Article

Dimensionality Control in Crystalline Zinc(II) and Silver(I) Complexes with Ditopic Benzothiadiazole-Dipyridine Ligands †

1
Inorganic Chemistry Laboratory, Faculty of Chemistry, University of Bucharest, Str. Dumbrava Rosie nr. 23, 020464 Bucharest, Romania
2
Coordination and Supramolecular Chemistry Laboratory, “Ilie Murgulescu” Institute of Physical Chemistry, Romanian Academy, Splaiul Independentei 202, 060021 Bucharest, Romania
3
MOLTECH-Anjou, UMR 6200, CNRS, UNIV Angers, 2 bd Lavoisier, CEDEX 49045 Angers, France
*
Authors to whom correspondence should be addressed.
Dedicated to Professor Christoph Janiak on the occasion of his 60th anniversary.
Chemistry 2021, 3(1), 269-287; https://doi.org/10.3390/chemistry3010020
Submission received: 19 January 2021 / Revised: 8 February 2021 / Accepted: 8 February 2021 / Published: 12 February 2021

Abstract

:
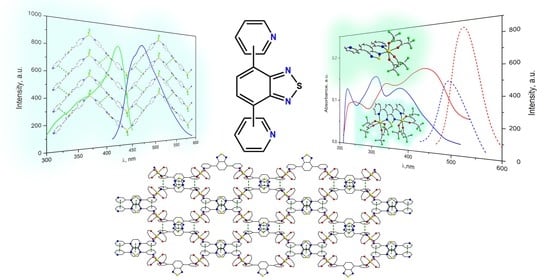
Three 2,1,3-benzothiadiazole-based ligands decorated with two pyridyl groups, 4,7-di(2-pyridyl)-2,1,3-benzothiadiazol (2-PyBTD), 4,7-di(3-pyridyl)-2,1,3-benzothiadiazol (3-PyBTD) and 4,7-di(4-pyridyl)-2,1,3 benzothiadiazol (4-PyBTD), generate ZnII and AgI complexes with a rich structural variety: [Zn(hfac)2(2-PyBTD)] 1, [Zn2(hfac)4(2-PyBTD)] 2, [Ag(CF3SO3)(2-PyBTD)]2 3, [Ag(2-PyBTD)]2(SbF6)2 4, [Ag2(NO3)2(2-PyBTD)(CH3CN)] 5, [Zn(hfac)2(3-PyBTD)] 6, [Zn(hfac)2(4-PyBTD)] 7, [ZnCl2(4-PyBTD)2] 8 and [ZnCl2(4-PyBTD)] 9 (hfac = hexafluoroacetylacetonato). The nature of the resulting complexes (discrete species or coordination polymers) is influenced by the relative position of the pyridyl nitrogen atoms, the nature of the starting metal precursors, as well as by the synthetic conditions. Compounds 1 and 8 are mononuclear and 2, 3 and 4 are binuclear species. Compounds 6, 7 and 9 are 1D coordination polymers, while compound 5 is a 2D coordination polymer, the metal ions being bridged by 2-PyBTD and nitrato ligands. The solid-state architectures are sustained by intermolecular π–π stacking interactions established between the pyridyl group and the benzene ring from the benzothiadiazol moiety. Compounds 1, 2, 79 show luminescence in the visible range. Density Functional Theory (DFT) and Time Dependent Density Functional Theory (TD-DFT) calculations have been performed on the ZnII complexes 1 and 2 in order to disclose the nature of the electronic transitions and to have an insight on the modulation of the photophysical properties upon complexation.

Graphical Abstract

1. Introduction

The 2,1,3-benzothiadiazole (BTD) unit is an electron acceptor fluorophore [1], which has been extensively used in the structure of derivatives and materials for various applications such as organic field-effect transistors [2,3,4], light emitting diodes [5,6], photovoltaics [7,8,9,10,11], redox switchable donor-acceptor systems [12,13], fluorescent probes [14,15] and so forth. In the solid state, the BTD fragment generally engages in a variety of supramolecular interactions such as hydrogen bonding, chalcogen N···S bonding and π–π stacking interactions [14,16,17]. Moreover, the presence of two sp2 nitrogen atoms on the thiadiazole ring confers coordinating properties to the BTD unit, which have been exploited, for example, in several transition metal complexes where BTD acted as monotopic [18] or ditopic ligand [19,20,21,22,23]. On the other hand, introduction of coordinating groups on the benzene ring affords neutral or anionic ligands allowing the formation of luminescent discrete complexes or coordination polymers in which the thiadiazole nitrogen atoms can take part, or not, to the coordination of metal centers [24]. In this respect, 4,7-substituted BTD derivatives with carboxylate or carboxylate containing fragments have been used as divergent anionic linkers towards various metal-organic frameworks (MOFs) which showed, for example, luminescence sensing properties in the presence of water [25], organic amines [26], organic dyes [27] or metal ions [28], while neutral 4,7-di(4-pyridyl-vinyl)-BTD ligands, with vinyl spacers between the pyridine rings and the BTD unit, provided luminescent zinc(II) coordination polymers in the presence of dicarboxylate linkers [29]. Particularly interesting is the direct connection of pyridines on the 4,7-positions of BTD, as it allows the access to the series of ditopic ligands 4,7-di(2-pyridyl)-2,1,3-benzothiadiazol (2-PyBTD), 4,7-di(3-pyridyl)-2,1,3-benzothiadiazol (3-PyBTD) and 4,7-di(4-pyridyl)-2,1,3-benzothiadiazol (4-PyBTD) (Scheme 1), the first one having the possibility to act as ditopic bis(chelating) ligand if the BTD nitrogen atoms are involved in coordination.
The synthesis of the three ligands is straightforward, consisting of the Stille coupling of 4,7-dibromo-2,1,3-benzothiadiazole with the series of 2-, 3- and 4-tributylstanyl-pyridines, respectively [30]. The three ligands are highly fluorescent, with quantum yields in acetonitrile solutions ranging between 68 and 90%. Rather surprisingly, when considering their promising coordination abilities, only the 4-PyBTD ligand has been used so far to prepare 3D coordination polymers of ZnII, CdII, CoII and NiII, also containing benzene-dicarboxylate linkers, showing modulation of emission properties in the presence of metal ions or picric acid [31,32].
We report herein a first combined coordination chemistry study of the three ditopic ligands 2-PyBTD, 3-PyBTD and 4-PyBTD (Scheme 1) towards zinc(II) and silver(I) based fragments with the objective to explore the topicity of the ligands and the dimensionality of the resulting complexes, for which the crystal structures are described in detail, with a special focus on the supramolecular interactions in the solid state. Moreover, the photophysical properties of the ZnII complexes are reported and compared to those of the ligands.

2. Materials and Methods

The reagents employed were purchased from commercial sources and used without further purification.
2-PyBTD, 3-PyBTD and 4-PyBTD were synthesized according to the literature procedure [30].
[Zn(hfac)2(2-PyBTD)] 1: 0.0011 g (0.0038 mmol) 2-PyBTD in 4 mL CHCl3 and 2 mL methanol were added to a solution of 0.0039 g (0.0075 mmol) of [Zn(hfac)2(H2O)2]·H2O in 2 mL methanol and stirred for one hour. After filtration, the solution was left to slowly evaporate. Yellow needle like single crystals were formed in a few days (0.0023 g, yield 79%). Selected IR data (KBr, cm−1): 3066(w), 2955(m), 2921(m), 2851(m), 1655(s), 1617(m), 1573(m), 1553(m), 1528(m), 1486(m), 1465(m), 1348(w), 1260(s), 1203(s), 1143(vs), 1099(s), 1067(s), 909(m), 880(m), 842(m), 795(w), 779(w), 743(m), 666(m), 584(m) (Figure S1). Elemental analysis calcd for C26H12ZnF12N4O4S: C, 40.56; H, 1.57; N, 7.28; S, 4.17%. Found: C, 40.51; H, 1.26; N, 7.24; S, 4.11%.
[Zn2(hfac)4(2-PyBTD)] 2: 0.0035 g (0.0067 mmol) of [Zn(hfac)2(H2O)2]·H2O and 0.001g (0.0034 mmol) 2-PyBTD were solubilized in a mixture of 4 mL n-heptane and 2 mL CH2Cl2 and then heated to the n-heptane boiling point. Upon cooling to room temperature, 2 mL of CH2Cl2 were added and the solution was left to slowly evaporate. Yellow single crystals were formed within a few days (0.0034 g, yield 81%). Selected IR data (KBr, cm−1): 3123(w), 3045(w), 1655(s), 1600(m), 1558(m), 1531(m), 1479(s), 1457(m), 1348(w), 1253(vs), 1216(vs), 1144(vs), 1097(m), 1064(m), 1020(w), 949(m), 907(m), 866(w), 796(m), 782(m), 741(m), 665(m), 585(m) (Figure S2). Elemental analysis calcd for C36H14Zn2F24N4O8S: C, 34.61; H, 1.13; N, 4.48; S, 2.57%. Found: C, 33.99; H, 0.94; N, 4.38; S, 2.49%.
[Ag(CF3SO3)(2-PyBTD)]2 3: An ethylacetate solution (2 mL) of AgCF3SO3 (0.0021 g, 0.0081 mmol) was left to slowly diffuse through a 4 mL layer of ethylacetate and dichloromethane (1:1 v/v) into a solution of 0.0012g (0.0041 mmol) 2-PyBTD solubilized in 2 mL CH2Cl2. Yellow single crystals were formed within a few days (0.0013 g, yield 59%). Selected IR data (KBr, cm−1): 3313(w), 3053(w), 2920(w), 1720(w), 1582(m), 1549(m), 1462(m), 1434(m), 1384(m), 1262(vs), 1175(s), 1035(vs), 948(w), 890(w), 775(m), 737(m), 646(s), 578(w) (Figure S3). Elemental analysis calcd for C17H10AgF3N4O3S2: C, 37.31; H, 1.84; N, 10.24; S, 11.72%. Found: C, 37.22; H, 2.04; N, 9.86; S, 11.62%.
[Ag(2-PyBTD)]2(SbF6)2 4: Crystalline 4 have been prepared in the same manner as 3, except that an ethylacetate solution of AgSbF6 (0.0026g, 0.0075 mmol) and dichloromethane solution of 2-PyBTD (0.001g, 0.0034 mmol) were used. Yellow single crystals of 4 crystalized in a week (0.0018 g, yield 84%). Selected IR data (KBr, cm−1): 3109(m), 3050(m), 2991(m), 2934(m), 1721(w), 1596(s), 1553(s), 1527(s), 1464(s), 1433(s), 1373(s), 1350(w), 1284(w), 1256(m), 1159(m), 1094(m), 1054(m), 1018(m), 994(m), 948(m), 892(w), 858(m), 772(s), 747(m), 657(vs), 550(m) (Figure S4). Elemental analysis calcd for C32H20Ag2F12N8S2Sb2: C, 30.31; H, 1.59; N, 8.84; S, 5.06%. Found: C, 30.69; H, 1.72; N, 8.45; S, 4.77%.
[Ag2(NO3)2(2-PyBTD) (CH3CN)] 5: A solution of AgNO3 (0.005 g, 0.029 mmol) in 2 mL ethylacetate and 2 mL acetonitrile was left to slowly diffuse through a 4 mL layer of ethylacetate and dichloromethane (1:1 v/v) into a dichloromethane solution (2 mL) of 2-PyBTD (0.0043 g, 0.014 mmol). Yellow single crystals appeared in three weeks (0.0014 g, yield 15.5%).
[Zn(hfac)2(3-PyBTD)] 6: A solution of 0.0041 mmol (0.0012g) 3-PyBTD in 4 mL CHCl3 is added to a solution containing 0.0081 mmol [Zn(hfac)2(H2O)2]·H2O (0.0042 g) in 2 mL of methanol. The mixture is stirred for 2 h and then filtered. Yellow single crystals of 6 are formed in few days by slow evaporation of the solvent (0.0013 g, yield 42%). Selected IR data (KBr, cm−1): 3064(w), 2920(w), 1682(m), 1652(m), 1550(m), 1525(m), 1510(m), 1485(m), 1438(m), 1254(s), 1194(s), 1142(s), 1122(s), 1095(s), 847(w), 790(m), 746(m), 725(m), 694(m) (Figure S5).
[Zn(hfac)2(4-PyBTD)] 7: A solution of 0.0034 mmol (0.001 g) 4-PyBTD in a mixture of 4 mL CHCl3 and 2 mL methanol was mixed with a solution containing 0.0067 mmol [Zn(hfac)2(H2O)2]·H2O (0.0035 g) in 2 mL methanol and then stirred for 2 h. After filtration, the solution was left to slowly evaporate. Yellow needle like single crystals were formed in few days (0.0020 g, yield 77%). Selected IR data (KBr, cm−1): 1650(s), 1613(m), 1558(s), 1533(m), 1495(s), 1460(s), 1430(s), 1375(m), 1259(vs), 1219(vs), 1144(vs), 1019(m), 850(m), 821(m), 808(m), 727(w), 669(s) (Figure S6). Elemental analysis calcd for C26H12ZnF12N4O4S: C, 40.56; H, 1.57; N, 7.28; S, 4.17%. Found: C, 40.13; H, 1.42; N, 6.96; S, 4.53%.
[ZnCl2(4-PyBTD)2] 8: 0.0024g (0.0082 mmol) 4-PyBTD in 4 mL CH2Cl2 and 2 mL methanol were added to a solution of 0.0012 g (0.0088 mmol) of ZnCl2 in 2 mL methanol and stirred for 10 min, when the mixture became opaque. After adding 2 mL DMF and heating at 60 °C for 30 min, the precipitate was solubilized and the light-yellow solution was left to slowly evaporate. Dark-yellow single crystals were formed within a few days (0.0025 g, yield 85%). Selected IR data (KBr, cm−1): 3460(m), 1638(s), 1616(s), 1594(m), 1548(m), 1478(w), 1429(m), 1409(m), 1220(m), 1071(m), 1029(m), 883(w), 829(m), 815(m), 721(m), 629(w) (Figure S7).
[ZnCl2(4-PyBTD)] 9: Light yellow single crystals of 9 were synthesized in the same manner as 8, except that the opaque solution was further stirred for one hour before 2 mL DMF were added, followed by two hours stirring at 60 °C (0.0019 g, yield 54%). Selected IR data (KBr, cm−1): 3288(m), 2964(m), 2918(m), 1668(m), 1552(m), 1392(m), 1261(s), 1094(vs), 1027(vs), 805(vs), 700(w) (Figure S8).
IR spectra (KBr pellets) were recorded on a Bruker Tensor 37 spectrophotometer in 4000 to 400 cm−1 frequencies range. Diffuse reflectance spectra were performed on a JASCO V-670 spectrophotometer. Elemental analysis was carried out on a EuroEa Elemental Analyzer. The fluorescence spectra were carried out on a JASCO FP-6500 spectrofluorimeter.
X-ray data for compounds 26 and 8 were collected on an Agilent Supernova diffractometer with CuKα (λ = 1.54184 Å) and for compounds 1, 7 and 9 on a Rigaku XtaLAB Synergy, Single source at offset/far, HyPix diffractometer using a graphite-monochromated Mo Kα radiation source (λ = 0.71073 Å). The structures were solved by direct methods and refined by full-matrix least squares techniques based on F2. The non-H atoms were refined with anisotropic displacement parameters. Calculations were performed using SHELXT and SHELXL-2015 crystallographic software packages [33,34]. A summary of the crystallographic data and the structure refinement for crystals 19 is given in Tables S1 and S2.
Crystallographic data for the nine structures have been deposited with the Cambridge Crystallographic Data Centre, deposition numbers CCDC 2056006 (1), CCDC 2056007 (2), CCDC 2056008 (3), CCDC 2056009 (4), CCDC 2056010 (5), CCDC 2056011 (6), CCDC 2056012 (7), CCDC 2056013 (8), CCDC 2056014 (9). These data can be obtained free of charge from CCDC, 12 Union road, Cambridge CB2 1EZ, UK (e-mail: [email protected] or http://www.ccdc.cam.ac.uk (accessed on 12 February 2021)).
DFT and TD-DFT calculations have been performed with the Gaussian 09 program [35] using the DFT method with the PBE1PBE functional and the augmented and polarized Ahlrichs triple-zeta basis set TZVP [36]. The full molecular reports, molecular orbitals, electron density differences pictures and calculated spectra have been automatically generated by a homemade Python program, quchemreport [37], based on cclib [38].

3. Results and Discussion

The ligands 2-PyBTD, 3-PyBTD and 4-PyBTD (Scheme 1) have been synthesized according to the literature procedure described by Yamashita et al. [30]. To compare their coordination modes, the precursor {Zn(hfac)2} (hfac = hexafluoroacetylacetonate) has been used throughout the whole series, thus ensuring, in principle, the preparation of neutral complexes and the coordination of two additional ligands in either cis or trans positions. The coordination ability of the metal center is enhanced thanks to the electron withdrawing effect of the fluorinated hfac ligands [39,40]. Furthermore, while the ZnII ion provides a more rigid system upon coordination, it does not present any d-d transition which could interfere with the ligand based emission. Then, the scope of the study has been extended towards the use of ZnCl2, as it provides tetrahedral ZnCl2L2 complexes with pyridine based ligands [41], at the difference with the {Zn(hfac)2} fragment which favors the formation of octahedral Zn(hfac)2L2 complexes. Finally, silver(I) precursors have been evaluated in coordination with 2-PyBTD in order to take advantage of the propensity of this metal center to adopt various coordination modes as a consequence of the interplay between the coordination flexibility of the 2-PyBTD ligand, that is, chelating vs. divergent ditopic and the coordination behavior of the anionic ligand of the AgI precursor. In the following discussion we describe in detail the crystal structures of the complexes obtained with each of the three ligands, together with the photophysical properties of the zinc(II) complexes with 2-PyBTD and 4-PyBTD.

3.1. Discrete Complexes and Coordination Polymers with the 2-PyBTD Ligand

3.1.1. Mononuclear [Zn(hfac)2(2-PyBTD)] 1 and Binuclear [Zn2(hfac)4(2-PyBTD)] 2 Complexes

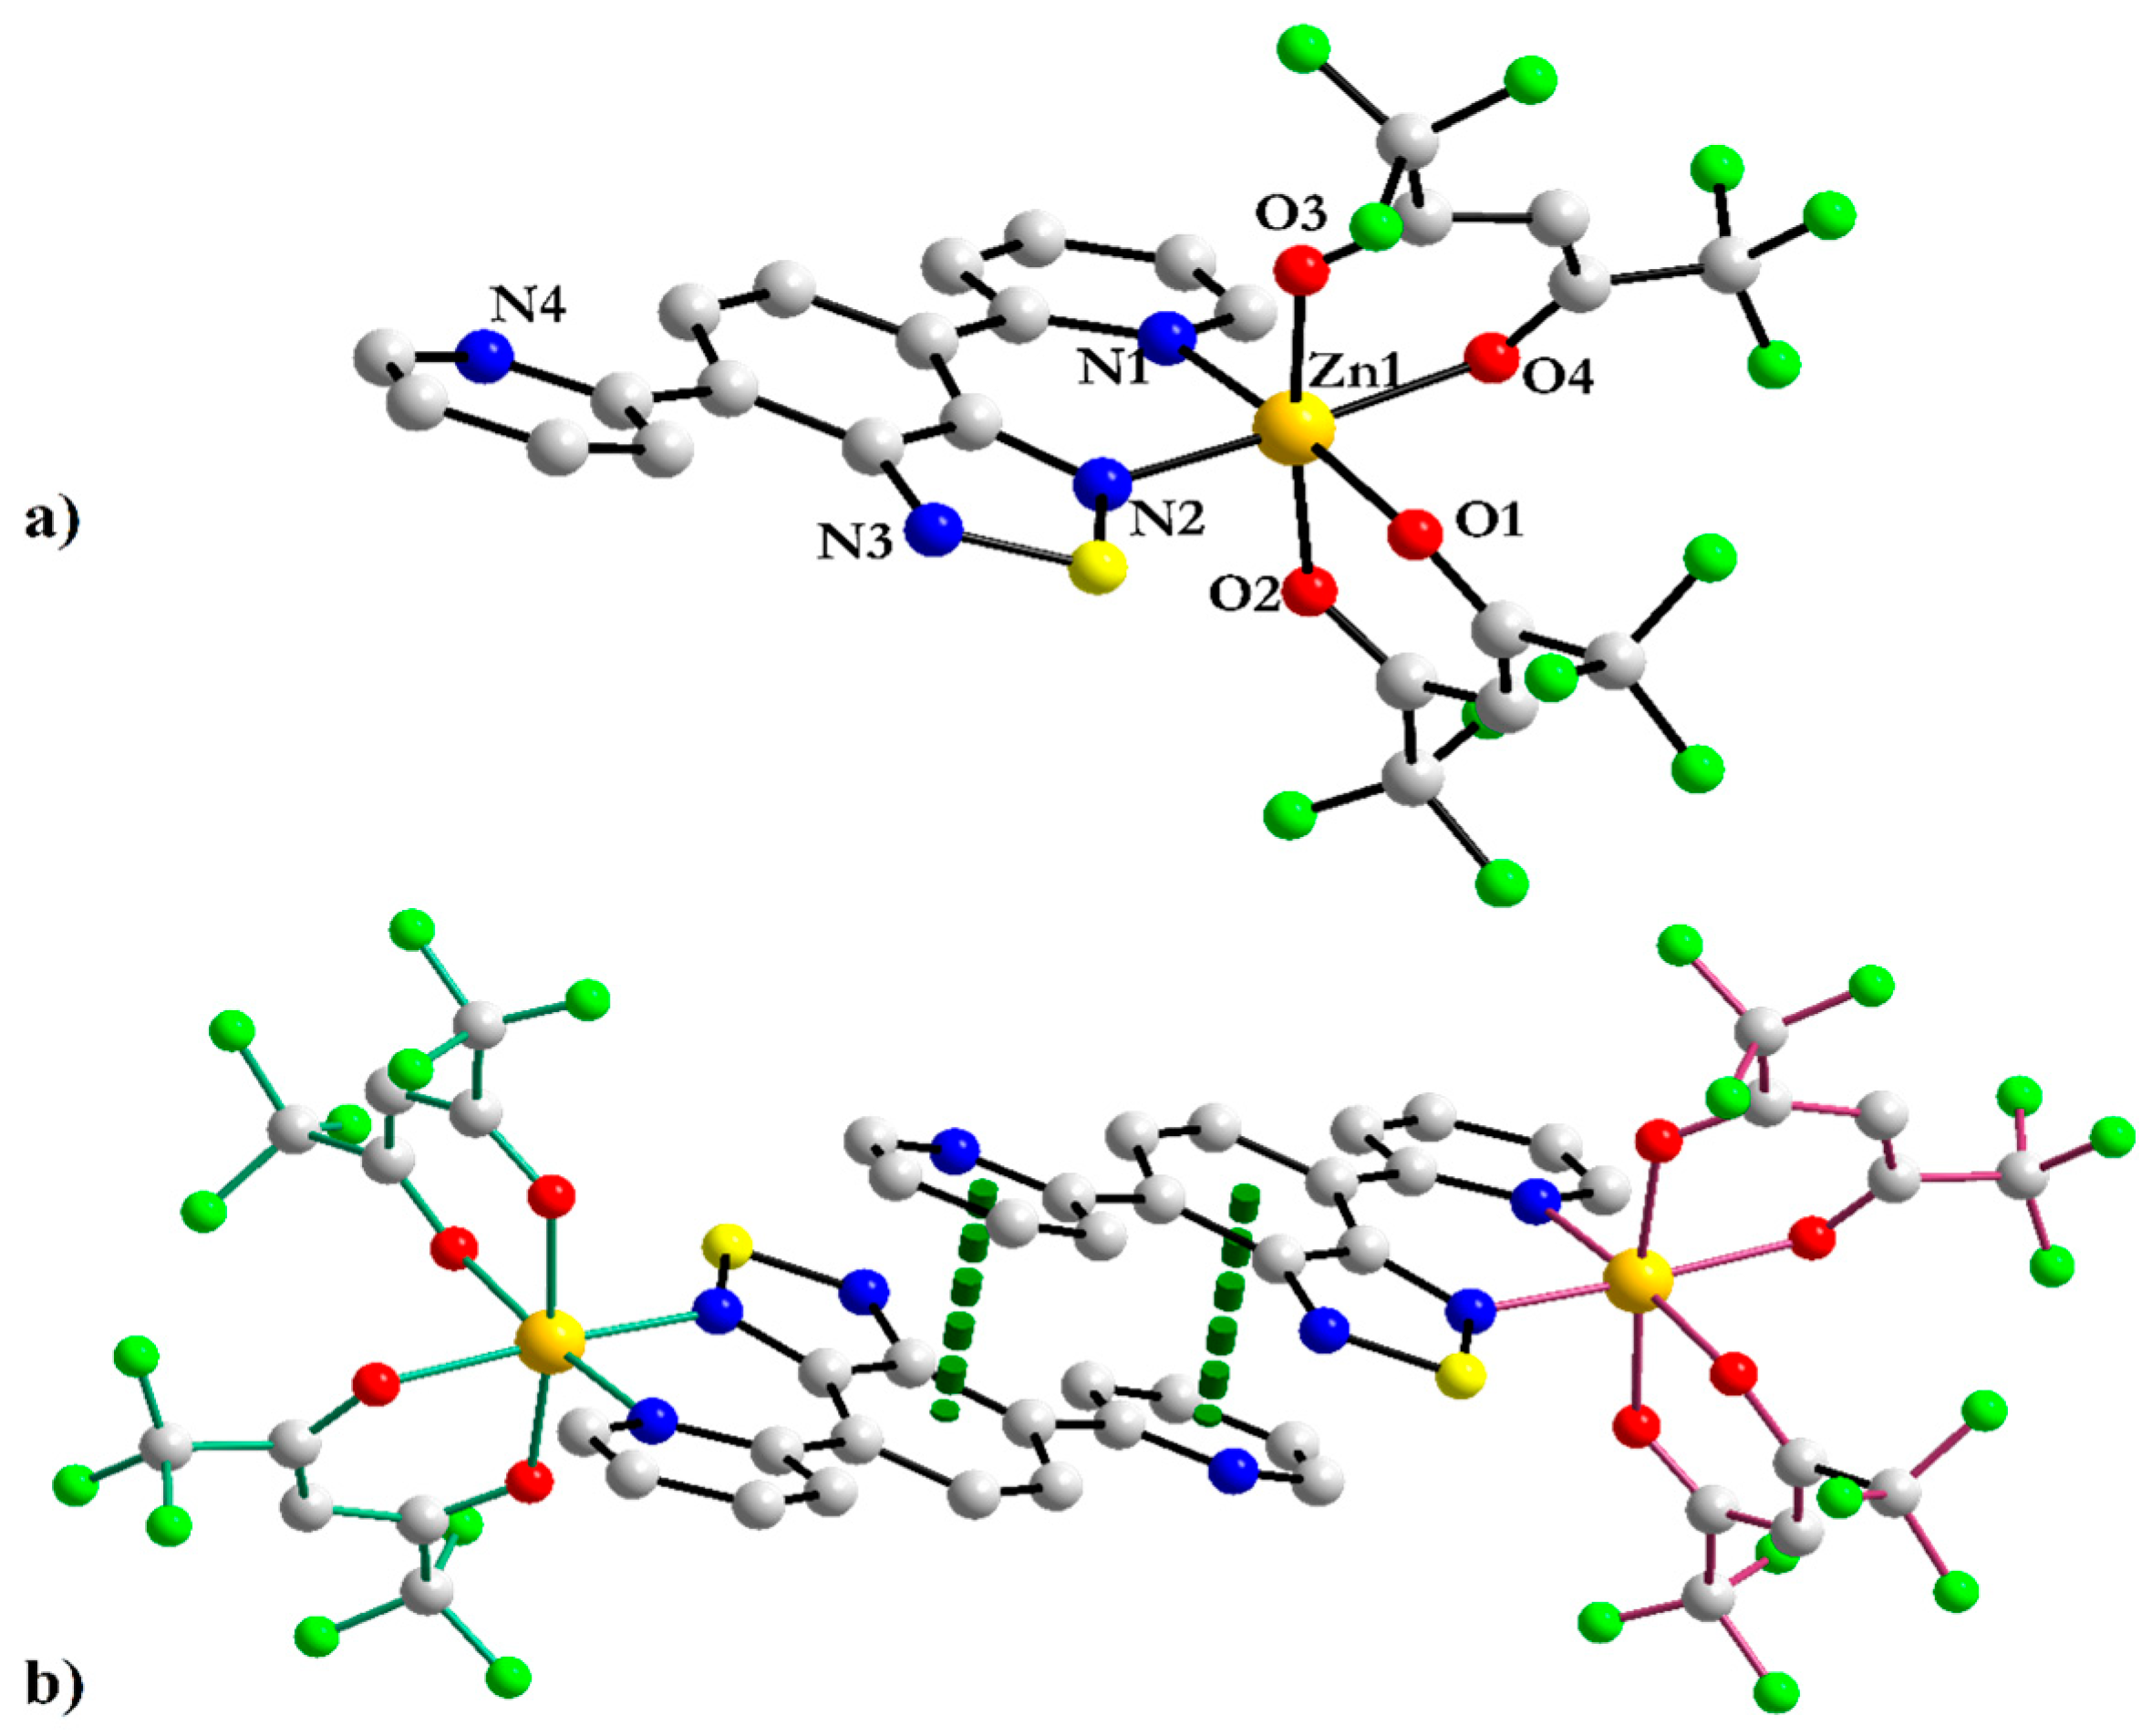
The reaction between 2-PyBTD and the [Zn(hfac)2(H2O)2]·H2O precursor in a ratio of 1:2 afforded either the mononuclear complex 1 or the binuclear complex 2 depending on the reaction solvent mixture, that is, methanol/chloroform and heptane/methylene chloride, respectively. Complex 1 crystallized in the monoclinic space group P21/c, with one independent complex molecule in the asymmetric unit. The metal center shows octahedral coordination stereochemistry, with the coordination sphere generated by four oxygen atoms (O1–O4) from the hfac anionic ligands and two nitrogen atoms from a pyridine (N1) and the BTD unit (N2) (Figure 1a, Table 1 and Table S3).
The pyridine units of the ligand are cis-trans oriented and are slightly twisted with respect to the BTD plane, with values of 14.1° (PyN1) and 15.3° (PyN4) for the corresponding dihedral angles. The mononuclear units arrange in supramolecular dimers, with opposite chiralities Δ and Λ of the octahedral configuration of ZnII, thanks to π stacking interactions between the uncoordinated pyridine and BTD phenyl rings (Figure 1b).
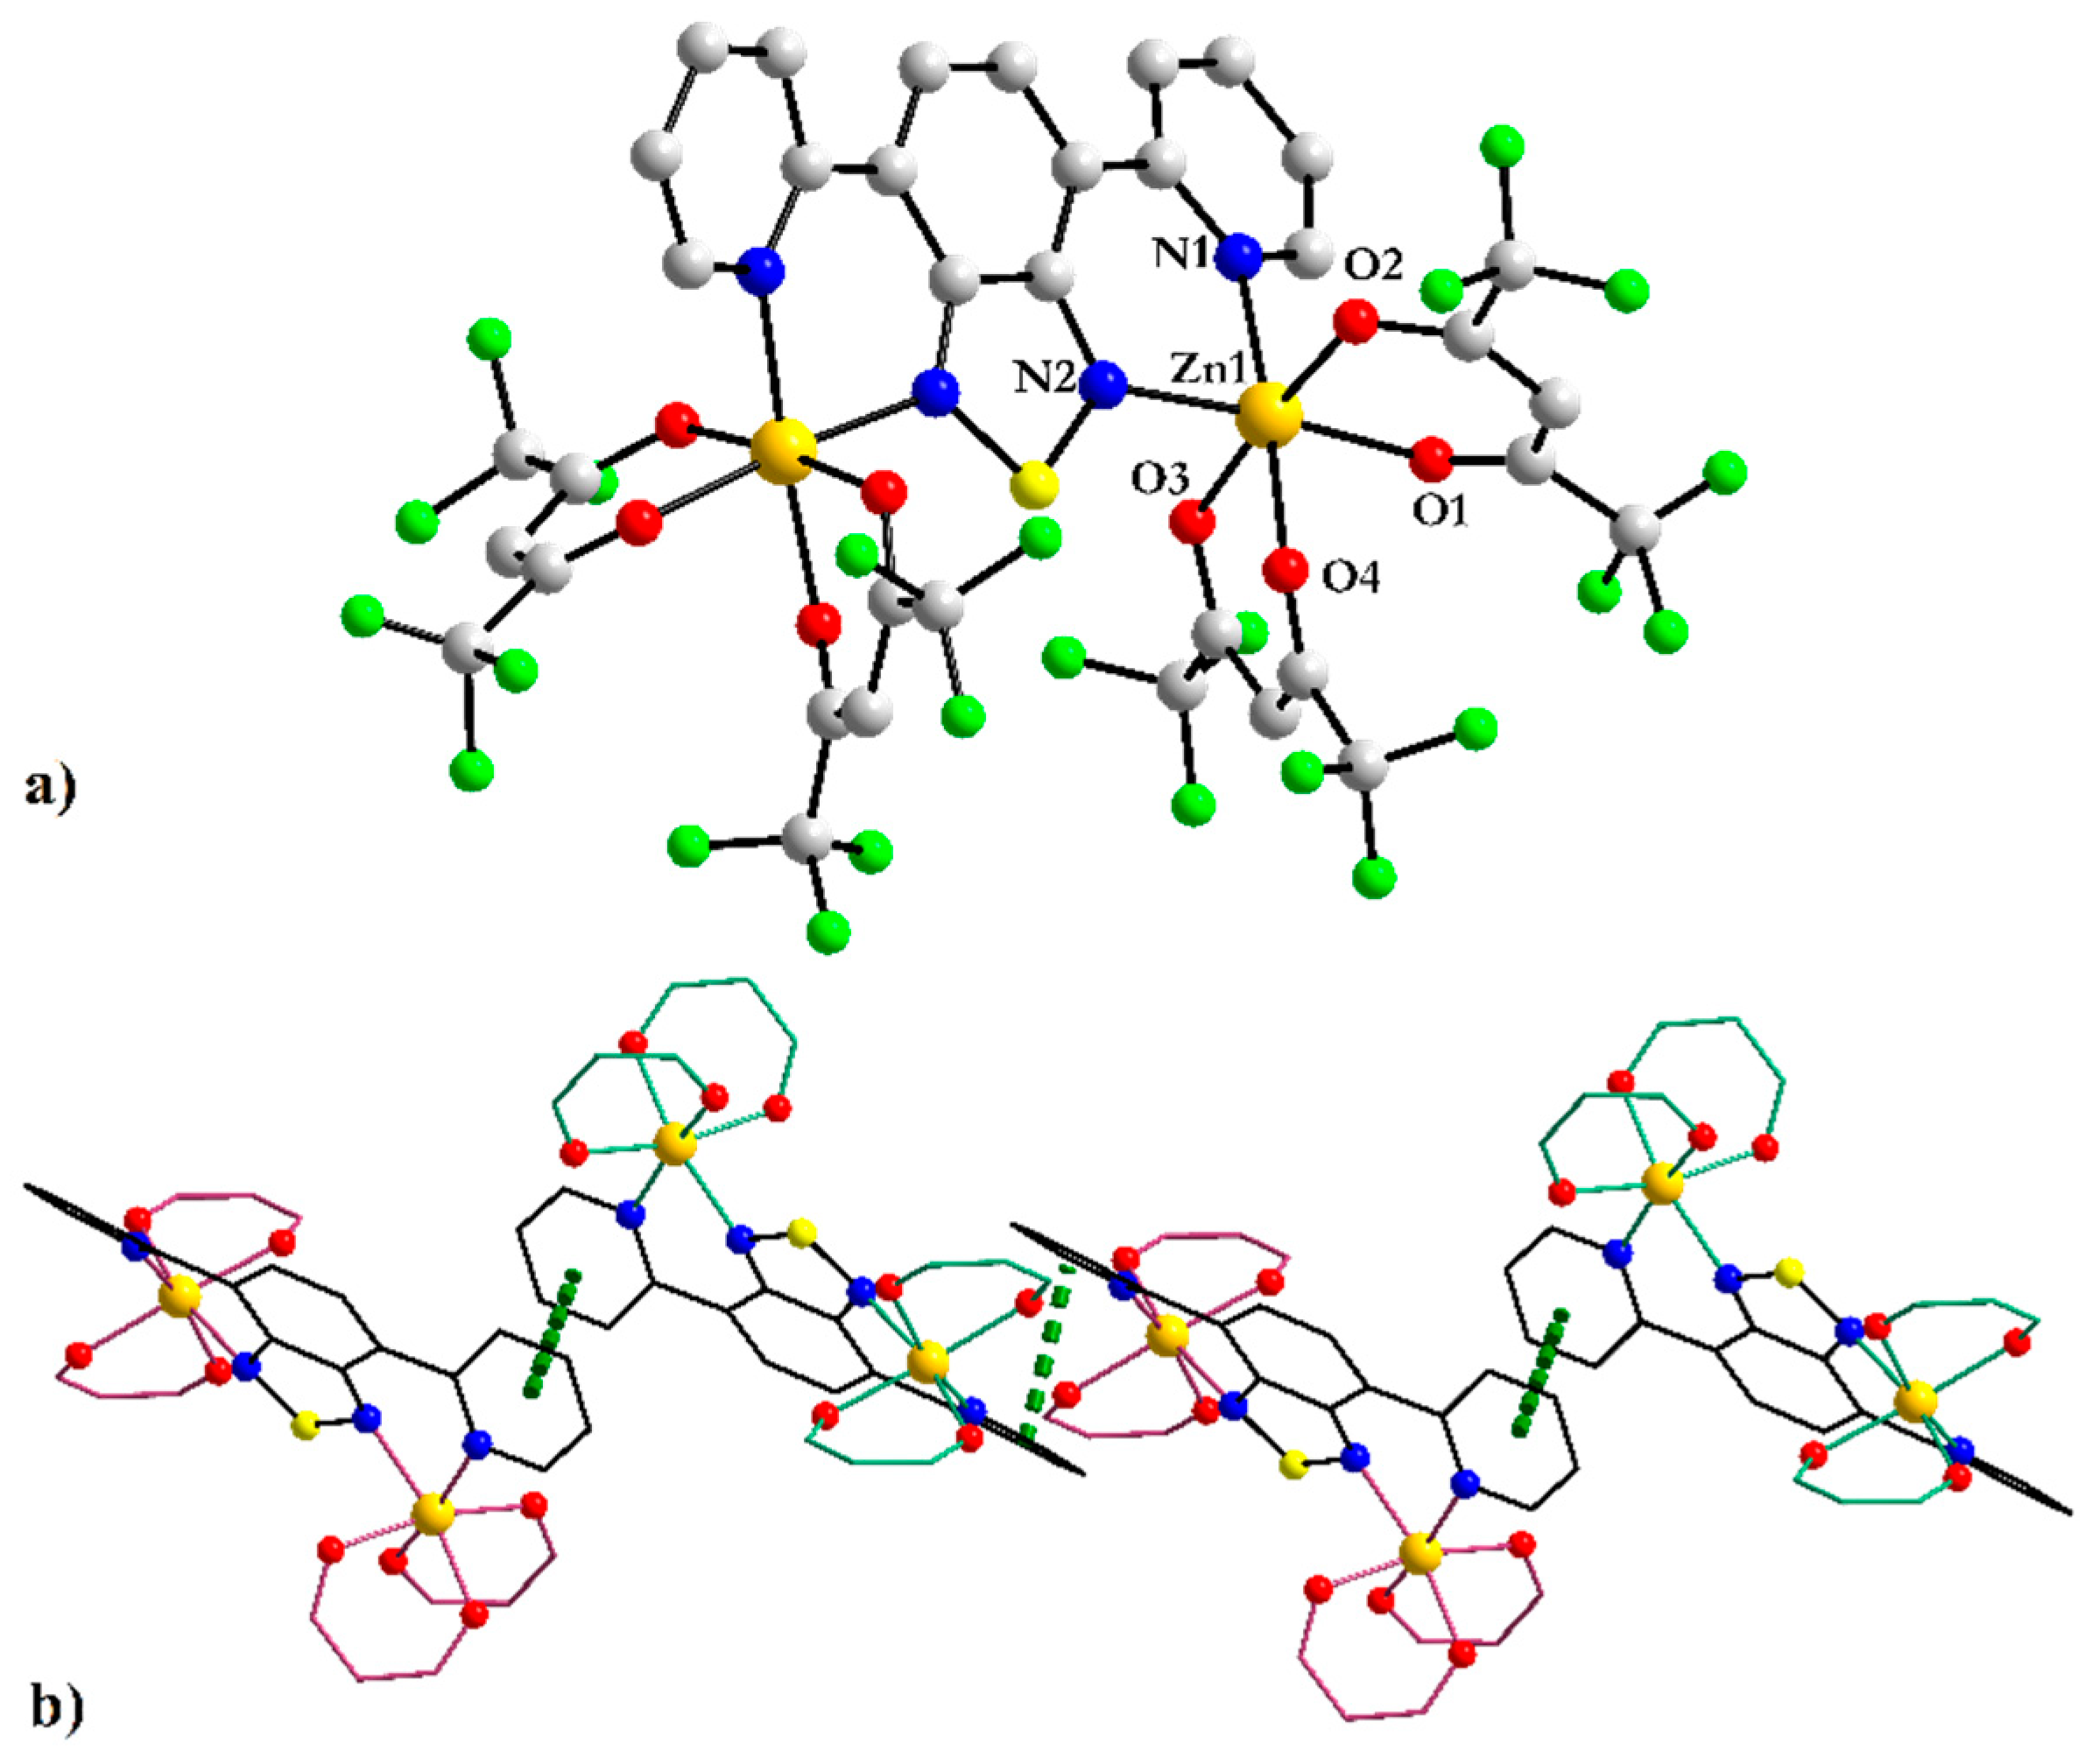
The binuclear complex 2 crystallized in the monoclinic space group C2/c with half a molecule of complex in the asymmetric unit, the other half being generated by the C2 axis crossing the BTD unit through the S atom located on a special position (Table 1 and Figure 2). Zn–O and Zn–N bond lengths are comparable in the two complexes. However, the Py rings in 2, having now a cis-cis arrangement due to the bis-chelation, are more strongly twisted when compared to 1, as attested by the value of ±26.9° for the Py–BTD dihedral angle.
Whereas both metal centers of the binuclear unit show the same Δ or Λ configuration, the complexes form supramolecular chains through offset π–π stacking interactions between the pyridyl rings (centroid–centroid distances = 3.64 Å), with an alternation of Δ and Λ configurations (Figure 2b).

3.1.2. Binuclear [Ag(CF3SO3)(2-PyBTD)]2 3 and [Ag(2-PyBTD)]2(SbF6)2 4 Complexes

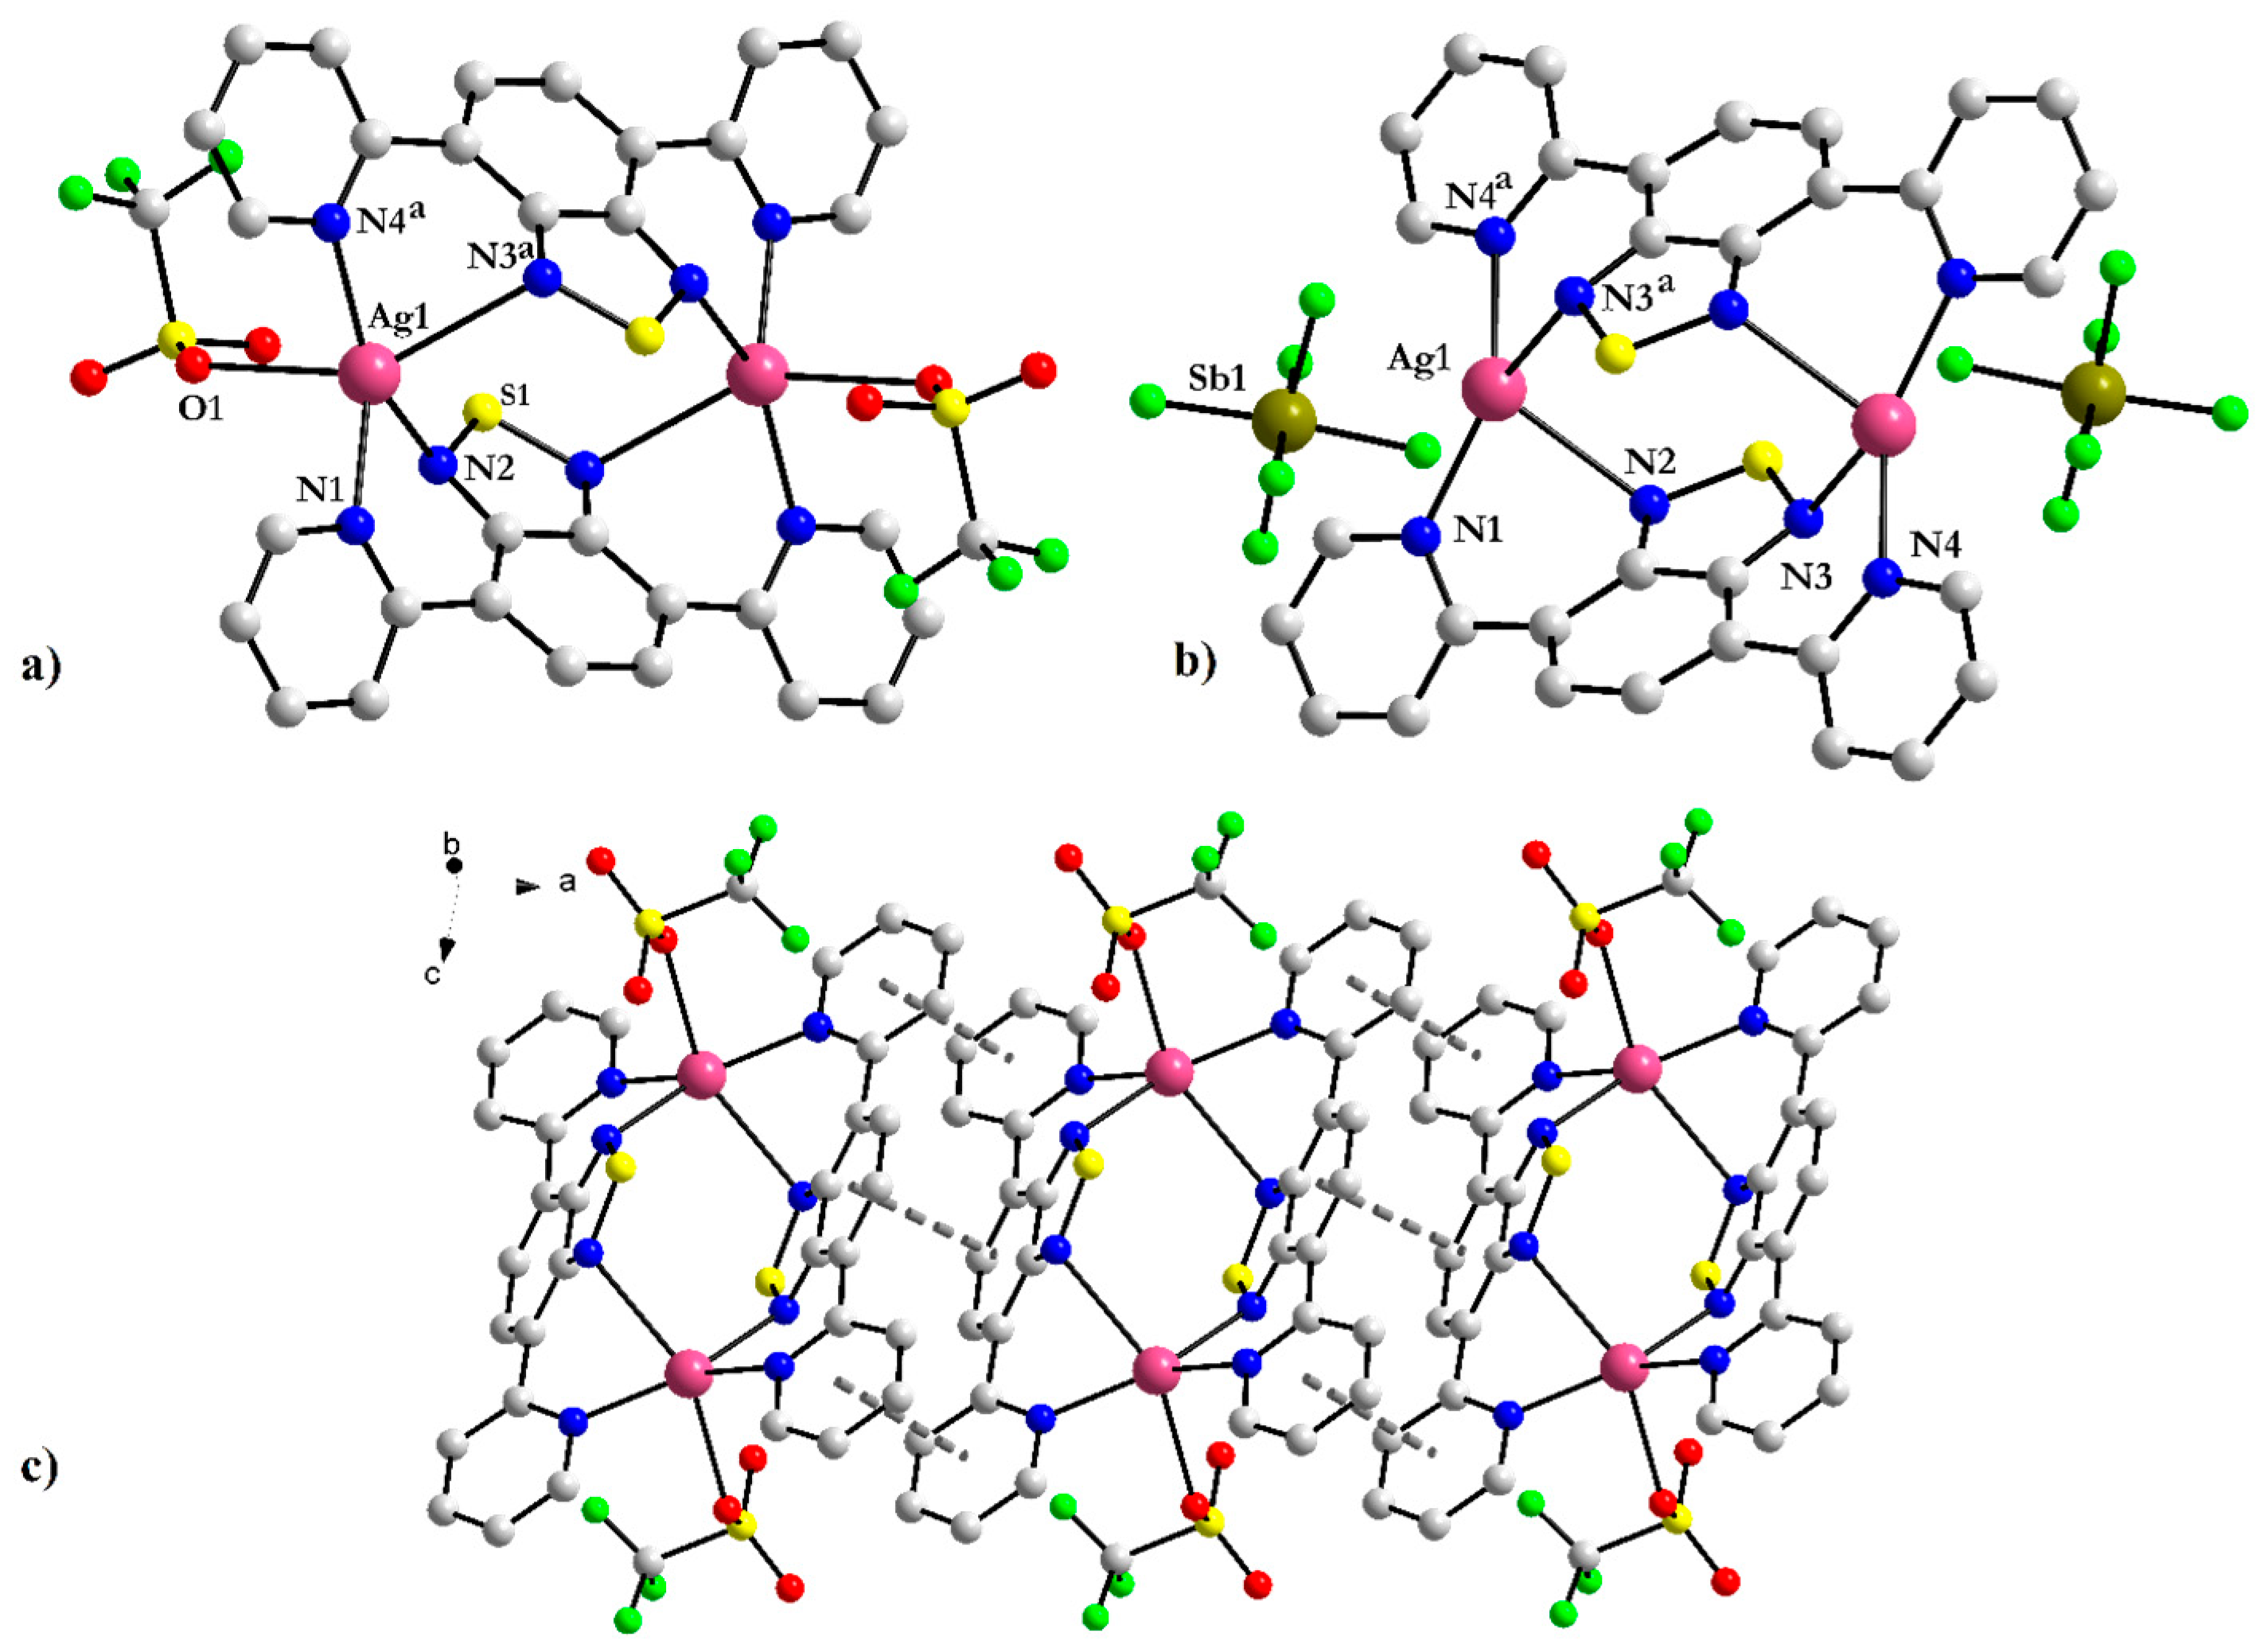
Reaction of 2-PyBTD with the silver(I) salts AgCF3SO3 and AgSbF6 provided the yellow crystalline binuclear complexes [Ag(CF3SO3)(2-PyBTD)]2 3 and [Ag(2-PyBTD)]2(SbF6)2 4, respectively. The isostructural compounds crystallized in the monoclinic space group P21/c with one centrosymmetric dimeric complex in the unit cell (Figure 3). In the ligand 2-PyBTD the pyridine rings are in cis-cis configuration to allow chelation of silver(I), yet the twist between Py and BTD rings is much larger than in complex 2, with dihedral angles of 39.0° (PyN1) and 38.9° (PyN4) in complex 3 and 44.1° (PyN1) and 31.1° (PyN4) in complex 4. As a consequence, while the pyridine nitrogen lone pairs point towards the metal center, the coordination with the BTD nitrogen atoms seems reminiscent to Ag(I)-π interactions [42]. In complex 3 the silver ions are pentacoordinated within a slightly distorted square pyramid, with the basal plane formed by three nitrogen atoms from two molecules of BTD (Ag1–N1 = 2.274(3), Ag1–N2 = 2.361(3), Ag1–N4a = 2.216(3) Å, a = 1 − x, 1 − y, 1 − z) and an oxygen atom from a triflate anion (Ag1–O1 = 2.658(3) Å), while in the apical position a semi-coordinated nitrogen atom of a thiadiazole ring (Ag1–N3a = 2.770 Å, a = 1 − x, 1 − y, 1 − z) is located (Figure 3a, Table 4 and Table S4). The value of τ5 parameter defined as [(θ–φ)/60] [43], estimating the degree of trigonal distortion from the square pyramid geometry, amounts to 0.08 in complex 3. In complex 4, the SbF6 anion is not coordinated to the metal center, therefore the coordination stereochemistry can be described as see-saw, according to the value of τ4 parameter [44] (τ4Ag1 = 0.58), with four nitrogen atoms from pyridine and thiadiazole rings of two ligands (Ag1–N1 = 2.192(5), Ag1–N2 = 2.287(5), Ag1–N3a = 2.415(5) Ag1–N4a = 2.221(5) Å, a = 1 − x, −y, 1 − z) (Figure 3b, Table 2 and Table S4).
The intermolecular Ag···Ag distances are 5.91 Å in 3 and 5.95 Å in 4, thus precluding the existence of any argentophilic interaction. The packing diagram reveals the formation of one-dimensional stair-like supramolecular motifs upon π–π stacking offset interactions between pyridine (centroid–centroid distance 3.59 Å (3) and 3.72 Å (4)) and phenyl (centroid–centroid distance 3.62 Å (3) and 3.66 Å (4)) rings belonging to neighboring binuclear species (Figure 3c and Figure S9).

3.1.3. Coordination Polymer [Ag2(NO3)2(2-PyBTD)(CH3CN)] 5

Reaction between 2-PyBTD and AgNO3 provided a 2D coordination polymer with a 2:1 metal to ligand ratio. The compound crystallized in the monoclinic space group P21/c, with one ligand, two silver(I), two nitrate ions and one acetonitrile molecule in the asymmetric unit. The structure of the coordination polymer can be described as follows: the nitrate anions link the silver(I) ions in double chains (Figure 4a) and 2-PyBTD acts as tridentate ligand, thus connecting the inorganic chains in bidimensional layers (Figure 4b). The two metal centers are crystallographically inequivalent and present different coordination geometry. Accordingly, Ag1 ions are hexacoordinated and their coordination stereochemistry can be at best described as pentagonal pyramid following the SHAPE analysis [45,46] (Table S5). Five oxygen atoms, with three shorter distances (Ag1–O1 = 2.471(5), Ag1–O4 = 2.575(3), Ag1–O6a = 2.441(3) Å) and two longer ones Ag1–O3 = 2.795(3), Ag1–O5a = 2.768(3) Å, a = 1 − x, 0.5 + y, 0.5 − z), indicative of semi-coordination, together with a pyridine nitrogen atom (Ag1–N1 = 2.304(3) Å) form the coordination environment of Ag1 (Table 3 and Table S6). Ag2 ions are pentacoordinated and adopt a distorted square pyramid stereochemistry, with τ5Ag2 = 0.49. The basal plane is formed by one pyridine nitrogen atom (Ag2–N4b = 2.370(5) Å, b = 1 − x, 1 − y, 1 − z), one thiadiazole nitrogen atom (Ag2–N2 = 2.299(4) Å), one acetonitrile nitrogen atom (Ag1–N7 = 2.264(6) Å) and one semi-coordinated nitrato oxygen atom (Ag1–O6 = 2.737(3) Å), while the apical position is occupied by a semi-coordinated nitrato oxygen atom (Ag2–O5c = 2.653(2) Å, c = 1 − x, −0.5 + y, 0.5 − z). The BTD ligand adopts a cis-trans conformation and shows a tridentate coordination mode, connecting two metal centers of the same double chain through a pyridine (N1) and a thiadiazolyl (N2) nitrogen atom and a third silver ion from a neighboring chain through the second pyridine nitrogen atom (N4) (Figure 4c). The two nitrate anions adopt as well different coordination modes, with N5 being bidentate chelate to Ag1 and N6 linking four metal centers. Within a chain π–π stacking contacts establish between pyridine rings (centroid–centroid distance of 3.54 Å) and also short Ag···Ag distances of 3.55 Å for Ag1···Ag2 are observed.

3.2. Coordination Polymer with the 3-PyBTD Ligand

Reaction between 3-Py-BTD and [Zn(hfac)2(H2O)2]·2H2O afforded yellow crystals of the coordination polymer formulated as [Zn(hfac)2(3-PyBTD)] (6). The compound crystallized in the monoclinic space group P21/n with one ligand and one Zn(hfac)2 fragment in the asymmetric unit. The ligand adopts a ditopic coordination mode through the pyridine nitrogen atoms, connecting the Zn(hfac)2 nodes to form wavy chains in spite of the cis arrangement of the pyridine ligands in the coordination sphere of Zn(II) (Figure 5). The coordination geometry of the metal ions is octahedral, with four hfac oxygen atoms (Zn1–O1 = 2.120(3), Zn1–O2 = 2.124(3), Zn1–O3 = 2.112(3) Å, Zn1–O4 = 2.119(3) Å) and two pyridine nitrogen atoms from two different 3-PyBTD ligands (Zn1–N1 = 2.124(4) Å, Zn1–N4a = 2.120(4) Å, a = 0.5 + x, 1.5 − y, 0.5 + z) (Table 4 and Table S7), disposed, as already mentioned, in a cis configuration. The two pyridine rings of the ligand are arranged in trans-trans with respect to the BTD unit, with dihedral angles of 40.5° (N1) and 39.9° (N4).
The metal nodes within the chains show opposite alternated chirality and the chains are associated in supramolecular layers thanks to π–π stacking between the pyridine (3.50 Å) and benzene (3.69 Å) rings (Figure 5b and Figure S10).

3.3. Discrete Complexes and Coordination Polymers with the 4-PyBTD Ligand

3.3.1. Coordination Polymer [Zn(hfac)2(4-PyBTD)] 7

Compound 7 has been obtained as yellow crystals in a similar manner as compound 6. It crystallized in the triclinic space group P–1, with one independent ligand 4-PyBTD in general position, two Zn(II) ions located on inversion centers and one hfac ligand on each metal center, the other hfac ligands being generated through the inversion centers. At the difference with complex 6, in 7 the pyridine ligands are located in trans positions (Figure 6). As expected, the coordination geometry around the metal centers is octahedral, with the equatorial positions occupied by four hfac oxygen atoms (Zn1–O1 = 2.041(3), Zn1–O2 = 2.035(3), Zn1–O3 = 2.057(3) Å, Zn1–O4 = 2.053(3) Å) and the axial ones by two pyridine nitrogen atoms (Zn1–N1 = 2.084(3) Å, Zn1–N2 = 2.042(3) Å) (Table 5 and Table S8). Again, the pyridine rings are twisted with respect to the BTD unit, the corresponding dihedral angles amounting at 39.0° (N1) and 41.6° (N4), values which are slightly superior to those observed in the free ligand (36.8°) [30].

3.3.2. Coordination Complexes of 4-PyBTD with ZnCl2

The reaction of 4-PyBTD with ZnCl2 afforded either the mononuclear complex [ZnCl2(4-PyBTD)2] 8 or the coordination polymer [ZnCl2(4-PyBTD)] 9 by slightly varying the experimental conditions. The former crystallized in the monoclinic space group P21/c with one complex in general position in the asymmetric unit, while the latter crystallized in the non-centrosymmetric orthorhombic space group P212121, with one 4-PyBTD ligand and one ZnCl2 fragment in the asymmetric unit. In both complexes the coordination geometry around the metal center is tetrahedral, with values of the bond lengths Zn–Cl and Zn–N in the usual range (Table 6 and Table S9).
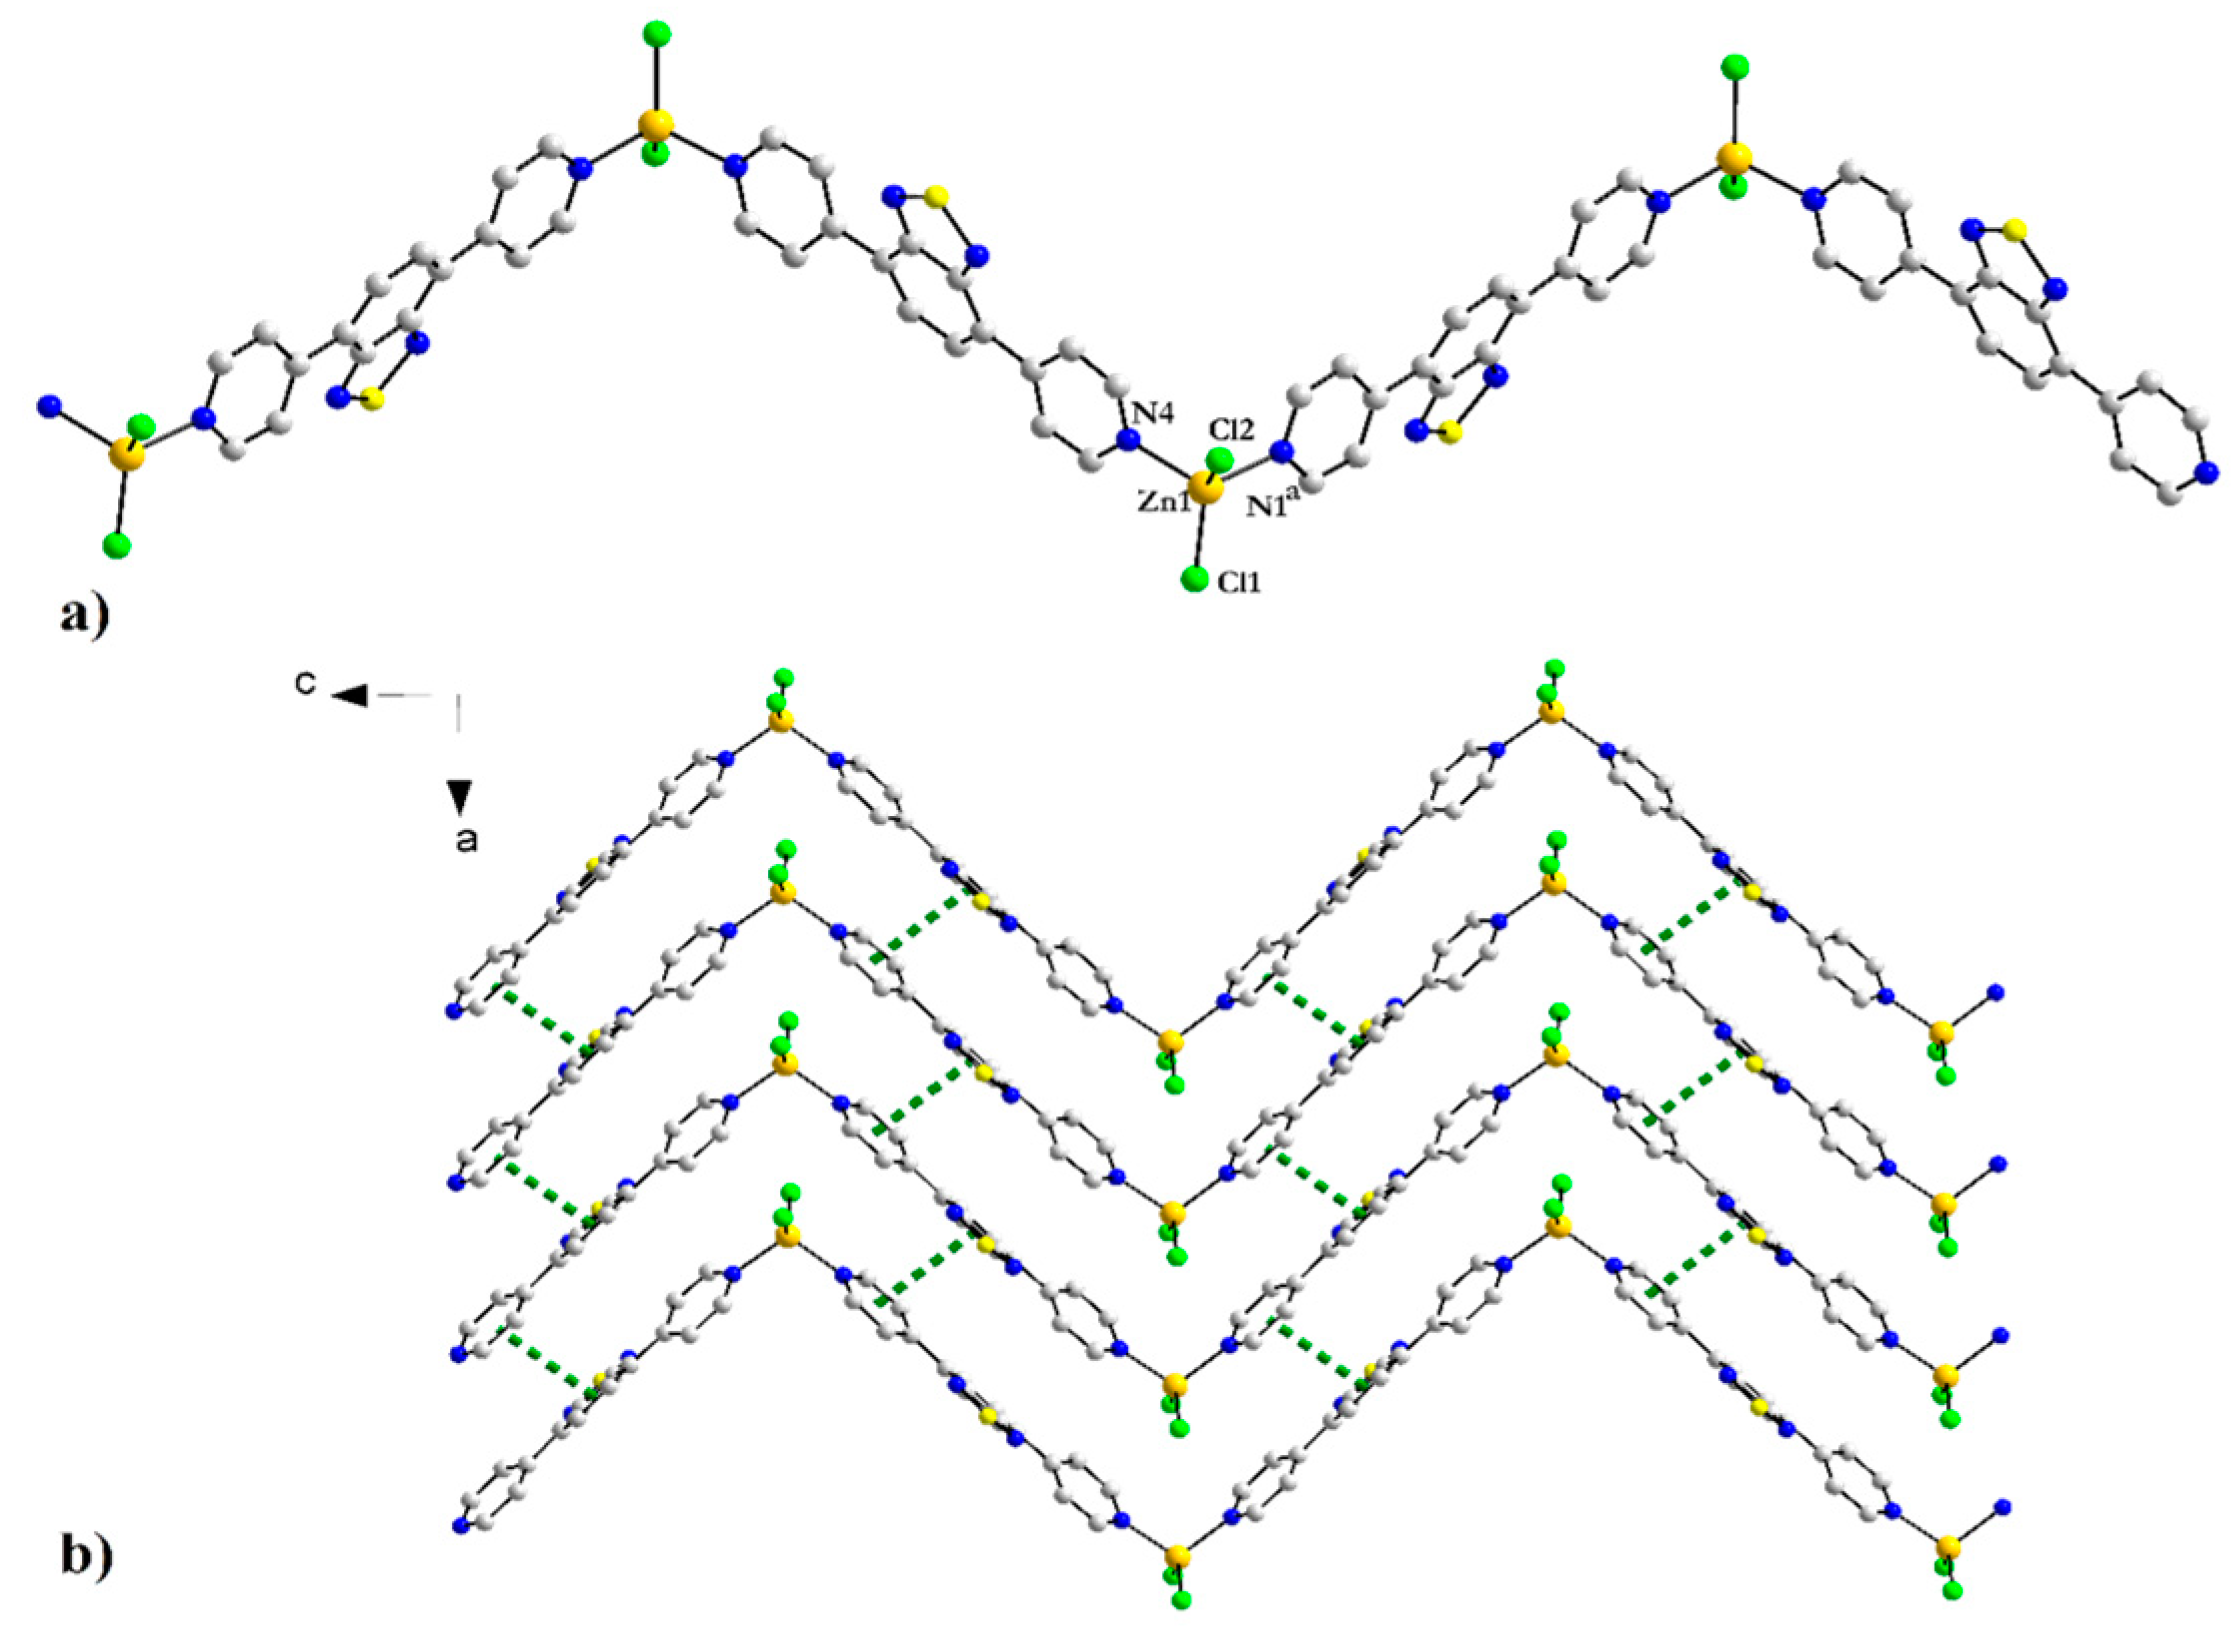
The pyridine rings of the two 4-PyBTD ligands show large distortions with respect to the BTD units in complex 8, with dihedral angles of 46.3° (N1), 39.4° (N4), 38.6° (N5) and 39.8° (N8) (Figure S11a), and, comparable, much weaker distortions in the coordination polymer 9 (23.2° (N1) and 16.9° (N4)) (Figure 7). In the structure of 8 a 2D network is established thanks to π–π stacking interactions between pyridine rings, with centroid–centroid distances of 3.79 and 3.78 Å (Figure S11b). In the coordination polymer 9, the bidentate tecton connects the metal ions in zig-zag chains (Figure 7a).
The chains arrange in layers upon π–π stacking interactions between pyridine and benzene rings, with an interplanar distance of 3.89 Å (Figure 7b).
The purity of the different complexes have been checked, when the amounts were sufficient, by elemental analysis and powder X-ray diffraction (PXRD) analysis, by comparing the experimental PXRD diffractograms with those simulated from the single crystal X-ray data (Figures S12–S16).

3.4. Photophysical Properties

As mentioned in the Introduction, the Py-BTD ligands are luminescent. Their coordination to metal ions with d10 configurations such as Zn(II) should provide luminescent complexes with, in principle, an increase of the emission efficiency as a consequence of a more rigid structure [47,48,49,50]. Moreover, emission wavelength could vary because of the different dihedral angles between the pyridine and BTD units, influencing the extension of the π-conjugated system. We have therefore investigated the photophysical properties of the Zn(II) complexes of ligands 2-PyBTD and 4-Py-BTD and compared them with those of the ligands, previously reported [30]. In order to have reliable comparisons between ligands, molecular complexes and coordination polymers, all the measurements have been performed in the solid state.

3.4.1. Complexes 1 and 2

The ligand 2-PyBTD presents in the UV-Vis absorption spectrum a very broad intense band with a maximum at 420 nm and another distinct weaker band at 258 nm encompassing several π–π* transitions [30] (Figure S17). Upon excitation at λex = 400 nm, an intense emission band centered at λem = 523 nm is observed, which, interestingly, is strongly bathochromically shifted when compared to the value λem = 469 nm (λex = 299 nm) measured in acetonitrile solutions [30] (see Figure S18 for spectra measured in CH2Cl2 solutions). Clearly, packing effects have a strong influence on the absorption and emission wavelengths. However, a direct comparison between the photophysical properties of 2-Py-BTD and its zinc(II) complexes 1 and 2 is not straightforward since in the former the pyridine rings adopt a trans-trans conformation [30], while in the complexes the respective conformations are cis-trans and cis-cis.
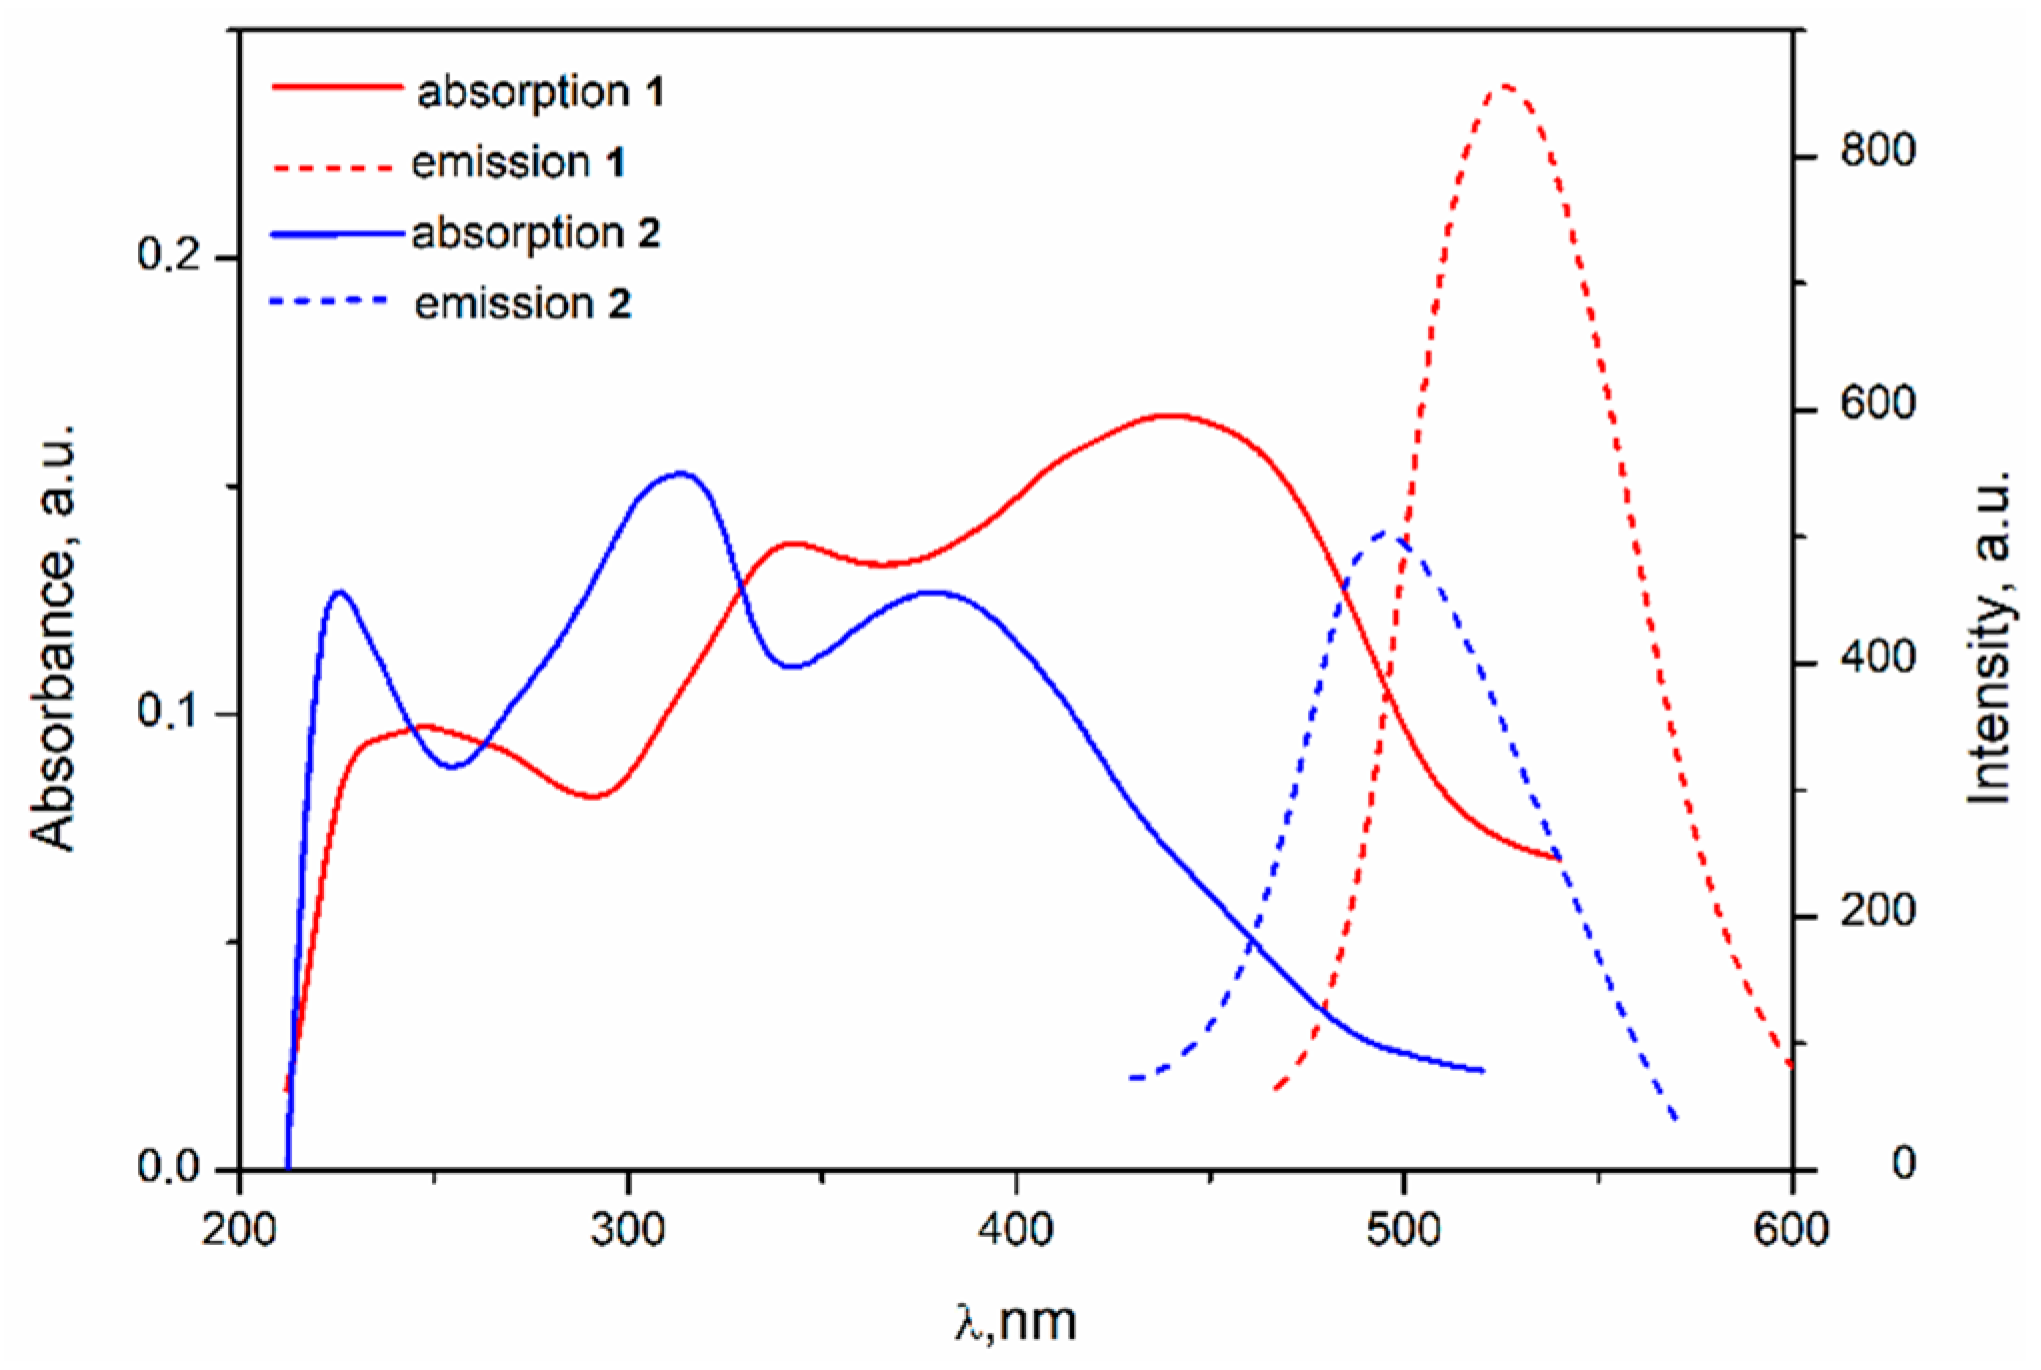
The Zn(II) ion does not possess any d-d transition, therefore, following its coordination to 2-PyBTD, ligand based π–π* transitions centered at 247, 343 and 440 nm are observed in the UV-Vis spectrum of complex 1 (Figure 8). In its emission spectrum, the band observed at λem = 526 nm upon excitation at λex = 440 nm is much more intense than the one of the free ligand.
Coordination of two Zn(hfac)2 fragments induces massive changes in the photophysical properties of complex 2 compared to the free ligand and complex 1. In the diffused reflexion UV-Vis absorption spectrum of 2, three bands at 379, 313 and 226 nm are observed, while the emission spectrum shows an intense band centered at λem = 495 nm upon excitation at λex = 380 nm (Figure 8). The blue-shift of the absorption and emission bands of complex 2 compared to complex 1 can be tentatively explained, on the one hand, by the different conformations adopted by the pyridine rings, that is, cis-cis in 2 and cis-trans in 1 and also by the decrease of planarity in the former system upon coordination of 2-PyBTD to two metal centers. Indeed, in complex 2 the twist between the two pyridine rings amounts to 52.9° compared to 7.3° in 1 and the distortion with respect to the BTD chromophore are 26.9° in 2 and 14.1° and 15.3° in 1 (see Figure 1 and Figure 2). On the other hand, photophysical properties measured in the solid state can be strongly influenced by the intermolecular interactions in the packing. As discussed above, in complex 1 there is formation of supramolecular dimers through π–π stacking interactions between the uncoordinated pyridine and BTD, while in 2 the complexes form supramolecular chains through π–π stacking between the pyridine units (vide supra). The influence of all these factors on the absorption/emission properties is difficult to be disclosed.
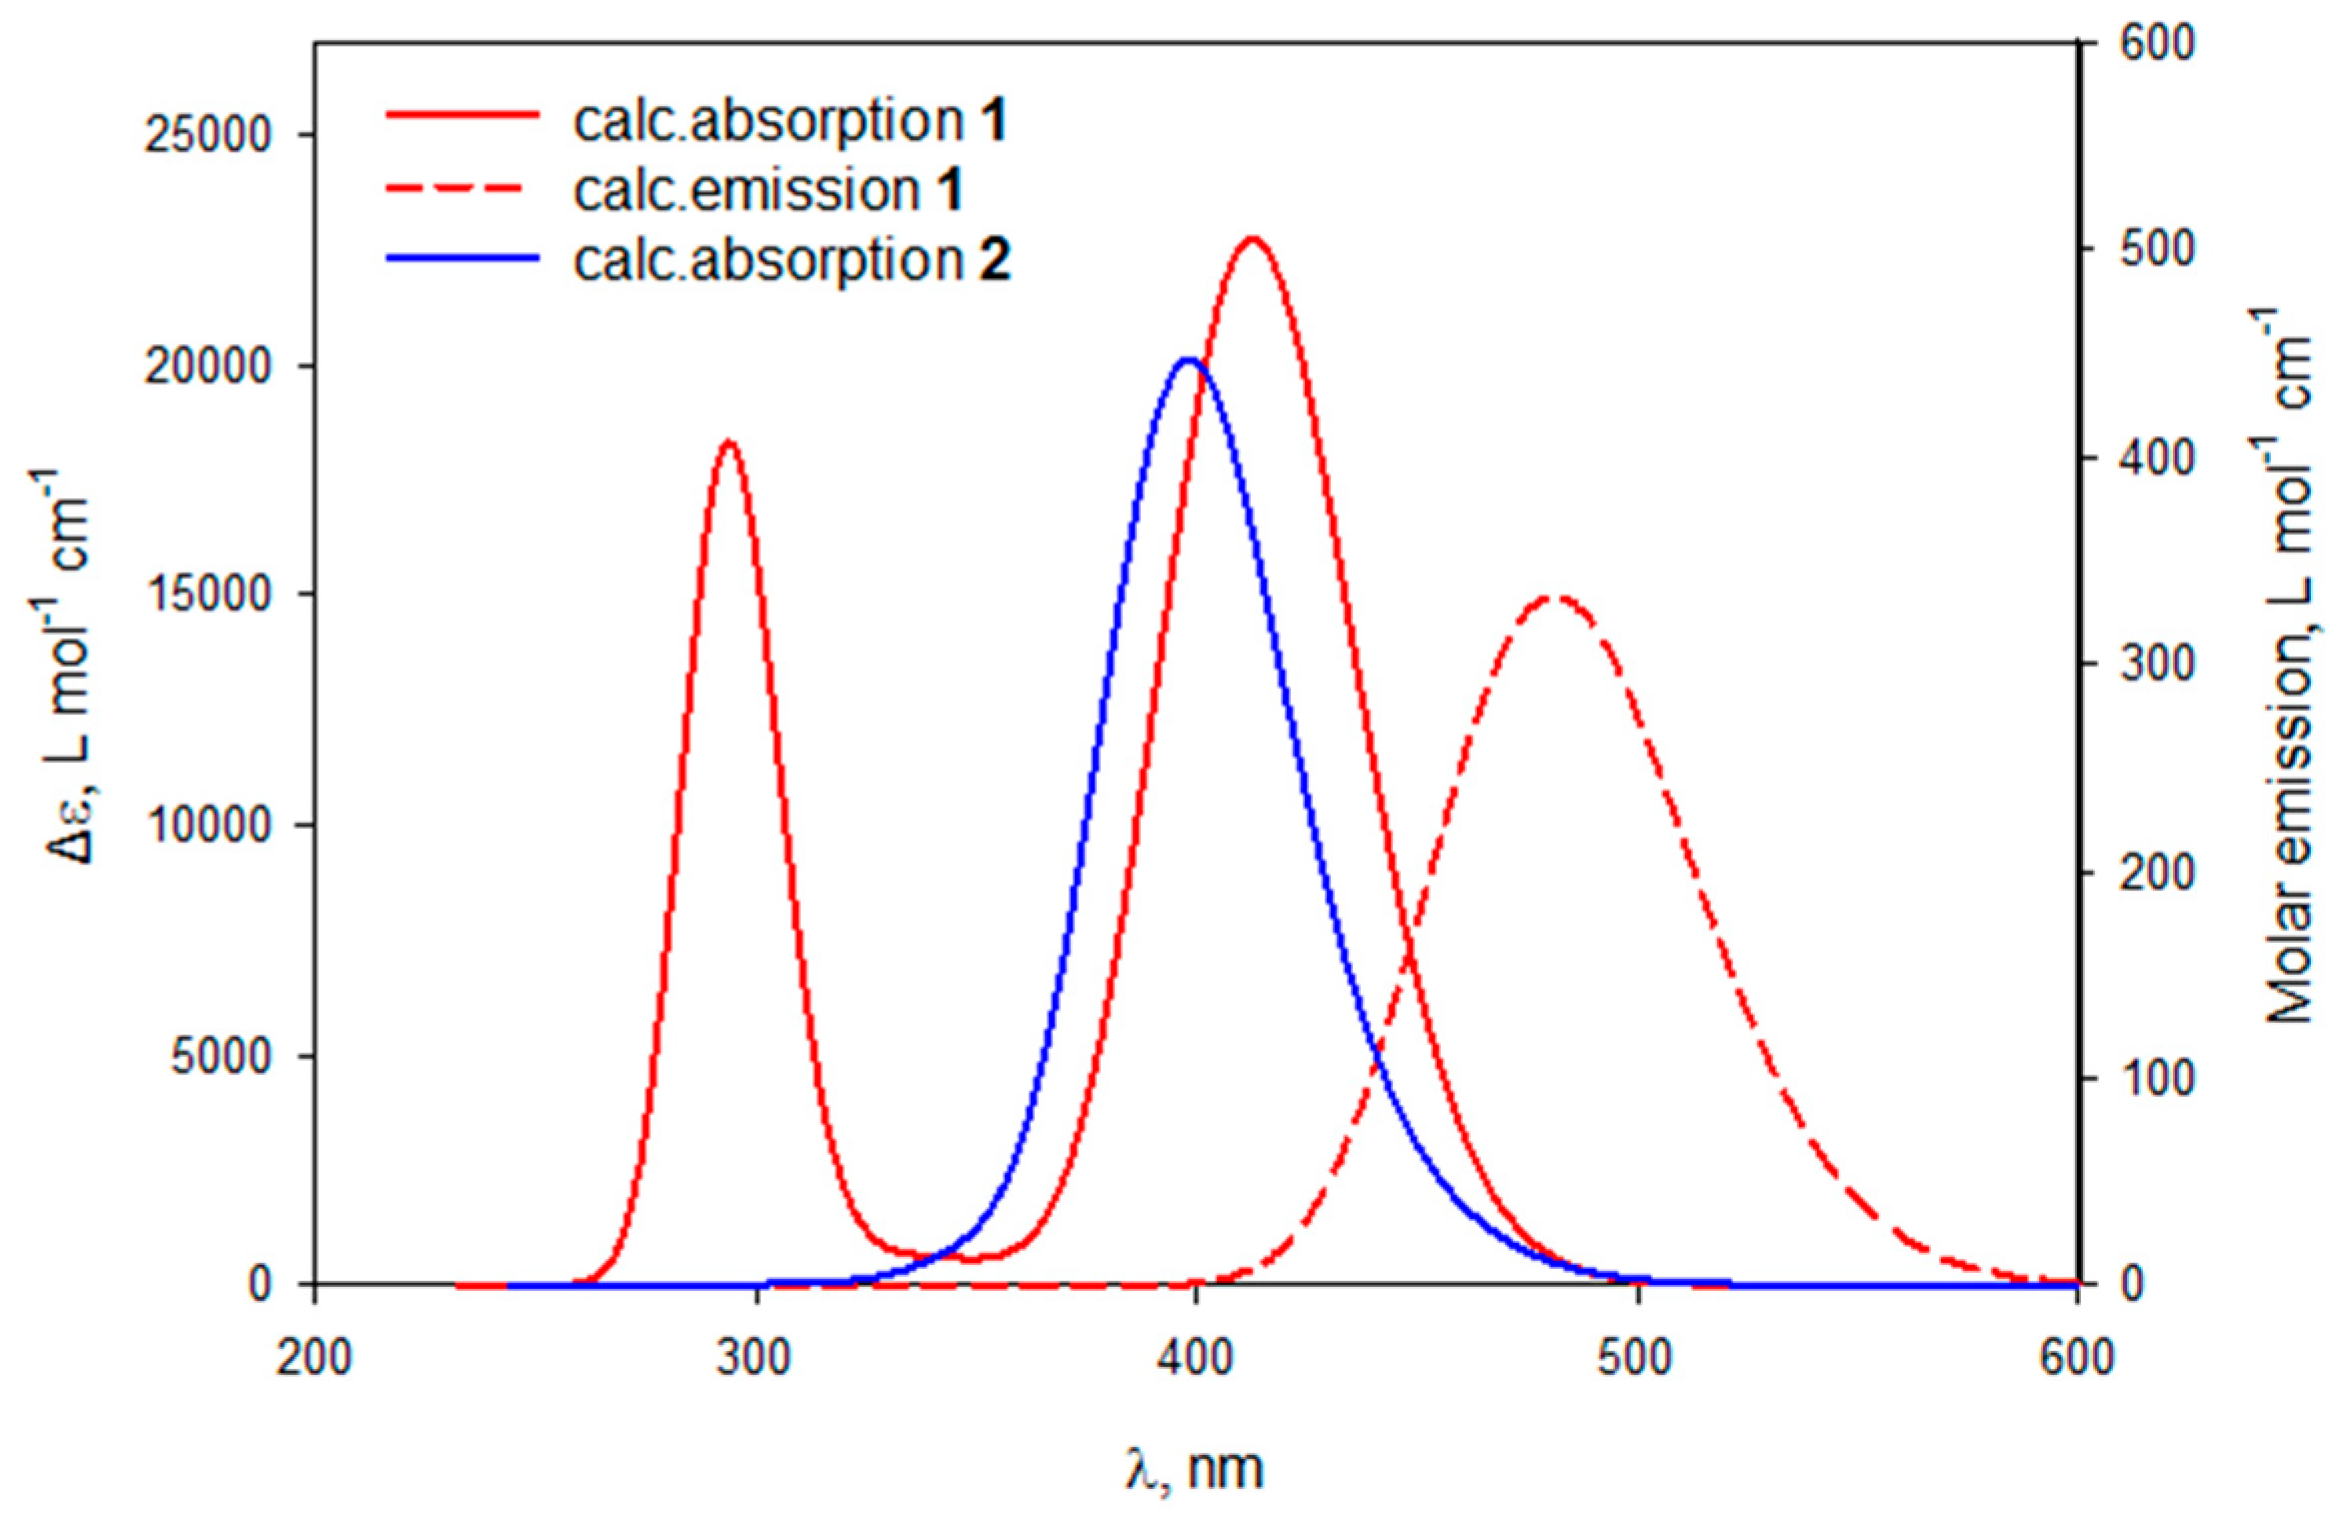
In order to have an insight on the nature of the electronic transitions involved in the absorption and emission bands, we have performed DFT and TD-DFT calculations on both complexes 1 and 2 (see the details in the SI). The optimized geometries are in agreement with the experimental ones obtained by X-ray structure analysis. The simulated UV-Vis absorption spectra of complexes 1 and 2 are shown in Figure 9.
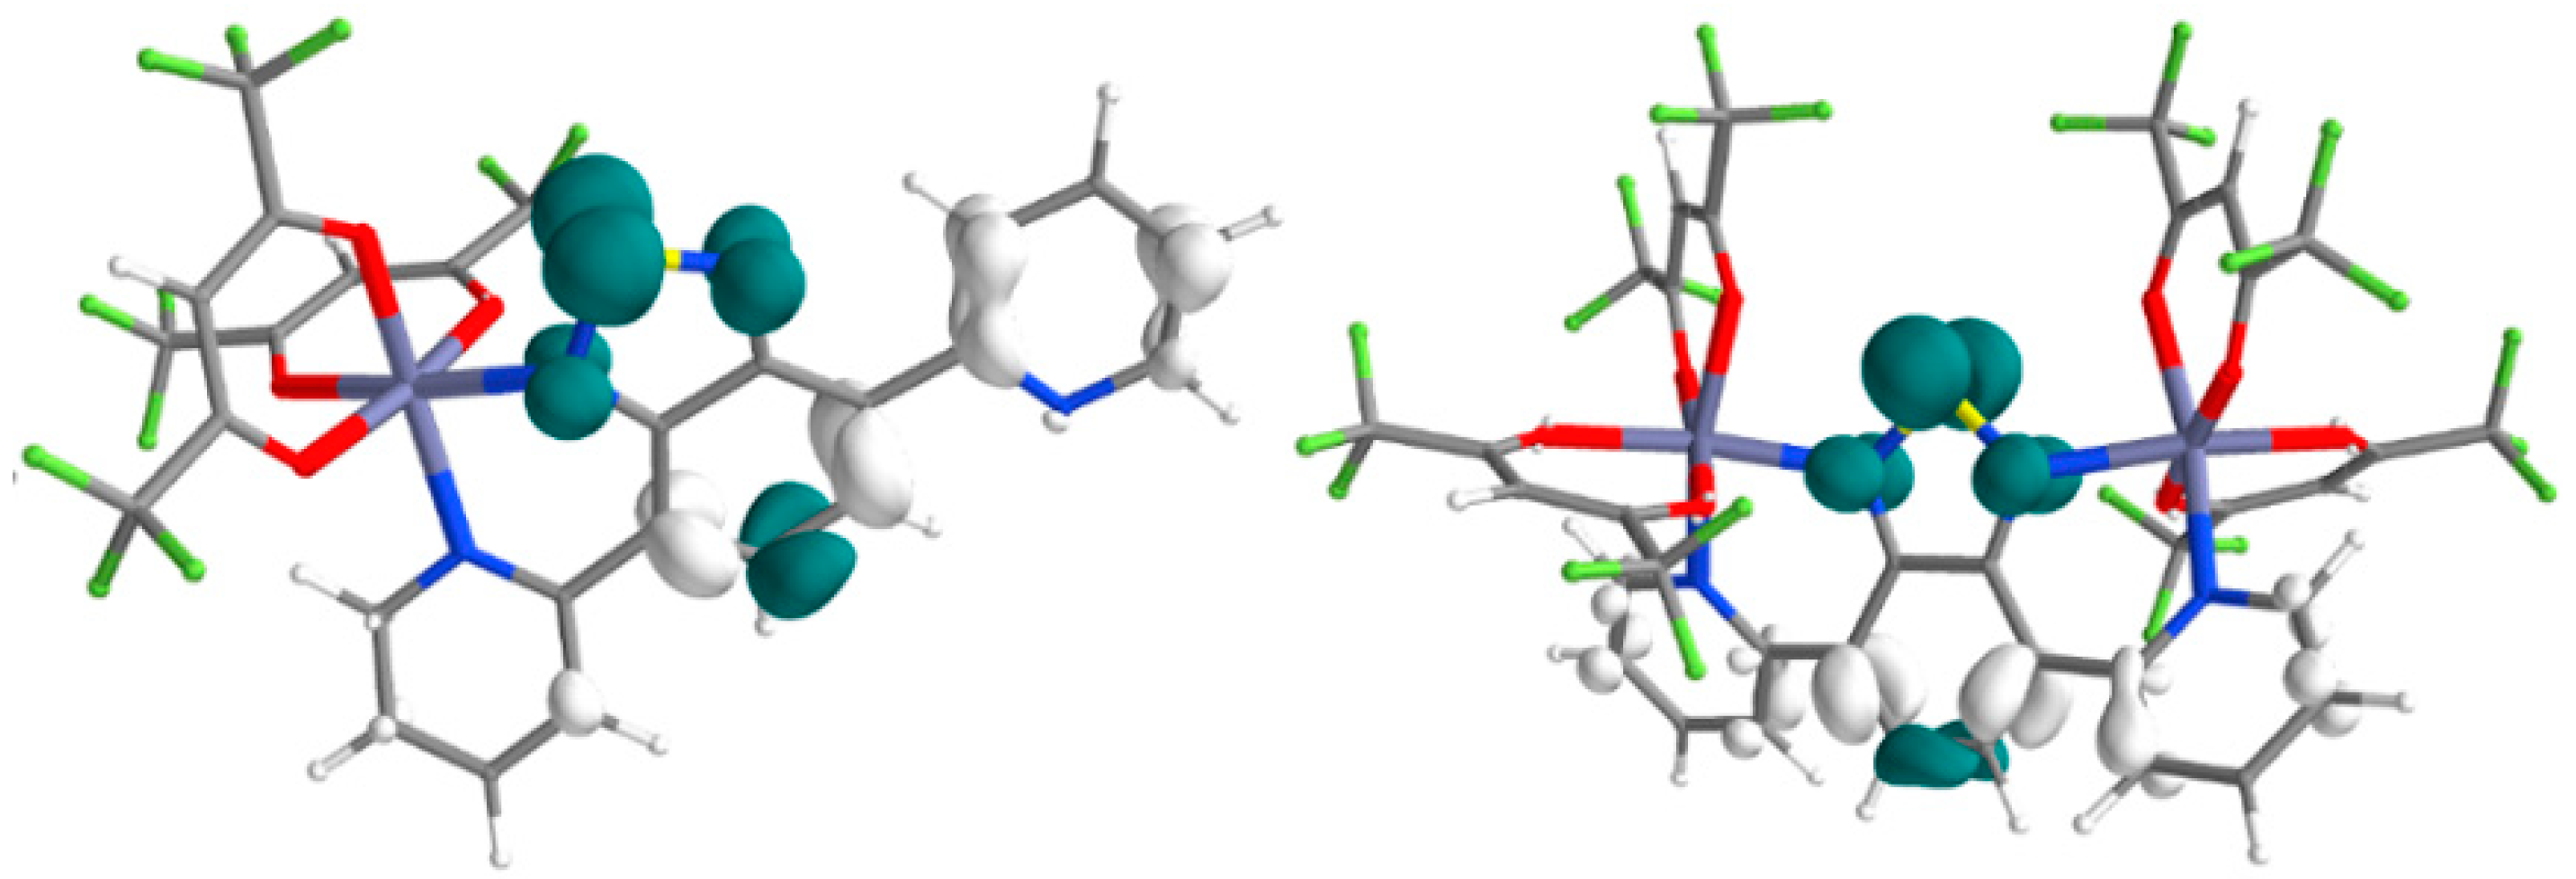
The first calculated allowed transition in complex 1, occurring at 413 nm (SI), corresponds to a HOMO → LUMO excitation of π–π* type (Figure 10 left), HOMO being based mainly on the pyridine and benzene rings, while LUMO is mainly delocalized on the BTD unit, with a large participation of the thiadiazole ring. The corresponding calculated emission wavelength values amounts to 478 nm, hence blue-shifted compared to the experimental value measured in the solid state but in agreement with the value of 467 nm for the emission in CH2Cl2 solution (Figure S19). One can thus hypothesize that the red-shift for the absorption/emission bands observed in the solid state is the consequence of intermolecular π–π stacking interactions, all the more since HOMO and LUMO are localized on the π system involved in the corresponding electronic transition. In complex 2 the highest four occupied orbitals, that is, from HOMO–3 to HOMO, are in-phase and out-of-phase combinations of hfac based orbitals, while the LUMO has a similar distribution as in complex 1, namely on the BTD unit, with a large participation of the thiadiazole ring. Consequently, the first four singlet excited states, which are HOMO–n → LUMO excitations (n = 0–3), present very weak oscillator strengths. The first intense absorption band is described by a HOMO–4 → LUMO excitation, as shown by the electron density difference (EDD) between the 5th excited state and the ground state (Figure 10 right) and corresponds, as the S1-S0 transition in complex 1, to a charge transfer from the benzene-dipyridine skeleton to thiadiazole. The calculated wavelength value for this absorption is 397 nm, thus slightly blue-shifted compared to 1, yet remaining consistent with the experimental absorption band measured in CH2Cl2 solution occurring at λmax = 387 nm (Figure S20). Unfortunately, the optimization of the excited emissive state for complex 2 could not be carried out due to interstate mixing. It should be emphasized once again, that it is not straightforward to directly compare the absorption/emission wavelengths values between ligand 2-PyBTD, complex 1 and complex 2, as they show the three possible conformations trans-trans, cis-trans and cis-cis, respectively. However, as stated above, the blue-shift observed in the solid state for the absorption/emission bands of 2 compared to those of 1 is very likely due to the different π–π stacking interactions involving the aromatic rings responsible for the corresponding electronic transitions.

3.4.2. Complexes 79

The UV-Vis spectrum of 4-PyBTD ligand, which provided complexes 79, shows the presence of one very broad band with a maximum at 397 nm and an additional weaker band at 260 nm. In the emission spectrum an intense band centered at λem = 472 nm (λex = 370 nm) is observed (Figure S21), in agreement with a previous report [31]. At the difference with ligand 2-PyBTD (vide supra), a much weaker bathochromic shift is observed now for the solid state emission of 4-PyBTD compared to the emission band in acetonitrile solution occurring at λem = 448 nm (λex = 299 nm) [30].
Coordination of Zn(hfac)2 fragments to provide the coordination polymer 7 is accompanied by a strong bathochromic shift of the luminescence, as witnessed by the emission band centered at 527 nm (λex = 460 nm) and an increase of the emission intensity compared to the free ligand (Figure 11). A similar bathochromic shift has been observed for a mixed coordination polymer of Zn(II), 4-PyBTD and isophthalic acid [31].
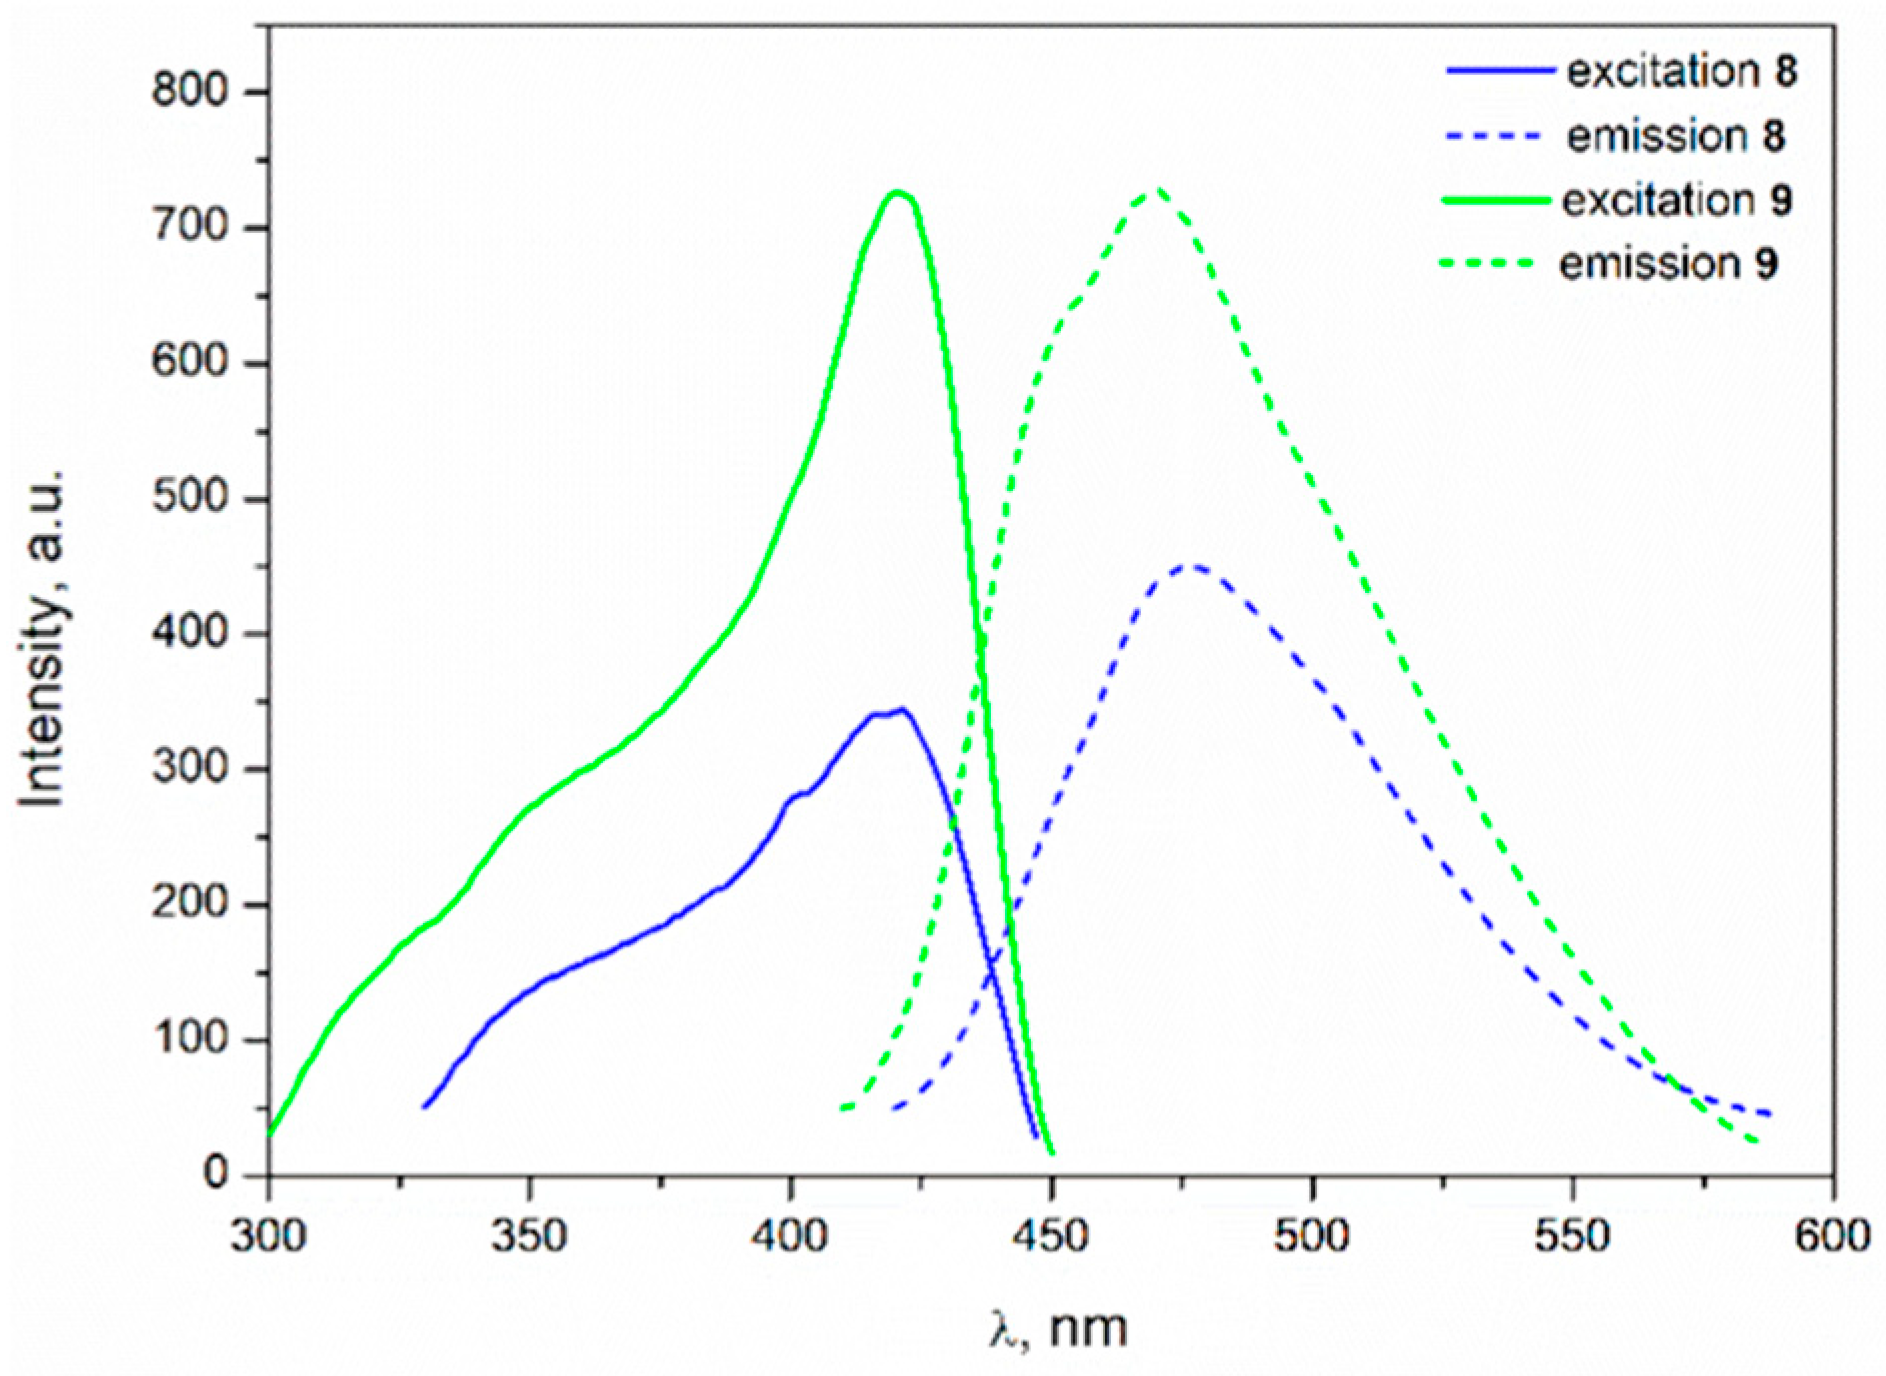
Complexes 8 and 9, containing ZnCl2 fragments instead of Zn(hfac)2, show strong blue luminescence at emission wavelengths of λem = 476 nm (λex = 410 nm) and λem = 471 nm (λex = 400 nm) (Figure 12, see Figure S22 for the absorption spectra), respectively, comparable to the emission wavelength of the free ligand (vide supra). The excitation spectra of both complexes overlap with the corresponding wavelength regions of the absorption spectra.
The absence of bathochromic shift of the luminescence in the case of complexes 8 and 9 when compared to complex 7, might have its origin, besides the different molecular packing in the solid state, in the difference of molecular orbital levels involved in the emission, as a consequence of the strong electron withdrawing effect exerted by the hfac ligands with respect to the chloride ligands which have a π-donating effect.

4. Conclusions

4,7-dipyridyl-2,1,3-benzothiadiazol ligands 2-PyBTD, 3-PyBTD and 4-PyBTD have been used to prepare coordination complexes with d10 transition metals group in order to take advantage of their flexible topicity and luminescence properties. Compounds 15 with 2-PyBTD and 6 with 3-PyBTD represent the first reported complexes based on these ligands. While ligand 2-PyBTD showed chelating behavior towards zinc(II) and silver(I) ions, involving coordination by the pyridine and thiadiazole nitrogen atoms, in the zinc(II) complexes based on 3-PyBTD and 4-PyBTD the ligands act as bridges through the pyridine nitrogen atoms to provide the coordination polymers 6, 7 and 9. Moreover, the mononuclear complex [ZnCl2(4-PyBTD)2] 8 has been prepared as well, as a brick model for the coordination polymer 9. In the crystal structures of all the complexes the occurrence of supramolecular interactions directing the overall architecture has been thoroughly discussed. A very peculiar coordination behavior of 2-PyBTD has been revealed in the coordination polymer 5 with silver nitrate, where the ligand shows a tridentate coordination mode leading to the formation of an original 2D structure. A striking difference has been observed between 3-PyBTD and 4-PyBTD towards the Zn(hfac)2 fragments in complexes 6 and 7, since in the former the pyridine nitrogen atoms are in cis configuration, while in the latter they coordinate the metal ion in axial positions. Solid state photophysical properties of the zinc(II) complexes of ligands 2-PyBTD and 4-PyBTD indicate an enhancement of the emission intensity when compared to the free ligands. The emission wavelength shows modulation with the nuclearity of the complexes, that is, blue-shift in 2 compared to 1 very likely because of the different intermolecular π–π stacking interactions, and with the coordinated fragment, that is, red-shift in 7 compared to 8 and 9. DFT calculations on complexes 1 and 2 shed light on the nature of the electronic transitions involved in the low energy absorption band responsible for the emissive properties. This first coordination chemistry study of PyBTD with d10 metals clearly highlight the interest of these ligands for the access to multifunctional ligands and open the way towards the preparation of whole series of complexes. Particularly attractive, for example, is the use of 2-PyBTD ligand as bridge between paramagnetic metal centers where the magnetic interaction can be mediated by the oxidation state of the ligand [51], when considering the possibility to reduce the BTD unit into radical anion species. These directions are currently explored in our groups.

Supplementary Materials

The following are available online at https://www.mdpi.com/2624-8549/3/1/20/s1. Table S1. Crystallographic data, details of data collection and structure refinement parameters for compounds 15. Table S2. Crystallographic data, details of data collection and structure refinement parameters for compounds 69. Table S3. Selected bond angles (°) for compounds 1 and 2. Table S4. Selected bond angles (°) for compounds 3 and 4. Table S5. Values of the SHAPE parameter for the Ag1 ion in compound 5 for hexacoordination. Table S6. Selected bond angles (°) for compound 5. Table S7. Selected bond angles (°) for compound 6. Table S8. Selected bond angles (°) for compound 7. Table S9 Selected bond angles (°) for compounds 8 and 9. Figure S1. IR spectrum of compound 1. Figure S2. IR spectrum of compound 2. Figure S3. IR spectrum of compound 3. Figure S4. IR spectrum of compound 4. Figure S5. IR Spectrum of compound 6. Figure S6. IR spectrum of compound 7. Figure S7. IR spectrum of compound 8. Figure S8. IR spectrum of compound 9. Figure S9. Perspective of the 1D supramolecular assembly in 4. Figure S10. Schematic representation of the supramolecular layer in crystal structure of 6. Figure S11. (a) Molecular structure of complex [ZnCl2(4-PyBTD)2] 8; (b) Perspective view of the 2D layers resulting from π–π stacking between pyridine rings from adjacent mononuclear species. Figure S12. Simulated (black) and experimental (red) powder X-ray diffractograms for compound 1. Figure S13. Simulated (black) and experimental (red) powder X-ray diffractograms for compound 2. Figure S14. Simulated (black) and experimental (red) powder X-ray diffractograms for compound 4. Figure S15. Simulated (black) and experimental (red) powder X-ray diffractograms for compound 7. Figure S16. Simulated (black) and experimental (red) powder X-ray diffractograms for compound 8. Figure S17. UV-Vis absorption spectrum (red curve), emission spectrum (blue curve, λex = 400 nm) and excitation spectrum (green curve, λem = 525 nm) of ligand 2-PyBTD. Figure S18. Absorption (red), emission (blue) and excitation (green) spectra of 2-PyBTD recorded in CH2Cl2. (Absorption: λ = 236, 290, 382 nm; Emission: λex = 380 nm, λmax = 466 nm; Excitation: λem = 465 nm, λ = 292, 385 nm). Figure S19. Absorption (red), emission (blue) and excitation (green) spectra of compound 1 recorded in CH2Cl2. (Absorption: λ = 265, 314, 381 nm; Emission: λex = 390 nm, λmax = 467 nm; Excitation: λem = 465 nm, λ = 282, 305, 329, 398 nm). Figure S20. Absorption (red), emission (blue) and excitation (green) spectra of compound 2 recorded in CH2Cl2. (Absorption: λ = 272, 321, 387 nm; Emission: λex = 390 nm, λmax = 470 nm; Excitation: λem = 470 nm, λ = 273, 330, 389 nm). Figure S21. UV-Vis absorption spectrum (red curve), emission spectrum (blue curve, λex = 370 nm) and excitation spectrum (green curve, λem = 470 nm) of ligand 4-PyBTD. Figure S22. (a) UV-Vis absorption spectra of complex 8; (b) UV-Vis absorption spectra of complex 9. Figure S23. Two views of the optimized geometry of 1 together with the atom numbering scheme. Figure S24. HOMO, LUMO, HOMO-1 and LUMO+1 (from top to bottom, two views each) of complex 1. Figure S25. Representation of the F+ function (two views) for complex 1. The blue color indicates the most electrophilic regions. Figure S26. Representation of the F- function (two views) for complex 1. The blue color indicates the most nucleophilic regions. Figure S27. Representation of the Electron Density Difference (S1-S0 left) and (S2-S0 right) for complex 1. The excited electron and the hole regions are indicated by, respectively, blue and white surfaces. Figure S28. Calculated UV-visible absorption spectrum of complex 1 with a gaussian broadening (FWHM = 3000 cm−1). Figure S29. Calculated UV-visible emission spectrum of complex 1 with a gaussian broadening (FWHM = 3000 cm−1). Figure S30. Two views of the optimized geometry of 2 together with the atom numbering scheme. Figure S31. HOMO, LUMO, HOMO-1 and LUMO+1 (from top to bottom, two views each) of complex 2. Figure S32. Representation of the Electron Density Difference (S1-S0 left) and (S2-S0 right) for complex 2. The excited electron and the hole regions are indicated by, respectively, blue and white surfaces. Figure S33. Calculated UV-visible absorption spectrum of complex 2 with a gaussian broadening (FWHM = 3000 cm−1).

Author Contributions

N.A. conceived and designed the experiments; T.M. synthesized and characterized the ligands and the complexes; N.P. and T.C. performed the DFT calculations; N.A. and M.A. wrote and/or reviewed the manuscript with contributions from all the authors. All authors have read and agreed to the published version of the manuscript.

Funding

Financial support in France from the CNRS and University of Angers is gratefully acknowledged. The Erasmus exchange program between the University of Angers, France and University of Bucharest, Romania, is acknowledged (internship grant to T.M.).

Acknowledgments

Magali Allain (Plateau CRISTAL, SFR Matrix, University of Angers) is gratefully acknowledged for help with the X-ray structure of complex 6.

Conflicts of Interest

The authors declare no conflict of interest. The funders had no role in the design of the study; in the collection, analyses, or interpretation of data; in the writing of the manuscript, or in the decision to publish the results.

References

  1. Thomas, K.R.J.; Lin, J.T.; Velusamy, M.; Tao, Y.-T.; Chuen, C.-H. Color Tuning in Benzo[1,2,5]thiadiazole-Based Small Molecules by Amino Conjugation/Deconjugation: Bright Red-Light-Emitting Diodes. Adv. Funct. Mater. 2004, 14, 83–90. [Google Scholar] [CrossRef]
  2. Kono, T.; Kumaki, D.; Nishida, J.; Sakanoue, T.; Kakita, M.; Tada, H.; Tokito, S.; Yamashita, Y. High-Performance and Light-Emitting n-Type Organic Field-Effect Transistors Based on Dithienylbenzothiadiazole and Related Heterocycles. Chem. Mater. 2007, 19, 1218–1220. [Google Scholar] [CrossRef]
  3. Zhang, M.; Tsao, H.N.; Pisula, W.; Yang, C.; Mishra, A.K.; Müllen, K. Field-Effect Transistors Based on a Benzothiadiazole−Cyclopentadithiophene Copolymer. J. Am. Chem. Soc. 2007, 129, 3472–3473. [Google Scholar] [CrossRef]
  4. Geng, Y.; Pfattner, R.; Campos, A.; Hauser, J.; Laukhin, V.; Puigdollers, J.; Veciana, J.; Mas-Torrent, M.; Rovira, C.; Decurtins, S.; et al. A Compact Tetrathiafulvalene–Benzothiadiazole Dyad and Its Highly Symmetrical Charge-Transfer Salt: Ordered Donor π-Stacks Closely Bound to Their Acceptors. Chem. Eur. J. 2014, 20, 7136–7143. [Google Scholar] [CrossRef] [PubMed] [Green Version]
  5. Chen, C.T. Evolution of Red Organic Light-Emitting Diodes:  Materials and Devices. Chem. Mater. 2004, 16, 4389–4400. [Google Scholar] [CrossRef]
  6. Neto, B.A.D.; Lapis, A.A.M.; da Silva Júnior, E.N.; Dupont, J. 2,1,3-Benzothiadiazole and Derivatives: Synthesis, Properties, Reactions and Applications in Light Technology of Small Molecules. Eur. J. Org. Chem. 2013, 228–255. [Google Scholar] [CrossRef]
  7. Velusamy, M.; Thomas, K.R.J.; Lin, J.T.; Hsu, Y.; Ho, K. Organic Dyes Incorporating Low-Band-Gap Chromophores for Dye-Sensitized Solar Cells. Org. Lett. 2005, 7, 1899–1902. [Google Scholar] [CrossRef]
  8. Lin, L.-Y.; Lu, C.-W.; Huang, W.-C.; Chen, Y.-H.; Lin, H.-W.; Wong, K.-T. New A-A-D-A-A-Type Electron Donors for Small Molecule Organic Solar Cells. Org. Lett. 2011, 13, 4962–4965. [Google Scholar] [CrossRef]
  9. Lin, L.-Y.; Chen, Y.-H.; Huang, Z.-Y.; Lin, H.-W.; Chou, S.-H.; Lin, F.; Chen, C.-W.; Liu, Y.-H.; Wong, K.-T. A Low-Energy-Gap Organic Dye for High-Performance Small-Molecule Organic Solar Cells. J. Am. Chem. Soc. 2011, 133, 15822–15825. [Google Scholar] [CrossRef]
  10. Haid, S.; Marszalek, M.; Mishra, A.; Wielopolski, M.; Teuscher, J.; Moser, J.-E.; Humphry-Baker, R.; Zakeeruddin, S.M.; Grätzel, M.; Bäuerle, P. Significant Improvement of Dye-Sensitized Solar Cell Performance by Small Structural Modification in π-Conjugated Donor–Acceptor Dyes. Adv. Funct. Mater. 2012, 22, 1291–1302. [Google Scholar] [CrossRef]
  11. Geng, Y.; Pop, F.; Yi, C.; Avarvari, N.; Grätzel, M.; Decurtins, S.; Liu, S.-X. Electronic tuning effects via π-linkers in tetrathiafulvalene-based dyes. New J. Chem. 2014, 38, 3269–3274. [Google Scholar] [CrossRef]
  12. Pop, F.; Amacher, A.; Avarvari, N.; Ding, J.; Lawson Daku, L.M.; Hauser, A.; Koch, M.; Hauser, J.; Liu, S.-X.; Decurtins, S. Tetrathiafulvalene-Benzothiadiazoles as Redox-Tunable Donor-Acceptor Systems: Synthesis and Photophysical Study. Chem. Eur. J. 2013, 19, 2504–2514. [Google Scholar] [CrossRef] [Green Version]
  13. Pop, F.; Seifert, S.; Hankache, J.; Ding, J.; Hauser, A.; Avarvari, N. Modulation of the charge transfer and photophysical properties in non-fused tetrathiafulvalene-benzothiadiazole derivatives. Org. Biomol. Chem. 2015, 13, 1040–1047. [Google Scholar] [CrossRef] [PubMed]
  14. Neto, B.A.D.; Carvalho, P.H.P.R.; Correa, J.R. Benzothiadiazole Derivatives as Fluorescence Imaging Probes: Beyond Classical Scaffolds. Acc. Chem. Res. 2015, 48, 1560–1569. [Google Scholar] [CrossRef] [PubMed]
  15. Aldakov, D.; Palacios, M.A.; Anzenbacher, P. Benzothiadiazoles and Dipyrrolyl Quinoxalines with Extended Conjugated Chromophores−Fluorophores and Anion Sensors. Chem. Mater. 2005, 17, 5238–5241. [Google Scholar] [CrossRef] [Green Version]
  16. Cozzolino, A.F.; Vargas-Baca, I.; Mansour, S.; Mahmoudkhani, A.H. The Nature of the Supramolecular Association of 1,2,5-Chalcogenadiazoles. J. Am. Chem. Soc. 2005, 127, 3184–3190. [Google Scholar] [CrossRef] [PubMed]
  17. Ams, M.R.; Trapp, N.; Schwab, A.; Milić, J.V.; Diederich, F. Chalcogen Bonding “2S–2N Squares” versus Competing Interactions: Exploring the Recognition Properties of Sulfur. Chem. Eur. J. 2019, 25, 323–333. [Google Scholar] [CrossRef] [PubMed]
  18. Alcock, N.W.; Hill, A.F.; Roe, M.S. Hydrido(benzochalcogenadiazole) complexes of ruthenium: Crystal structure of [RuCl(H)(CO)(PPh3)(SN2C6H4)]. J. Chem. Soc. Dalton Trans. 1990, 5, 1737–1740. [Google Scholar] [CrossRef]
  19. Munakata, M.; Kuroda-Sowa, T.; Maekawa, M.; Nakamura, M.; Akiyama, S.; Kitagawa, S. Architecture of 2D Sheets with Six-Membered Rings of Coppers Interconnected by 2,1,3-Benzothiadiazoles and a Layered Structure Composed of the 2D Sheets. Inorg. Chem. 1994, 33, 1284–1291. [Google Scholar] [CrossRef]
  20. Renner, M.W.; Barkigia, K.M.; Melamed, D.; Smith, K.M.; Fajer, J. Ligand-Bridged Heterobimetallic Polymers: Silver(I)-Benzothiadiazole-Nickel Porphyrin Cation-Benzothiadiazole Arrays. Inorg. Chem. 1996, 35, 5120–5121. [Google Scholar] [CrossRef]
  21. Papaefstathiou, G.S.; Perlepes, S.P.; Escuer, A.; Vicente, R.; Gantis, A.; Raptopoulou, C.P.; Tsohos, A.; Psycharis, V.; Terzis, A.; Bakalbassis, E.G. Topological Control in Two-Dimensional Cobalt(II) Coordination Polymers by π–π Stacking Interactions: Synthesis, Spectroscopic Characterization, Crystal Structure and Magnetic Properties. J. Solid State Chem. 2001, 159, 371–378. [Google Scholar] [CrossRef] [Green Version]
  22. Papaefstathiou, G.S.; Tsohos, A.; Raptopoulou, C.P.; Terzis, A.; Psycharis, V.; Gatteschi, D.; Perlepes, S.P. Crystal Engineering: Stacking Interactions Control the Crystal Structures of Benzothiadiazole (btd) and Its Complexes with Copper(II) and Copper(I) Chlorides. Cryst. Growth Des. 2001, 1, 191–194. [Google Scholar] [CrossRef]
  23. Bashirov, D.A.; Sukhikh, T.S.; Kuratieva, N.V.; Naumov, D.Y.; Konchenko, S.N.; Semenov, N.A.; Zibarev, A.V. Iridium complexes with 2,1,3-benzothiadiazole and related ligands. Polyhedron 2012, 42, 168–174. [Google Scholar] [CrossRef]
  24. Sukhikh, T.S.; Ogienko, D.S.; Bashirov, D.A.; Konchenkoa, S.N. Luminescent complexes of 2,1,3-benzothiadiazole derivatives. Russ. Chem. Bull. 2019, 68, 651–661. [Google Scholar] [CrossRef]
  25. Marshall, R.J.; Kalinovskyy, Y.; Griffin, S.L.; Wilson, C.; Blight, B.A.; Forgan, R.S. Functional Versatility of a Series of Zr Metal–Organic Frameworks Probed by Solid-State Photoluminescence Spectroscopy. J. Am. Chem. Soc. 2017, 139, 6253–6260. [Google Scholar] [CrossRef] [Green Version]
  26. Zhang, W.-Q.; Li, Q.-Y.; Cheng, J.-Y.; Cheng, K.; Yang, X.; Li, Y.; Zhao, X.; Wang, X.-J. Ratiometric Luminescent Detection of Organic Amines Due to the Induced Lactam–Lactim Tautomerization of Organic Linker in a Metal–Organic Framework. ACS Appl. Mater. Interfaces 2017, 9, 31352–31356. [Google Scholar] [CrossRef] [PubMed]
  27. Zhao, D.; Yue, D.; Jiang, K.; Cui, Y.; Zhang, Q.; Yang, Y.; Qian, G. Ratiometric dual-emitting MOF⊃dye thermometers with a tunable operating range and sensitivity. J. Mater. Chem. C 2017, 5, 1607–1613. [Google Scholar] [CrossRef]
  28. Cheng, Q.; Han, X.; Tong, Y.; Huang, C.; Ding, J.; Hou, H. Two 3D Cd(II) Metal–Organic Frameworks Linked by Benzothiadiazole Dicarboxylates: Fantastic S@Cd6 Cage, Benzothiadiazole Antidimmer and Dual Emission. Inorg. Chem. 2017, 56, 1696–1705. [Google Scholar] [CrossRef] [PubMed]
  29. Song, W.-C.; Liang, L.; Cui, X.-Z.; Wang, X.-G.; Yang, E.-C.; Zhao, X.-J. Assembly of ZnII-coordination polymers constructed from benzothiadiazole functionalized bipyridines and V-shaped dicarboxylic acids: Topology variety, photochemical and visible-light-driven photocatalytic properties. CrystEngComm 2018, 20, 668–678. [Google Scholar] [CrossRef]
  30. Akhtaruzzaman, M.; Tomura, M.; Nishida, J.; Yamashita, Y. Synthesis and Characterization of Novel Dipyridylbenzothiadiazole and Bisbenzothiadiazole Derivatives. J. Org. Chem. 2004, 69, 2953–2958. [Google Scholar] [CrossRef]
  31. Ju, Z.; Yan, W.; Gao, X.; Shi, Z.; Wang, T.; Zheng, H. Syntheses, Characterization and Luminescence Properties of Four Metal–Organic Frameworks Based on a Linear-Shaped Rigid Pyridine Ligand. Cryst. Growth Des. 2016, 16, 2496–2503. [Google Scholar] [CrossRef]
  32. Shen, K.; Ju, Z.; Qin, L.; Wang, T.; Zheng, H. Two sTable 3D porous metal-organic frameworks with high selectivity for detection of PA and metal ions. Dyes Pigm. 2017, 136, 515–521. [Google Scholar] [CrossRef]
  33. Sheldrick, G.M. Crystal structure refinement with SHELX. Acta Cryst. 2015, C71, 3–8. [Google Scholar]
  34. Sheldrick, G.M. SHELXT–Integrated space-group and crystal-structure determination. Acta Cryst. 2015, A71, 3–8. [Google Scholar] [CrossRef] [PubMed] [Green Version]
  35. Frisch, M.J.; et al. Gaussian∼09 Revision D.01.
  36. Schäfer, A.; Huber, C.; Ahlrichs, R. Fully optimized contracted Gaussian basis sets of triple zeta valence quality for atoms Li to Kr. J. Chem. Phys. 1994, 100, 5829–5835. [Google Scholar] [CrossRef]
  37. Cauchy, T.; Da Mota, B. Quchemreport. A Python Program for Control Quality and Automatic Generation of Quantum Chemistry Results. University of Angers, Angers, France, 2020.
  38. O’boyle, N.M.; Tenderholt, A.L.; Langner, K.M. Cclib: A Library for Package-Independent Computational Chemistry Algorithms. J. Comput. Chem. 2008, 29, 839–845. [Google Scholar] [CrossRef] [PubMed]
  39. Lee, C.-J.; Wei, H.-H. Synthesis, crystal structure and magnetic properties of zinc(II)-hexafluoro-acetylacetonate complexes with pyridyl-substituted nitronyl and imino nitroxide radicals. Inorg. Chim. Acta 2000, 310, 89–95. [Google Scholar] [CrossRef]
  40. Zaman, M.B.; Udachin, K.A.; Ripmeester, J.A. One-dimensional coordination polymers generated from 1,2-bis(x-pyridyl)butadiyne (x = 3 and 4) and bis(hexafluoroacetylacetonato)M(II) (M = Cu, Mn, Zn). CrystEngComm 2002, 4, 613–617. [Google Scholar] [CrossRef]
  41. Steffen, W.L.; Palenik, G.J. Infrared and Crystal Structure Study of σ vs. π Bonding in Tetrahedral Zinc(II) Complexes. Crystal and Molecular Structures of Dichlorobis(4-substituted pyridine)zinc(II) Complexes. Inorg. Chem. 1977, 16, 1119–1127. [Google Scholar] [CrossRef]
  42. Baudron, S.A. Ag(I)-π interactions with pyrrolic derivatives. Coord. Chem. Rev. 2019, 380, 318–329. [Google Scholar] [CrossRef]
  43. Addition, A.W.; Nageswara, R.T.; Reedjik, J.; van Rijn, J.; Verschoor, G.C. Synthesis, structure and spectroscopic properties of copper(II) compounds containing nitrogen–sulphur donor ligands; the crystal and molecular structure of aqua[1,7-bis(N-methylbenzimidazol-2-yl)-2,6-dithiaheptane]copper(II) perchlorate. J. Chem. Soc. Dalton Trans. 1984, 1349–1356. [Google Scholar] [CrossRef]
  44. Yang, L.; Powell, D.R.; Houser, R.P. Structural variation in copper(I) complexes with pyridylmethylamide ligands: Structural analysis with a new four-coordinate geometry index, τ4. Dalton Trans. 2007, 955–964. [Google Scholar] [CrossRef] [PubMed]
  45. Casanova, D.; Llunell, M.; Alemany, P.; Alvarez, S. The Rich Stereochemistry of Eight-Vertex Polyhedra: A Continuous Shape Measures Study. Chem. Eur. J. 2005, 11, 1479–1494. [Google Scholar] [CrossRef]
  46. Llunell, M.; Casanova, D.; Cirera, J.; Bofill, J.M.; Alemany, P.; Alvarez, S.; Pinsky, M.; Avnir, D. SHAPE; Version 2.3; University of Barcelona: Barcelona, Spain; Hebrew University of Jerusalem: Jerusalem, Israel, 2013. [Google Scholar]
  47. Li, M.; Lu, H.-Y.; Liu, R.-L.; Chen, J.-D.; Chen, C.-F. Turn-On Fluorescent Sensor for Selective Detection of Zn2+, Cd2+ and Hg2+ in Water. J. Org. Chem. 2012, 77, 3670–3673. [Google Scholar] [CrossRef]
  48. Ducloiset, C.; Jouin, P.; Paredes, E.; Guillot, R.; Sircoglou, M.; Orio, M.; Leibl, W.; Aukauloo, A. Monoanionic Dipyrrin–Pyridine Ligands: Synthesis, Structure and Photophysical Properties. Eur. J. Inorg. Chem. 2015, 5405–5410. [Google Scholar] [CrossRef]
  49. Kumar, R.S.; Kumar, S.K.A.; Vijayakrishna, K.; Sivaramakrishna, A.; Paira, P.; Rao, C.V.S.B.; Sivaraman, N.; Sahoo, S.K. Bipyridine bisphosphonate-based fluorescent optical sensor and optode for selective detection of Zn2+ ions and its applications. New J. Chem. 2018, 42, 8494–8502. [Google Scholar] [CrossRef]
  50. Diana, R.; Panunzi, B. The Role of Zinc(II) Ion in Fluorescence Tuning of Tridentate Pincers: A Review. Molecules 2020, 25, 4984. [Google Scholar] [CrossRef] [PubMed]
  51. Stetsiuk, O.; Abhervé, A.; Avarvari, N. 1,2,4,5-Tetrazine based ligands and complexes. Dalton Trans. 2020, 49, 5759–5777. [Google Scholar] [CrossRef]
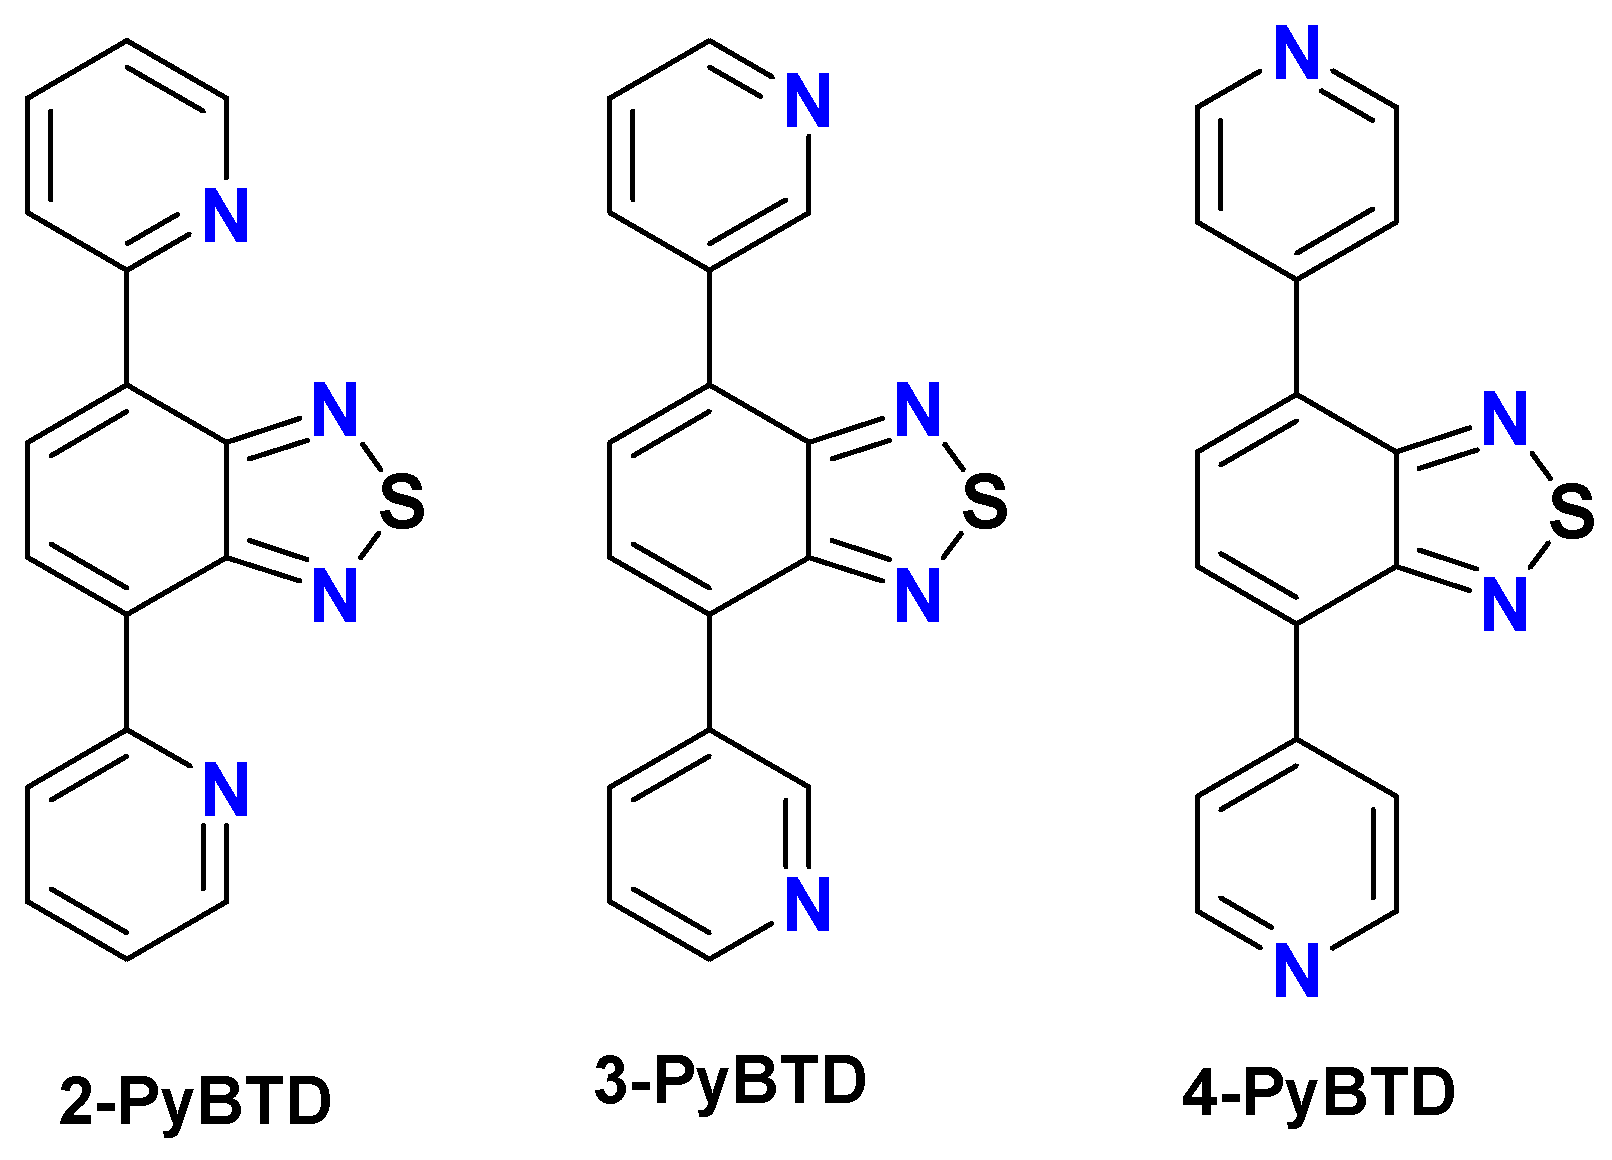
Scheme 1. 4,7-dipyridyl-BTD ligands used in the present study.
Chemistry 03 00020 sch001
Figure 1. (a) Crystal structure of [Zn(hfac)2(2-PyBTD)] (1) with a focus on the coordination sphere of ZnII and partial atom numbering scheme; (b) Supramolecular dimer built out of mononuclear units of opposite chirality (green—Λ configuration, violet—Δ configuration) through π–π stacking interactions.
Chemistry 03 00020 g001
Figure 2. (a) Crystal structure of [Zn2(hfac)4(2-PyBTD)] (2) with a partial atom numbering scheme; (b) View of the packing diagram illustrating the opposite chirality of the metal centers from neighboring binuclear complexes (green—Λ configuration, violet—Δ configuration) (CF3 groups have been omitted for clarity).
Chemistry 03 00020 g002
Figure 3. (a) Crystal structure of complex [Ag(CF3SO3)(2-PyBTD)]2 3. Symmetry operation a = 1 − x, 1 − y, 1 − z; (b) Crystal structure of complex 4. Symmetry operation a = 1 − x, − y, 1 − z; (c) View of a one-dimensional assembly in compound 3 highlighting the π–π stacking interactions between neighboring binuclear species.
Chemistry 03 00020 g003
Figure 4. (a) Structural detail of a double chain formed by Ag(I) and nitrate ions in the crystal structure of compound 5. Symmetry operations a = 1 − x, 0.5 + y, 0.5 − z; b = 1 − x, 1 − y, 1 − z; c = 1 − x, −0.5 + y, 0.5 − z; (b) 2D layer resulting from the cross-linking of double chains with 2-PyBTD ligands; (c) Tridentate coordination mode adopted by 2-PyBTD in 5.
Chemistry 03 00020 g004
Figure 5. (a) Structural detail of a chain built from Zn(hfac)2 nodes and 3-PyBTD spacers in the crystalline structure of compound 6 illustrating the opposite chirality of the alternated metal centers (green—Λ configuration, violet—Δ configuration). Symmetry operations a = −0.5 + x, 1.5 − y, −0.5 + z; (b) View along the a direction of the 2D layers assembled through π–π stacking between adjacent chains (CF3 groups have been omitted for clarity).
Chemistry 03 00020 g005
Figure 6. Linear chain in the crystal structure of compound 7. Symmetry operation a = − x, 2 − y, 2 − z; b = 2 − x, − y, 1 − z.
Chemistry 03 00020 g006
Figure 7. (a) Structural detail of a zig-zag chain in compound 9; (b) Supramolecular layer from π–π stacking interactions. Symmetry operation a = 1.5 − x, 1 − y, 0.5 + z.
Chemistry 03 00020 g007
Figure 8. Solid state UV-Vis absorption (solid lines) and emission (dashed lines) spectra of complexes 1 (red) and 2 (blue).
Chemistry 03 00020 g008
Figure 9. Calculated UV-Vis absorption (solid lines) and emission (dashed line) spectra of complexes 1 (red) and 2 (blue) with a gaussian broadening (FWHM = 3000 cm−1); TD-DFT/PBE1PBE/TZVP.
Chemistry 03 00020 g009
Figure 10. Representation of the Electron Density Differences (EDD) for the S1-S0 transition of complex 1 (left) and the S5-S0 transition of complex 2 (right). The excited electron and hole regions are indicated by, respectively, blue and white surfaces.
Chemistry 03 00020 g010
Figure 11. Solid state UV-Vis absorption and emission spectra of complex 7.
Chemistry 03 00020 g011
Figure 12. Emission (dotted curves, λex = 410 nm for 8 and λex = 400 nm for 9) and excitation (solid curves, λem = 475 nm for 8 and λem = 470 nm for 9) for complexes 8 (blue) and 9 (green).
Chemistry 03 00020 g012
Table 1. Selected bond lengths (Å) for compounds 1 and 2.
12
Zn1–N1
Zn1–N2
Zn1–O1
Zn1–O2
Zn1–O3
Zn1–O4
2.105(6)
2.101(7)
2.092(5)
2.092(6)
2.135(6)
2.087(6)
Zn1–N1
Zn1–N2
Zn1–O1
Zn1–O2
Zn1–O3
Zn1–O4
2.104(2)
2.171(2)
2.115(2)
2.111(2)
2.088(2)
2.064(2)
Table 2. Selected bond lengths (Å) for compounds 3 and 4.
34
Ag1–N1
Ag1–N2
Ag1–N3a
Ag1–N4a
Ag1–O1
2.274(3)
2.361(3)
2.770(3)
2.216(3)
2.657(3)
Ag1–N1
Ag1–N2
Ag1–N3a
Ag1–N4a
2.192(5)
2.587(5)
2.415(5)
2.221(5)
a = 1 − x, 1 − y, 1 − za = 1 − x, 1 − y, 1 − z
Table 3. Selected bond lengths (Å) for compound 5.
5
Ag1–N1
Ag1–O1
Ag1–O3
Ag1–O4
Ag1–O5a
Ag1–O6a
2.302(6)
2.474(5)
2.793(6)
2.571(6)
2.767(5)
2.436(5)
Ag2–N2
Ag2–N4b
Ag2–N7
Ag2–O6
Ag2–O5c
2.294(4)
2.374(6)
2.275(6)
2.736(6)
2.654(5)
a = 1 − x, 0.5 + y, 0.5 − z; b = 1 − x, 1 − y, 1 − z; c = 1 − x, −0.5 + y, 0.5 − z
Table 4. Selected bond lengths (Å) for compound 6.
6
Zn1–O1
Zn1–O2
Zn1–O3
Zn1–O4
Zn1–N1
Zn1–N4a
2.120(3)
2.124(3)
2.112(3)
2.119(3)
2.124(4)
2.120(4)
a = −0.5 + x, 1.5 − y, −0.5 + z
Table 5. Selected bond lengths (Å) for compound 7.
7
Zn1–O1
Zn1–O2
Zn1–N1
Zn2–O3
Zn2–O4
Zn2–N4
2.076(3)
2.075(2)
2.161(2)
2.073(2)
2.096(2)
2.136(2)
Table 6. Selected bond lengths (Å) for compounds 8 and 9.
89
Zn1–N1
Zn1–N5
Zn1–Cl1
Zn1–Cl2
2.049(2)
2.060(2)
2.217(2)
2.214(1)
Zn1–N1a
Zn1–N4
Zn1–Cl1
Zn1–Cl2
2.064(5)
2.068(5)
2.202(2)
2.232(2)
a = 1.5 − x, 1 − y, 0.5 + z
Publisher’s Note: MDPI stays neutral with regard to jurisdictional claims in published maps and institutional affiliations.