Article

First- and Second-Order Raman Scattering and Photorefraction in Nonlinear Optical Crystal LiNbO3:Y3+(0.46 wt%)

by
Nikolay V. Sidorov
1,
Mikhail N. Palatnikov
1,
Alexander Y. Pyatyshev
2,* and
Alexander V. Skrabatun
2,3
1
Tananaev Institute of Chemistry—Subdivision of the Federal Research Centre, Kola Science Centre of the Russian Academy of Sciences, Science Centre of Russian Academy of Sciences (ICT KSC RAS), 184209 Apatity, Russia
2
P. N. Lebedev Physical Institute of the Russian Academy of Sciences, 119991 Moscow, Russia
3
Department of Physics, Bauman Moscow State Technical University, 105005 Moscow, Russia
*
Author to whom correspondence should be addressed.
Physics 2026, 8(2), 39; https://doi.org/10.3390/physics8020039
Submission received: 9 December 2025 / Revised: 28 January 2026 / Accepted: 18 March 2026 / Published: 9 April 2026
(This article belongs to the Section Condensed Matter Physics)

Abstract

It is found that the speckle structure of the photoinduced light scattering indicatrix of the LiNbO3:Y3+(0.46 wt%) crystal and its behavior with the time of crystal irradiation with a laser undergo an atypical behavior caused by the features of the dissipation processes of laser-induced defects in the crystal. In the frequency range of 100–4000 cm−1, the Raman spectra of the LiNbO3:Y3+(0.46 wt%) single crystal were recorded upon excitation by visible (532 nm) and near-IR (785 nm) laser radiation. Five second-order Raman scattering lines were detected in the frequency range of 1000–2100 cm−1, with the frequencies of two of them (of about 1790 cm−1 and 1940 cm−1) somewhat exceeding the doubled value of the frequencies of fundamental vibrations of the 4A1(z)LO (longitudinal optical) and 9E(x,y) symmetry types, which allows us to attribute these lines to the overtones of the fundamental vibrations of 4A1(z)LO and 9E(x,y). It is found that only one Raman scattering line is observed in the region of stretching vibrations of OH-groups (3200–3800 cm−1). The frequency of this line is found to depend on the scattering geometry, varied within 3431–3438 cm−1, and to be shifted to the low-frequency region by about 30–50 cm−1 relative to the frequencies in the IR absorption spectrum. This finding may be due to the alternative prohibition rule due to the presence of the center of symmetry of the oxygen octahedra O6 of the crystal structure.

1. Introduction

Yttrium-containing crystals are extensively used as functional materials for various purposes: scintillators [1,2,3,4], highly efficient catalysts [5,6], wear-resistant electrodes [7], and gas sensors [8,9]. The transition element yttrium is considered most suitable for creating various nonlinear optical and laser materials as an element of the main matrix and activator [10,11], including as an activator in the matrix of the nonlinear optical crystal lithium niobate (LiNbO3), which has exceptionally high values of nonlinear optical coefficients (d33 = 37.8 × 10⁻¹² m/V, d31 = 5.18 × 10⁻¹² m/V, d22 = 2.468 × 10⁻¹² m/V) and quite high radiation resistance [11,12]. It should be noted that the LiNbO3 single crystal is transparent in the range of 0.25–5.3 μm, which allows the use of materials based on it in the visible, near-, and mid-IR (infrared) ranges. LiNbO3:Y3+ crystals are also promising materials for nonlinear optical conversion of laser radiation [13,14,15,16,17,18,19,20,21], generation of THz radiation [22,23], recording of reflective gratings [24,25], and so on.
LiNbO3 single crystals of any composition exhibit the photorefraction effect—the effect of photoinduced change in refractive indices (optical damage) [25,26,27]. The photorefraction effect limits many applications of LiNbO3 single crystals in optics. With the photorefraction effect, quite strong destruction of the laser beam in the crystal occurs, and photoinduced light scattering (PILS) appears. As a result, these phenomena cause distortion of the laser beam wavefront, which leads to distortion of the converted radiation and to instability of the solid-state laser. If the Raman scattering and photorefraction are excited by the same laser radiation, then photorefraction leads to the appearance in the Raman spectrum of lines that are forbidden by the selection rules for this scattering geometry. The Raman spectra of the LiNbO3:Y3+ crystal were previously analyzed in a number of studies [27,28,29,30]. In Ref. [27], the Raman spectra in the ranges of 40–160 and 500–800 cm−1 are investigated for the first time. A line with a frequency of 120 cm−1 was recorded, corresponding to two-particle states of acoustic phonons with a total wavevector equal to zero, and in the scattering geometry x(zx)y, lines of 580 cm−1 and 635 cm−1 were observed. Moreover, the fully symmetric line A1(TO) (transverse optical) with a frequency of 635 cm−1 is forbidden for observation in the Raman spectrum in the scattering geometry x(zx)y and appears in it due to the presence of the photorefraction effect in the crystal. Also, the Raman spectra in the range of 500–700 cm−1 in the scattering geometry z(xz)y have been analyzed. A fundamental Raman line with a frequency of 577 cm−1 and two broad maxima with frequencies of 602 cm−1 and 620 cm−1 were observed on its wing. In the region of totally symmetric (A1(TO)) vibrations of Li+ and Nb5+ ions located in the O6 oxygen octahedra of the LiNbO3 crystal structure (150–350 cm−1), overlapping fundamental Raman lines with frequencies of 254 cm−1 and 275 cm−1, corresponding to the 1A1(z) and 2A1(z) modes, as well as a weak line with a frequency of 334 cm−1 were recorded. In the frequency range of stretching bridge vibrations of oxygen atoms Nb-O-Nb (800–960 cm−1), an asymmetric fundamental Raman line with a maximum near 873 cm−1 and a broad wing with a maximum at about 900 cm−1 was detected. In the scattering geometries y(zx)z and z(xz)y in the ranges of 130–170 and 500–750 cm−1, the presence of fundamental Raman lines with frequencies of 150 cm−1 and 578 cm−1 was detected, and lines with frequencies of 172 cm−1 and 605 cm−1 manifested in the spectrum due to the effect of photorefraction [28,29]. In the scattering geometry x(zx)y, the intensity of the Raman lines at 580 cm−1 and 628 cm−1 turned out to be practically identical. Also, in the LiNbO3:Y3+(0.46 wt%) crystal in the scattering geometries y(zz)y and x(yy)x, a Raman component with a frequency of about 695 cm−1 has been detected [30], the origin of which is quite ambiguous and is discussed in Refs. [31,32]. A double-doped LiNbO3:Y:Mg single crystal grown from a congruent melt has been studied by Raman spectroscopy in Ref. [33]. In the scattering geometry z(yy)z, a number of fundamental Raman lines corresponding to the A1(LO)- and E(TO)-modes were recorded.
Based on a brief review of the existing literature, it should be noted that the Raman spectra of the LiNbO3:Y3+(0.46 wt%) single crystal earlier have been investigated only in the frequency range of 50–1000 cm−1, in which mainly fundamental vibrations of the crystal lattice are manifested. However, the literature completely lacks studies of the Raman spectra of the LiNbO3:Y3+(0.46 wt%) single crystal in the frequency range (1000–4000 cm−1), in which second-order Raman spectra corresponding to bound states of fundamental vibrations of the crystal lattice have been obtained for LiNbO3 crystals of other compositions [34,35,36,37,38]. In addition, earlier studies of the Raman spectra of the LiNbO3:Y3+(0.46 wt%) single crystal have been performed only under excitation by a visible laser source with a wavelength of 514.5 nm and a relatively high power (200 mW), causing a strong photorefraction effect [27]. It should be noted that, due to photorefraction, lines forbidden by the selection rules for the scattering geometry under study appear in the Raman spectrum, as well as spectral components caused by laser-induced defects. In order to obtain information on the state of the intrinsic defect structure of the crystal, undistorted by photoinduced processes, of considerable interest is to study the Raman spectra of the LiNbO3:Y3+(0.46 wt%) single crystal in a wider frequency range (1000–4000 cm−1) without the influence of the photorefraction effect on the Raman spectrum. To this end, it is necessary to excite the Raman scattering with laser radiation in the near- or mid-IR ranges that does not cause the photorefraction effect.
In this paper, comparative studies of the first-order (corresponding to fundamental vibrations of the crystal lattice) and second-order Raman spectra of a LiNbO3:Y3+(0.46 wt%) single crystal in the frequency range of 100–4000 cm−1, including the previously virtually unexplored frequency range of 1000–4000 cm−1, in which overtone processes and bound states of fundamental vibrations may occur in LiNbO3 crystals of different compositions [34,35,36,37,38], are performed for the first time under excitation by laser radiation in the visible (λ0 = 532 nm wavelength) and near-IR (λ0 = 785 nm) ranges. The use of laser sources with wavelengths of 532 nm and 785 nm in the current study is due to the observation that the photorefraction effect in a LiNbO3 crystal depends on the wavelength of the exciting radiation. The photorefraction effect is maximal when the Raman spectra are excited by laser radiation in the visible range with a wavelength of 532 nm and is already absent when the Raman spectra are excited by laser radiation in the near-IR range with a wavelength of 785 nm.

2. Obtaining a LiNbO3:Y3+(0.46 wt%) Single Crystal

To grow a LiNbO3:Y3+(0.46 wt%) single crystal, we used a granulated batch (TU 0.027.039) synthesized in the ICT KSC RAS. The batch preparation is described in detail in Ref. [39]. The batch composition corresponded to the congruent melting composition (48.6 mol% Li2O). The LiNbO3:Y3+(0.46 wt%) single crystal was grown using a platinum crucible in an air atmosphere by the Czochralski method under conditions of a small (approximately 2 °C/cm) axial temperature gradient on a Crystal-2 setup (Voroshilovgrad Electronic Machine Manufacturing Plant, Voroshilovgrad, USSR) equipped with an automatic weight control system, which makes it possible to maintain constant conditions during the crystallization of various samples and, consequently, to grow them with sufficiently reproducible characteristics. Direct doping of the melt with yttrium oxide (Y2O3, 99.99% purity) has been performed. The single crystal was grown in the direction of the polar axis (Z-cut) at a rotation speed of 16 rpm and a travel speed of 0.8 mm/h. The growth rate was 1.08 mm/h. The process was completed when the crystal mass reached 130 g, with no more than 15% of the melt mass crystallizing. The crystal parameters were as follows: cone length—17 mm, cylindrical part length—30 mm, crystal diameter—30 mm, inverse cone length—5 mm. The yttrium concentration was determined directly in the crystal and is 0.46 wt%. The LiNbO3:Y3+ crystal was analyzed by X-ray fluorescence analysis (XRF) on a Spectroscan MAKS-GV (Spectron, St. Petersburg, Russia) instrument. The distribution coefficient is KD(Y) ~0.89. Accordingly, the yttrium concentration in the melt is about 0.52 wt%. The impurity concentration in the single crystal, determined by spectral analysis, is given in Table 1.
Immediately before growing the LiNbO3:Y3+(0.46 wt%) single crystal, the melt was overheated and held in the overheated state for two hours at a temperature significantly (about 200 °C) higher than the melting point in order to increase the homogeneity of the melt and eliminate gas inclusions. Overheating the melt promotes the destruction of associative bonds, which in turn allows for achieving the required homogeneity of the single crystal. Then the melt was gradually cooled to the seeding temperature. Crystal seeding was performed no earlier than 5–7 h after obtaining the melt.
In the zone of post-growth annealing of the single crystal, a virtually isothermal region with a temperature of 1205 °C was formed. The grown single crystal was maintained at this temperature for two hours in order to relieve thermoelastic stresses in the crystal. Then, the crystal was cooled to room temperature at a rate of 50 °C/h. The single crystal grown and cooled to room temperature was subjected to additional annealing in a «Lanthan» (Voroshilovgrad Electronic Machine Manufacturing Plant, Voroshilovgrad, USSR) furnace at 1200 °C, after which it was cooled at a rate of 20 °C/h to a temperature of 1000 °C. In the process of cooling, a constant voltage was applied to the crystal in order to make it monodomain. The monodomain nature of the crystals was controlled by an electroacoustic method based on measuring the electrical impedance using a technique developed by some of the authors [40]. It should be noted that during monodomainization, not only is a monodomain state formed, but also there is a significant reduction in macro-, meso-, and microdefects in the crystal.
The homogeneity of the composition of the LiNbO3:Y3+(0.46 wt%) single crystal was controlled by the chemical composition of impurities and by the Curie temperature value measured by differential thermal analysis for plates cut from the upper and lower parts of the single crystal boule. Table 1 shows that the LiNbO3:Y3+(0.46 wt%) crystal is characterized by high homogeneity along the growth axis by the composition of impurities and main components, as evidenced by the coincidence of the Curie temperatures of the upper and lower parts of the boule. The optical homogeneity of the LiNbO3:Y3+(0.46 wt%) crystal was also controlled by conoscopic and PILS patterns. A single crystal sample in the form of a carefully polished plate or rectangular parallelepiped, the edges of which coincided in direction with the main crystallographic axes x, y, and z (z is the polar axis of the crystal), was mounted on a movable two-coordinate optical stage. This made it possible to scan the entire plane of the input face with a laser beam and obtain a multitude of conoscopic and PILS patterns corresponding to different sections of the cross section of the sample under study. The scanning step was 0.5 mm.
The samples for the studies of Raman spectra were prepared in the form of a rectangular parallelepiped (size 5 × 6 × 7 mm3). The axes of the Cartesian coordinate system were selected in accordance with IEEE standard 176-1987 [41]. The faces of the parallelepiped were carefully polished. The samples for the studies of conoscopic and PILS patterns were prepared in the form of carefully polished plates of 1 mm thickness.

3. Registration of Conoscopic and PILS Patterns, Raman and IR Absorption Spectra of LiNbO3:Y3+(0.46 wt%) Crystal

To study the conoscopic and PILS patterns in this paper, we used the original experimental setups and techniques described in Refs. [42,43]. We used a YAG:Nd3+ laser MLL-100 (Changchun New Industries Optoelectronics Tech. Co., Ltd., Changchun, China) with a radiation wavelength of 532 nm and a laser beam diameter of 3 mm. The conoscopic and PILS patterns of the sample under study were recorded on a translucent screen using a digital camera. The conoscopic patterns were obtained at a laser radiation power of 1 and 90 mW, and the PILS patterns were obtained at a laser radiation power of 160 mW. At a low laser radiation power of 1 mW, the photorefractive effect is exceptionally small, so that no opening of the PILS indicatrix was observed. At such a low laser radiation power, the conoscopic pattern reflects only the state of the intrinsic structural defects of the crystal, since in this case there are no laser-induced defects or defects caused by the photorefraction effect. When excited by the radiation of the MLL-100 laser with a power of 90 mW, the conoscopic images showed both the intrinsic defects of the crystal (determined by the composition and technology of obtaining the crystal) and the defects induced in the crystal by the laser radiation, as well as the defects caused by the effect of photorefraction.
Raman spectra were recorded using BWS465-532S and BWS465-785H i-Raman Plus spectrometers (B&W Tek, Plainsboro Township, NJ, USA) using the known technique [35]. The laser spot diameter at focus was 85 µm. When recording the Raman spectra, the laser radiation power was selected so as not to cause local heating of the sample by laser radiation. Due to the presence of the photorefraction effect in the LiNbO3:Y3+(0.46 wt%) crystal, the value of which can change with the time of irradiation of the crystal by laser radiation, all spectra were recorded at least 10 min after the action of laser radiation on the crystal, after which the photorefraction effect in the crystal no longer changes. IR absorption spectra in the region of stretching vibrations of OH-groups were recorded using a Bruker VERTEX 70x spectrometer (Bruker, Karlsruhe, Germany) using the known technique [38].

4. Photorefractive Properties of LiNbO3:Y3+(0.46 wt%) Crystal

We have investigated the photorefractive properties of the LiNbO3:Y3+(0.46 wt%) crystal using laser conoscopy and PILS. The conoscopic patterns of the LiNbO3:Y3+(0.46 wt%) crystal obtained by irradiation with laser radiation with a wavelength of λ0 = 532 nm and a power of 1 mW and 90 mW are shown in Figure 1. One can see from Figure 1 that at a laser radiation power of 1 mW, the conoscopic pattern of the LiNbO3:Y3+(0.46 wt%) crystal completely corresponds to a uniaxial crystal with a high degree of structural perfection. However, with an increase in the laser radiation power to 90 mW, due to an increase in the photorefraction effect, distortions characteristic of weak optical biaxiality of the crystal appear in the conoscopic pattern. Namely, the circular symmetry of the image is broken, the “Maltese cross” is deformed in the vertical direction without enlightenment in the center, and the angles between its branches differ from right angles. At the same time, the isochromes en effect retain the shape of concentric circles, characteristic of uniaxial crystals.
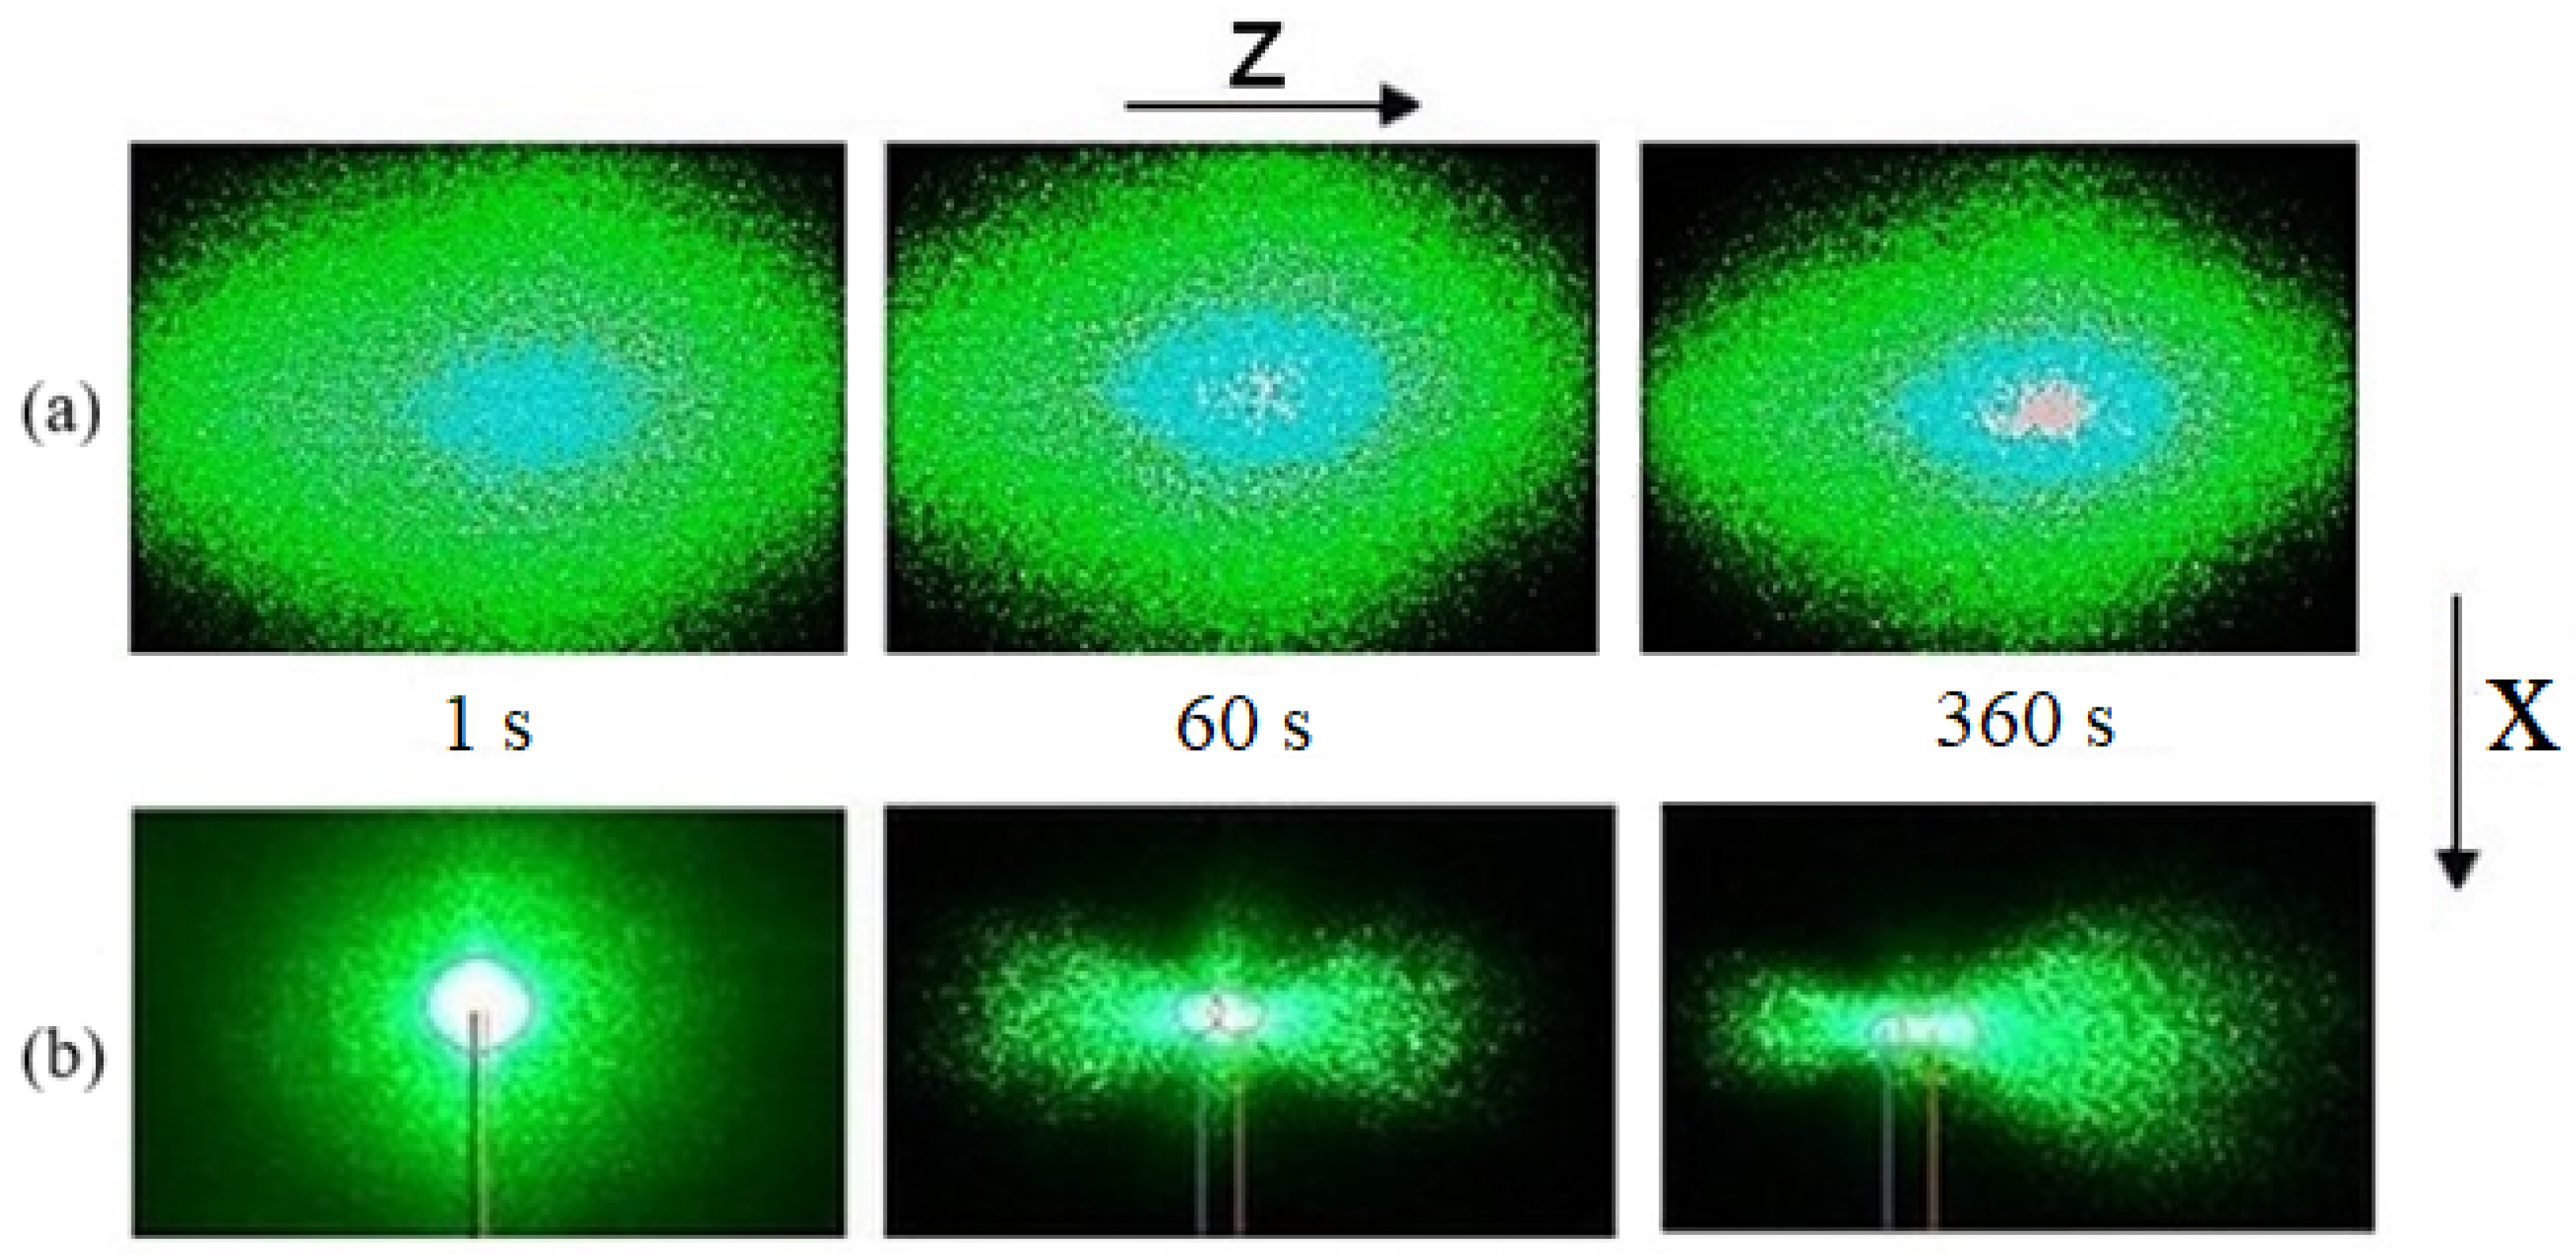
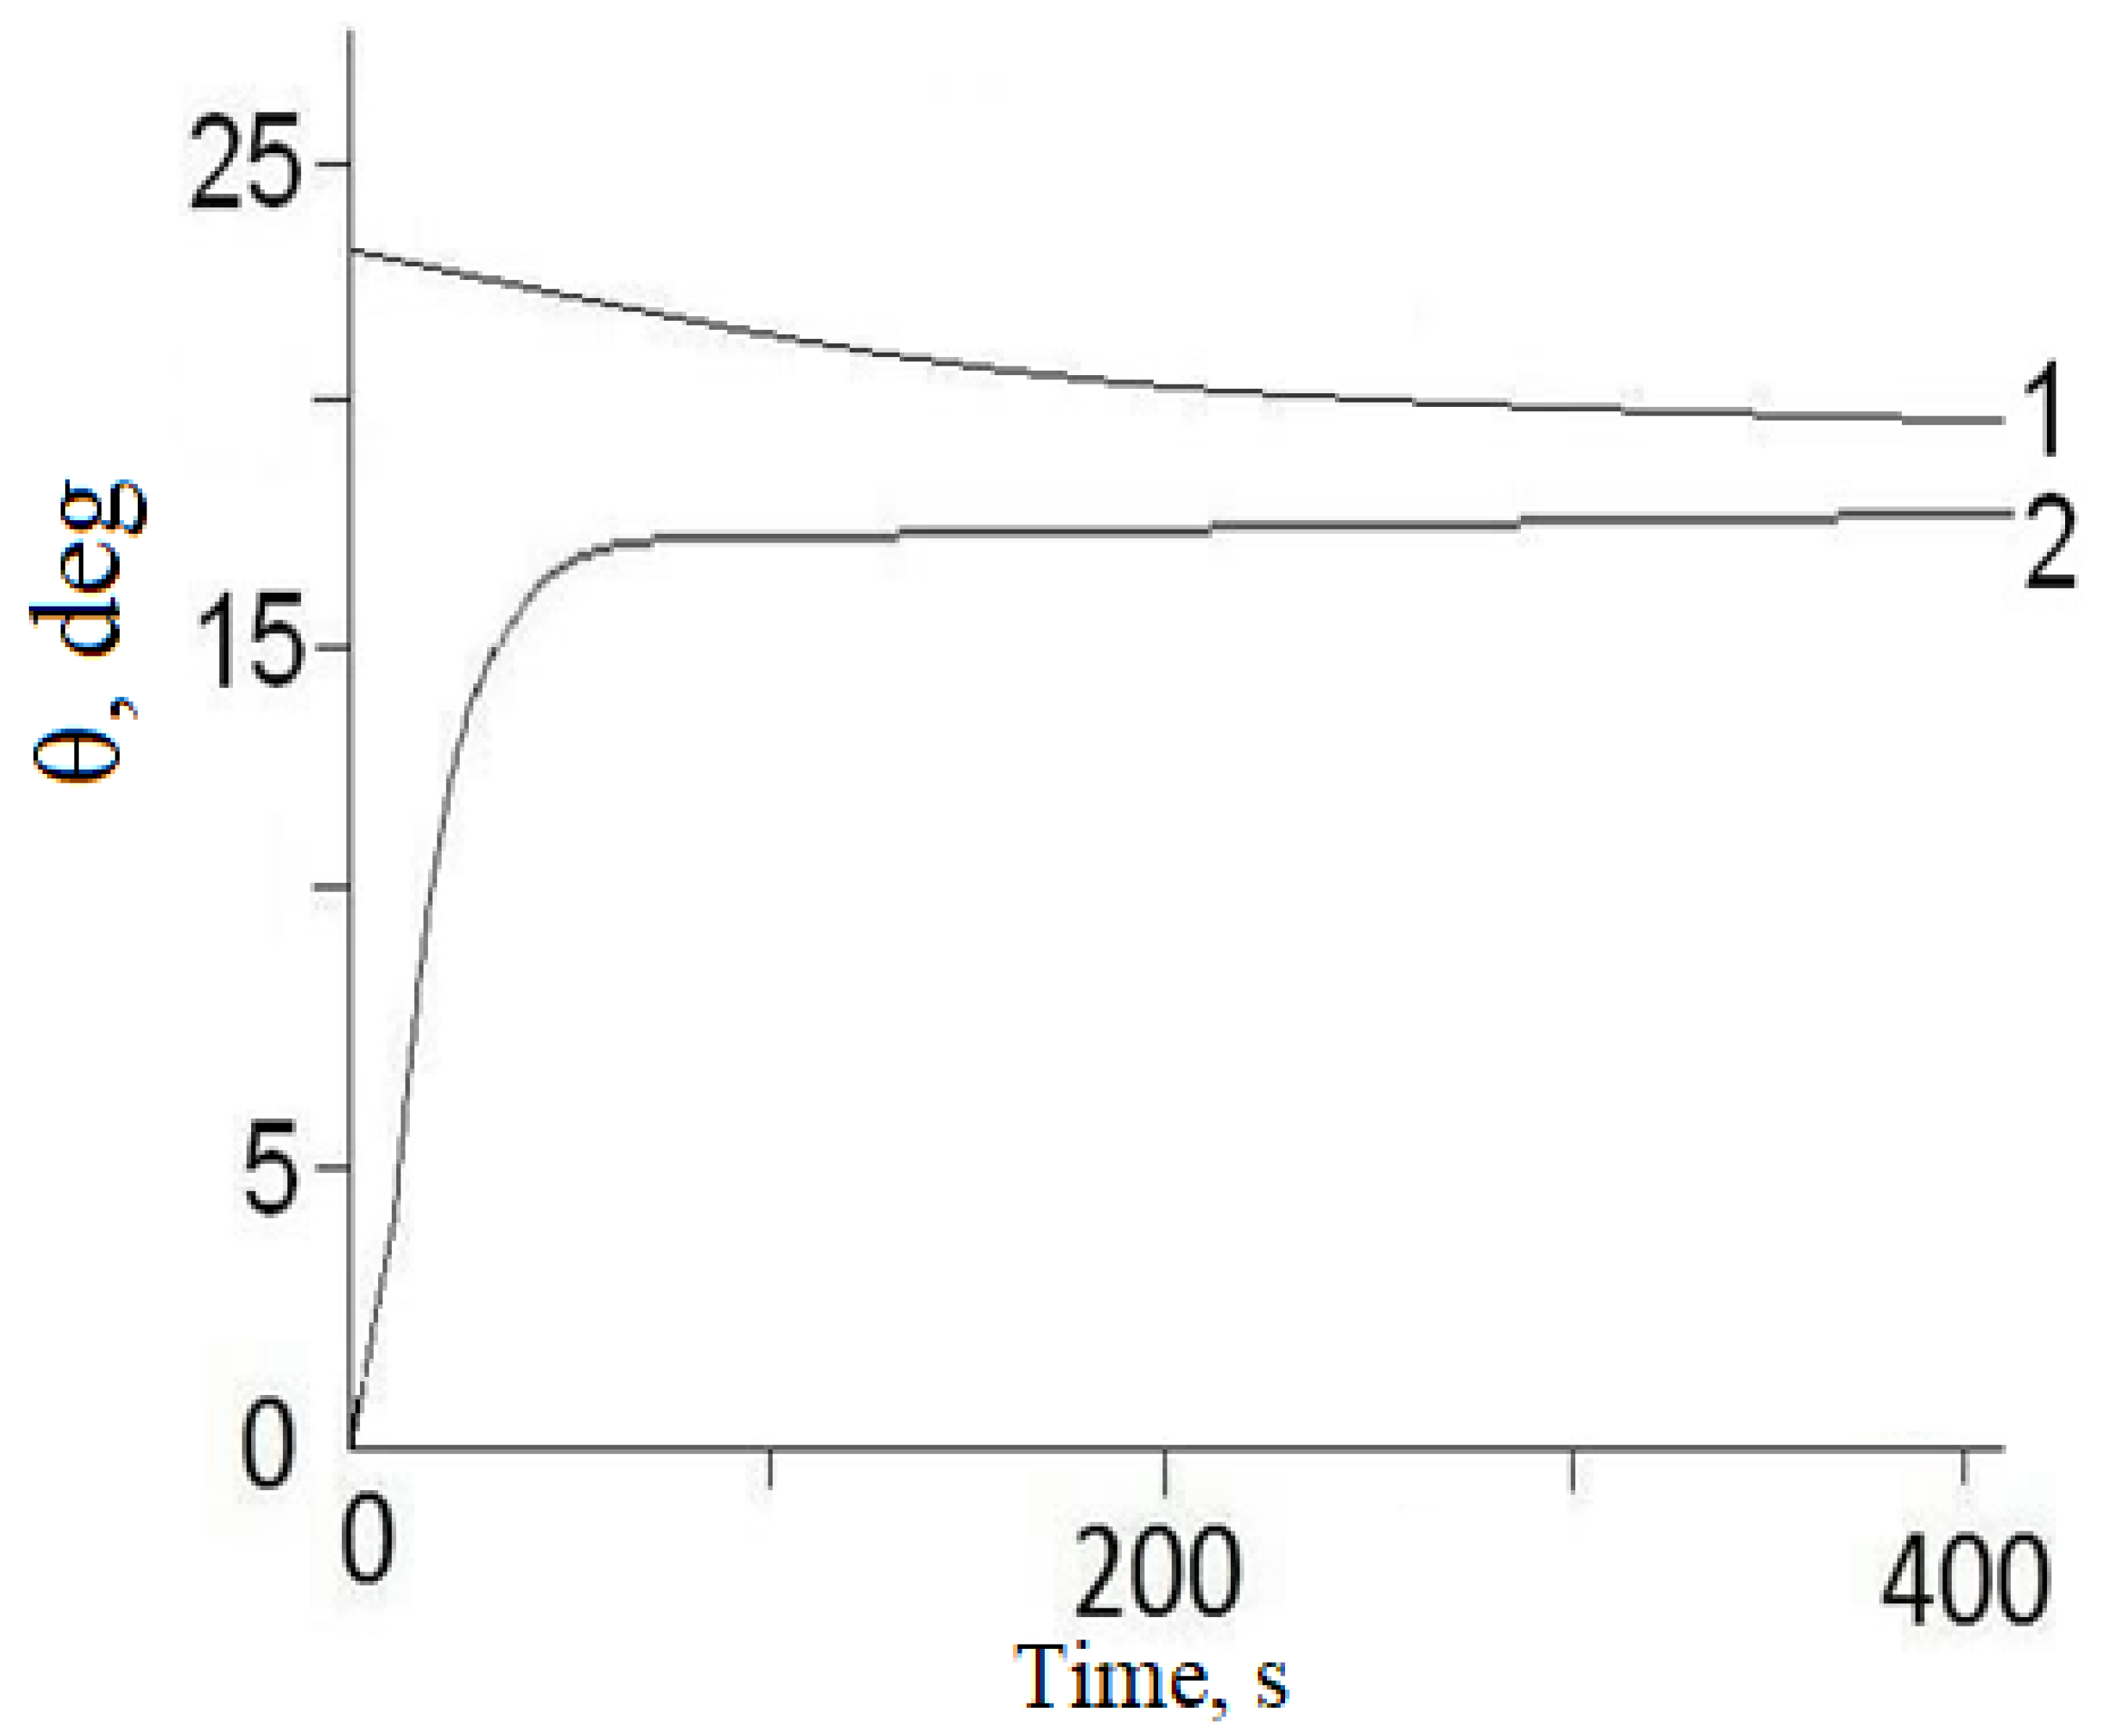
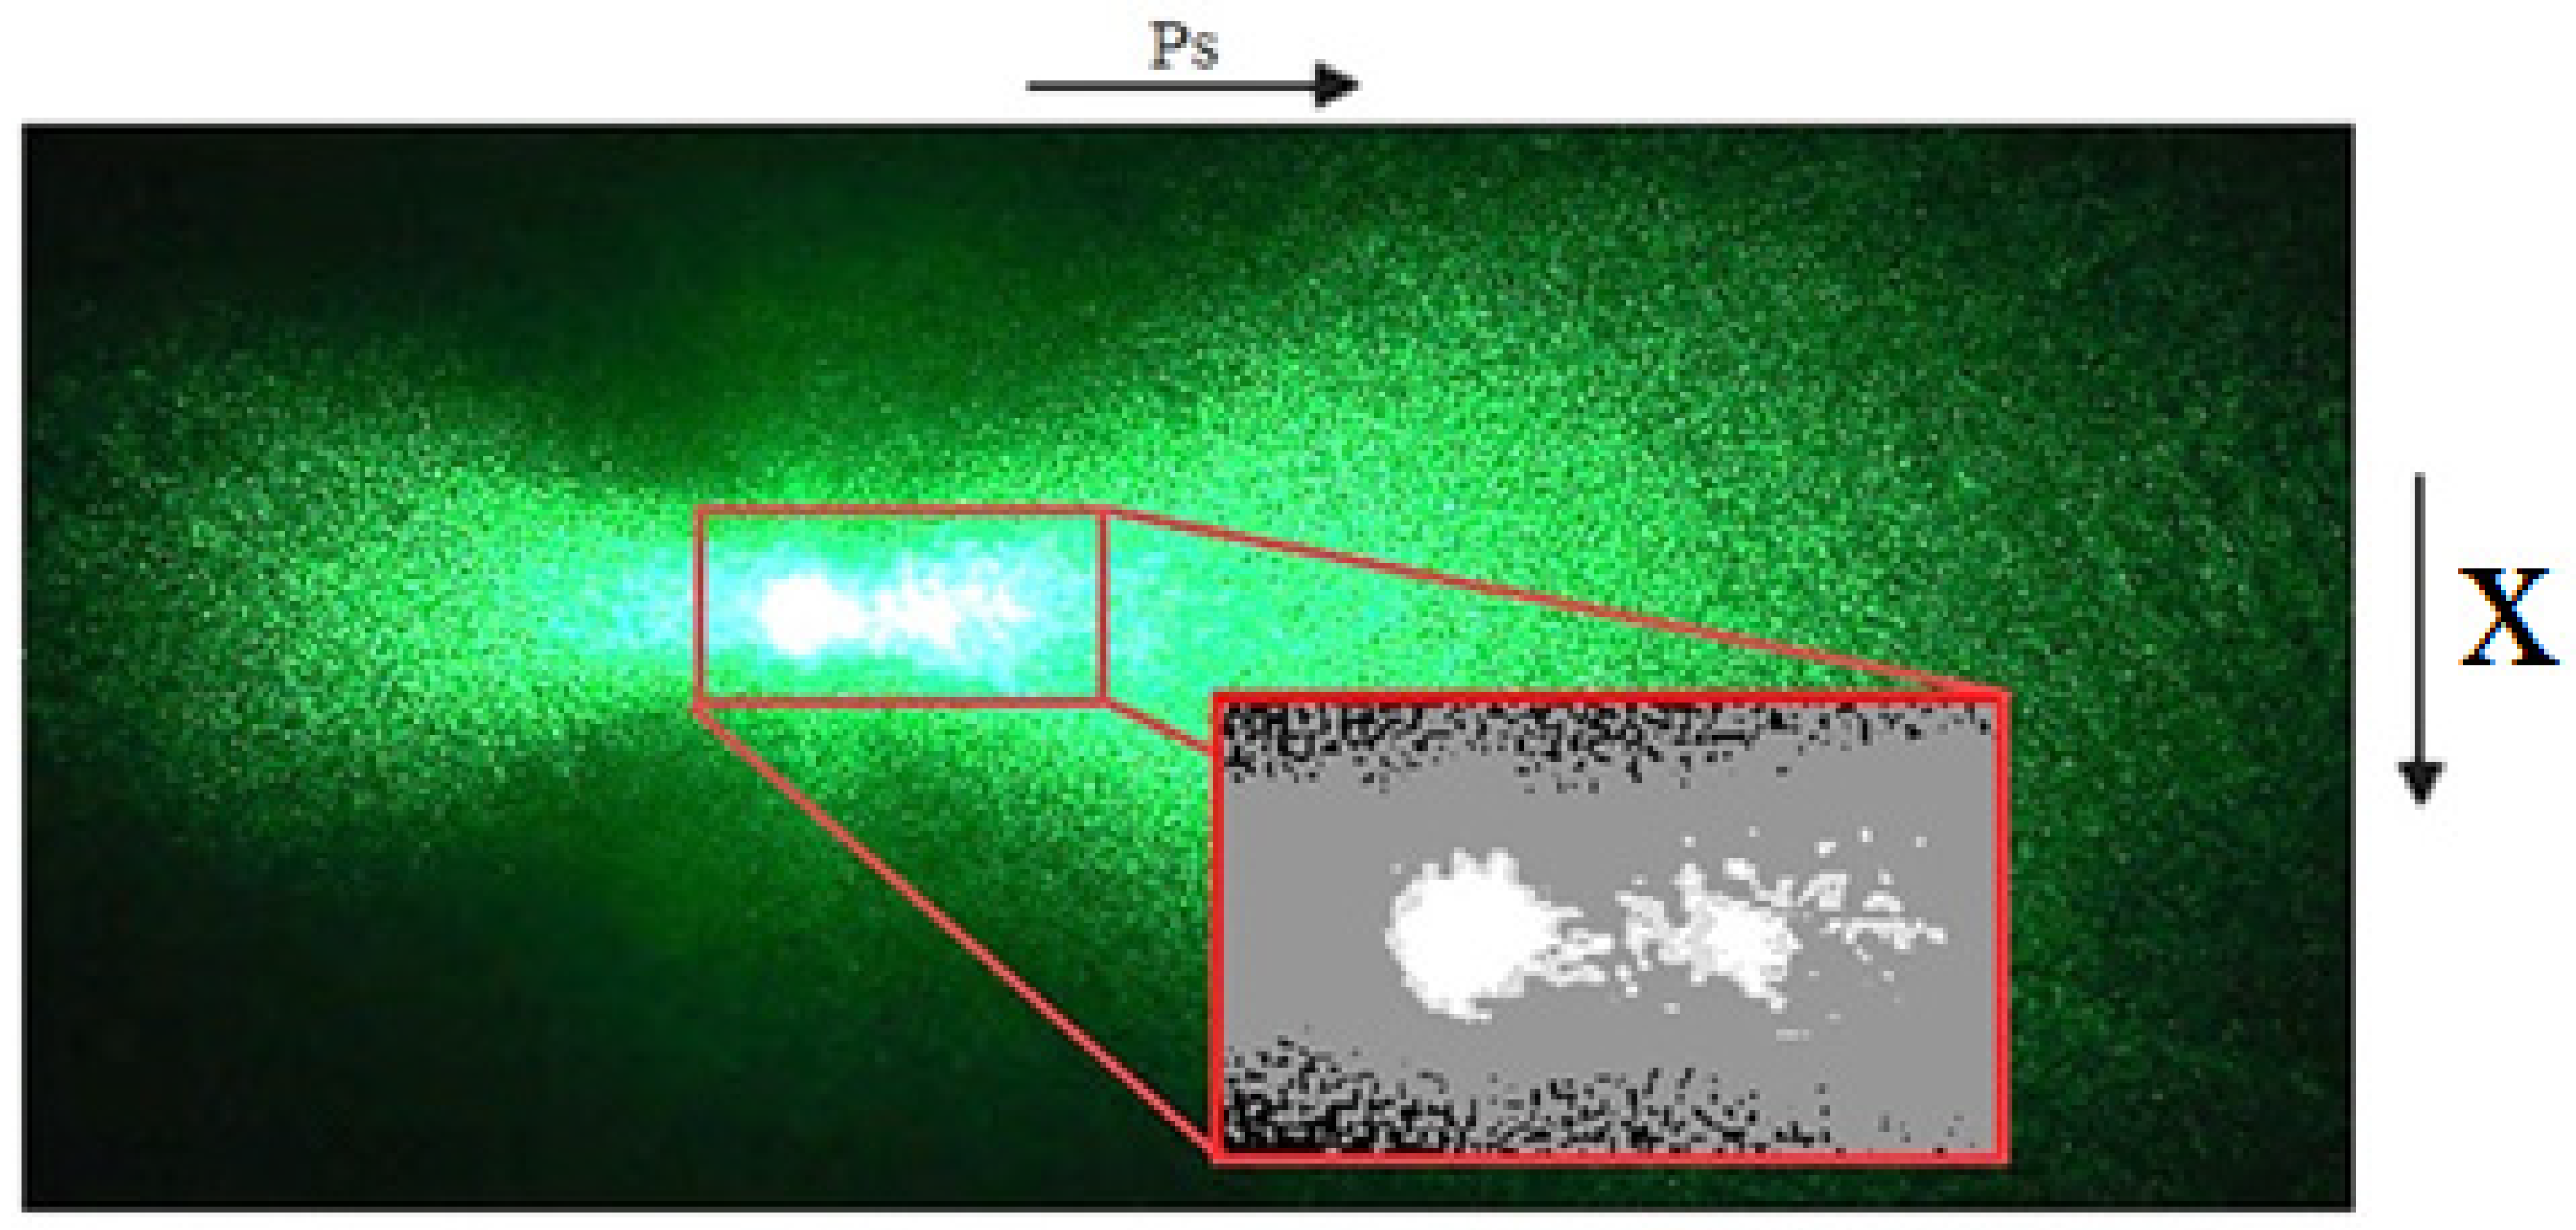
A direct consequence of the photorefraction effect in a photorefractive crystal is the photoinduced scattering of laser radiation by laser-induced microdefects, the refractive index of which differs from the refractive index of the crystal in the absence of the photorefraction effect [42,43]. Figure 2 and Figure 3 show the dynamics of the time change of the speckle structure of the PILS indicatrix and the opening angle of the speckle structure of the PILS indicatrix of the LiNbO3:Y3+(0.46 wt%) crystal, obtained using exciting laser radiation with a wavelength of λ0 = 532 nm and a power of 160 mW. It should be noted that the speckle structure of the PILS indicatrix of the LiNbO3:Y3+(0.46 wt%) crystal is atypicalfrom the speckle structures of other LiNbO3 crystals of different compositions [43]. The dependences of the speckle structure of the PILS indicatrix and the opening angle θ of the speckle structure of the PILS indicatrix on the crystal laser irradiation time are also atypical (Figure 2 and Figure 3). The time behavior of the angle θ and the type of the speckle structure of the PILS indicatrix (Figure 2 and Figure 3) differ significantly from the time behavior of similar parameters of LiNbO3 crystals of other compositions, characterized by different values of the photorefraction effect [42,43]. As an example for comparison, Figure 2b shows the PILS pattern of a highly perfect LiNbO3:B3+(0.83 mol% B2O3 in the batch) crystal obtained under the same experimental conditions and the dynamics of its development over time. The influence of the non-metallic element boron on the structural and optical perfection of lithium niobate crystal is described in detail in a number of papers [44,45,46,47]. From Figure 2, one can see that a three-layer PILS pattern is observed for both crystals, which is characteristic of LiNbO3 crystals of different compositions and production technologies [42,43]. However, for the LiNbO3:Y3+(0.46 wt%) crystal, the speckle structure of the PILS indicatrix has the form of an ellipse, and for the LiNbO3:B3+(0.83 mol% B2O3 in the batch) crystal, it has the form of a well-visible figure eight. In addition, the PILS pattern of the LiNbO3:B3+(0.83 mol% B2O3 in the batch) crystal distictly shows the birefringence of the laser beam (Figure 4), while the PILS pattern of the LiNbO3:Y3+(0.46 wt%) crystal does not pronounce a birefringence (Figure 2). That is, the figure-eight appearance of the PILS pattern is due to the more pronounced and stronger birefringence of the laser beam in the LiNbO3:B3+(0.83 mol% B2O3 in the batch) crystal compared to the LiNbO3:Y3+(0.46 wt%) crystal.
One can see from Figure 2 and Figure 3 that the speckle structure of the PILS indicatrix in the LiNbO3:Y3+(0.46 wt%) crystal appears almost instantly, during the first second of laser irradiation of the crystal. At the same time, under similar experimental conditions (λ0 = 532 nm, power P = 160 mW), the disclosure of the speckle structure of the PILS indicatrix in the LiNbO3:B3+(0.83 mol% B2O3 in the batch) crystal occurs within about 60 s after the start of laser irradiation of the sample (Figure 3).
It is also noteworthy that for the LiNbO3:Y3+(0.46 wt%) crystal, the central layer (laser spot) is absent in the speckle structure of the PILS indicatrix for more than 60 s of irradiation, Figure 2a, which is characteristic of the LiNbO3:B3+(0.83 mol% B2O3 in the batch) crystal and of LiNbO3 crystals of other compositions studied in the literature [43]. This finding indicates quite a strong dissipation of the laser radiation energy by laser-induced defects of the LiNbO3:Y3+(0.46 wt%) crystal and can be associated with the redistribution of energy between the ordinary and extraordinary rays. During the first 60 s of irradiation, the laser beam, experiencing birefringence when propagating perpendicular to the polar z axis, is divided into two closely spaced beams of different polarization (ordinary and extraordinary), which do not create their own laser track, since a significant part of the beam energy scattered by laser-induced defects dissipates into the volume of the crystal. The central layer (considerably weak) in the PILS pattern of the LiNbO3:Y3+(0.46 wt%) crystal appears only after about 60 s of irradiation of the crystal with the laser beam (Figure 2), after the second and third layers of the speckle structure of the PILS indicatrix have already formed. In this case, the central layer of the speckle structure of the LiNbO3:Y3+(0.46 wt%) crystal is presented in the form of separate dots (Figure 2), while for the LiNbO3:B3+(0.83 mol% B2O3 in the batch) crystal and photorefractive LiNbO3 crystals of other compositions, the central layer exists in the form of a single bright spot [43]. It can be assumed that this phenomenon is a consequence of the peculiarities of the interaction of laser radiation with laser-induced defects in the structure of the photorefractive LiNbO3:Y3+(0.46 wt%) crystal. After 360 s, the laser beam in the LiNbO3:Y3+(0.46 wt%) crystal can already be observed as a single bright spot. This behavior of the laser beam in the crystal indicates that the LiNbO3:Y3+(0.46 wt%) crystal, after more than 360 s of laser irradiation, is no longer able to dissipate the entire laser radiation energy flux into the crystal volume. The unusual features of the photorefractive properties of the LiNbO3:Y3+(0.46 wt%) crystal are reflected in its Raman spectrum.

5. First- and Second-Order Raman Spectra of LiNbO3:Y3+(0.46 wt%) Crystal

The photorefraction effect, laser-induced defects, and PILS can have a noticeable effect on the Raman spectrum of a crystal in polarized radiation. Raman spectroscopy can be an effective method for studying the photorefractive effect and photoinduced processes in crystals. In addition, it should be taken into account that under the action of the electric field of laser radiation in ferroelectric crystals, a change in the effective charge of longitudinal (LO) optical phonons can occur, which should manifest itself in a change in the intensities of light scattering on longitudinal phonons [48]. The effective cross-section of scattering on transverse (TO) phonons indeed does not depend on the value of the effective transverse charge, and therefore it should not change with a change in the concentration of multiply charged dopants responsible for the photorefraction effect.
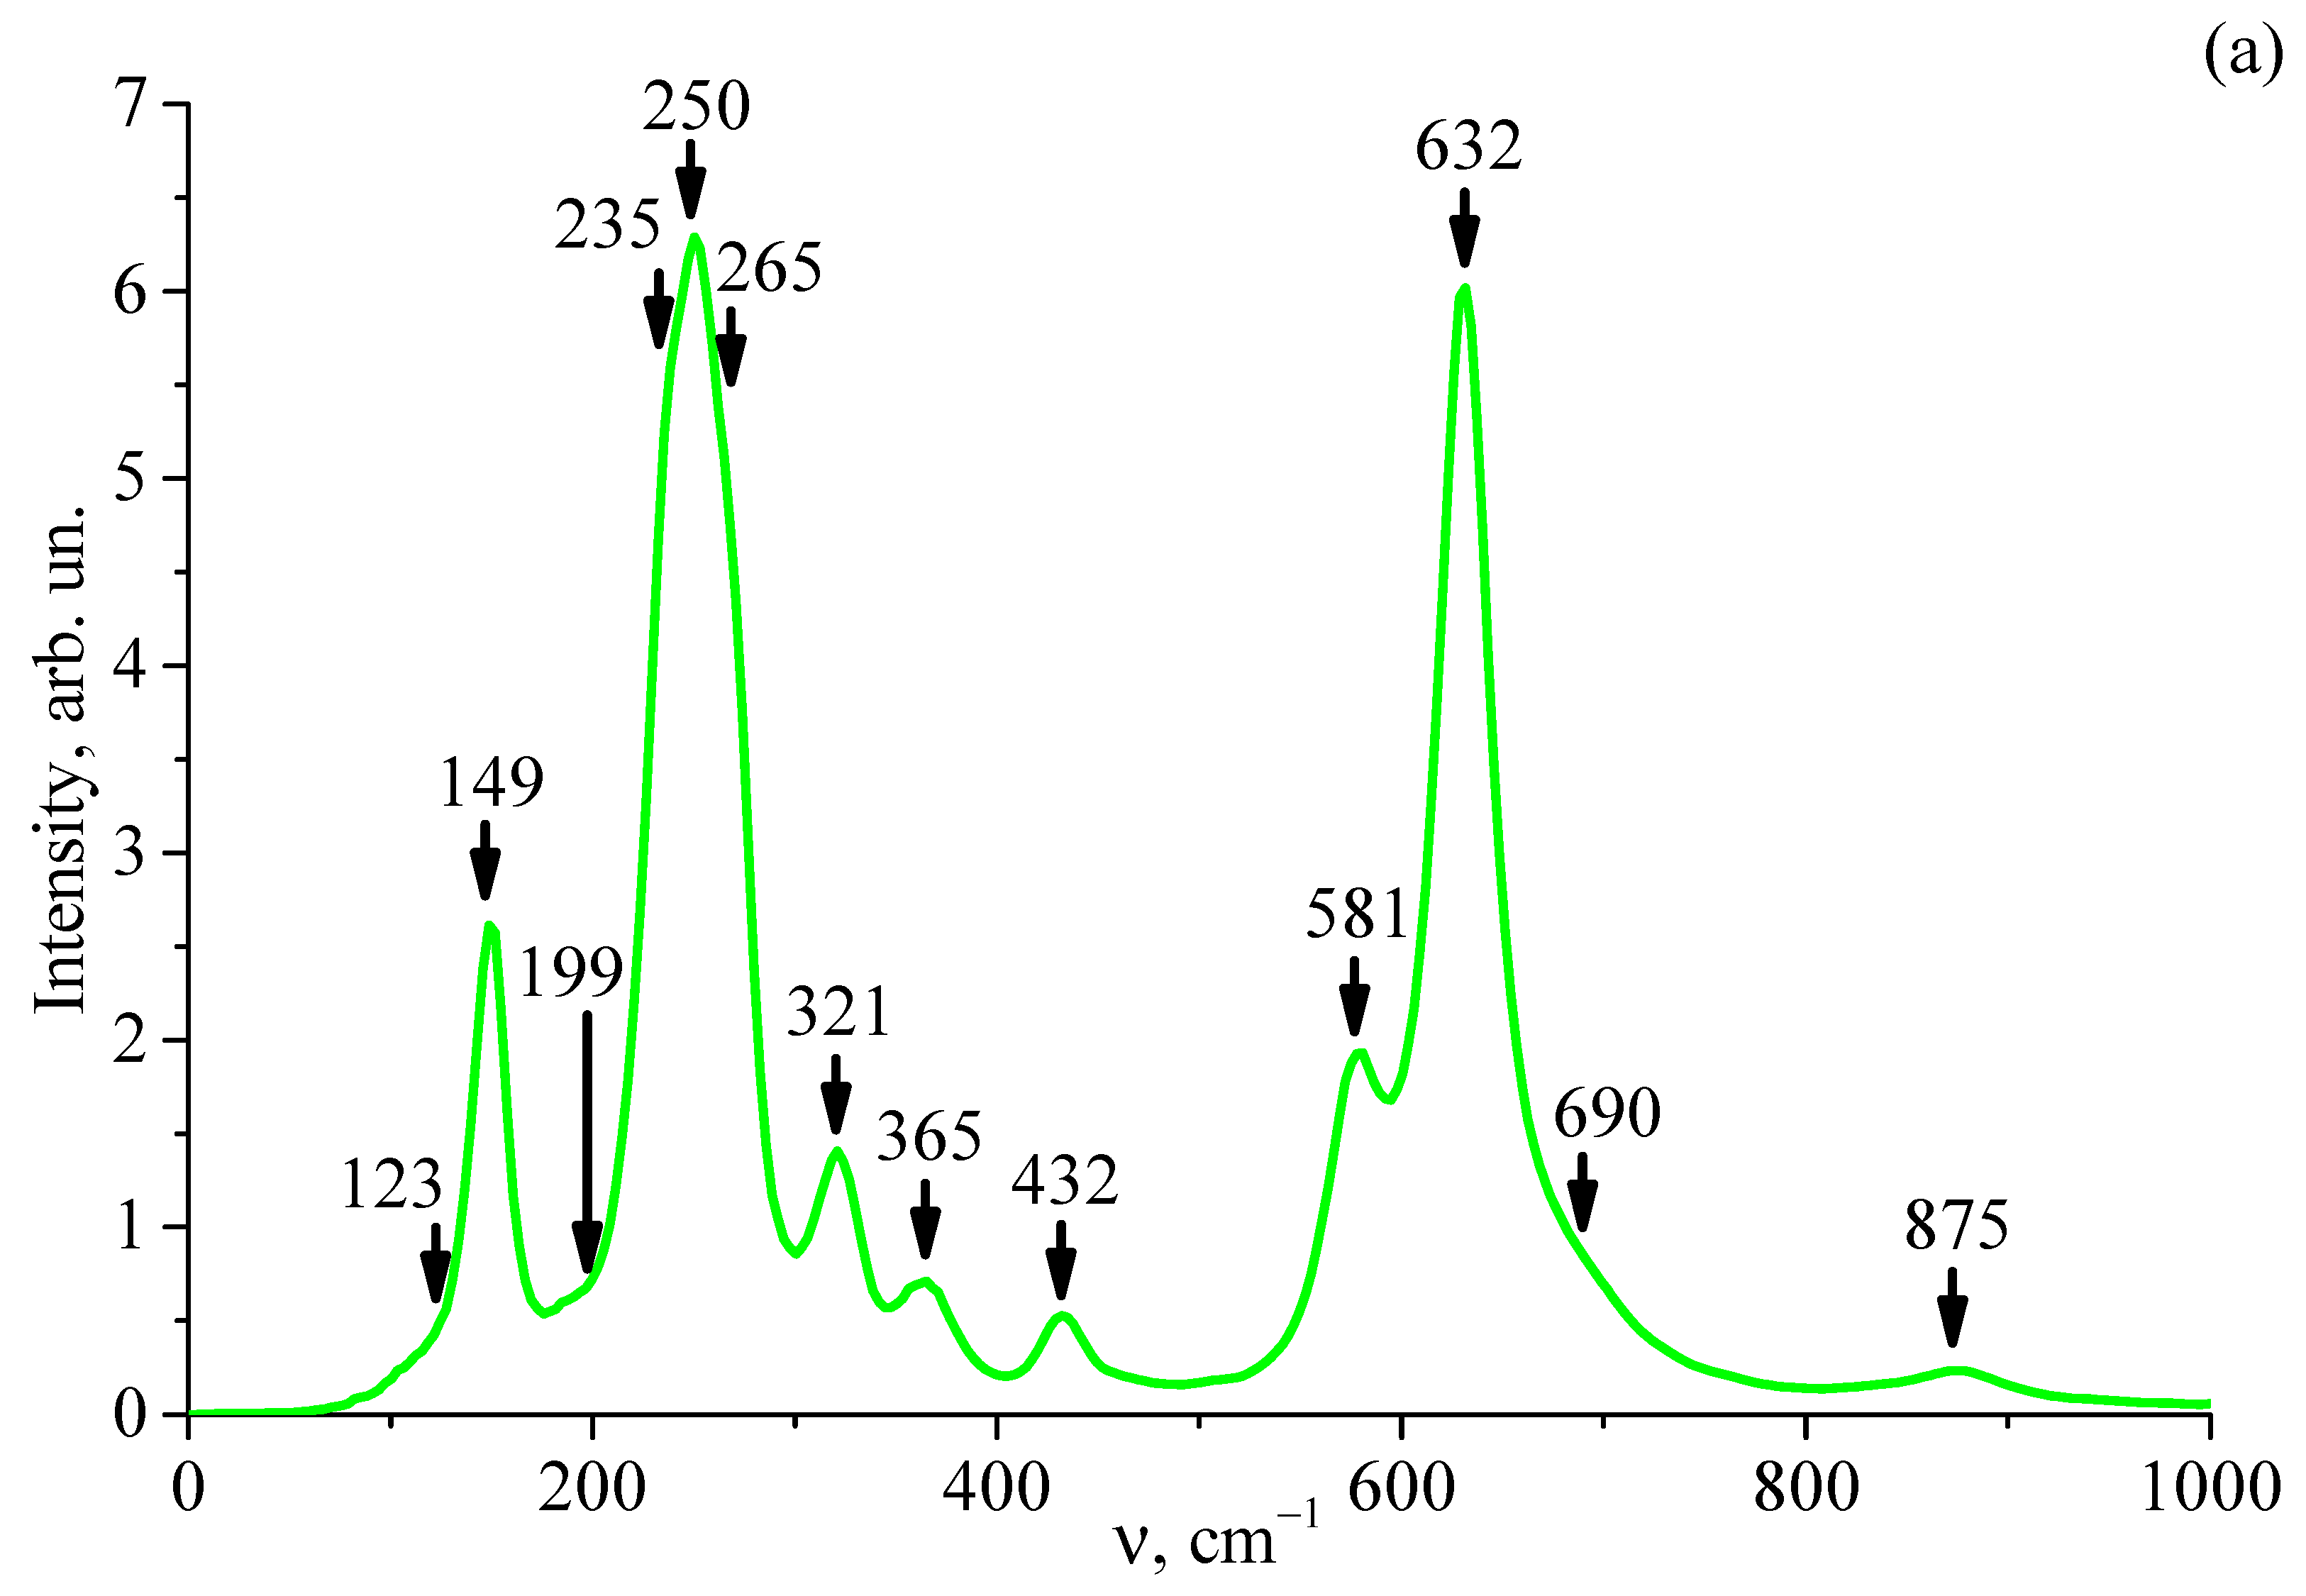
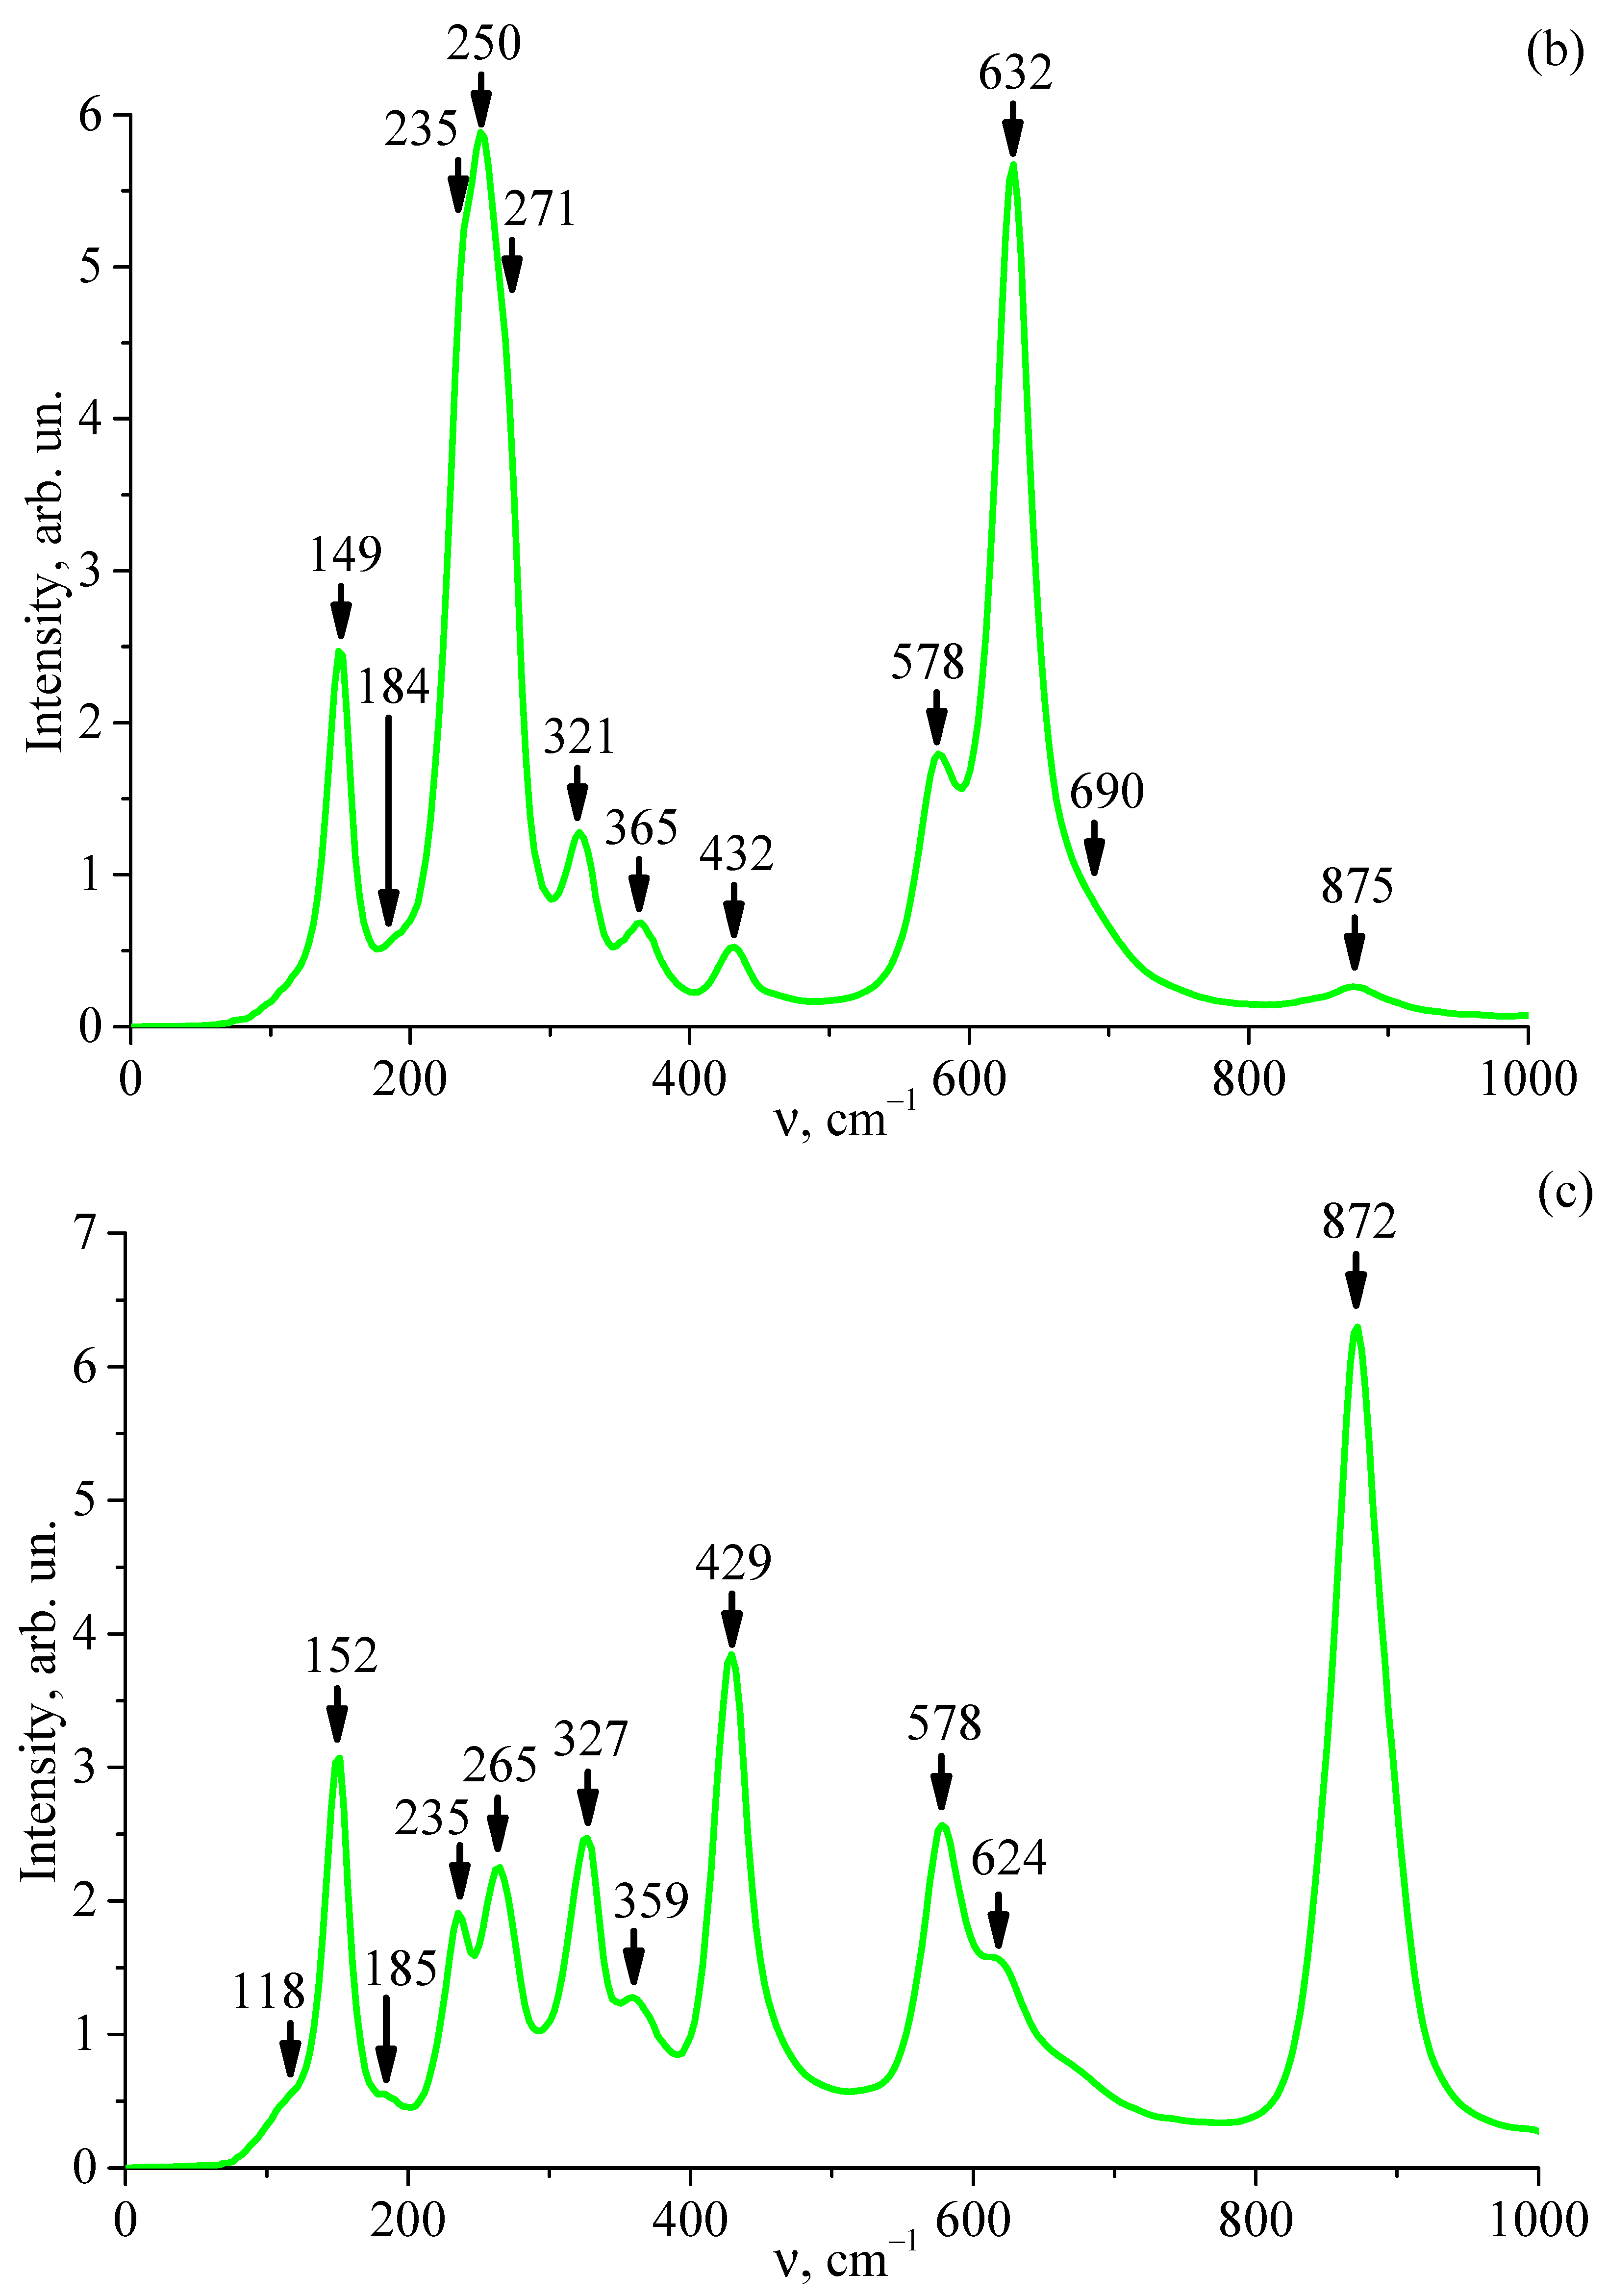
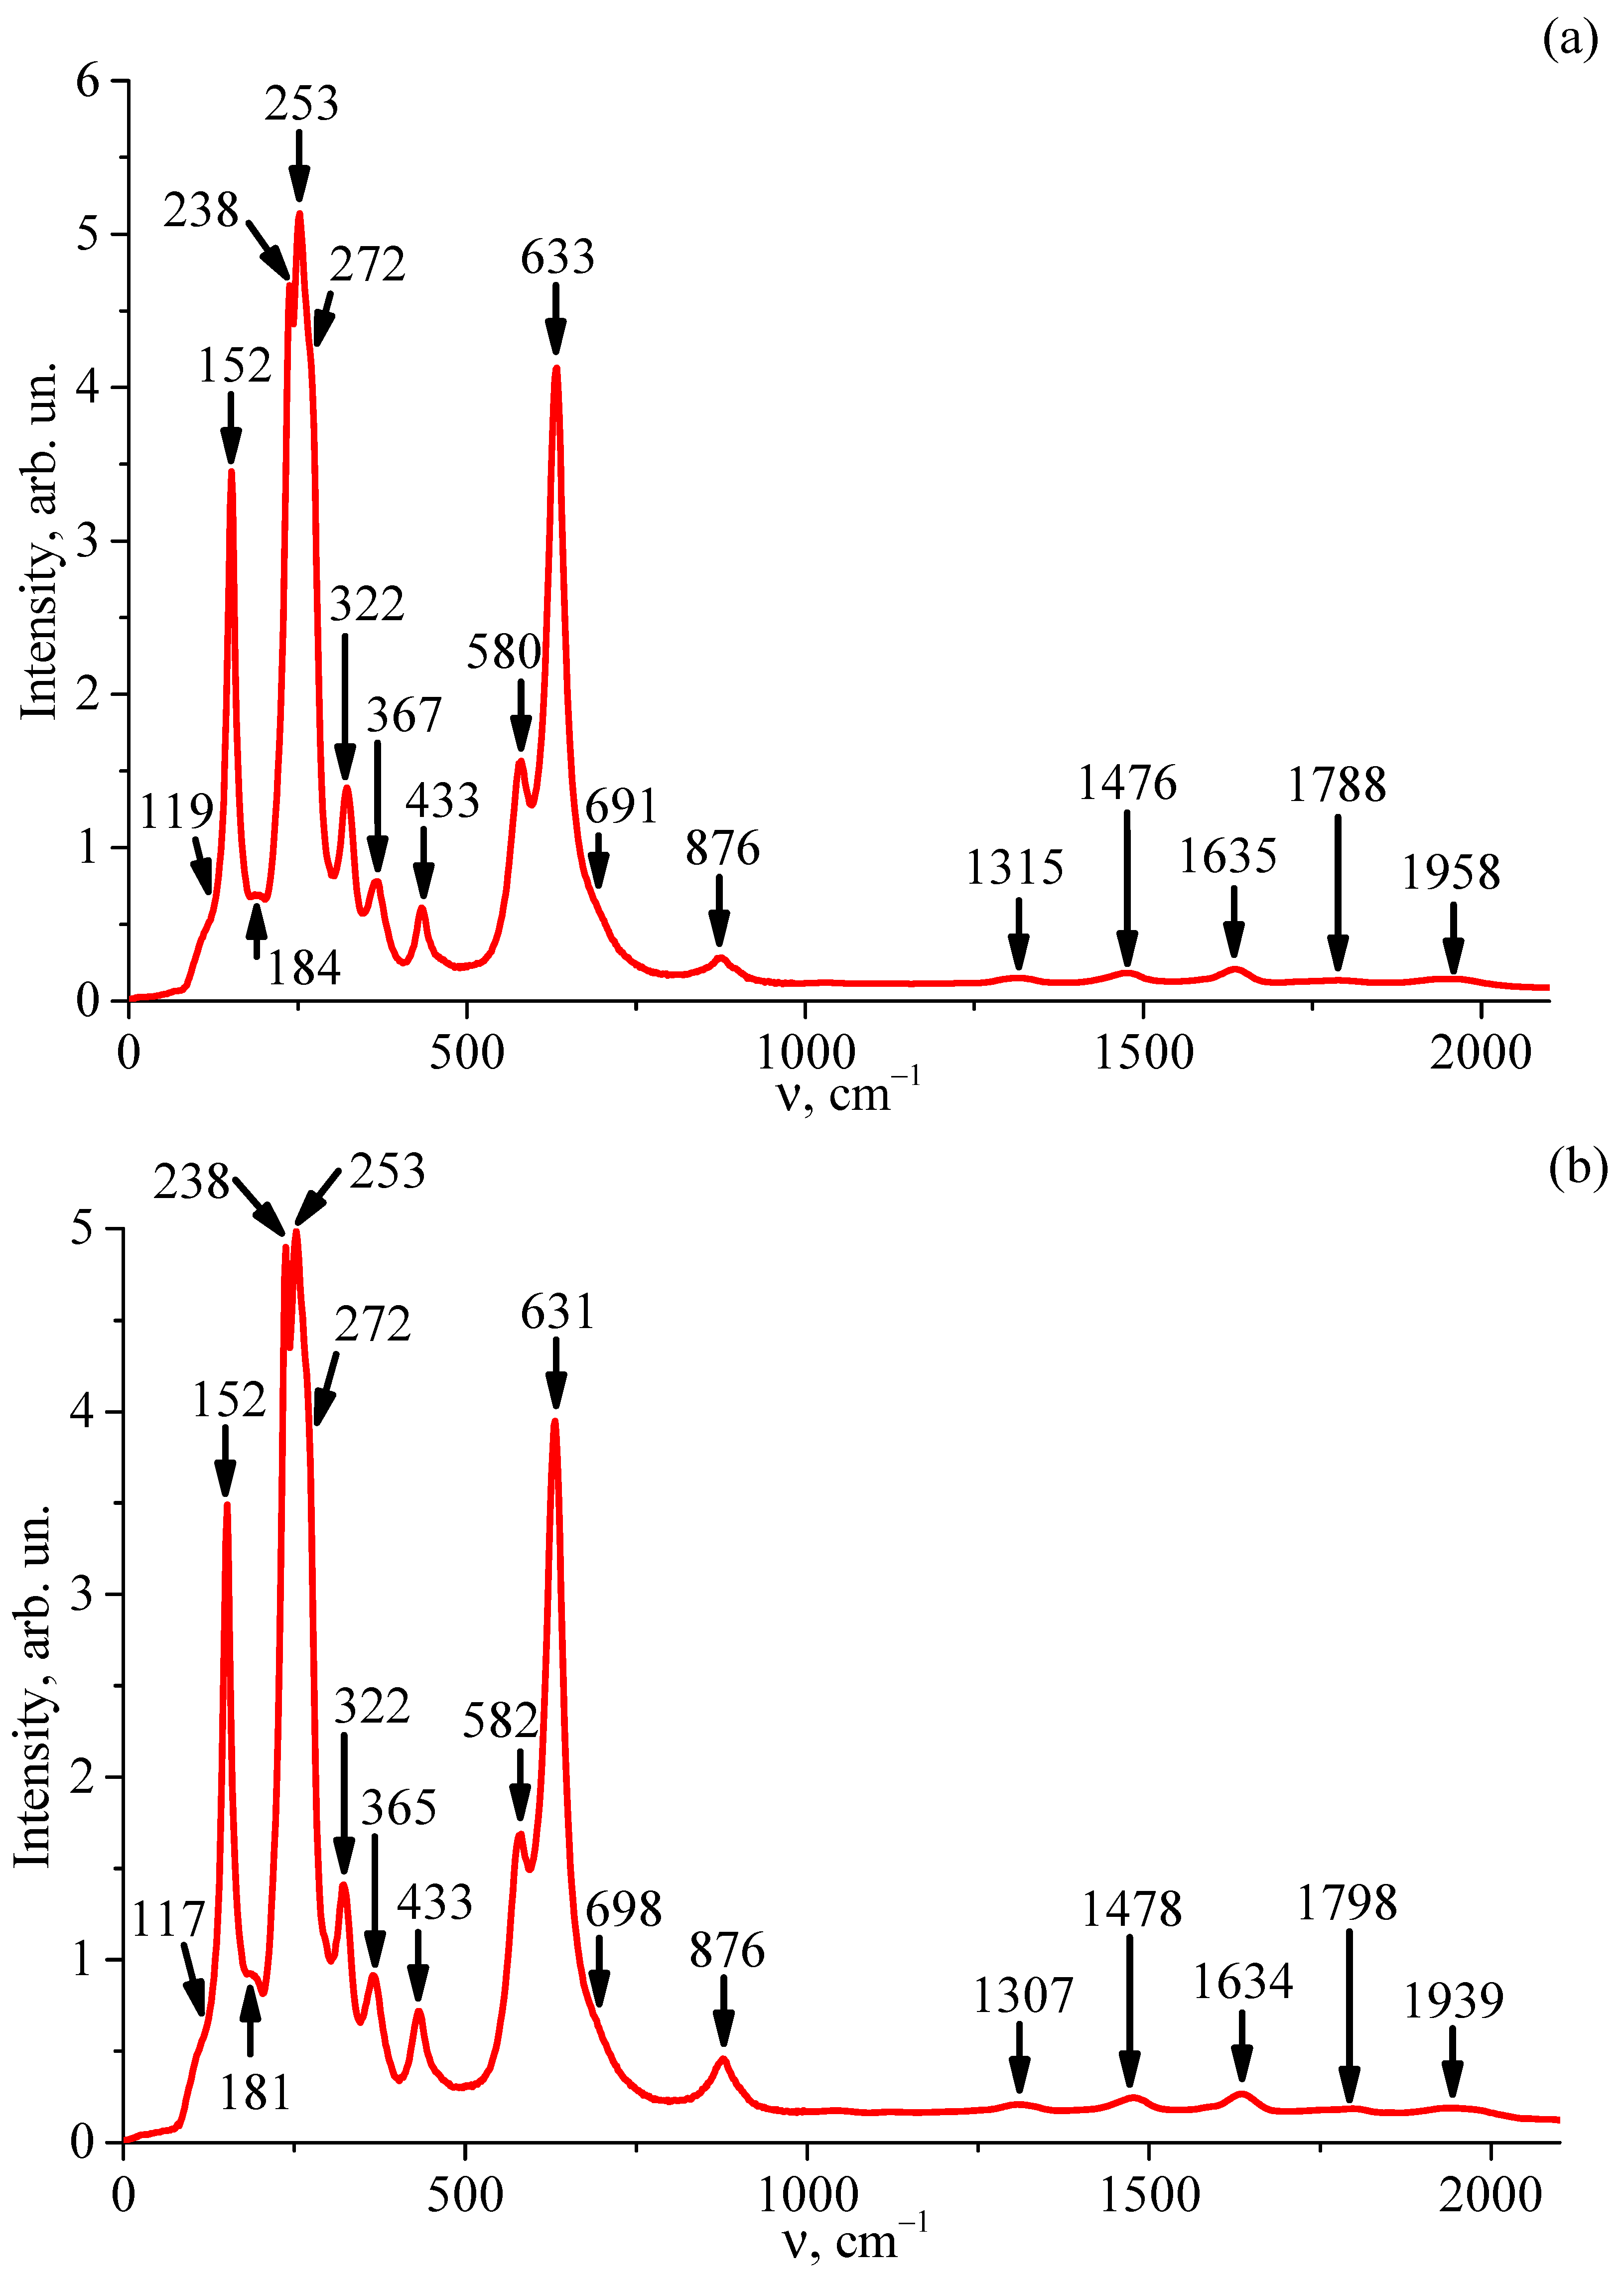
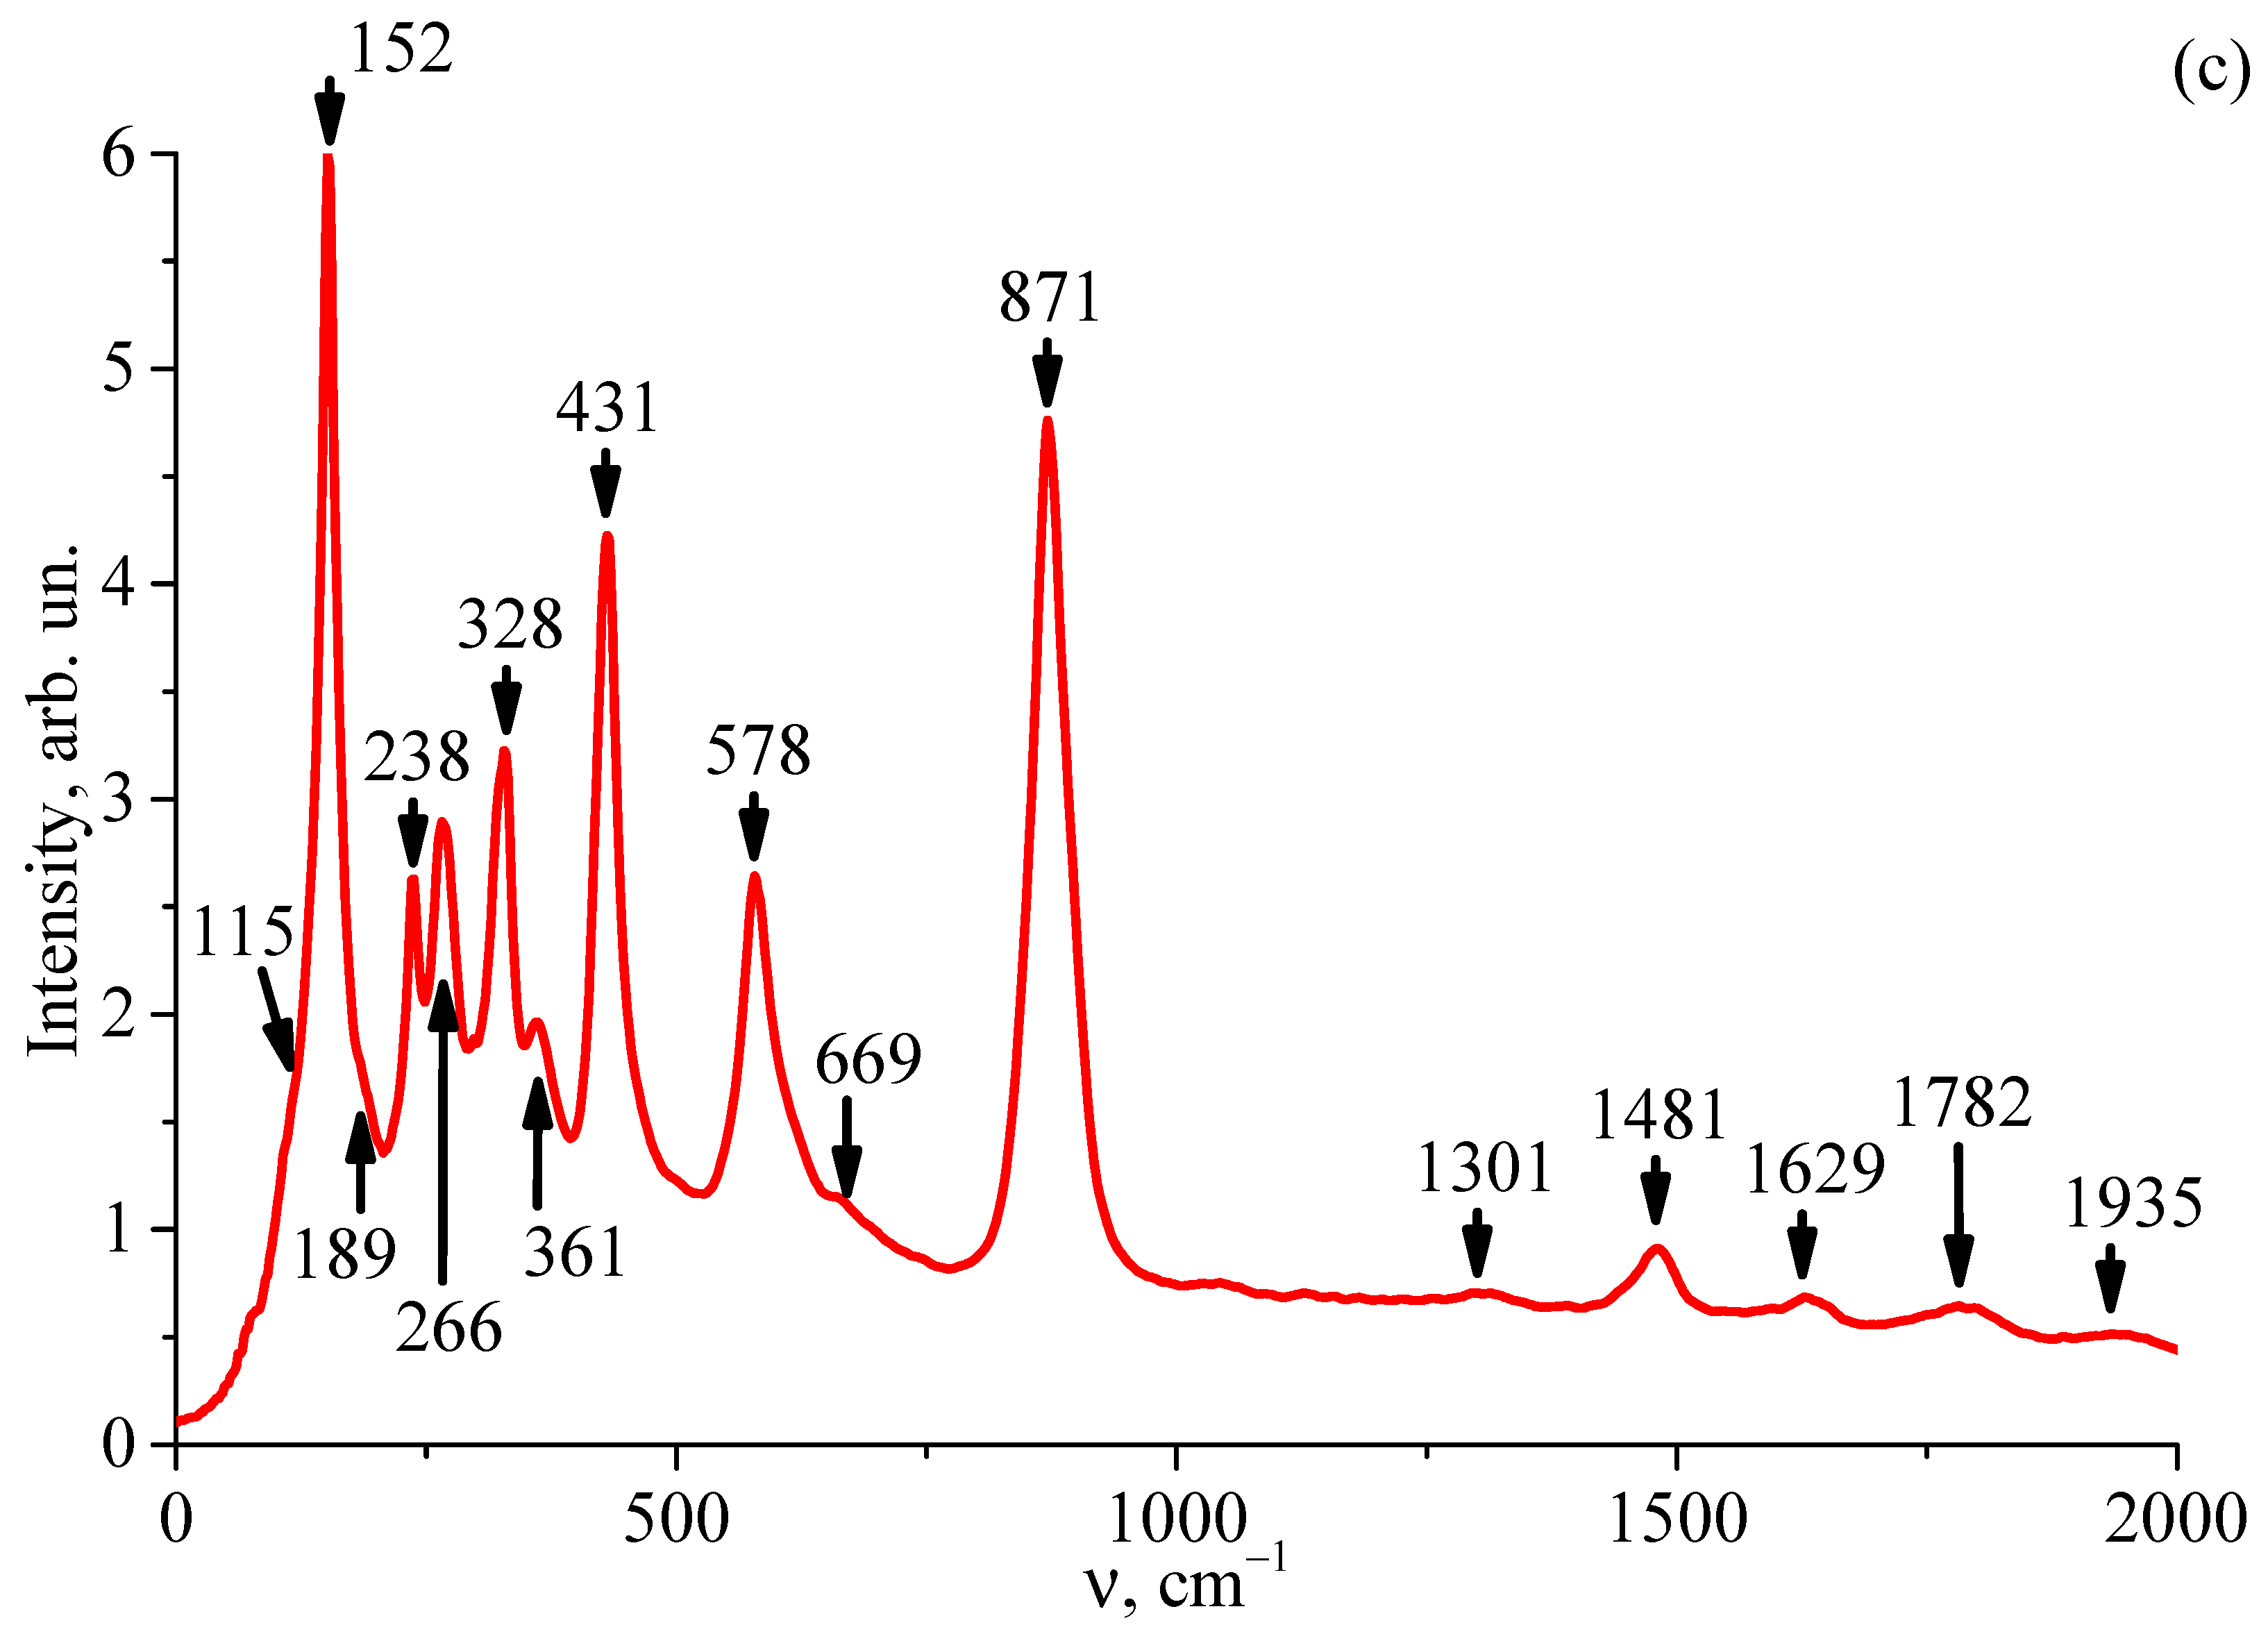
Figure 5 shows the Raman spectra of the LiNbO3:Y3+(0.46 wt%) crystal excited by laser radiation with λ0 = 532 nm, causing the photorefraction effect. Figure 6 illustrates the Raman spectra of the LiNbO3:Y3+(0.46 wt%) crystal excited by laser radiation with λ0 = 785 nm, which does not cause the photorefraction effect. The experimentally observed frequencies of the Raman lines of the LiNbO3:Y3+(0.46 wt%) crystal upon excitation of the Raman spectra by the 532 nm and 785 nm laser lines and their assignment to the fundamental vibrations of the crystal lattice are given in Table 2. In the absence of the photorefraction effect in the Raman spectrum of the LiNbO3 crystal in the scattering geometries x zz , zy x ¯ and y zz , zx y ¯ , according to the selection rules, TO and LO polar fundamental vibrations of the A1(z) and E(x,y) symmetry types appear. When using the scattering geometry z xx , yy , xy z ¯ , only LO polar vibrations of the A1(z) symmetry type appear in the Raman spectrum.
As an analytical line in the study of the photorefraction effect in LiNbO3 crystals of different compositions, it is convenient to use the 4A1(z)TO line with a frequency of about 630 cm−1, corresponding to the fully symmetric vibrations of the oxygen atoms of the O6 oxygen octahedra of the crystal structure [27]. This line is allowed by the selection rules in the scattering geometries x zz , zy x ¯ and y zz , zx y ¯ and is forbidden by the selection rules in the z xx , yy , xy z ¯ scattering geometry. From a comparison of Figure 5c and Figure 6c it is evident that when the Raman spectrum of the LiNbO3:Y3+(0.46 wt%) crystal is excited by laser radiation with a wavelength of 785 nm, which does not cause the photorefraction effect, the 4A1(z)TO line with a frequency of about 630 cm−1 is absent from the spectrum in the z xx , yy , xy z ¯ scattering geometry. At the same time, this line reliably appears in the Raman spectrum in scattering geometries z xx , yy , xy z ¯ upon excitation of the spectrum by a laser line with a wavelength of 532 nm, causing the photorefraction effect. From a comparison of Figure 5 and Figure 6, one can see that the frequencies of the lines in the Raman spectra of the LiNbO3:Y3+(0.46 wt%) crystal, recorded in the same polarization scattering geometries, differ upon excitation by the lines of 532 nm (the photorefraction effect is present) and 785 nm (the photorefraction effect is absent). In addition, in addition to the lines corresponding to fundamental vibrations of the lattice (the first-order Raman spectrum), a number of low-intensity lines related to the second-order spectrum are observed in the Raman spectrum of the LiNbO3:Y3+(0.46 wt%) crystal in the frequency range of 100–900 cm−1. Thus, the lowest frequency of the registered Raman lines (115 cm−1) observed by us is additional: it does not correspond to either the fundamental optical vibrations of the A1(z) and E(x,y) symmetry types or the pseudoscalar optical vibrations of the A2 symmetry type prohibited by the selection rules. The Raman line with a frequency of about 690 cm−1 was previously observed in congruent (R = [Li]/[Nb] = 0.946) and close to stoichiometric (R ≈ 1) LiNbO3 crystals [31,32,51,52,53]. However, no unambiguous assignment of this spectral component by the symmetry type and the nature of the atomic motion was revealed. Earlier, a line with a frequency of 199 cm−1 has been observed in the IR absorption spectrum of a congruent lithium niobate crystal [51]. This spectrum component is close to the calculated value for the E(x,y)LO mode [54,55]. In LiNbO3:Er and LiNbO3:Er:Ti crystals, a Raman line with a frequency of 182 cm−1, were recorded, which was attributed to the 2E(x,y) mode [56]. The Raman line with a frequency of 669 cm−1 was attributed to the second-order Raman spectrum [57].
In the frequency range of 1000–2100 cm−1, five second-order Raman lines are observed, the intensity of which is significantly lower than the intensity of the Raman lines corresponding to the fundamental vibrations of the lattice. In this case, two lines are visible with frequencies of about 1790 cm−1 and 1940 cm−1, somewhat exceeding the doubled value of the frequencies of the fundamental vibrations 4A1(z)LO and 9E(x,y)LO. That is, the lines with frequencies of about 1790 and 1940 cm−1 can be overtones of the fundamental vibrations 4A1(z)LO and 9E(x,y) of the oxygen atoms of the oxygen octahedra O6. Previously, we have observed similar second-order Raman spectra in a number of LiNbO3 and LiTaO3 crystals of different compositions in the frequency range of 1000–2100 cm−1 [34,35,36,37,38].

6. Raman and IR Absorption Spectra of LiNbO3:Y3+(0.46 wt%) Crystal in the Region of Stretching Vibrations of OH-Groups

A basic type of defect that is formed in the LiNbO3 crystal during growth by the Czochralski method in an air atmosphere is defects in the form of OH-groups [58,59,60,61,62,63,64]. In the ideal structure of the LiNbO3 crystal of strictly stoichiometric composition (R = 1), there are no NbLi point defects, and the placement of hydrogen atoms is impossible [61]. The arrangement of hydrogen atoms in the structure of real LiNbO3 crystals changes depending on the value of the R ratio, concentration, and type of dopant [58,59,60,61,62,63,64]. In this case, the configuration of the oxygen-octahedral clusters of the LiO6, NbO6, and MeO6 structure is disrupted (Me is an impurity metal or a V, vacancy). The presence of hydrogen in the structure of the LiNbO3 crystal also leads to the formation of complex defects: VLi-OH, NbLi-OH, Me-OH, Me-OH-Me, etc. The presence of such defects results in a change in the nonlinear optical and ferroelectric characteristics of the crystal and affects such practically significant properties of LiNbO3 as photoluminescence, photorefractive thermal fixation, dark conductivity, and photorefractive sensitivity [58]. It is natural to expect the manifestation of a defect in the form of OH-groups in the vibrational spectra.
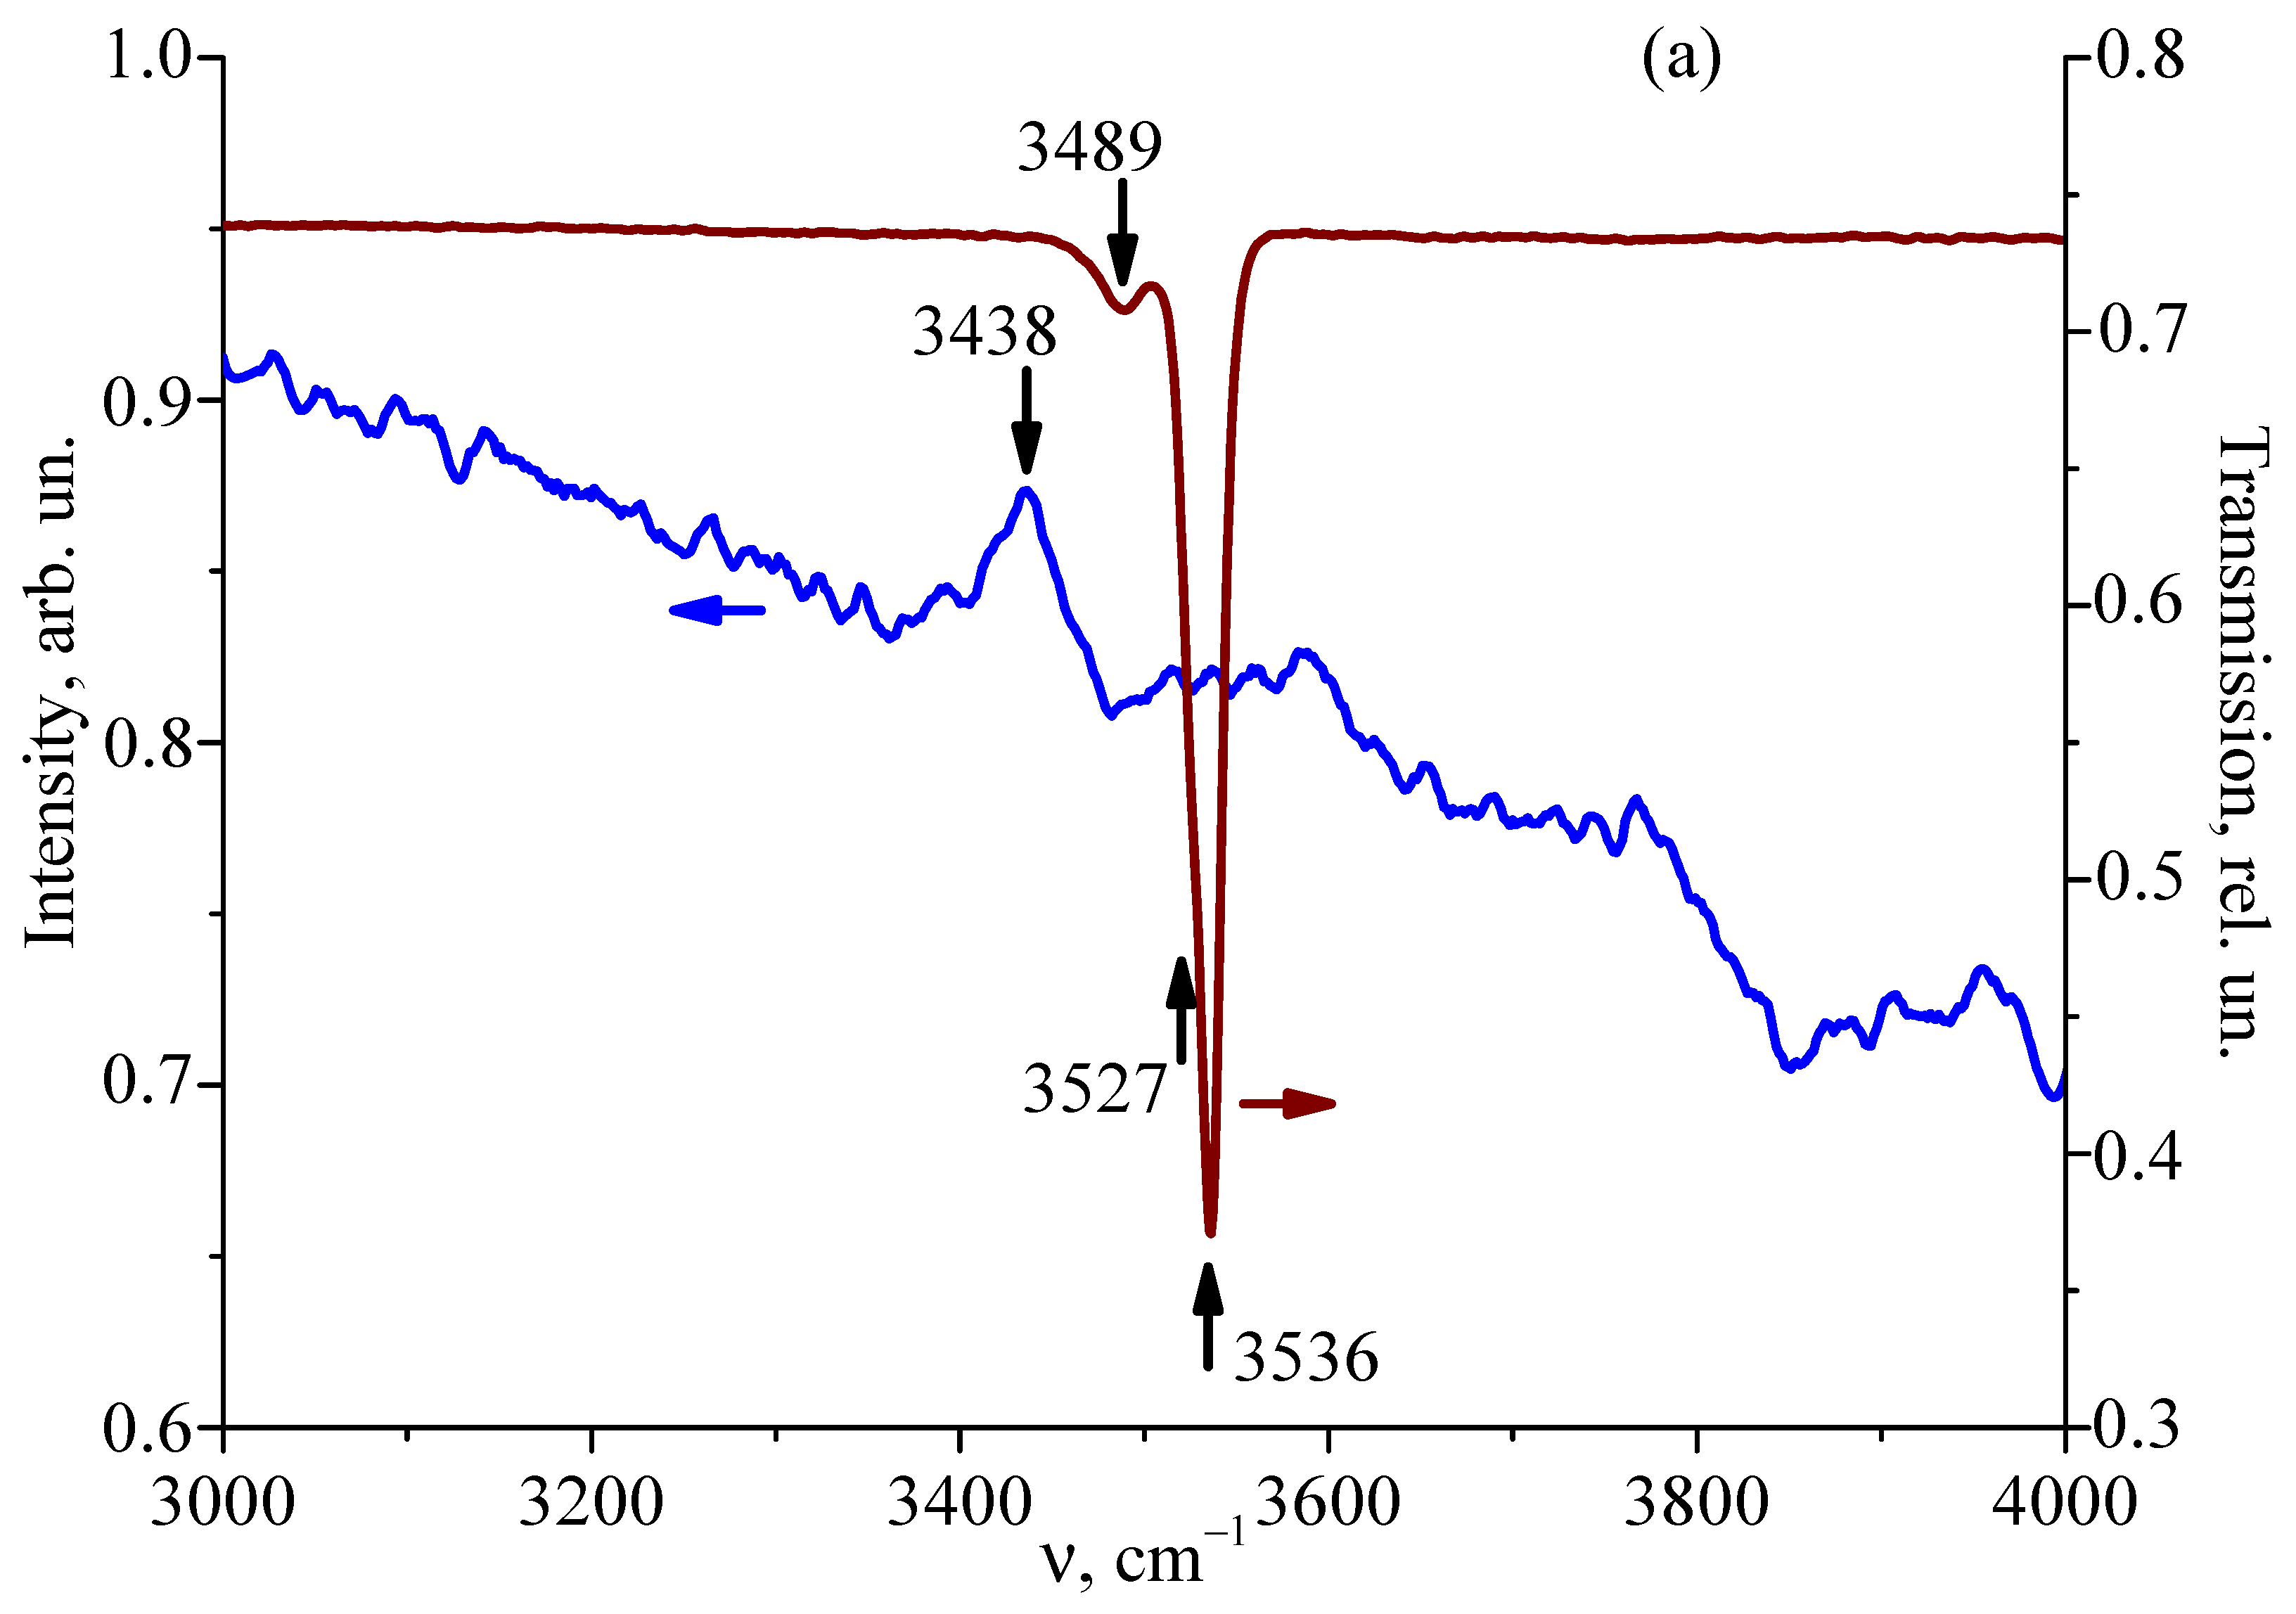
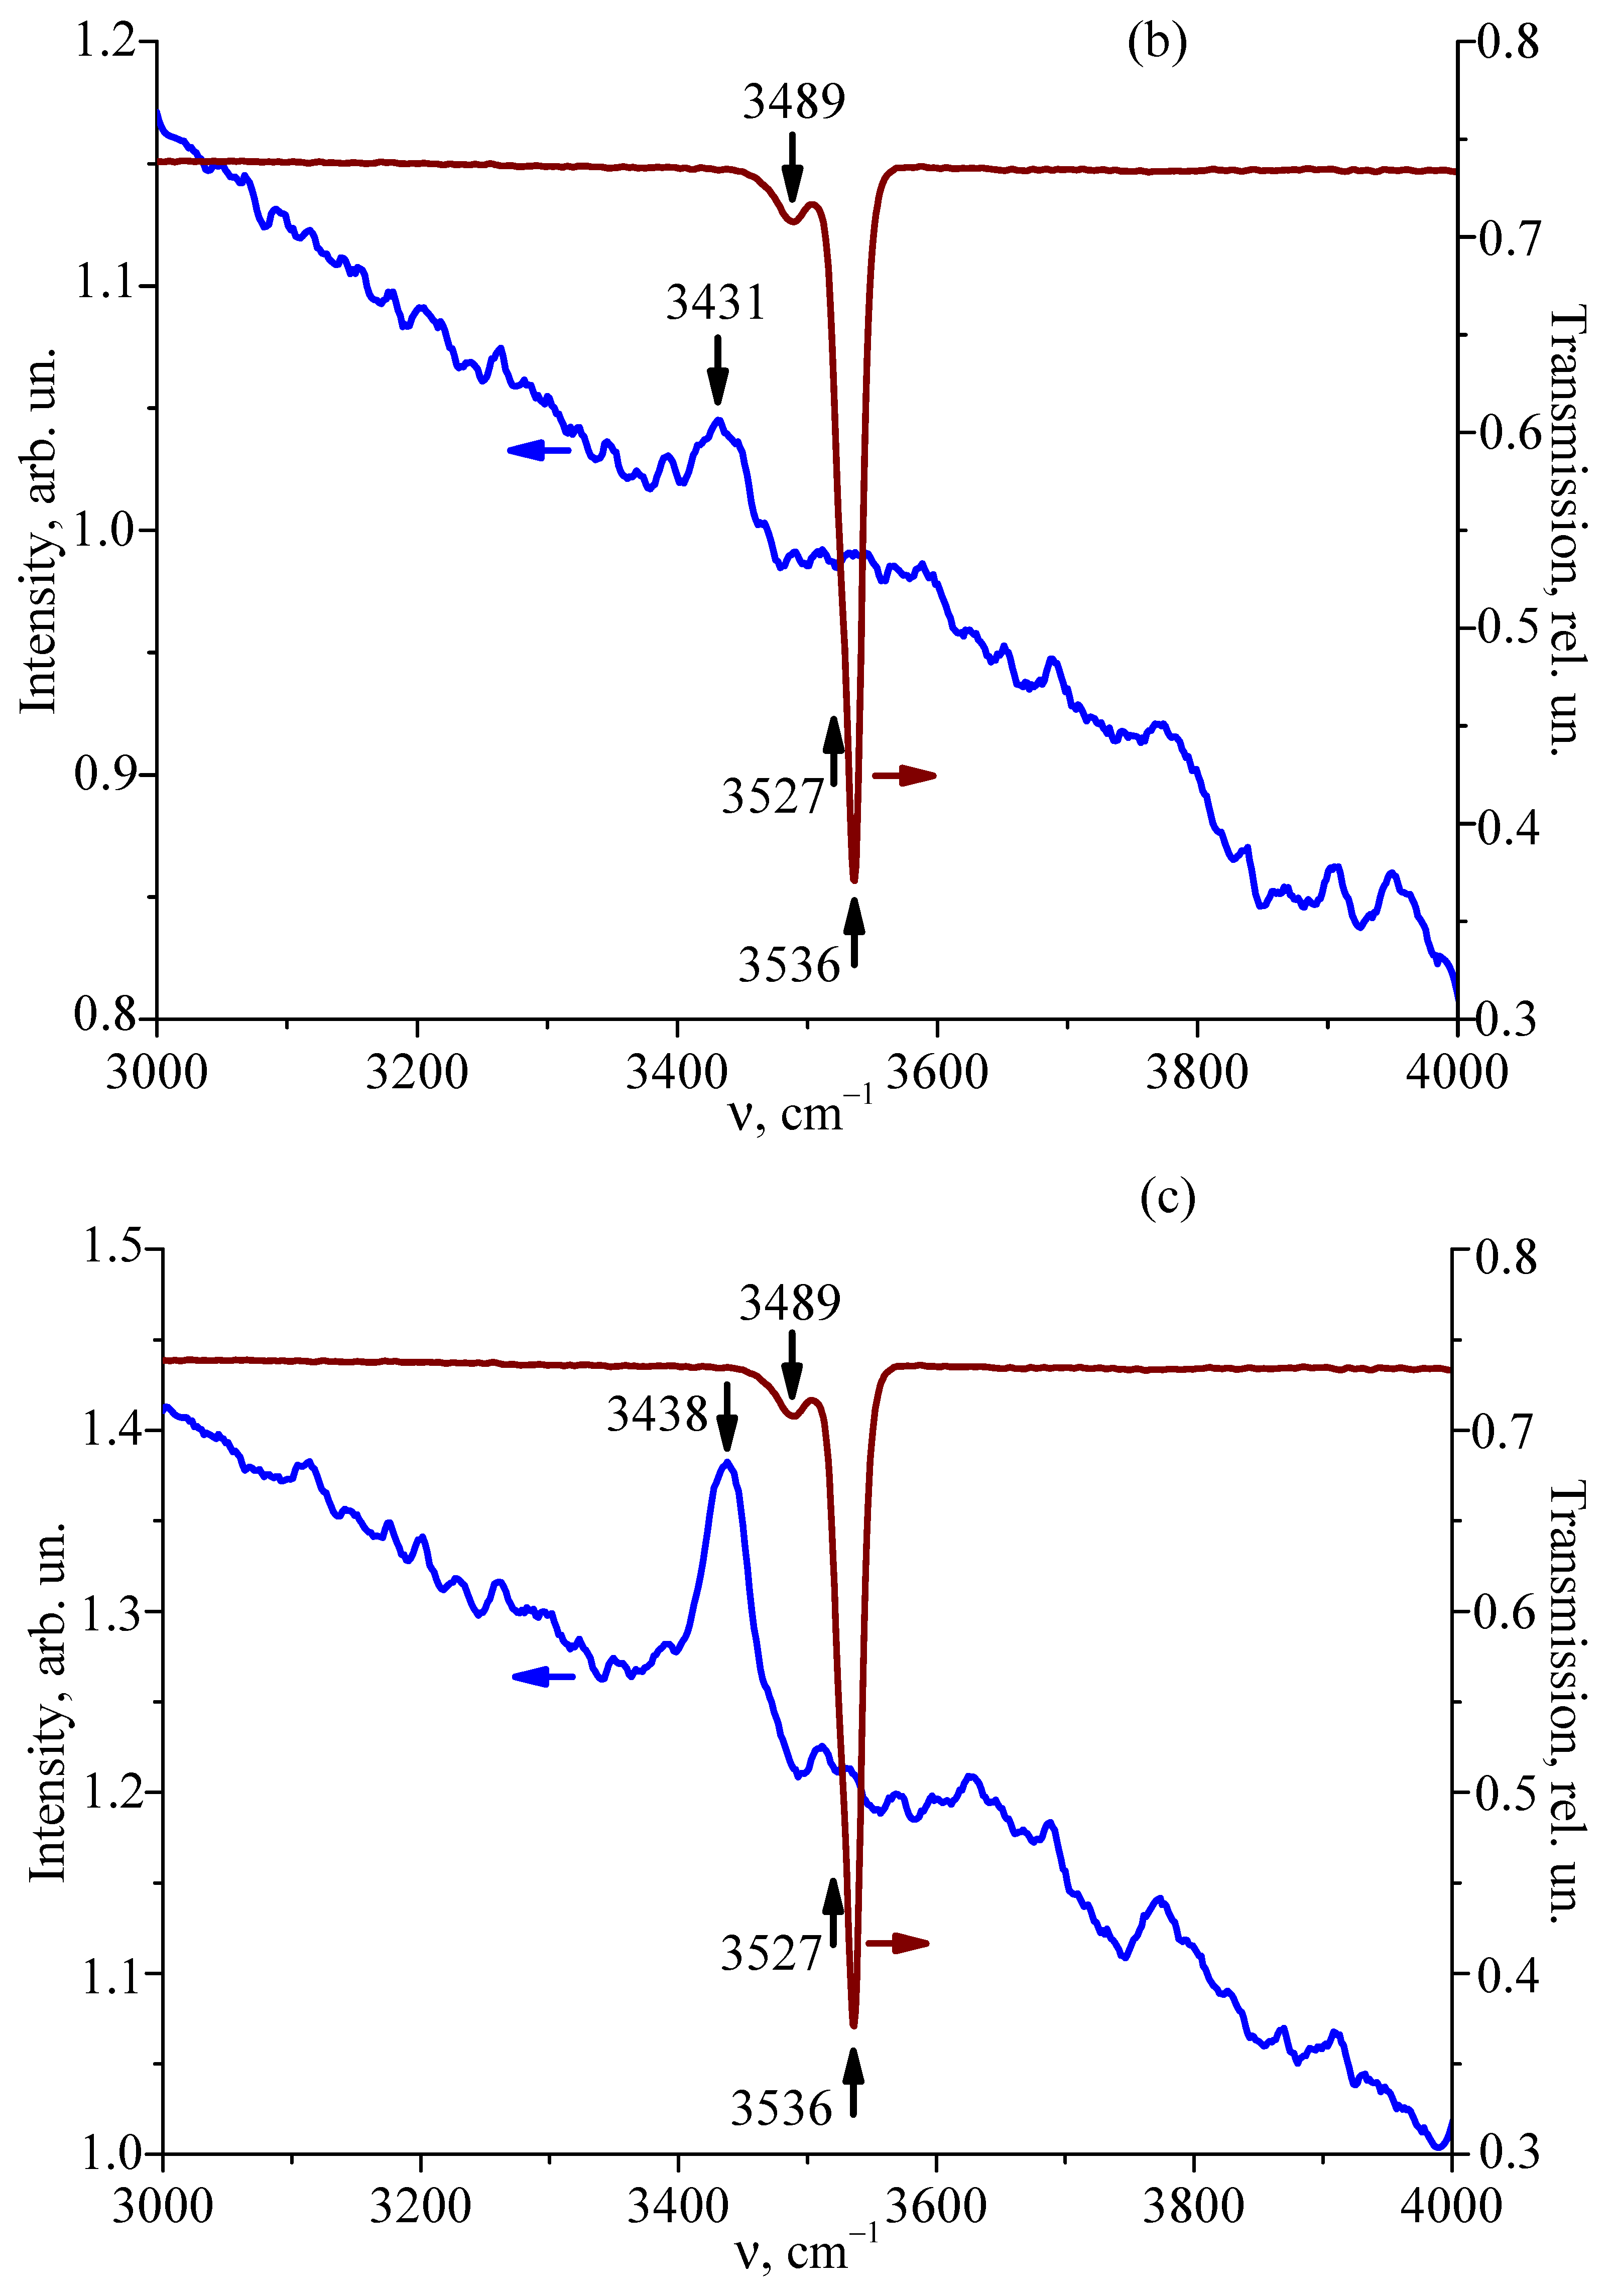
Figure 7 shows a comparison of the recorded IR absorption and Raman spectra in the region of stretching vibrations of OH-groups.
The Raman lines with frequencies of 3431 cm−1 and 3438 cm−1 in the Raman spectrum and the lines with frequencies of 3489 cm−1, 3527 cm−1, and 3536 cm−1 in the IR absorption spectrum are related to the stretching vibrations of OH-groups. When entering the crystal lattice, the yttrium cation forms complex defects Y Nb 3 + - OH and Y Li 3 + - OH - Y Nb 3 + , which correspond to the IR absorption lines of 3527 cm−1 and 3536 cm−1. It should be noted that in the region of stretching vibrations of OH-groups, the frequencies in the Raman spectrum and in the IR absorption spectrum of the LiNbO3:Y3+(0.46 wt%) crystal differ significantly, and the Raman spectrum as a whole is shifted to the low-frequency region relative to the IR absorption spectrum by more than 50 cm−1. In addition, for the LiNbO3:Y3+(0.46 wt%) crystal, the Raman line frequency (3431–3438 cm−1) is shifted by about 40 cm−1 to the low-frequency region relative to the frequency of the 3482 cm−1 line in the IR absorption spectrum of the nominally pure congruent LiNbO3cong crystal (R = 0.946) and by about 30 cm−1 relative to the frequency of the 3466 cm−1 line in the IR absorption spectrum of the nominally pure stoichiometric LiNbO3 crystal (R = 1) with a high degree of structural perfection, studied in [59,60]. It is also unexpected that in the Raman spectrum in the region of stretching vibrations of OH-groups, only one line is reliably observed. At the same time, several lines (at least three) are observed in the IR absorption spectrum in the region of stretching vibrations of OH-groups of non-stoichiometric (R < 1) LiNbO3 crystals of different compositions [58,59,60,61,62]. Moreover, the number of lines in the IR absorption spectrum depends on the composition of the crystal. However, in the IR absorption spectrum of a LiNbO3 crystal of strictly stoichiometric composition (R = 1) with a high degree of structural perfection, only one narrow line with a frequency of 3466 cm−1 has been observed [61]. The reasons for such a strong difference in the frequencies of the lines corresponding to stretching vibrations of OH-groups in the IR absorption spectra and Raman spectra currently remain unknown. One of the reasons may be the feature that the oxygen octahedra O6 of the LiNbO3:Y3+(0.46 wt%) crystal structure have a shape close to the shape of a regular octahedron, i.e., they are centrosymmetric, and at the same time the vibrations of the OH-groups distort the shape of the O6 octahedron negligibly little. For centrosymmetric structures, the rule of alternative prohibition applies: vibrations active in the IR absorption spectrum are prohibited in the Raman spectrum, and vice versa.

7. Conclusions

In this paper, comparative studies of Raman spectra of photorefractive LiNbO3:Y3+(0.46 wt%) single crystal excited by visible (532 nm) and near-IR (785 nm) laser sources in a wide frequency range (100–4000 cm−1) are performed for the first time, and their interpretation is given taking into account the photorefractive effect (optical damage). It is found that the speckle structure of the photoinduced light scattering indicatrix of LiNbO3:Y3+(0.46 wt%) crystal, in contrast to the speckle structure of LiNbO3 crystals of other compositions, opens unexpectedly quickly—within the first second of laser radiation exposure to the crystal. With the irradiation time, the speckle structure of the PILS indicatrix is also found to exhibit atypical behavior caused by the peculiarities of the dissipation processes of laser-induced defects in the crystal. In the frequency range of 1000–2100 cm−1, five second-order Raman scattering lines have been detected for the first time, and the frequencies of two of them (about 1790 cm−1 and 1940 cm−1) slightly have been observed to exceed the doubled value of the frequencies of fundamental vibrations of the 4A1(z)LO and 9E(x,y) symmetry types. That is, the lines with frequencies of about 1790 cm−1 and 1940 cm−1 may represent overtones of the fundamental vibrations of 4A1(z)LO and 9E(x,y). It is found that in the region of stretching vibrations of OH-groups (3200–3800 cm−1) in the Raman spectrum of the LiNbO3:Y3+(0.46 wt%) crystal, only one line with a frequency of about 3431–3438 cm−1 is observed. At the same time, in the IR absorption spectrum in the region of stretching vibrations of OH-groups of the LiNbO3:Y3+(0.46 wt%) crystal and numerous non-stoichiometric (R < 1) LiNbO3 crystals of different compositions studied in the literature [58,59,60,61,62], several lines (at least three) are observed. In this case, for the LiNbO3:Y3+(0.46 wt%) crystal, the Raman spectrum as a whole is found to be shifted to the low-frequency region relative to the IR absorption spectrum by more than 50 cm−1. It should be noted that in the IR absorption spectrum of the LiNbO3 crystal of strictly stoichiometric composition (R = 1) with a high degree of structural perfection, as well as in the Raman spectrum of the LiNbO3:Y3+(0.46 wt%) crystal, only one narrow line with a frequency of 3466 cm−1 was observed [59]. The reasons for such a strong enough difference in the frequencies of the lines corresponding to the stretching vibrations of OH-groups in the IR absorption spectra and Raman spectra currently remain unknown. It can be assumed that the oxygen octahedra O6 of the LiNbO3:Y3+(0.46 wt%) crystal structure has a shape close to the shape of a regular octahedron, i.e., are centrosymmetric. For centrosymmetric structures, the alternative prohibition rule applies: vibrations active in the IR absorption spectrum are prohibited in the Raman spectrum, and vice versa.

Author Contributions

Conceptualization, N.V.S. and A.Y.P.; resources, M.N.P.; writing—original draft preparation, N.V.S. and A.Y.P.; data curation, A.V.S.; formal analysis, A.V.S. and A.Y.P. All authors have read and agreed to the published version of the manuscript.

Funding

N.V.S. and M.N.P. acknowledge the Ministry of Science and Higher Education of Russian Federation, scientific topic FMEZ-2025-0055. A.Y.P. acknowledges the Russian Science Foundation, Grant No. 19-79-30086-P.

Data Availability Statement

The raw data required to reproduce the findings are available from the corresponding author upon reasonable request.

Conflicts of Interest

The authors declare no conflicts of interest. The funders had no role in the design of the study; in the collection, analyses, or interpretation of data; in the writing of the manuscript; or in the decision to publish the results.

References

  1. Zapadlík, O.; Pejchal, J.; Babin, V.; Jarý, V.; Vaněček, V.; Kučerková, R.; Jurek, K.; Beitlerová, A.; Nikl, M. GSAG:Ce scintillator: Insights from yttrium admixture. RSC Adv. 2025, 15, 2140–2151. [Google Scholar] [CrossRef]
  2. Ermochenkov, I.M.; Zavartsev, Y.D.; Zagumennyi, A.I.; Yurasova, O.V.; Morozov, I.V.; Serebryakov, D.V. Scintillation Lu2SiO5−z:Y3+:Ce3+:Ca2+ crystal for positron emission tomography. Bull. Lebedev Phys. Inst. 2024, 51, 25–29. [Google Scholar] [CrossRef]
  3. Belov, M.V.; Zavartsev, Y.D.; Zavertyaev, M.V.; Zagumennyi, A.I.; Kozlov, V.A.; Kutovoi, S.A.; Pestovskii, N.V.; Savinov, S.Y. Scintillation properties of large Lu2SiO5–z:Y3+:Ce3+:Ca2+ crystals. Bull. Lebedev Phys. Inst. 2022, 49, 121–124. [Google Scholar] [CrossRef]
  4. Belov, M.V.; Vlasov, V.I.; Zavartsev, Y.D.; Zavertyaev, M.V.; Zagumennyi, A.I.; Kozlov, V.A.; Pestovskii, N.V.; Savinov, S.Y.; Tskhay, V.S. New scintillation crystals YAG:Yb3+:Mg2+ and YAG:Yb3+:Ca2+:Mg2+ with a short decay time. Bull. Lebedev Phys. Inst. 2024, 51, 290–293. [Google Scholar] [CrossRef]
  5. Wang, T.; Wang, Y.; Weng, Y.; Lv, L.; Guo, S.; Ding, C.; Liu, F.; Li, T.; Wang, B.; Peng, Z. Effect of yttrium doping on the properties of Nickel-Iron multiphase heterostructures at high current conditions. Chem. Eng. Sci. 2025, 302, 120859. [Google Scholar] [CrossRef]
  6. Huang, Y.; Li, J.; Bai, L.; Chen, X.; Chen, S.; Zhang, H. Synthesis of magnetically recyclable cauliflower-like sonocatalyst yttrium doped ZrO2 and sonocatalytic degradation of organic dye. Desalin. Water Treat. 2025, 321, 101049. [Google Scholar] [CrossRef]
  7. Jiang, Y.; Zhu, L.; Tian, J.; Miao, H.; Tan, R.; Tian, Z.; Li, X.; Liu, Y. A high rate and stability O3-type cathode material based on a Y-doped NaNi1/3Fe1/3Mn1/3O2 matrix. Mater. Today Commun. 2025, 46, 112523. [Google Scholar] [CrossRef]
  8. Luo, Q.; Wan, Y.; Wang, Z.; Gao, S.; Chen, Y.; Feng, C. Excellent-performing gas sensor based on Yttrium-doped ZnFe2O4 nanofibers for detection of n-Butanol. J. Alloys Compd. 2025, 1027, 180605. [Google Scholar] [CrossRef]
  9. Wang, J.; Sun, C.; Bao, J.; Yang, Z.; Zhang, J.; Huang, X. Yttrium doping of perovskite oxide La2Ti2O7 nanosheets for enhanced proton conduction and gas sensing under highhumidity levels. Sensors 2025, 25, 901. [Google Scholar] [CrossRef]
  10. Vatnik, S.M.; Osipov, V.V.; Luk’yashin, K.E.; Kravchenko, V.B.; Kopylov, Y.L.; Vedin, I.A.; Kurbatov, P.F. Multiwatt lasing of Nd:YAG laser ceramics containing 0.8 % and 1 % of Nd. Quantum Electron. 2014, 44, 585–587. [Google Scholar] [CrossRef]
  11. Kaminskii, A.A. Laser crystals and ceramics: Recent advances. Laser Photon. Rev. 2007, 1, 93–177. [Google Scholar] [CrossRef]
  12. Prokhorov, A.M.; Kuz’minov, Y.S. Physics and Chemistry of Crystalline Lithium Niobate; Adam Hilger: New York, NY, USA, 1990. [Google Scholar]
  13. Aleksandrovskiĭ, A.L.; Naumova, I.I.; Tarasenko, V.V.; Kholodnykh, A.I.; Yakovleva, G.I. Quasiphase-matched ee–e frequency conversion of light in LiNbO3:Y crystals with a regular domain structure. Sov. J. Quantum Electron. 1989, 19, 1343–1345. [Google Scholar] [CrossRef]
  14. Volkov, V.V.; Laptev, G.D.; Morozov, E.Y.; Naumova, I.I.; Chirkin, A.S. Consecutive quasi-phase-matched generation of the third harmonic of the radiation from an Nd:YAG laser in a periodicaly poled Y:LiNbO3 crystal. Quantum Electron. 1998, 28, 1020–1021. [Google Scholar] [CrossRef]
  15. Kornienko, V.V.; Kitaeva, G.K.; Naumova, I.I.; Tuchak, A.N.; Penin, A.N.; Yakunin, P.V. Evaluating the spectral sensitivity of the nonlinear-optical terahertz wave radiation detecors via spontaneous parametric down-conversion spectra. Opt. Spectrosc. 2014, 116, 520–528. [Google Scholar] [CrossRef]
  16. Goul’Kov, M.; Odoulov, S.; Naumova, I.; Agulló-López, F.; Calvo, G.; Podivilov, E.; Sturman, B.; Pruneri, V. Degenerate parametric light scattering in periodically poled LiNbO3:Y:Fe. Phys. Rev. Lett. 2001, 86, 4021–4024. [Google Scholar] [CrossRef] [PubMed]
  17. Barilov, D.; Shumelyuk, A.; Hesselink, L.; Sturman, B.; Odoulov, S. Coupling of orthogonally polarized waves and vectorial coherent oscillation in periodically poled LiNbO3:Y:Fe. J. Opt. Soc. Am. B 2003, 20, 1649–1655. [Google Scholar] [CrossRef]
  18. Aleksandrovskiĭ, A.L.; Ershova, G.I.; Kitaeva, G.K.; Kulik, S.P.; Naumova, I.I.; Tarasenko, V.V. Dispersion of the refractive indices of LiNbO3:Mg and LiNbO3:Y crystals. Sov. J. Quantum Electron. 1991, 21, 225–227. [Google Scholar] [CrossRef]
  19. Chirkin, A.S.; Volkov, V.V. Consecutive Quasi-phase-matched interactions of light waves in periodically poled nonlinear optical crystals. J. Russ. Laser Res. 1998, 19, 409–426. [Google Scholar] [CrossRef]
  20. Aleksandrovski, A.L.; Naumova, I.I.; Tarasenko, V.V. Lithium niobate with laminar domains for frequency tripling of Nd: YAG laser radiation. Ferroelectrics 1993, 141, 147–152. [Google Scholar] [CrossRef]
  21. Bihan, R.L.; Averty, D.; Pain, D.; Aleksandrovski, A.L.; Naumova, I.I. Study of lithium niobate with periodically reversed domains. Ferroelectrics 1995, 172, 181–186. [Google Scholar] [CrossRef]
  22. Kornienko, V.V.; Kitaeva, G.K.; Sedlmeir, F.; Leuchs, G.; Schwefel, H.G.L. Towards terahertz detection and calibration through spontaneous parametric down-conversion in the terahertz idler-frequency range generated by a 795 nm diode laser system. APL Photonics 2018, 3, 051704. [Google Scholar] [CrossRef]
  23. Ma, G.H.; Tang, S.H.; Kitaeva, G.K.; Naumova, I.I. Terahertz generation in Czochralski-grown periodically poled Mg:Y:LiNbO3 by optical rectification. J. Opt. Soc. Am. B 2006, 23, 81–89. [Google Scholar] [CrossRef]
  24. Odoulov, S.; Shumelyuk, A.; Thien, R.; von Bally, G. Reflection hologram recording in periodically poled LiNbO3:Y:Fe. J. Opt. A 2004, 6, 224–228. [Google Scholar] [CrossRef]
  25. Odoulov, S.; Tarabrova, T.; Shumelyuk, A.; Naumova, I.I.; Chaplina, T.O. Photorefractive properties of bulk periodically poled LiNbO3:Y:Fe. Opt. Mater. 2001, 18, 65–68. [Google Scholar] [CrossRef]
  26. Odoulov, S.; Tarabrova, T.; Shumelyuk, A.; Naumova, I.I.; Chaplina, T.O. Photorefractive response of bulk periodically poled LiNbO3:Y:Fe at high and low spatial frequencies. Phys. Rev. Lett. 2000, 84, 3294–3297. [Google Scholar] [CrossRef]
  27. Sidorov, N.V.; Serebryakov, Y.A. The structural ordering and photorefraction in lithium niobate admixed crystals. Ferroelectrics 1994, 160, 101–105. [Google Scholar] [CrossRef]
  28. Sidorov, N.V.; Chufyrev, P.G.; Palatnikov, M.N.; Mel’nik, N.N.; Zheleznov, Y.A.; Khomich, V.Y. Manifestation of a photorefractive effect in Raman spectra of lithium niobate crystals of different compositions. Quantum Electron. 2004, 34, 1177–1179. [Google Scholar] [CrossRef]
  29. Sidorov, N.V.; Chufyrev, P.G.; Palatnikov, M.N.; Kalinnikov, V.T.; Mel’nik, N.N. Doping effect on the Raman spectrum and photorefractive properties of LiNbO3 crystals. Inorg. Mater. 2005, 41, 164–171. [Google Scholar] [CrossRef]
  30. Chufyrev, P.G.; Sidorov, N.V.; Palatnikov, M.N.; Yanichev, A.A. Manifestation of the specific structural features of lithium niobate single crystals of different composition in their Raman spectra. Opt. Spectrosc. 2008, 105, 913–918. [Google Scholar] [CrossRef]
  31. Voron’ko, Y.K.; Kudryavtsev, A.B.; Osiko, V.V.; Sobol’, A.A.; Sorokin, E.V. Raman scattering study of phase transitions in lithium niobate and tantalate. Sov. Phys. Solid State 1987, 29, 771–775. [Google Scholar]
  32. Voron’ko, Y.K.; Kudryavtsev, A.B.; Sobol’, A.A.; Sorokin, E.V. High-temperature Raman spectroscopy: A tool for probing phase transformations of laser crystals. Trydy Inst. Obsch. Fiz. AN SSSR [Proc. Gen. Phys. Inst. AS USSR] 1991, 29, 50–100. (In Russian) [Google Scholar]
  33. Lengyel, K.; Szaller, Z.; Péter, Á.; Polgár, K.; Kovács, L. Microscopic and Raman spectroscopic investigation of the domain structures in LiNbO3:Y:Mg crystals. Ferroelectrics 2008, 368, 3–11. [Google Scholar] [CrossRef]
  34. Gorelik, V.S.; Abdurakhmonov, S.D. Overtone Raman scattering in lithium niobate single crystal doped with terbium. Crystallogr. Rep. 2022, 67, 252–255. [Google Scholar] [CrossRef]
  35. Sidorov, N.V.; Pyatyshev, A.Y.; Stroganova, E.V.; Galutskiy, V.V.; Skrabatun, A.V. Features of Raman scattering in LiNbO3:Er3+ crystal with erbium gradient. J. Raman Spectrosc. 2025, 56, 1100–1113. [Google Scholar] [CrossRef]
  36. Sidorov, N.; Palatnikov, M.; Pyatyshev, A.; Sverbil, P. Second-order Raman scattering in ferroelectric ceramic solid solutions LiNbxTa1−xO3. Crystals 2022, 12, 456. [Google Scholar] [CrossRef]
  37. Sidorov, N.V.; Pyatyshev, A.Y.; Galutskiy, V.V.; Stroganova, E.V.; Skrabatun, A.V. Features of the defect structure of a lithium-gradient nonlinear optical single crystal LiNbO3 and their manifestation in the Raman spectra. Spectrochim. Acta A 2025, 327, 125340. [Google Scholar] [CrossRef]
  38. Sidorov, N.; Pyatyshev, A.; Stroganova, E.; Galutskiy, V.; Bushunov, A.; Tarabrin, M. Features of the defect structure of the compositionally homogeneous crystal LiNbO3:Er3+(3.1 wt%) and the gradient crystal LiNbO3:Er3+ and their manifestation in the IR transmission spectra in the region of stretching vibrations of hydrogen atoms of OH-groups. Materials 2025, 18, 579. [Google Scholar] [CrossRef]
  39. Palatnikov, M.N.; Sidorov, N.V.; Biryukova, I.V.; Shcherbina, O.B.; Kalinnikov, V.T. Granulated charge for lithium niobate single crystals growth. Perspekt. Mater. [Perspect. Mater.] 2011, 2, 93–97. (In Russian). Available online: https://j-pm.tilda.ws/page54744501.html (accessed on 13 March 2026). [CrossRef]
  40. Palatnikov, M.N.; Sandler, V.A.; Sidorov, N.V.; Efremov, I.N.; Makarova, O.V. Methods for controlling the degree of unipolarity of large LiNbO3 crystals. Instrum. Exp. Tech. 2020, 63, 383–387. [Google Scholar] [CrossRef]
  41. ANSI/IEEE Std 176-1987; Standard on Piezoelectricity. The Institute of Electrical and Electronics Engineers, Inc. (IEEE): New York, NY, USA, 1998. [CrossRef]
  42. Maksimenko, V.A.; Syui, A.V.; Karpets, Y.M. Photoinduced Processes in Lithium Niobate Crystals; FIZMATLIT: Moscow, Russia, 2008. (In Russian) [Google Scholar]
  43. Sidorov, N.V.; Pikoul’, O.Y.; Teplyakova, N.A.; Palatnikov, M.N. Laser Conoscopy and Photoinduced Light Scattering in Research of Properties of Optically Nonlinear Lithium Niobate Crystal; RAS: Moscow, Russia, 2019; (In Russian). Available online: https://new.ras.ru/work-new/publishing/monographs/lazernaya-konoskopiya-i-fotoindutsirovannoe-rasseyanie-sveta-v-issledovaniyakh-svoystv-nelineyno-opt/ (accessed on 13 March 2026).
  44. Atsuo, Y.; Hitoshi, T.; Masaki, S. Liquid phase epitaxial growth of LiNbO3 thin film using Li2O-B2O3 flux system. J. Cryst. Growth 1993, 132, 48–60. [Google Scholar] [CrossRef]
  45. Can, H.; Shichao, W.; Ning, Y. Subsolidus phase relations and the crystallization region of LiNbO3 in the system Li2O–B2O3–Nb2O5. J. Alloys Compd. 2010, 502, 211–214. [Google Scholar] [CrossRef]
  46. Palatnikov, M.; Sidorov, N.; Kadetova, A.; Titov, R.; Biryukova, I.; Makarova, O.; Manukovskaya, D.; Teplyakova, N.; Efremov, I. Growing, structure and optical properties of LiNbO3:B crystals, a material for laser radiation transformation. Materials 2023, 16, 732. [Google Scholar] [CrossRef]
  47. Titov, R.; Kadetova, A.; Tokko, O.; Sidorov, N.; Palatnikov, M.; Teplyakova, N.; Masloboeva, S.; Biryukova, I.; Efremov, I.; Manukovskaya, D. Influence of doping technology on the stoichiometry and features of the localization of B3+ cations in LiNbO3:B single crystals. Crystals 2023, 13, 1245. [Google Scholar] [CrossRef]
  48. Anderson, A. (Ed.) The Raman Effect. Volume 2: Applications; Marcel Dekker, Inc.: New York, NY, USA, 1973. [Google Scholar]
  49. Sanna, S.; Neufeld, S.; Rüsing, M.; Berth, G.; Zrenner, A.; Schmidt, W.G. Raman scattering efficiency in LiTaO3 and LiNbO3 crystals. Phys. Rev. B 2015, 91, 224302. [Google Scholar] [CrossRef]
  50. Margueron, S.; Bartasyte, A.; Glazer, A.M.; Simon, E.; Hlinka, J.; Gregora, I.; Gleize, J. Resolved E-symmetry zone-centre phonons in LiTaO3 and LiNbO3. J. Appl. Phys. 2012, 111, 104105. [Google Scholar] [CrossRef]
  51. Barker, A.S., Jr.; Loudon, R. Dielectric properties and optical phonons in LiNbO3. Phys. Rev. 1967, 158, 433–445. [Google Scholar] [CrossRef]
  52. Ridah, A.; Bourson, P.; Fontana, M.D.; Malovichko, G. The composition dependence of the Raman spectrum and new assignment of the phonons in LiNbO3. J. Phys. Cond. Matter 1997, 9, 9687–9693. [Google Scholar] [CrossRef]
  53. Savova, I.; Savatinova, I.; Liarokapis, E. Phase composition of Z-cut protonated LiNbO3: A Raman study. Opt. Mater. 2001, 16, 353–360. [Google Scholar] [CrossRef]
  54. Friedrich, M.; Riefer, A.; Sanna, S.; Schmidt, W.G.; Schindlmayr, A. Phonon dispersion and zero-point renormalization of LiNbO3 from density-functional perturbation theory. J. Phys. Cond. Matter 2015, 27, 385402. [Google Scholar] [CrossRef]
  55. Repelin, Y.; Husson, E.; Bennani, F.; Proust, C. Raman spectroscopy of lithium niobate and lithium tantalate. Force field calculations. J. Phys. Chem. Solids 1999, 60, 819–825. [Google Scholar] [CrossRef]
  56. Zhang, D.; Chen, X.; Jin, Y.; Cao, X.; Zhu, D.; Wang, Y.; Ding, G.; Cui, Y.; Chen, C.; Wu, Z.; et al. Raman study on vapor-phase equilibrated Er:LiNbO3 and Er:Ti:LiNbO3 crystals. Appl. Phys. A 2001, 72, 95–102. [Google Scholar] [CrossRef]
  57. Yang, X.; Lan, G.; Li, B.; Wang, H. Raman spectra and directional dispersion in LiNbO3 and LiTaO3. Phys. Status Solidi b/Basic Sol. State Phys. 1987, 142, 287–300. [Google Scholar] [CrossRef]
  58. Volk, T.; Wöhlecke, M. Lithium Niobate: Defects, Photorefraction and Ferroelectric Switching; Springer: Berlin/Heidelberg, Germany, 2009. [Google Scholar] [CrossRef]
  59. Lengyel, K.; Péter, Á.; Kovács, L.; Corradi, G.; Pálfavi, L.; Hebling, J.; Unferdorben, M.; Dravecz, G.; Hajdara, I.; Szaller, Z.; et al. Growth, defect structure, and THz application of stoichiometric lithium niobate. Appl. Phys. Rev. 2015, 2, 040601. [Google Scholar] [CrossRef]
  60. Cabrera, J.M.; Olivares, J.; Carrascosa, M.; Rams, J.; Müller, R.; Diéguez, E. Hydrogen in lithium niobate. Adv. Phys. 1996, 45, 349–392. [Google Scholar] [CrossRef]
  61. Wöhlecke, M.; Kovács, L. OH ions in oxide crystals. Crit. Rev. Solid State Mater. Sci. 2001, 26, 1–86. [Google Scholar] [CrossRef]
  62. Kovács, L.; Rebouta, L.; Soarest, J.C.; da Silva, M.F.; Hage-Ali, M.; Stoquert, J.P.; Siffert, P.; Sanz-Garcia, J.A.; Corradi, G.; Szaller, Z.; et al. On the lattice site of trivalent dopants and the structure of Mg2+-OH-M3+ defects in LiNbO3:Mg crystals. J. Phys. Cond. Matter 1993, 5, 781–794. [Google Scholar] [CrossRef]
  63. Köhler, T.; Zschornak, M.; Röder, C.; Hanzig, J.; Gärtner, G.; Leisegang, T.; Mehner, E.; Stöcker, H.; Meyer, D.C. Chemical environment and occupation sites of hydrogen in LiMO3. J. Mater. Chem. C 2023, 11, 520–538. [Google Scholar] [CrossRef]
  64. Savelyev, E.; Akhmatkhanov, A.; Tronche, H.; Doutre, F.; Lunghi, T.; Baldi, P.; Shur, V. Kinetics of the domain structure in uniform electric field in LiNbO3 with surface layer modified by soft proton exchange. Phys. Status Solidi rrl/Rapid Res. Lett. 2024, 18, 2300420. [Google Scholar] [CrossRef]
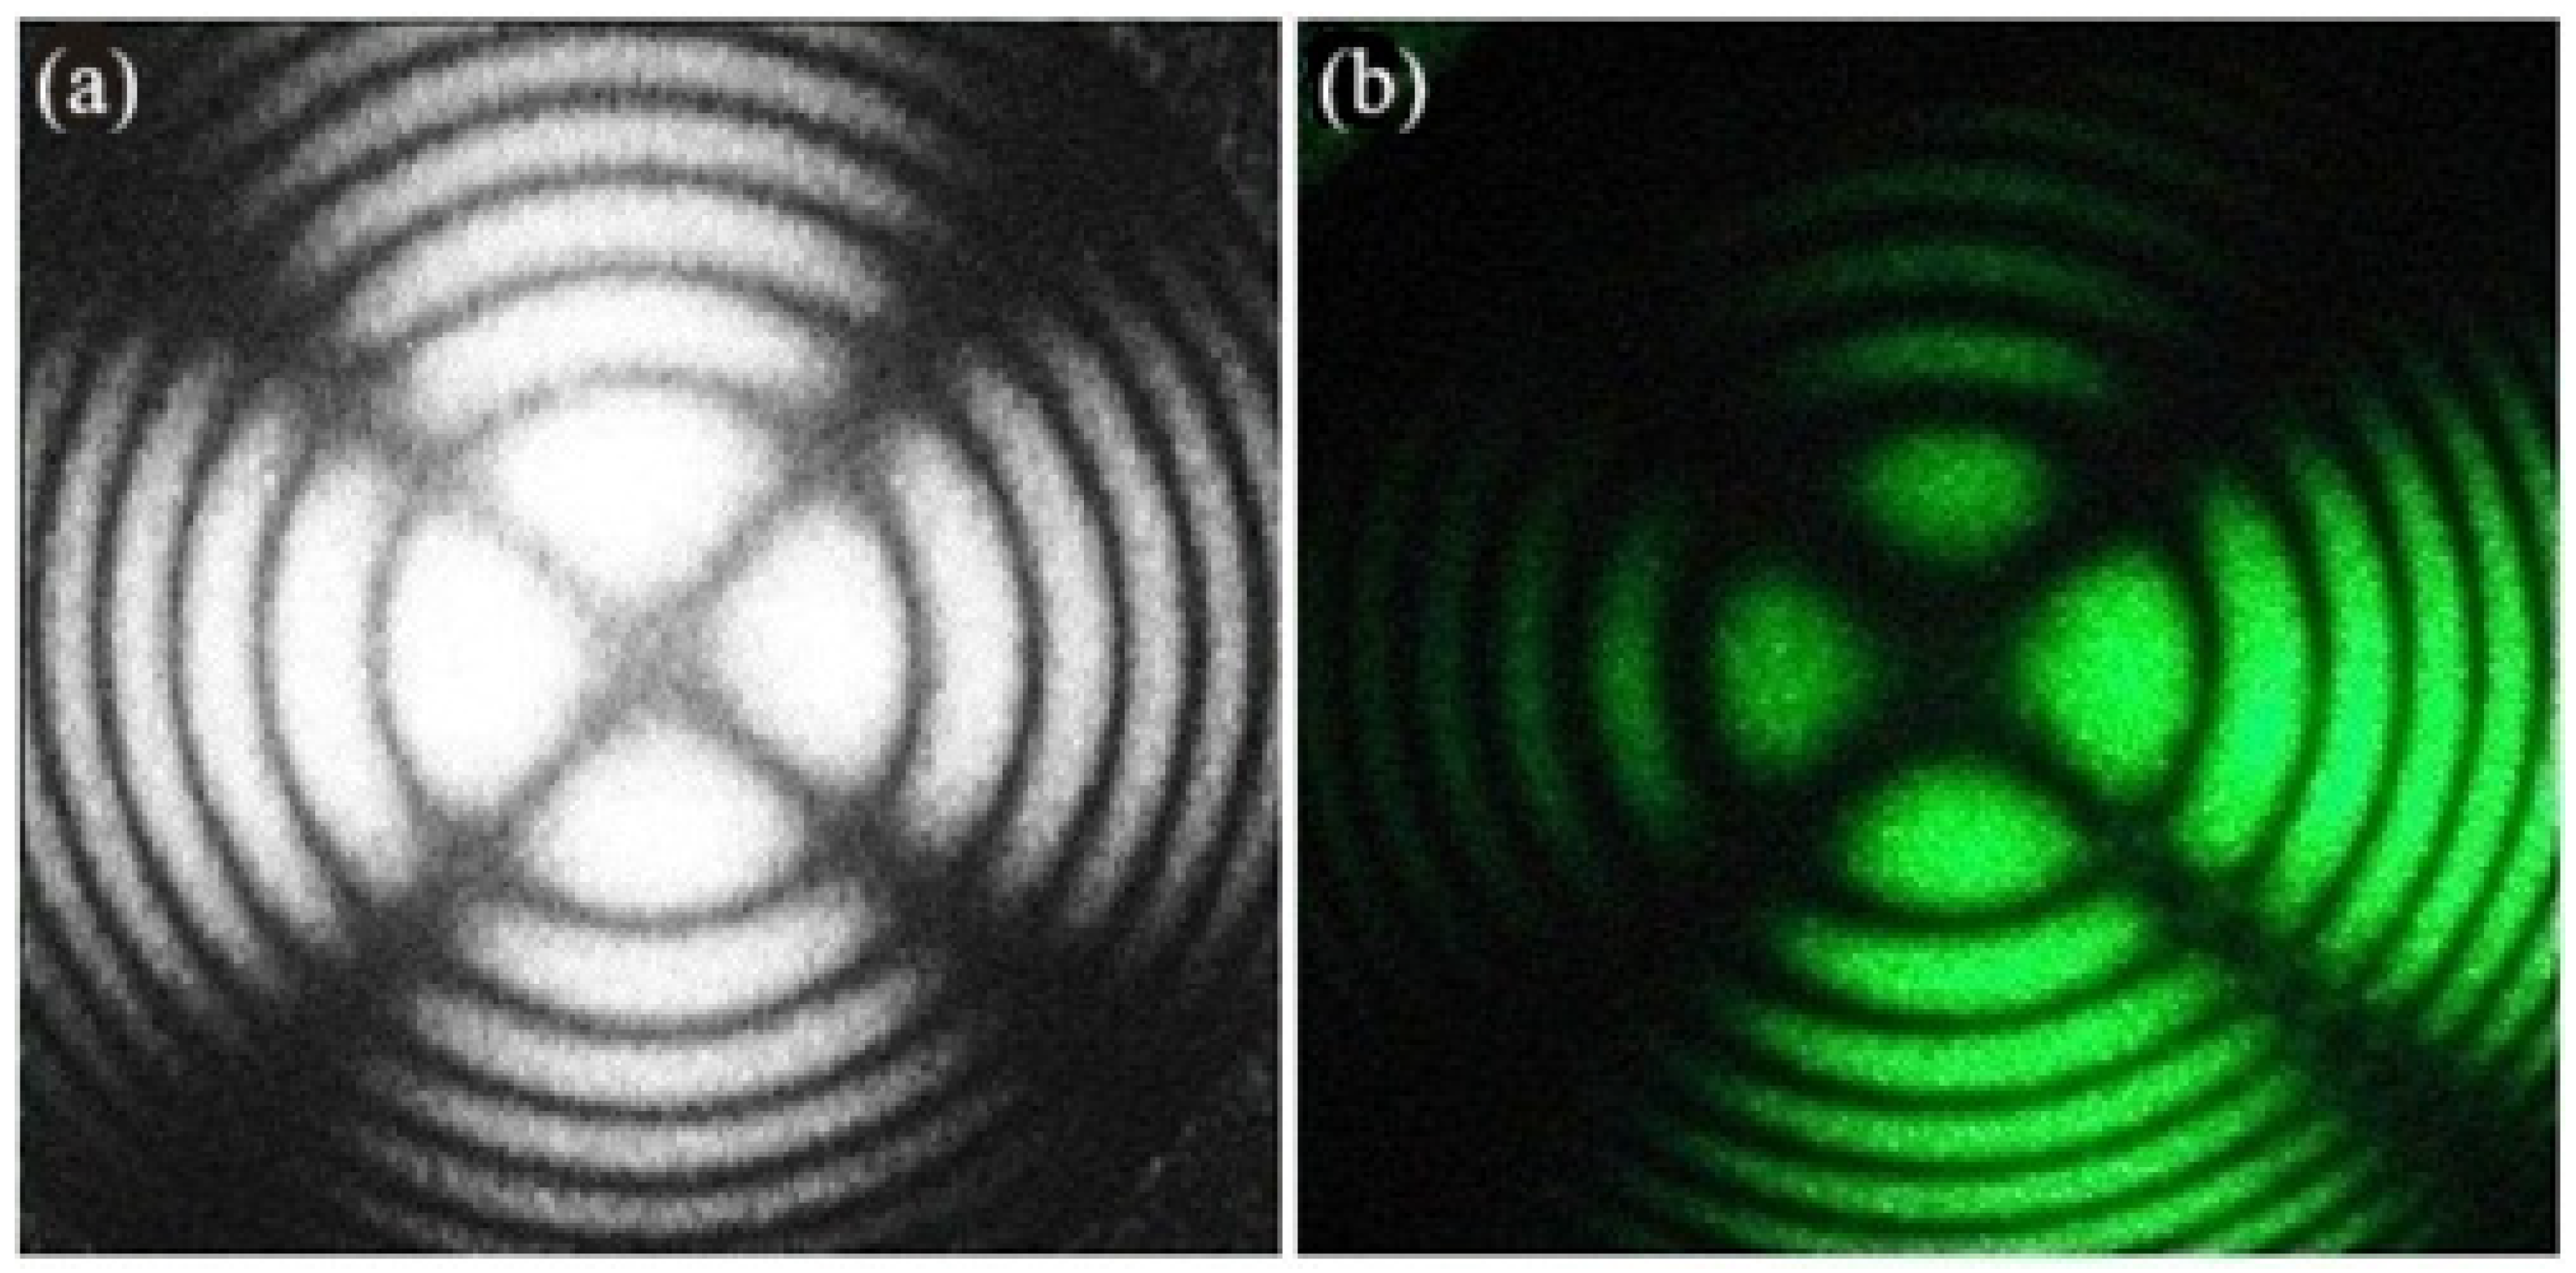
Figure 1. Conoscopic patterns of the LiNbO3:Y3+(0.46 wt%) crystal obtained at λ0 = 532 nm and laser radiation power P of (a) 1 mW and (b) 90 mW.
Physics 08 00039 g001
Figure 2. PILS patterns of LiNbO3:Y3+(0.46 wt%) (a) and LiNbO3:B3+(0.83 mol% B2O3 in the batch) (b) crystals, obtained with excitation by laser radiation with a wavelength of λ0 = 532 nm and a power of 160 mW, and the dynamics of their development over time, as indicated. The exciting laser radiation is directed perpendicular to the polar Z-axis and polarized along the crystallographic X-axis. The polarization of the ordinary beam coincides with the direction of the X-axis, and the polarization of the extraordinary beam coincides with the direction of the Y-axis.
Physics 08 00039 g002
Figure 3. Time dependences of the opening angle θ of the speckle structure of the PILS indicatrix in LiNbO3:Y3+(0.46 wt%) (1) and LiNbO3:B3+(0.83 mol% B2O3 in the batch) crystals (2). λ0 = 532 nm, P = 160 mW.
Physics 08 00039 g003
Figure 4. Birefringence of a laser beam in a LiNbO3:B3+(0.83 mol% B2O3 in the batch) crystal. The central layer of the PILS indicatrix is highlighted in red and converted to black and white to enhance contrast. Two beams (ordinary and extraordinary) are quite well visible on the output face of the crystal as two round white spots. λ0 = 532 nm, P = 160 mW. The exciting laser radiation is directed perpendicular to the polar Z-axis and polarized along the crystallographic X-axis. The polarization of the ordinary beam coincides with the direction of the X-axis, and the polarization of the extraordinary beam coincides with the direction of the Y-axis.
Physics 08 00039 g004
Figure 5. Raman spectra of the LiNbO3:Y3+(0.46 wt%) crystal in scattering geometries x zz , zy x ¯ (a), y zz , zx y ¯ (b) and z xx , yy , xy z ¯ (c). λ0 = 532 nm.
Physics 08 00039 g005aPhysics 08 00039 g005b
Figure 6. Raman spectra of the LiNbO3:Y3+(0.46 wt%) crystal in scattering geometries x zz , zy x ¯ (a), y zz , zx y ¯ (b) and z xx , yy , xy z ¯ (c). λ0 = 785 nm.
Physics 08 00039 g006aPhysics 08 00039 g006b
Figure 7. Comparison of IR absorption (dark red) and Raman spectra (blue) of the LiNbO3:Y3+(0.46 wt%) crystal in the region of stretching vibrations of OH-groups in scattering geometries: x zz , zy x ¯ (a), y zz , zx y ¯ (b), z xx , yy , xy z ¯ (c). Raman spectra were recorded upon excitation by a laser line with a wavelength of 532 nm.
Physics 08 00039 g007aPhysics 08 00039 g007b
Table 1. Concentration of trace amounts of foreign cationic metal impurities and the Curie temperature (TC = 1145 °C) in the upper (cone) and lower parts of the LiNbO3:Y3+(0.46 wt%) single crystal.
ImpurityImpurity Content, wt%
TopBottom
Zr<1 × 10⁻²<1 × 10⁻²
Mo<1 × 10⁻³<1 × 10⁻³
Ca<5 × 10⁻³<5 × 10⁻³
Fe<1 × 10⁻³<1 × 10⁻³
Ti<1 × 10⁻³<1 × 10⁻³
Si<1 × 10⁻³<1 × 10⁻³
Pb, Ni, Cr, Co<1 × 10⁻³<1 × 10⁻³
Al<5 × 10⁻⁴<5 × 10⁻⁴
Cu<5 × 10⁻⁴<5 × 10⁻⁴
Mn, V, Mg, Sn<5 × 10⁻⁴<5 × 10⁻⁴
Table 2. Experimentally observed frequencies (cm−1) of Raman lines of the LiNbO3:Y3+(0.46 wt%) single crystal and their assignment based on polarization measurements performed in Refs. [49,50] for two values of the exciting laser radiation wavelength λ0 and different scattering geometries.
λ0 = 532 nmλ0 = 785 nmAttribution
x zz , zy x ¯ y zz , zx y ¯ z xx , yy , xy z ¯ x zz , zy x ¯ y zz , zx y ¯ z xx , yy , xy z ¯
123 118119117115
1491491521521521521E(x,y)TO
199184185184181189
2352352352382382382E(x,y)TO
(2E(x,y)LO)
250250 253253 1A1(z)TO
265 265 2663E(x,y)TO
271 272272 1A1(z)LO
(2A1(z)TO)
3213213273223223284E(x,y)TO
3653653593673653615E(x,y)TO
4324324294334334316E(x,y)LO
(7E(x,y)TO)
5815785785805825788E(x,y)TO
632632624633631 4A1(z)TO
669
690690 691698
8758758728768768714A1(z)LO
(9E(x,y)LO)
Disclaimer/Publisher’s Note: The statements, opinions and data contained in all publications are solely those of the individual author(s) and contributor(s) and not of MDPI and/or the editor(s). MDPI and/or the editor(s) disclaim responsibility for any injury to people or property resulting from any ideas, methods, instructions or products referred to in the content.