1. Introduction
The concept of Hofstadter butterfly dates back to the year of 1976, when Douglas Hofstadter calculated the energy spectra of electrons moving in a two-dimensional (2D) lattice under a magnetic field [
1]. Subsequently, Gregory Wannier advanced the discourse by elucidating the theoretical underpinnings from the perspective of Landau energy level configurations [
2]. Electrons can transition between lattice points, and their behavior can be described by the Harper equation, which is a simplified form of the Schrodinger’s equation, reflecting the motion of electrons in a 2D lattice. By solving the Harper equation, the energy eigenvalues of the system can be obtained. Surprisingly, when magnetic flux passes through lattice units, the distribution of energy eigenvalues forms a fractal structure, namely the Hofstadter butterfly. It has self-similarity and fractal characteristics, and its shape and number of branches vary with changes in magnetic flux intensity [
3,
4]. One of the important predictions from the butterfly is that the intrinsic property of the 2D material can be tuned from being semiconducting, insulating and even superconducting, which raises considerable attractions with enormous promising applications in electronics, optics, magnetics, and other areas.
Hofstadter butterfly was first experimentally observed in a graphene/hexagonal boron nitride(h-BN) superlattice system [
5,
6,
7]. The periodic potential introduced by the periodic distribution of van der Waals forces is the fundamental reason why this phenomenon can be observed. In Ref. [
5], a moiré superlattice was obtained by combining bilayer graphene with h-BN. The bilayer graphene Hall bars was first prepared using mechanical exfoliation and co-lamination techniques and the wavelength of the moiré pattern was determined using Atomic Force Microscopy (AFM) imaging technology. By measuring resistance and Hall conductance under zero and high magnetic fields, it became able to construct Landau fan and Wannier diagrams to observe quantum Hall effect states associated with Hofstadter butterflies. By analyzing the effects of temperature and magnetic field on conductivity, the size of fractal gaps was estimated and the recursive structure of Hofstadter butterflies was observed.
The Hofstadter butterfly phenomenon was observed in van der Waals heterostructures [
6]. The graphene-hBN heterostructure samples were first designed and prepared and then devices with specific geometric shapes were formed through detailed nanofabrication processes. By utilizing the formation of moiré superlattices, it became able to adjust the electronic behavior in graphene and use theoretical models to predict and interpret experimental results. By measuring the Landau energy level spectrum and bandgap as well as conducting high-sensitivity capacitance measurements, it also able to observe the Hofstadter butterfly effect in the experiment. These observations were achieved through magnetic transport measurements, and these features are consistent with Hofstadter’s butterfly predictions. Through these comprehensive experiments and theoretical analysis, Hofstadter butterflies were successfully in the experiments.
In Ref. [
7], Hofstadter butterfly was observed through capacitance spectroscopy measurements in graphene–hBN heterostructures. Graphene–hBN heterostructure samples were prepared the minimum density of states associated with Dirac cone replicas was detected through capacitance measurement techniques under zero magnetic field. Under high magnetic field conditions, new cyclotron gaps were observed due to the formation of high field replicated Dirac cones and Landau quantization, which exhibited sharp minimum values in capacitance measurements, forming the energy spectrum structure of Hofstadter butterflies. In addition, with the assistance of temperature dependence analysis of density of states and theoretical models, it became able to provide a detailed explanation of the observed spectral structure, thereby confirming the existence of Hofstadter butterflies in graphene superlattices.
The Hofstadter butterfly is used to discuss the problem of integer quantum Hall effect, which is a quantum fractal composed of integers [
8,
9].Integers are topological quantum numbers related to the quantum Hall effect, manifested as the labeling of gaps in the butterfly spectrum, and are Chern numbers with topological origins. It is a geometric phase measured in units of 2π, directly related to Hall conductivity, and the sum of Chern numbers for all energy bands in the finite model is zero [
8]. The common feature of this system is the flux-energy graph [
10]. The range of values for the quantum number ϕ of magnetic flux varies in the range of [0, 1] [
8]. In general, for rational
, the butterfly diagram consists of
q subbands and
q − 1 gaps. For even numbers of
q, the two central bands come into contact with each other [
8,
11].
Moiré fringes are formed by the superposition of two sets of periodic grating structures with similar spatial frequencies. When two 2D crystals with the same lattice structure and similar lattice constants are stacked together at a certain angle, a moiré pattern with a larger lattice constant and the same lattice structure is formed [
12,
13]. When there is interlayer interaction between two layers of materials, the periodic superposition of their lattice induces a periodic potential field, thereby forming a moiré superlattice. This superlattice structure with long-range periodicity provides the necessary physical conditions for the observation of Hofstadter butterfly fractal spectra. Mismatched grating lattices, due to differences in spatial frequencies, can result in the formation of moiré patterns with wavelengths greater than the lattice constant [
14]. In a recent study [
15], the moiré Hofstadter butterfly energy spectrum of magic angle graphene was studied using a first-principles-based multi-atom tight binding model. The h-BN substrate and atomic relaxation factors were incorporated, as well as the magnetic field effect via the Peierls correction. It was found that electronic states can be divided into moiré states, mixed states, and conventional states, and magnetic field enhancement can cause the electron density of the moiré flat band to decay from the moiré center. This study reveals the competitive regulation between magnetic field and moiré potential field at the atomic scale and confirms the existence of Hofstadter fractal structure in moiré superlattices through atomic level simulations, providing a microscopic perspective for understanding electronic behavior under complex geometric symmetry. However, there is still a lack of comparative investigation of fractal energy spectra of triangular and rectangular moiré superlattices due to differences in geometric symmetry. Specifically, the electronic state evolution laws of the two structures under alternating magnetic fields have not been systematically revealed [
15].
In Ref. [
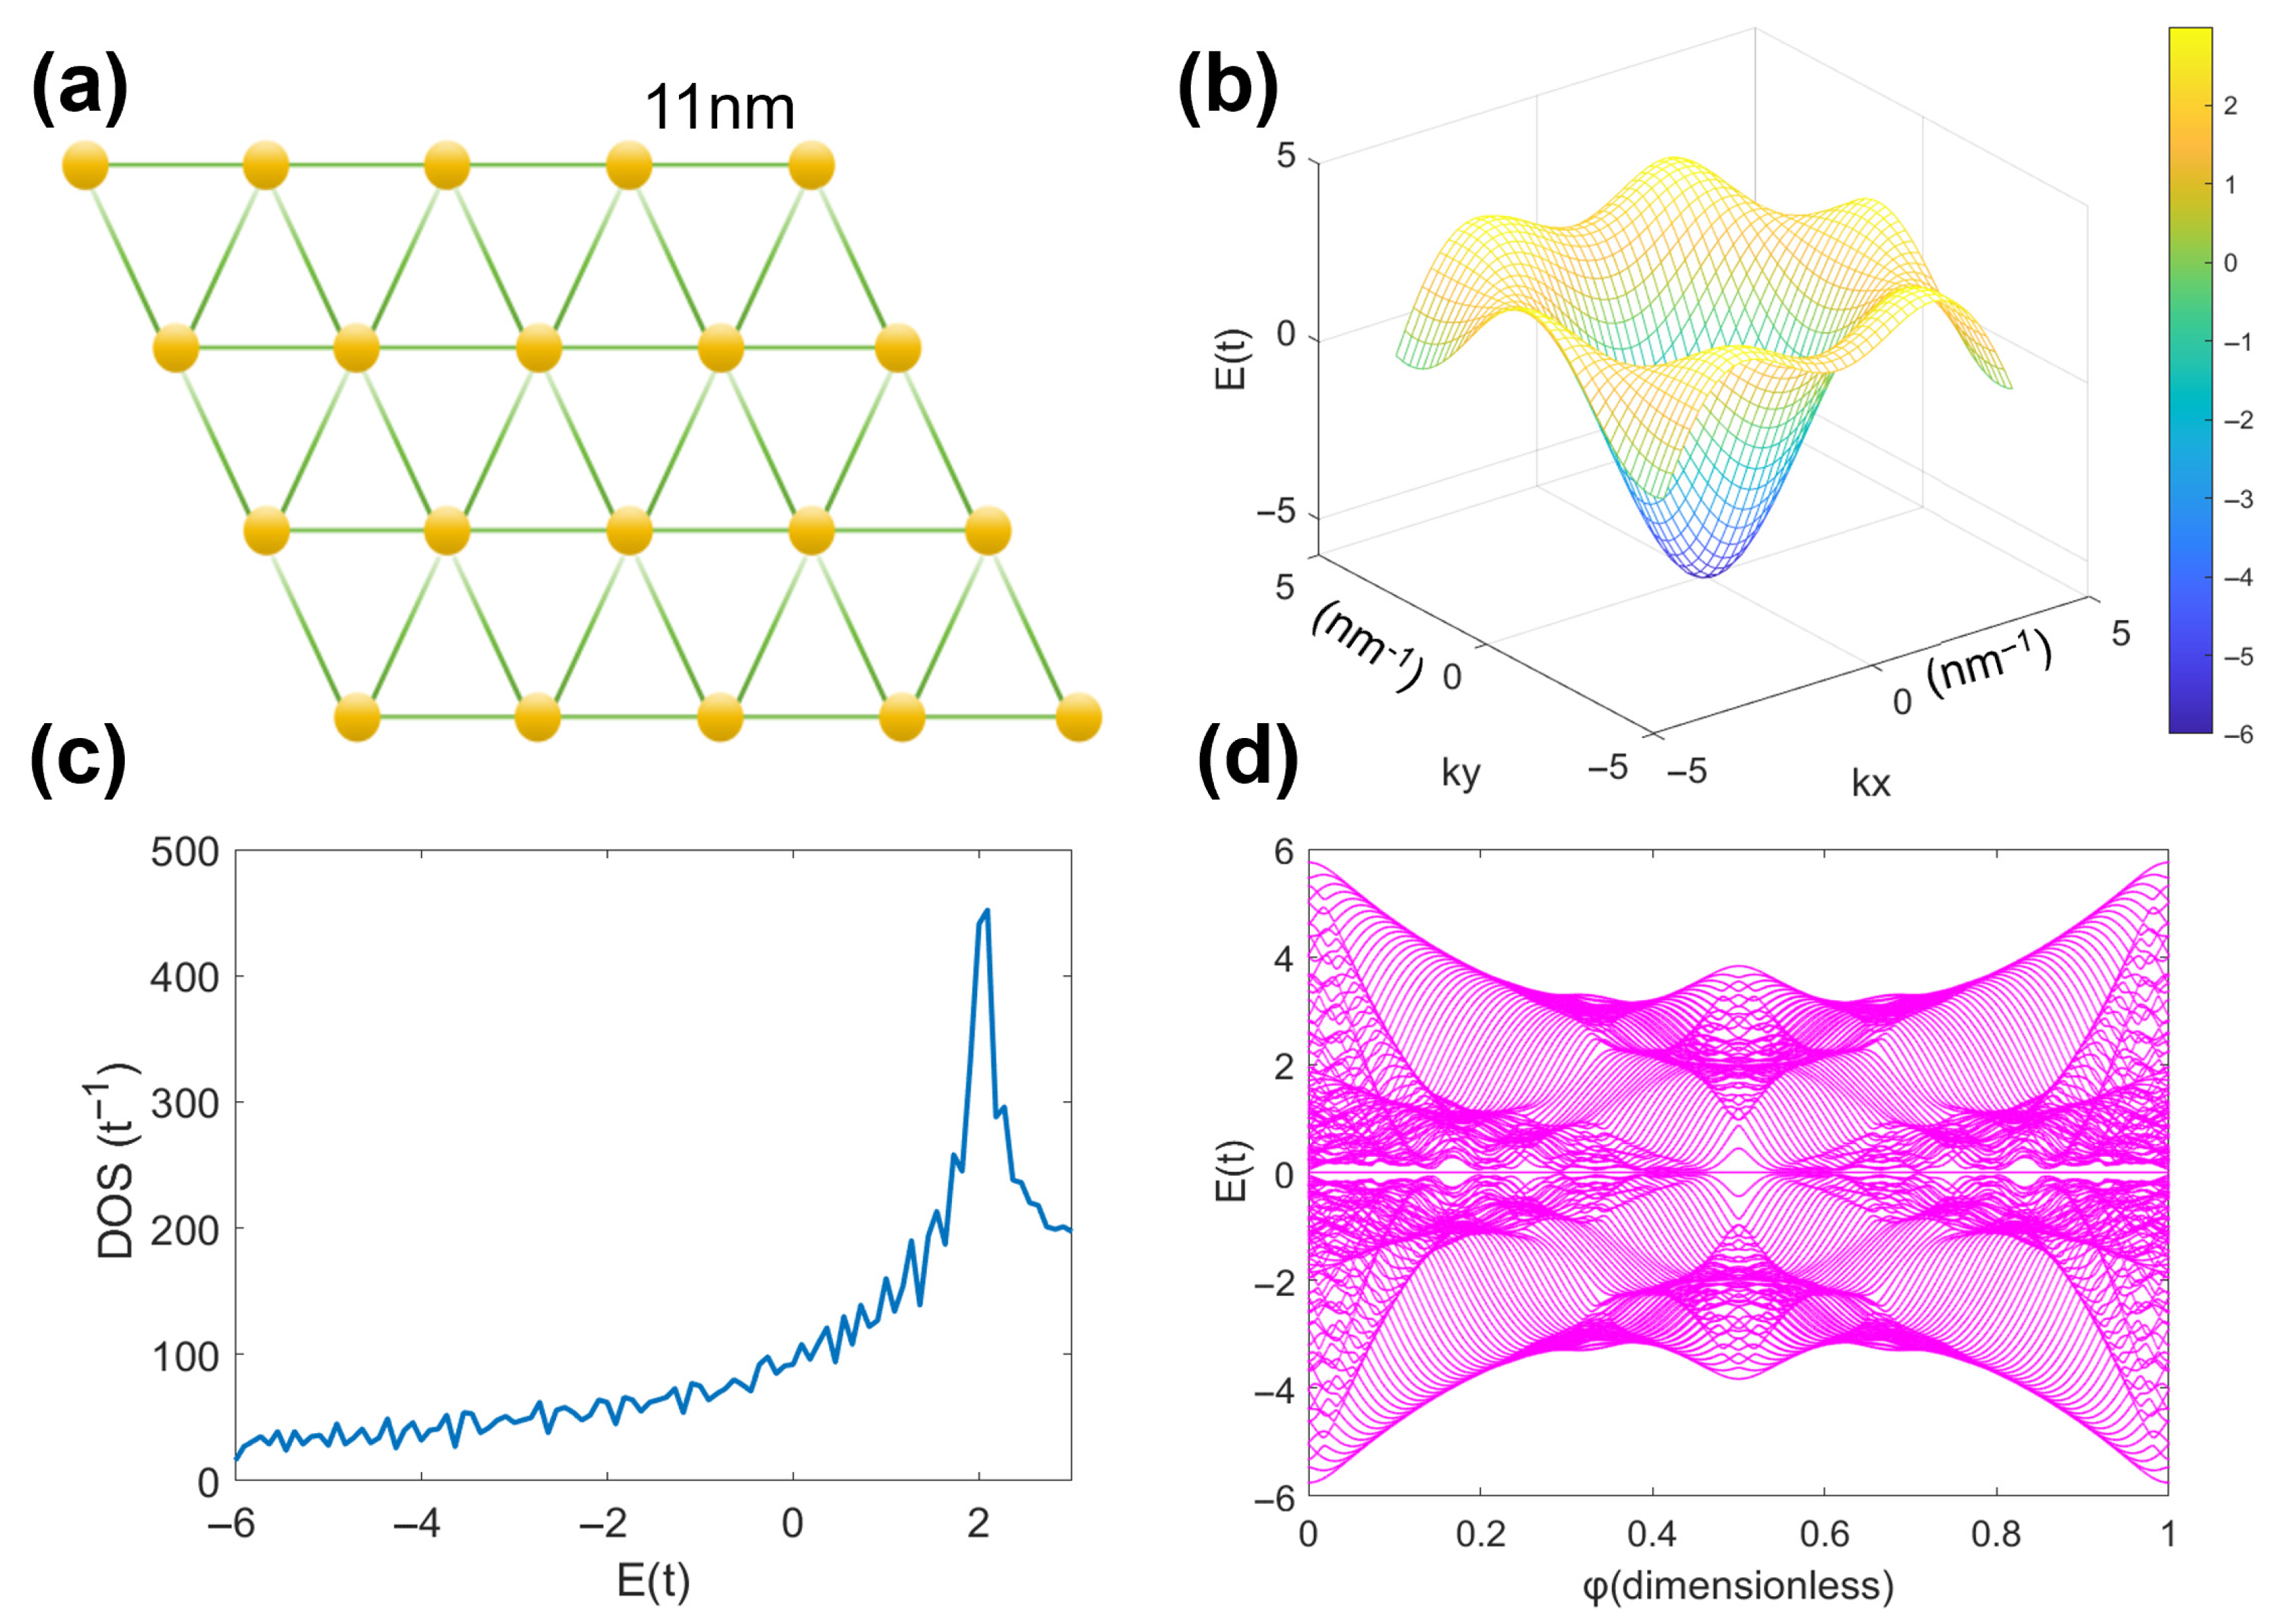
16], by directly hydrogenating the original bilayer graphene, the upper layer of graphene underwent hydrogenation to form graphone, while the lower layer of graphene remained intact, thus forming a bilayer graphone/graphene superlattice. Triangular and linear moiré patterns were observed in this structure. Atomic force microscopy measurements and corresponding fast Fourier transform analysis confirmed the formed patterns. In the atomic force microscopy characterization image of bilayer graphene/graphene superlattice, significant moiré fringes were observed in a relatively flat region, displaying a complete region composed of periodic triangular moiré patterns depicting a 11 nm moiré wavelength (long period) and a 60° vector angle [
16]. In Ref. [
17], a new technique was developed to explore the fluorination process of graphene. The ordering of graphene can also be analyzed using the same technique from the fluorination of bilayer graphene. A new rectangular moiré pattern was observed between the top fluorinated graphene layer and the bottom unfluorinated graphene layer. This rectangular moiré pattern can be explained by an atomic locked bilayer C
2F boat/graphene superlattice [
17]. In the current study, we use triangular and rectangular moiré wavelengths to simulate these two modes. The moiré wavelength in both studies is much larger than the atomic scale, providing a new dimension for regulating electronic behavior. Although the Hofstadter butterfly of traditional lattices has been extensively studied, there have been no reports on the comparative study of fractal spectra of triangular and rectangular moiré superlattices prepared experimentally due to their geometric symmetry differences.
Given the discussed development, the current paper systematically studies the energy dispersion relationship, density of states, and Hofstadter butterfly characteristics of triangular and rectangular moiré wavelengths under different magnetic fields using a tight binding model. Specifically, the differences in electronic behavior between two moiré patterns are compared and analyzed to reveal the significant influence of geometric structure on the distribution of electronic states. We explore the dynamic changes in electronic state distribution under alternating magnetic fields, including the evolution characteristics of energy gap structure and density of states curve, and then reveal the intrinsic relationship between fractal structure and electronic state distribution by calculating fractal dimension.
Finally, by analyzing different superlattices, Hofstadter butterflies caused by different moiré pattern structures are obtained, and electronic behavior in more complex environments is explored. These studies have important theoretical and practical value for understanding the electronic properties of low-dimensional materials and developing new electronic devices. In addition, complex Hofstadter butterfly patterns are analyzed, revealing the complex dynamics of electrons in confined spaces and external magnetic fields.
2. Theoretical Method
Electrons moving in a periodic potential field in real space form discrete and continuous Bloch energy bands. Under 2D confinement, electrons also form discrete and highly degenerate Landau levels in a vertical magnetic field. Therefore, the band structure of a 2D electron gas is modulated by both the periodic field and the magnetic field [
10]. The joint modulation of two fields causes electrons to form energy-level structures in a periodic potential field and a magnetic field, causing the Bloch band and Landau level of electrons to split into a series of subbands [
18]. When the period of the potential field (moiré wavelength λ) is equivalent to the characteristic length of the vertical magnetic field (magnetic length
), the width of the Bloch band matches the lower energy level of the Landau level, and the electronic state can be significantly modulated by both the periodic potential field and the magnetic field. Therefore, under a certain carrier density and magnetic field, the electronic state can be in multiple Bloch bands and multiple Landau levels simultaneously, forming a self-similar fractal energy level structure, which is shown as Hofstadter butterfly in the transport spectrum [
1,
2].
Without considering electron degeneracy, the electron density required to fill a Bloch band is
, where
A is the superlattice cell area corresponding to the periodic field. The electron density required to fill a Landau level is
, with
a non-superconducting magnetic flux quantum where.
h represents the Planck constant,
e is the individual electron charge, and
B denotes the magnetic field strength. The number of subbands
p and Bloch subbands
q in the Landau level can be determined as follows:
, where
Φ is the magnetic flux in the superlattice cell corresponding to the periodic potential field. Then
is the number of magnetic flux quanta that a magnetic field passes through the crystal surface area. For simplicity, we consider the magnetic field to be perpendicular to the crystal plane. For rational magnetic fields, if
, the band splits into
q subbands. ϕ happens to be a key parameter of Hofstadter’s butterfly diagram [
1].
To distinctly observe the fractal structure of Hofstadter butterfly in experiments, it is necessary to consider the relevant characteristic sizes. The modulation of electrons by periodic and magnetic fields corresponds to two characteristic lengths: the wavelength of periodic potential λ and the magnetic length , where The fractal energy spectrum can only be observed distinctly when λ and are of similar size.
In this study, we simulate and investigate using moiré wavelength based on the experimental results previously reported in Refs. [
16,
17]. In what follows, in the bilayer graphene/graphene superlattice system, the edge length of the triangular moiré wavelength is of 11 nm, and, in the single-sided fluorinated bilayer graphene system, the rectangular moiré wavelength is 13.8 nm long and 6.8 nm wide.
3. Moiré Wavelength Under Tight Binding Model
When calculating the energy dispersion relationship of triangular and rectangular moiré wavelengths using the tight binding model, the main consideration is the jump situation on the nearest neighbor moiré wavelength point [
19,
20]. The corresponding Hamiltonian of the tight binding model is
, where
i is the moiré wavelength point,
δ denotes the nearest neighbor bond,
and
are the annihilation and generation operator of electrons, respectively, at moiré wavelength
i, “c.c.” stands for complex conjugate,
t denotes the jump integral energy of electrons on the nearest neighbor, and
μ denotes chemical potential.
In this study, we employ periodic boundary conditions to simulate systems with periodic moiré modes. This choice allows us to simulate infinitely repetitive periodic structures, thereby better capturing the quantum behavior of electrons in periodic potential fields.
In the tight-binding model, t gives the probability of an electron transitioning between adjacent atoms or lattice points, or, in other words, the energy of an electron jumping from one lattice point to another. This parameter is a key parameter in the model, which directly affects the band structure and electron dispersion relationship. In the following statements, it is expressed as unit energy 1, i.e., t = 1. We set t = 1 to simplify the expression of the Hamiltonian and subsequent calculations, concentrating the system’s characteristics on other physical variables, making the model easier to handle and observe while still capturing the fundamental characteristics of electronic behavior. In solid-state physics, energy is typically considered on a relative scale. Setting t to 1 allows energy to be expressed relative to this jump integral, which can be more generally applied to various different systems, simplifying the comparison and analysis of energy levels.
In the following, we set μ = 0. The reason for setting the chemical potential μ = 0 is similar to the jump integral, with the main purpose of simplifying the model and calculations. The chemical potential determines the position of the Fermi level, which in turn affects the filling of electrons. When the chemical potential changes, the position of the Fermi level in the energy band also changes, which directly affects the distribution of electrons and the energy dispersion relationship. For example, if the chemical potential increases (i.e., the Fermi level rises), more electrons are filled to higher energy levels, which can cause changes in the distribution of electrons in the energy band, thereby affecting the shape of the energy dispersion diagram. The density of states describes the number of available quantum states at a specific energy. The position of the chemical potential affects the peak position and shape of the density of states. For example, if the chemical potential approaches the edge of a certain energy band, the density of states near that energy may increase because more electrons are filled into that energy band. In addition, changes in chemical potential can also cause the peak of the density of states to shift, reflecting changes in electron distribution.
After performing the Fourier transform, the energy dispersion relationship is obtained as , where k is the wave vector in reciprocal space.
3.1. Triangular Moiré Wavelength
As shown in
Figure 1a, the 2D triangular moiré wavelength is a simplified model with a periodicity of 11 nm. The energy dispersion relationship of the triangular moiré wavelength in the absence of a magnetic field can be obtained from the Hamiltonian of tight binding approximation:
[
21], where
is the moiré wavelength and
kx and
ky are the two wave vector components in the reciprocal space. The energy dispersion diagram of the equation is shown in
Figure 1b.
As shown in
Figure 1b, the energy dispersion relationship is symmetric with respect to
k = 0 in the simplified Brillouin zone, but asymmetric with respect to the energy
E = 0. The range of energy values corresponding to the energy band is [−6, 3], and the bandwidth is 9. The expression for the density of states is
, where
η is infinitesimal quantity, here set to
η = 0.01 [
21,
22], and
is the Dirac delta.
The density of states graph is shown in
Figure 1c with a bottom
E = −6, and the peak of the density of states is at
E = 2. This peak is a Van Hove singular peak, which originates from the accumulation of electronic states at a specific wave vector when the band structure undergoes a curvature transition, forming a characteristic peak in the density of states curve. The density of states graph is not symmetric about
E = 0 due to dispersion symmetry in the
kx and −
kx directions, but energy is asymmetric with respect to
E = 0 in the
ky direction due to the asymmetry of the trigonometric term.
The Hofstadter butterfly of the triangular moiré wavelength is given in
Figure 1d and shows a set of Landau energy bands and definite patterns of Landau energy level aggregation, similar to the Hofstadter butterfly of tightly binding electrons in a 2D square moiré wavelength. The bandgap structure-shaped energy spectrum has fractal characteristics, but the overall energy spectrum structure undergoes deformation. Through MATLAB R2022a software calculation, the fractal dimension of the square moiré wavelength is 1.8569, while that of the triangular moiré wavelength is 1.7960. Compared with the Hofstadter butterfly of the square moiré wavelength, the triangular moiré wavelength’s Hofstadter butterfly exhibits more pronounced deformation features. This is due to the triple symmetry of the triangular lattice and the magnetic-field induced Landau quantization interaction, which breaks the quadruple symmetry constraint of the square lattice. When magnetic flux passes through lattice units, the solution to the Harper equation generates more complex fractal branches due to reduced symmetry, resulting in a decrease in fractal dimension and intensified spectral deformation.
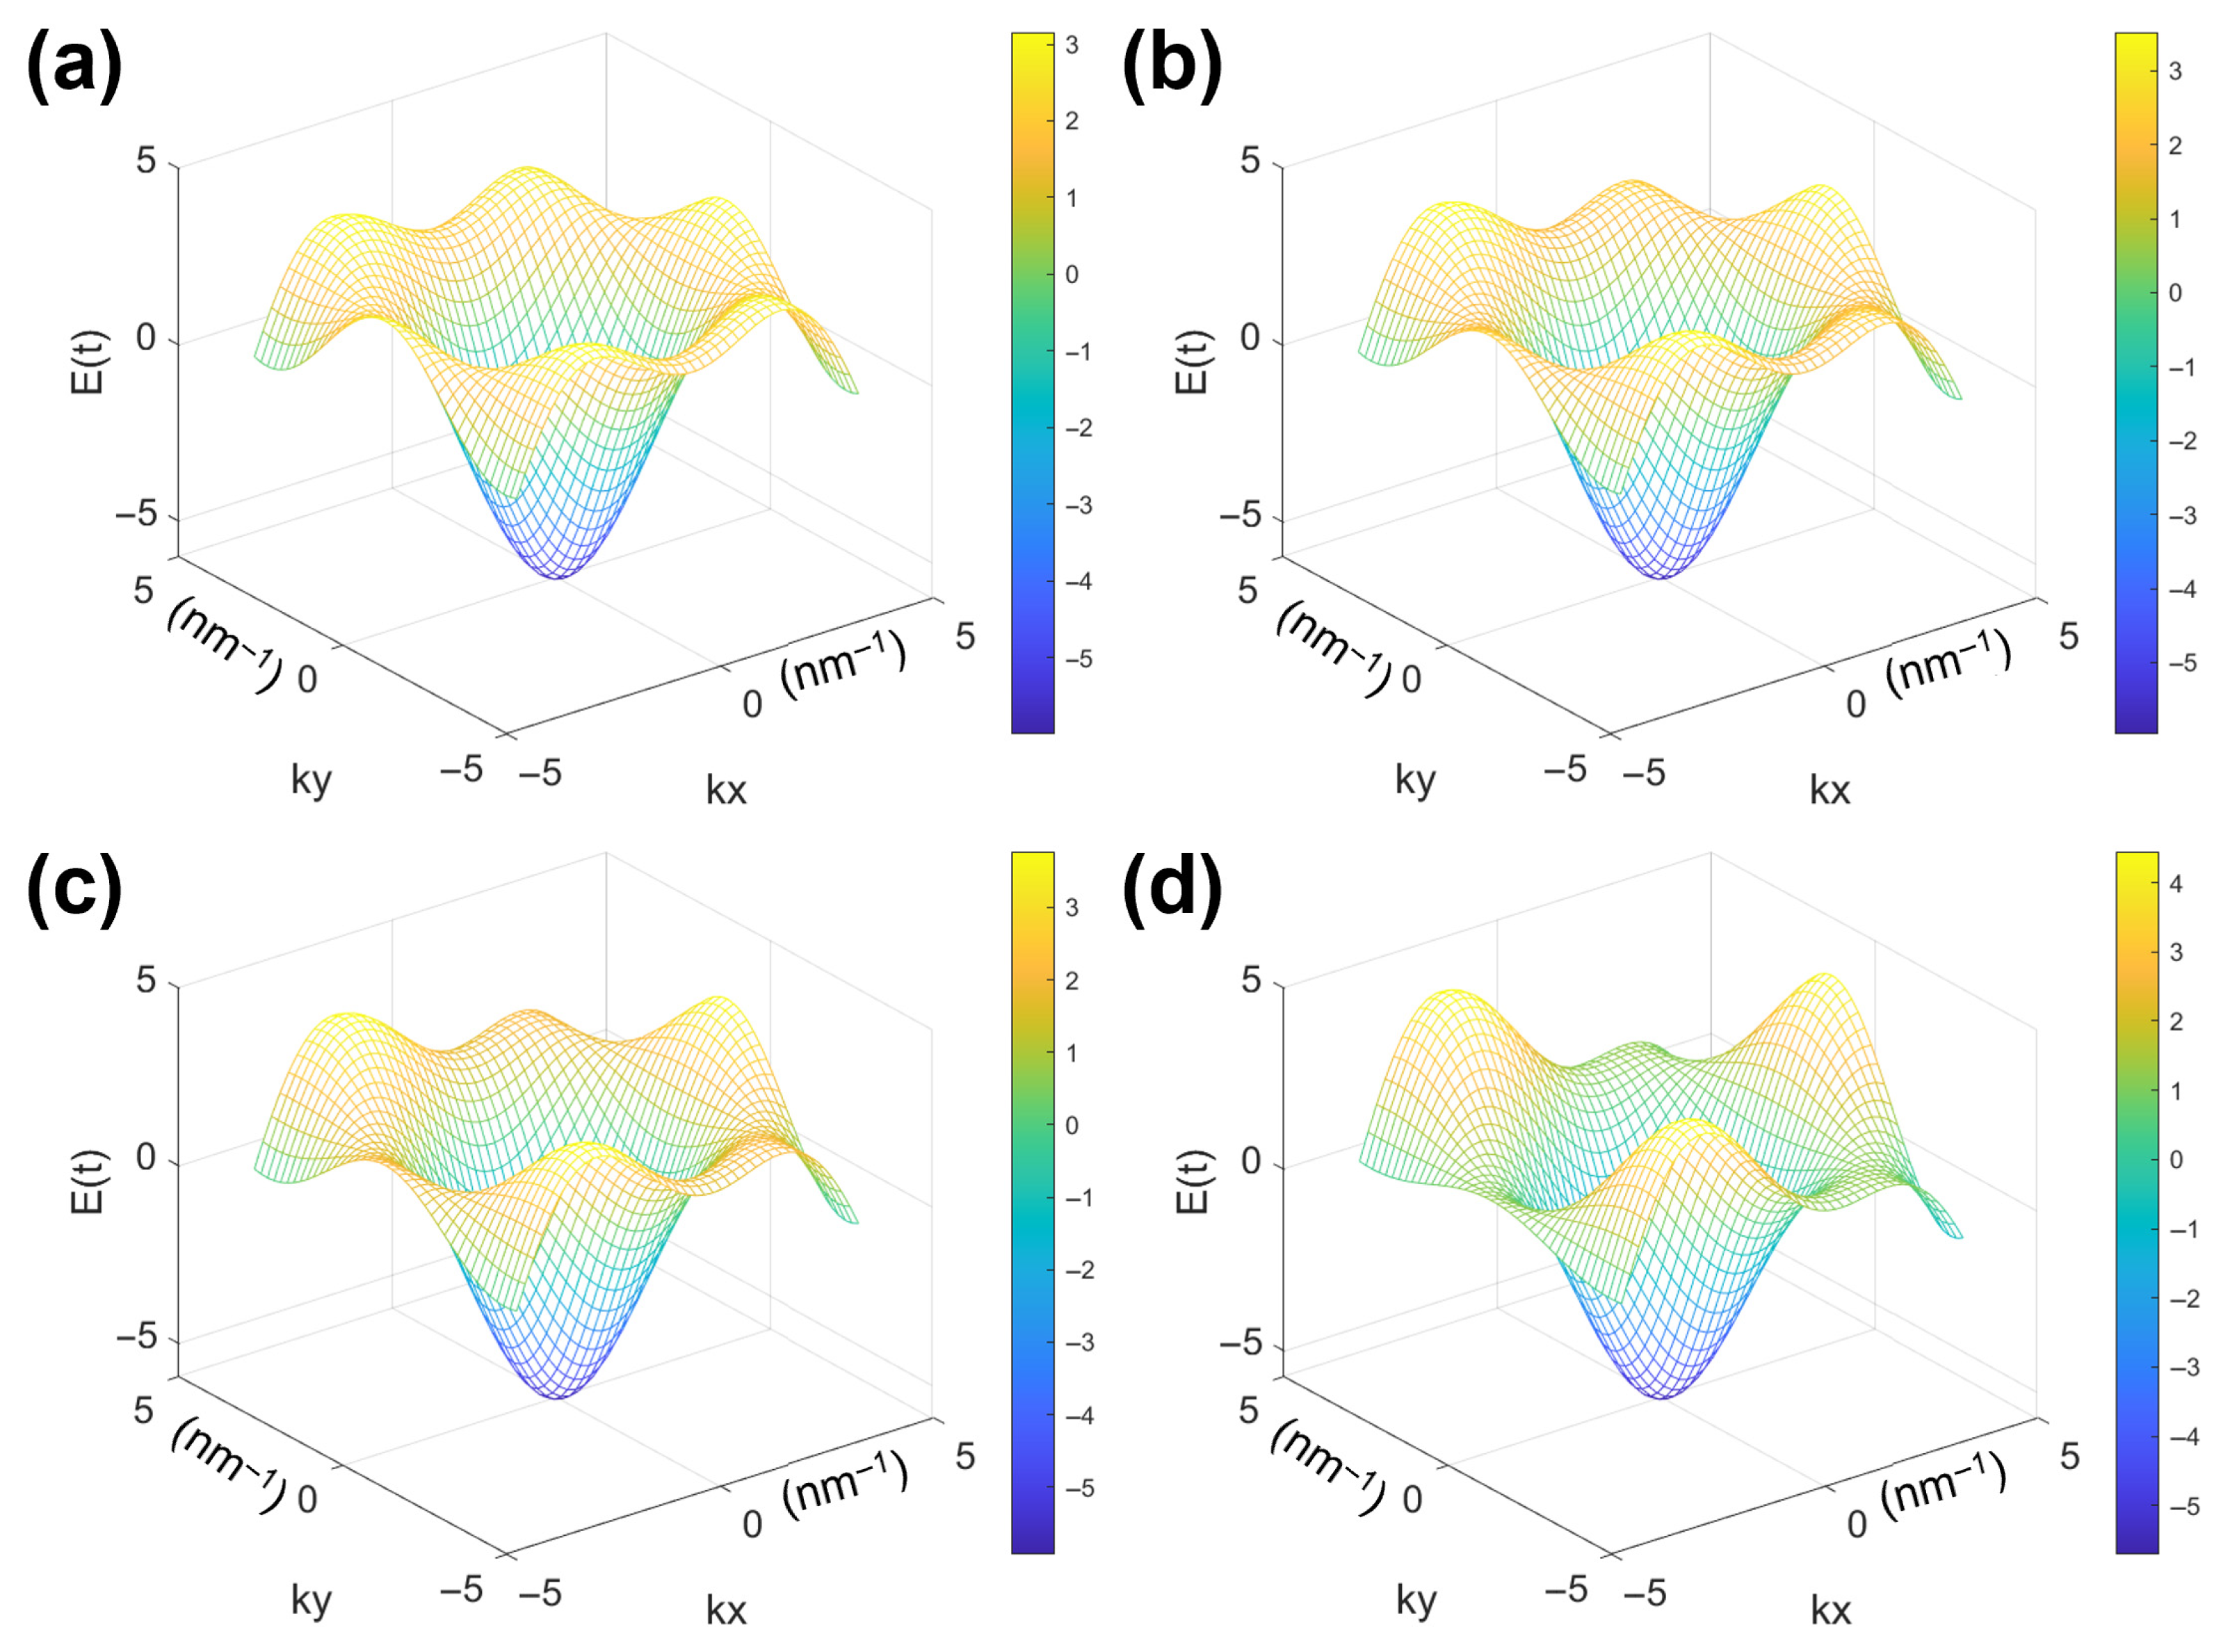
When a triangular moiré wavelength is subjected to an alternating magnetic field, the energy dispersion relationship obtained from the tightly binding Hamiltonian approximation becomes
[
21]. When the staggered magnetic field
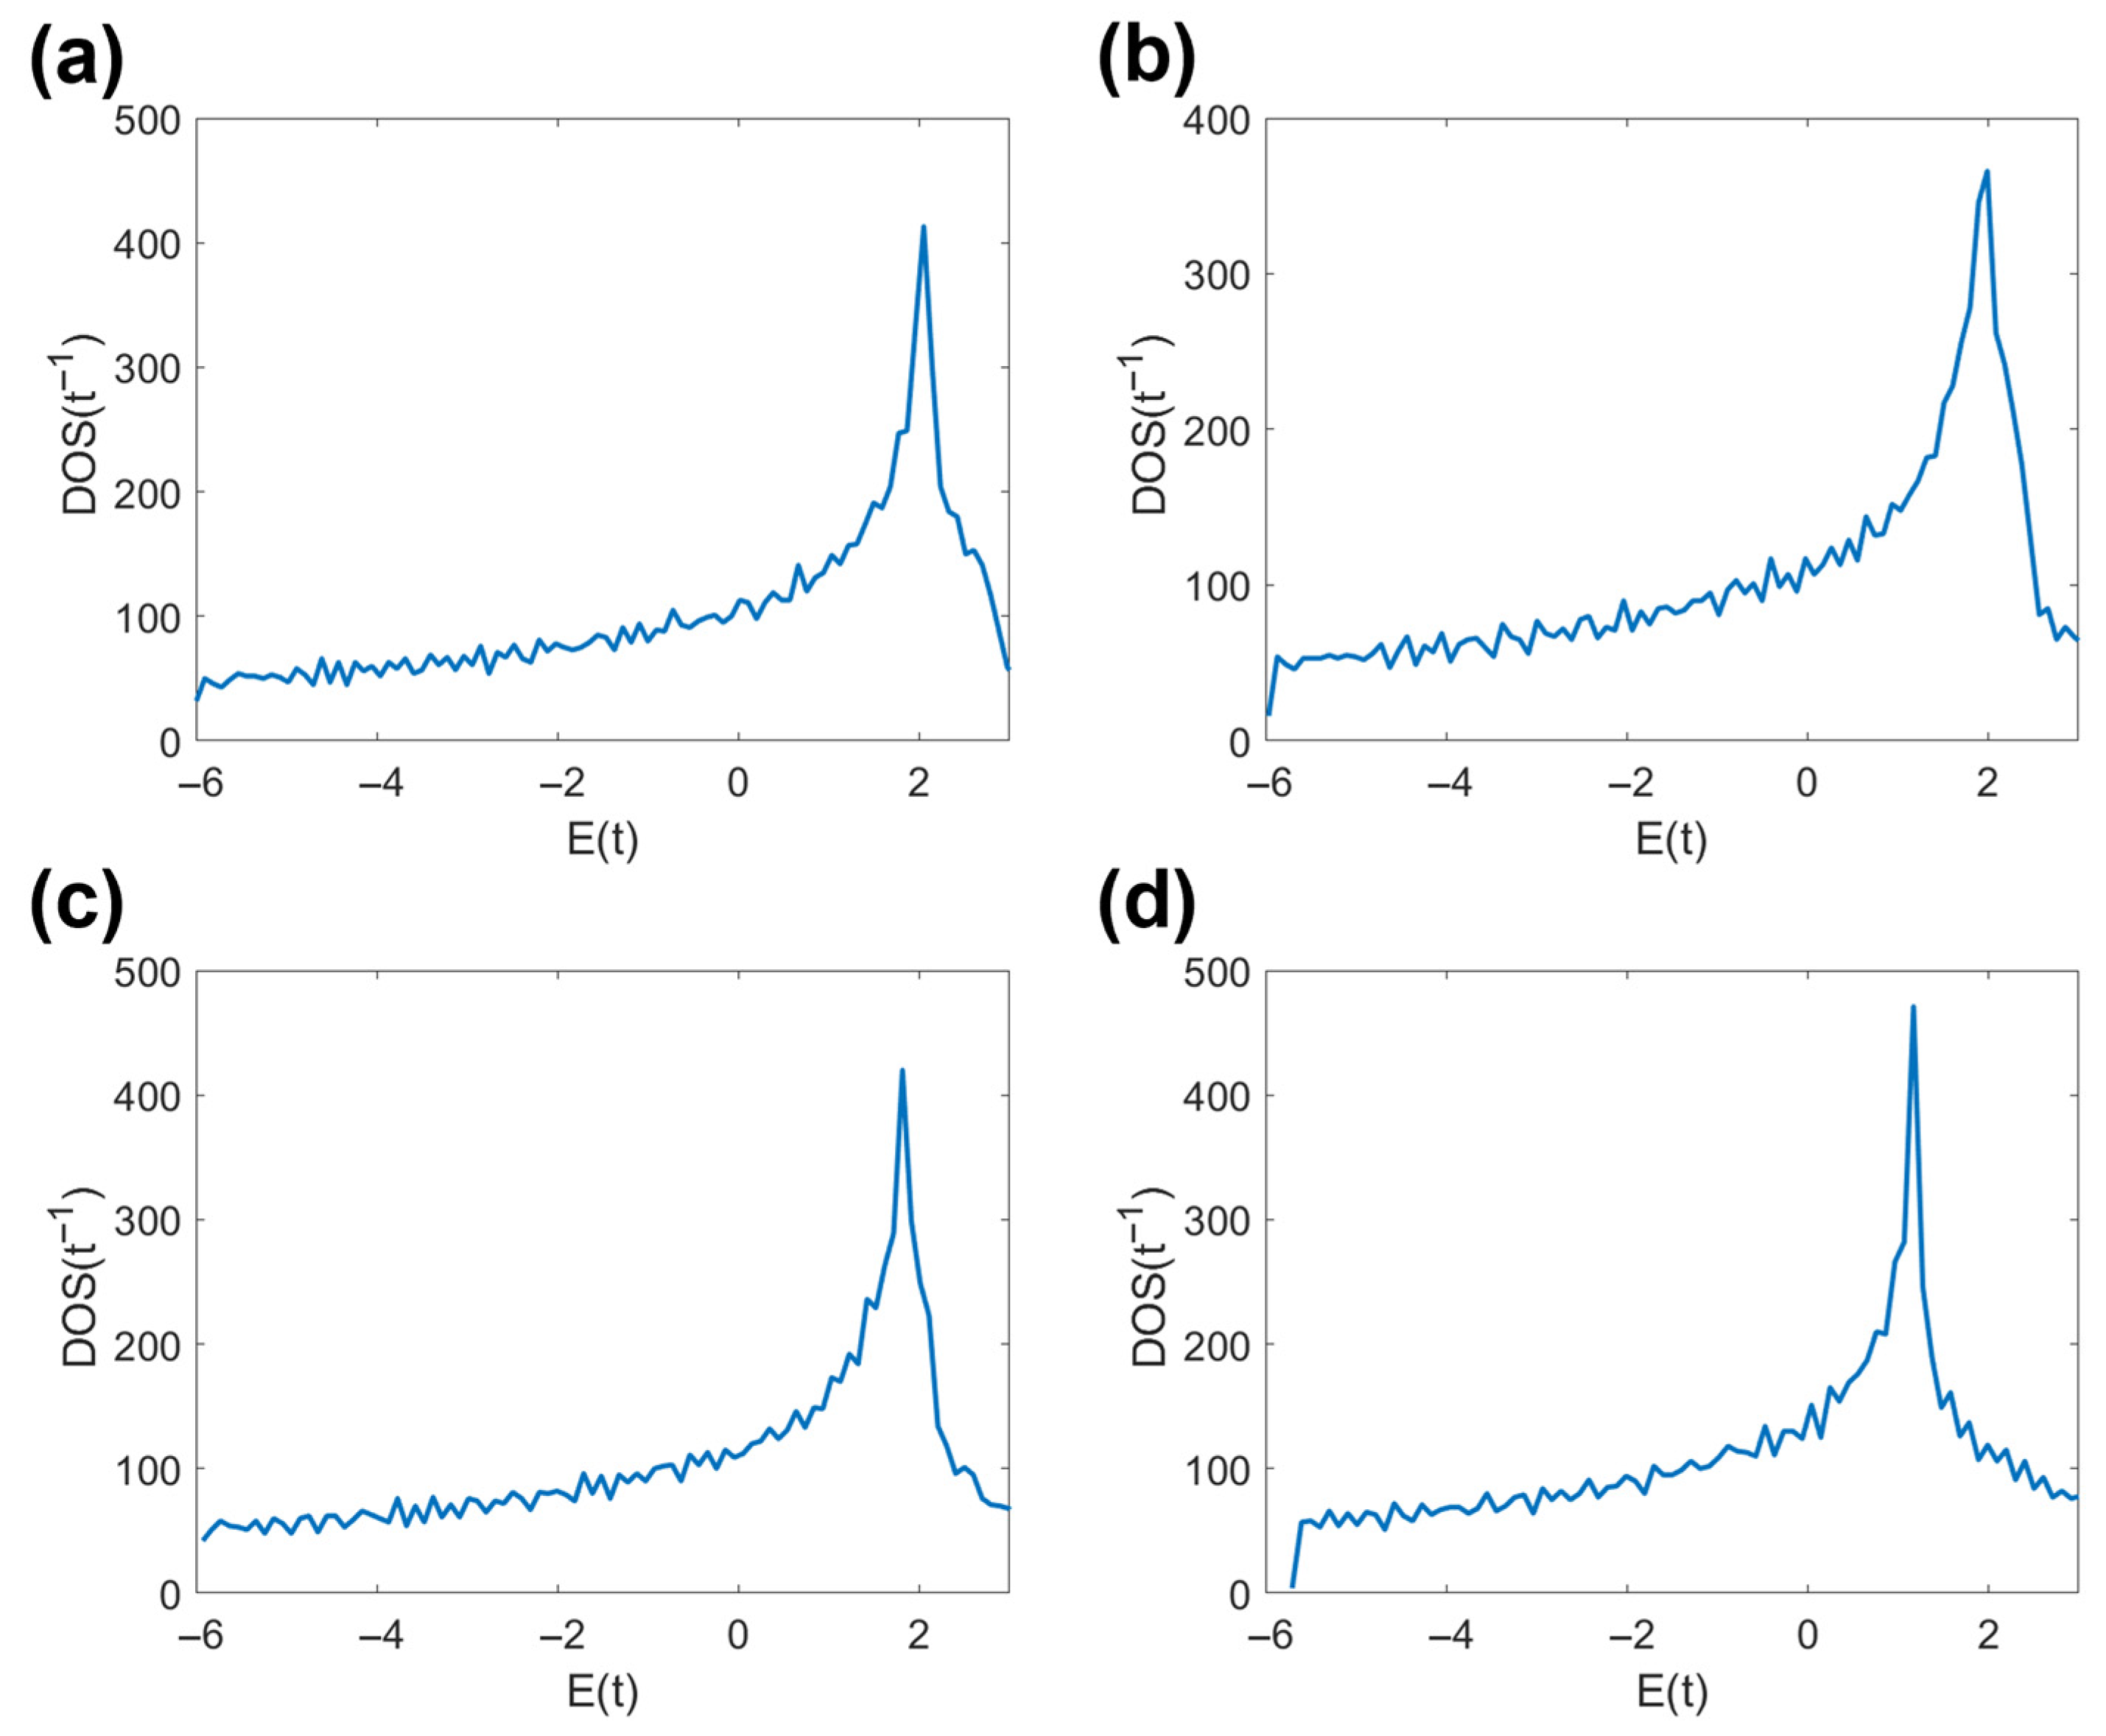
gradually increasing from 0.03π to 0.3π, the energy dispersion relationship and density of states are shown in
Figure 2 and
Figure 3, respectively. The energy dispersion relationship diagram in
Figure 2 is projected in the
kx direction, and it can be observed that, due to the influence of the magnetic field, the energy dispersion relationship in the simplified Brillouin zone changes from symmetric about
k = 0 to asymmetric. As shown in
Figure 3, the density of states plots is not symmetric about
E = 0, and as the magnetic field intensity increases, the peaks of the density of states plots become sharper and the bandwidth somewhat increases. This phenomenon occurs due to the introduction of phase factors
and
under an alternating magnetic field, breaking the original symmetry of the lattice and causing the probability of electron transitions to exhibit anisotropy. When the magnetic field is enhanced, the magnetic length
lB decreases, the Landau energy level splitting intensifies, and the electronic state transitions from a continuous distribution to a discrete energy level, resulting in a sharp peak in the density of states.
3.2. Rectangular Moiré Wavelength
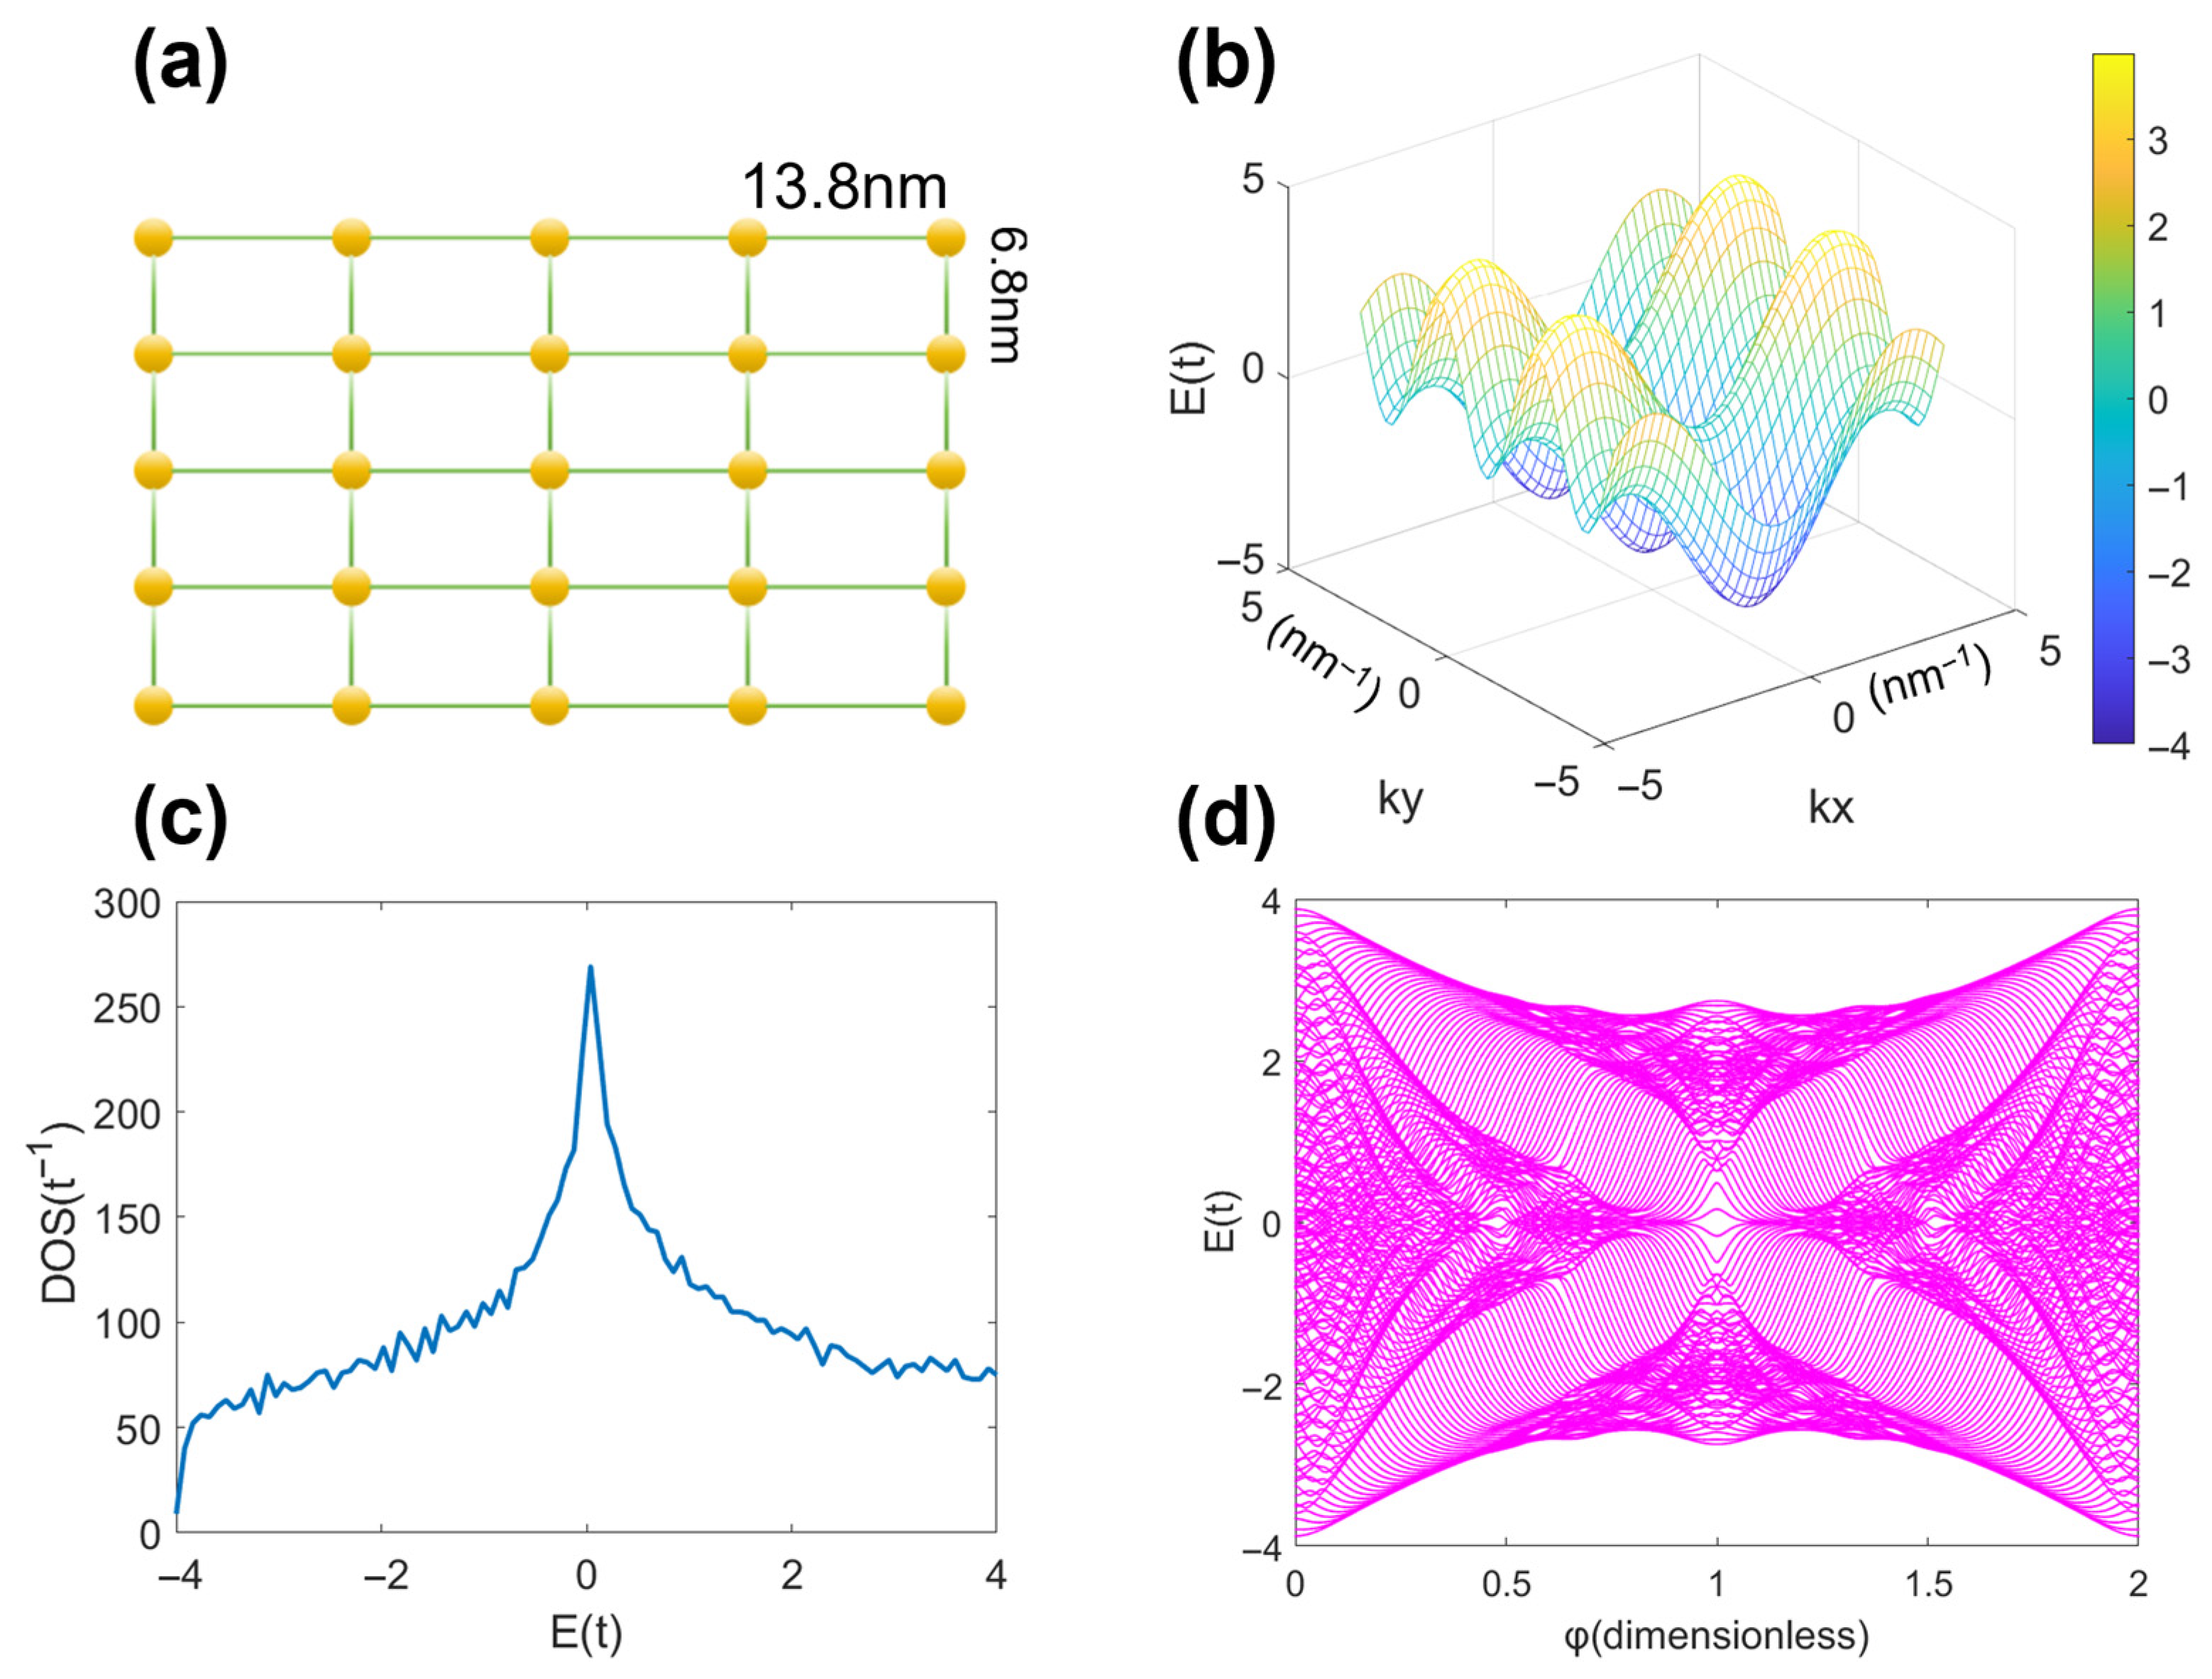
As shown in
Figure 4a, the case of a 2D rectangular moiré wavelength is similar to that of a 2D square moiré wavelength.
Figure 4a shows a simplified model of rectangular moiré wavelength, with a length of 13.8 nm and a width of 6.8 nm. A dispersion relationship
[
21] when no magnetic field is applied. Here, both
a and
b are the moiré wavelength and
kx and
ky are the two wave vectors in the inverted space. The energy dispersion diagram of a rectangular moiré wavelength with corresponding aspect ratios can be obtained as shown in
Figure 4b.
We use the same formula and method as for he triangular moiré wavelength considered above to calculate the density of states of the rectangular moiré wavelength, and the value of
η is also the same as the triangular moiré wavelength, which is 0.01, for the convenience of subsequent comparison. The density of states is shown in
Figure 4c, with a bottom
E = −4 and a peak density of states near
E = 0. It can be seen that the density of states graph is not symmetric about
E = 0. This is because the aspect ratio of the rectangular moiré wavelength (13.8 nm × 6.8 nm) is close to 2:1, and there are differences in the transition intensity of electrons in the
x- and
y-directions in the tight binding model. The anisotropy leads to different periods in the
x- and
y-directions, resulting in differences in the oscillation frequency of energy dispersion in the two directions, forming an asymmetric “hump” structure. The peak of the density of states is close to
E = 0 due to the symmetry of the rectangular lattice being closer to a square shape, and the accumulation of the density of states of electrons near the Fermi surface
E = 0 is more significant.
As depicted in
Figure 4d, the Hofstadter butterfly of a rectangular moiré wavelength shows a number of Landau sub-energy bands and definite patterns of Landau energy-level aggregation. The overall energy spectrum structure is highly similar to the Hofstadter butterfly of tightly binding electrons in a 2D square moiré wavelength, and the bandgap structure-shaped energy spectrum also has distinct fractal characteristics. Through MATLAB calculations, the fractal dimension of the square moiré wavelength is 1.8569, while that of the rectangular moiré wavelength is 1.8917. Compared with the Hofstadter butterfly of the square moiré wavelength, the rectangular moiré wavelength’s Hofstadter butterfly exhibits relatively smaller deformation. This is because the aspect ratio of the rectangular lattice is close to one, preserving the approximate quadruple symmetry of the square lattice. The magnetic-field induced splitting of Landau energy levels and the coupling of lattice periodicity are closer to the law of square lattices, and the fractal structure has stronger self-similarity, so the fractal dimension is closer to a square system. The low symmetry of triangular lattices leads to more complex coupling with magnetic fields and sparser fractal structure branches (lower fractal dimension). Rectangular lattices have fractal structures that are closer to ideal square lattices due to their approximate square symmetry.
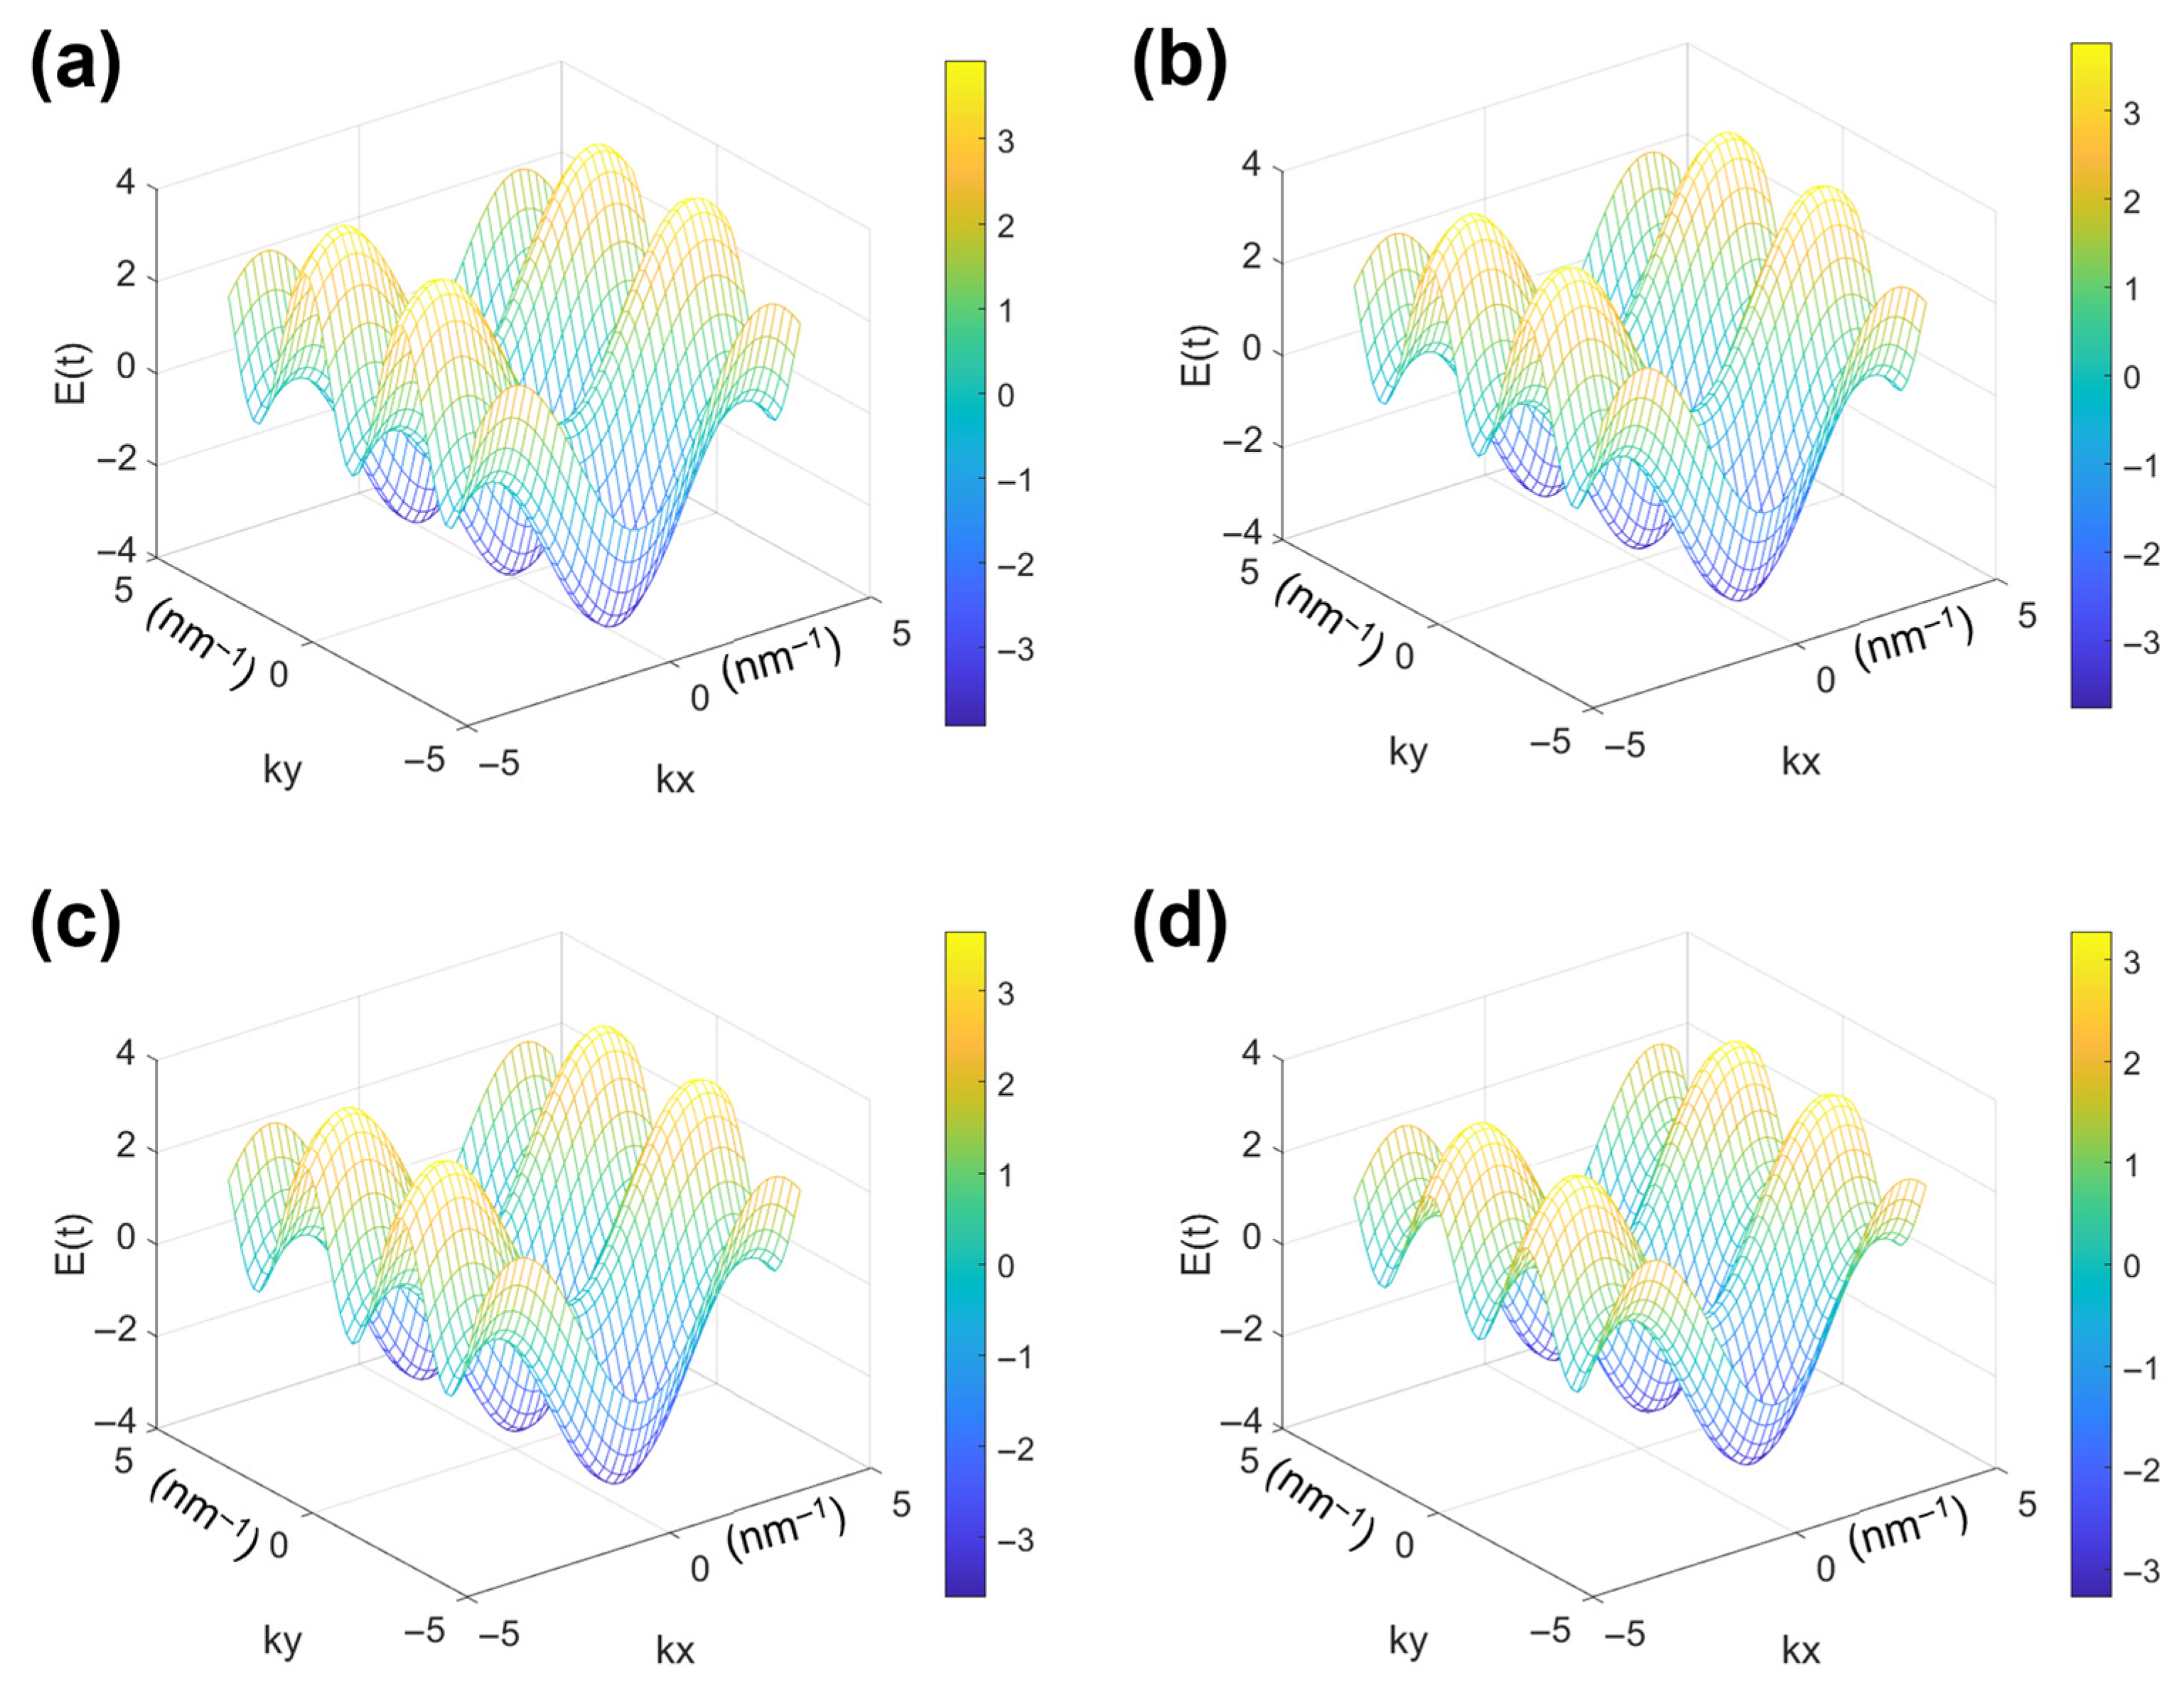
Using the same method, the energy dispersion relationship of a rectangular moiré wavelength under the action of magnetic field can be obtained.
Figure 5 shows the energy dispersion relationship diagrams as the alternating magnetic field Δ
ϕ gradually increases from 0.03π to 0.3π. The energy changes with the wave vector in a “hump” or “wave” shape, and the appearance of multiple peaks and valleys is due to periodicity, with the Fermi surface always at
E = 0. This is because the anisotropy of the rectangular lattice results in varying modulation strengths of the magnetic field in different directions, but overall symmetry remains strong. When the magnetic field is enhanced, the magnetic length
decreases, the Landau energy level spacing increases, and the electronic states are bound in discrete energy levels, resulting in the peak density of states splitting and the spacing widening. The Fermi surface remains at
E = 0 due to the setting of chemical potential
μ = 0, ensuring that electron filling always follows the Fermi surface as the boundary.
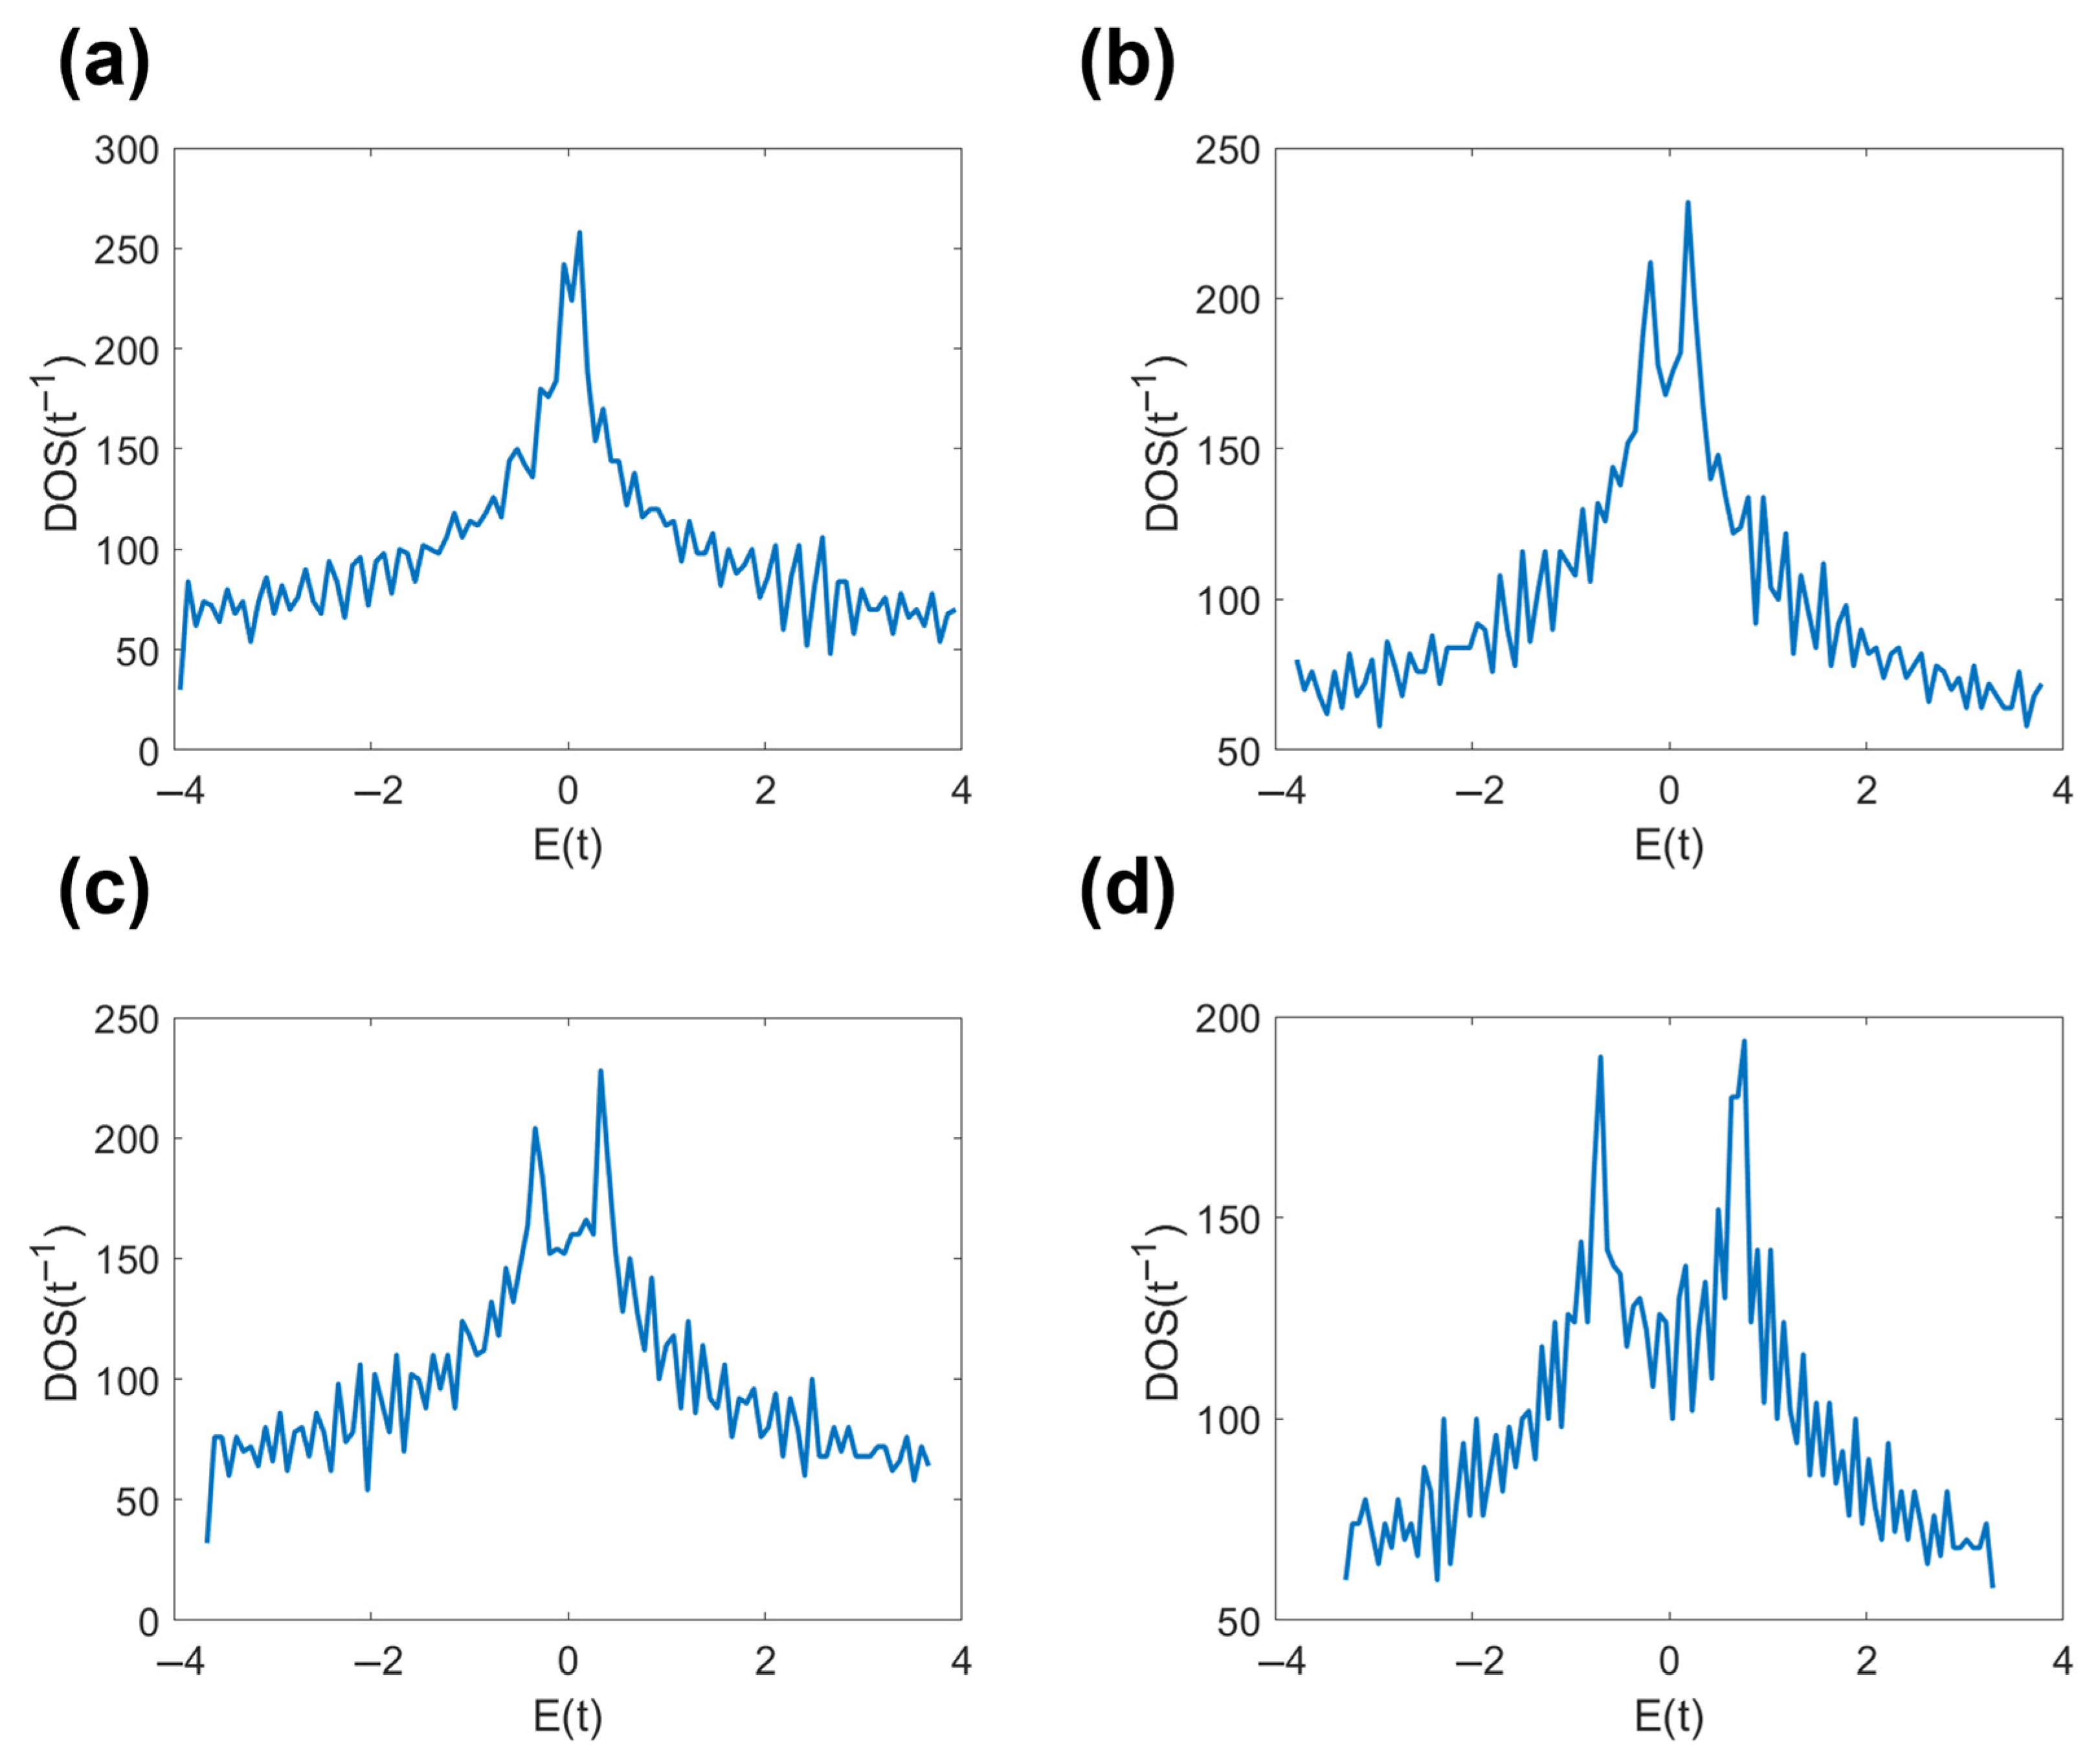
Figure 6 shows that under different alternating magnetic fields, the splitting of Landau energy levels leads to splitting of electronic states in terms of energy, resulting in significant changes in the density of states curve. Specifically, the original continuous band structure is divided into multiple discrete energy levels which exhibit a series of peaks on the density of states curve. These peaks represent the electron density of states at different Landau energy levels, and the gaps between energy levels correspond to the energy required for electrons to undergo different Landau transitions. At lower magnetic field strengths, the density of states curve shows a relatively gentle change and some broad peaks, indicating that in weaker magnetic fields, the distribution of electronic states is relatively continuous and the spacing between energy levels is small. As the magnetic field strength increases, the energy difference between each Landau level also increases. This is reflected in the state density curve, where the interval between peaks gradually increases with the increase in magnetic field. Meanwhile, one also observes that the peak gradually became sharper and more segmented structures appeared. This indicates that the enhancement of the magnetic field leads to a redistribution of electronic states, and there is a noticeable splitting of energy levels. At the highest magnetic field strength of 0.3π, the peak of the density of states curve is found to be the sharpest, and the interval between the peaks further increases. This shows that a strong magnetic field has a significant impact on the distribution of electronic states, resulting in highly discretized energy levels.
Compared with
Figure 3 of the triangular moiré wavelength, the density of state images exhibit a trend of change from gentle to sharp under the action of a magnetic field, indicating that the distribution of electronic states has undergone a transition from continuous to discrete. However, due to the different geometric structures, the response of rectangular moiré wavelength in a magnetic field has its unique characteristics. At the same magnetic field strength, there are differences in the peak positions and intervals of the density of states curves of triangular and rectangular moiré wavelengths. The sharpening of the peak of the density of states in a triangle is more significant due to the higher sensitivity of electronic states to magnetic fields under triple symmetry. The energy level splitting of rectangles is more distinct, and due to weaker anisotropy, Landau quantization is more regular. This reflects the different effects of the two geometric structures on the distribution of electronic states.
4. Conclusions
In this paper, we have systematically studied the electronic structural characteristics of triangular (11 nm) and rectangular (13.8 nm × 6.8 nm) moiré patterns using a tight binding model. The focus was on analyzing the energy dispersion relationship, density of states, and the evolution of Hofstadter butterflies under different magnetic fields. Finally, it is found that under zero magnetic field, the energy dispersion relationship of triangular moiré patterns is symmetric about k = 0 but asymmetric about E = 0, with an energy range of [−6, 3], and a significant Van Hove singular peak in the density of states which appears at E = 2. The energy dispersion of rectangular moiré patterns exhibits an anisotropic “hump” structure, with a peak density of states close to E = 0, which is closer to the characteristics of a square lattice.
The fractal characteristics of Hofstadter butterfly show that the fractal dimension of the triangular structure is 1.7960, significantly lower than that of the square lattice (1.8569), and the energy spectrum deformation is obvious. The fractal dimension of the rectangular structure is 1.8917, which is closer to a square lattice and reflects stronger symmetry. Under the action of an alternating magnetic field (Δϕ increased from 0.03π to 0.3π), the symmetry of the energy dispersion curve of the triangular moiré pattern is disrupted, and the peak density of states shows a more significant sharpening trend with the enhancement of the magnetic field. The rectangular structure exhibits more straightforward Landau energy level splitting characteristics, with the energy level spacing expanding with increasing magnetic field strength.
The results obtained reveal the key regulatory role of geometric symmetry on the electronic behavior of moiré superlattices: the triple symmetry of triangles makes fractal structures more susceptible to magnetic field disturbances, while the approximate quadruple symmetry of rectangles makes their electronic state evolution closer to the square lattice law. This study is believed to provide a new perspective for understanding quantum fractal phenomena in low dimensional materials, as well as provides a theoretical references for the design of quantum devices based on moiré superlattices, such as quantum Hall effect devices and fractal optical elements.
