Article

Present Status of Spectroscopy of the Hyperfine Structure and Repolarization of Muonic Helium Atoms at J-PARC

1
Department of Physics, Nagoya University, Furo-cho, Chikusa-ku, Nagoya 464-8601, Japan
2
High Energy Accelerator Research Organization (KEK), 1-1 Oho, Tsukuba, Ibaraki 305-0801, Japan
3
Kobayashi-Maskawa Institute, Nagoya University, Furo-cho, Chikusa-ku, Nagoya 464-8601, Japan
4
Advanced Science Research Center, Japan Atomic Energy Agency (JAEA), 2-4 Shirane Shirakata, Tokai-mura, Naka-gun, Ibaraki 319-1195, Japan
5
Department of Physics, Ibaraki University, Ibaraki 310-8512, Japan
6
School of Science, The University of Tokyo, 7-3-1 Hongo, Bunkyo, Tokyo 113-0033, Japan
*
Authors to whom correspondence should be addressed.
Current affiliation: Department of Physics, Niigata University, 8050 Ikarashi 2-no-cho, Nishi-ku, Niigata 950-2181, Japan.
Physics 2024, 6(2), 877-890; https://doi.org/10.3390/physics6020054
Submission received: 29 February 2024 / Revised: 26 March 2024 / Accepted: 29 April 2024 / Published: 12 June 2024
(This article belongs to the Special Issue Precision Physics and Fundamental Physical Constants (FFK 2023))

Abstract

:
The mass  m μ  of the negative muon is one of the parameters of the elementary particle Standard Model and it allows us to verify the CPT (charge–parity–time) symmetry theorem by comparing  m μ  value with the mass  m μ +  of the positive muon. However, the experimental determination precision of  m μ  is  3.1 ppm , which is an order of magnitude lower than the determination precision of  m μ +  at  120 ppb . The authors aim to determine  m μ  and the magnetic moment  μ μ  with a precision of  O ( 10 ppb )  through spectroscopy of the hyperfine structure (HFS) of muonic helium-4 atom  ( 4 He μ e )  under high magnetic fields.  He 4 μ e  is an exotic atom where one of the two electrons of the  He 4  atom is replaced by a negative muon. To achieve the goal, it is necessary to determine the HFS of  He 4 μ e  with a precision of  O ( 1 ppb ) . This paper describes the determination procedure of the HFS of  He 4 μ e  in weak magnetic fields reported recently, and the work towards achieving the goal of higher precision measurement.

1. Introduction

The muonic helium atom  ( 4 He μ e )  consists of a  He 4  atom where one of its two electrons is replaced by a negative muon. The production of muonic helium atoms involves forming the  ( 4 He μ ) +  ion through the capture of a muon by a  He 4  atom and transitions to the ground state by ejecting both electrons through Auger and radiative transitions [1]. The electron binding energy of the  ( 4 He μ ) +  ion, which is similar to that of hydrogen (13.6 eV [2]), requires a charge exchange with another atom that acts as an electron donor, such as Xe or  CH 4 , to form a muonic helium atom. Since the orbital radius of the negative muon is approximately 400 times smaller than the Bohr radius due to the mass of muon and the doubly charged  He 4  nucleus, the  ( 4 He μ ) +  ion can be dealt with as a pseudo-nucleus with a magnetic moment equal to a negative muon [3]. Thus, the  He 4 μ e  atom is regarded as a heavy hydrogen isotope, similar to muonium, which is a purely leptonic system comprising a positive muon and an electron. The ground-state hyperfine structure (HFS) of the muonic helium atom arises from the interaction between the magnetic moments of the electron and the negative muon. The HFS of the muonic helium atom is similar to that of muonium and can be measured using the same apparatus and techniques as those for muonium’s ground-state HFS [4,5,6]. As a three-body system, the muonic helium atom’s HFS serves as a precise probe for testing and refining the theory of quantum three-body systems [7]. High magnetic field measurements also enable the precise determination of the magnetic moment and mass of the negative muon, and facilitate tests of the CPT theorem through a comparison with the positive muon.
New precise measurements of the ground-state HFS of the muonic helium atom are in progress at the Japan Proton Accelerator Research Complex (J-PARC) Muon Science Establishment (MUSE) D-line and the newest result with a precision of 4.5 ppm at zero field has been reported [3]. This uncertainty is still primarily statistical. The significant statistical uncertainty stems not only from beam intensity but also from the loss of muon spin polarization (from approximately 100% to about 6%) due to Auger transitions and Stark mixing during the formation of muonic helium atoms [1,8,9,10,11,12].

2. Theoretical Backgrounds of the Experiment

2.1. Breit–Rabi Equation

The spin Hamiltonian for the ground-state muonium and muonic helium atoms in a static magnetic field  B  is given by
H = h Δ ν I · J + μ B g J J · B μ μ g μ I · B ,
where h is the Planck constant,  h Δ ν  represents the HFS,  I  and  J  are the spin operators of the muon and the electron,  μ B  and  μ μ  are the magnitudes of the magnetic moments of the electron and muon, and  g J  and  g μ  are the g factors of the bound electron and the muon, respectively. The Breit–Rabi equation that gives the eigenenergies for each spin eigenstate in Equation (1) is obtained as the function
E F = 1 2 ± 1 2 , m F = h Δ ν 4 m F μ μ g μ B 0 ± h Δ ν 2 1 + 2 m F x + x 2 ,
where  B = ( 0 , 0 , B 0 ) ,
x = g J μ B + g μ μ μ h Δ ν B 0 , s = 1 2 1 x 1 + x 2 1 / 2 , c = 1 2 1 + x 1 + x 2 1 / 2 ,
and F and  m F  represent, respectively, the total spin and its z-component of the atom. The energy eigenstates of hydrogen-like atoms are classified by  | F , m F  as
| 1 , | 2 , | 3 , | 4 = | 0 , 0 , | 1 , 1 , | 1 , 0 , | 1 , 1 .
In the case of a muonic helium atom, it is essential to note that  Δ ν < 0  and  μ μ < 0 . From Equation (2), for a muonic helium atom, by replacing  Δ ν  by  Δ ν  and  μ μ  by  μ μ :
ν 12 + ν 34 Δ ν ,                                                                                                                        
μ μ μ p = 2 ν 12 ν 34 + ν 34 ν 12 r e ν p ν p 2 r e ν p ν 34 ν 12 · g μ g μ ,
where
r e = μ e μ p = g J μ B 2 μ p
and  ν 12  and  ν 34  are the energy differences between the sublevels  ( | 1 , | 2 )  and  ( | 3 , | 4 ) , respectively; having the same sign change in energy with respect to the magnetic field.  ν p  is the free proton NMR frequency which is proportional to  B 0 . As long as the second-order perturbations are ignored, states without orbital angular momentum do not change their eigenenergy due to the electric field; that is, the electric field can be neglected.

2.2. Resonance Curve

In muonium and muonic helium HFS measurements, the resonance curve is obtained by the difference in the emitted direction distribution of decay positrons or decay electrons with and without applying a microwave field. The number of secondary particles detected by any detector between time  t 1  and  t 2  is denoted as  N ON t  for the case with microwaves, and  N OFF t  with no microwaves defining the asymmetry signal quantity S:
S ( t ) = N ON ( t ) N OFF ( t ) 1 .
Following the method of Refs. [13,14,15],  S ( t 1 , t 2 )  in a weak magnetic field is:
S t 1 , t 2 = P A 2 ( y 0 ) cos θ A 1 y 0 P 2 A 2 y 0 cos θ · γ exp γ t 1 exp γ t 2 L t 1 , t 2 ,
where
L t 1 , t 2 = Γ Δ ω Γ · Γ + Δ ω 2 sin Γ + Δ ω 2 t γ cos Γ + Δ ω 2 t Γ + Δ ω 2 + 4 γ 2 + Γ + Δ ω Γ · Γ Δ ω 2 sin Γ Δ ω 2 t γ cos Γ Δ ω 2 t Γ Δ ω 2 + 4 γ 2 + 1 2 γ exp γ t t 1 t 2 ,
Γ = Δ ω 2 + 8 | b | 2 , | b | = 1 4 c g S μ B s g μ μ μ 2 B x 2 + B y 2 ,
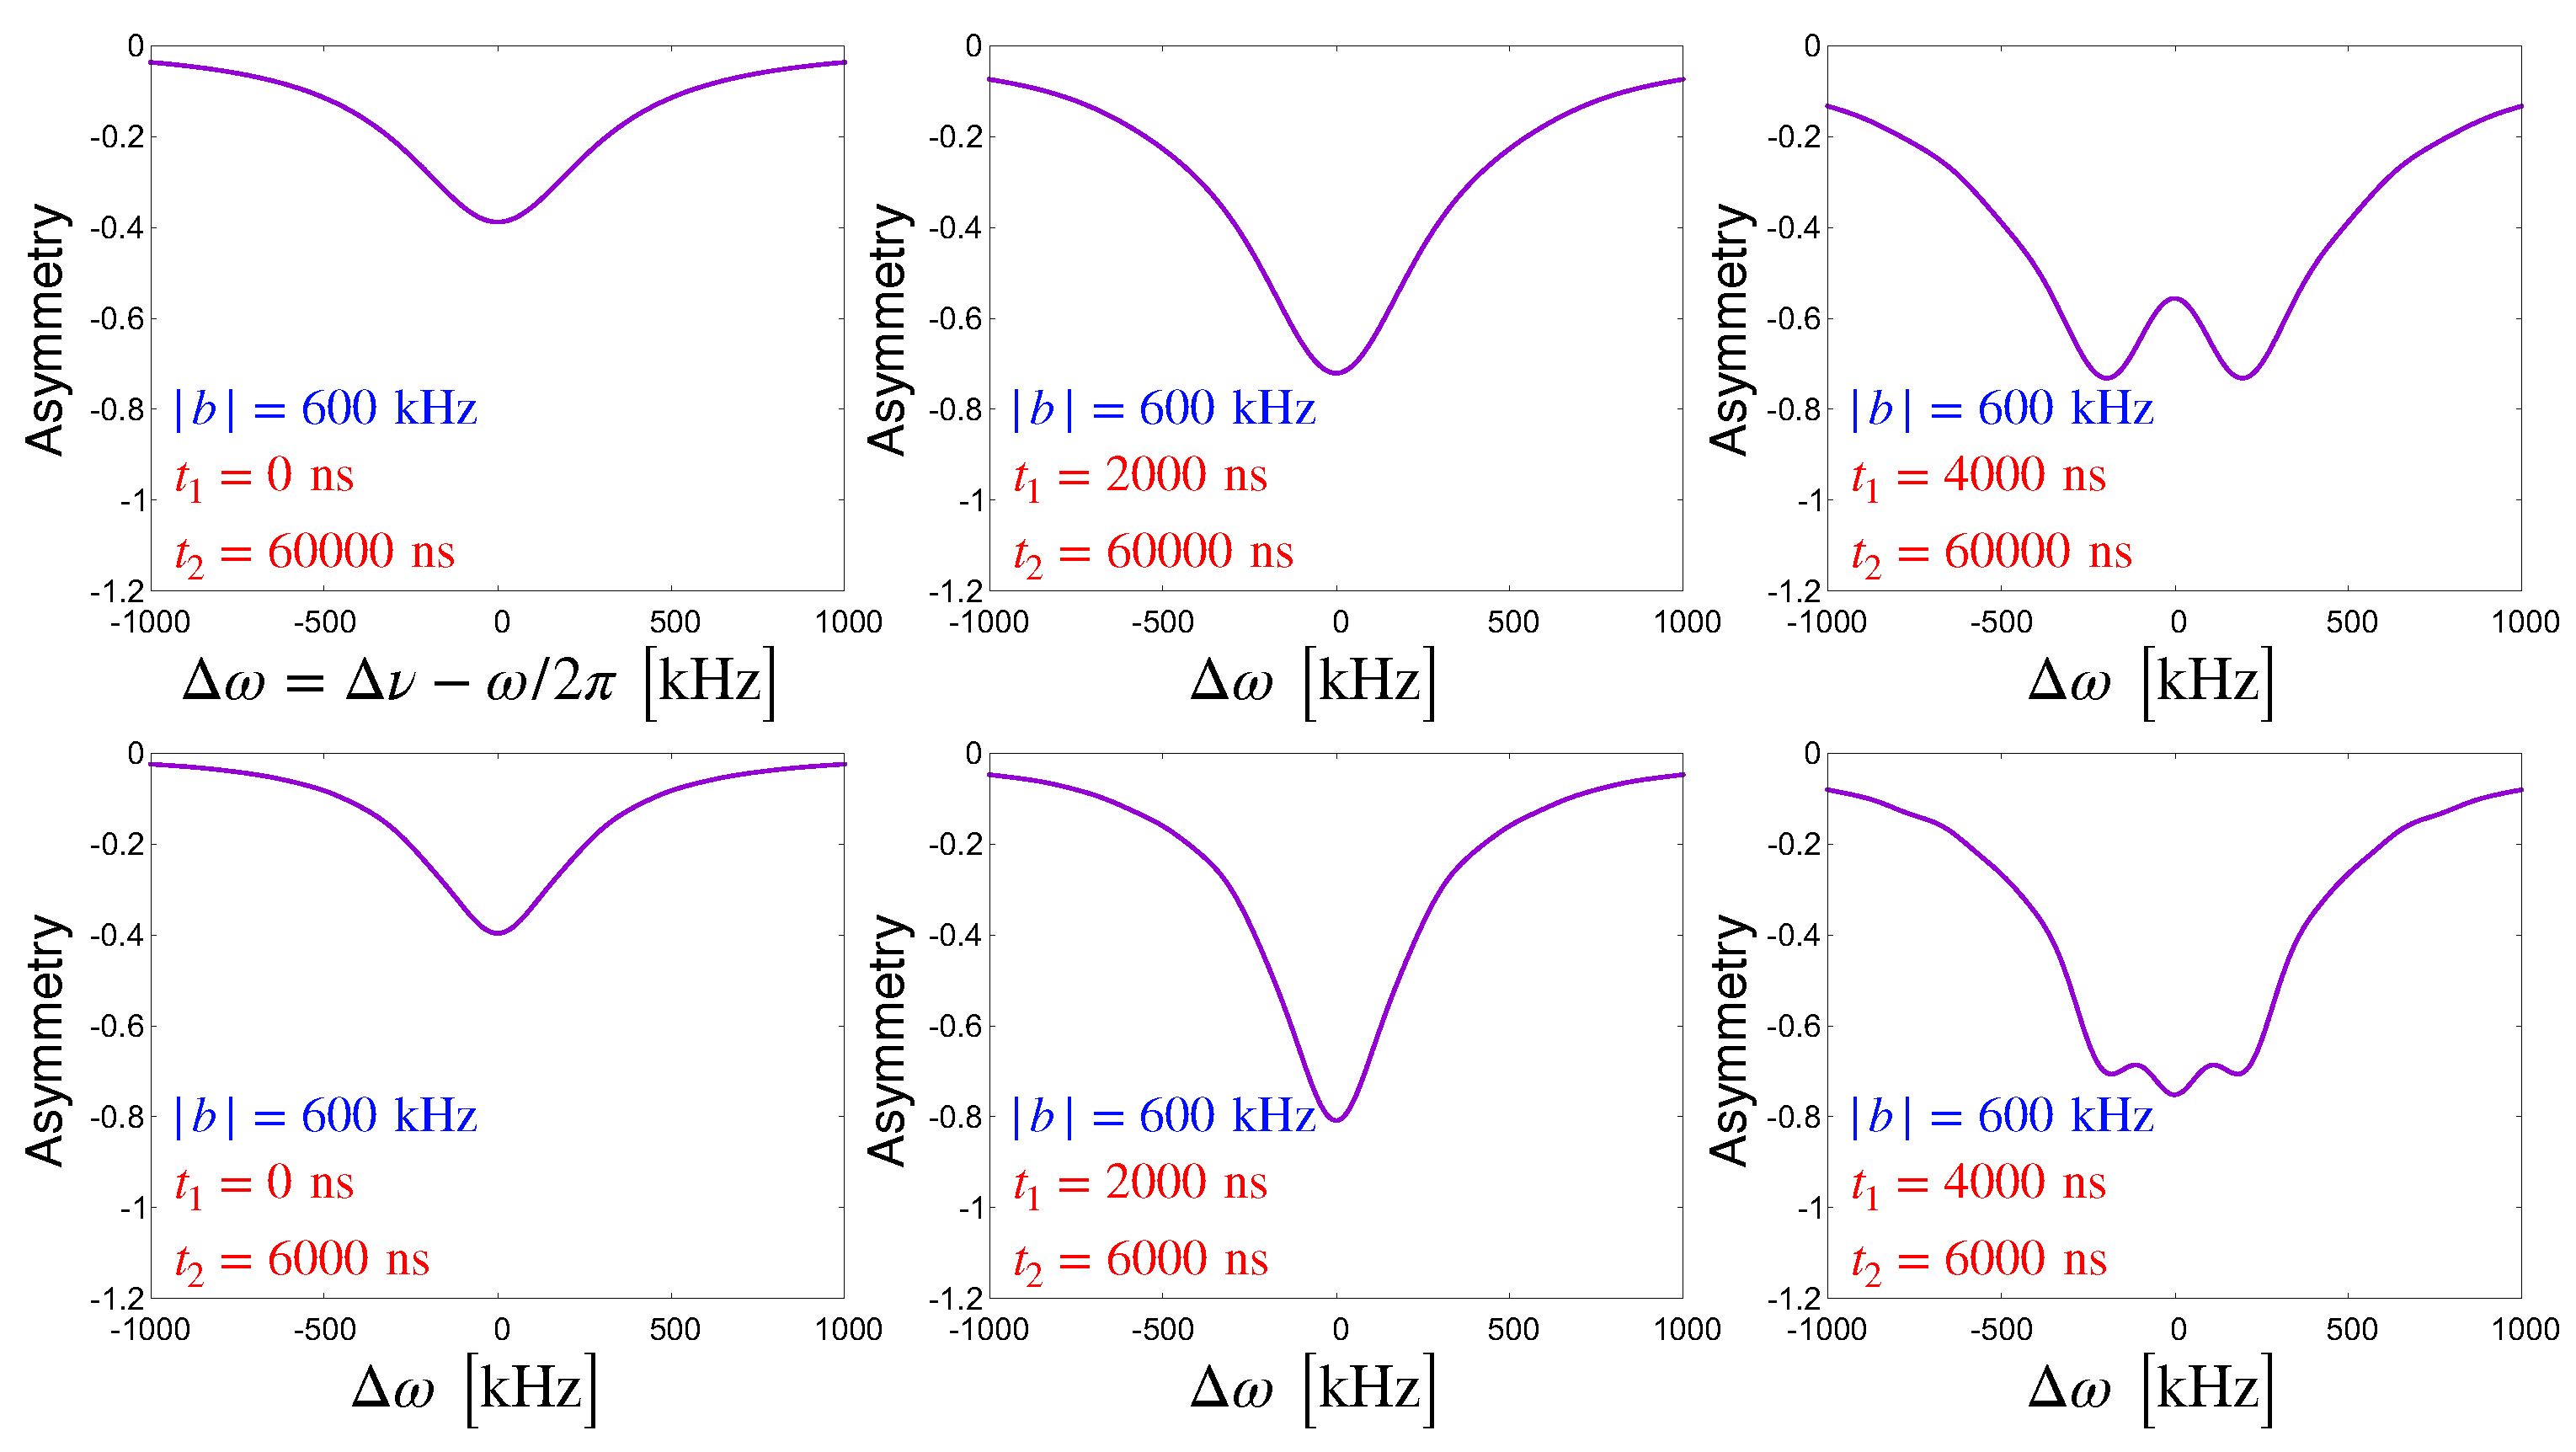
where  γ  is the muon decay rate,  Δ ω  is the difference of angular frequency between the muonic helium atom HFS and the applied microwave field,  | b |  is the Rabi frequency, which is proportional to the microwave field strength, y is the ratio of the momentum of the secondary particle to the maximum momentum,  θ  is the angle between the spin of the muon and the momentum of the secondary particle, and  A 1 ( y 0 )  and  A 2 ( y 0 )  are coefficients determined by the momentum threshold. The factor of the solid angle of the detector is canceled out when calculating  N ON ( t ) / N OFF ( t ) . In the case of a weak magnetic field, despite the different order of the energy level, the resonance curve is the same as that of muonium. The shapes of resonance curves change depending on  | b | , the measurement duration  [ t 1 , t 2 ] , and the initial polarization P of the muon within the muonic helium atom. Some examples of resonance curve shapes are shown in Figure 1 and Figure 2. Thus, by optimizing or improving these parameters, it is possible to enhance the measurement precision. Due to the short lifetime of muons stopped in high-Z (atomic number) atoms, delaying  t 1  not only changes the peak height as shown in Figure 1 and Figure 2 but also reduces the background in the actual measurement. In addition, delaying  t 2  makes the resonance curve wider and lowers the peak height but reduces the uncertainty of the data points, resulting in improved fit accuracy under our experimental conditions described later.

2.3. Pressure Shift

Muonic helium atoms repeatedly collide with the surrounding gas atoms. During these collisions, the energy levels of  He 4 μ e  fluctuate due to the effects of interactions with atoms in the gas. Thus, the HFS of  He 4 μ e  in gas shifts from its value in vacuum. This shift can be described by an “impact approximation”. The discussion in this Section refers to considerations in Refs. [16,17]. Regarding gas atoms as classical oscillators, the atomic oscillation can be written as  f ( t ) = exp i ω 0 t + i η ( t ) , where  ω 0  is the resonance frequency, and  η ( t )  is the phase change caused by the interaction between atoms. When the gas pressure and temperature are stationary, the resonance curve  I ( ω ) , which is obtained from the Fourier transform of the atomic oscillation, can be expressed as
I ( ω ) = lim Δ T 1 2 π Δ T Δ T / 2 Δ T / 2 f ( t ) exp i ( ω 0 + ω ) t d t 2 = 1 π Re 0 Φ ( τ ) exp i ω τ d τ
with Φ ( τ ) = lim Δ T 1 Δ T Δ T / 2 Δ T / 2 f * ( t ) f ( t + τ ) d t .
Considering the time average,
Φ ( τ ) = f * ( 0 ) f ( τ ) = exp i η ( τ ) ,
one derives:
Δ Φ = Φ ( τ + Δ τ ) Φ ( τ ) = Φ ( τ ) 1 exp i Δ η
with  Δ η  the phase shift produced by collisions during  Δ τ . Using the impact parameter  ρ  between two particles, the distribution  F ( v )  of relative velocities, and the number density of atoms N, one finds:
1 exp i Δ η = N Δ τ 0 v F ( v ) d v 2 π 0 ρ 1 exp i η ( ρ ) d ρ = γ i Δ Δ τ
with γ = 2 π N v 0 1 cos η ( ρ ) ρ d ρ
and Δ = 2 π N v 0 sin η ( ρ ) ρ d ρ .
From Equations (11) and (12):
d Φ d τ = γ i Δ Φ , Φ = exp γ i Δ τ .
By substituting Equation (15) into Equation (8), one obtains a Lorentzian resonance shape
I ( ω ) = γ 2 π 1 ( ω Δ ) 2 + γ 2 .
That is, the resonance frequency shifts in proportion to the number of gas atoms, i.e., the gas pressure. Therefore, HFS measurements must be taken at multiple target gas pressures and extrapolated to vacuum. High-pressure environments that require consideration of three-body collisions will result in additional second-order terms.

3. HFS Measurement

3.1. Apparatus

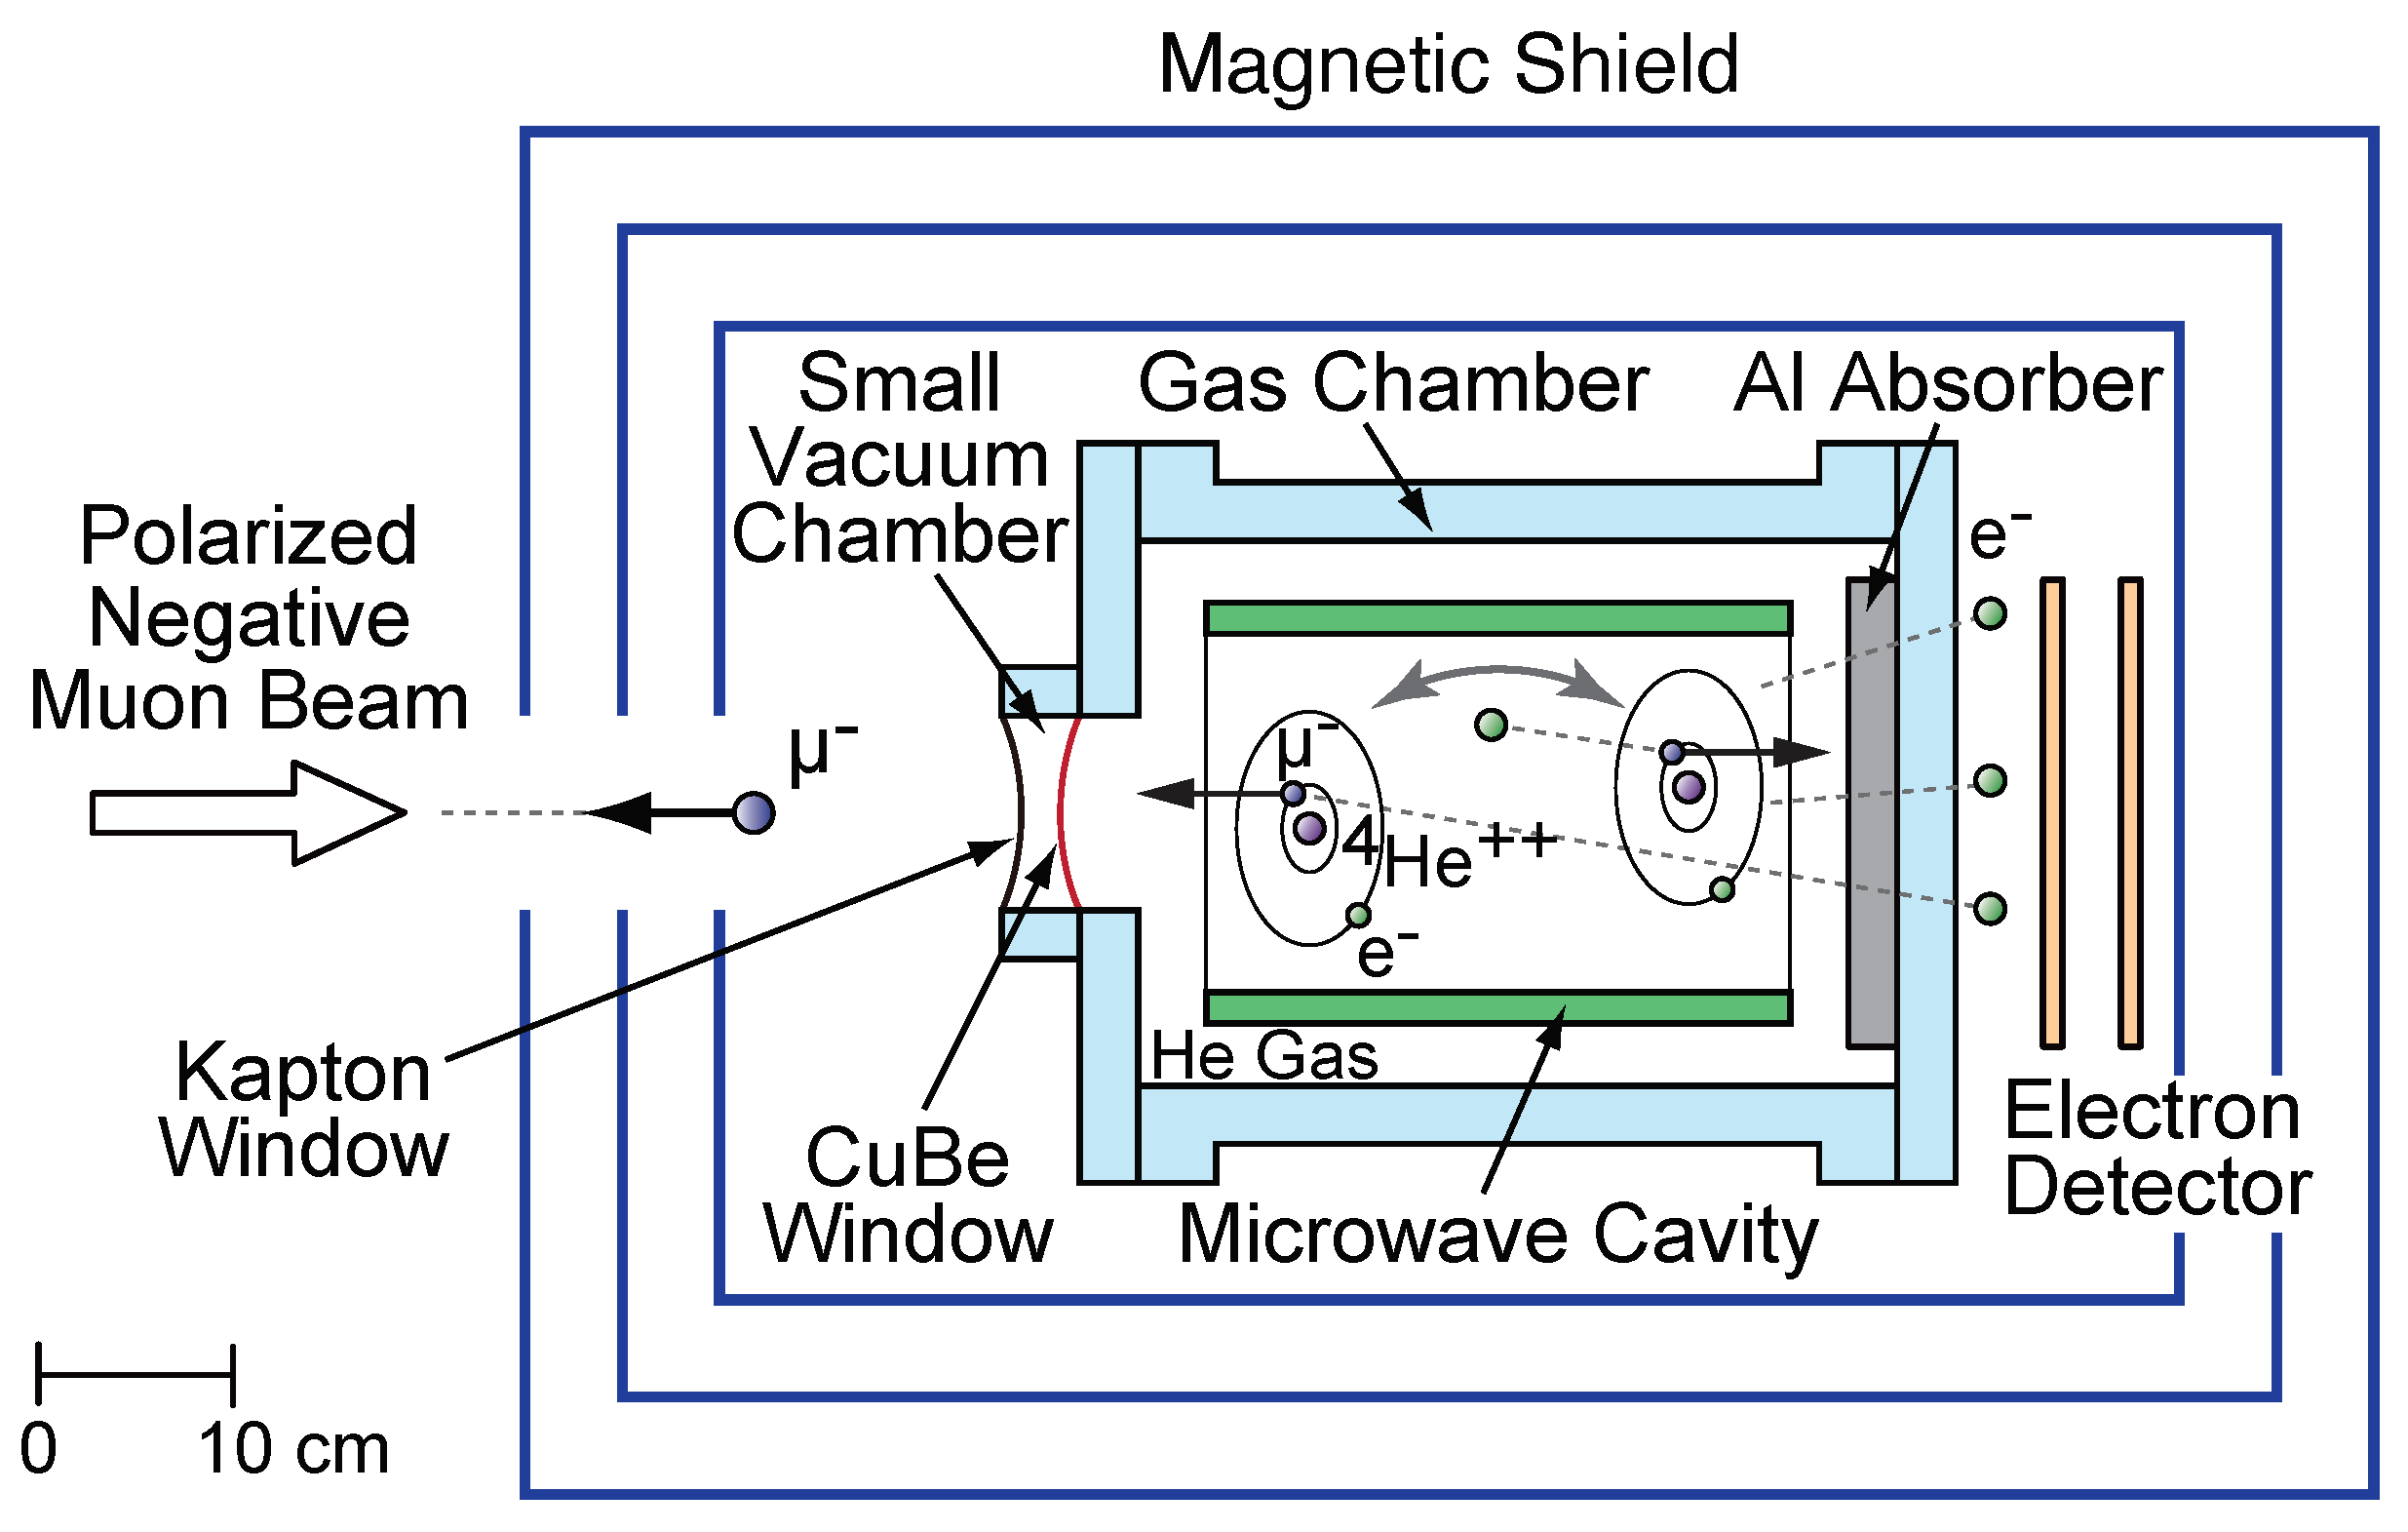
In the experiment, the same apparatus was used for muonic helium measurements as in the Muonium Spectroscopy Experiment Using Microwave (MuSEUM) Collaboration [4], except for the microwave cavity, the target gas filled in the gas chamber, and the beam intensity of the J-PARC MUSE D-line. The schematic view is shown in Figure 3. The detail of the microwave cavity and target gas is explained in Ref. [3].  Kr , which was used as the gas target in the MuSEUM experiment [4], does not act as an electron donor because its electron binding energy ( 14.00 eV  [2]) is higher than that of  ( 4 He μ ) +  ion. Methane ( CH 4 ), with a smaller electron binding energy ( 12.61 eV  [18]), close to that of  Xe  ( 12.13 eV  [2]) which was used in previous measurements [19,20], can act as an electron donor for the  ( 4 He μ ) +  ion, yielding a residual  μ  polarization of 5% [21]. It is the same value as  Xe  reported in Ref. [1] or almost twice higher than that reported in Ref. [19]. Here, to note is that considerations in Refs. [1,19] agree on the value of the residual polarization of the  ( 4 He μ ) +  ion but differ in the value of the residual polarization of the muonic helium atom. Furthermore, the  μ  capture rate of  CH 4  is 5 times smaller than that of  Xe , attributable to the Fermi–Teller Z law [22]. For the setup considered here, delaying the starting point  t 1  of integration not only affects the changes in the shape of resonance curve but also enhances the signal-to-noise ratio. This enhancement is attributed to the background signal from muonic copper, formed in the cavity and by the 1 mm thick copper beam stopper located downstream, which exhibits a shorter lifetime (0.164 ns) compared to muonic helium atoms (2.19531 ns) [23]. In such experiments, the beam intensity was  1.6 × 10 7 μ + / s  and  1.7 × 10 6 μ / s  with an accelerator operation power of 800 kW. The beam was pulsed and repetitive at 25 Hz.

3.2. Analysis

In the measurement, the decay electron from  μ  was detected by a segmented scintillation detector placed downstream of the microwave cavity and gas chamber. The detector acquires data for 64 µs every 40 ms (25 Hz). At the resonance point, the state transition rate achieves its maximum, hence maximizing the difference in the number of detected electrons with and without the application of microwaves. Determining the resonance frequency, indicated as  Δ ν , entails calculating the asymmetry ( N ON / N OFF 1 ) by integrating over any given interval  [ t 1 , t 2 ]  and fitting it according to Equation (7). For all measurements,  t 1 = 1.6  µs and  t 2 = 60.0  µs were set, resulting in the most precise average fit result of the resonance frequency. Periods where the input microwave power fluctuated more than 50% from the set value were excluded from the analysis, because fluctuations in microwave power shift the asymmetry as shown in Figure 1 and change the resonance frequency. Muonic helium atom HFS resonance curves were measured at He gas pressures of 4.0, 10.4, and 3.0 atm sequentially to extrapolate the HFS frequency to vacuum. The main sources of background were muons stopped in copper and prompt particles from the beam line. Thus, the background increased at low pressure even by optimizing the beam momentum to maximize the number of muons stopped in the target gas. However, this change could be neglected in our analysis due to the sufficient delay of  t 1 . Figure 4 compares our and earlier results [19,20]. The results are consistent within 1 σ  (standard deviation).
The result of the HFS of muonic helium in vacuum obtained by us here is
Δ ν He 4 μ e 0 atm , 0 ° C = 4 , 464 , 980 ± 20 kHz 4.5 ppm precision .
This result improves the previous world best result [20] by a factor of 1.5 and the previous zero-magnetic-field measurement [19] by a factor of 3. The uncertainty is primarily due to statistics, while systematic uncertainties for  Δ ν 0 atm  were estimated to be lower than 800 Hz (see details in Ref. [3]).
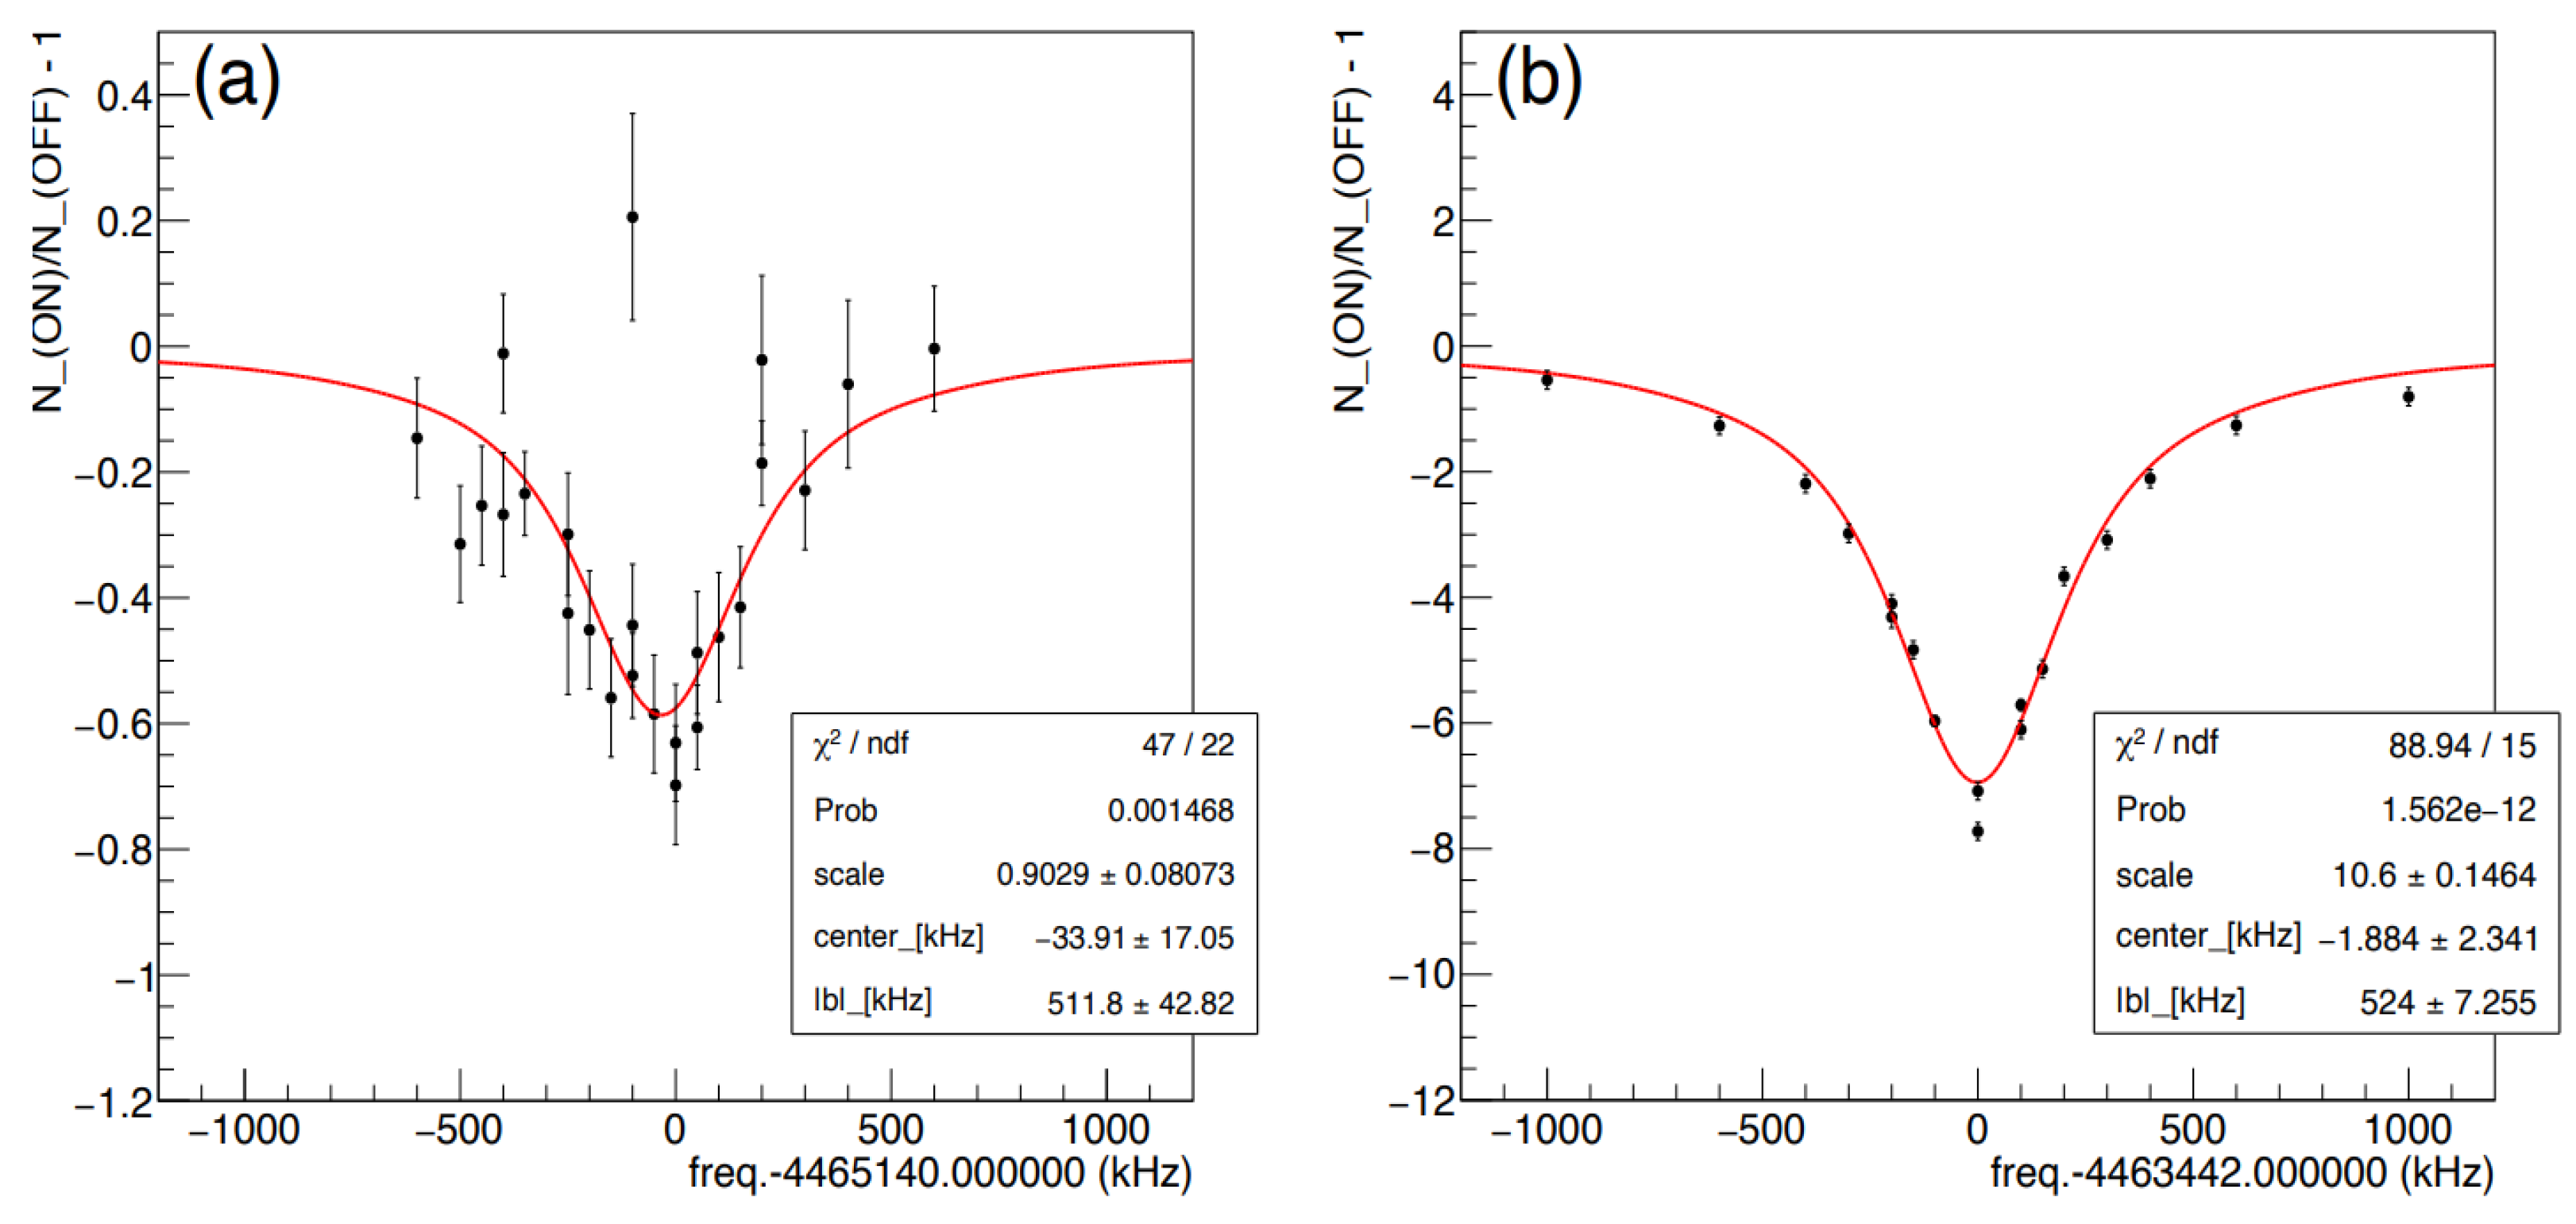
With the target gas used in our experiments, muonium formation occurred when positive muons were injected. At a target gas pressure of 10.4 atm, muonium HFS was also measured, as shown in Figure 5. The muonium result at 10.4 atm is [3]
Δ ν Mu 10.4 atm = 4 , 463 , 438.2 ± 2.3 kHz 0.5 ppm precision
and the muonic helium atom at 10.4 atm is [3]
Δ ν He 4 μ e 10.4 atm = 4 , 465 , 104 ± 17 kHz 3.8 ppm precision .
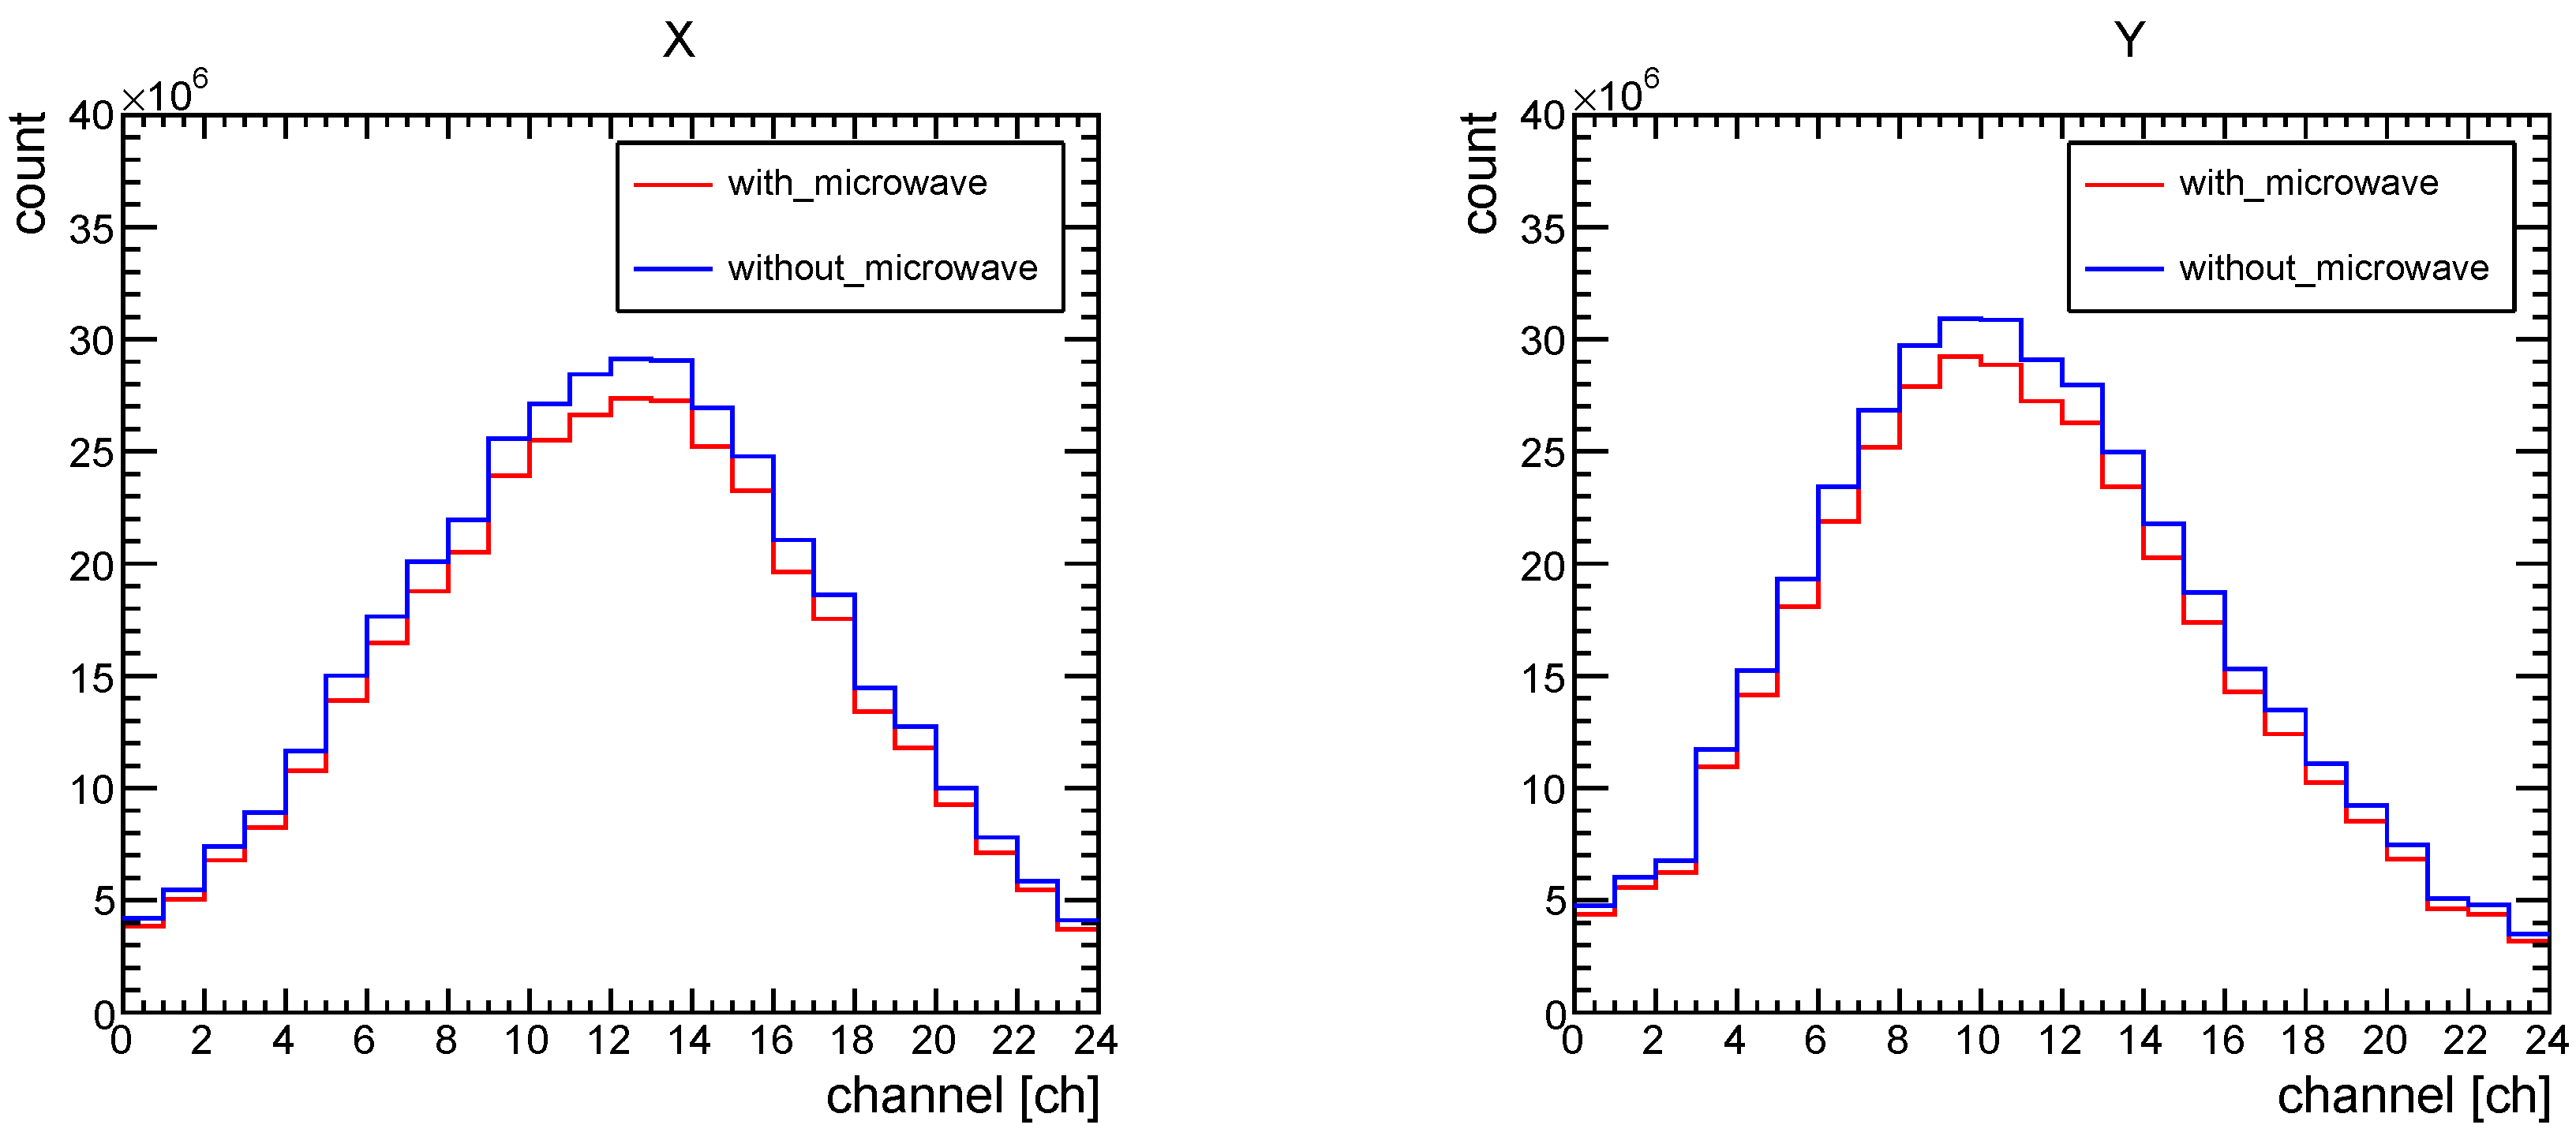
When measuring the muonium HFS, decay electrons tend to be emitted in the direction parallel to the muon spin. Therefore, the sign of the change in asymmetry reverses from that of the muonic helium atom. However, at the J-PARC MUSE D-line, the polarization directions of the positive and negative muon beams are reversed (except for the surface muon beam). Therefore, the measurement results were similar to those of the muonic helium atom. Actually, the residual polarization of muonium is 50%. By comparing the result of the muonic helium atom and considering Equation (6), the residual polarization of the muonic helium atom in this experiment was estimated at 4.5%. When comparing the precision of measurement results, it is considered that the effect of residual polarization on determination precision is proportional to the polarization rate. The peak height of the resonance curve, which is proportional to the residual polarization, was consistent across all pressures within the range of the fit accuracy (about 10%). Even in the muonium measurement results, where the microwave frequency was closest to the resonance frequency and the difference between applying and not applying microwaves was at its maximum, there was no significant difference in the distribution of positron detection locations, as shown in Figure 6. This is attributed to the broad distribution of the formation locations of muonium and muonic helium atoms.

4. Discussion

Muonic helium is the simplest quantum three-body system, and its HFS allows us to validate the theory of quantum three-body systems through a comparison with experimental values. The theoretical values of the muonic helium atom HFS are currently reported to be around 130 ppm by both variational methods and perturbation theory [24,25], but these values are still 30 times less precise than current experimental results. The large uncertainty is mainly caused by higher-order QED effects. In recent theoretical calculations for the HFS of the  2 3 S 1  state in the  He 3  atom [26], the precision was improved by a factor of 40 by utilizing the experimental values of HFS of the 1S state in the  He +  ion. If this method can be applied to the HFS of the 1S state in muonic helium, it would be possible to improve the precision of theoretical values to the same level as current experimental values, allowing for the verification of quantum three-body system theories in the near future. Therefore, it is necessary to further improve the precision of theoretical calculations to match the level of experimental results.
The verification of the CPT theorem in second-generation leptons through the mass comparison of positive and negative muons is limited to a level of 3.1 ppm, due to the determination precision of the negative muon mass being 3.1 ppm [27], which is more than an order of magnitude less precise than the 120 ppb precision achieved for the positive muon [28]. The negative muon mass can be determined with the measurement of the muonic helium atom HFS under high magnetic fields. To achieve a precision of  O ( 10 ppb )  in determining the negative muon mass, which currently exceeds the precision of the positive muon mass, it is required to measure the muonic helium atom HFS with a precision of  O ( 1 ppb ) . Measurements at high magnetic fields are planned using the J-PARC MUSE H-line, which started operation recently. The H-line, provides a beam with an intensity ten times higher than the D-line [29,30]. In addition, under high magnetic fields, the decay electrons are more concentrated along the beam axis. In addition, the use of the Rabi oscillation spectroscopy method developed by Nishimura et al. can improve the statistical precision by a factor of three [5]. Then, the measurement precision of the muonic helium atom HFS can reach  O ( 10 ppb )  within 100 days of measurement.
The systematic uncertainties of high-field HFS measurements are expected to be of the same level as weak-magnetic-field HFS measurements except for detector pileup, magnetic field uniformity, and quadratic pressure shift because almost the same apparatus is used. With the detector used in our measurements, one cannot ignore the effects of pileup at high event rates of the H-line. To reduce systematic uncertainty caused by pile-up, we plan to refine the segmentation of the detector and use high-rate capability silicon strip sensors that are being developed for the J-PARC muon  g 2 /EDM experiment [31,32]. Since fluctuations in the magnetic field mean fluctuations in the resonance frequency, measurements at high magnetic fields can introduce significant systematic uncertainties due to the lack of uniformity in the magnetic field. To suppress systematic uncertainties in  O ( 1 ppb ) , the fluctuations in the magnetic field must be less than 0.2 ppm both temporally and spatially. Currently, developments of the technology to shim a 1.7 T magnetic field generated by an MRI magnet to a uniformity of less than 0.2 ppm [33] and a CW-NMR probe with a resolution better than 10 ppb for monitoring fluctuations in the magnetic field [34] are ongoing. The quadratic pressure shift is currently estimated to be at most 175 ppb or less [3], based on results of muonium in Kr, which is the most precise measurement so far [35]. However, measuring the HFS at higher pressures and determining the quadratic pressure shift with our target gas could greatly reduce this uncertainty. Further improvement can be expected by enhancing the polarization of muonic helium atoms. Muonic helium atoms can be polarized using a spin exchange optical pumping (SEOP) technique [36], employed for producing polarized  He 3  for neutron spin filters [37]. Currently, it is estimated that by combining the H-line, Rabi oscillation spectroscopy method, and SEOP, the measurement precision of the muonic helium atom HFS is expected to reach  O ( 1 ppb ) .
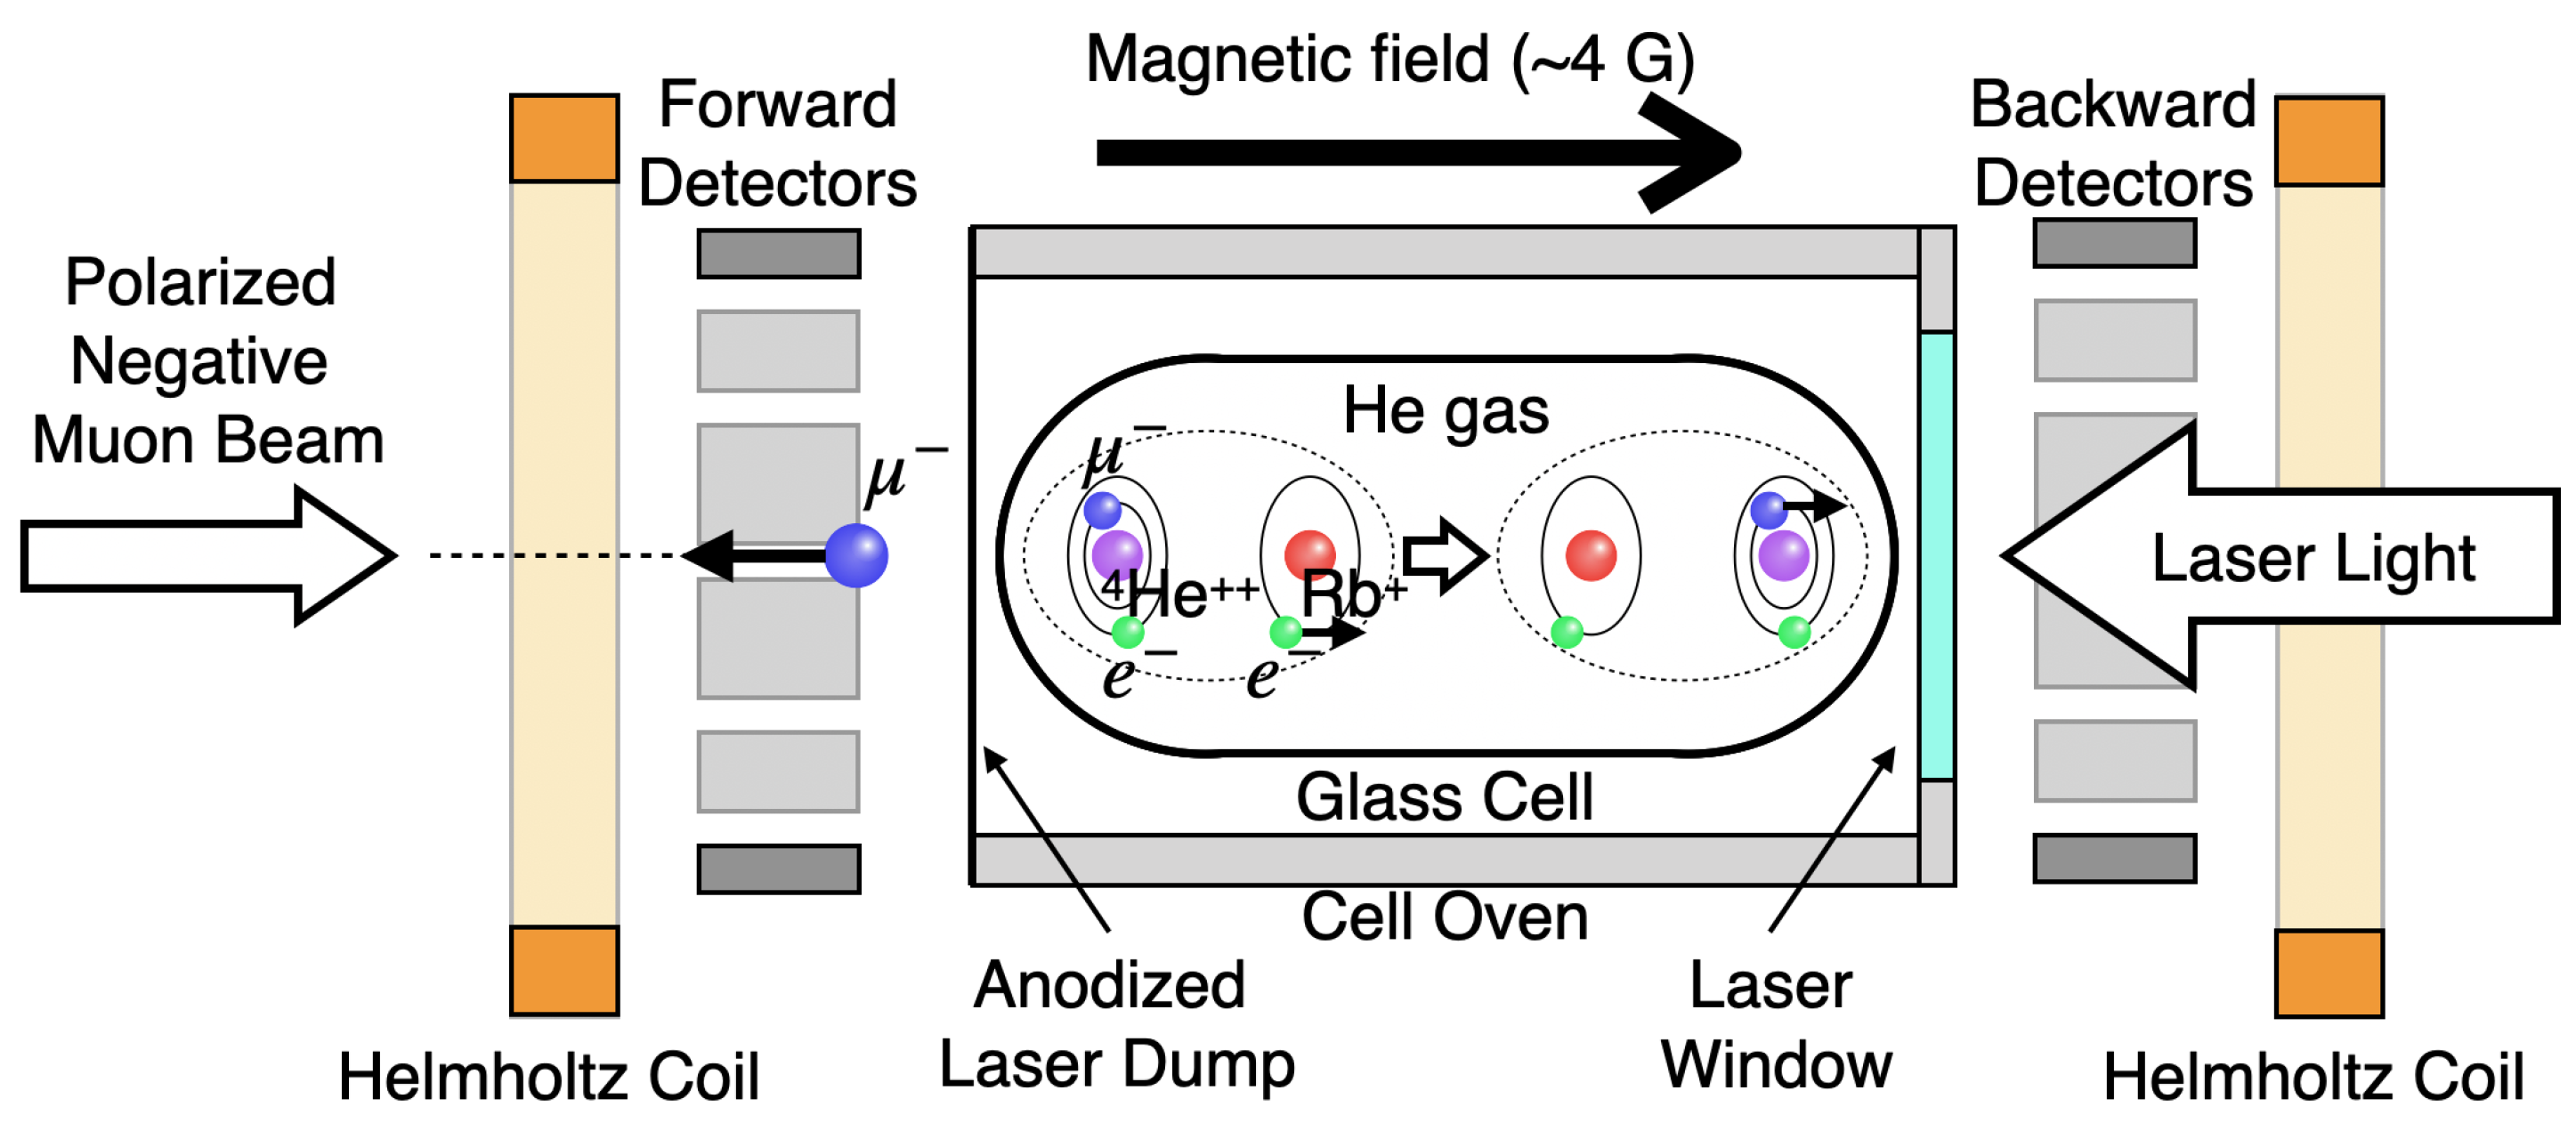
The development and demonstration of a highly polarized muonic helium atom production apparatus using SEOP, aimed to be incorporated into HFS measurements, is currently in progress. The demonstration of muonic helium SEOP was also done on the J-PARC MUSE D-line but in another experimental area. Figure 7 shows the schematic view of muonic helium SEOP. In this experiment, a glass cell sealed with 3 atm of  He 4  gas and a small amount (of about 0.1 g) of Rb and K atoms was set into a 4 G magnetic field. The glass cell was made from GE180 glass, a type of alumino-silicate glass that is resistant to corrosion by alkali metals. After the alkali metals were vaporized by heating the glass cell to almost 200 °C, a 795 nm wavelength laser light was irradiated onto the glass cell. When the laser light was circularly polarized, Rb atoms were polarized by optical pumping and then made K atoms polarized via spin-exchange collision. This method, used to polarize  He 3  is called “Hybrid-SEOP” and can achieve a higher polarization than only using Rb atoms [38].
The polarization direction of Rb and K atoms can be flipped by changing the rotation direction of the laser, because the polarization direction depends on the helicity of the laser light. The laser light emitted from a laser diode array is linear polarized. To make a circularly polarized laser light, a quarter-wavelength plate was installed into the optical path of the laser. When the quarter-wavelength plate was rotated by 90 degrees, the rotation direction of the circular polarization was flipped. When the quarter-wavelength plate was rotated by 45 degrees, the laser light became linearly polarized. When muons were injected into the glass cell,  He 4 μ  ion were formed. Then, the  He 4 μ e  atom was generated by the charge exchange between the alkali metal and  He 4 μ  ion. This made  μ  in  He 4 μ e  polarized upon the half polarization rate of alkali metals via hyperfine interaction. Also,  He 4 μ e  atoms and alkali metal atoms collided with each other repeatedly and exchanged the spin of the electron. Then, the  He 4 μ e  atoms were polarized upon the same polarization rate of alkali metals, also via hyperfine interaction. The polarization of the muon was observed by counting the number of decay electrons,  N FWD  and  N BWD , emitted upstream and downstream, respectively. The asymmetry defined as  N FWD / N BWD 1  depended on the polarization rate of the muon. Currently, changes in the direction of decay electron emission due to differences in the polarization of incident lasers, indicated by the generation of a polarized muonic helium atom are observed. A detailed analysis of these results is ongoing. The glass cell used in the experiment had a thickness of approximately 0.5 mm, which is very thin compared to those used for  He 3  SEOP. However, based on the time spectrum of decay electrons, it was estimated that about 90% of the muons stopped inside the glass constituting the cell in this experiment. This expected to increase the statistical uncertainty in HFS measurements by decreasing the number of muons stopped in target gas. Moreover, the muons captured by the constituent elements of glass, especially oxygen, have a lifetime close to that of muonic helium (1.7954 ns for muonic oxygen and 2.19531 ns for muonic helium), creating a significant and difficult-to-eliminate background, unlike muons stopped in copper. While it is possible to reduce the number of muons stopping in the glass by making it even thinner, such a cell would need to withstand an internal pressure of 3 atm, making fabrication challenging. Therefore, we are currently considering the repolarization of muonic helium atoms using a metal cell. Metal cells lead not only to a reduced background but also allow for changes in internal gas pressure and eliminate the need to consider the microwave intensity distribution by serving as a microwave cavity. However, there are several challenges, including selecting materials that are not corroded by alkali metals, devising methods for installing laser entry windows, and preventing damage due to heating.
Using Monte Carlo (MC) simulations based on previous results [36], incorporating SEOP into zero-magnetic-field measurements could improve measurement precision by a factor of six or more. Drawing from the analogy of  He 3  SEOP, the efficiency of SEOP depends on the number of alkali metal atoms, which relies on the temperature. Therefore, the amount of improvement depends on the temperature of the target gas. In this simulation, it was assumed that the polarization rate of alkali metals was 100%. Furthermore, the state transition of muonic helium atom due to microwave resonance was represented by the correlation with the initial amplitude of each state, making it difficult to determine the relationship with the immediately preceding state quantity. For this reason, we are currently unable to analytically deal with microwave resonance and SEOP simultaneously. To simulate the state where microwave resonance and SEOP occur simultaneously, the latter were treated separately as follows:
  • to determine whether the particle decays every 1 ns;
  • if the particle it does not decay, to determine whether spin exchange with alkali metals occurs;
  • if the decay or spin exchange occurs, to determine the current state of the particle;
  • if the spin exchange occurs, in subsequent calculations, the current time is considered to be  t = 0 , and the spin-exchange probability and the existence probability of each state are considered been determined.
In this treatment, the probability of each state is interpreted as the weighted average of the transition probabilities with the initial state quantities. This simulation reproduces the theoretical formula of microwave resonance without SEOP. Moreover, under conditions where microwave resonance does not occur, the simulation can replicate the estimation formula for the spin polarization of the muonic helium atom due to SEOP from Ref. [36]. An example of the simulation results is shown in Figure 8. The shape of the resonance curve obtained by this simulation is narrower than that predicted by Equation (7), indicating that a more detailed examination is necessary for the analysis method of HFS measurements introduced by SEOP.
The final goal is to conduct HFS measurements in a high magnetic field using an SEOP apparatus. However, the polarization process of muonic helium atoms via SEOP involves hyperfine interactions. Therefore, it is also necessary to study the spin polarization efficiency in high magnetic fields.

5. Conclusions

Recently, we established a method to measure the HFS of muonic helium atoms, applied it in zero magnetic field using the state transitions that occur due to interaction with microwaves, and achieved a new best world result with a precision of 4.5 ppm [3]. The uncertainty was mainly statistical. In addition to using a high-intensity negative muon beam, statistical uncertainty can also be improved by solving the depolarization of negative muons caused by Auger transitions and Stark mixing associated with the formation of muonic helium atoms. From the comparison with the measurement of the HFS of muonium and the muonic helium atom under the same conditions, the polarization rate of muonic helium atoms generated in our HFS measurement is expected to be about 4.5%.
Depolarized muonic helium can be repolarized by the SEOP technique. Currently, the development of SEOP equipment is in progress at J-PARC, and repolarization up to about a 30% polarization rate has been achieved. This is the first example of repolarizing muonic helium atoms using a pulsed muon beam. Furthermore, according to MC simulations based on the results of a previous study on the repolarization of muonic helium atoms by SEOP [36], under ideal conditions, the gain due to spin repolarization can be larger than a factor of six. Combining this with the 100-fold statistics obtained from measuring for 100 days at the J-PARC MUSE H-line, improvements in electron detection efficiency due to magnetic fields, and a threefold gain from Rabi oscillation spectroscopy [5], it is expected that the HFS of muonic helium  Δ ν  can be determined with a precision of about 7 ppb and the magnetic moment and the mass of negative muons can be determined with a precision of about 70 ppb. However, there are still quite a number of challenges with the current SEOP equipment, such as, for example, the problem of the presence of a large fraction of the negative muons stopping in the glass cell and, therefore, preventing of forming muonic helium.

Author Contributions

Conceptualization, P.S., T.I. and K.S.; methodology, P.S., S.K. (Sohtaro Kanda), S.N., K.S. and H.A.T.; software, S.F., S.K. (Sohtaro Kanda) and S.N.; validation and investigation, S.F., P.S., M.F., Y.G., R.I., S.K. (Sohtaro Kanda), S.K. (Shiori Kawamura), S.N., T.O. (Takuya Okudaira), K.S., H.T. and H.A.T.; formal analysis, data curation and writing—original draft, S.F.; writing—review and editing, S.F. and P.S.; resources, P.S., T.I., M.K., T.O. (Takayuki Oku), H.M.S., K.S. and H.A.T.; visualization, S.F, P.S, M.F., Y.G., R.I., S.K. (Sohtaro Kanda) and S.N.; supervision and project administration, P.S. and K.S.; funding acquisition, P.S., K.S. and H.A.T. All authors have read and agreed to the published version of the manuscript.

Funding

This work was supported by the JSPS KAKENHI (Grant-in-Aid for Scientific Research (A) 21H04481) and JST SPRING, grant number JPMJSP2125.

Data Availability Statement

The data that support the findings of this study are available from the corresponding author upon reasonable request.

Acknowledgments

The muon experiment at the Materials and Life Science Experimental Facility of the J-PARC was performed under a user program (2020B0333, 2021B0169, 2022A0159, 2022A0208, 2022B0314). S.F. would like to take this opportunity to thank the “Interdisciplinary Frontier Next-Generation Researcher Program of the Tokai Higher Education and Research System”.

Conflicts of Interest

The authors declare no conflicts of interest.

Abbreviations

The following abbreviations are used in this manuscript:
BWD         backward (downstream)
CPTcharge–parity–time
CWcontinuous wave
EDMelectric dipole moment
FWDforward (upstream)
GEGeneral Electric
HFShyperfine structure
J-PARCJapan Proton Accelerator Research Complex
MCMonte Carlo
MRImagnetic resonance imaging
MUSEMuon Science Establishment
MuSEUMMuonium Spectroscopy Experiment Using Microwave
NMRnuclear magnetic resonance
ppbparts per billion ( × 10 9 )
ppmparts per million ( × 10 6 )
QEDquantum electrodynamics
SEOPspin exchange optical pumping

References

  1. Souder, P.A.; Crane, T.W.; Hughes, V.W.; Lu, D.C.; Orth, H.; Reist, H.W.; Yam, M.H.; Putlitz, G.z. Formation of the muonic helium atom. Phys. Rev. A 1980, 22, 33–50. [Google Scholar] [CrossRef]
  2. Lide, D.R. (Ed.) CRC Handbook of Chemistry and Physics: A Ready-Reference Book of Chemical and Physical Data; CRC Press, Inc.: Boca Raton, FL, USA, 1992; pp. 10-211–10-213. Available online: https://archive.org/details/hdbkofchemistryp00unse (accessed on 27 April 2024).
  3. Strasser, P. et al. [MuSEUM Collaboration] Improved measurements of muonic helium ground-state hyperfine structure at a near-zero magnetic field. Phys. Rev. Lett. 2023, 131, 253003. [Google Scholar] [CrossRef] [PubMed]
  4. Kanda, S.; Fukao, Y.; Ikedo, Y.; Ishida, K.; Iwasaki, M.; Kawall, D.; Kawamura, N.; Kojima, K.M.; Kurosawa, N.; Matsuda, Y.; et al. New precise spectroscopy of the hyperfine structure in muonium with a high-intensity pulsed muon beam. Phys. Lett. B 2021, 815, 136154. [Google Scholar] [CrossRef]
  5. Nishimura, S. et al. [MuSEUM Collaboration] Rabi-oscillation spectroscopy of the hyperfine structure of muonium atoms. Phys. Rev. A 2021, 104, L020801. [Google Scholar] [CrossRef]
  6. Tanaka, K.S.; Iwasaki, M.; Kamigaito, O.; Kanda, S.; Kawamura, N.; Matsuda, Y.; Mibe, T.; Nishimura, S.; Saito, N.; Sakamoto, N.; et al. Development of microwave cavities for measurement of muonium hyperfine structure at J-PARC. Prog. Theor. Exp. Phys. 2021, 2021, 053C01. [Google Scholar] [CrossRef]
  7. Schmid, E.W.; Ziegelmann, H. The Quantum Mechanical Three-Body Problem; Friedr. Vieweg + Sohn: Braunschweig, Germany; Pergamon Press: Oxford, UK, 1974. [Google Scholar] [CrossRef]
  8. Mann, R.A.; Rose, M.E. Depolarization of negative μ mesons. Phys. Rev. 1961, 121, 293–301. [Google Scholar] [CrossRef]
  9. Shmushkevich, I.M. Depolarization of μ-mesons in μ-mesic atom formation. Nucl. Phys. 1959, 11, 419–431. [Google Scholar] [CrossRef]
  10. Mukhopadhyay, N.C. Nuclear muon capture. Phys. Rep. 1977, 30, 1–144. [Google Scholar] [CrossRef]
  11. Koike, T.; Akaishi, Y. Stark mixing in the exotic helium atom cascade process. Nucl. Phys. A 1998, 639, 521c–524c. [Google Scholar] [CrossRef]
  12. Hughes, V.W.; Putlitz, G.z. Muonium. In Quantum Electro-Dynamics; Kinoshita, T., Ed.; World Scientific: Singapore, 1990; pp. 822–904. [Google Scholar] [CrossRef]
  13. Bailey, J.M.; Cleland, W.E.; Hughes, V.W.; Prepost, R.; Ziock, K. Muonium. II. Observation of the muonium hyperfine-structure interval. Phys. Rev. A 1971, 3, 871–884. [Google Scholar] [CrossRef]
  14. Cleland, W.E.; Bailey, J.M.; Eckhause, M.; Hughes, V.W.; Prepost, R.; Rothberg, J.E.; Mobley, R.M. Muonium. III. Precision measurement of the muonium hyperfine-structure interval at strong magnetic field. Phys. Rev. A 1972, 5, 2338–2356. [Google Scholar] [CrossRef]
  15. Thompson, P.A.; Crane, P.; Crane, T.; Amato, J.J.; Hughes, V.W.; Putlitz, G.z.; Rothberg, J.E. Muonium. IV. Precision measurement of the muonium hyperfine-structure interval at weak and very weak magnetic fields. Phys. Rev. A 1973, 8, 86–112. [Google Scholar] [CrossRef]
  16. Sobel’man, I.I.; Vainshtein, L.A.; Yukov, E.A. Excitation of Atoms and Broadening of Spectral Lines; Springer: Berlin/Heidelberg, Germany, 1995; pp. 237–296. [Google Scholar] [CrossRef]
  17. Torii, H.A. Laser Spectroscopy of Antiprotonic Helium Atomcules-Collisional Shift and Broadening of Resonance Lines. Ph.D. Thesis, Tokyo University, Tokyo, Japan, 1997. [Google Scholar]
  18. Berkowitz, J.; Greene, J.P.; Cho, H.; Ruscić, B. The ionization potentials of CH4 and CD4. J. Chem. Phys. 1987, 86, 674–676. [Google Scholar] [CrossRef]
  19. Orth, H.; Arnold, K.-P.; Egan, P.O.; Gladisch, M.; Jacobs, W.; Vetter, J.; Wahl, W.; Wigand, M.; Hughes, V.W.; Putlitz, G.z. First observation of the ground-state hyperfine-structure resonance of the muonic helium atom. Phys. Rev. Lett. 1980, 45, 1483–1486. [Google Scholar] [CrossRef]
  20. Gardner, C.J.; Badertscher, A.; Beer, W.; Bolton, P.R.; Egan, P.O.; Gladisch, M.; Greene, M.; Hughes, V.W.; Lu, D.C.; Mariam, F.G.; et al. Precise measurement of the hyperfine-structure interval and Zeeman effect in the muonic helium atom. Phys. Rev. Lett. 1982, 48, 1168–1171. [Google Scholar] [CrossRef]
  21. Arseneau, D.J.; Fleming, D.G.; Li, Y.; Li, J.; Suleimanov, Y.V.; Guo, H. Rate coefficient for the 4Heμ++CH4 reaction at 500 K: Comparison between theory and experiment. J. Phys. Chem. B 2016, 120, 1641–1648. [Google Scholar] [CrossRef] [PubMed]
  22. Knight, J.D.; Orth, C.J.; Schillaci, M.E.; Naumann, R.A.; Daniel, H.; Springer, K.; Knowles, H.B. Chemical effects in negative muon capture in some ionic and covalent solids and ionic aqueous solutions. Phys. Rev. A 1976, 13, 43–53. [Google Scholar] [CrossRef]
  23. Suzuki, T.; Measday, D.F.; Roalsvig, J.P. Total nuclear capture rates for negative muons. Phys. Rev. C 1987, 35, 2212–2224. [Google Scholar] [CrossRef] [PubMed]
  24. Aznabayev, D.T.; Bekbaev, A.K.; Korobov, V.I. The hyperfine structure of the ground state in the muonic helium atoms. Phys. Part. Nucl. Lett. 2018, 15, 236–239. [Google Scholar] [CrossRef]
  25. Krutov, A.A.; Martynenko, A.P. Ground-state hyperfine structure of the muonic helium atom. Phys. Rev. A 2008, 78, 032513. [Google Scholar] [CrossRef]
  26. Patkóš, V.; Yerokhin, V.A.; Pachucki, K. Higher-order QED corrections to the hyperfine splitting in 3He. Phys. Rev. Lett. 2023, 131, 183001. [Google Scholar] [CrossRef]
  27. Beltrami, I.; Aas, B.; Beer, W.; de Chambrier, G.; Goudsmit, P.F.A.; von Ledebur, T.; Leisi, H.J.; Ruckstuhl, W.; Sapp, W.W.; Strassner, G.; et al. New precision measurements of the muonic 3d5/2–2p3/2 X-ray transition in 24Mg and 28Si: Vacuum polarisation test and search for muon-hadron interactions beyond QED. Nucl. Phys. A 1986, 451, 679–700. [Google Scholar] [CrossRef]
  28. Liu, W.; Boshier, M.G.; Dhawan, S.; van Dyck, O.; Egan, P.; Fei, X.; Perdekamp, M.G.; Hughes, V.W.; Janousch, M.; Jungmann, K.; et al. High precision measurements of the ground state hyperfine structure interval of muonium and of the muon magnetic moment. Phys. Rev. Lett. 1999, 82, 711–714. [Google Scholar] [CrossRef]
  29. Kawamura, N.; Aoki, M.; Doornbos, J.; Mibe, T.; Miyake, Y.; Morimoto, F.; Nakatsugawa, Y.; Otani, M.; Saito, N.; Seiya, Y.; et al. New concept for a large-acceptance general-purpose muon beamline. Prog. Theor. Exp. Phys. 2018, 11, 113G01. [Google Scholar] [CrossRef]
  30. Yamazaki, T.; Kawamura, N.; Shimomura, K.; Miyake, Y.; Oishi, Y.; Adachi, T.; Strasser, P.; Koda, A.; Fujimori, H.; Yuasa, T.; et al. New beamlines and future prospects of the j-parc muon facility. EPJ Web Conf. 2023, 282, 01016. [Google Scholar] [CrossRef]
  31. Yamanaka, T.; Aoyagi, T.; Ikeda, H.; Ikeno, M.; Ito, T.; Ueno, K.; Uchida, T.; Kawagoe, K.; Kishishita, T.; Kume, T.; et al. Positron tracking detector for J-PARC muon g−2/EDM experiment. Nucl. Instrum. Meth. Phys. Res. A Accel. Spectrom. Detect. Assoc. Equip. 2020, 958, 162786. [Google Scholar] [CrossRef]
  32. Aoyagi, T.; Honda, Y.; Ikeda, H.; Ikeno, M.; Kawagoe, K.; Kohriki, T.; Kume, T.; Mibe, T.; Namba, K.; Nishimura, S.; et al. Performance evaluation of a silicon strip detector for positrons/electrons from a pulsed a muon beam. J. Instrum. 2020, 15, P04027. [Google Scholar] [CrossRef]
  33. Sasaki, K.; Sugita, M.; Abe, M.; Iinuma, H.; Ogane, C.; Mibe, T.; Shimomura, K.; Ogitsu, T. Development of precise shimming technique with materials having low saturation magnetization. IEEE Trans. Appl. Supercond. 2022, 32, 9002107. [Google Scholar] [CrossRef]
  34. Tada, H.; Yoshizu, F.; Oyama, S.; Tanaka, T.; Sasaki, K.I.; Shimomura, K. Development of magnetic field mapping system for the MuSEUM experiment with high precision using CW-NMR probes. IEEE Trans. Appl. Supercond. 2022, 32, 9002205. [Google Scholar] [CrossRef]
  35. Casperson, D.; Crane, T.W.; Hughes, V.W. DA new high precision measurement of the muonium hyperfine structure interval Δν. Phys. Lett. B 1975, 59, 397–400. [Google Scholar] [CrossRef]
  36. Barton, A.S.; Bogorad, P.; Cates, G.D.; Mabuchi, H.; Middleton, H.; Newbury, N.R.; Holmes, R.; McCracken, J.; Souder, P.A.; Xu, J.; et al. Highly polarized muonic he produced by collisions with laser optically pumped Rb. Phys. Rev. Lett. 1993, 70, 758–761. [Google Scholar] [CrossRef] [PubMed]
  37. Okudaira, T.; Oku, T.; Ino, T.; Hayashida, H.; Kira, H.; Sakai, K.; Hiroi, K.; Takahashi, S.; Aizawa, K.; Endo, H.; et al. Development and application of a 3He neutron spin filter at J-PARC. Nucl. Instrum. Meth. Phys. Res. A Accel. Spectrom. Detect. Assoc. Equip. 2020, 977, 164301. [Google Scholar] [CrossRef]
  38. Babcock, E.; Nelson, I.; Kadlecek, S.; Driehuys, B.; Anderson, L.W.; Hersman, F.W.; Walker, T.G. Hybrid spin-exchange optical pumping of 3He. Phys. Rev. Lett. 2003, 91, 123003. [Google Scholar] [CrossRef] [PubMed]
Figure 1. The shape of asymmetry signal,  L ( Δ ω )  (7), for different Rabi frequency  | b |  and [ t 1 = 2000 ns , t 2 = 60 , 000 ns ] time interval. The value of the muon decay rate  γ 455 kHz  was used.
Physics 06 00054 g001
Figure 2. The shape of asymmetry signal,  L ( Δ ω )  (7), for different [ t 1 , t 2 ] time intervals and the Rabi frequency  | b | = 600  kHz. The value of the muon decay rate  γ 455 kHz  was used.
Physics 06 00054 g002
Figure 3. Schematic view of the experimental setup to measure the ground-state muonic helium atom HFS at zero magnetic field. The muon beam supplied by the J-PARC MUSE D-line is almost 100% polarized. A 1 mm thick copper beam stopper (not shown) is affixed on the Al absorber. The gas chamber can contain gases at pressures up to 10 atm. When exchanging target gases or changing pressures, the gas chamber is first evacuated. During this process, the pressure inside the small vacuum chamber is kept lower than that in the gas chamber to prevent deformation and damage to the CuBe windows. Reproduced from Ref. [3], with permission from American Physical Society.
Physics 06 00054 g003
Figure 4. The result of extrapolating the muonic helium atom HFS frequency to vacuum (solid circles). The solid line shows the linear fit result. The earlier results from Refs. [19] (open circle) and [20] (open squares) along with the linear extrapolation (dashed line) measured with He + Xe (1.5% doped) are shown for comparison (reproduced from Ref. [3], with permission from American Physical Society).
Physics 06 00054 g004
Figure 5. Measurements (black dots) and fit resonance curve (red line) at zero field, 10.4 atm, for the muonic helium atom (a) and muonium (b).The integral range is [1.6 µs, 60.0 µs], where the time origin is set to the second muon pulse arrival time. Note that the vertical scales of 10 times difference. The tables show the fitting procedure statistics.
Physics 06 00054 g005
Figure 6. The distribution of decay positron detection position at the first layer of the detector when the microwave frequency is closest to the resonance frequency in muonium HFS measurements with (red line) and without (blue line) applying microwave being projected on the X (left) and Y (right) axes.
Physics 06 00054 g006
Figure 7. Schematic view of muonic helium SEOP experiment.  He 4 μ e  atoms are polarized by charge exchange or spin exchange between alkali metal atoms. The irradiation of the laser and the injection of muons are performed simultaneously. Ten forward/backward detectors are installed on the circumference centered on the beam axis, respectively. The shape of the glass cell was chosen to minimize the stress caused by the internal pressure. See text for further details.
Physics 06 00054 g007
Figure 8. Simulation results with 5% of initial polarization assuming muonic helium and Rb atoms at 200 °C with no microwave resonance and no SEOP (black circles), with microvawe resonance and no SEOP (blue circles)), with no microwave resonance but with SEOP (pink circles), and with microwave resonance and SEOP (red circles).
Physics 06 00054 g008
Disclaimer/Publisher’s Note: The statements, opinions and data contained in all publications are solely those of the individual author(s) and contributor(s) and not of MDPI and/or the editor(s). MDPI and/or the editor(s) disclaim responsibility for any injury to people or property resulting from any ideas, methods, instructions or products referred to in the content.