A comprehensive analysis of data taken by a network of MPX devices is presented. The MPX devices are based on the Medipix-2 hybrid silicon pixel detector, which was developed by the Medipix-2 Collaboration [
4]. It consists of a ≈2 cm
silicon sensor matrix of
cells, bump-bonded to a readout chip. Each matrix element (
pixel,
thick) is connected to its respective readout chain integrated on the readout chip. Pulse height discriminators determine the input energy window and provide noise suppression. A counter in each pixel records interacting quanta of radiation, photons, neutrons, electrons, minimum ionizing particles and ions with energy deposits falling within the preset energy window [
5]. At LHC, the ALICE, ATLAS, CMS and LHCb Collaborations have elaborate systems of luminosity measurements, described in [
20,
21,
22,
23], respectively. A comparative study of their results and the MPX luminosity monitoring is beyond the scope of this article. The methods and techniques described in this article were pioneered for high-precision luminosity determination for the 2012 data-taking period at the LHC. These techniques and analysis methods are based on precision counting of particles passing the sensors. Similar requirements apply to analysis techniques used in other fields of research (e.g., medical applications and space science) where high precision and long-term time-stability of measurements are needed. MPX devices have already been successfully applied in these areas of research and the fundamental studies presented in this article can lead to further advances in their application.
The detection of charged particles in the MPX devices is based on the ionization energy deposited by particles passing through the silicon sensor. The signals are amplified and counted during an adjustable time window (frame) for each pixel. Neutral particles, however, need to be converted to charged particles before they can be detected. Therefore, a part of each silicon sensor is covered by a LiF converter.
The use of the MPX network for relative luminosity measurements in proton–proton collisions is studied here in detail.
2.1. MPX Luminosity from Hit Counting
The six MPX devices with the highest cluster rates, specified in
Table 1, are used (MPX01-05,13). Each device measures the luminosity independently and is cross-checked with the other devices. This is an intrinsic advantage of the MPX network.
Each MPX device has its own acquisition time window independent of the other devices. In order to compare luminosity measurements from different devices, a common time window is introduced, called luminosity block (LB), which is typically one minute long.
A small number of noisy pixels could have a significant effect on the luminosity measurement. Three independent methods differing in procedure and criteria for noisy pixel removal have been tested. The results of their respective luminosity measurements are compared as potential sources of systematic uncertainty.
Method 1: A pixel is defined as noisy if its count rate is more than five standard deviations from the average. If a pixel is found to be noisy in a 24 h reference period (chosen as the day in 2012 that had the largest number of noisy pixels), it is removed from the entire 2012 data-taking period. A linear interpolation is made between the rates (number of hits per second) in different frames. The hit rate at the middle of an LB is obtained from this interpolation.
Method 2: Noisy pixel removal is done frame by frame, i.e., a different set of noisy pixels is removed in each frame. Noisy pixels are those with a counting rate that differs from the mean by more than a luminosity-dependent threshold. The MPX luminosity from frames falling within an LB is used without an interpolation. A correction is made for the relative duration of the MPX frames and of the LB.
Method 3: Noisy pixel removal is done frame by frame. The counts of 15 frames (the frame under investigation and seven frames before and after) are summed, and a pixel is removed if the sum of these counts is above a threshold. An interpolation of the frame hit rate at the time of each LB is done as in method 1.
All three methods show a significant increase in the number of noisy pixels with time, when applied to MPX01 data. This might indicate possible radiation damage in the readout chip. In method 1 (method 2), the number of noisy pixels in MPX01 increases from less than 10 (300) in April 2012 to about 300 (1800) at the end of November 2012. The other devices have a smaller number of noisy pixels since they are exposed to a much lower particle flux (
Table 1).
The luminosities measured with the three methods were compared in short (frame-by-frame) and long (7 month) time periods. Depending on the MPX device considered, the frame-by-frame agreement varies from a few percent to less than 0.1% (for MPX01). The largest variation is between method 2 and the other two methods. We have determined that most of this variation is attributed to the conversion between frames and LBs in method 2. In the following, method 1 is used, and thus the same noisy pixels are removed for the whole 2012 data-taking period.
During the analysis of the MPX data, time-shifts between the three readout PCs were noticed. Therefore, they were synchronized off-line by analyzing the rising and falling luminosity curves when an LHC fill starts and ends. A time accuracy better than the LB length was therefore achieved.
In the process of performing the luminosity determination with MPX devices, the activation of the ATLAS detector material was investigated and found to have a negligible effect. A dedicated analysis of activation effects is given in
Section 6.2.
First, the hit rates per frame are converted into hit rates per LB for each MPX device separately. The procedure is described below. Frames within the time window of the LB are selected. The hit rates of these frames are averaged. Thus, one hit rate is stored per LB. Given that the acquisition times vary between 5 and 120 s, the number of frames used per LB varies for the six MPX devices. If there is no hit rate for a given LB, the previous LB hit rate is used. In the MPX luminosity analysis, only those LBs are used, for which all six MPX devices (MPX01-05 and MPX13) were operational.
The hit rate for the MPX01 device is normalized to units of luminosity by multiplying with the factor
derived in
Section 2.4. Then, the other devices are normalized to MPX01 based on the average hit rate for the June to November 2012 running period.
Table 2 summarizes the normalization factors.
The average luminosity (MPXav) for all other devices (excluding the one under consideration) is calculated LB-by-LB. Using this normalization factor, each MPX device obtains an equal weight, although the MPX devices have largely varying particle fluxes (hit rates).
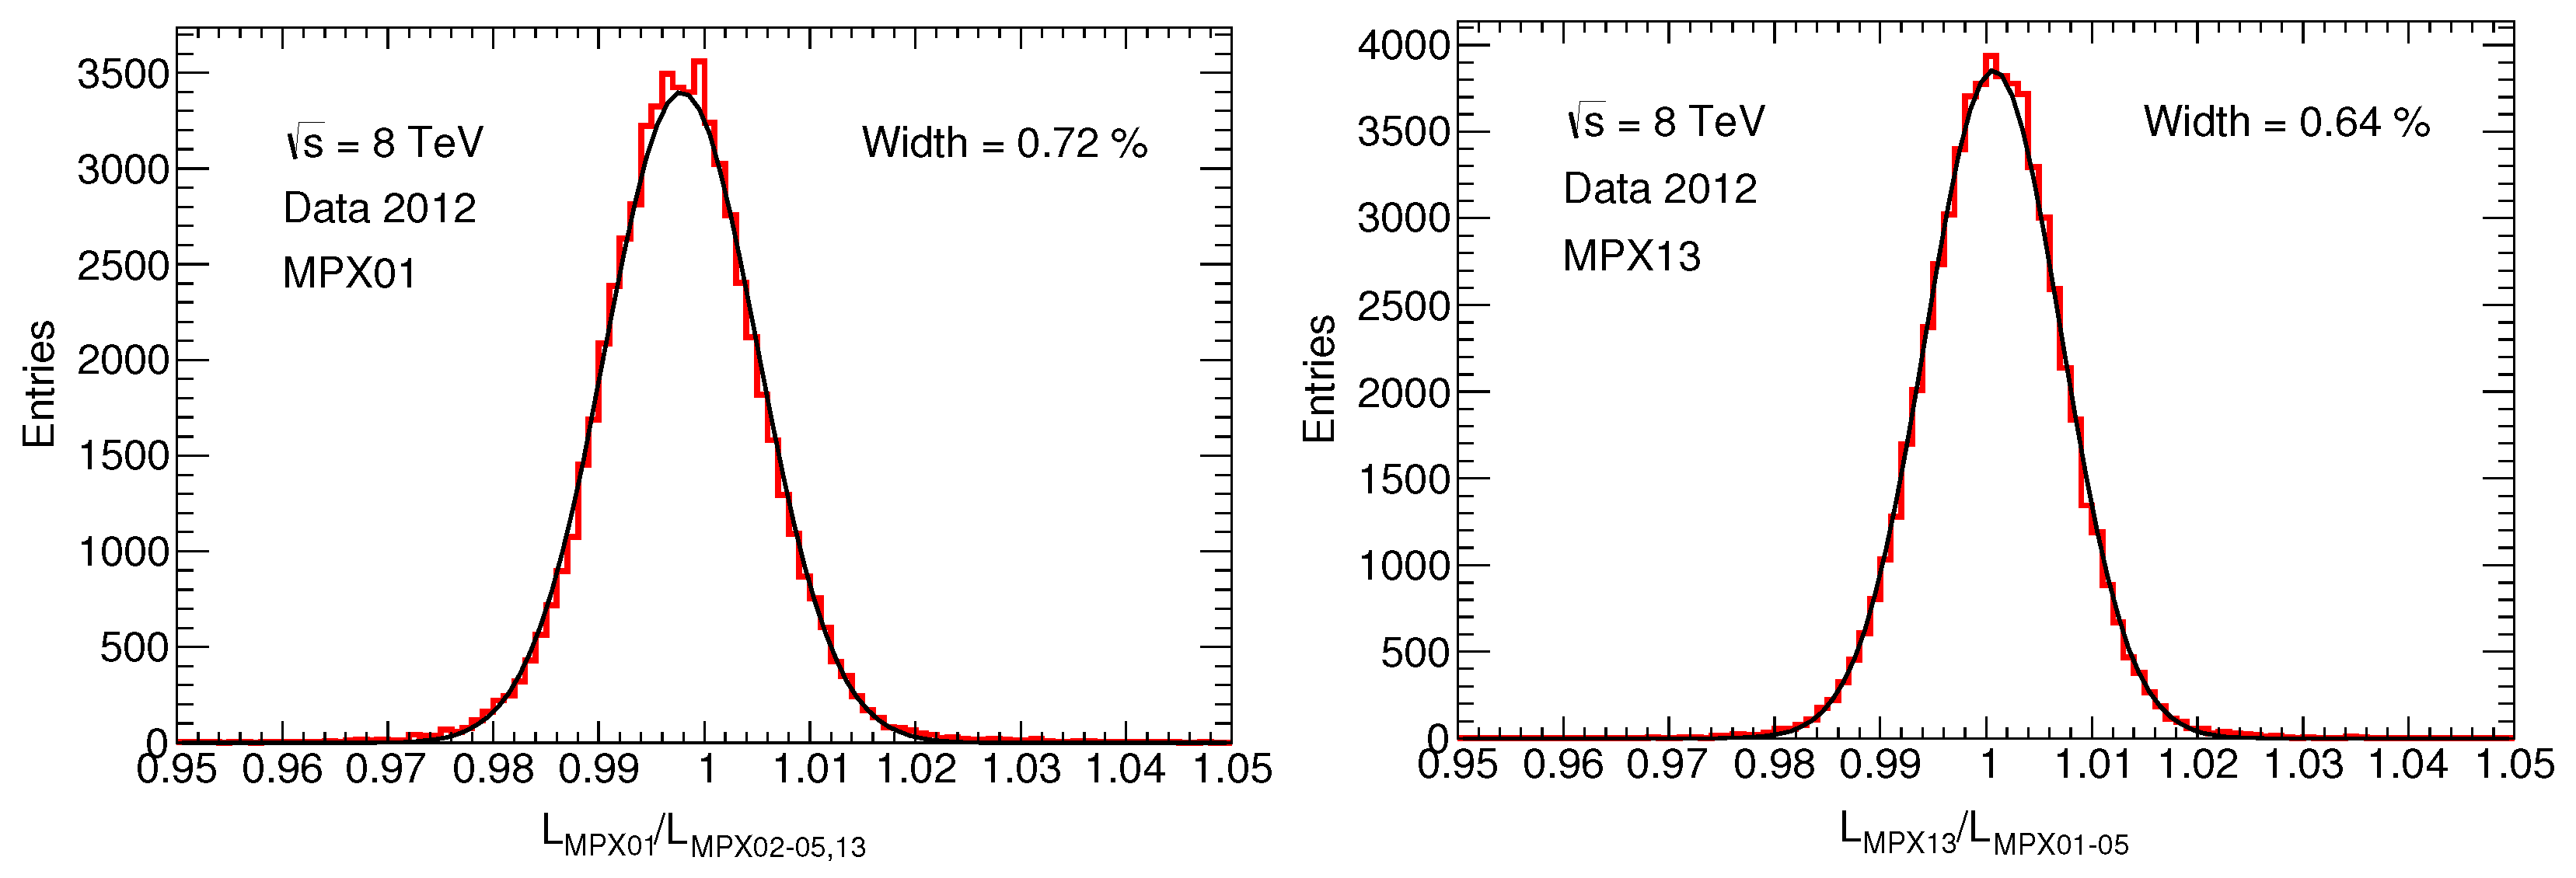
The MPX/MPXav ratio is calculated LB-by-LB for the six MPX devices.
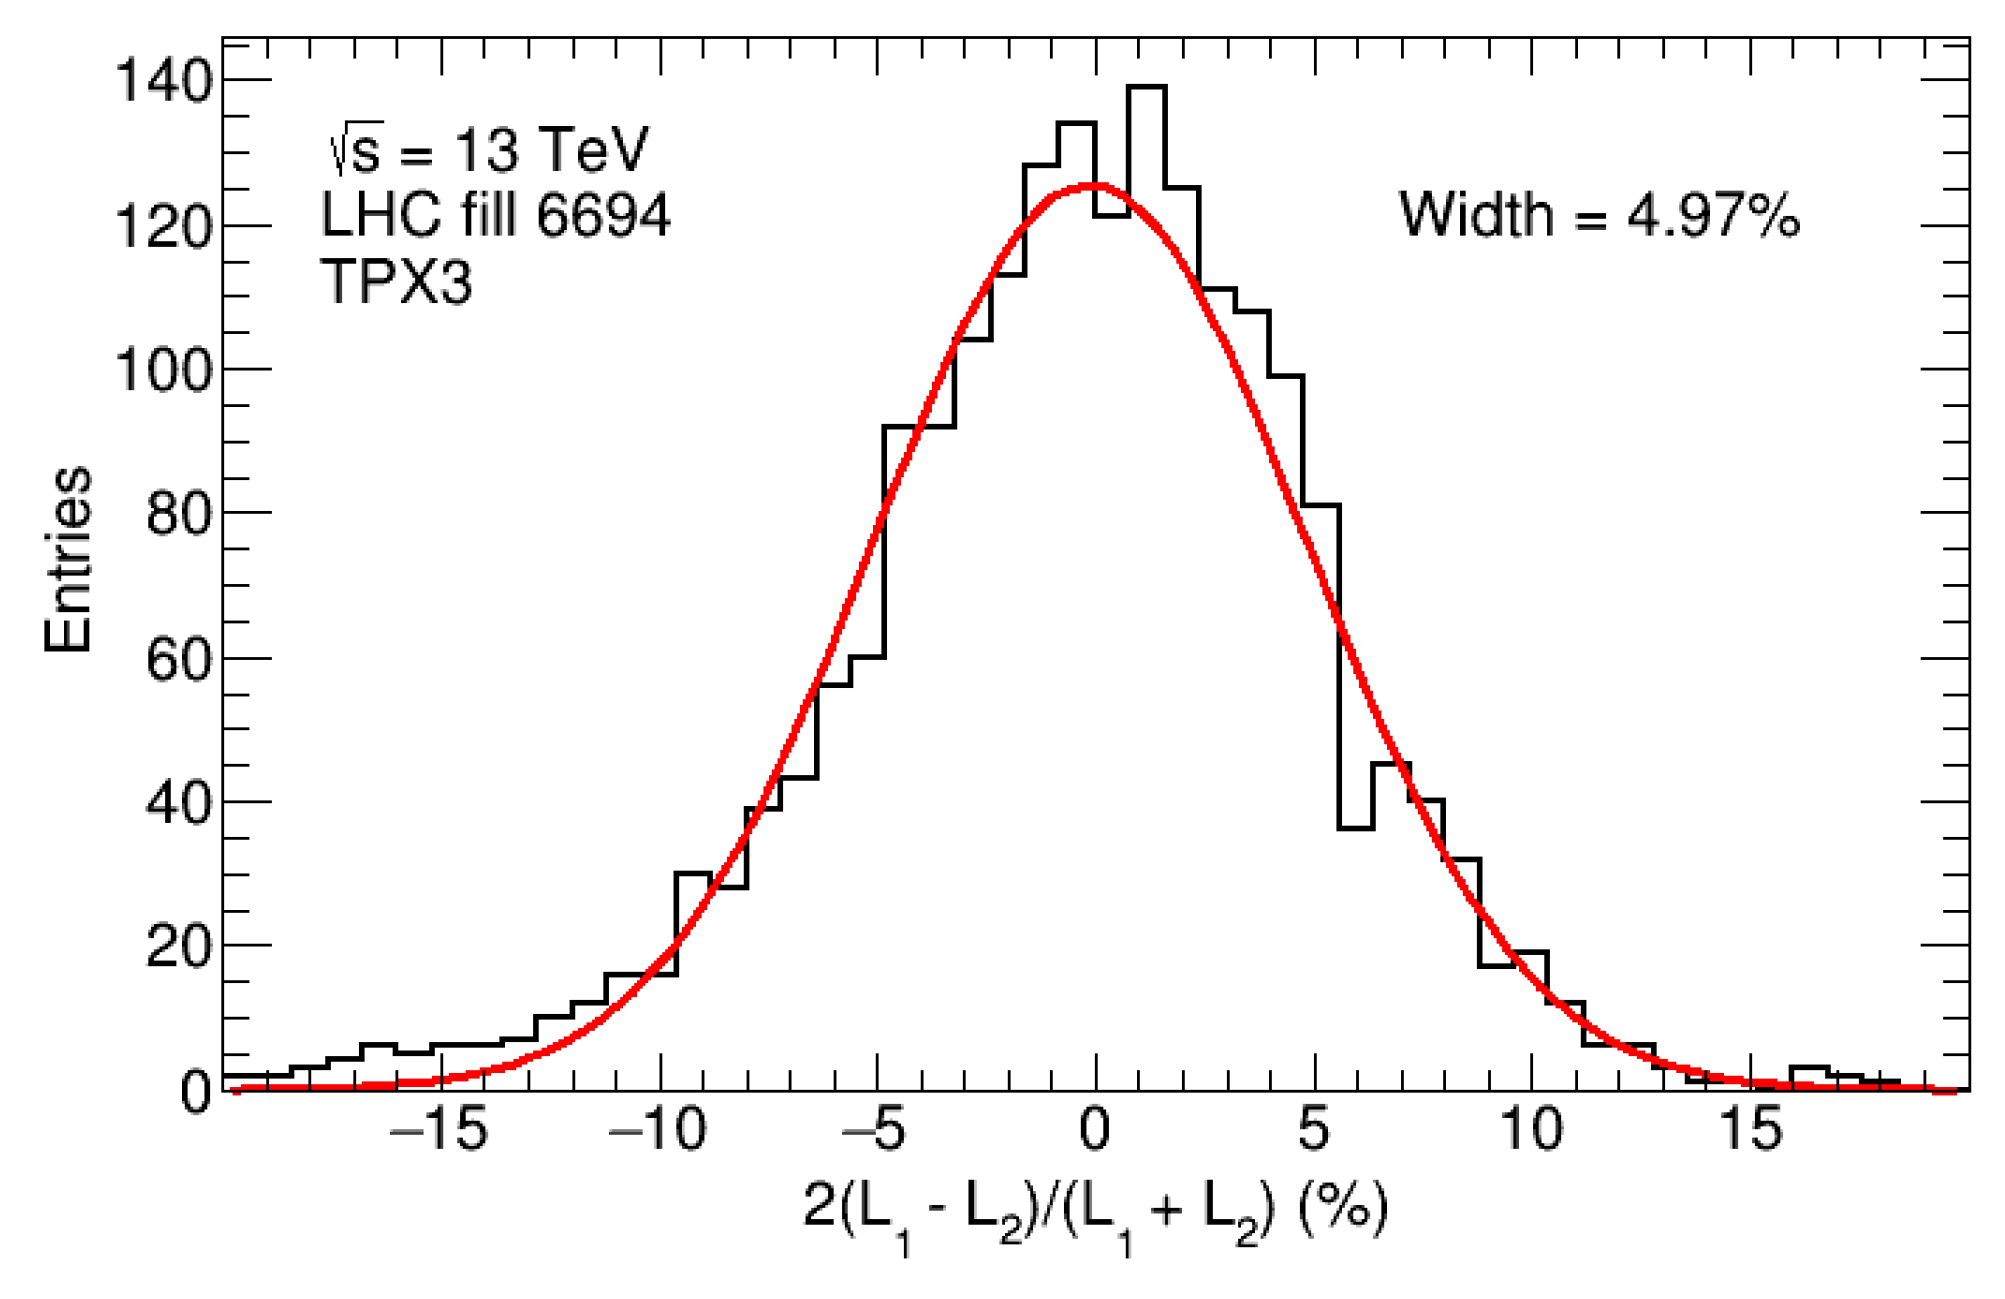
Figure 5 shows the luminosity ratio per LB for the June–November 2012 data-taking period for MPX01 and MPX13. A single Gaussian fit is applied using the statistical uncertainty
in each bin.
Table 2 summarizes the Gaussian fit values. The width of these fits vary between 0.6% and 1.2% depending on the MPX device.
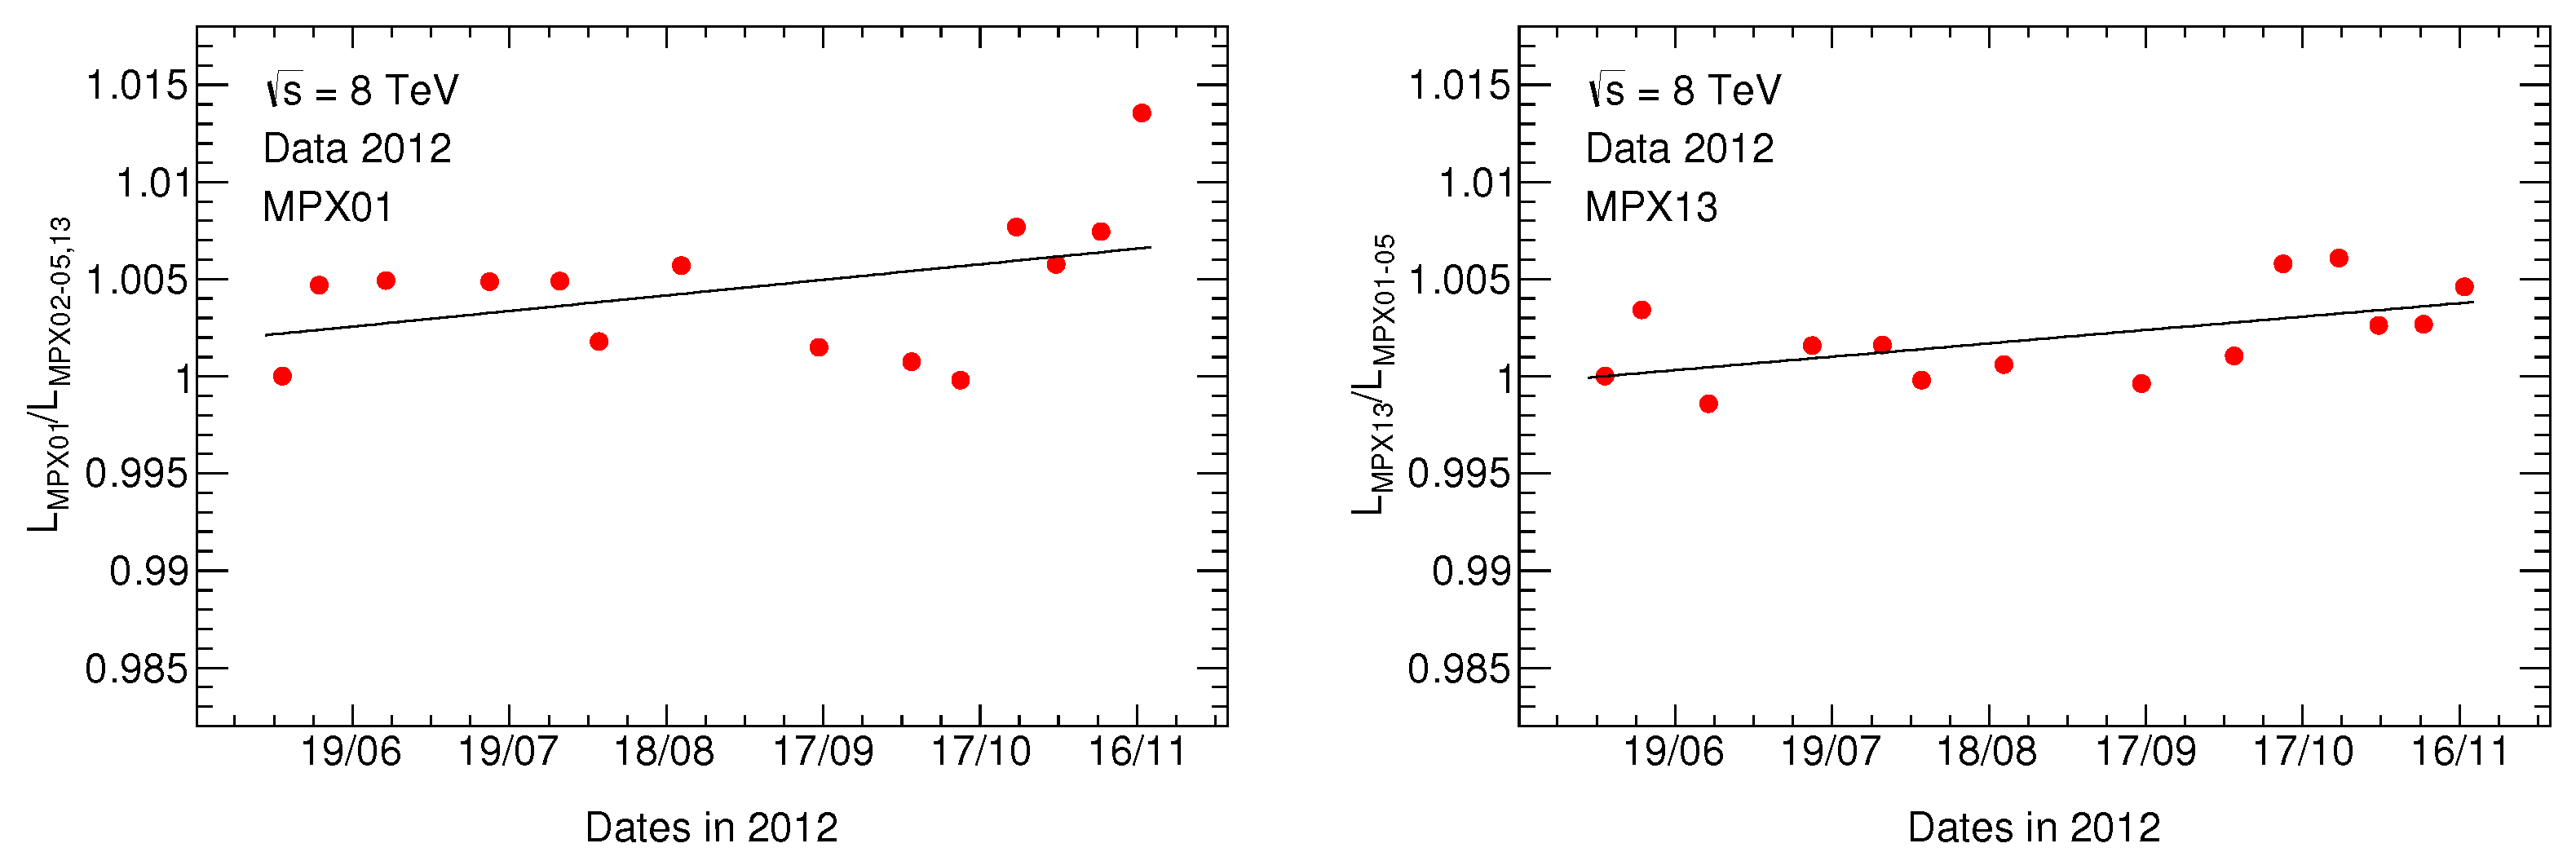
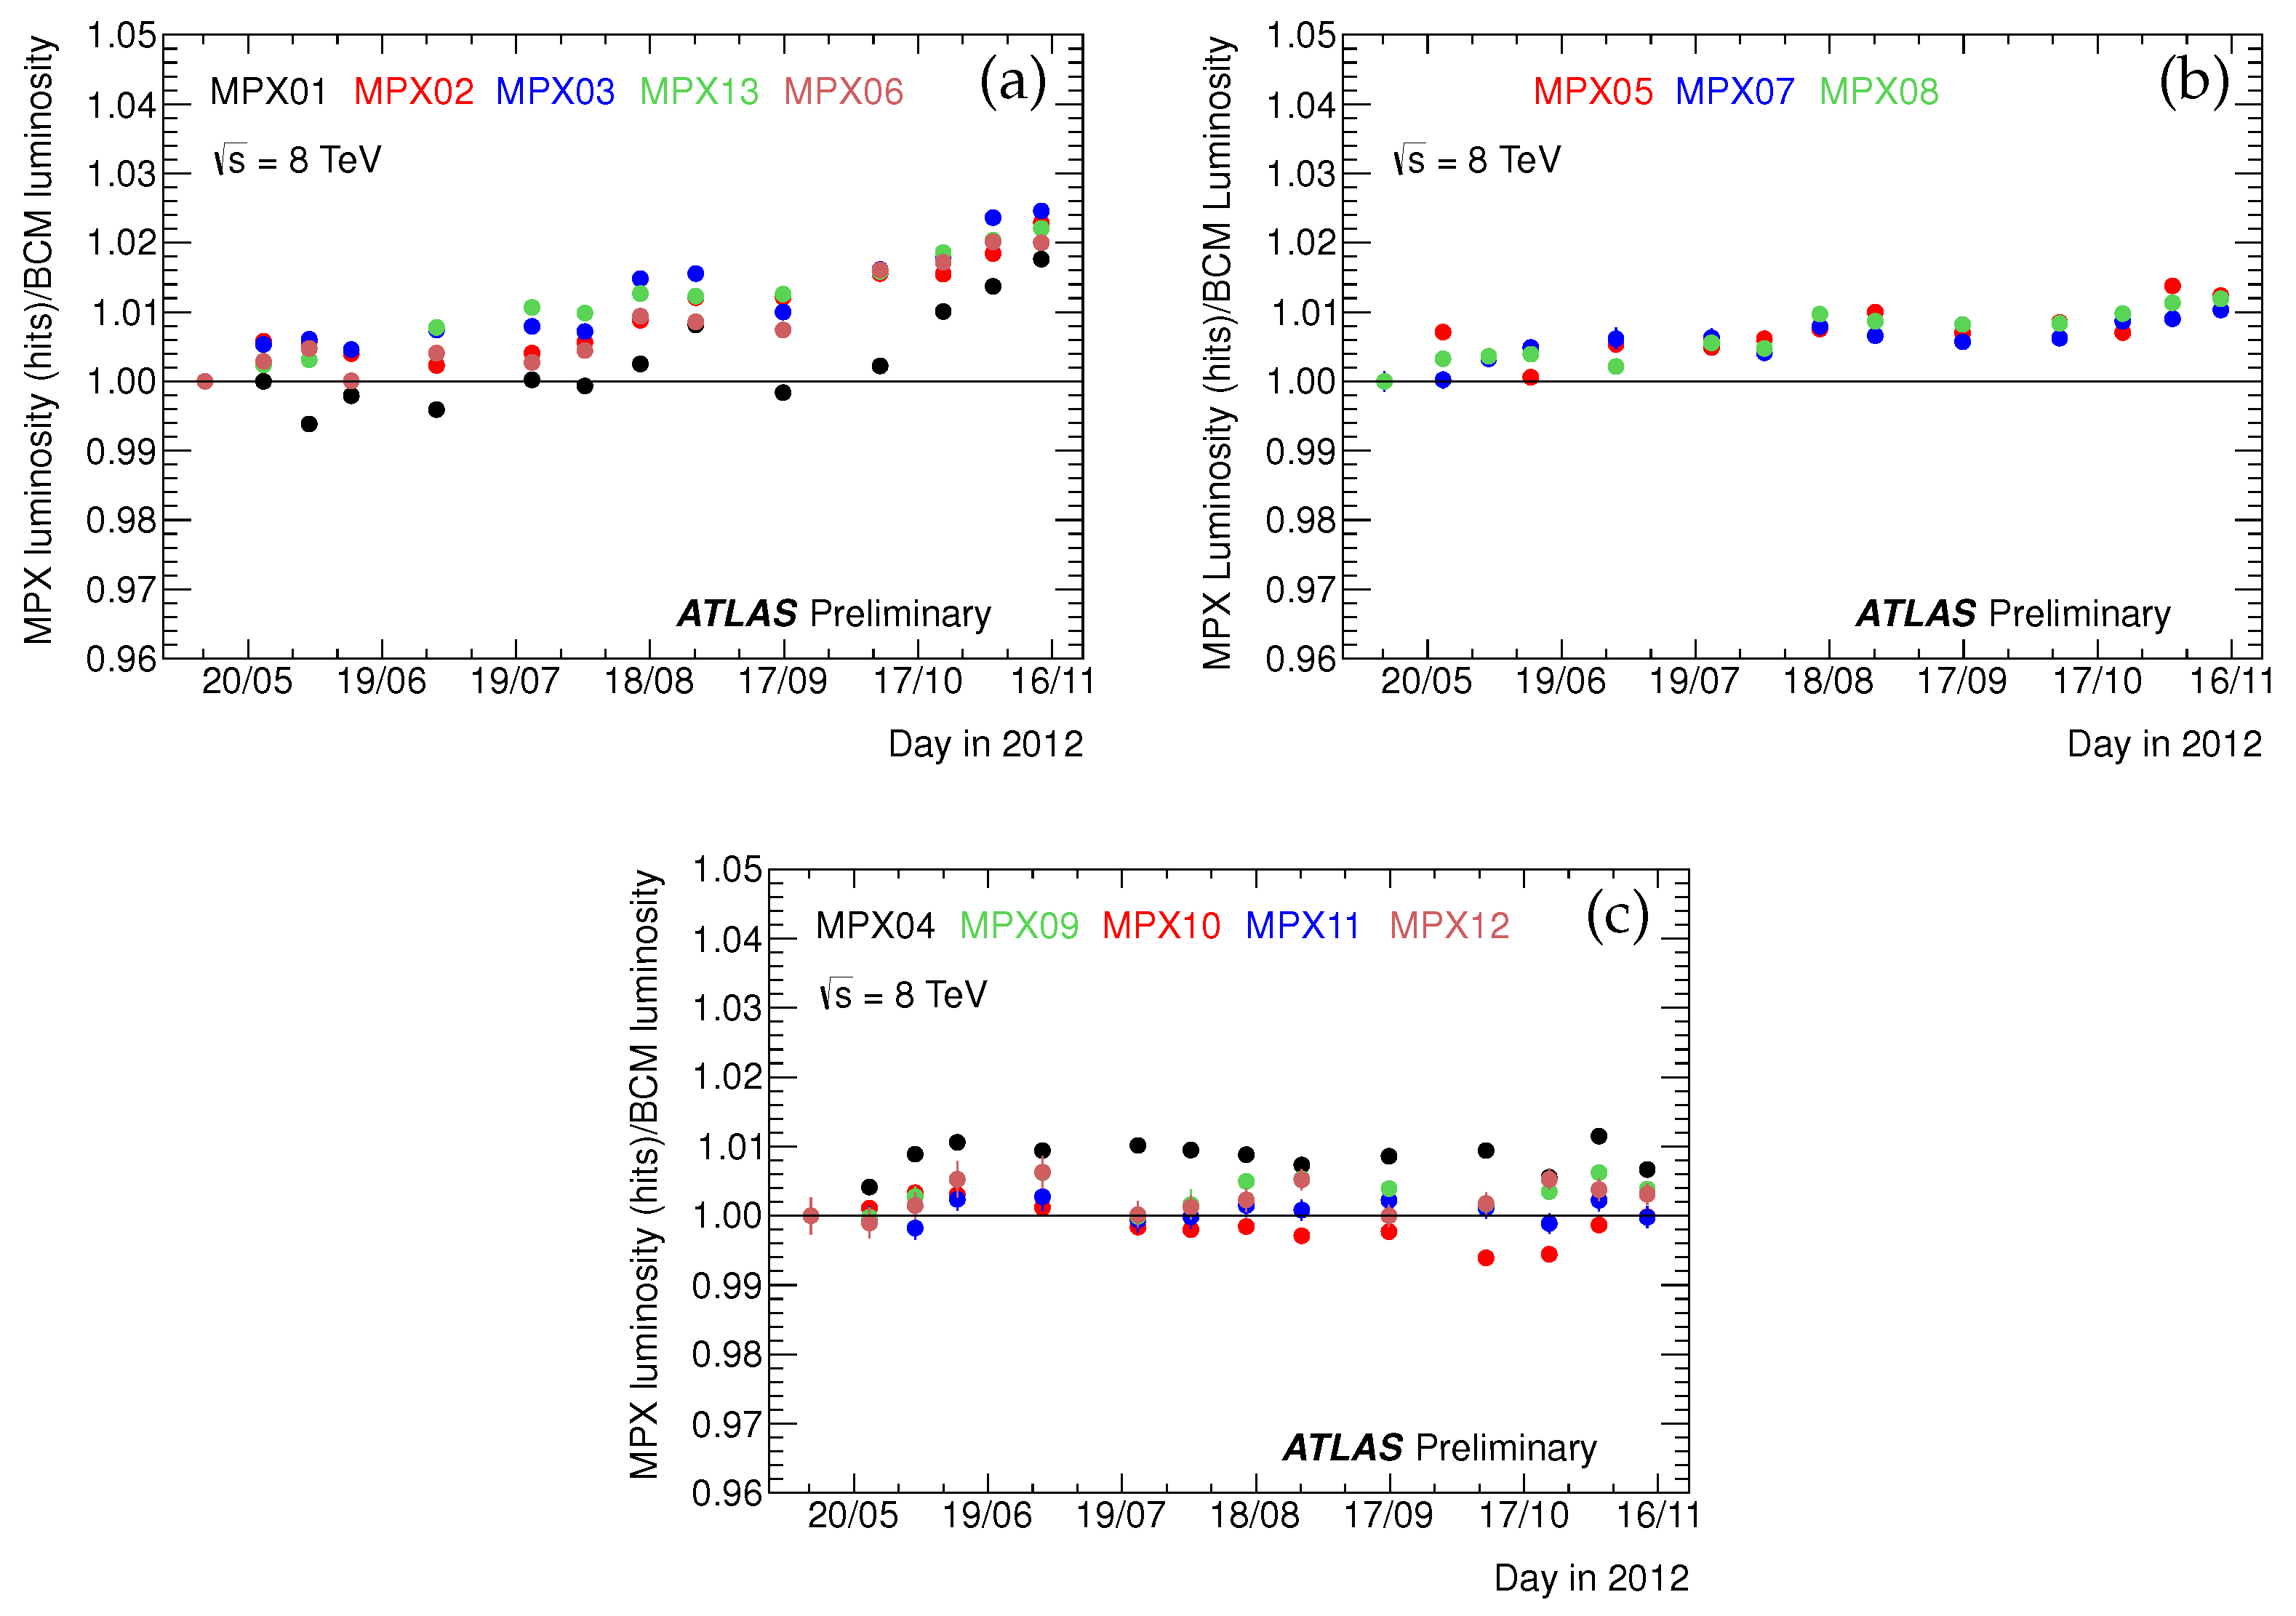
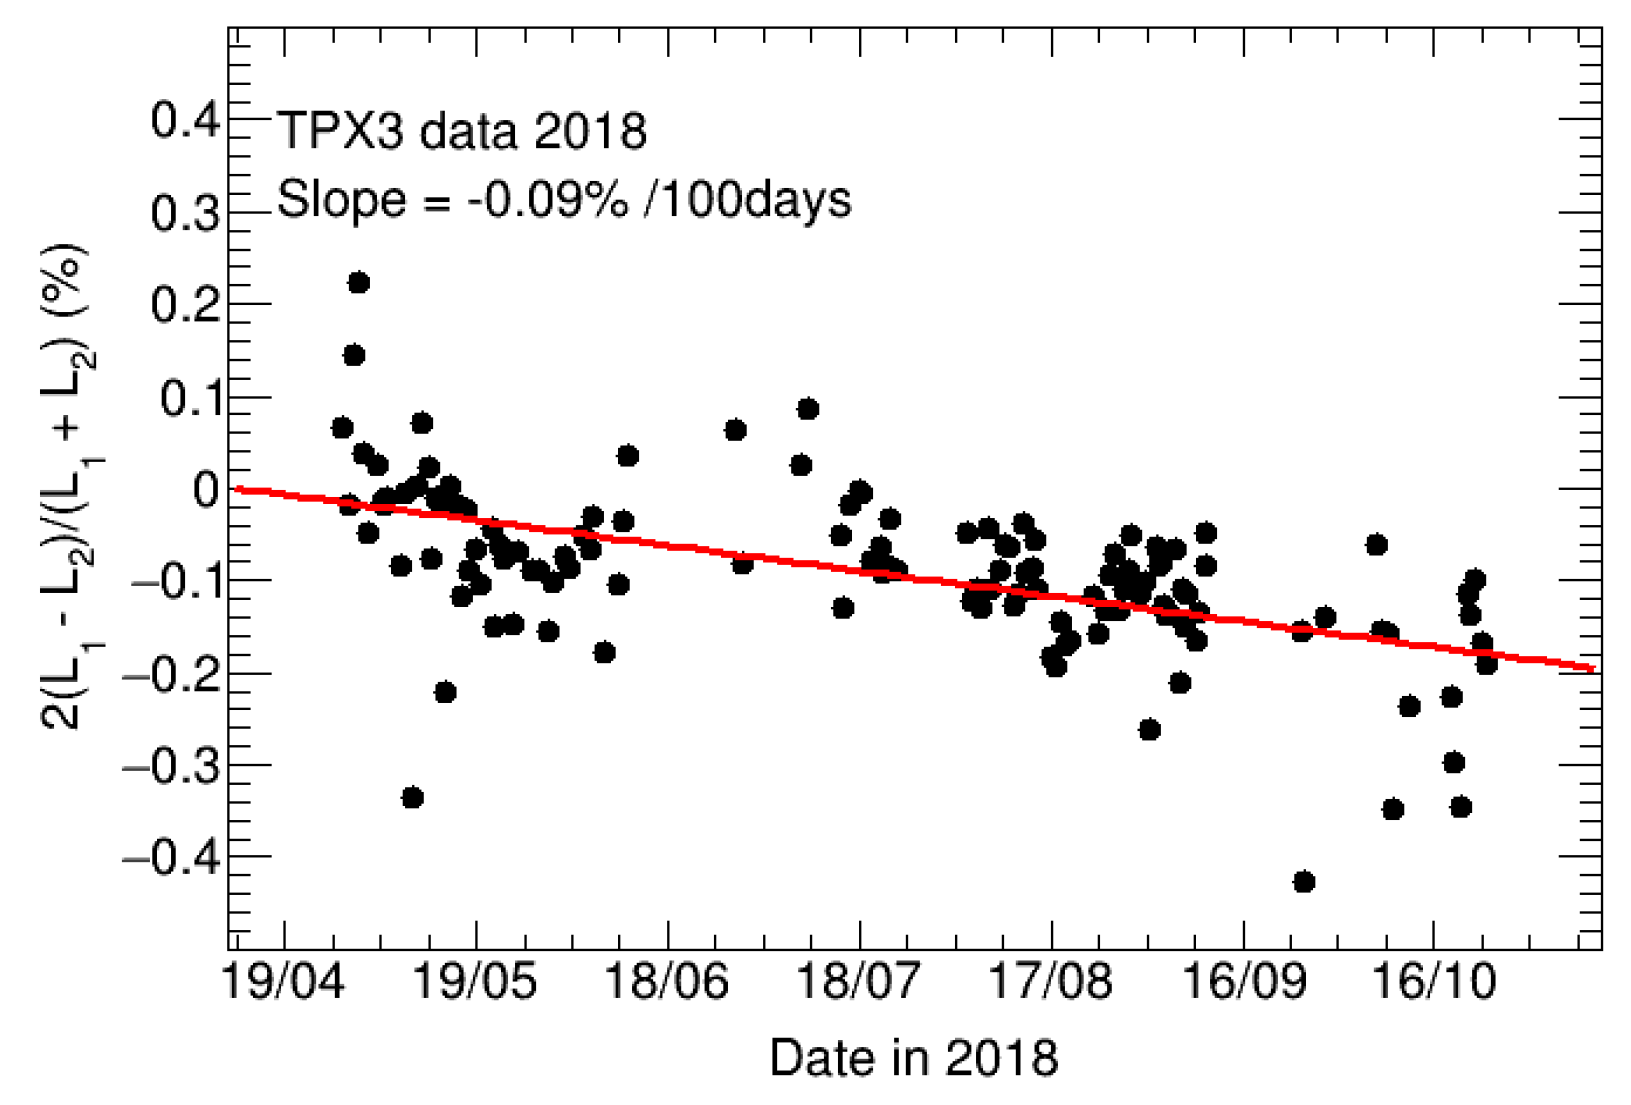
In addition, the long-term time stability (internal stability) of the six MPX devices is studied. For this study, the LBs for which all the MPX devices were operational are grouped into 14 time periods, such that each time period contains the same number of LBs. The luminosity ratio of an individual MPX device to the average of all other MPX devices (MPXav) is calculated for each time period and examples for MPX01 and MPX13 are given in
Figure 6. A normalization is applied such that the ratio is unity in time period 1 for each MPX device.
A linear fit is applied to the MPX/MPXav luminosity ratio versus time for the June to November 2012 data-taking period. The slope of the linear fit is taken as a measure of time stability. The obtained slope values and their uncertainties are summarized in
Table 3. The variance of these slope measurements is 0.69 [% per 200 days]
. The resulting standard deviation of 0.83 [% per 200 days] is used as an estimation of the systematic uncertainty.
In summary, for the six high statistics MPX devices the width of the fluctuations LB-by-LB is between 0.6 and 1.2%, and the time-stability from June to November 2012 is better than 1%. This gives us an indication of the time stability of MPX luminosity monitoring.
2.2. MPX Luminosity from Heavy Blob (Thermal Neutron) Counting
Thermal neutrons are detected by MPX devices via
reactions in a
converter layer with a thickness of 2–3 mg/cm
on average [
5] (
Section 2.3). In MPX tracking mode, tritons and alpha particles are registered by Si-sensors as so-called heavy blobs, HB (large round-shaped pixel clusters). The typical detection efficiency for thermal neutrons is 1%, determined from individual calibrations of the MPX devices in a thermal neutron field [
5] (
Section 2.3). Hence, the HB count rate is used as a measure of instantaneous luminosity since neutrons are generated in the LHC collisions.
The MPX06 to MPX12 devices are used for the HB (thermal neutron) counting since the pixel matrix occupancy for these devices is sufficiently small for pattern recognition. A dedicated study was performed to determine the misidentification of heavy blobs that are lost due to the overlap with other clusters [
5] (
Section 2.2). The resulting correction factors, specific to each MPX device, depend on the number of clusters per frame (i.e., on the LHC collision rate, on the device location and on the acquisition time). The precision of these correction factors was estimated to be below 1% with the exception of MPX06 with the largest pixel occupancy. Therefore, MPX06 was not used for the precision study and combination with the other devices.
An analytic model for the cluster overlap probability has been developed and agrees with the experimental results for simple cluster shapes.
The distribution of heavy blobs per frame recorded within the MPX12 region covered by a
converter is described well by a Poisson distribution, demonstrated in [
12].
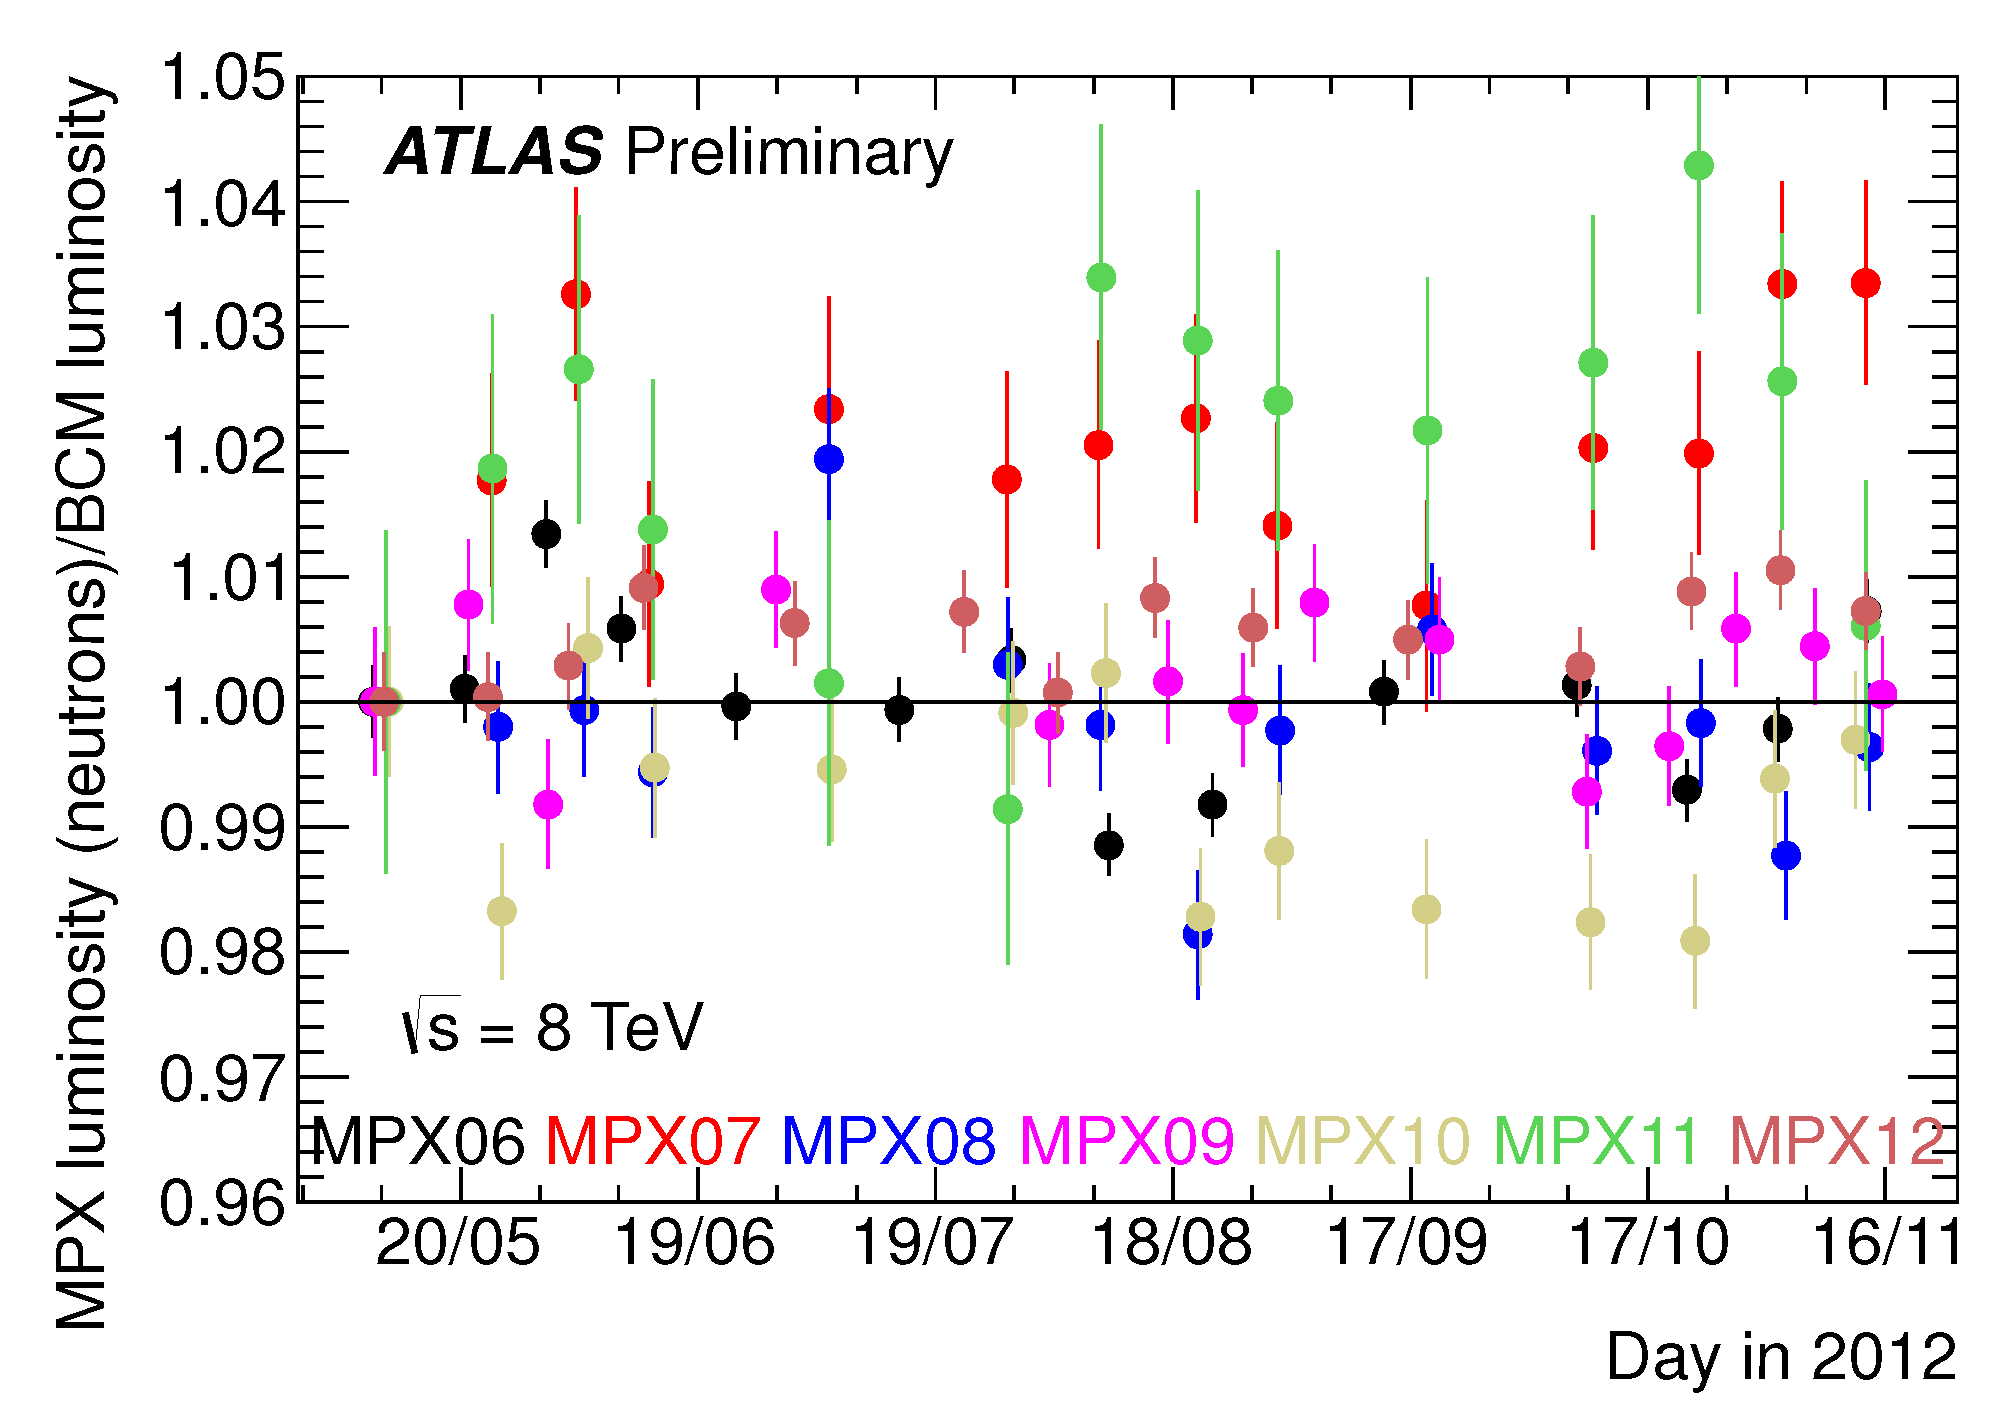
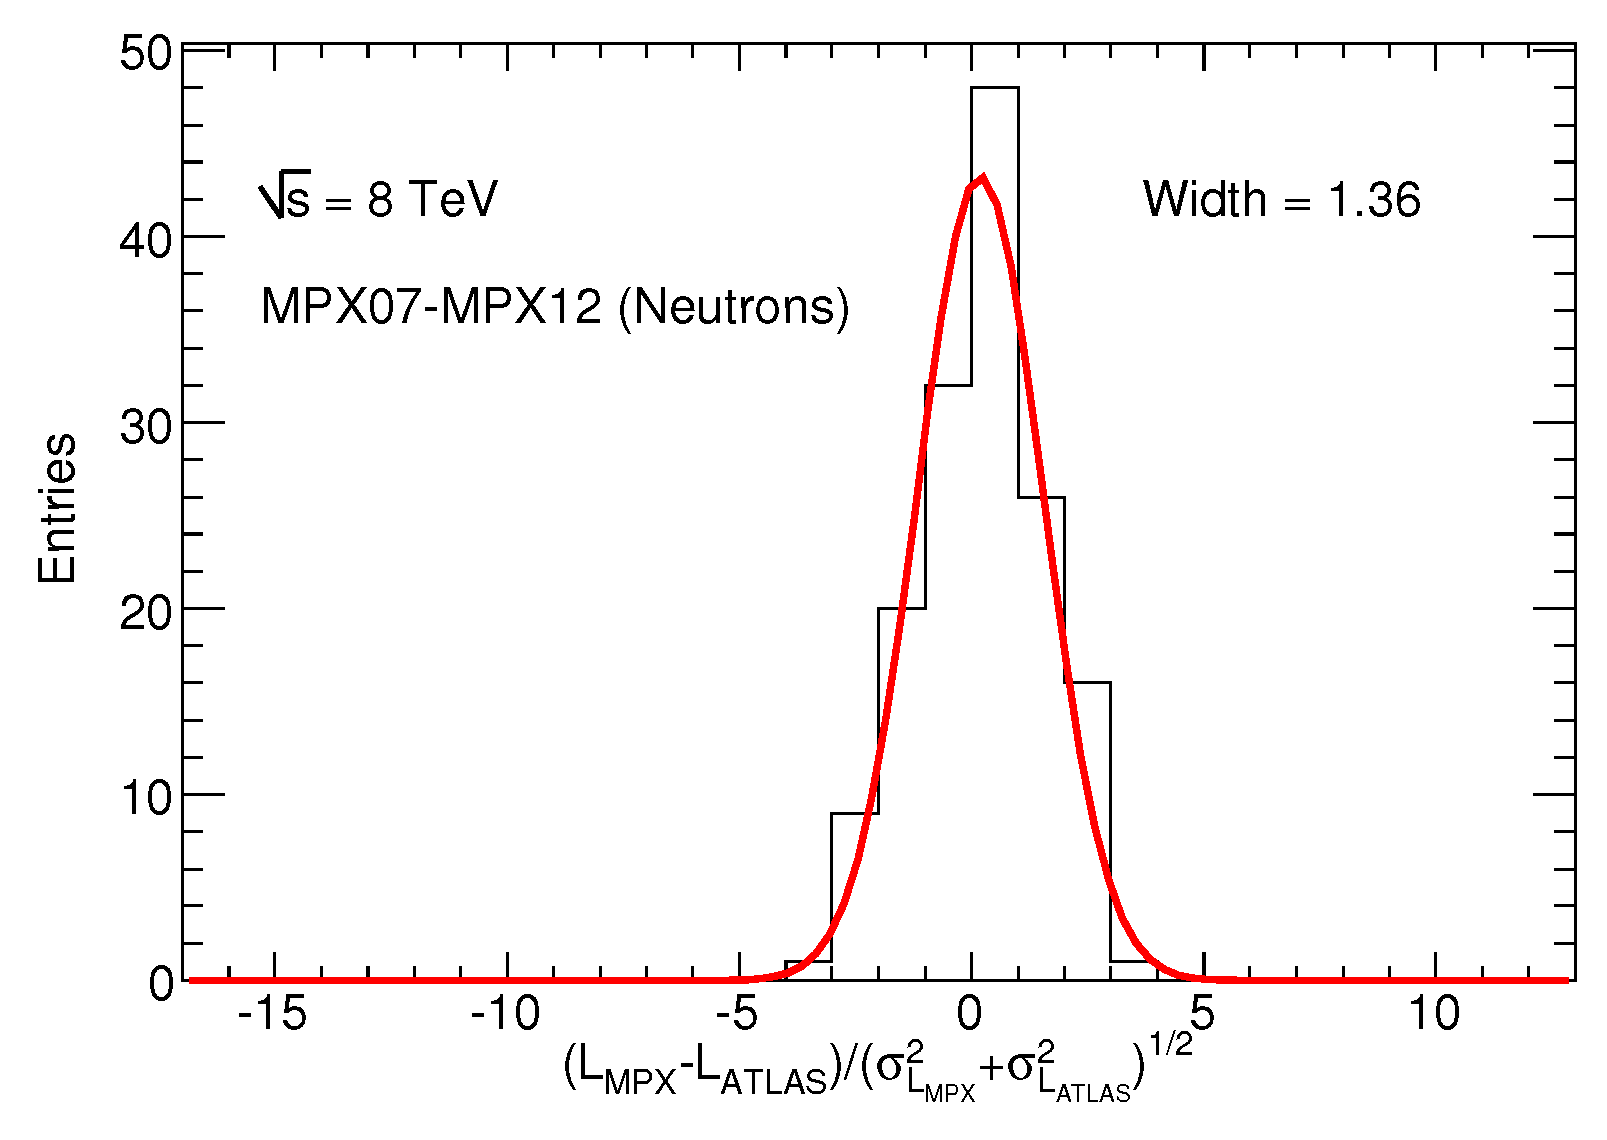
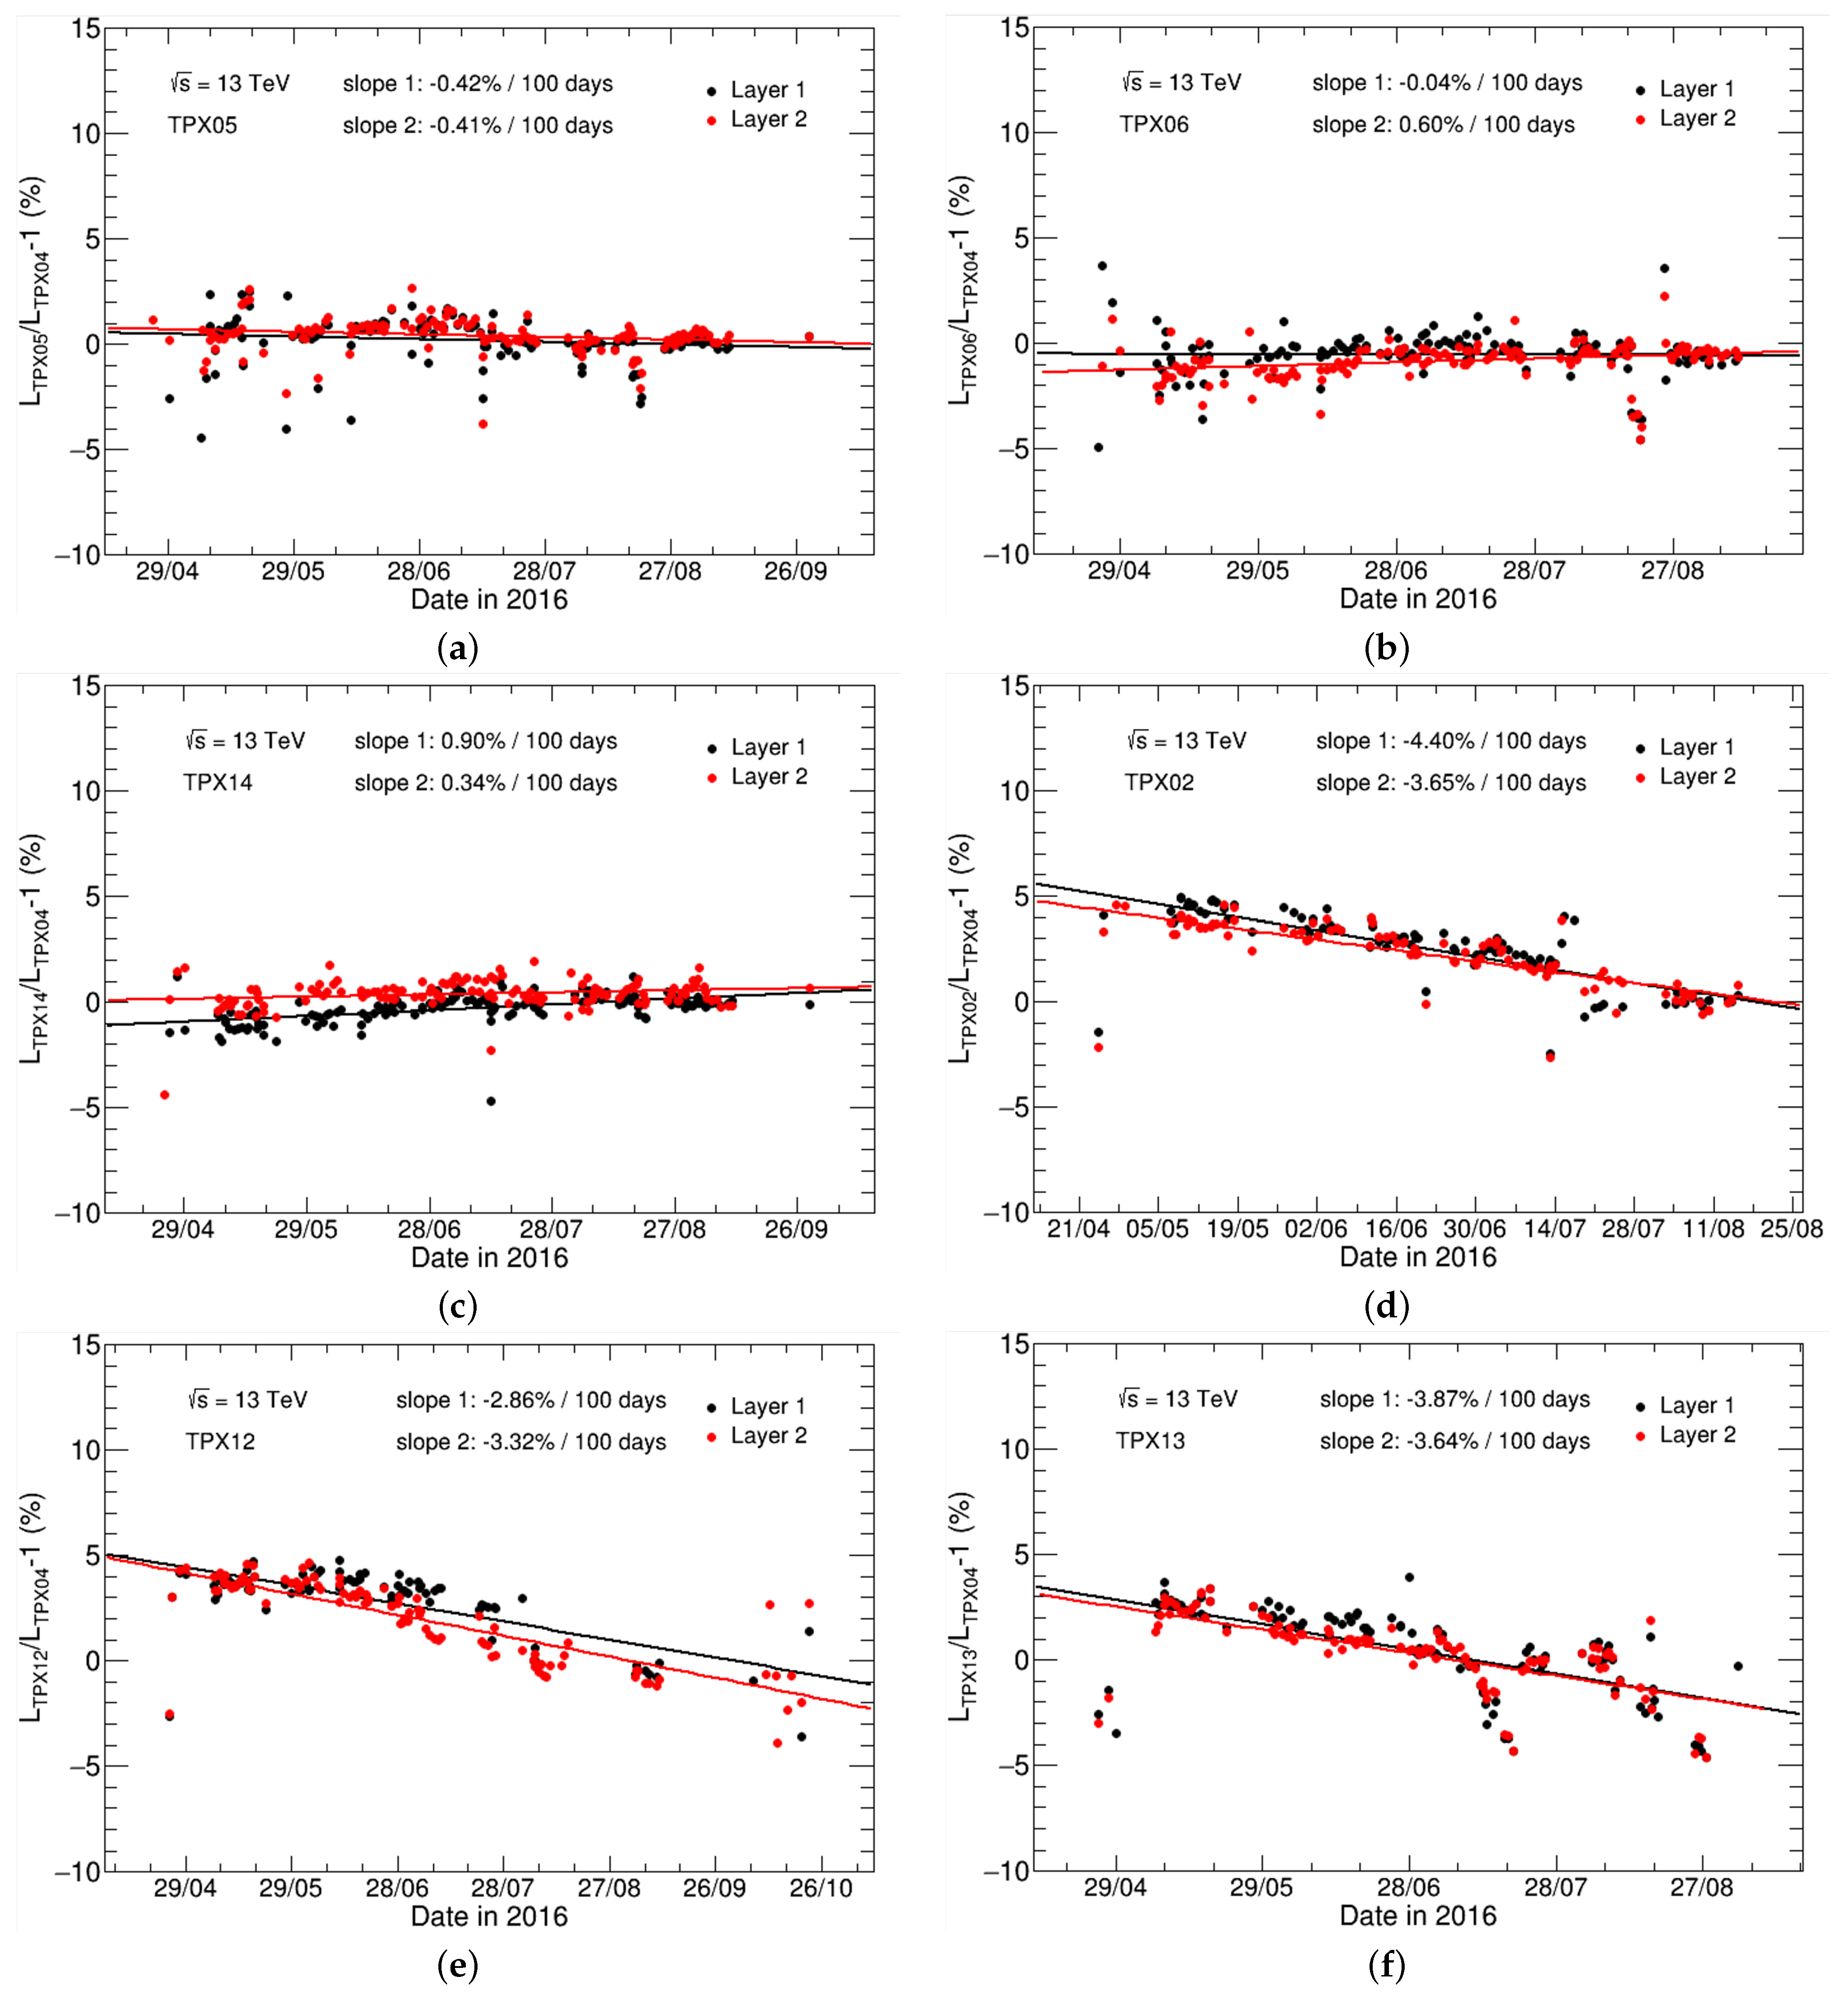
For luminosity determination, the overlap corrected number of heavy blobs (cHB) is used for each MPX device. The number of cHB per frame is converted into LBs, similar to the hit analysis. Frames that lie within the time window of the LB are selected. The numbers of cHB of these frames are averaged for all operational MPX devices. Only those LBs for which all MPX devices (MPX07-12) were operational are used.
These LBs are grouped into 14 time periods, such that each time period has an equal number of LBs, in the same way as was done for the hit analysis. For each time period, the number of cHB are summed for each MPX device. The summed cHB are converted into luminosity using a normalization factor such that the luminosity ratio MPX/MPXav of time period 1 is unity. In order to calculate the luminosity ratio MPX/MPXav for each time period, the weighted luminosity average of all the devices (excluding the device under consideration) used in MPXav is determined. For each device and each time period, the statistical uncertainty is , where is the summed number of heavy blobs.
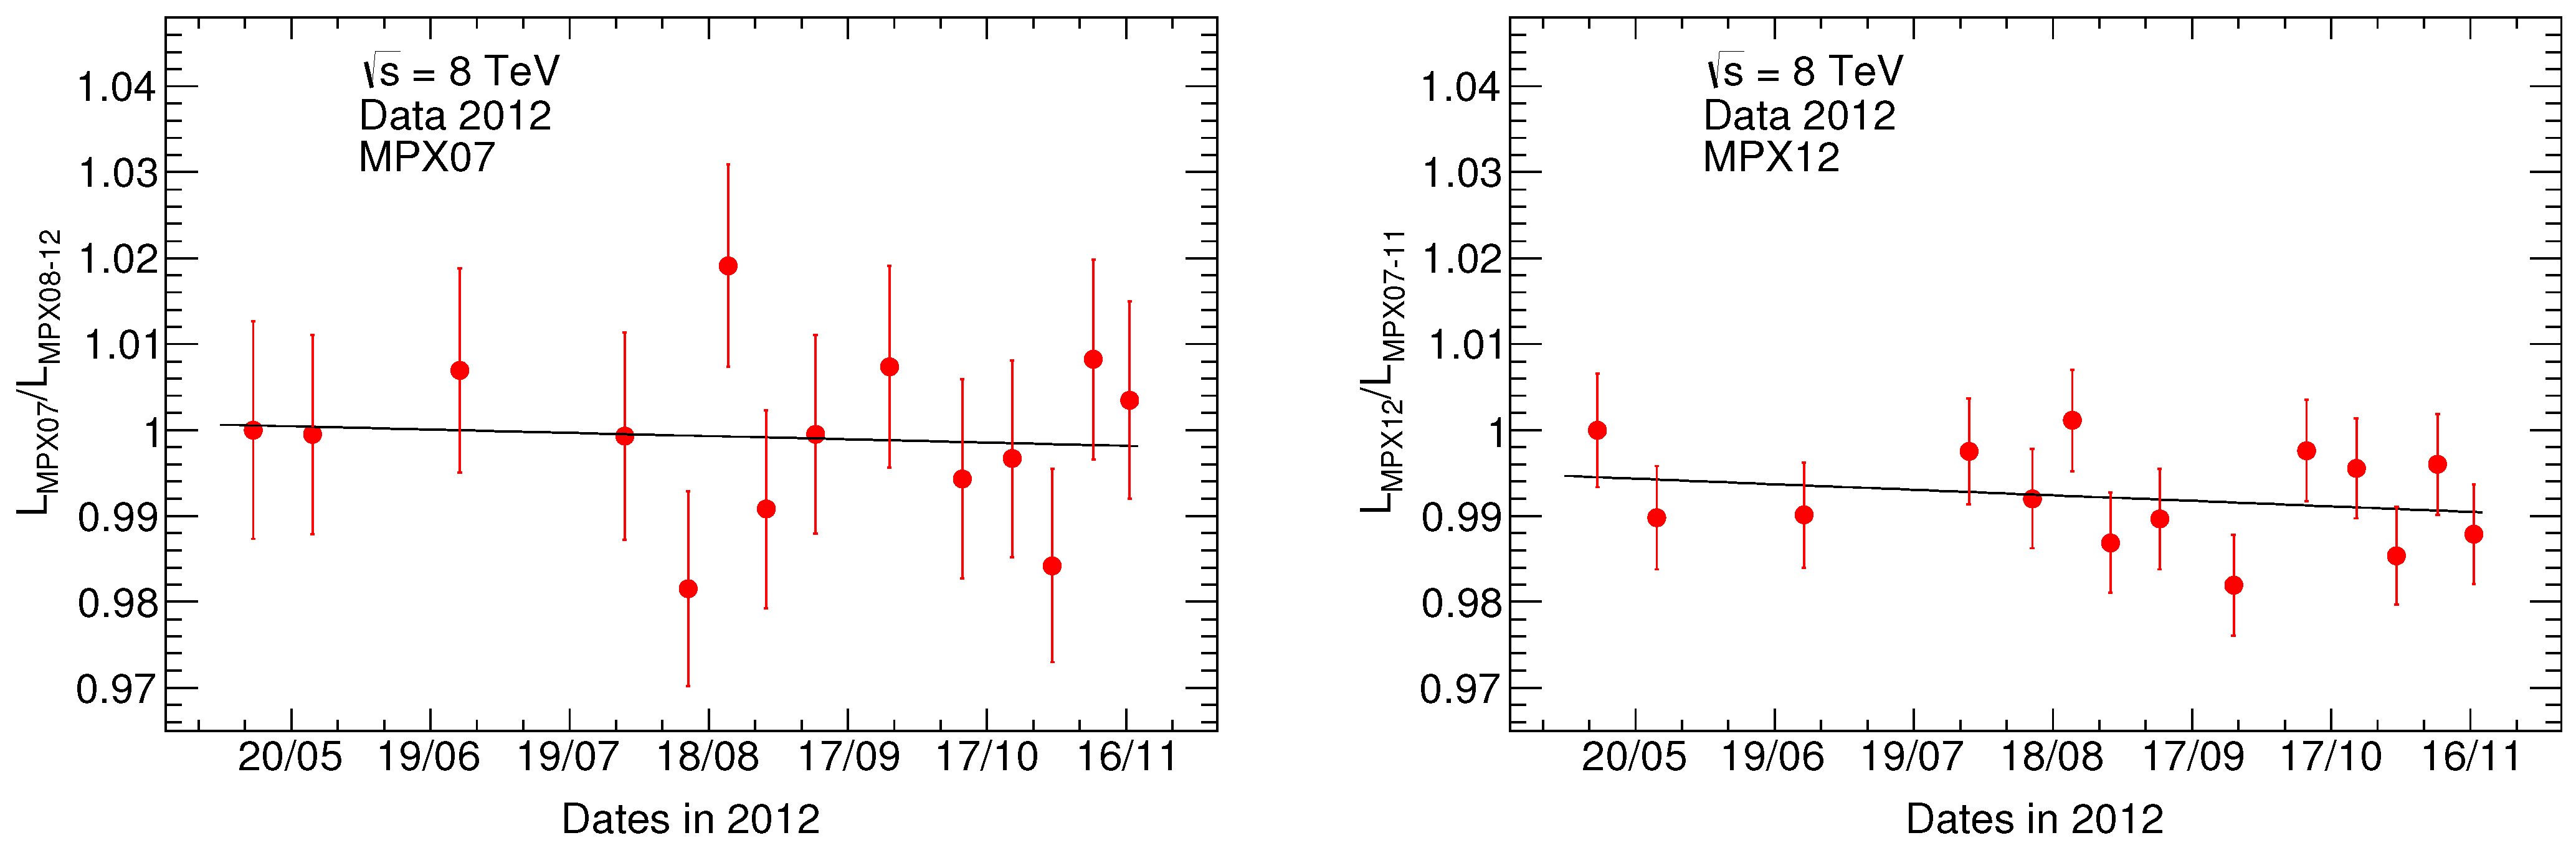
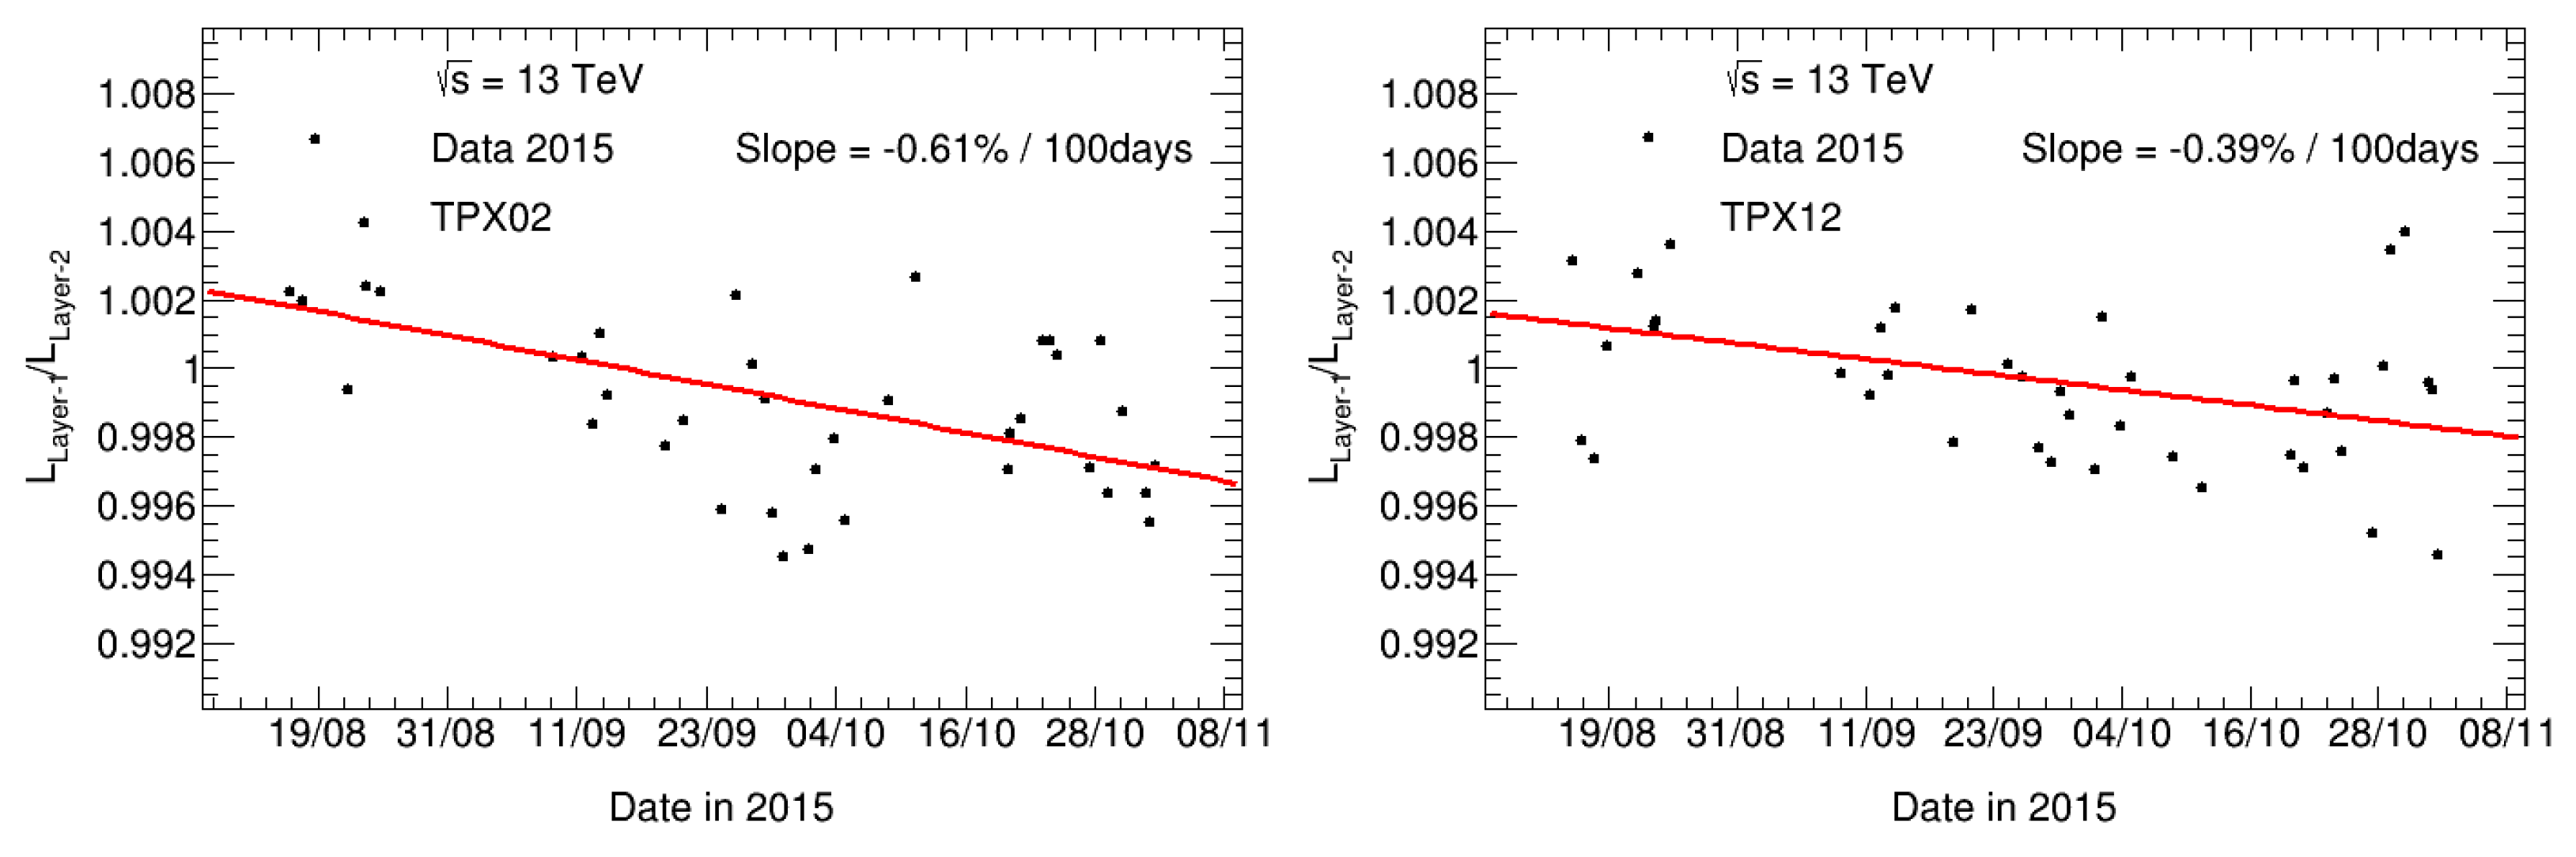
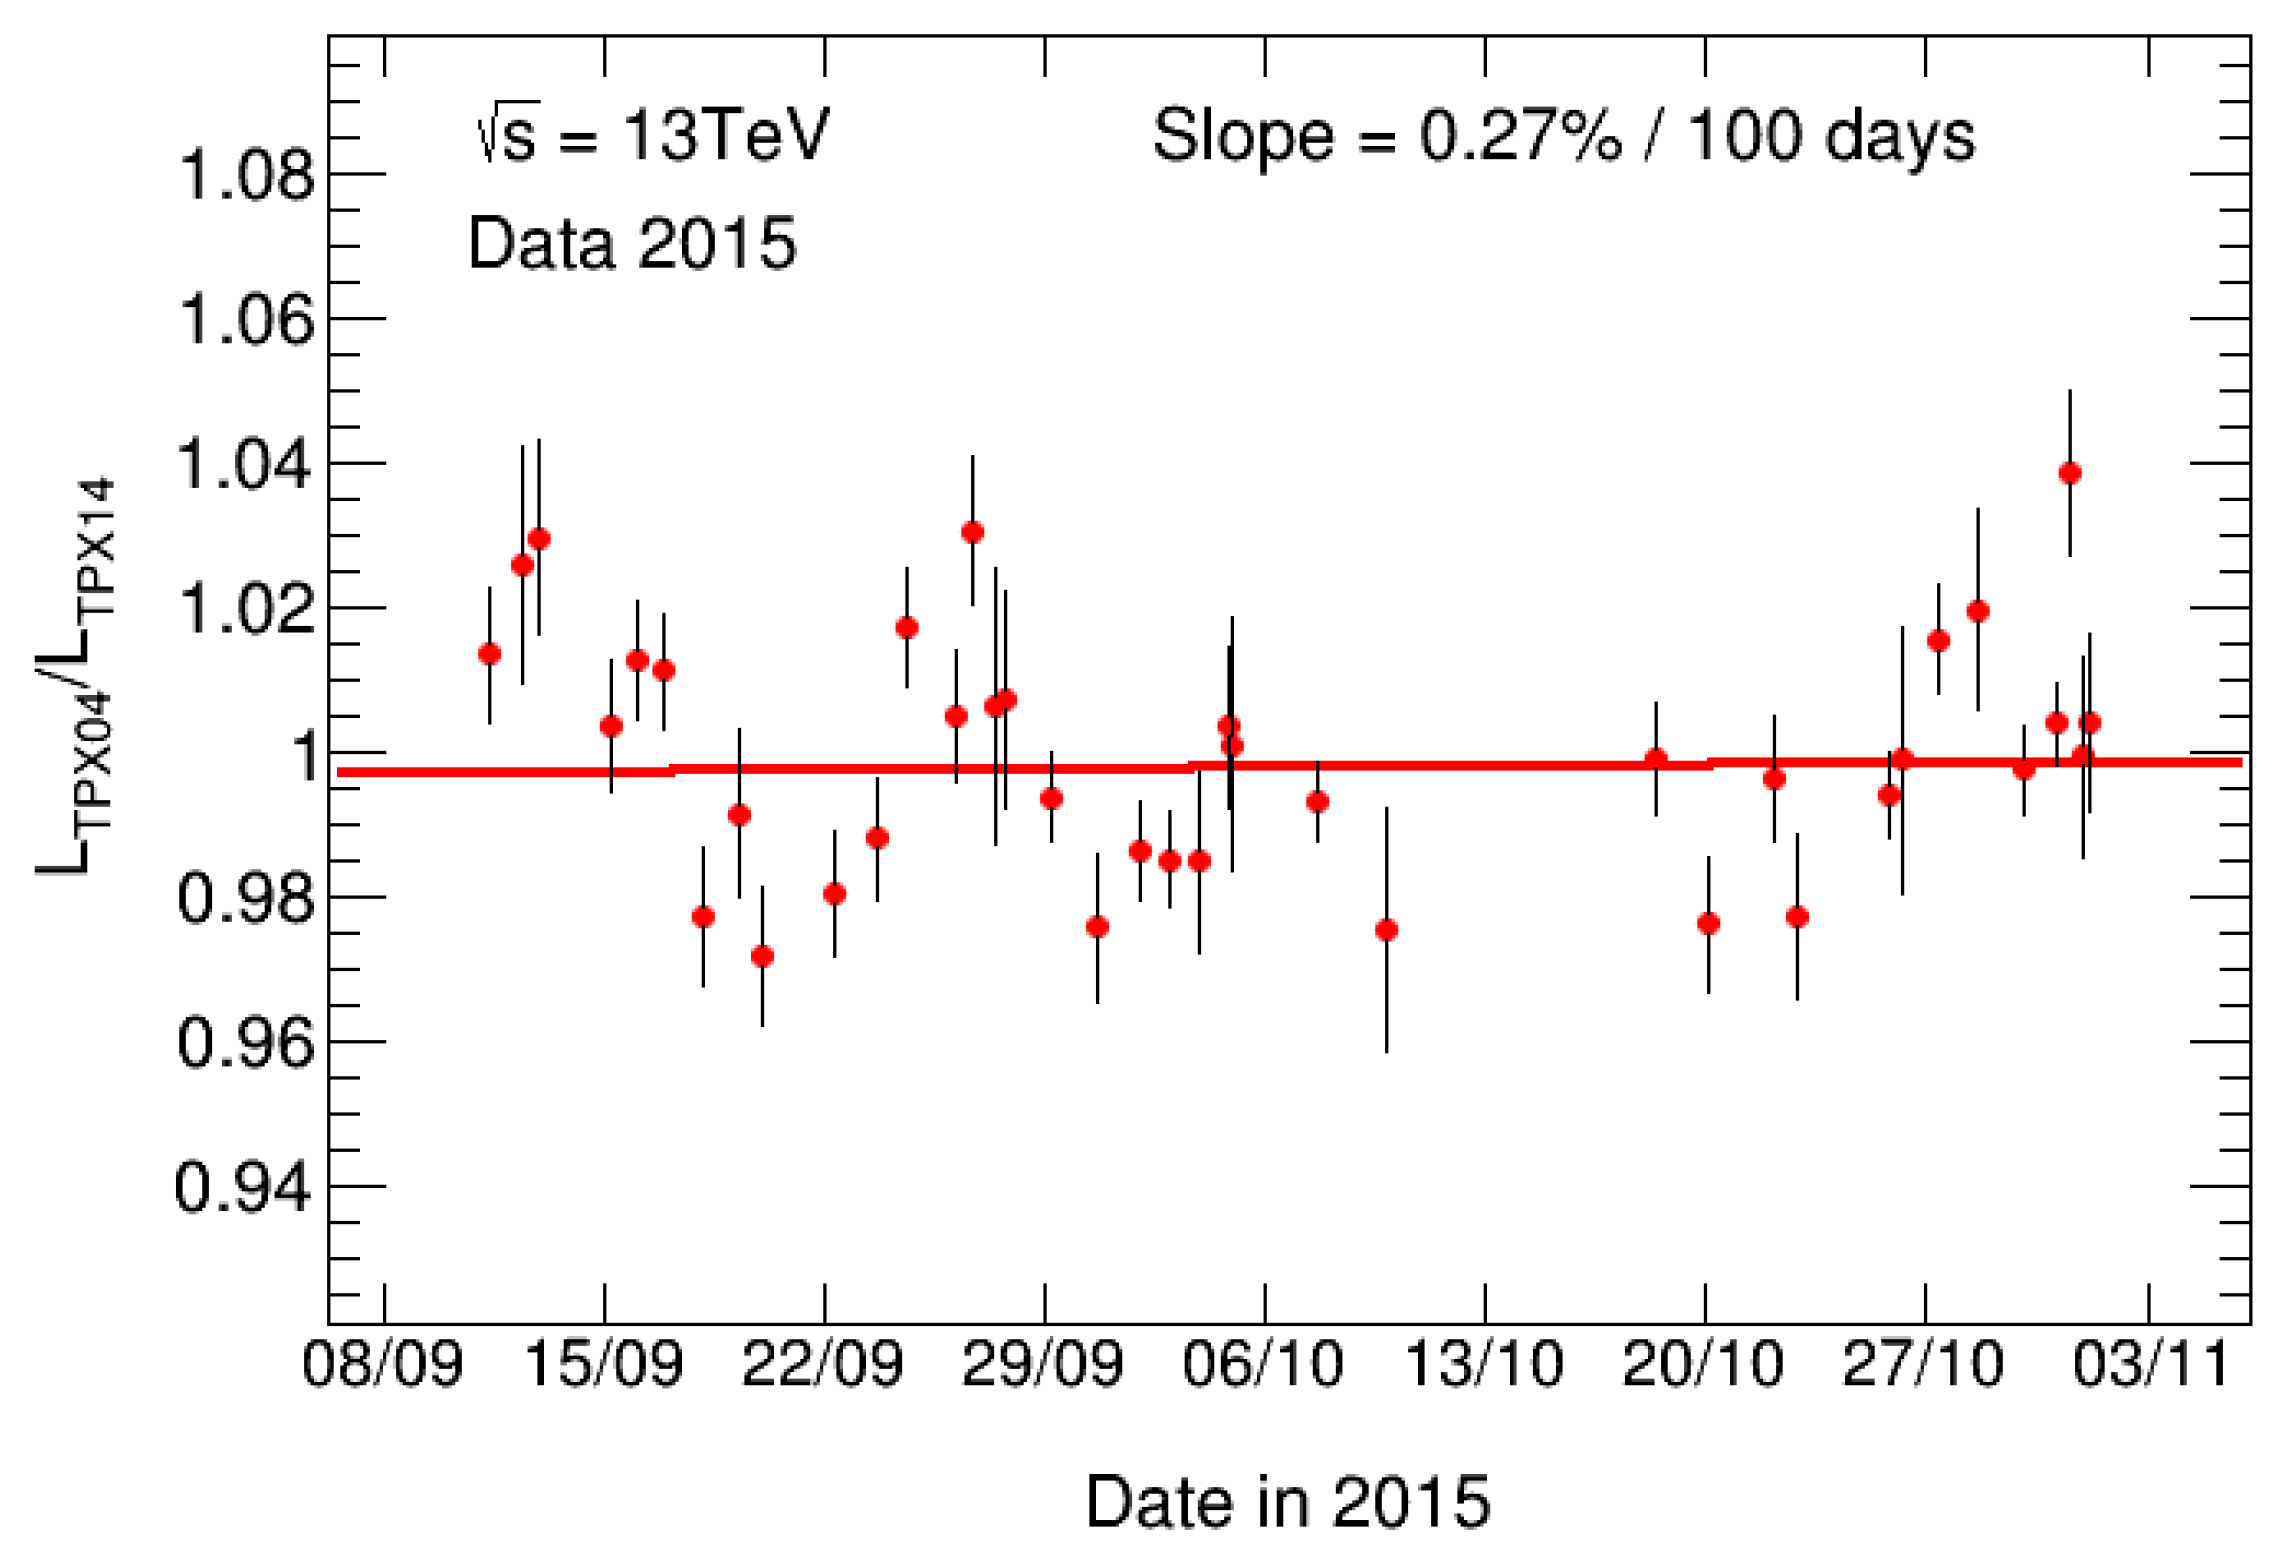
A linear fit is applied to determine the precision of the time history of the ratio between individual MPX devices with respect to the weighted average of all other devices, examples for MPX07 and MPX12 are shown in
Figure 7.
Table 4 summarizes the slope values and the uncertainties of the linear fits. The variance of these slope measurements is 0.38 [% per 200 days]
. The resulting standard deviation of 0.62 [% per 200 days] is used as an estimation of the systematic uncertainty. The
(per number of degrees of freedom, ndf) is close to unity; thus statistical uncertainties describe the fluctuations.
In the analysis of HB counting in the LiF-covered detector region, the statistical uncertainties are dominant since the HB count rate is rather small (a few HB per frame).
In summary, the long-term time-stability (internal stability) of from June to November 2015 of the HB analysis is better than 1%, comparing single MPX devices with the weighted average of all other MPX devices.
2.4. MPX vdM Scans
vdM scans are used for absolute luminosity calibration at the LHC [
24]. The vdM scan technique was pioneered at CERN in the 1960s to determine the luminosity calibration in a simple way. It involves scanning the LHC beams through one another to determine the size of the beams at their point of collision. The scans are performed to determine the horizontal and vertical widths of the beams. These width measurements are then combined with information on the number of circulating protons, allowing the determination of an absolute luminosity scale. Several ATLAS and CMS sub-detectors are used for vdM scans [
21,
22] since the luminosity calibration is very important for physics analyses.
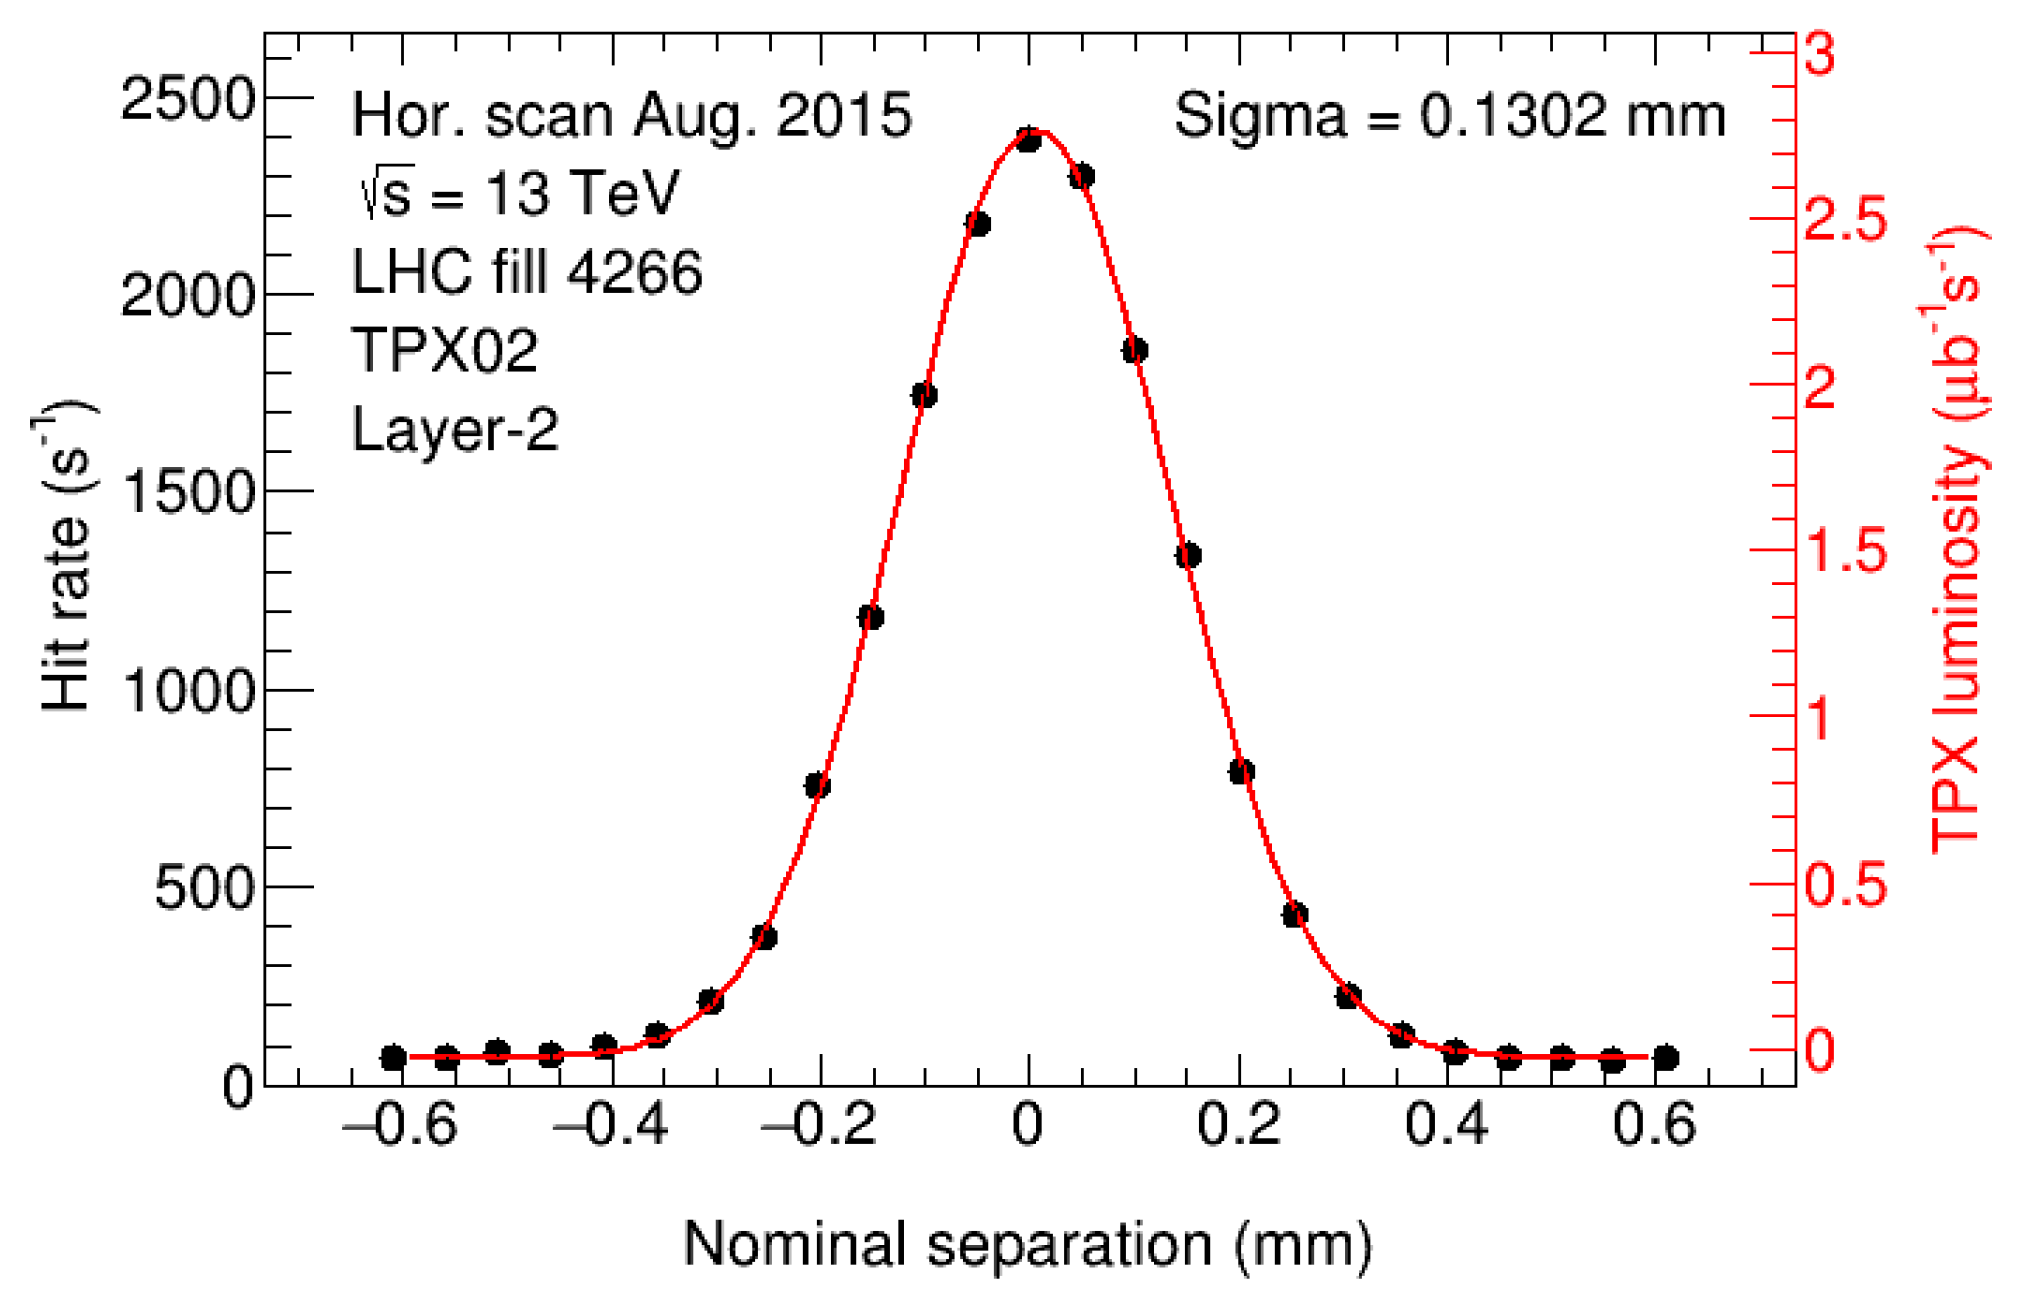
The study of the MPX data taken during LHC vdM scans in April, July and November 2012 focuses on the horizontal and vertical width determination of the LHC proton beams. The data used in this vdM scan study were taken with the MPX device with the highest count rate. This study demonstrates that the operation of the MPX network is fully adapted to the low-luminosity regime of vdM scans and the high-luminosity regime of routine physics running. Owing to the low statistics in heavy blob (thermal neutron) counting, only the hit counting mode can be used for the vdM data analysis.
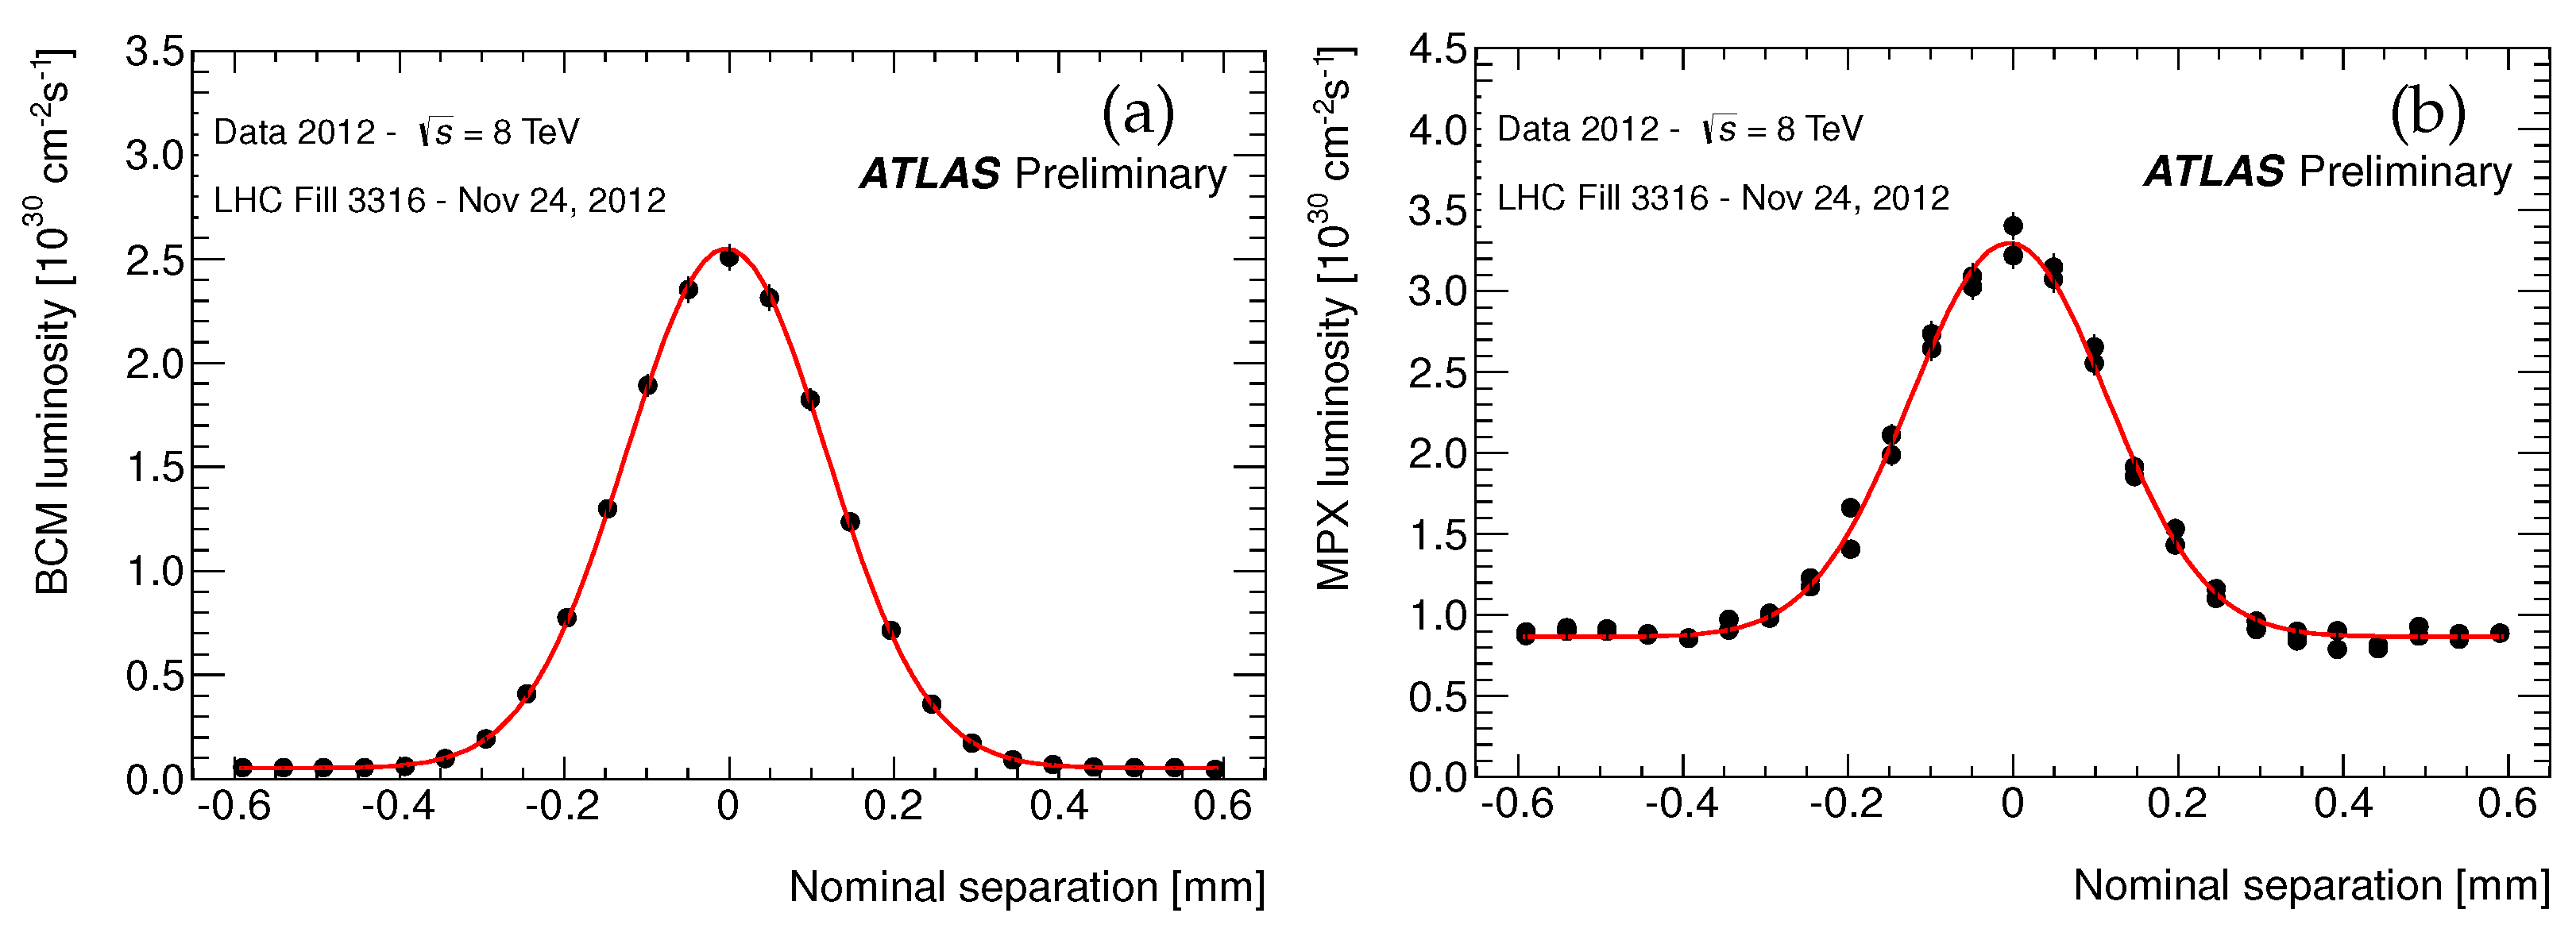
The beams are typically scanned transversely across each other in 25 steps. During each step, the beam orbits are left untouched (“quiescent beams”), and the luminosity remains constant for approximately 29 s. The beam separation is then incremented by several tens of microns (“non-quiescent beams”) over an interval of several seconds, during which the luminosity varies rapidly and the luminosity measurements are unreliable. Since the MPX exposure (acquisition) time is about 5 s per frame, followed by a 6 s readout period, two frames typically occur within each quiescent-beam scan step. Occasionally, the MPX devices need to reload their configuration files, in which case the dead time can be as long as 30 s. Therefore, only one frame is recorded in some scan steps.
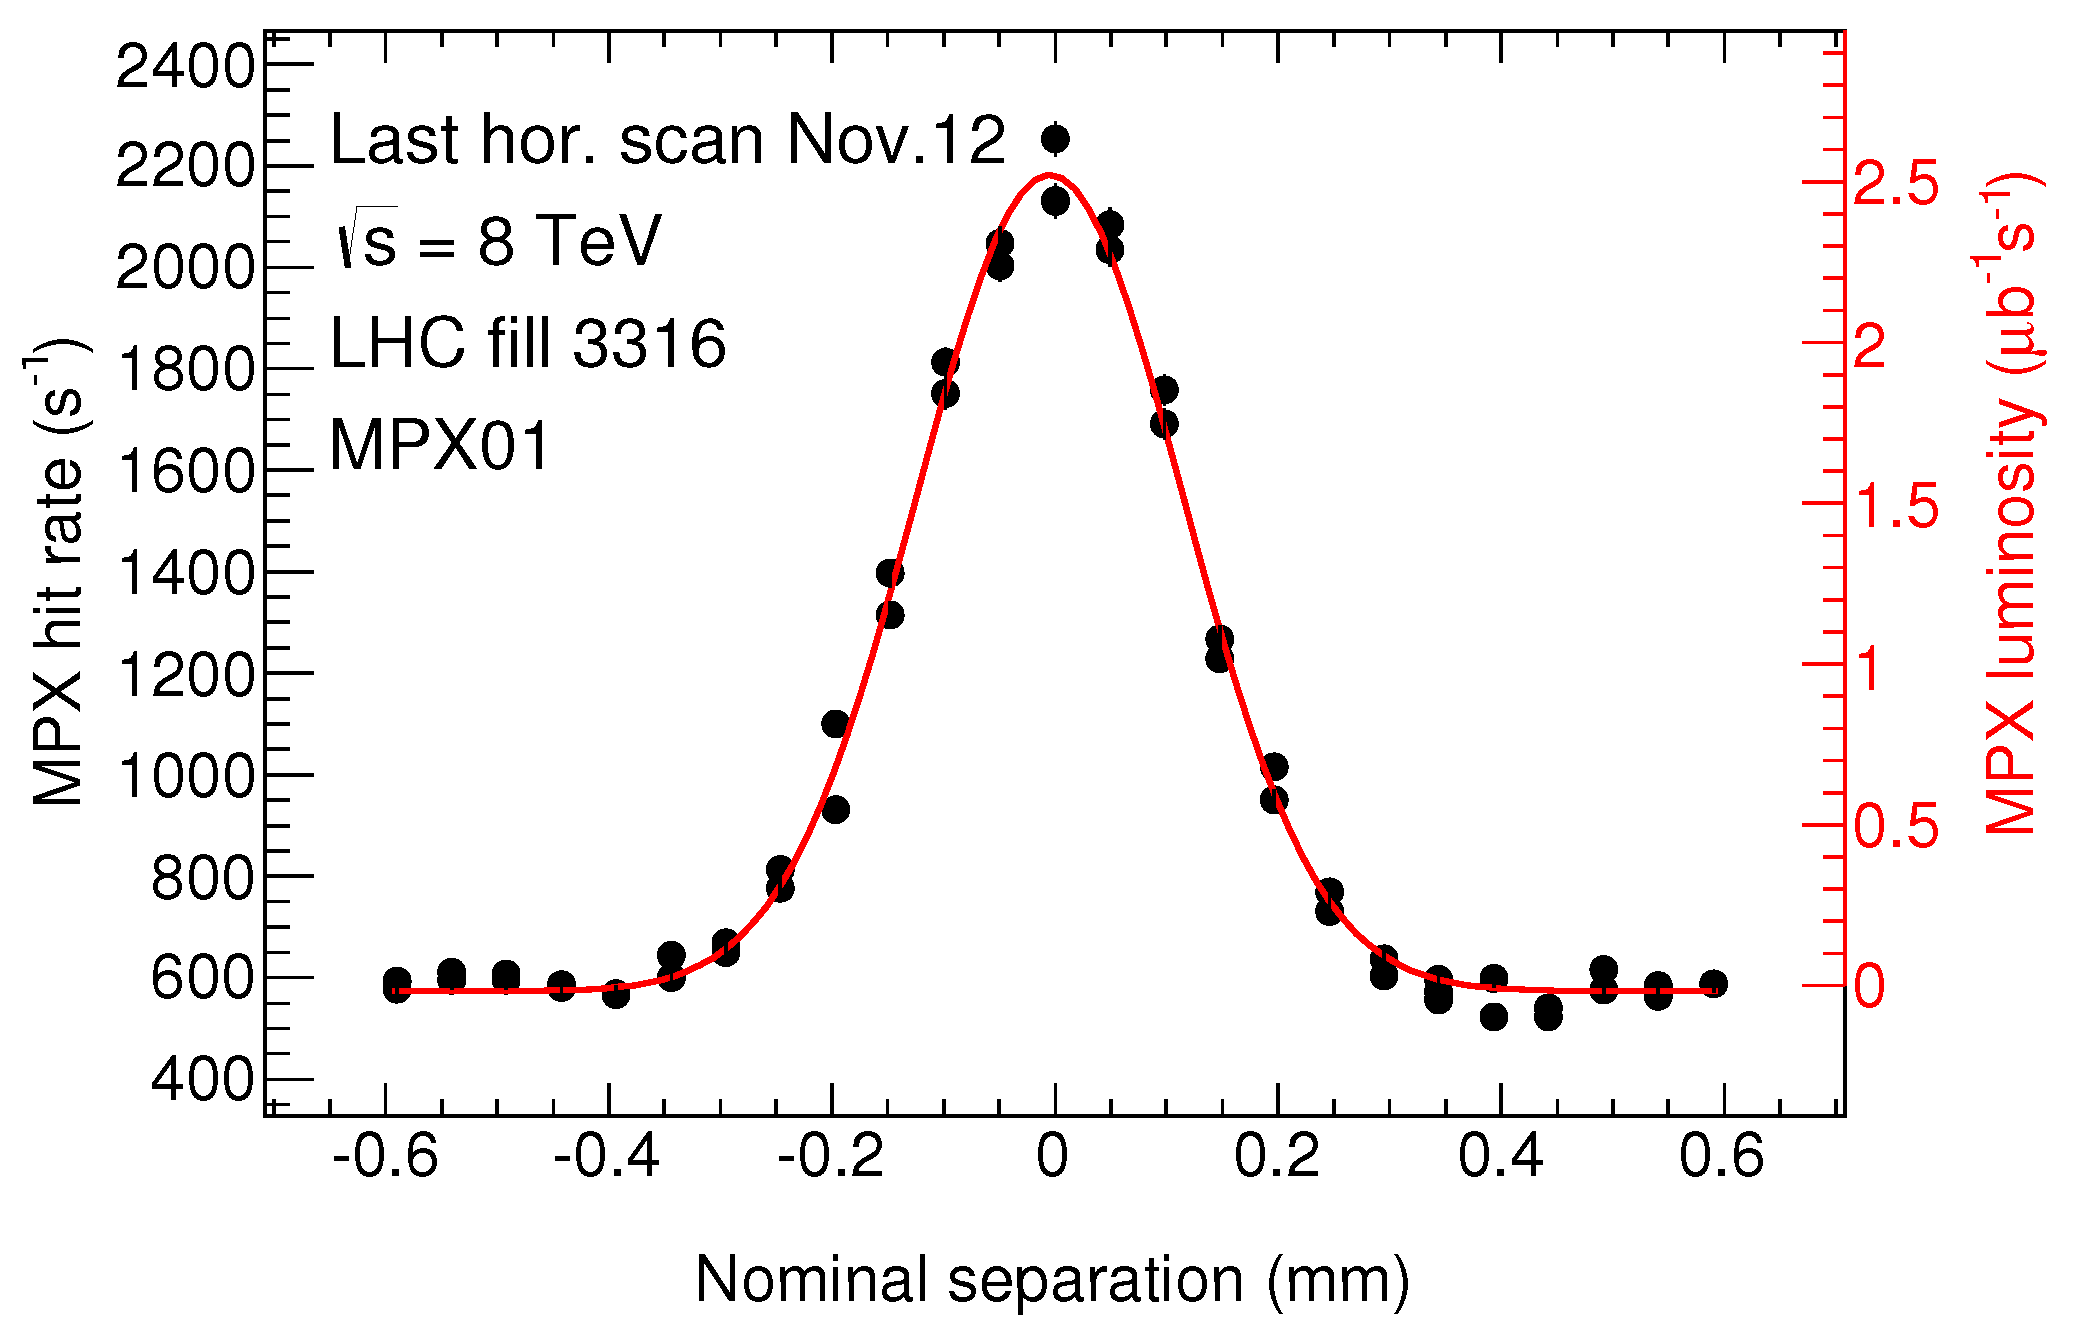
The beam separation dependence of the measured MPX luminosity is well represented by the sum of a single Gaussian and a constant (
Figure 9). The statistical uncertainty for each MPX frame, calculated from the number of hits, is scaled up by a factor
to account for the ratio between hits and clusters, as explained before in
Section 2.3. In this approach, it is assumed that one particle interacting with the MPX device creates one cluster, and it is the number of particles that leads to the statistical uncertainty.
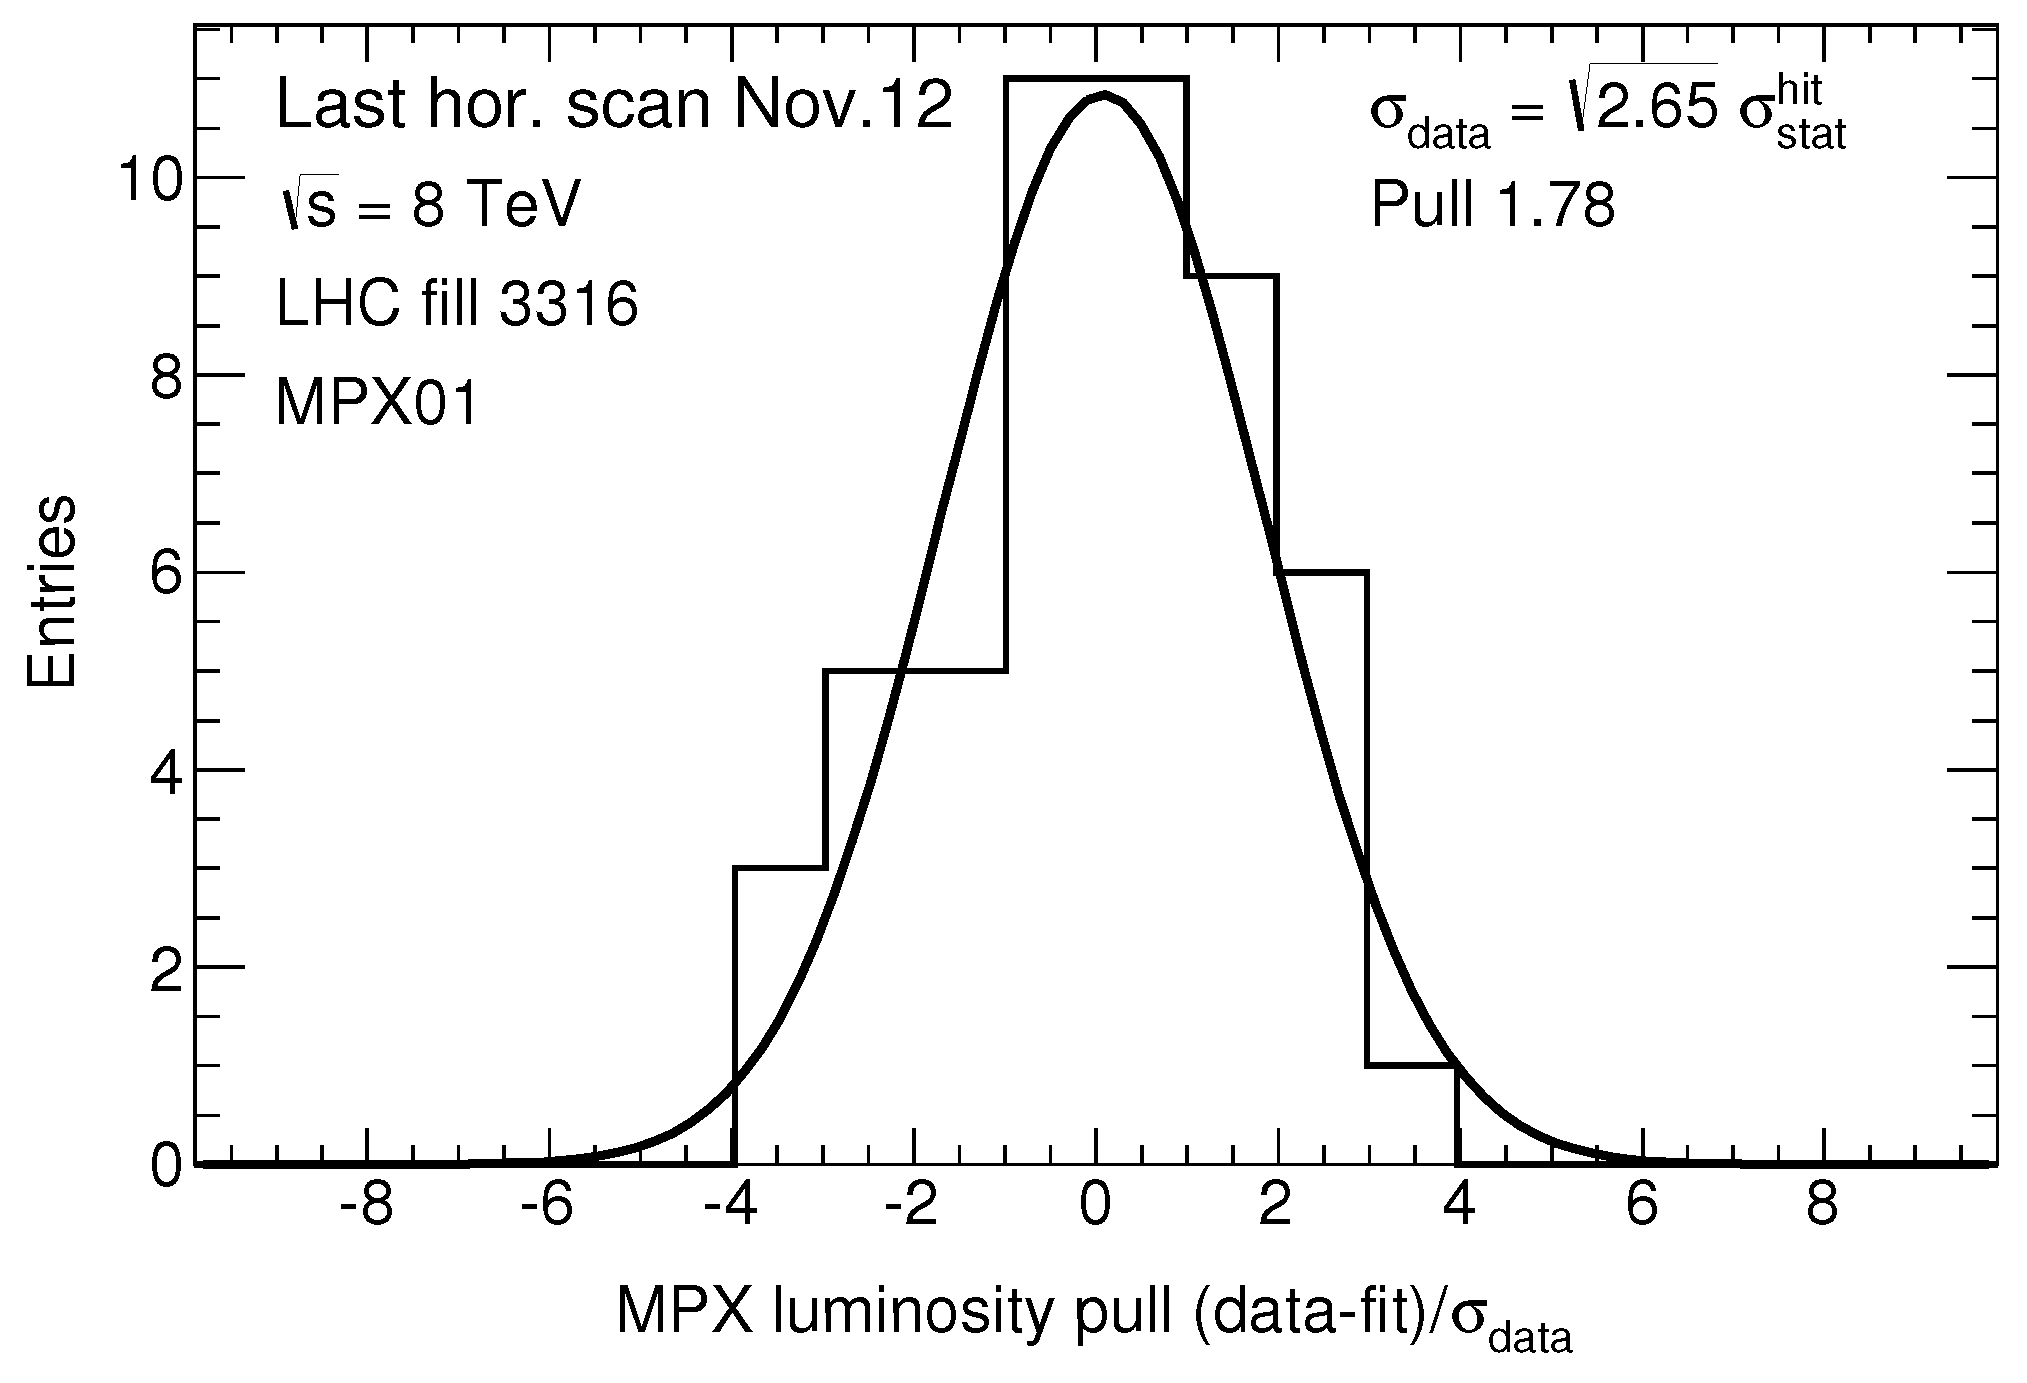
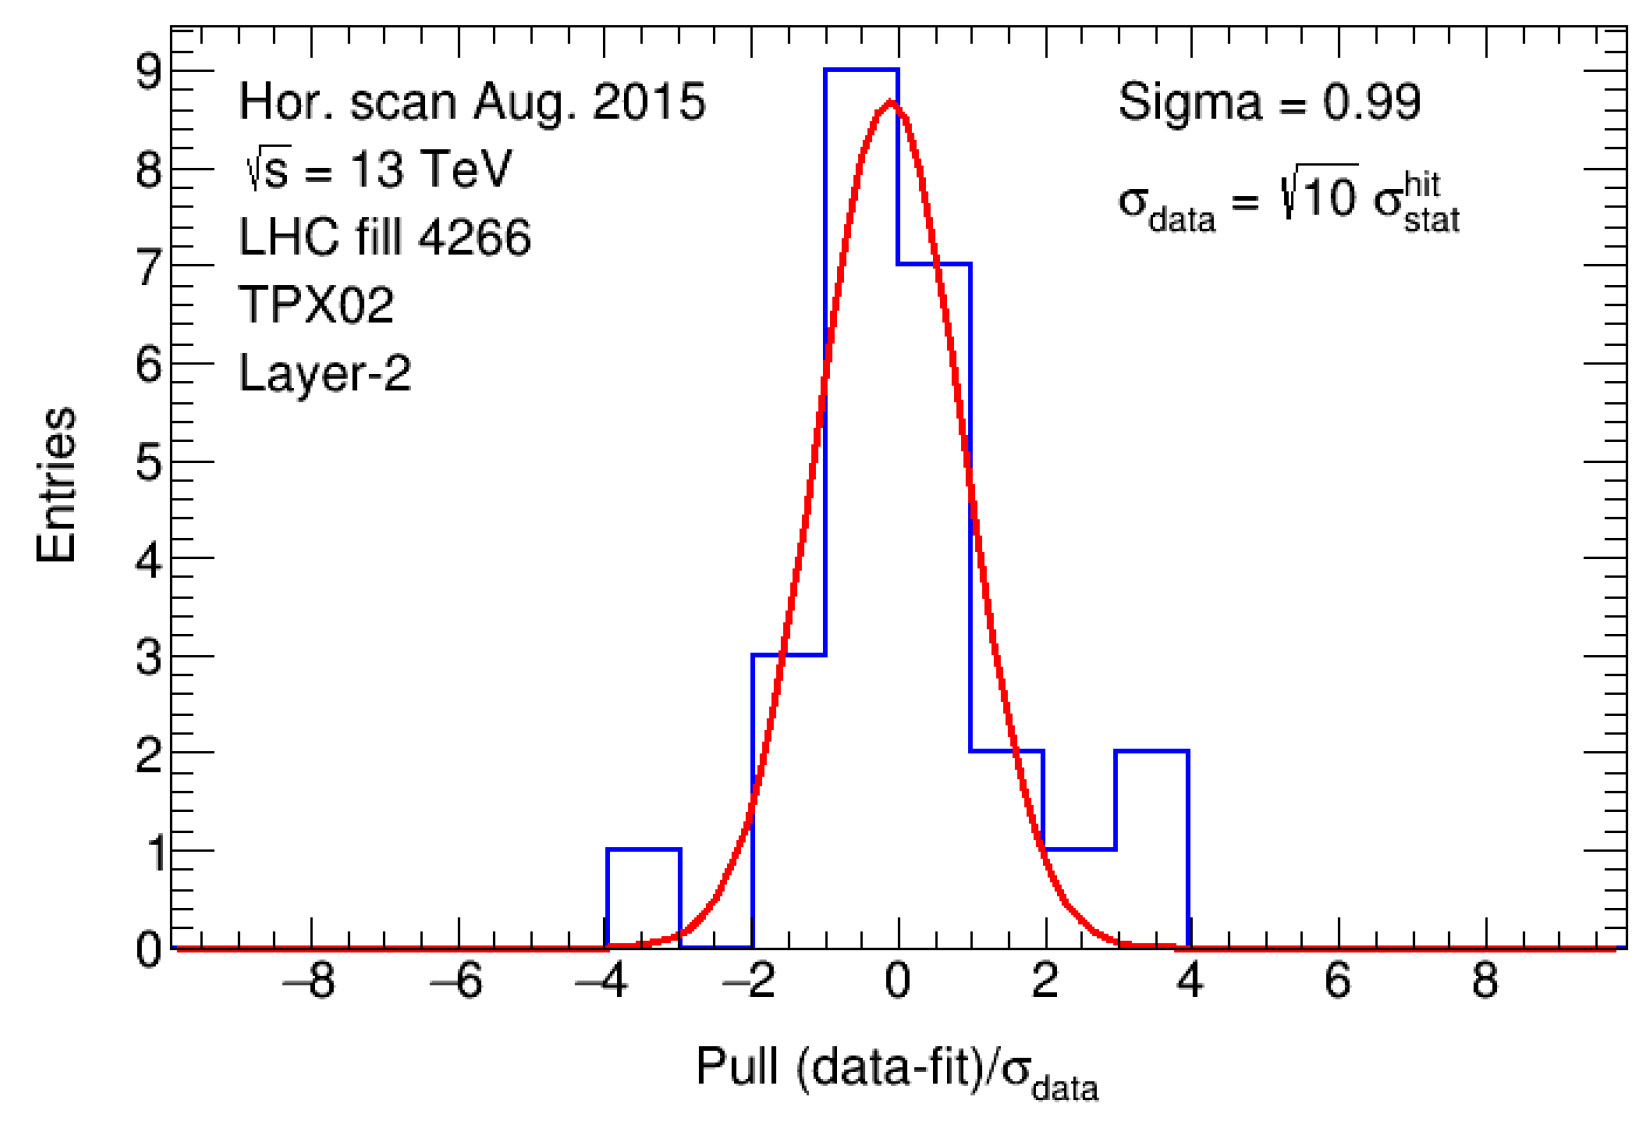
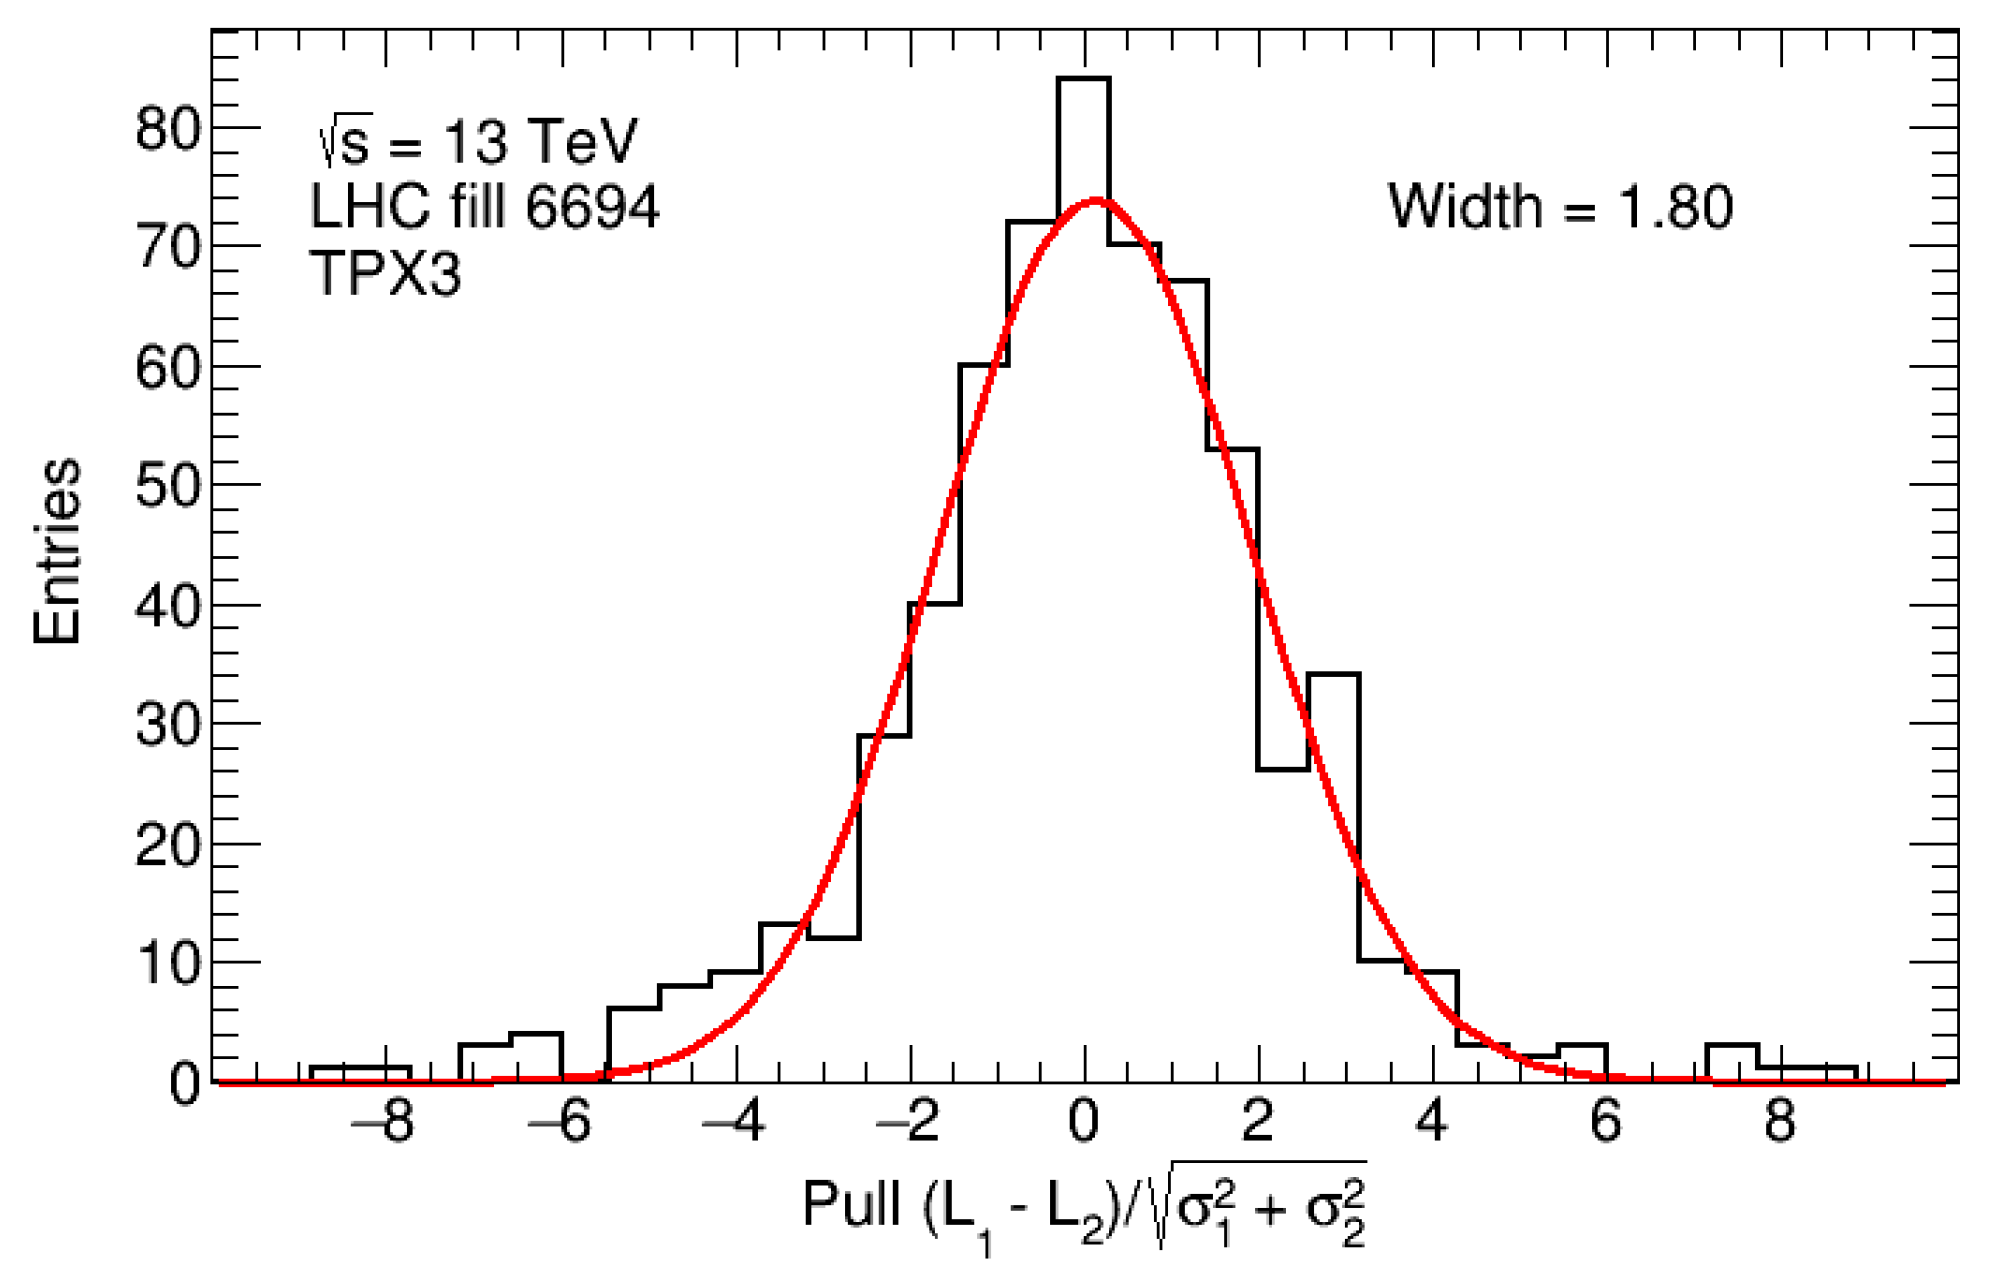
The precision of the MPX01 device can be determined with respect to the expected statistical precision. For this study, the pull (data-fit)/
is calculated (
Figure 10) for the last horizontal vdM scan in November 2012, where
and
. The sigma of the pull distribution is 1.78, which indicates that additional uncertainties are present beyond the determined statistical uncertainties.
The data show that the sensitivity of the MPX01 device is sufficient to measure the luminosity down to about , four orders of magnitude smaller than the luminosity typical of routine physics data-taking.
The luminosity can be calculated as:
where
is the number of bunch crossings producing collisions per machine revolution,
and
are the average bunch populations (number of protons) in beam 1 and beam 2, respectively,
f is the machine revolution frequency (11,245.5 Hz), and
(
) are the convoluted horizontal (vertical) bunch-averaged beam sizes.
The specific luminosity is defined as:
Table 6 summarizes the scan results for all 2012 vdM scans registered with the MPX01 device.
In this section, the last horizontal and vertical November 2012 scans are used for the absolute luminosity calibration. These two scans are described well by a single Gaussian. The horizontal scan (
Figure 9) has
, and a similar value is obtained for the vertical scan
. These ratios indicate that in addition to the statistical uncertainty (augmented by the factor
) systematic uncertainties are also present. The widths of the horizontal and vertical nominal beam sizes, and their uncertainties are
µm and
µm, respectively. The LHC parameters for fill 3316 are [
25] (the cited web page allows to enter the LHC fill number to obtain basic information about the fill):
Thus, the resulting luminosity is .
The corresponding number of MPX hits at the peak is determined from a Gaussian fit plus a constant background. The fit provides
hits/s at the peak above the background. Thus, the normalization factor
between the MPX01 hit rate and the instantaneous LHC luminosity is
The normalization factor for the absolute luminosity is only approximate, since the MPX acquisition time is much longer than the bunch spacing. Therefore, the bunch-integrated luminosity averages over the different bunch profiles.
The uncertainty of due to the bunch-integration by the MPX data-taking has been estimated by simulating 29 overlapping Gaussian distributions, corresponding to 29 colliding bunches, with varying individual widths. The simulated bunches vary in width in equal distances up to %. The envelope of the summed Gaussians is fitted, and the resulting width and height are compared with the nominal value without variations. The width uncertainty is 0.36% and height uncertainty is 0.49%. The fit is repeated 100 times with different sets of random numbers to test the reproducibility. For the determination of luminosity uncertainty, it is assumed that the horizontal and vertical width uncertainties are correlated, and thus the luminosity uncertainty is 0.72%. Furthermore, it is assumed that the widths and height (fitted hit rate) uncertainties are correlated; thus, the uncertainty on the normalization factor is .
Although further uncertainties could arise from non-Gaussian shapes, this study shows that the Gaussian approximation of the sum of Gaussians is quite robust and the luminosity approximation by bunch integration is a sensible approach. No attempt is made for a precise determination of the total uncertainty, which would require a dedicated study [
21].
In summary,
Figure 9 shows the hit rate and the absolute luminosity determined from the scan widths. The resulting normalization factor is used throughout this section.
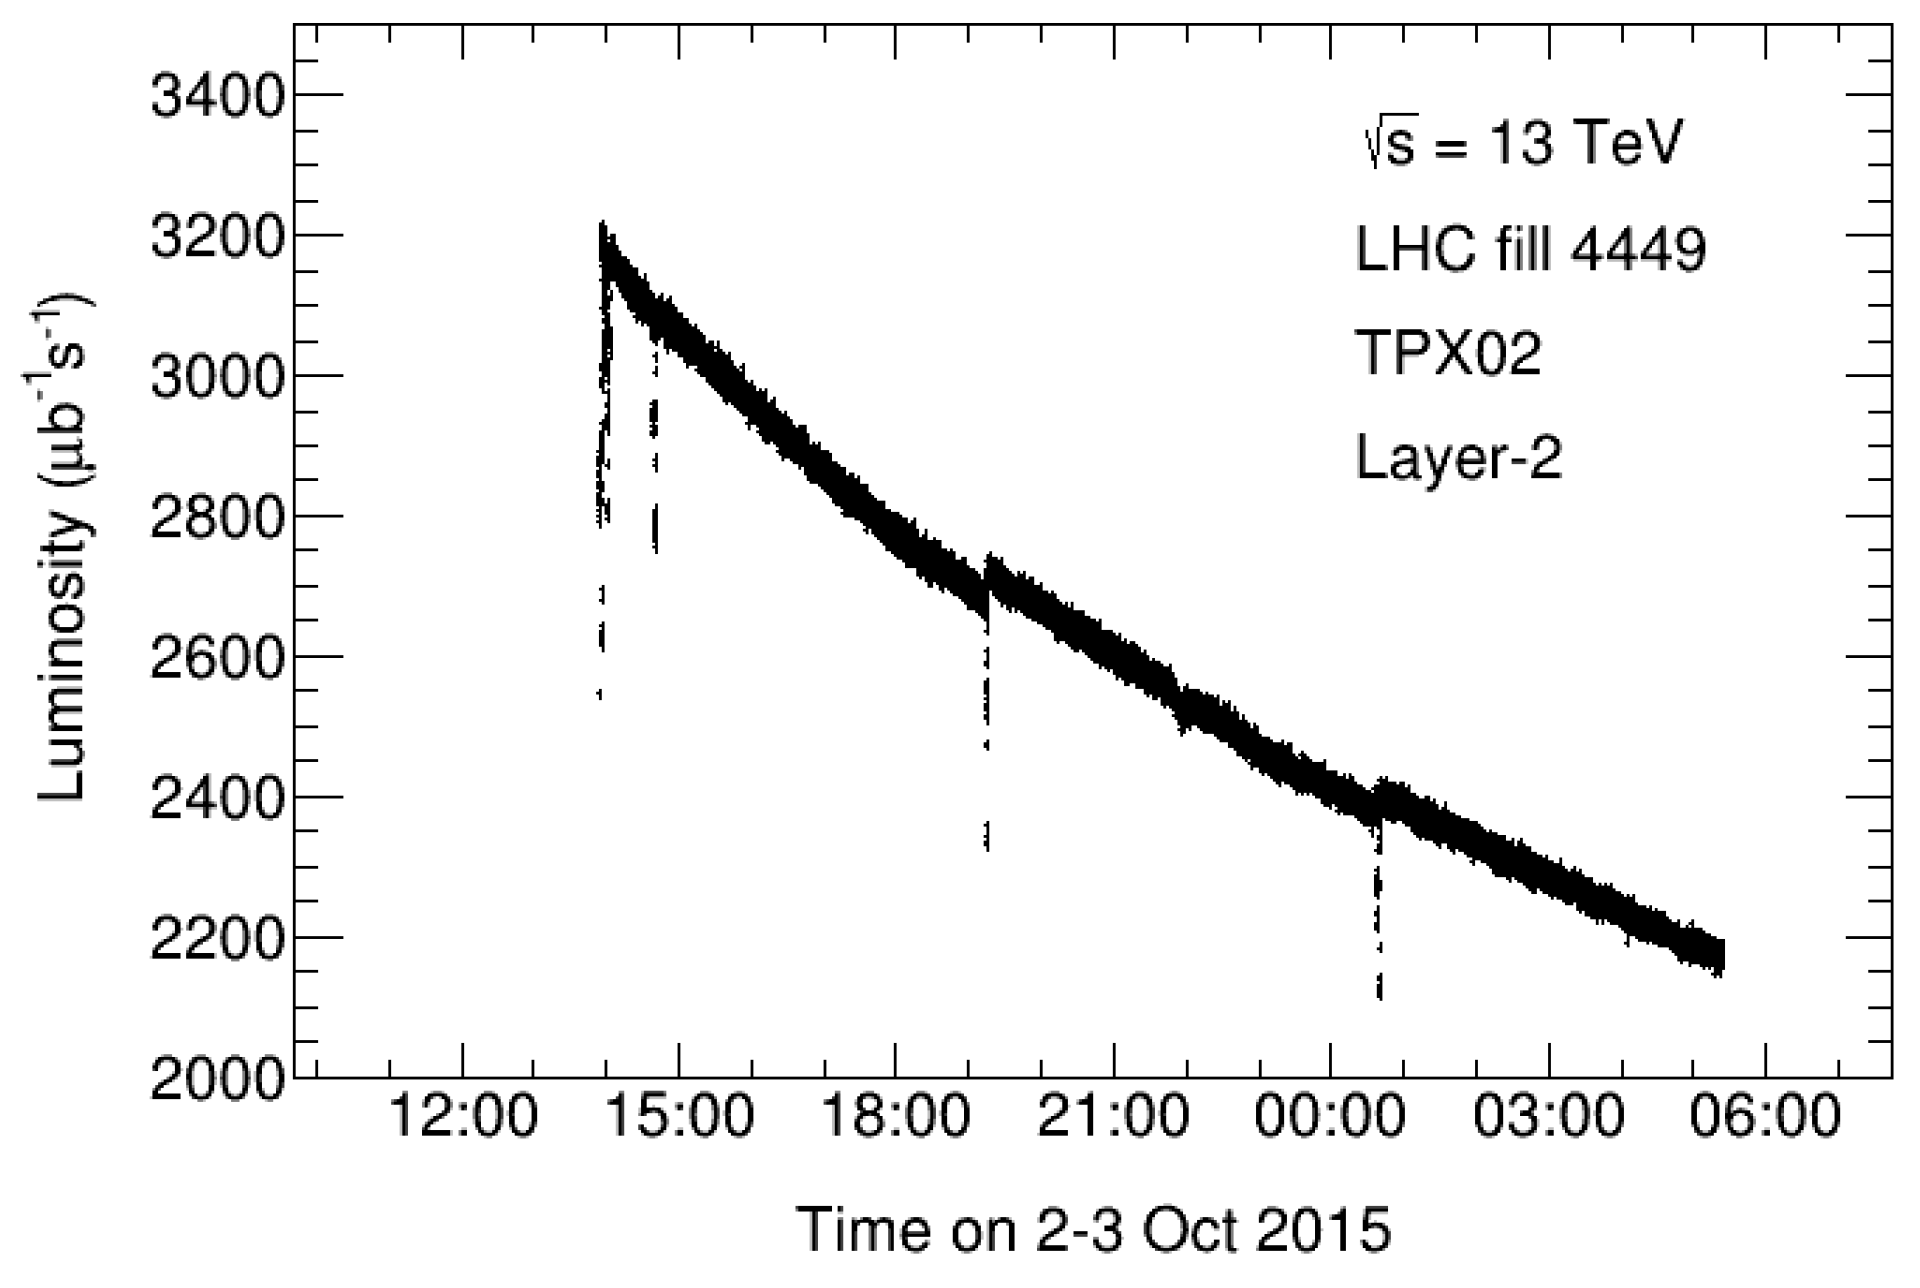
2.5. LHC Luminosity Curve and MPX Short-Term Precision
The MPX network precisely measures the LHC luminosity as a function of time. As a proof of principle, it is demonstrated that the MPX network has the capability to study the underlying mechanisms of the rate of reduction of LHC luminosity.
The LHC luminosity reduction is mainly caused by beam–beam interactions (burning-off the proton bunches) and beam–gas (single bunch) interactions by the protons of the circulating beams with remaining gas in the vacuum pipe. The particle loss rate due to proton burn off in collision is proportional to the number of protons in the second power since protons are lost in both colliding bunches. In the case that the protons in a beam collide with remaining gas in the vacuum pipe, the particle loss rate is proportional to the number of protons in the beam. The loss rate of protons
N in the colliding beam is thus governed by:
where
is the initial number of protons and
and
are constants related to beam-beam and beam-gas interactions, respectively. This equation has a known solution:
with two known border cases:
and
In the following, the time dependence of the luminosity and of the average number of interactions per bunch crossing,
, will be discussed. By definition
is proportional to the luminosity
L. Since both of these quantities are proportional to
, one expects the time dependence of
to be described by:
A fit is applied to the data using Equation (
8). The uncertainty on the fit result is evaluated by several independent measurements of the MPX network.
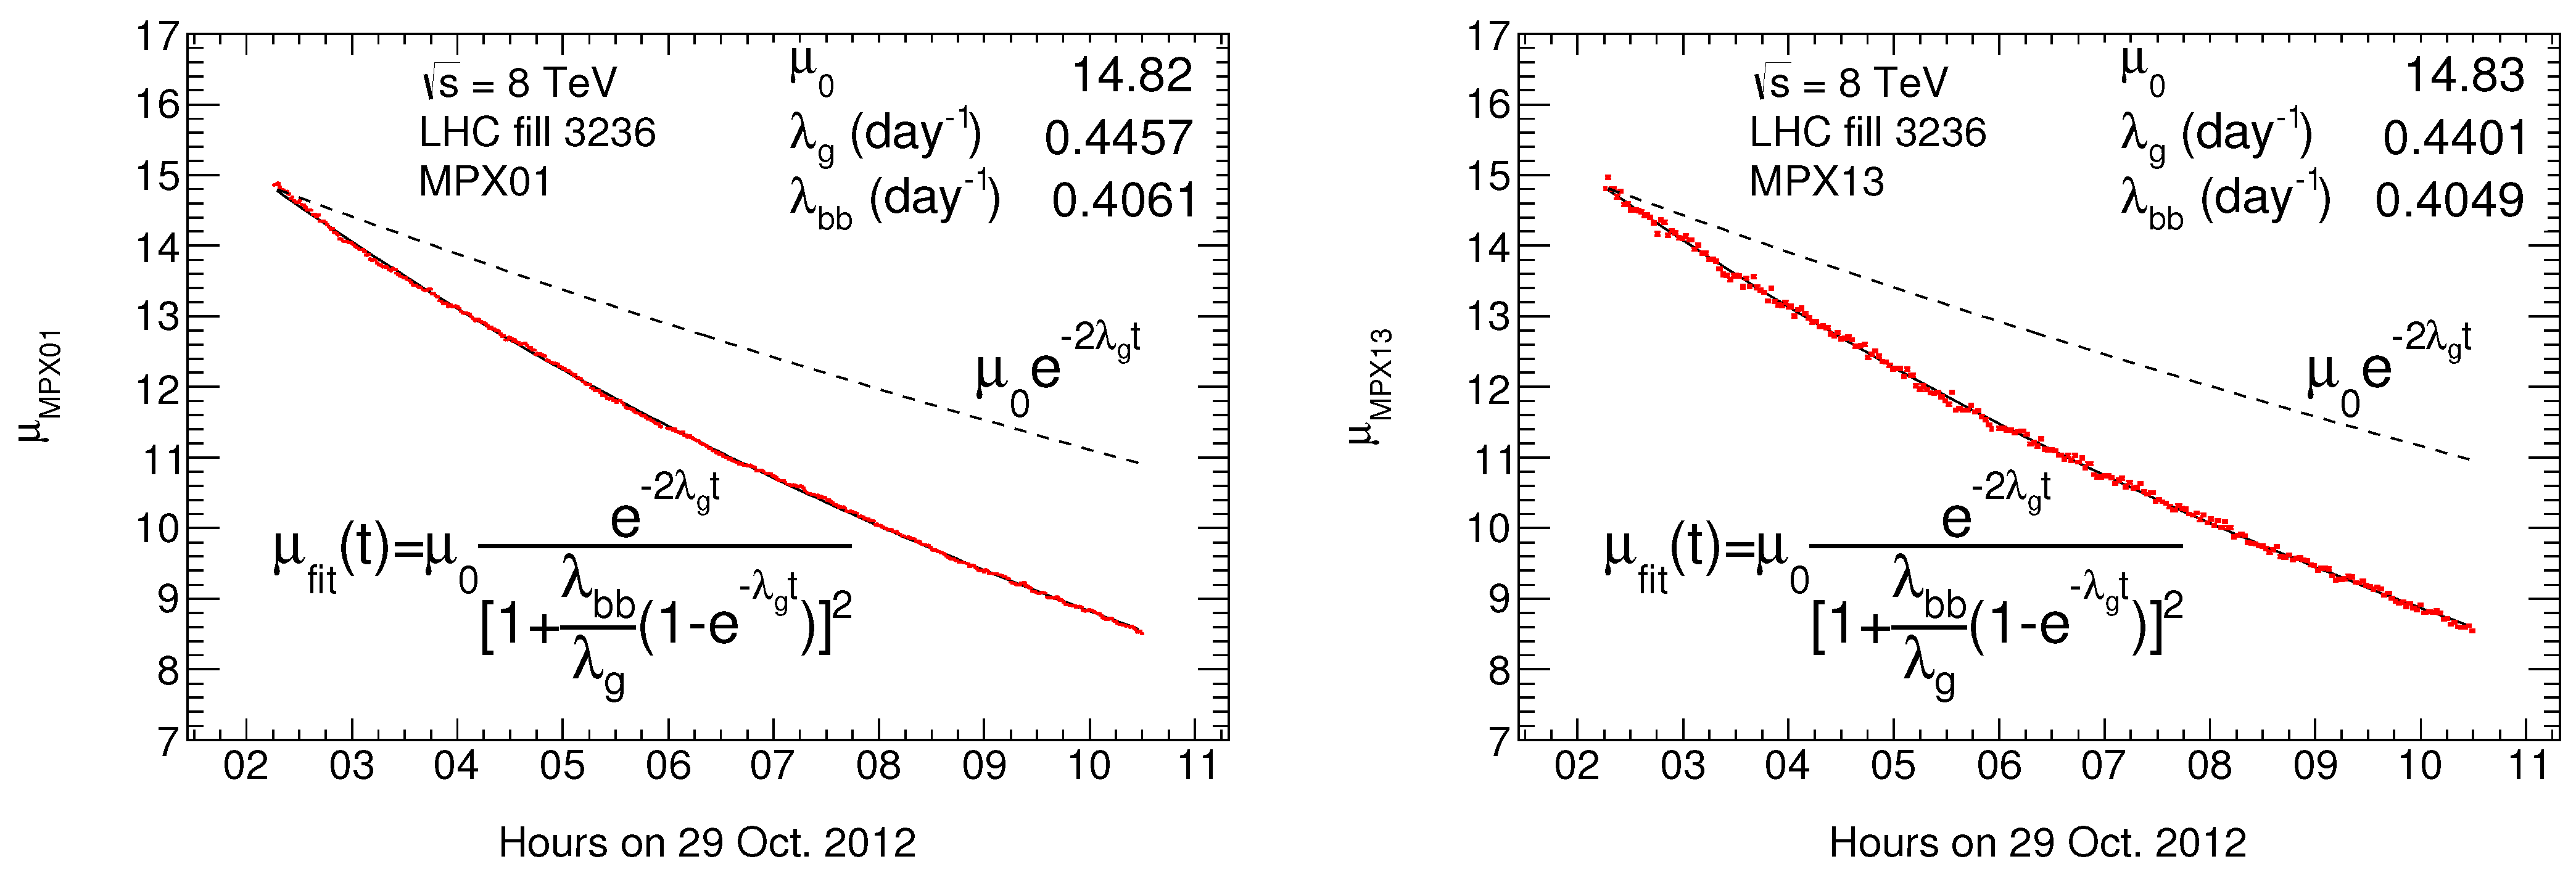
The LHC fill 3236, taken on 28–29 October 2012, is investigated in this study. The MPX luminosity is converted to an average interaction per bunch crossing by:
where
colliding bunches,
11,245.5 Hz and the inelastic cross-section
mb [
26]. The fill was chosen since it has a large
range from about
at the beginning to about
at the end.
When studying the MPX measurements of the LHC luminosity, structures resulting from LHC parameter tuning can be noted. These beam tuning adjustments change the shape of the luminosity decrease, and are not described by Equation (
8). It is noted that in the first half of a fill these tunings were frequent (about one every hour), while in the second half of a fill, adjustments of the beam were rarely made. Therefore, only the second half of a fill is used for this study and the range
to
is used for fitting the data distribution.
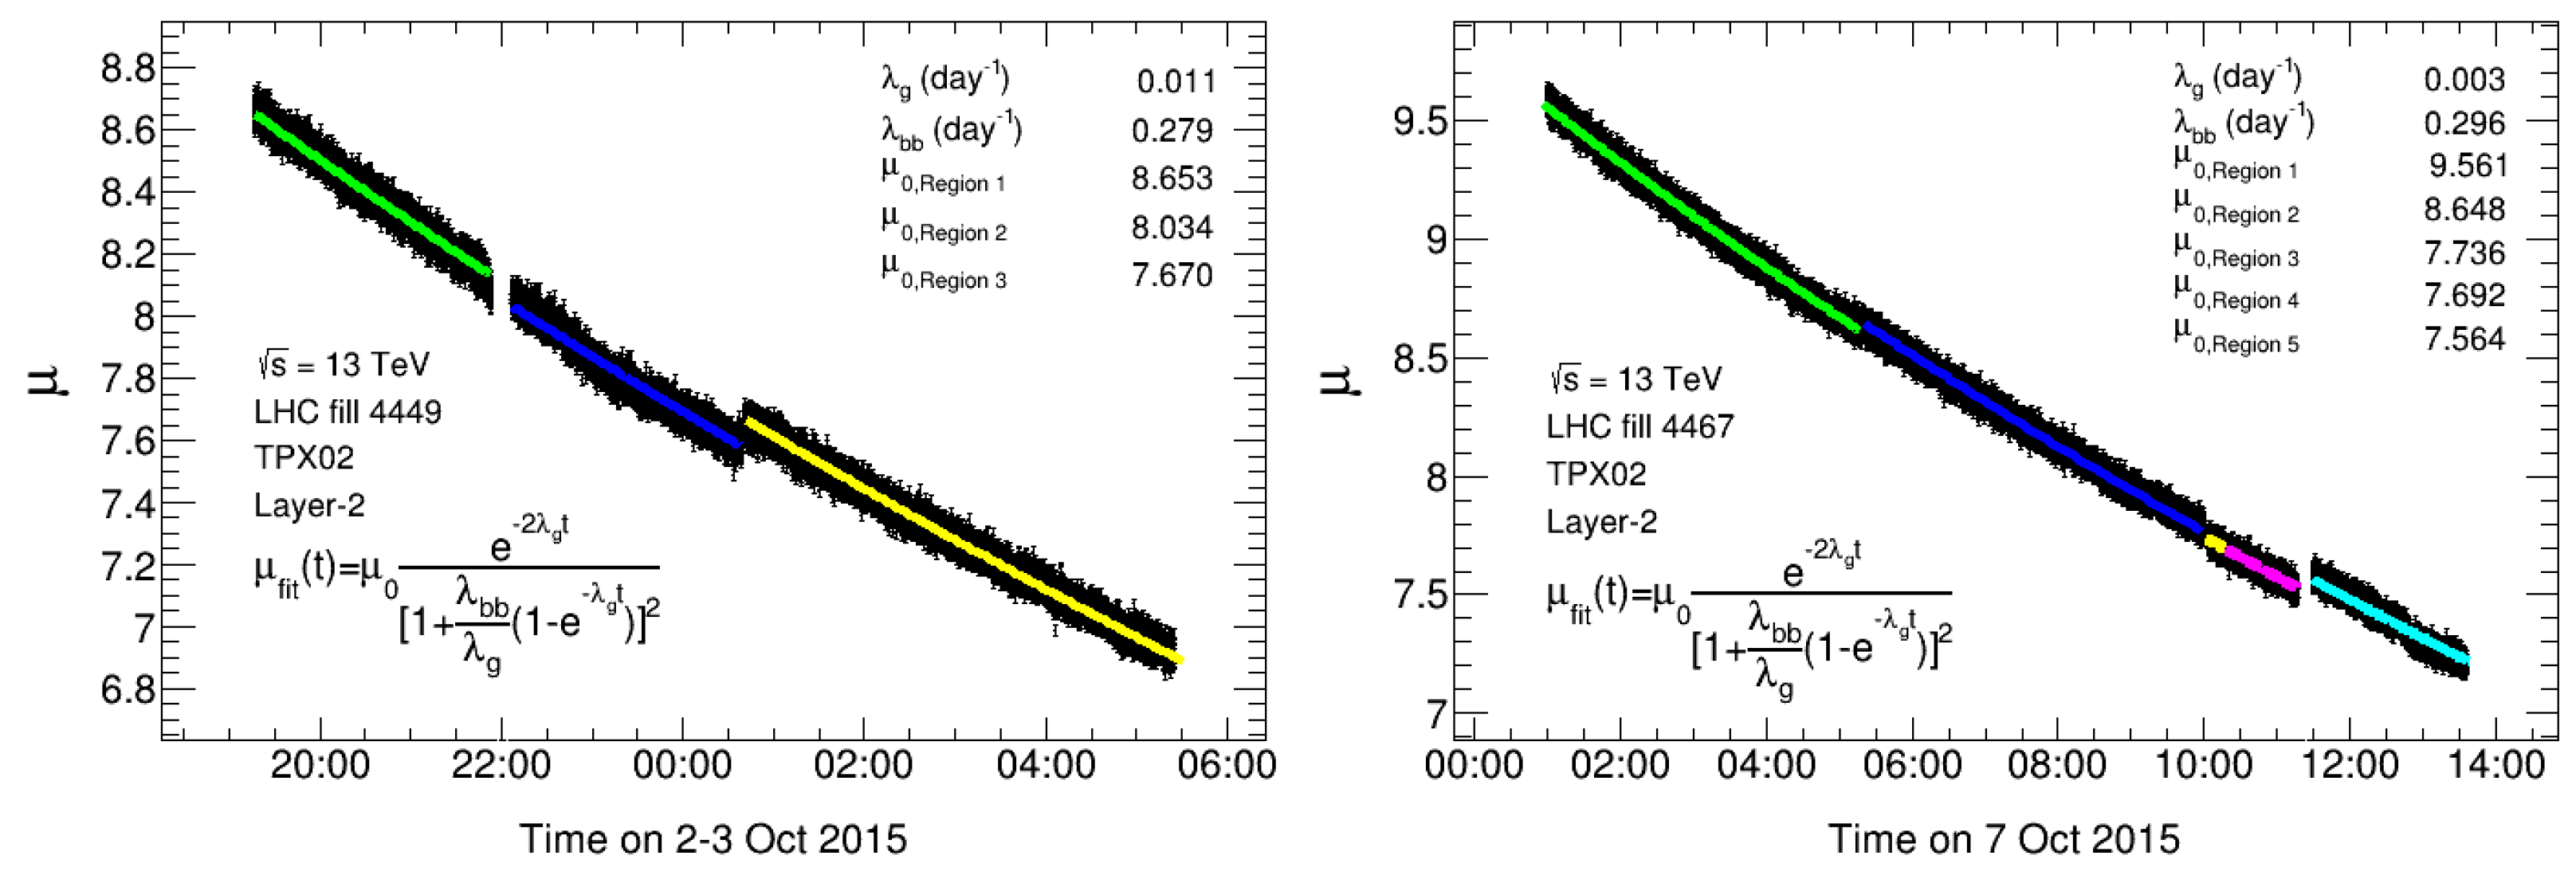
The fits are shown in
Figure 11 individually for MPX01 and MPX13. The fits give the initial number of interactions per bunch crossing
,
and
, summarized in
Table 7.
The fit with both parameters and describes the data significantly better compared to that using only one of the two.
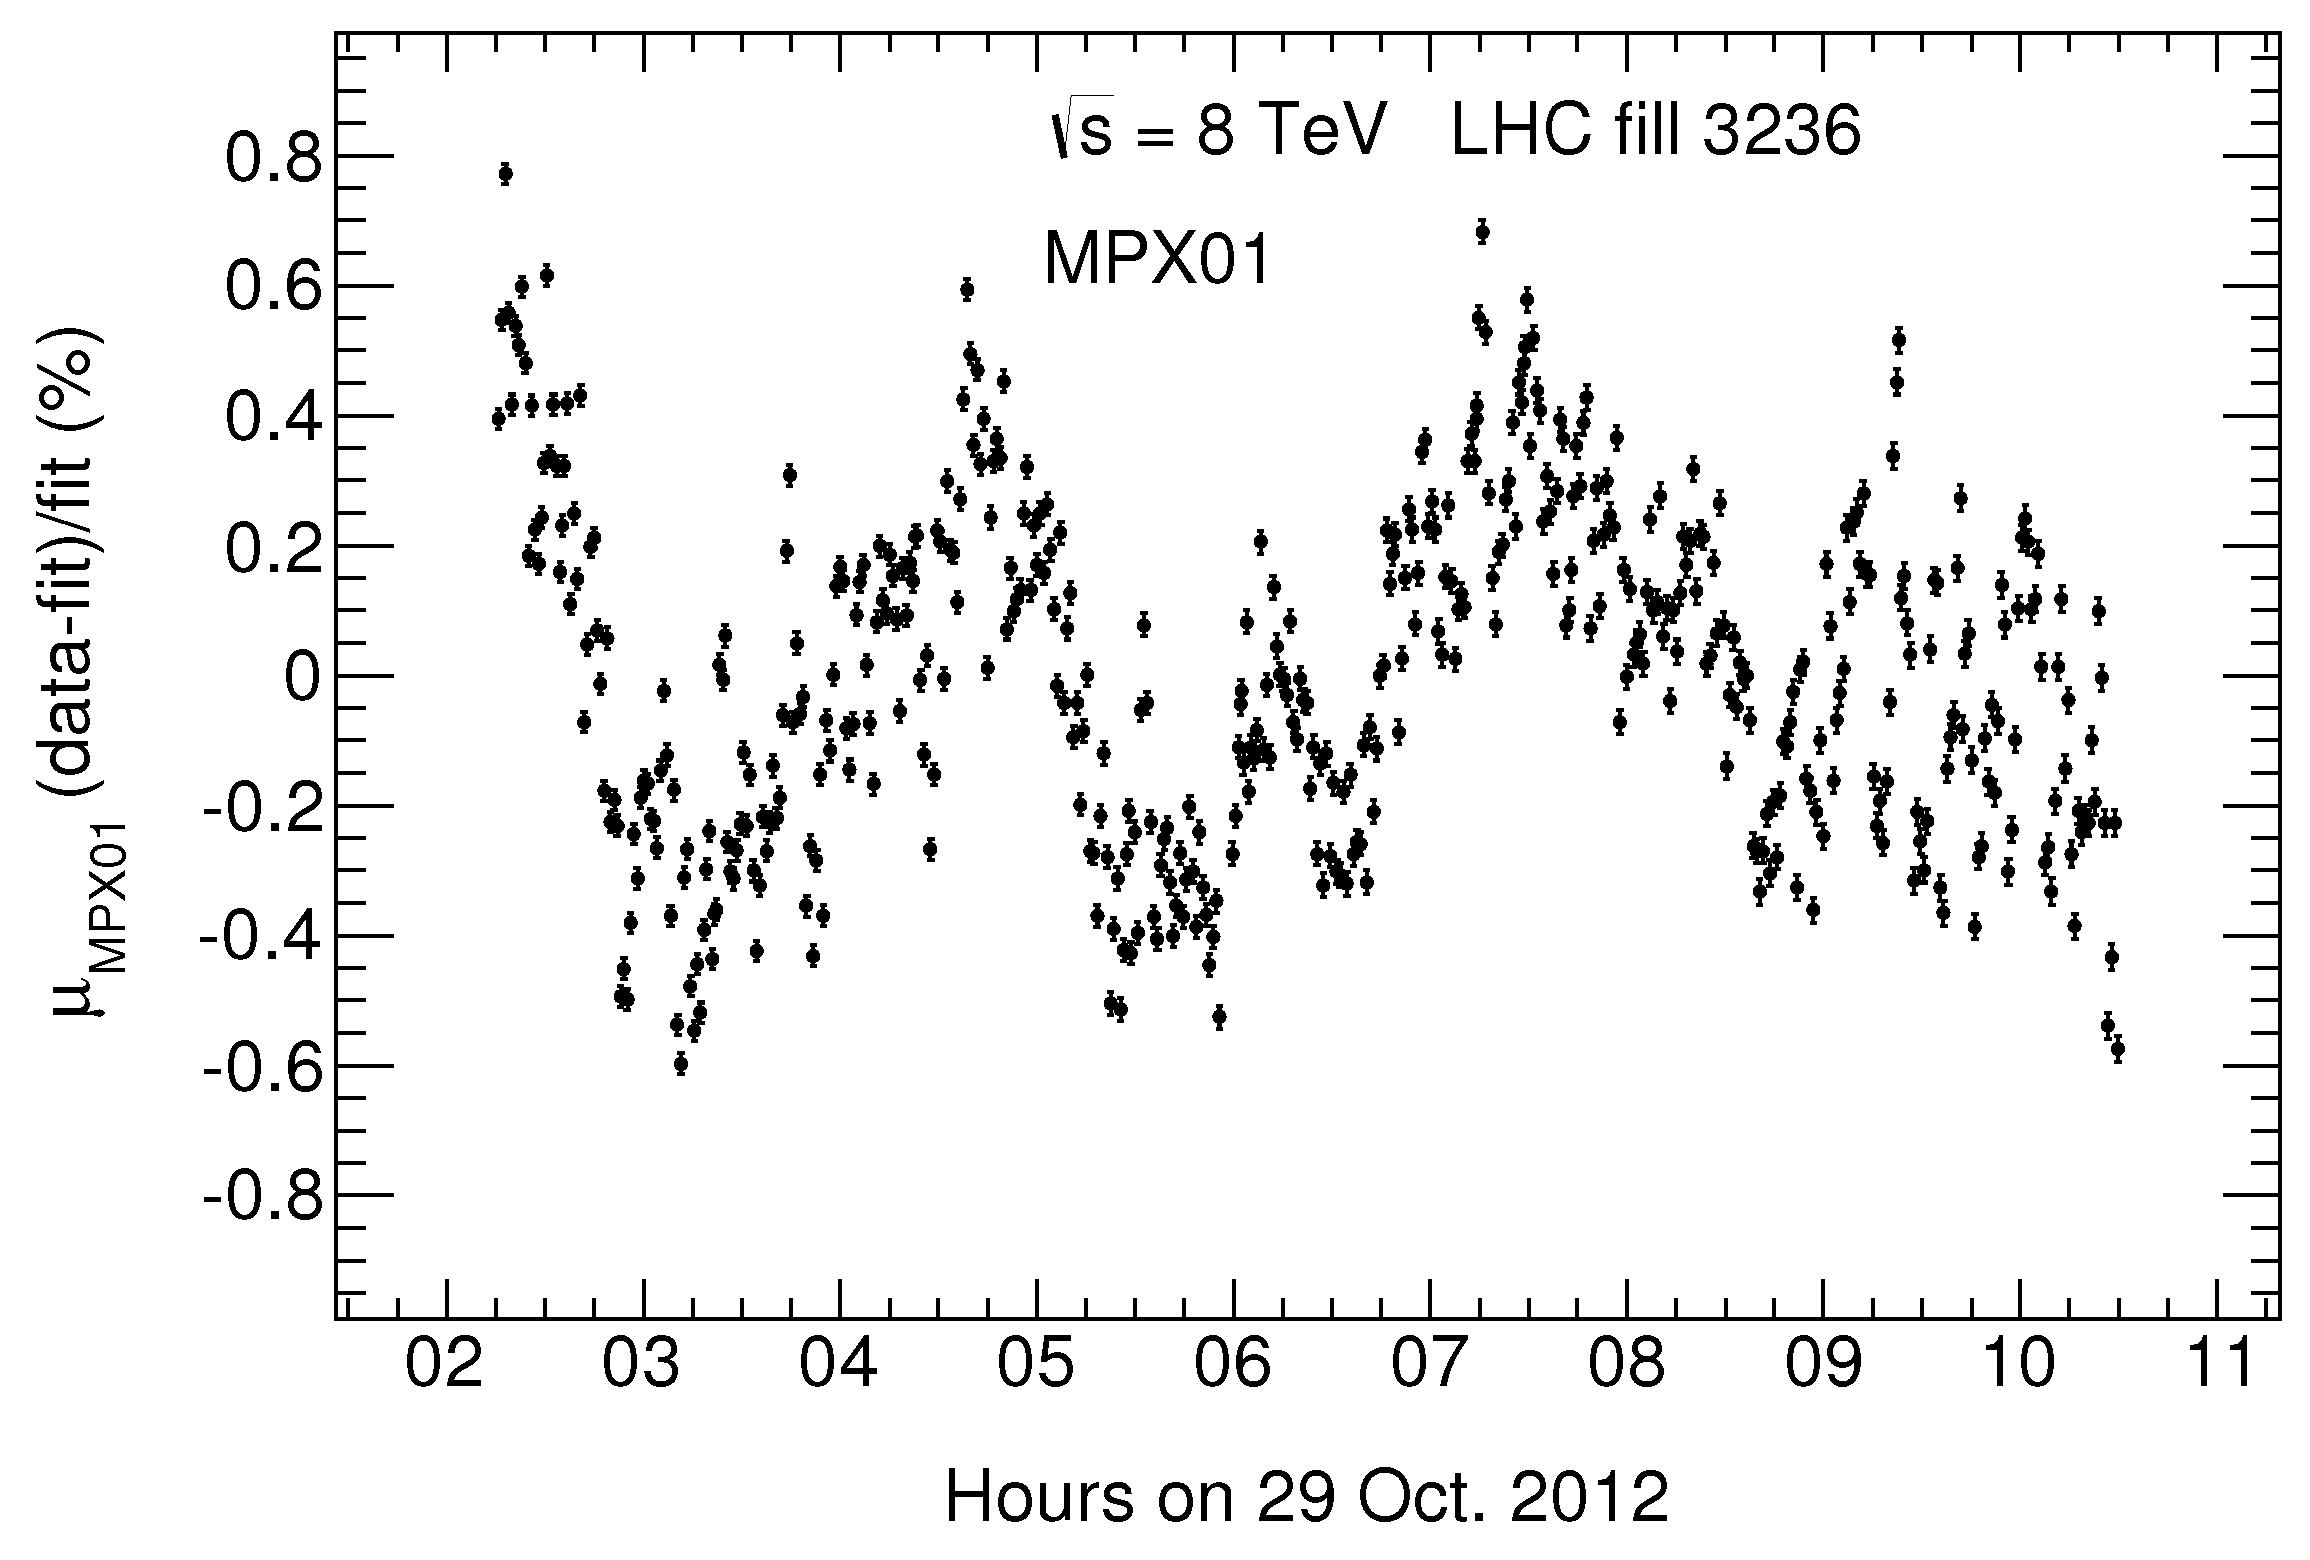
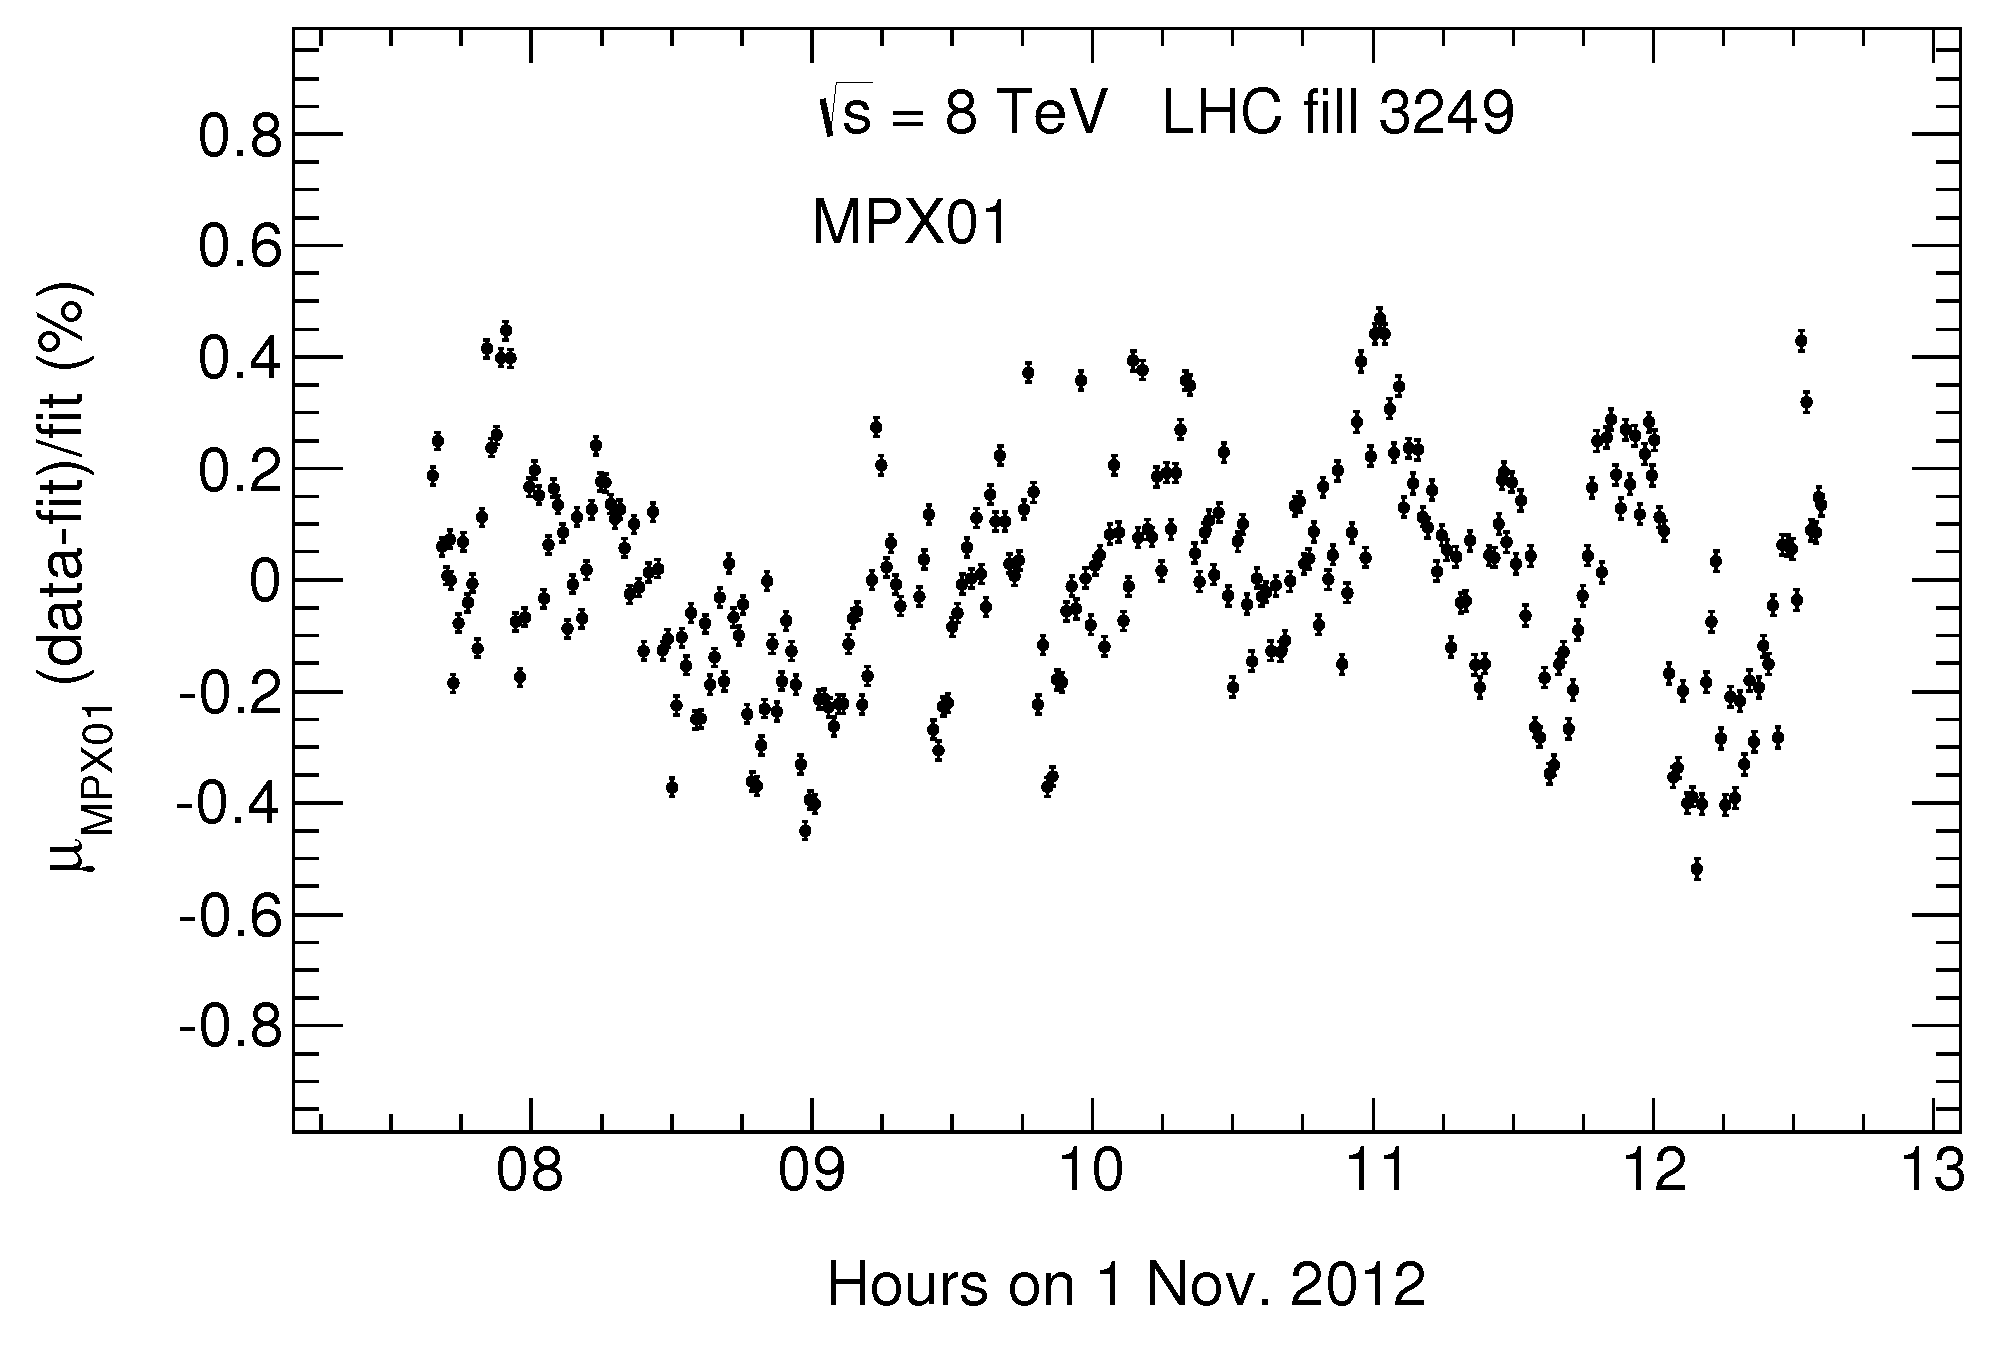
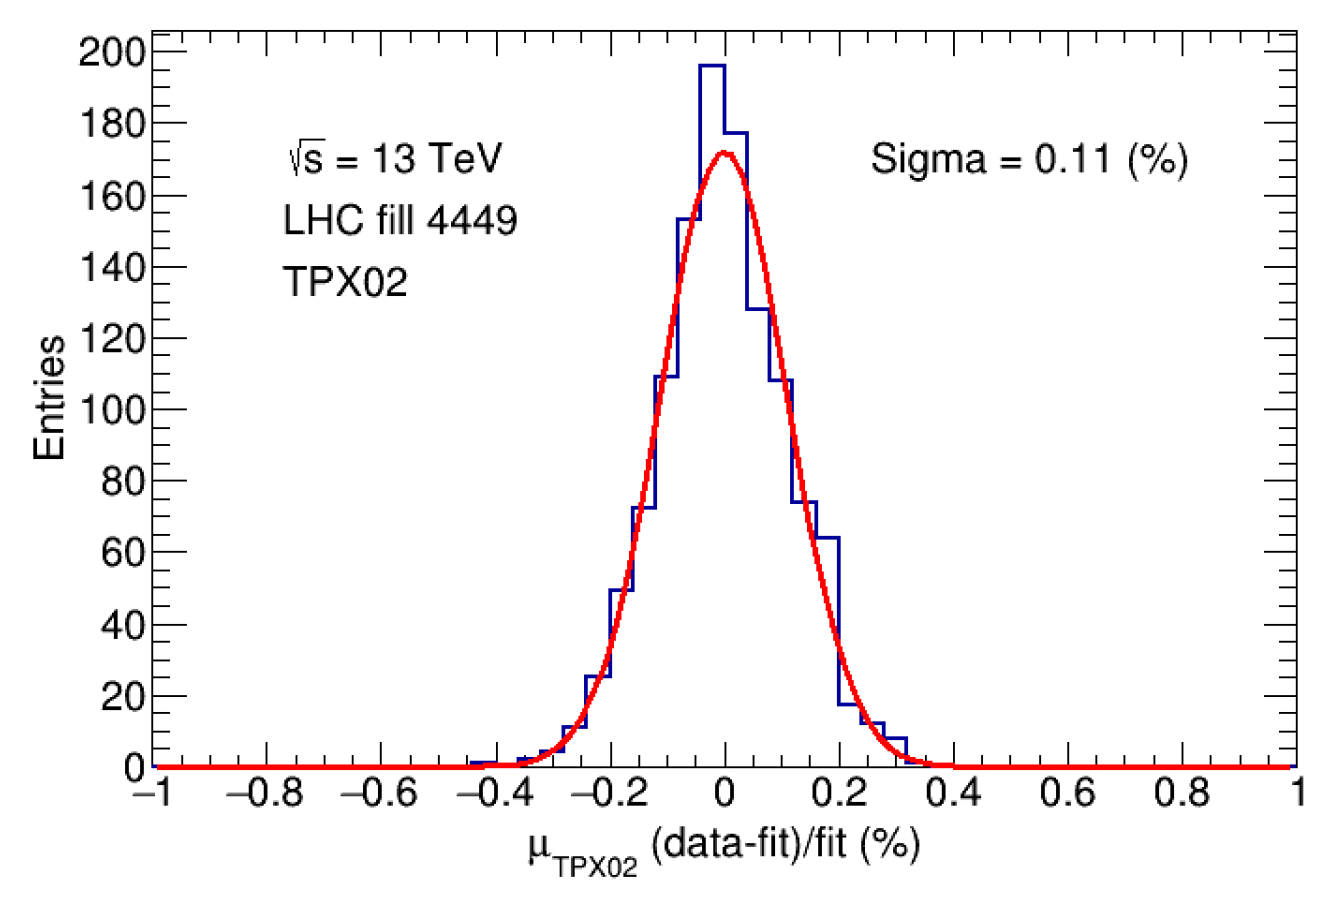
Figure 12 shows the difference between the fit and the data for MPX01. The observed structures could be attributed to small LHC luminosity fluctuations not described by the fit function. However, the origin of these fluctuations cannot be determined from the MPX data alone, and thus they are conservatively attributed to MPX systematics. The size of these fluctuations estimated as departure of the data from the fitted curve amounts to an RMS of approximately 0.3%, corresponding to
for
.
For all high-statistics devices used (MPX01-05 and MPX13), the uncertainties of the fits are dominated by systematic effects. The fit of the MPX01 data, for example, has a
much larger than one. Therefore, the fits are repeated with a constant systematic uncertainty for each MPX data point such that
. These fit parameters are also summarized in
Table 7. The
mean values of the beam–beam and beam–gas interactions are:
and
where the given standard deviations are calculated as the square root of the variance from the numbers in
Table 7 for constant systematic uncertainties.
The fit results indicate that the LHC luminosity reduction is predominantly caused by the beam–beam interactions since a larger value of corresponds to a shorter lifetime. In addition to the interactions between the proton beams and the remaining gas in the vacuum pipe, there could be other processes which, assuming that they also depend linearly on the number of protons, are incorporated in the value of .
In the following, the expected mean lifetime of inelastic beam–beam interactions is calculated and compared with the experimental results. The mean lifetime from inelastic beam–beam interactions is given by [
27]:
where
k is the number of bunches,
is the initial number of protons per bunch (
protons [
25]). The initial luminosity is
[
25], the number of high-luminosity experiments is
(ATLAS [
3] and CMS [
28]). We obtain
and thus
We note that
depends on the initial luminosity and the initial number of protons, and thus on the starting value of
for the fit. Since
, we can write
. Thus, for the lower initial luminosity in the fit, one expects a longer lifetime from beam–beam interactions and therefore a smaller
We observe that the fitted
value of Equation (
10) is larger than
calculated using the inelastic cross-section only given in Equation (
14). This suggests, as expected, that the proton–proton interaction cross-section leading to the proton loss from the beam is indeed larger than the inelastic cross-section. In addition to inelastic hadronic scattering, hadronic diffractive, hadronic elastic, and Coulomb scattering contribute to the proton burn-off.
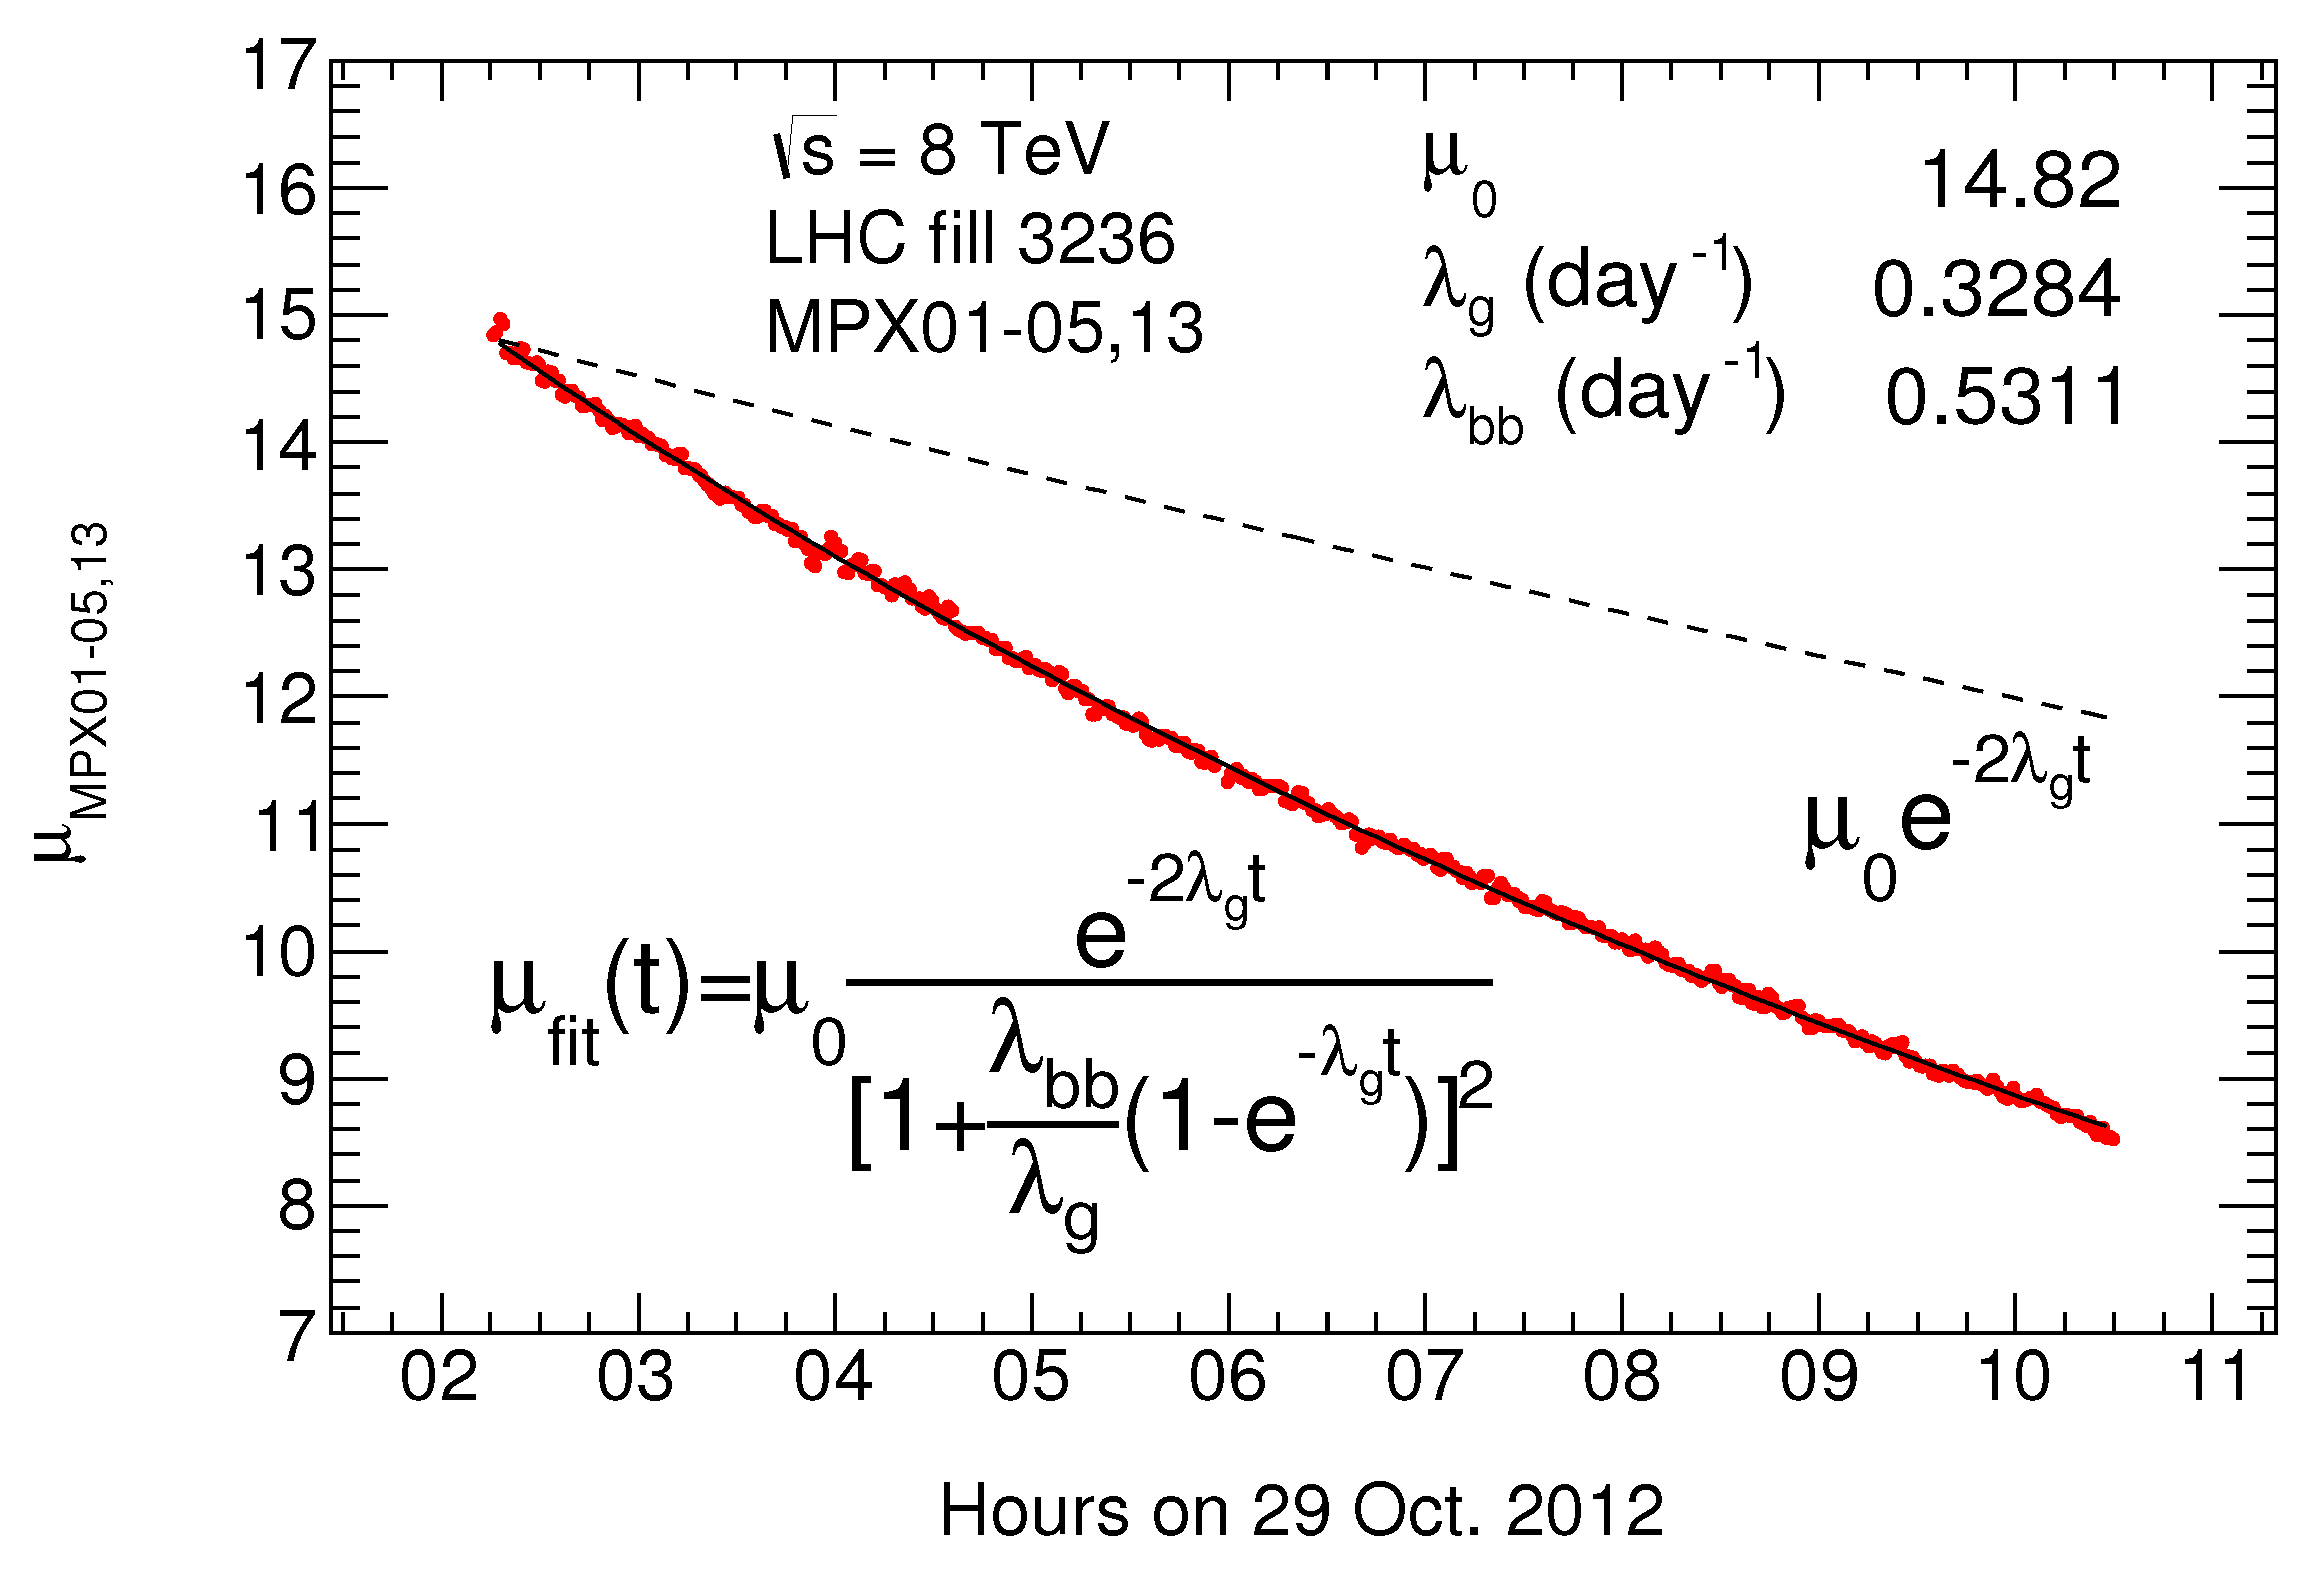
Another fit is performed using the combined data from MPX01-05 and MPX13 as a consistency check of the previously described analysis procedure, which used the average of the fit parameters from the individual MPX devices. The fit using the combined data is shown in
Figure 13. It gives, as expected, almost identical fit parameters to the ones obtained as the average values of the previous procedure.
The ratio of the data in the first half and the extrapolated fit curve is studied, since the performed fits were based only on data from the second half of the LHC fill 3236. It was found that data at the beginning of the fill are up to 30% above the fit curve. This could indicate that the luminosity decreases more quickly than expected from beam–beam (burn-off) and beam–gas interactions alone at the beginning of a fill, possibly due to non-linear effects with small emittance and short-length bunches. Furthermore, faster reductions in collision rates at the beginning of the fill could arise from denser bunches.
An intrinsic uncertainty in the MPX luminosity measurements results from the bunch integration of the MPX network since the colliding bunches in the LHC contribute with different intensities.
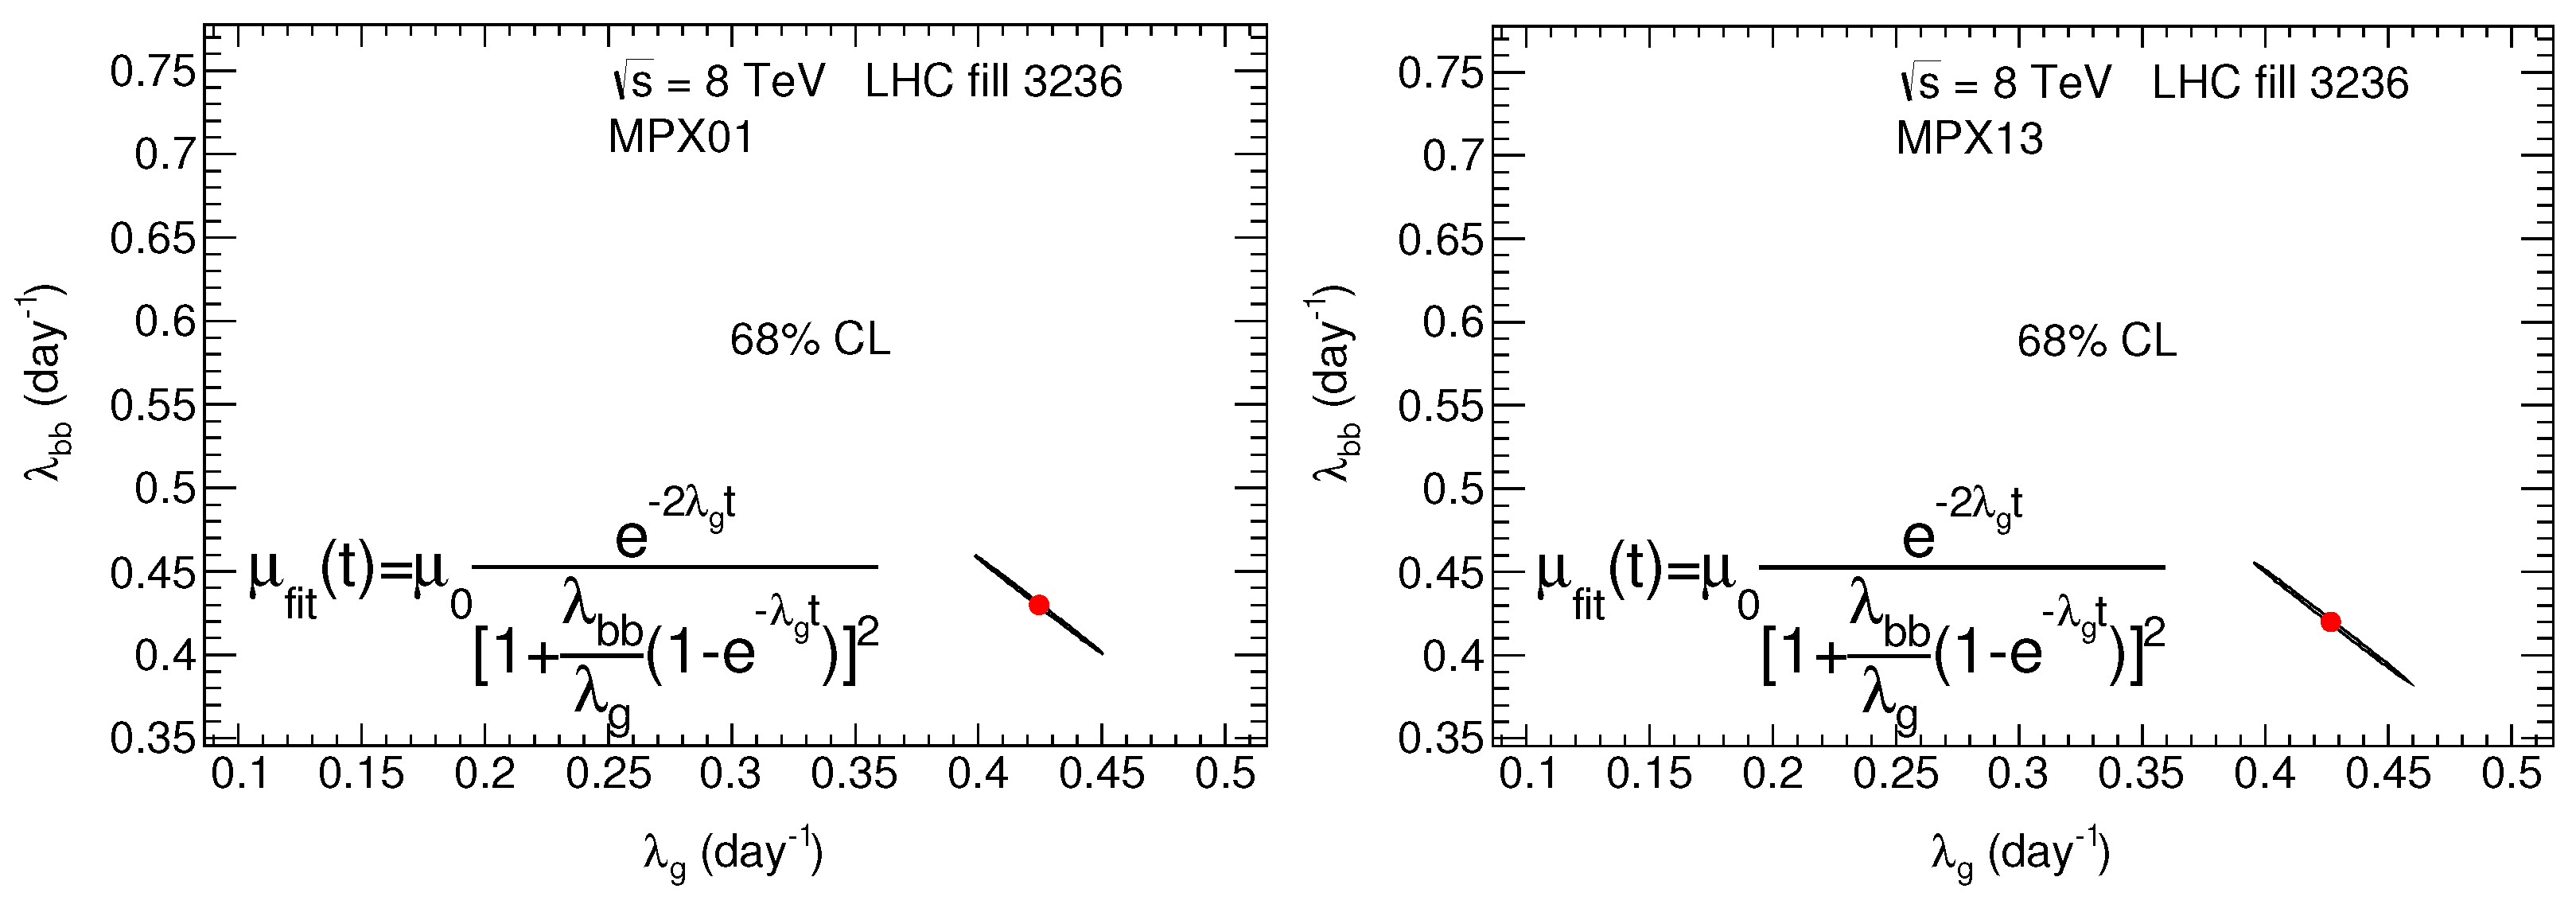
The contour plot of
and
, given at 68% CL (confidence level) in
Figure 14, shows a strong anti-correlation. The individual uncertainties are taken as constant (giving equal weight to the individual MPX devices in the combined data), since the uncertainty of the MPX data is systematically dominated. The constant uncertainty is scaled to
, yielding
.
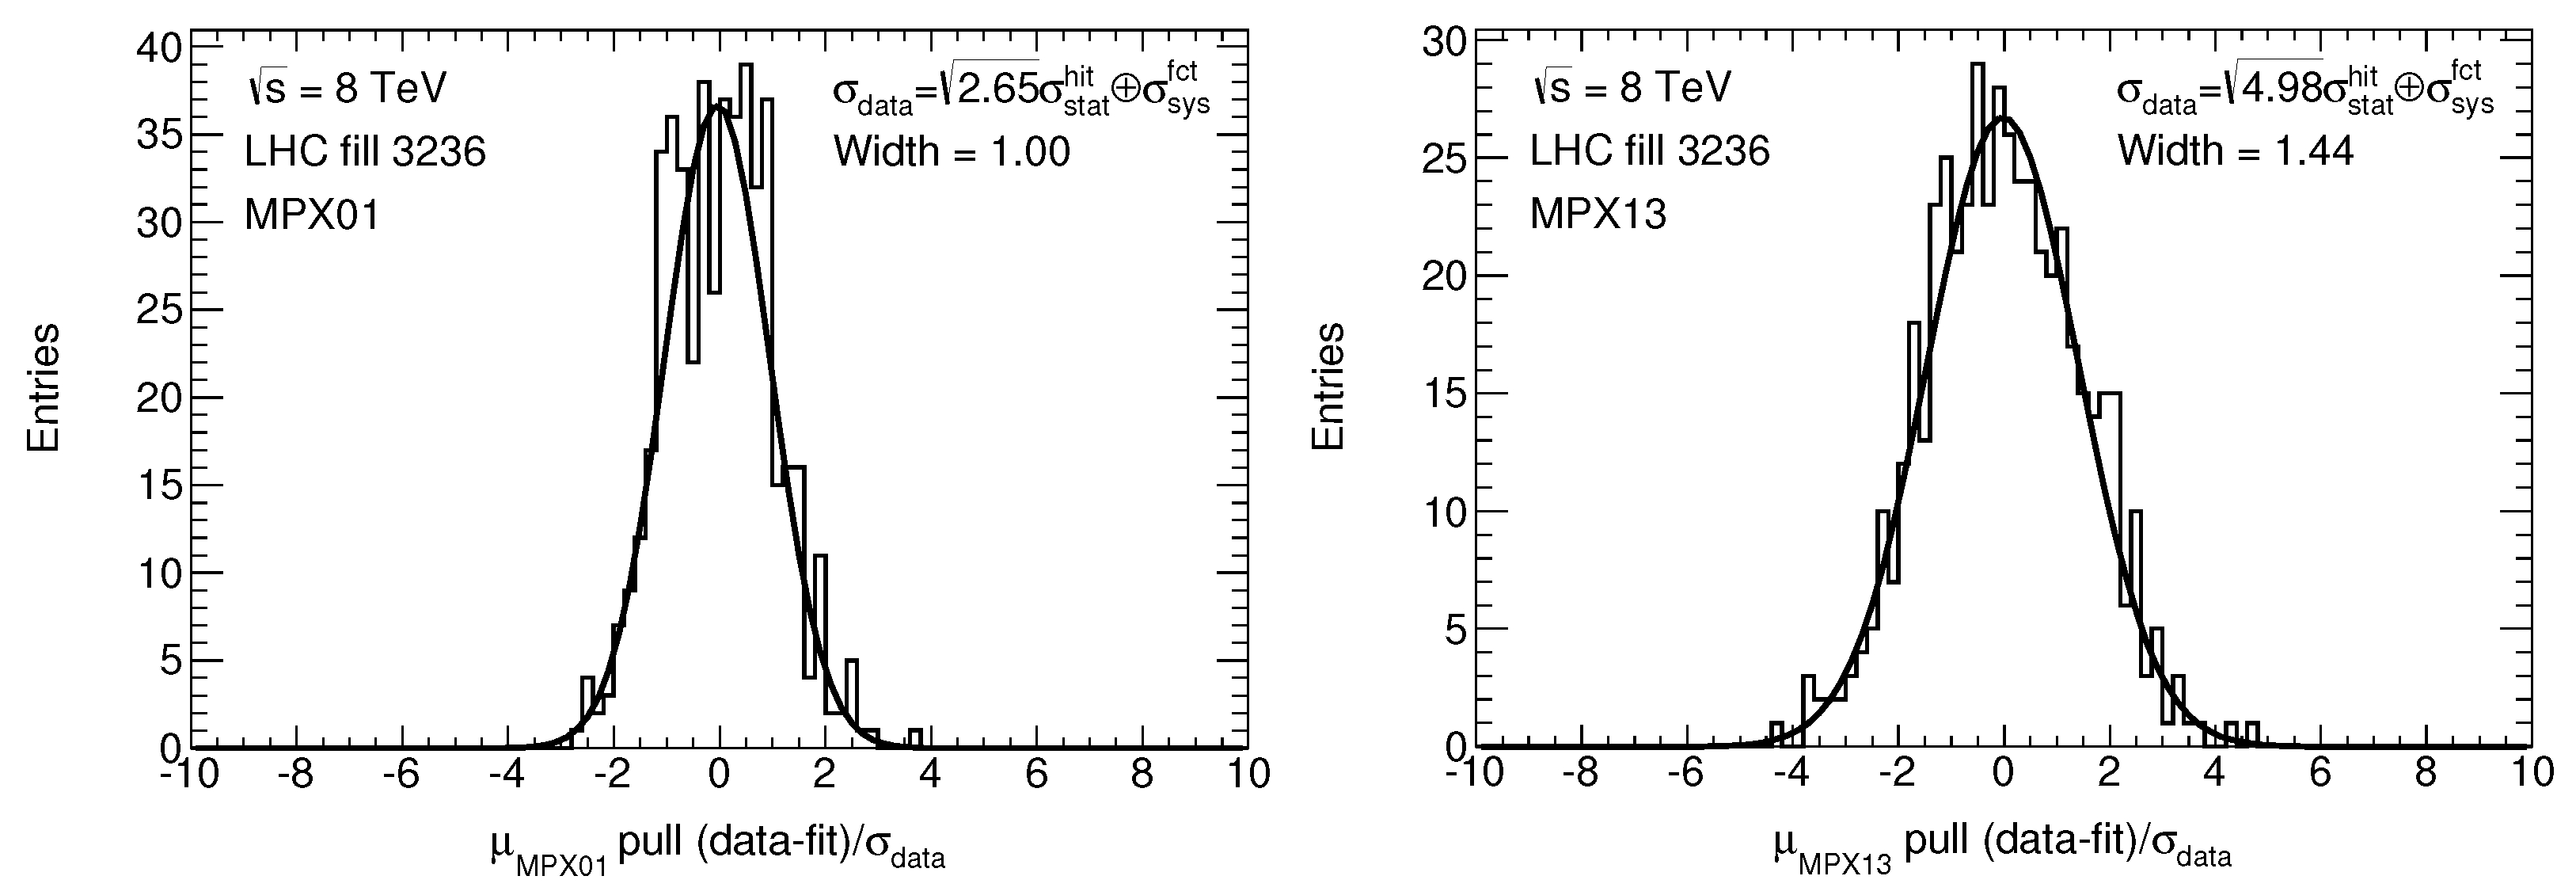
This study of the LHC luminosity reduction allows us to investigate the contribution of statistical and systematic uncertainties for each MPX device without relying on comparisons with other luminometers, only using MPX01 data due to its large data statistics. The pull, (data-fit)/
, is studied for each high-statistics MPX device individually with
. The
value is given in
Table 5 for each MPX device.
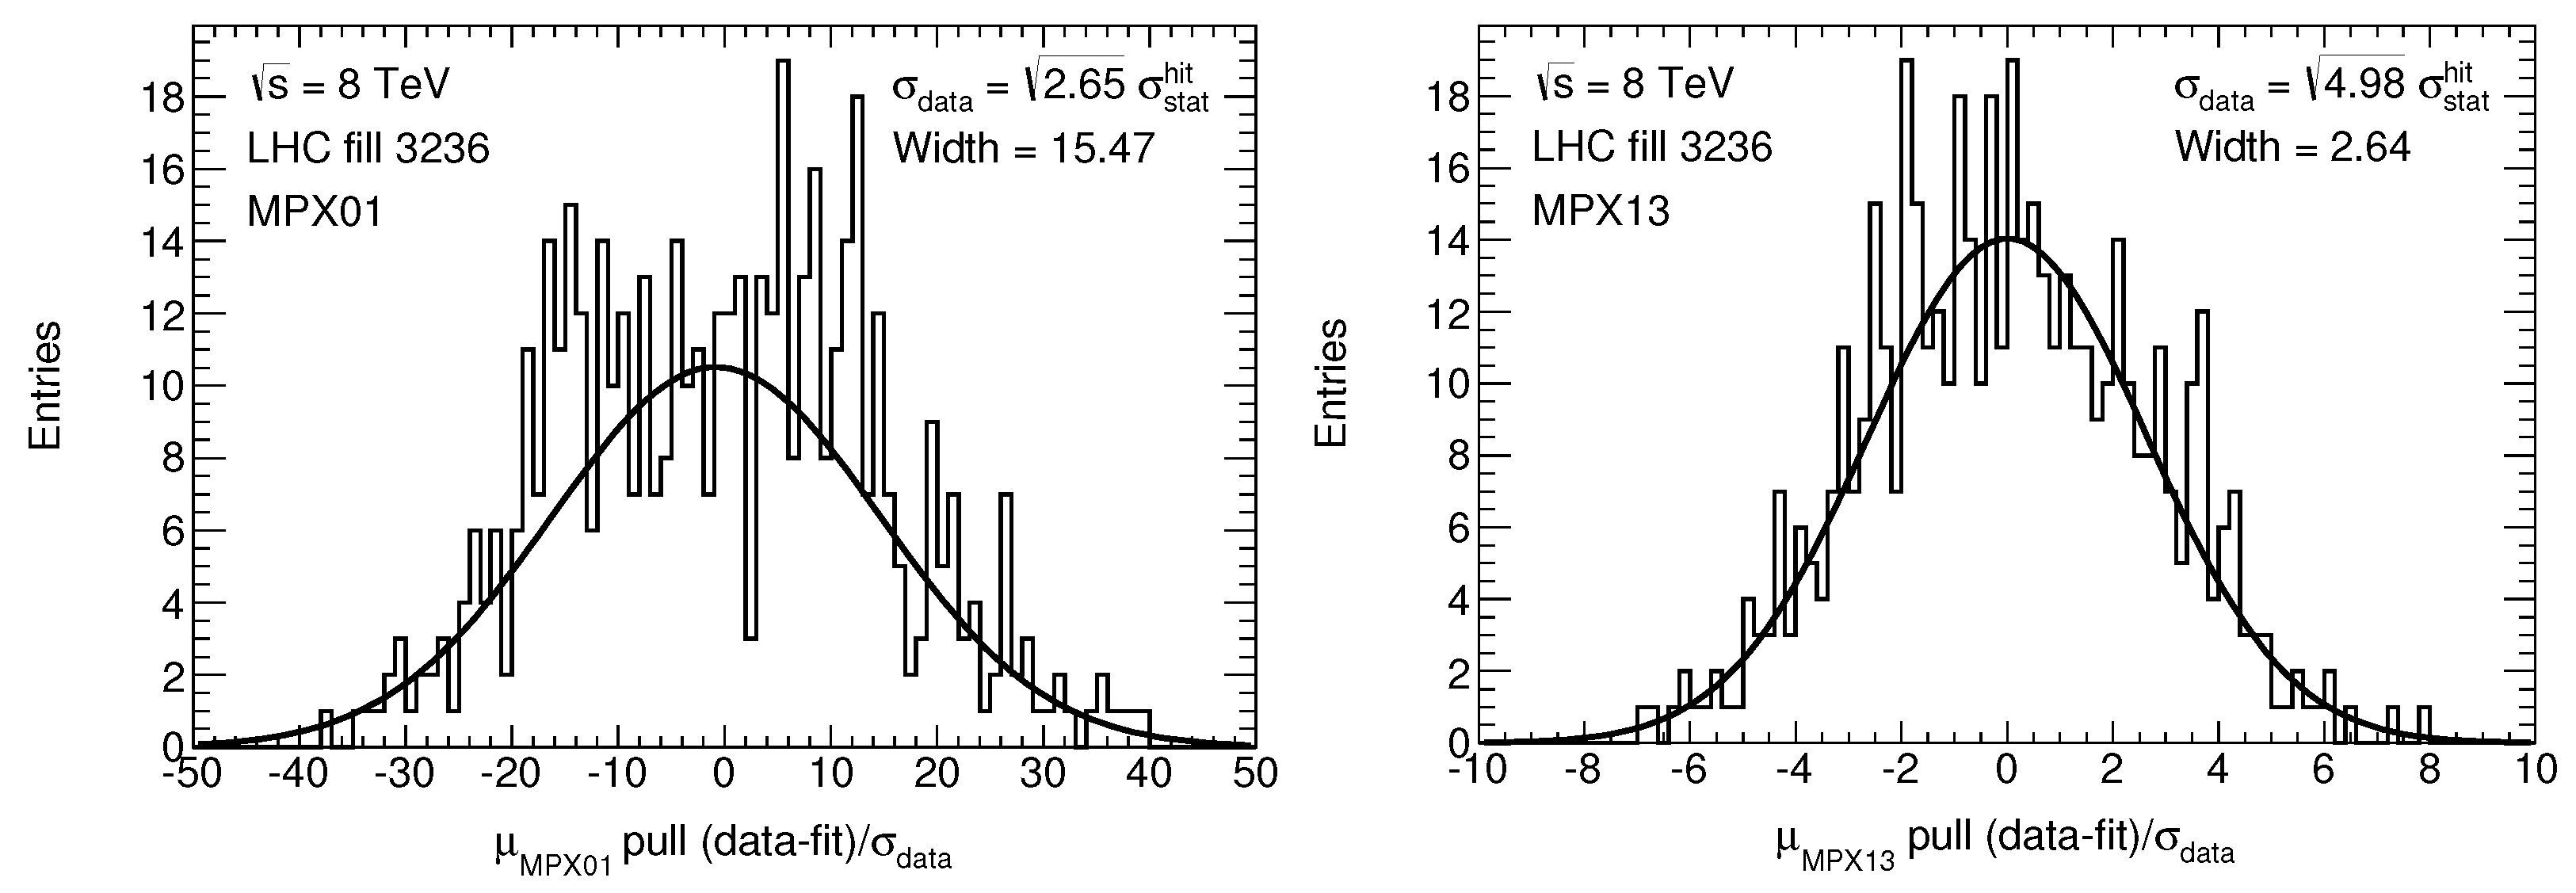
Figure 15 shows the pull distribution for MPX01 and MPX13. As expected from the observed structures in
Figure 12, the pull value 15.47 (defined as the width of a Gaussian fit) is large for MPX01. The pull values vary between 2 and 3 for MPX02-05 and MPX13, given in
Table 8. The uncertainty tends to be statistical in nature since the pull distributions are well described by Gaussians. While the hit statistics of MPX02-05 and MPX13 vary more than a factor 10 (
Table 5), the pull is almost device-independent. Thus, the systematic uncertainty in addition to the hit statistics seems to also be of statistical nature. Therefore, the total uncertainty (statistical and systematic) can be described by scaling the statistical uncertainties such that the pull is unity.
Comparing the pull value of MPX01 with those of the other MPX devices, one can see that the statistical precision of MPX01 is high enough that, in addition to the intrinsic MPX uncertainties (scaling with the MPX hit statistics), variations in the LHC luminosity that are not described by the fit function become visible, as shown in
Figure 12. This is corroborated by the observation that the pull distributions as a function of time show a structure only for MPX01.
The fluctuations of luminosity not described by the fit function (
Figure 12) are interpreted as systematic uncertainty. Therefore, an additional uncertainty corresponding to the RMS of the data deviations from the fit function,
, is added in quadrature to the statistical uncertainty.
Figure 16 shows the resulting pull distributions for MPX01 and MPX13, and
Table 8 summarizes the fit results. The width of the pull distribution is close to unity, as MPX01 was used to derive the systematic uncertainty. For the other MPX devices the pull varies between 1.44 and 2.10. Thus, as for the vdM scan, the fluctuations are about a factor two larger than expected from hit statistics alone for physics data-taking, which is about 3000 times larger in luminosity.
The effect of the varying hit/cluster ratio on the statistical evaluation is studied with a simple Monte Carlo simulation. The goal is to determine whether using the average hit/cluster ratio (2.65 for MPX01), rather than the varying ratios frame-by-frame, could increase the pull value. This study cannot be done with recorded data, since the pixel occupancy is too large during physics data-taking when the pull value is determined. First, a pull distribution has been simulated using a Gaussian distribution with unity width. Then, the statistical uncertainties are reduced by a constant value
. Alternatively, they are reduced by a varying factor
frame-by-frame, reflecting the MPX01 distribution in
Figure 8. Both resulting pull distributions are fitted with a Gaussian. The former gives a width of
, as expected, and the latter 1.2. Therefore, there is no increase in the width when using the varying hit/cluster ratios. Compared to the initial Gaussian distribution, the pull distribution with varying hit/cluster ratios shows a higher peak and higher populated side-bands. Thus, it can be excluded that the varying hit/cluster ratio is the source of the observed pull values for MPX02-05 and MPX13 ranging between 1.44 and 2.10 (
Table 8).
The following observations could explain the luminosity fluctuations being about twice as large as the statistical expectations from the hit statistics alone:
The average hit/cluster ratio, in particular for MPX01, could be larger as noisy pixels are not excluded when the ratio is determined.
The assumption that one cluster corresponds to one particle bears an uncertainty involving the cluster definition.
Some particles are reflected and could pass the MPX sensor more than once.
The showering of particles in the ATLAS detector material increases the number of particles passing the MPX devices; thus, the number of independent particles to be used in the statistical determination of the expected uncertainty would be smaller. The determination of this effect would require a full simulation of the material distribution of the ATLAS detector in front of each of the MPX devices, which is beyond the scope of this study. However, the same pull value of about two, observed for all six MPX devices used in the hit study, indicates that the effect is independent of the MPX device and its position.
These effects could lead to a smaller number of independent objects impacting the luminosity measurement. Thus, the statistical uncertainty is presumably larger than from hit counting alone. A reduction of the number of independent objects by about a factor four increases the statistical uncertainty by a factor two and would reduce the pull distribution width to unity.
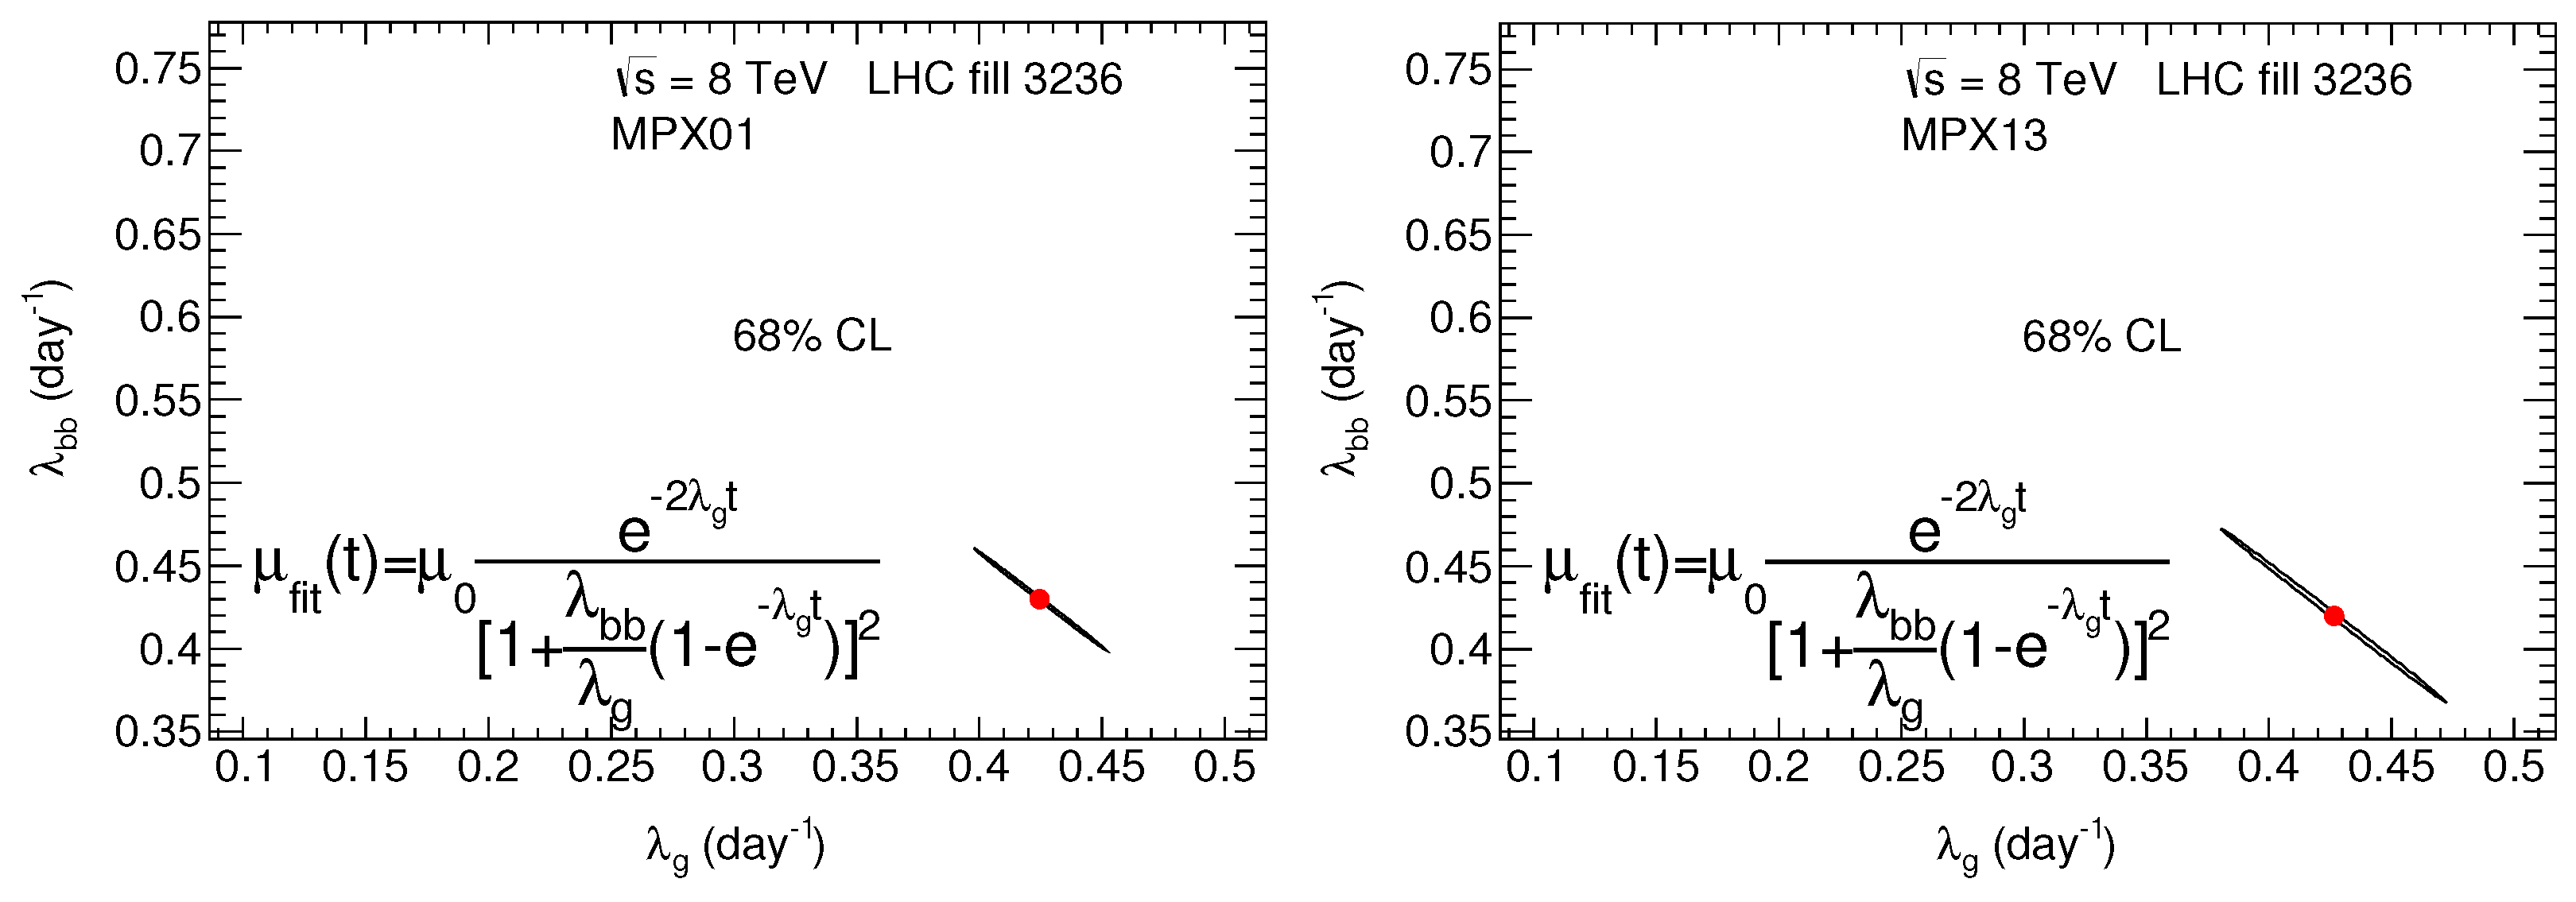
In summary,
Figure 17 shows the contour plot of
and
, given at 68% CL, for the hit statistical uncertainties and systematic uncertainties from luminosity fluctuations not described by the fit function. They are added in quadrature, given in
Table 9.
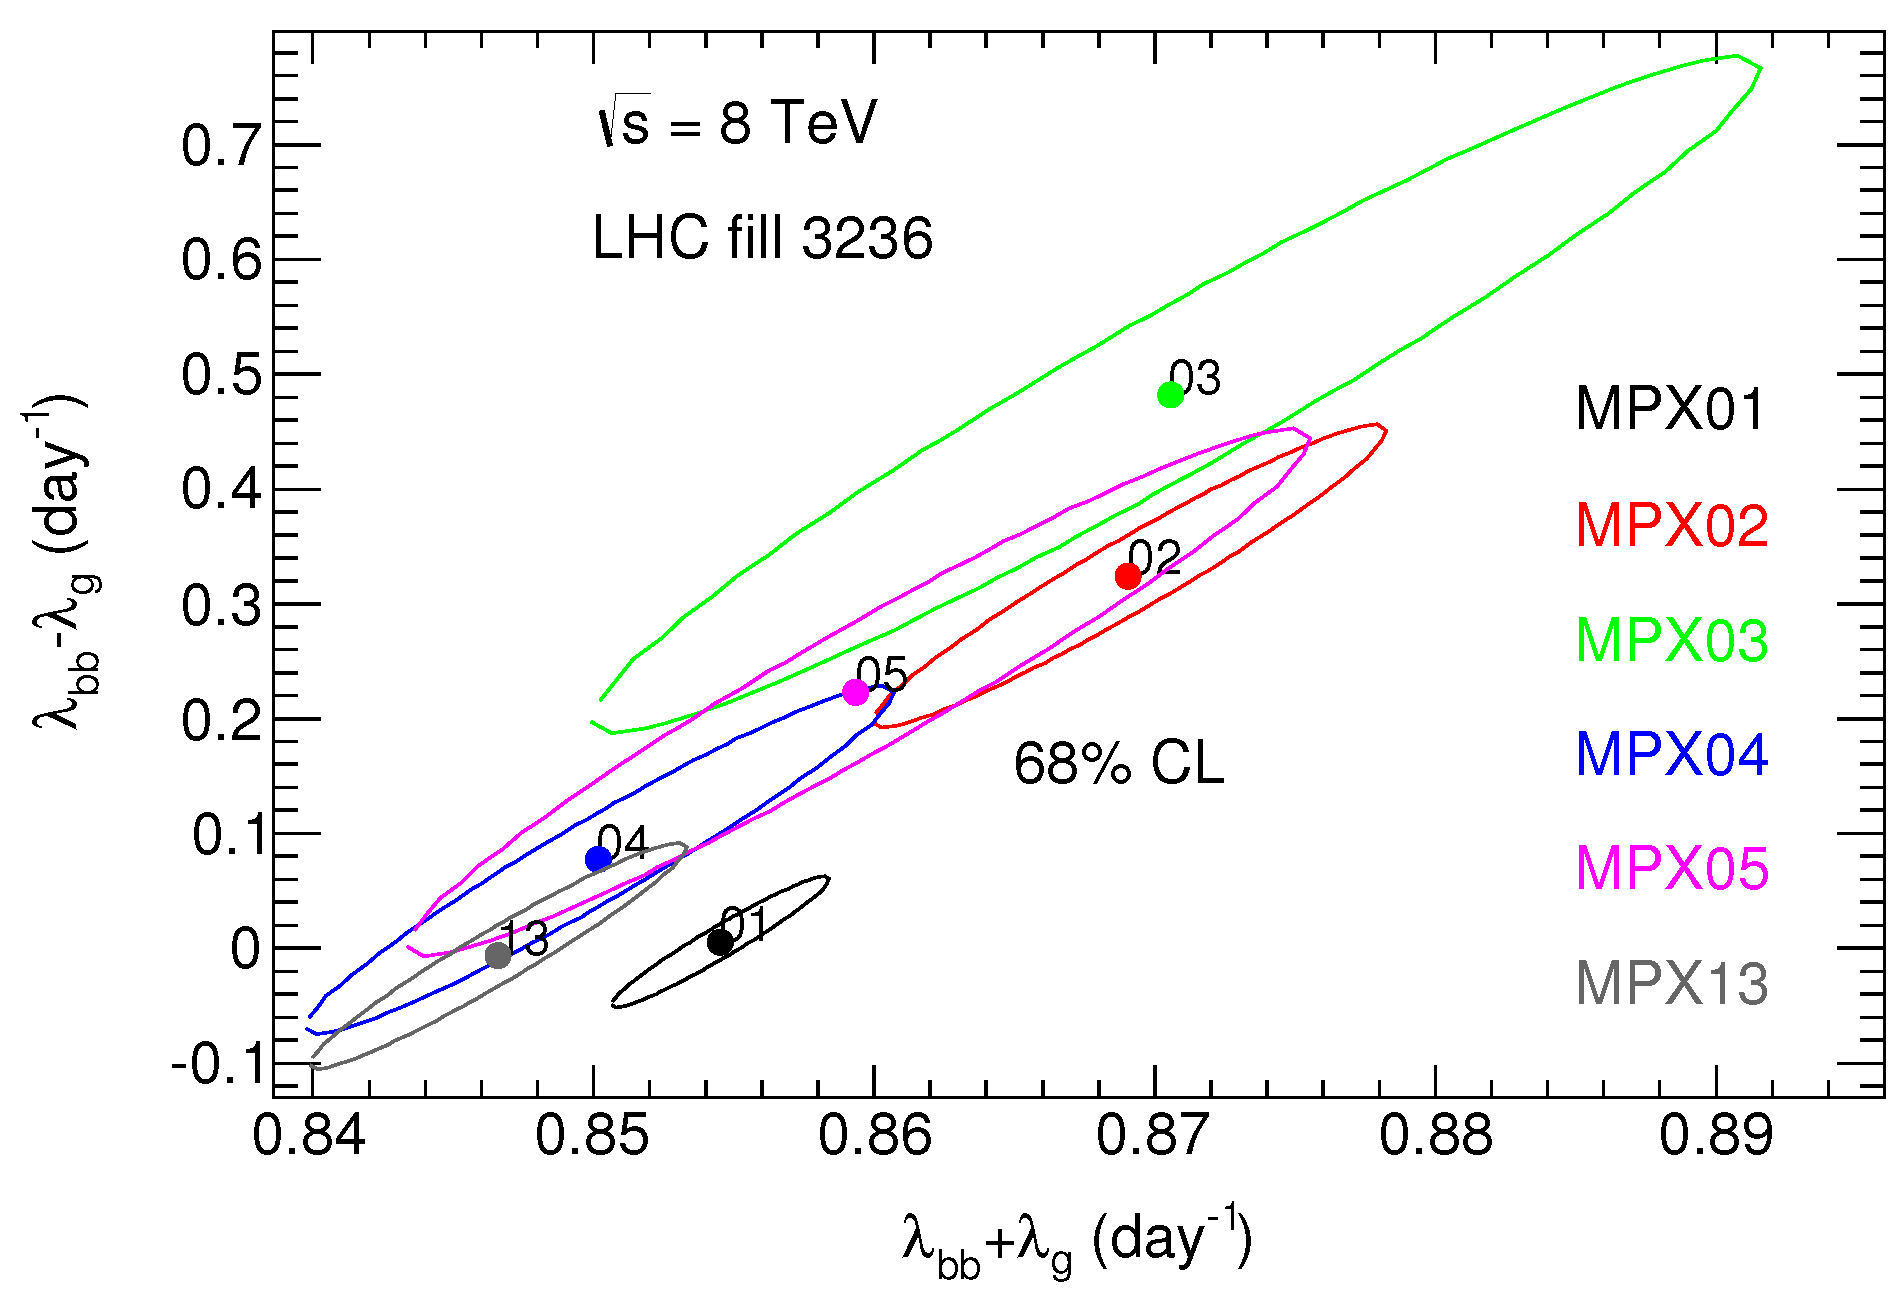
Figure 18 shows the corresponding plots for
. The variations of the fit values are well described by the contours. Owing to the strong anti-correlation between
and
, a transformation of the fit results is performed. The
versus
plane is used in order to illustrate the relative uncertainty between the fit values. The comparative sensitivities of the MPX devices at 68% CL are summarized in
Figure 19.
The analysis performed with LHC fill 3236 data has been repeated with LHC fill 3249 data, taken 31 October to 1 November 2012, for
to
. The MPX01 results from LHC fill 3249 lead to a relative precision below RMS 0.3% (
Figure 20) in agreement with the results from LHC fill 3236.
Table 10 gives the relative statistical uncertainties and lists the total uncertainties for RMS 0.2% (obtained in LHC fill 3249) and RMS 0.3% (obtained for LHC fill 3236). The corresponding pull values for statistical and total uncertainties are given in
Table 11.


