Abstract
Critical angle refractometry is an established technique for determining the refractive index of liquids and solids. For transparent samples, the critical angle refractometry precision is limited by incidence angle resolution. For lossy samples, the precision is also affected by reflectance measurement error. In the present study, it is demonstarted that reflectance error can be practically eliminated, provided that the sample’s extinction coefficient is a priori known with sufficient accuracy (typically, better than ) through an independent measurement. Then, critical angle refractometry can be as precise with lossy media as with transparent ones.
1. Introduction
Critical angle refractometry is the standard for determining the refractive index of transparent media [1,2,3,4,5,6]. The method relies on measurements of the reflectance, , of the interface, formed by a transparent front medium (which is commonly a prism) of known refractive index, , and the sample of unknown index, n, for a range of incidence angles, , that includes the critical angle, , of total internal reflection (TIR) [7,8,9].
As it is shown in Figure 1, the critical angle is located at a sharp discontinuity of the -derivative, ; the refractive index of the sample is obtained from the TIR condition:
with the corresponding relative error:
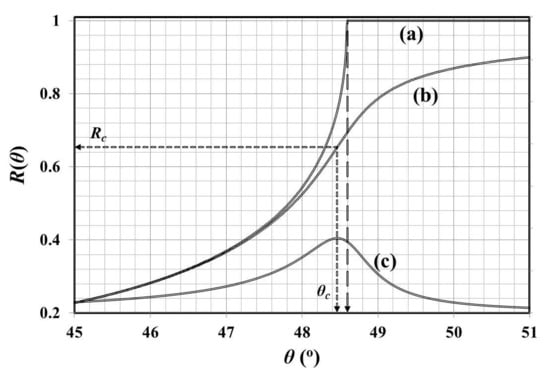
Figure 1.
(a) Fresnel reflectance, , profile, as a function of the incidence angle, , at an interface between a transparent sample and a transparent prism, such that the ratio of unknown refractive index to the known index is . Long-dashed arrow indicates the location of the corresponding critical angle, . (b) Fresnel reflectance profile at an interface between a lossy sample and a transparent prism, such that and , where and are the real and inginary parts of the refractive index, respectively. Short-dashed arrows indicate the location of the corresponding critical angle and critical reflectance, . (c) The critical angle rests at the peak of the reflectance derivative, which is also depicted (in arbitrary units).
In determining the TIR critical angle, the error, , is mainly regulated by the angular resolution of the experimental setup, which is typically between 20 rad and 100 rad for state-of-the-art refractometers [10].
Critical angle refractometry has also been used with lossy media where the refractive index turns into the complex number, , the imaginary part of which (imaginary index) incorporates loss effects, namely, absorption and/or scattering. The reflectance profile, , becomes smoother, and the critical angle, , is located at the maximum of , which now marks the gradual transition from the attenuated TIR (a-TIR) to the partial reflection regime; see Figure 1. The underlying assumption is that Equation (1) is still valid (at least approximately) and that it can be used to obtain an estimate of the real index of the lossy sample [11,12]. This assumption introduces systematic errors that have been the subject of extensive discussion; see, e.g., [13,14,15] Let us note that fitting the reflectance profile, , to Fresnel equations is another way to compute the complex optical constants [16,17,18]. However, bearing its own strengths and weaknesses, data regression is not a point method and, thus, cannot be taken as a “critical angle” refractometry approach in itself.
Recently, the universal condition of a-TIR,
was proposed, where is the critical reflectance at , and functions and are derived from the Fresnel equations [19]. In the case of the s-polarisation, which is the main foucus of the present study, these equations are given in Section 2. Using Equation (3), the complex refractive index can be determined by and .
Then, the relative error of the real index, , depends on both and :
In determining the critical reflectance, the error is mainly due to intensity fluctuations of the laser sources and, therefore, to be of the order of , which is at least two orders of magnitude larger than . As a result, critical angle refractometry is less precise with lossy media than it is with transparent ones.
In this paper, it is demonstrated that the critical reflectance can be numerically computed with higher accuracy than it can be experimentally obtained, provided that the extinction coefficient of the sample is a priori known with sufficient accuracy (<5%, typically). Then, the real index relative error for lossy samples (being and dependent; see Equation (4)) can become equal to the relative error for transparent samples (which is only dependent; see Equation (2)). This is a significant advancement in the field of optical characterisation of absorbing and/or scattering media, which include, among others, various forms of biological matter, non-transparent liquids, colloids and food products.
2. Background Theory and Initial Observations
The functions and [19] are compactly expressed in terms of the sample’s complex dielectric constant, , and the prism’s dielectric constant, :
where
with
and
As it is described in [19], the preceding formalism, which is valid for s-polarisation, calculates output values from refractometric input pairs by successive algebraic substitutions into Equations (5)–(8). Let us remark that Equations (5) and (6) are also valid for p-polarised light, in which case however, there exist no explicit solutions for and such as those provided by Equation (7). Instead, these parameters can be calculated as solutions to two algebraic equations, as is analytically shown in [19]. In that sense, the forthcoming analysis may be replicated for p-polarisation. Despite some more complication in the calculations, the results, reported here for s-polarisation, are qualitatively similar to those of p-polarisation.
Figure 2 gives a graphical insight by the isoangular curve which consists of pairs , computed by keeping constant ( in this example), while letting to vary. There is no loss of generality, associated with the specific choice of , because larger (smaller) critical angles simply shift the curve to the right (left). An indicative measurement (with varying) defines a single point in the -plane, whose coordinates uniquely determine the complex refractive index.

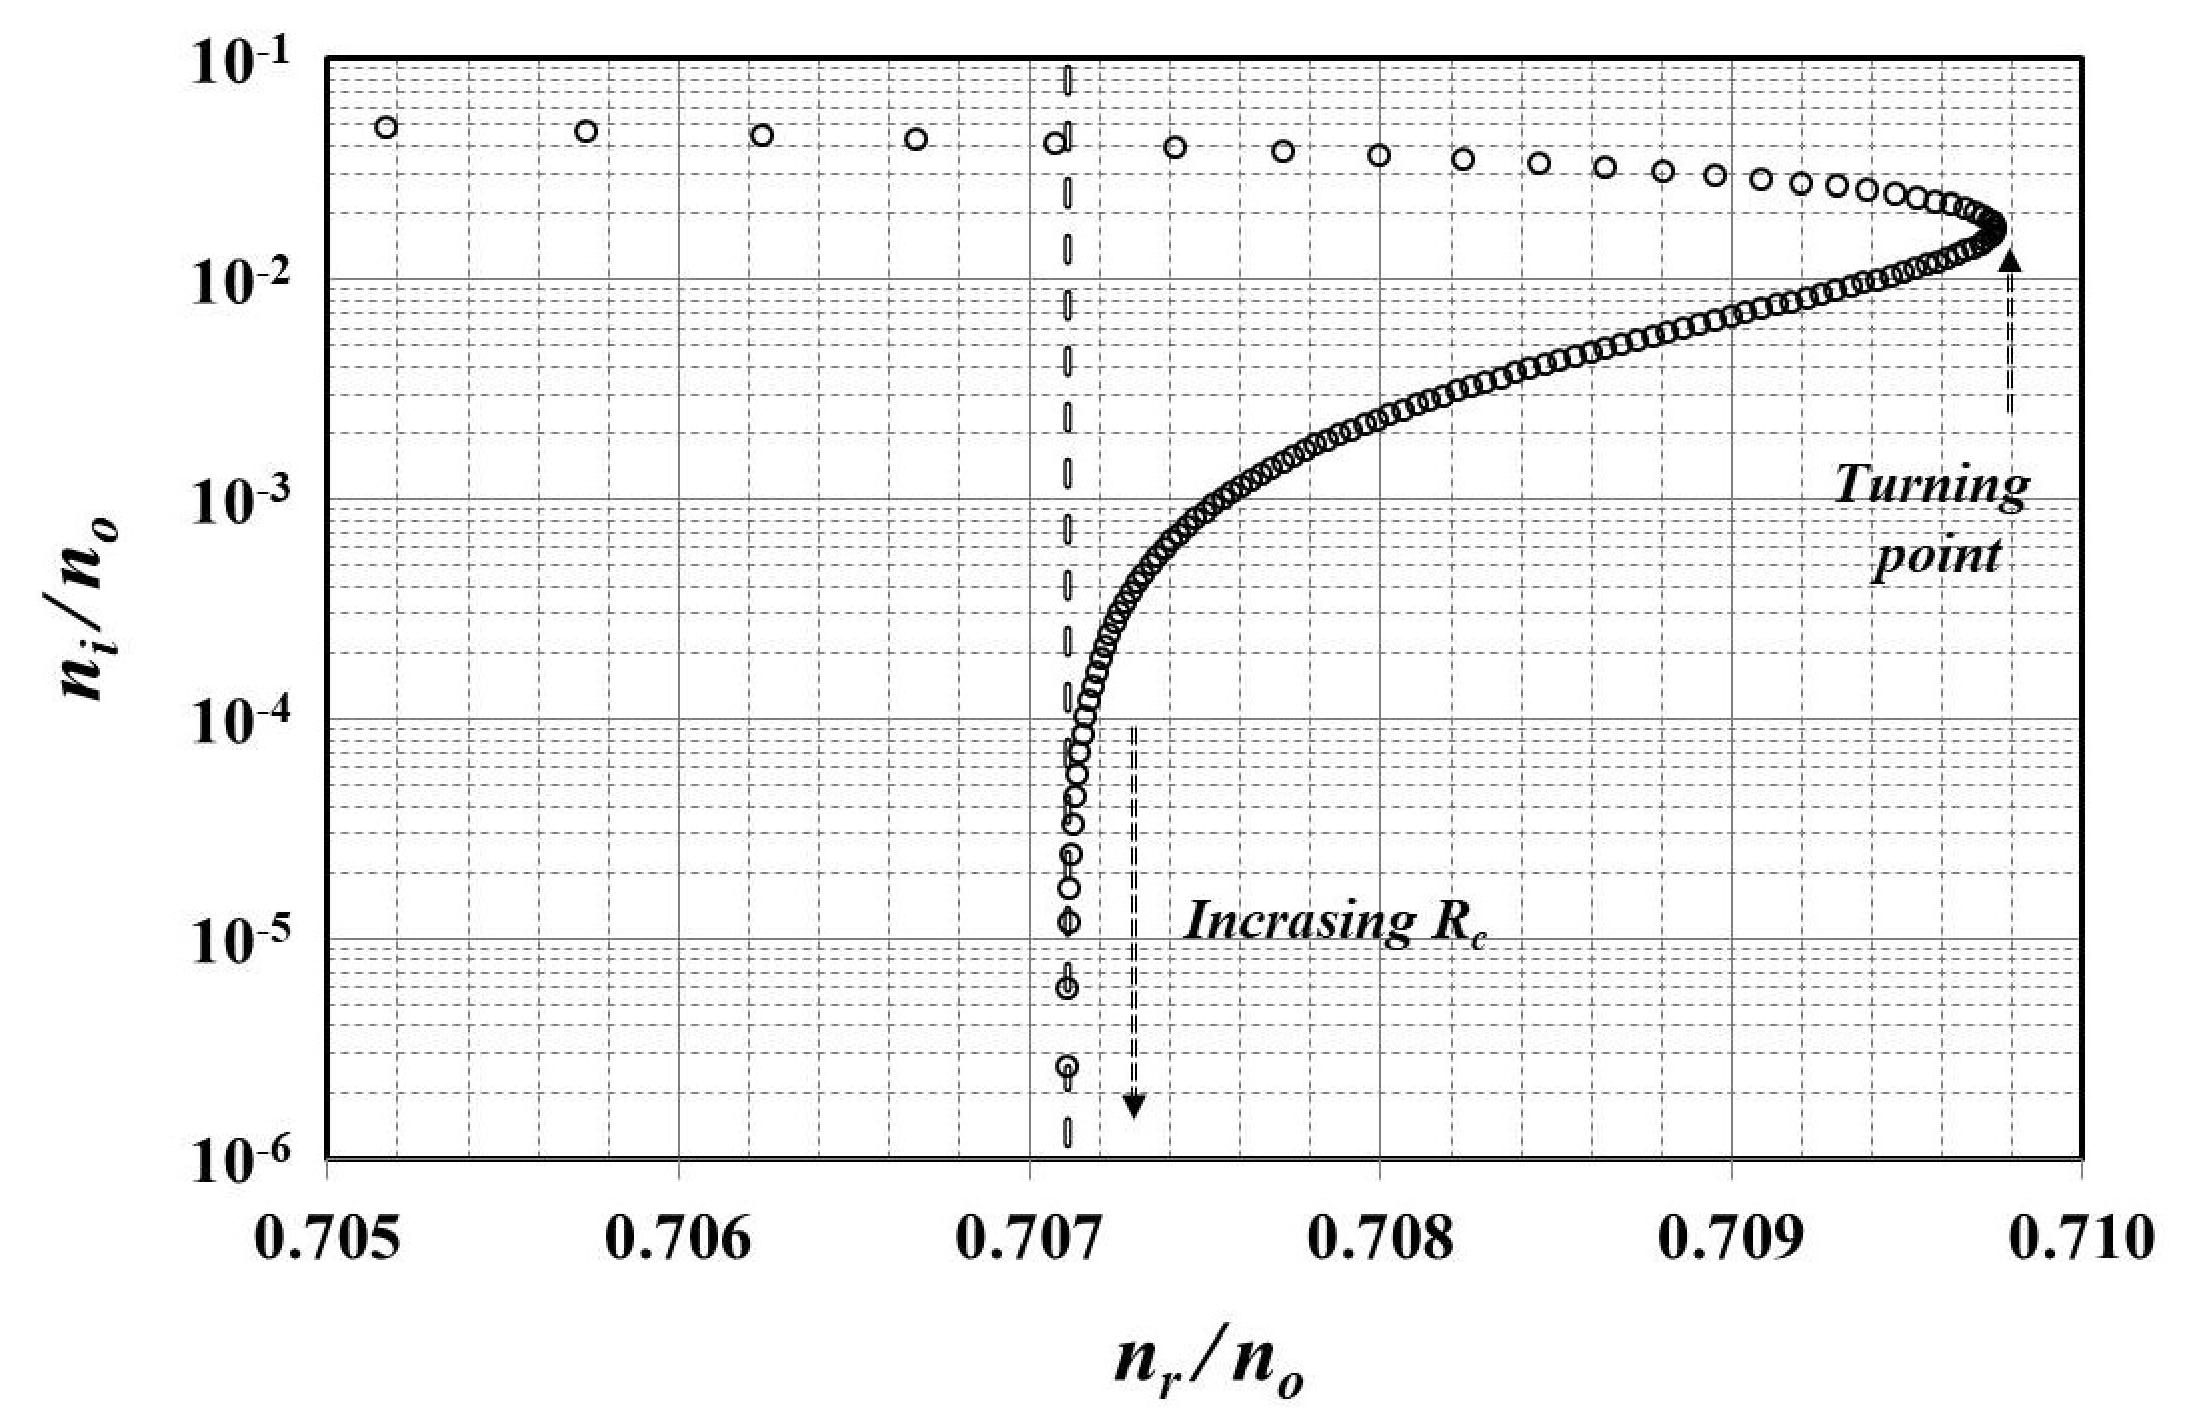
Figure 2.
Isoangular curves in the (-plane for the s-polarisation, and variable . As one moves along the direction of the arrow, increases in steps of , within the range . The vertical dashed line marks the transparency limit, .
In Figure 2, one can observe quite wide range, spanned by the imaginary index as the critical reflectance varies, especially compared to the relatively modest shift for the real index, which is nevertheless non-negligible. The vertical dashed line in Figure 2 marks the transparency limit , which is the estimate of the TIR-condition (Equation (1)) for each point of the isoangular curve. Unsurprisingly, this estimate practically coincides with the exact result for small , e.g., , a range that includes, for example, most liquids at wavelengths far from their ultraviolet or infrared resonances, but excludes most forms of biological matter, even in the therapeutic optical window. The most interesting feature in Figure 2 is the turning point of the isoangular curve, which vividly demonstrates that the systematic error, introduced by use of Equation (1) with lossy media, does not increase monotonically with attenuation but decreases above the turning point, and even becomes zero when the isoangular curve crosses the transparency limit marked by the dashed vertical line. This behaviour, which now emerges as a natural consequence of the universal a-TIR condition, had been previously observed [13,20] and labeled as inexplicable by other authors [14].
3. Method’s Application with a Priori Known Extinction Coefficient
3.1. Main Concept
The sample’s extinction coefficient, , i.e., the sum of the absorption coefficient, , and the scattering coefficient, , can be a priori known via an independent experimental method such as absorption spectroscopy or collimated transmittance spectroscopy. This type of independent extinction coefficient measurement has been reported earlier for pure water [21], various emulsions [22], bioliquids [23], oils [24] and semiconductors [25]; typically, the relative error, , in the measurement of the extinction coefficient is of to [26,27,28,29,30].
The formalism, described in Section 2, can be used to calculate the real part of the refractive index (real index) from the value of the critical angle alone. The direct measurement of critical reflectance is no longer needed, since can be determined from the value of the extinction coefficient, which is related to the imaginary index [31]:
so that the following equation holds true ( is the light wavelength):
Solving Equation (10) for (the only unknown variable) is a simple task for iterative computing software such as Mathematica’s FindRoot or Mathcad’s Find. As long as the initial guess root is kept within its physically meaningful range, , the solution is always unique and unambiguous. Substituting the measured value of and the numerically retrieved value of in yields the real index of the lossy sample.
The procedure described has a straightforward graphical interpretation. Let us consider the measurement of a critical angle, for example, , so that one can refer to Figure 2. An a priori known value of the extinction coefficient (equivalently, ) defines a unique horizontal line that crosses the isoangular curve at a single point; locating its position is equivalent to numerically computing the value of . The abscissa of that point is the real index of the lossy medium.
3.2. Critical Reflectance Error
The formalism of Section 2 enables the calculation of from the values of and . The method, introduced in Section 3.1, retrieves the numerical value of from the extinction coefficient (when the extinction coefficient is already known) instead of its direct measurement. To better appreciate the advantage of the proposed method, one has to remember that the experimental error of a direct reflectance measurement is typically greater than . Breaking this threshold does not seem possible with standard unstabilized laser sources of moderate cost, such as those used in common refractometers.
Let us now show that the propagated error, , of the numerically retrieved can be kept below the threshold. To this end, one accounts for the fact that is numerically computed from input values of and , or equivalently, and , which are assumed to be independent variables, so that the covariance between them can be taken to be zero. Therefore, propagated error conveys corresponding experimental errors and :
Critical reflectance, , is not expressed explicitly as a function of and . Instead, Equation (10) can be restated in the implicit form: . Then, the derivatives in Equation (11) can be obtained using the implicit function theorem:
and
Moreover, one can introduce the relative error, , which is related to and :
Values of and its two partial derivatives that appear in Equation (15) can be easily computed for any pair . Therefore, error can be estimated as a function of the variables , and . Numerical investigation reveals that is practically independent of , at least when this parameter is kept within its reasonable range, 20 rad 100 rad. This observation reflects the easily verifiable fact that
which reduces Equation (15) to the approximate form:
and narrows down to a function of only three variables, namely, of and .
Figure 3 shows the results of calculations of versus for indicative values and : the solid line, produced via the exact Equation (15). In agreement with the approximate Equation (17), is not affected by and increases linearly with , which is taken within the range . One can observe that (or ) when (), indicating that critical reflectance error can be two (one) orders of magnitude smaller than the threshold, when is numerically retrieved from the a priori known extinction coefficient.
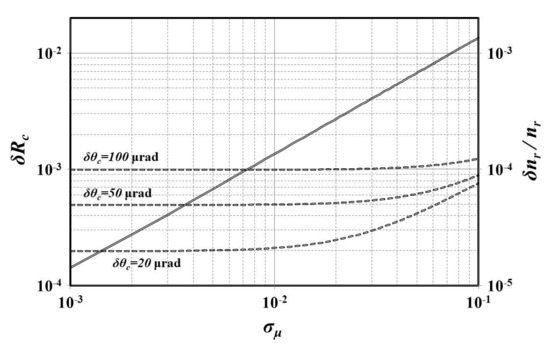
Figure 3.
Solid line: error in the numerical determination of the critical reflectance, , as a function of the exstinction coefficient relative error, . Calculations are based on Equation (15) for and . Dashed lines: relative error, , as a function of for the same pair of and values; varies from 100 via 50 to 20 rad, as indicated. Calculations result from substituting Equation (15) into Equation (4).
3.3. Real Index Error
The relative error, , can be computed as a function of the variables , and by substituting Equation (15) into Equation (4).
Figure 3 shows versus for and : the dashed lines correspond to and 20 rad, as indicated. The error lines become horizontal for small at a constant value (in this example, ). In the horizontal region, the relative real index error is practically equal to that of a transparent sample (cf. Equation (2)). This observation alone proves that refractometry with lossy media can be as precise as the refractometry with transparent ones, provided that the extinction coefficient is a priori known with sufficient accuracy. The horizontal regions terminate at a maximum permissible , above which continues to increase beyond the transparency limit. In the example considered, this transition occurs in the vicinity of when rad, at when rad, and at when rad.
Note that the upper and lower dashed lines in Figure 3 flatten out at (when rad) and (when rad). These levels match the specifications of modern refractometers operating with transparent samples, which typically prescribe an error between ∼ (standard precision) and ∼ (ultimate precision) [32].
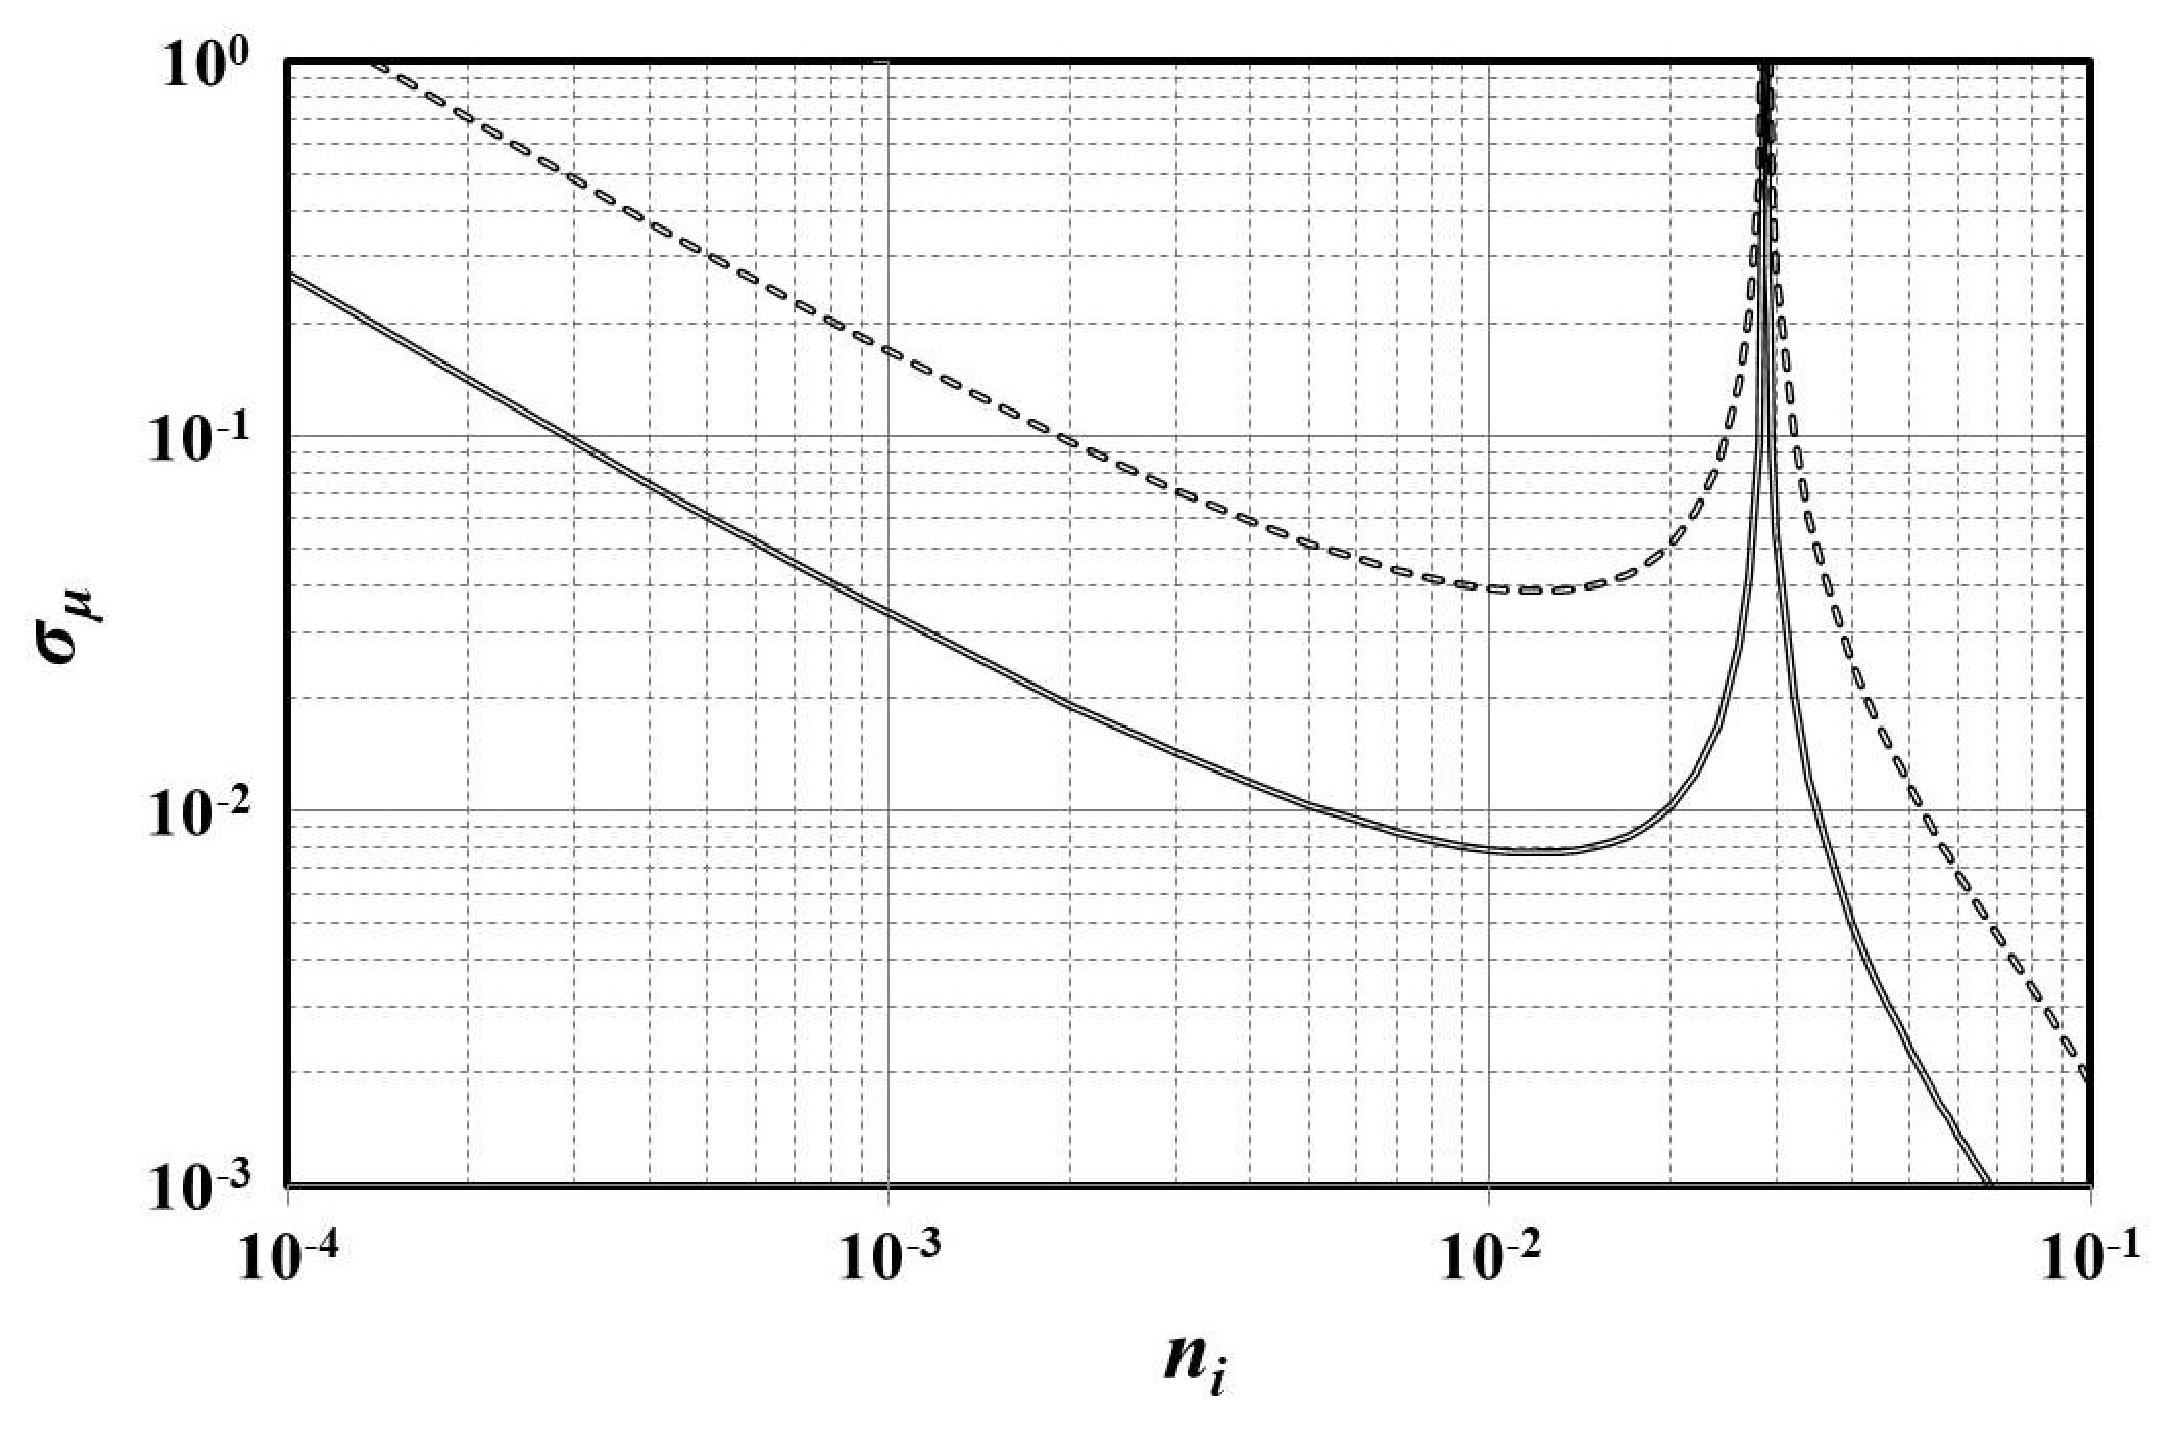
As a final exercise, let us consider the refractometric measurement of a lossy sample with by use of a reference front medium with , so that . With these assumptions, as given, it is straightforward to calculate the magnitude of that is required to reach (i) the ultimate precision , assuming that the refractometer measures critical angles with an ultrahigh accuracy rad, and (ii) a standard precision , with a more tolerant rad. The calculations are shown in Figure 4 by solid and dashed lines, respectively.

Figure 4.
Maximum permissible relative error, , as a function of for ultimate refractometric precision , when rad (solid line), and standard refractometric precision , when rad (dashed line). A sample with and a prism with are considered.
Therein, one observes a general trend: the maximum permissible decreases with increasing . This trend clearly indicates that the need for accurate measurements of the extinction coefficient is more acute when optical loss is growing. There is one exception to this, which manifests itself as a characteristic sharp peak at larger . This peak reflects the vertical slope of the isoangular curve at the turning point, see Figure 2. Quite naturally, is found increasing again at the transparent limit, where the slope of the isoangular curve is again nearly vertical. Likewise, decreases rapidly for larger after the peak because the slope of isoangular curve above there is zero
To better understand the interpretation made, let us point that a vertical slope in Figure 2 suggests that small enough change in the imaginary index causes zero shift to the real index. Similarly, a horizontal slope suggests that small change in the imaginary index causes a maximum shift in the real index. Hence, the real index error minimizes (and the maximum permissible maximizes) as soon as the slope turns vertical, and vice versa.
Meantime, the most important observation in Figure 4 is that the real index of the sample can be measured with an extreme precision, , as long as and (solid line). Note that although being strict, this situation is indeed realistic. For example, the extinction coefficient of water has been measured with a relative error even less than near its infrared absorption peak (at nm), where [21]; see discussion in Section 3.4 below. This is also possible with a much more lax for all . An adequate for many applications error is reached with for all (dashed line). These observations illustrate the functionality of the proposed method with all but the most extremely attenuating media.
3.4. Comments on Implementation Issues
The proposed method involves the tandem use of two instruments. The first determines the reflectance profile at the sample’s interface with a prism; prism coupling refractometers operate routinely in various laboratories and they are also commercially available; see, e.g. Metricons’s 2010/M model. The second measures the sample’s extinction coefficient. Collimated transmittance setups (typically, homemade) suit ideally this purpose; see, e.g., [21,26,27]. The corresponding operating principle is straightforward. The transmitted portion of a collimated light beam, travelling through sample sections of variable length, is monitored; the extinction coefficient is then deduced by fitting experimental results to the known Lambert-Beer law. This technique is commonly used for fluids where liquid cells of different sizes facilitate tuning of the path length. The technique is also applicable for solid samples, provided that slices of variable thickness can be cut.
This tandem measurement is actually known. In [21], the (real) refractive index and the extinction coefficient of several types of liquids, including water, were measured by the combined use of critical angle refractometetry and collimated transmittance spectroscopy. Unaware of the attenuated-TIR condition (Equation (3)) at that time, the standard TIR law of transparent media (Equation (1)) was exploited in [21] to determine the real index. Let us see, through a didactic example, how the method, proposed in this paper, adjusts those results.
Let us start by selecting the reported data for water at a wavelength nm, where the extinction coefficient, cm, was measured [21] translating via Equation (9) into the imaginary index, . The relative error in this measurement was as small as . Using an SF13 glass prism with , the real index was approximated by the standard TIR condition, leading to the value , which, given the index of the prism, corresponds to the critical angle .
Using the required input pair ( cm), the method, proposed in the current paper, yields, first, the critical reflectance and, then, the real index of water, corrected to a new value, . The correction from the previous estimate () is relatively modest, while non negligible for applications requiring high accuracy. The modest correction effect is expected (cf. Figure 2), since the imaginary index in our example just exceeds ; it would have been much stronger, had the sample been more attenuating.
Using Equation (15), the prescribed value, combined with an assumed error in the measurement of critical angle, 20 rad rad, leads to a propagated error in the numerical estimation of the critical reflectance within . Such an accuracy is surely orders of magnitude higher than the ∼ uncertainty with which critical reflectance can be directly measured. This finding manifests the main advantage of the method here described. Then, within the same range, this method yields the real index with an error of , the latter calculated as it is described in Section 3.3. It is worth noticing the compliance of this result with Figure 3.
4. Conclusions
In this paper, the universal attenuated total internal reflection (a-TIR) condition is exploited in order to accurately determine the real part of the refractive index (real index), nr, of lossy media from the critical incidence angle, , at s-polarisation given the extinction coefficient, . This is accomplished in a two-step procedure. First, the critical reflectance, , is numerically retrieved from the pair . Then, the real index is calculated from and .
Numerical investigation reveals that can be recovered (in the first step) more accurately than it can be directly measured. As a consequence the determination of the real index (in the second step) becomes more precise. The relative error, , can be reduced down to when the respective error in the independent measurement of is in the range of to .
The results, obtained here, demonstrate that refractometry of lossy media can be as precise as with transparent media, a development that is of interest to various applications in biomedical optics, material characterisation, analytical chemistry and quality control.
Author Contributions
Conceptualization, K.M.; methodology, S.K., K.M.; validation, P.G., S.K.; investigation, S.K., K.M.; writing—original draft preparation, S.K., P.G.; writing—review and editing, K.M. All authors have read and agreed to the published version of the manuscript.
Funding
This research received no external funding.
Data Availability Statement
Data supporting this article are available from the corresponding author upon reasonable request.
Conflicts of Interest
The authors declare no conflict of interest.
References
- Castrejón-Pita, J.R.; Morales, A.; Castrejón-García, R. Critical angle laser refractometer. Rev. Sci. Instrum. 2006, 77, 035101. [Google Scholar] [CrossRef]
- Moutzouris, K.; Hloupis, G.; Stavrakas, I.; Triantis, D.; Chou, M.H. Temperature-dependent visible to near-infrared optical properties of 8 mol% Mg-doped lithium tantalate. Opt. Mater. Express 2011, 1, 458. [Google Scholar] [CrossRef]
- Moutzouris, K.; Stavrakas, I.; Triantis, D.; Enculescu, M. Temperature-dependent refractive index of potassium acid phthalate (KAP) in the visible and near-infrared. Opt. Mater. 2011, 33, 812–816. [Google Scholar] [CrossRef]
- Moutzouris, K.; Papamichael, M.; Betsis, S.C.; Stavrakas, I.; Hloupis, G.; Triantis, D. Refractive, dispersive and thermo-optic properties of twelve organic solvents in the visible and near-infrared. Appl. Phys. B 2013, 116, 617–622. [Google Scholar] [CrossRef]
- Dongare, M.; Buchade, P.; Shaligram, A. Refractive index based optical Brix measurement technique with equilateral angle prism for sugar and Allied Industries. Optik 2015, 126, 2383–2385. [Google Scholar] [CrossRef]
- Chiappe, C.; Margari, P.; Mezzetta, A.; Pomelli, C.S.; Koutsoumpos, S.; Papamichael, M.; Giannios, P.; Moutzouris, K. Temperature effects on the viscosity and the wavelength-dependent refractive index of imidazolium-based ionic liquids with a phosphorus-containing anion. Phys. Chem. Chem. Phys. 2017, 19, 8201–8209. [Google Scholar] [CrossRef] [PubMed]
- Chen, J.Y.; Xie, Z.H.; Li, W.N.; Lin, S.B.; Zhang, L.L.; Liu, C.X. Construction and investigation of a planar waveguide in photo-thermal-refractive glass by proton implantation. Optik 2020, 207, 164461. [Google Scholar] [CrossRef]
- Revathi, V.; Rajendran, V. Investigation about nonlinear optics and antibacterial activity of pyrrolidine-2-carboxylic acid cadmium chloride hydrate single crystal. Optik 2018, 154, 234–241. [Google Scholar] [CrossRef]
- Liu, C.X.; Shen, X.L.; Guo, H.T.; Li, W.N.; Wei, W. Proton-implanted optical waveguides fabricated in Er3+-doped phosphate glasses. Optik 2017, 131, 132–137. [Google Scholar] [CrossRef]
- Koutsoumpos, S.; Giannios, P.; Moutzouris, K. Extended derivative method of critical-angle refractometry for attenuating media: Error analysis. Meas. Sci. Technol. 2021, 32, 105007. [Google Scholar] [CrossRef]
- Zeng, H.; Wang, J.; Ye, Q.; Deng, Z.; Mei, J.; Zhou, W.; Zhang, C.; Tian, J. Study on the refractive index matching effect of ultrasound on optical clearing of bio-tissues based on the derivative total reflection method. Biomed. Opt. Express 2014, 5, 3482. [Google Scholar] [CrossRef] [Green Version]
- Sun, T.Q.; Ye, Q.; Wang, X.W.; Wang, J.; Deng, Z.C.; Mei, J.C.; Zhou, W.Y.; Zhang, C.P.; Tian, J.G. Scanning focused refractive-index microscopy. Sci. Rep. 2014, 4, 5647. [Google Scholar] [CrossRef] [Green Version]
- Meeten, G.H.; North, A.N.; Willmouth, F.M. Errors in critical-angle measurement of refractive index of optically absorbing materials. J. Phys. E Sci. Instrum. 1984, 17, 642–643. [Google Scholar] [CrossRef]
- Goyal, K.G.; Dong, M.L.; Kane, D.G.; Makkar, S.S.; Worth, B.W.; Bali, L.M.; Bali, S. Note: Refractive index sensing of turbid media by differentiation of the reflectance profile: Does error-correction work? Rev. Sci. Instrum. 2012, 83, 086107. [Google Scholar] [CrossRef] [Green Version]
- Morales-Luna, G.; García-Valenzuela, A. Viability and fundamental limits of critical-angle refractometry of turbid colloids. Meas. Sci. Technol. 2017, 28, 125203. [Google Scholar] [CrossRef] [Green Version]
- Giannios, P.; Toutouzas, K.G.; Matiatou, M.; Stasinos, K.; Konstadoulakis, M.M.; Zografos, G.C.; Moutzouris, K. Visible to near-infrared refractive properties of freshly-excised human-liver tissues: Marking hepatic malignancies. Sci. Rep. 2016, 6, 27910. [Google Scholar] [CrossRef] [Green Version]
- Giannios, P.; Koutsoumpos, S.; Toutouzas, K.G.; Matiatou, M.; Zografos, G.C.; Moutzouris, K. Complex refractive index of normal and malignant human colorectal tissue in the visible and near-infrared. J. Biophotonics 2016, 10, 303–310. [Google Scholar] [CrossRef] [PubMed]
- Räty, J.; Pääkkönen, P.; Peiponen, K.E. Assessment of wavelength dependent complex refractive index of strongly light absorbing liquids. Opt. Express 2012, 20, 2835. [Google Scholar] [CrossRef] [PubMed]
- Koutsoumpos, S.; Giannios, P.; Stavrakas, I.; Moutzouris, K. The derivative method of critical-angle refractometry for attenuating media. J. Opt. 2020, 22, 075601. [Google Scholar] [CrossRef]
- Meeten, G.H. Refractive index errors in the critical-angle and the Brewster-angle methods applied to absorbing and heterogeneous materials. Meas. Sci. Technol. 1997, 8, 728–733. [Google Scholar] [CrossRef]
- Kedenburg, S.; Vieweg, M.; Gissibl, T.; Giessen, H. Linear refractive index and absorption measurements of nonlinear optical liquids in the visible and near-infrared spectral region. Opt. Mater. Express 2012, 2, 1588. [Google Scholar] [CrossRef]
- Ninni, P.D.; Martelli, F.; Zaccanti, G. Intralipid: Towards a diffusive reference standard for optical tissue phantoms. Phys. Med. Biol. 2010, 56, N21–N28. [Google Scholar] [CrossRef] [PubMed]
- Zhao, Y.; Qiu, L.; Sun, Y.; Huang, C.; Li, T. Optimal hemoglobin extinction coefficient data set for near-infrared spectroscopy. Biomed. Opt. Express 2017, 8, 5151. [Google Scholar] [CrossRef] [PubMed] [Green Version]
- Zhao, D.; Zhang, G.; Zhang, X.; Li, D. Optical properties of paraffin at temperature range from 40 to 80 ∘C. Optik 2018, 157, 184–189. [Google Scholar] [CrossRef] [Green Version]
- Forouhi, A.R.; Bloomer, I. Optical properties of crystalline semiconductors and dielectrics. Phys. Rev. B 1988, 38, 1865–1874. [Google Scholar] [CrossRef]
- Li, X.; Zhao, J.M.; Wang, C.C.; Liu, L.H. Improved transmission method for measuring the optical extinction coefficient of micro/nano particle suspensions. Appl. Opt. 2016, 55, 8171. [Google Scholar] [CrossRef] [Green Version]
- Ninni, P.D.; Martelli, F.; Zaccanti, G. Effect of dependent scattering on the optical properties of Intralipid tissue phantoms. Biomed. Opt. Express 2011, 2, 2265. [Google Scholar] [CrossRef] [Green Version]
- Feder, I.; Duadi, H.; Fixler, D. Single wavelength measurements of absorption coefficients based on iso-pathlength point. Biomed. Opt. Express 2020, 11, 5760. [Google Scholar] [CrossRef]
- Marchesini, R.; Bertoni, A.; Andreola, S.; Melloni, E.; Sichirollo, A.E. Extinction and absorption coefficients and scattering phase functions of human tissues in vitro. Appl. Opt. 1989, 28, 2318. [Google Scholar] [CrossRef] [PubMed]
- Ogusu, K.; Suzuki, K.; Nishio, H. Simple and accurate measurement of the absorption coefficient of an absorbing plate by use of the Brewster angle. Opt. Lett. 2006, 31, 909. [Google Scholar] [CrossRef]
- Wu, S.; Lian, J.; Song, P.; Gao, S.; Wang, X.; Ma, Z.; Wang, Y.; Guan, W. Optical properties of Sr3NbGa3Si2O14 crystal. Opt. Int. J. Light Electron Opt. 2013, 124, 686–688. [Google Scholar] [CrossRef]
- Zhou, W.; Zhou, Y.; Albert, J. A true fiber optic refractometer. Laser Photonics Rev. 2017, 11, 1600157. [Google Scholar] [CrossRef]


Publisher’s Note: MDPI stays neutral with regard to jurisdictional claims in published maps and institutional affiliations. |
© 2021 by the authors. Licensee MDPI, Basel, Switzerland. This article is an open access article distributed under the terms and conditions of the Creative Commons Attribution (CC BY) license (https://creativecommons.org/licenses/by/4.0/).