Article

Cyber Threat Profiles in Thailand: An Empirical Typology for Policy Prioritisation

by
Jevon Dixon
1,
Charupol Ruangsuwan
1 and
Issara Sereewatthanawut
1,2,*
1
King Prajadhipok’s Institute, 120 Chaeng Wattana Road, Thung Song Hong, Lak Si, Bangkok 10210, Thailand
2
Faculty of Engineering, Bangkokthonburi University, 16/10 Moo 2 Liapkhlong Thawiwatthana Rd. Khwaeng Thawi Watthana, Khet Thawi Watthana, Bangkok 10170, Thailand
*
Author to whom correspondence should be addressed.
J. Cybersecur. Priv. 2026, 6(4), 124; https://doi.org/10.3390/jcp6040124
Submission received: 12 May 2026 / Revised: 16 June 2026 / Accepted: 17 June 2026 / Published: 16 July 2026
(This article belongs to the Section Security Engineering & Applications)

Abstract

Cyberattacks have become a routine feature of contemporary security environments, yet policy responses often treat cyber threats as undifferentiated, encouraging generic remedies while obscuring the distinct capabilities needed to address different forms of attack. This article develops an empirical exploratory typology of cyber threats affecting Thailand. Drawing on incident-level data, it uses multiple correspondence analysis and hierarchical clustering to classify attacks by actor type, motive, target industry, event type, event subtype, and attributed actor country. The findings reveal three distinct threat profiles: financial cybercrime, characterised by criminal actors and financial motives; hacktivist disruption, defined by protest motives, disruptive operations, and attacks on public administration; and nation-state political espionage, associated with state-linked actors, China-attributed activity, and exploitation of end hosts. The article argues that distinguishing among these threat profiles provides a more useful basis for threat prioritisation, capability development, and resource allocation than treating cyber insecurity as a single risk category.

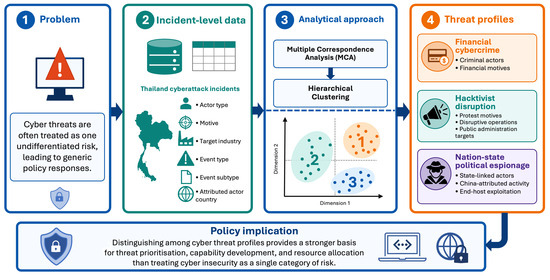
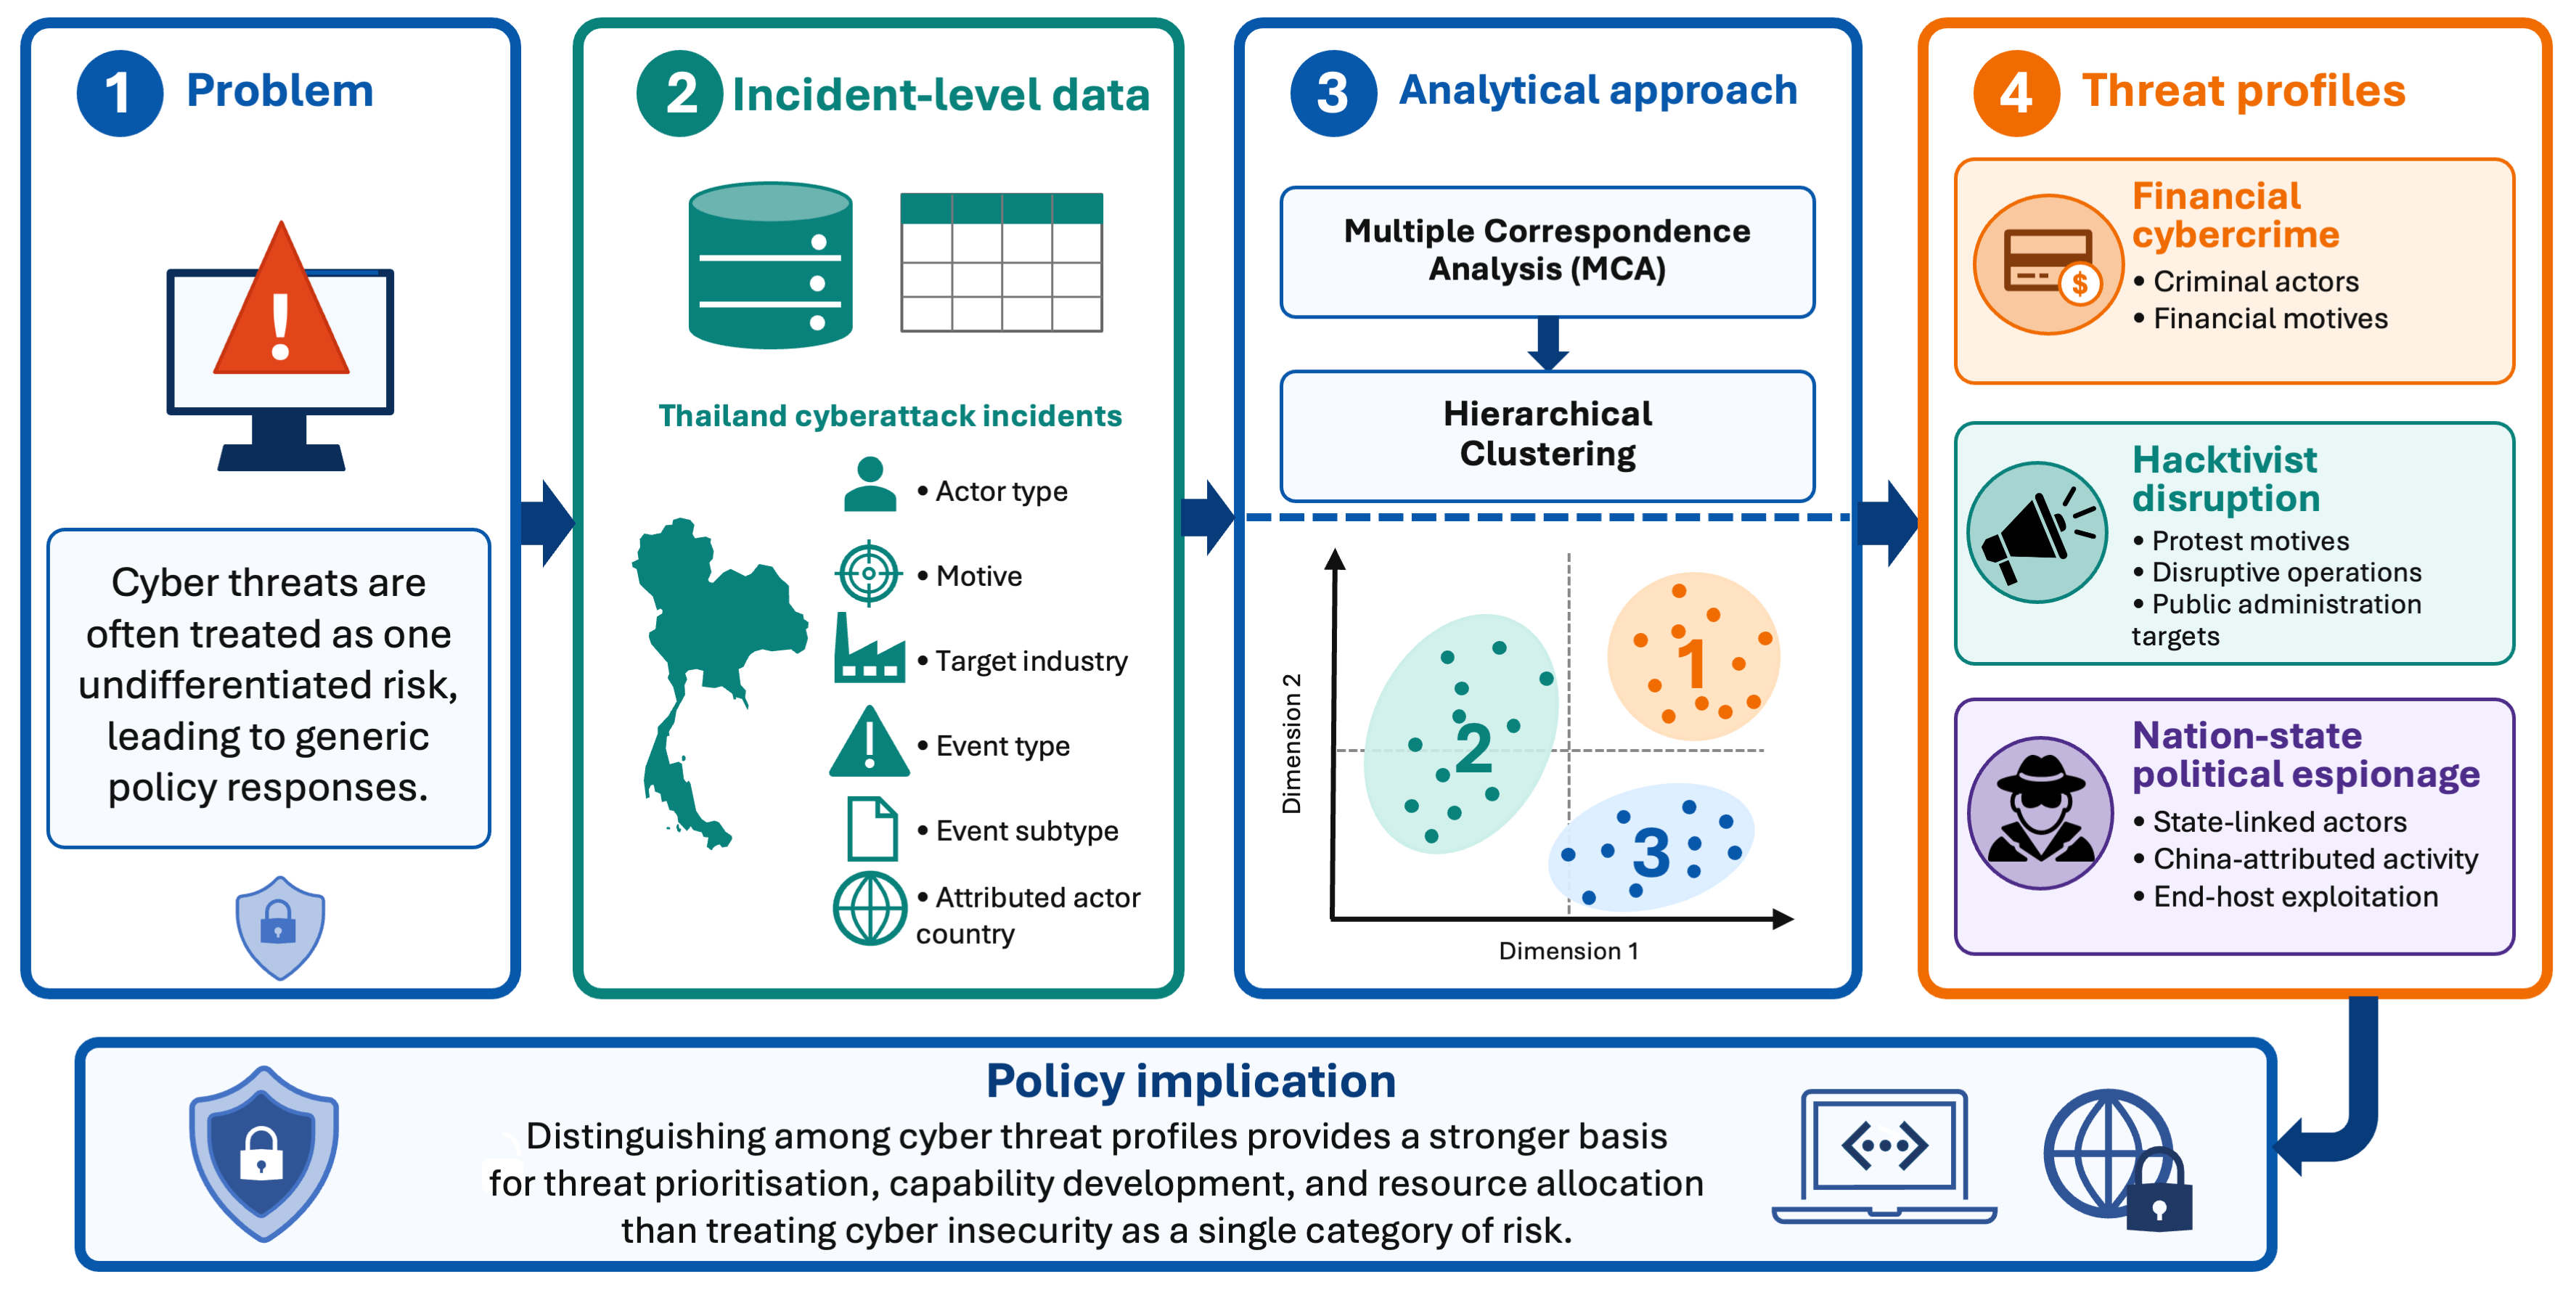
Graphical Abstract

1. Introduction

Cyberattacks have become a routine feature of contemporary security environments, affecting governments, critical infrastructure, and private enterprise alike. As states increasingly depend on digital systems for economic activity, public administration, and national defence, the consequences of inadequate cyber preparedness extend well beyond individual incidents. For developing and middle-income countries, this challenge is compounded by resource constraints, workforce gaps, and uneven institutional capacity.
Thailand reflects this broader pattern. The country has built a visible national governance architecture and established key legal instruments for cybersecurity, yet research consistently points to weak operational capacity and insufficient readiness across critical sectors [1]. Its growing dependence on digital financial services, maritime infrastructure, and public-sector connectivity has expanded its exposure, while regional cooperation mechanisms within the Association of Southeast Asian Nations (ASEAN) remain fragmented and lack binding cyber-specific frameworks [2,3,4,5].
Many cybersecurity policy frameworks rely on broad, cross-sector risk-management categories [6,7], yet the actual incident landscape consists of heterogeneous threats that differ by actor, target, attack vector, technical pathway, and organisational context [8]. A criminal ransomware campaign targeting a bank, a hacktivist defacement of a government website, and a state-sponsored intrusion into defence networks are fundamentally different problems that require different responses. Treating them as one inflates some capability investments while neglecting others. Although cyber threats and cyber-incident classifications have been examined in the wider literature [8,9,10,11], there remains a regional empirical gap concerning how cyber incidents affecting Southeast Asia, and Thailand in particular, can be systematically classified by actor type, actor country, motive, sector, and event form, and how such classifications may inform differentiated policy responses.
Routine activity theory (RAT) offers a useful analytical framework. RAT holds that a crime occurs when a motivated offender, a suitable target, and the absence of a capable guardian converge [12]. Applied to cybersecurity, this framework shifts the focus from individual incidents to the structural conditions that enable them and, importantly, points toward differentiated guardianship responses depending on which offender–target configuration is at play.
This study applies RAT empirically. Using incident-level data from the University of Maryland’s Cyber Events Database covering the period 2014–2025, we use multiple correspondence analysis (MCA) followed by hierarchical clustering to group cyber incidents affecting Thailand by actor type, motive, target industry, and event type and subtype. This research focuses on cyber incidents in Thailand; therefore, we filter for attacks that target Thai-based computer systems. Year is included as a supplementary variable to assess whether attack profiles align with a particular year. The aim is not to catalogue attacks but to produce an empirically grounded typology that can directly inform differentiated training priorities, force design, and resource allocation for Thai policymakers and defence planners. It therefore presents a structured classification that makes heterogeneous incidents comparable, enabling the detection, explanation, and action on incident patterns.
For this research, the definition of a cyber event or cyber-attack is based on how the observations in the dataset are defined. In this case, a cyber event or cyber-attack for this research is defined as “a single or cumulative unauthorised effort using computer technology and networks to achieve a discernible effect on a target” [13,14,15].
The paper proceeds as follows. The literature review situates the study within several related debates: cyber threats as non-traditional security threats, global cybercrime patterns and attribution challenges, typologies of cybercriminal organisations, structural correlates of cyber aggression, Thailand’s cyber posture and sectoral vulnerabilities, and the theoretical foundations of routine activity theory (RAT). The materials and methods section describes the dataset, variables, and analytical procedure. The results section presents the clustering solution and its defining characteristics. The discussion and conclusion section interprets each cluster through RAT, draws out implications for Thailand’s cyber governance and the military’s role, addresses methodological contributions and limitations and offers concluding remarks.

2. Literature Review

2.1. Cyberattacks as Non-Traditional Security Threats and the Analytical Problem of Variation

Cyberattacks are now routinely framed as non-traditional security threats, but policy responses often remain generic: improve cybersecurity, train personnel, and strengthen cooperation. The analytical problem is that cyber incidents are not a single phenomenon. They vary by actor configurations, motives, sectoral targeting, and event forms, and these differences matter for doctrine, force design, and training. A government that treats cyber risk as an undifferentiated category tends to over-invest in some capabilities (often technical tooling) while under-invest in others (organisation, human capital pipelines, civil–military coordination, and sector-specific readiness).
Cyberattacks normally have two main motives: economic gain or political motives [16,17]. However, the incident landscape that becomes visible to researchers and policymakers is shaped by disclosure practices. Some organisations may not disclose cyberattacks because doing so can harm their reputation [18], thereby biasing what becomes visible and, consequently, what policy can learn from these attacks. At the same time, cyber threats are becoming increasingly serious as organisations struggle to find qualified personnel to protect their systems, while technological solutions remain insufficient as threats continue to evolve [4,5,19]. This contributes to a persistent gap between the importance organisations place on cybersecurity and their actual cybersecurity practices [20]. Although cybersecurity expectations are highly important to business leaders, formal cybersecurity strategies and cyber awareness remain approximately 45 percentage points lower among business leaders [20]. This lack of investment has practical implications, as it takes an average of 23 days to resolve a ransomware attack [19].

2.2. Global Patterns, Cybercrime Hubs, and the Attribution Problem

The World Cybercrime Index (WCI), compiled from expert opinions in cybersecurity, ranked the top 5 countries for cybercrime as Russia, Ukraine, China, the US, and Nigeria [21]. The study indicates that cyberattacks from certain countries are specialised in specific forms of cybercrimes [21]. Russia, Ukraine, China, and North Korea tend to engage in more technical cybercrime, while Nigeria tends to engage in less technical cybercrime and focus more on scams [21]. Research also shows that countries in Southeast Asia are disproportionately targeted by maritime cyberattacks emanating from China [22].
A related issue is the attribution problem in cyberspace, where identifying and locating individuals is difficult; when individuals cannot be identified or located, enforcement becomes weak [23,24]. The dematerialised nature of cyberspace makes attribution difficult [24,25]. This attribution problem results in weak cyber deterrence and favours cyber offence rather than cyber defence [25]. The preference for cyber defence is further complicated by weak international norms and weak geographical constraints [24]. Attribution aims to reduce uncertainty, and unsuccessful attribution reduces state security [25]. However, attribution remains technical and labour-intensive, requiring a well-versed, expert team to successfully identify attackers [25]. Low-priority cyberattacks are sometimes ignored and not thoroughly investigated [25]. Attribution not only relates to determining the aggressor but also includes determining how the attack was carried out, what was affected, and why it was carried out [25]. Nevertheless, the main aim is to identify the organisation or responsible government [25].

2.3. Typologies of Cybercriminal Organisations and Interaction Patterns

Choo [10] identifies three types of organised cybercrime groups: traditional organised crime groups that leverage ICT to enhance their land-based criminal activities, groups that operate solely online, and ideologically or politically motivated groups that use ICT to support their endeavours. Leukfeldt et al. [11] highlight four types of organised cybercriminal networks based on the degree of interaction and level of technology. The low-tech, high-victim-attacker interaction uses phishing emails and websites, as well as telephone interaction [11]. Low-tech, low-interaction tactics use phishing emails and website-only approaches, with the attacker using the information to request a new SIM for the victim and use it to obtain access codes [11]. High tech low interaction: intrusion by malware and gains access to the victim’s computer [11]. High tech with no interaction: where there is infection via malware, but there is no action performed by the attacker [11]. Research also points to clustering techniques to develop data-driven taxonomies to find patterns in cyberthreats [9]. While not a clustering technique, research by Bruce et al. [21] helps to divide countries into technical and non-technical cybercrime hubs.

2.4. Structural and Political–Economic Correlates of Cybercrime and Cyber Aggression

Cybercrime is also driven by socioeconomic conditions and mirrors broader socioeconomic and political contexts [16,19,22,26,27]. Countries with higher GDP per capita and advanced ICT are more likely to experience attacks, while countries of origin of attacks often have high corruption and large internet bandwidth [28,29]. Cybercrime sources are more concentrated in North America, Central and Eastern Europe, East Asia, India, and eastern Australia [26]. In contrast, lower concentrations are seen across much of Africa (excluding South Africa), western and northern South America, Central America, certain Middle Eastern areas, southern Central Asia, and parts of Southeast Asia [26].
Research indicates that state power constitutes the most significant factor in initiating cyberattacks [30]. Higher state power, greater economic wealth, and lower levels of democracy generally increase the likelihood of state-sponsored cyberattacks [30]. In other words, cyber aggressors tend to possess greater military and economic power and to be less democratic [30].

2.5. Thailand’s Cyber Posture, Military Roles, and Sectoral Vulnerabilities and ASEAN’s Role

Specifically for Thailand, research indicates that the country lacks national-level cyber readiness to prevent and defend against cyber threats and that it needs to develop cyber capabilities across all dimensions [1]. Thailand reflects average strength in formal institutions and statutory frameworks, but substantially weaker in operationalised cyber power functions [1]. This suggests that Thailand’s cybersecurity posture is best understood as institutionally formalised yet operationally uneven [1]. Although Thailand has built a visible national governance architecture and established key legal instruments that signal consolidation of authority and coordination at the formal level, its cyber capability remains weak [1].
Research also indicates that it is necessary to implement a cyberattack counteraggression unit to monitor, analyse, and predict trends in cyber threats [1]. It also recommends creating Thai social media applications to reduce reliance on foreign applications [1]. The Thai army plays a role in cybersecurity by analysing cyber threats and evaluating its own cybersecurity preparedness [1]. It develops security policies to protect against cyber threats and suggests improvements to cyber laws and regulations to enhance Thailand’s cyber defence [1].
The National Security Policy and Plan B.E. 2566–2570 (2023–2027), Security Policy and Plan No. 10, specifically addresses Thailand’s defence against cyberattacks [31]. While other sections of the policy outlined concrete plans for terrorism, illegal migration, drug trafficking, etc., the section on cybersecurity did not outline any concrete plans to mitigate or counter cyber threats [31]. Mongkolnchaiarunya [32] argues that the Thai defence strategy of cyber retaliation is unnecessary, as it is not threatened by any state actor for whom this strategy would be effective. Mongkolnchaiarunya [32] also highlights hacktivists as a major source of cyberattacks in Thailand. Cybersecurity knowledge also supports cybersecurity awareness, as both influence behavioural choices in mobile banking in Thailand [33].
In Thailand, 1 in 4 SMEs lack basic cybersecurity protection [4]. They rely solely on basic antivirus software, lack a cybersecurity response plan, and provide no cybersecurity training for employees [4]. As Thailand is also dependent on the maritime economy, it has adopted maritime technologies, thereby increasing cybersecurity vulnerabilities in its port infrastructure [4]. Thailand moves more and more to a cashless society, thus also making it more vulnerable to financial phishing risks [4].
Even though there is cyber cooperation within the Association of Southeast Asian Nations (ASEAN), it lacks a formal organisation-level principle or cooperation agreement to reduce cyber risks [2,3]. While ASEAN has formal cooperation frameworks to address non-traditional issues such as drug trafficking, terrorism, and human trafficking, it lacks a unified framework to reduce cyber risks [3,5]. Technological disparities among Southeast Asian states limit cybersecurity consensus in ASEAN, as technological readiness and maturity are uneven [3,34].

2.6. Routine Activity Theory (RAT) and Clustering as an Applied Bridge to Policy Design

Routine activity theory (RAT) offers a useful framework for understanding the conditions under which crime occurs. RAT posits that three conditions are necessary for a crime to occur: a motivated offender, a suitable target, and the absence of a capable guardian [12]. A motivated offender is an individual or group willing and intent on committing a crime, such as cybercriminals. Suitable targets are those that are vulnerable or easily accessible, meaning victims of cyberattacks. The absence of a capable guardian suggests inadequate protective measures, like cybersecurity defences. Situational crime prevention highlights what can be done in each dimension to reduce the likelihood of crime: for the motivated offender, reduce the number of offenders; for suitable targets, harden potential targets; and, in the absence of capable guardians, increase the capability or number of guardians [35]. Some critics question RAT’s applicability to cybercrime for various reasons, including the view that RAT posits a convergence of all three conditions for crime in space and time, which is lacking in cyberspace [36,37]. But we argue that in cyberspace these conditions are met. The temporal element is present; once an object is online, it becomes visible in cyberspace once it is found. The spatial element is also present, as cyberspace is a virtual space. Now the question remains whether the RAT elements can converge in time and space. A motivated offender, in this case a hacker, searches for a suitable target, in this case an online system, and, in the absence of a capable guardian (weak cyber protections), a crime occurs. The time condition is met because the act occurs when all elements are online and in a virtual environment. While the conditions may not act in exactly the same manner as in the physical space, the conditions are present, and the occurrence of cybercrime indicates that the conditions are met according to RAT.
This theoretical approach is crucial for evaluating cybercrime, as it highlights that the absence of capable guardians may stem from inadequate training, limited technology, and understaffing, thereby increasing cyber vulnerabilities. The assumption underpinning this study is that a cyberattack does not directly demonstrate a specific guardianship deficit (since guardianship is not measured in this study), but rather suggests plausible guardianship needs that may require enhancement. This interpretation is consistent with routine activity theory, which argues that crime occurs when motivated offenders, suitable targets, and the absence or insufficiency of capable guardianship converge [12,38]. Therefore, it is theoretically reasonable to treat cyber incidents as indicating possible weaknesses in guardianship conditions, while recognising that guardianship remains difficult to operationalise in cyber settings and may produce mixed or null empirical results [36,39]. Therefore, cluster analysis is used to identify distinct cyber-incident profiles that reflect variation in motivated offenders and suitable targets. These profiles are then interpreted through RAT to develop preparedness hypotheses about where capable guardianship may need to be strengthened. Enhancing capable guardians decreases the likelihood of cyber threats. For example, research indicates that providing training and knowledge about information and communication technology reduces losses from cybercrime [19].
Therefore, the problématique is whether empirical clustering of cyber incidents (by actor type, motive, targeted sector, and event type, event subtype) yields clusters that can directly inform differentiated strategies for government officials.
In our work, creating an exploratory typology of cyberattacks serves as a bridge between past incidents and future mitigation design. Clusters become useful when they can be interpreted as distinct attack environments that demand different readiness profiles (skills, doctrine, coordination, and sector-specific operational protocols). Clustering will be able to provide an exploratory overview of the cyberthreat landscape in Thailand.
This work proposes that, based on the RAT dimensions and the available data in this dataset, distinct cyberthreats affecting Thailand can be grouped into clusters, and policy guidelines tailored to each cluster can be developed. The aim of economics is to be as efficient as possible with finite resources. This research can direct tailored resources to areas where the empirical research points based on the specific characteristics of those clusters. This can avoid resource waste and tailored policy implementation.

3. Materials and Methods

3.1. Data

The data on cyberattacks used for this research were obtained from the University of Maryland’s Cyber Events Database [14]. This well-established dataset tracks cyberattacks from 2014 to the present and is built through a mixed-methods pipeline that combines automated collection (web/dark-web scraping and GDELT news retrieval) with systematic human vetting, deduplication, and case-level coding. Events are included only when they can be traced to an underlying source and are classified using a structured taxonomy for cyber events, actor attributes, motives, targets, and effects [14]. Additionally, each observation reflects one attacker and one target. Together, these robust procedures provide transparent provenance and consistent measurement, making the dataset appropriate for analysing patterns in reported cyber events. Table 1 lists the variables used in this research.
The variables and their labels in this dataset make it ideal for interpretability for policy and organisational defence. The actor type, motive, affected industry, and event type/subtype make it legible to decision-makers and map directly to distinct prevention strategies (e.g., staff training for social engineering vs. segmentation/backups for ransomware). For example, ENISA’s threat landscape approach similarly emphasises recurring threat and actor categories, and explicitly reports sector-targeting patterns as part of strategic situational awareness [40,41]. However, the report lacks robust overlap among these categories, which is somewhat expected given that it is not an academic article.
Actor-side variables (actor type, actor country, motive) are likely to form a strong organising dimension because they capture both intent and a proxy for capability/resources, helping to distinguish where attacks are attributed to originate and the attack profiles associated with different actor configurations. Furthermore, because the variables capture both behavioural features of attacks (e.g., event type/subtype, motive) and contextual features (e.g., target industry, actor attributes, year of attack), the resulting clusters are readily interpretable and can be labelled as distinct attack profiles. The initial dataset contains 16,382 observations, but after filtering for attacks affecting Thailand, 78 observations remain.

3.2. Analytical Framework

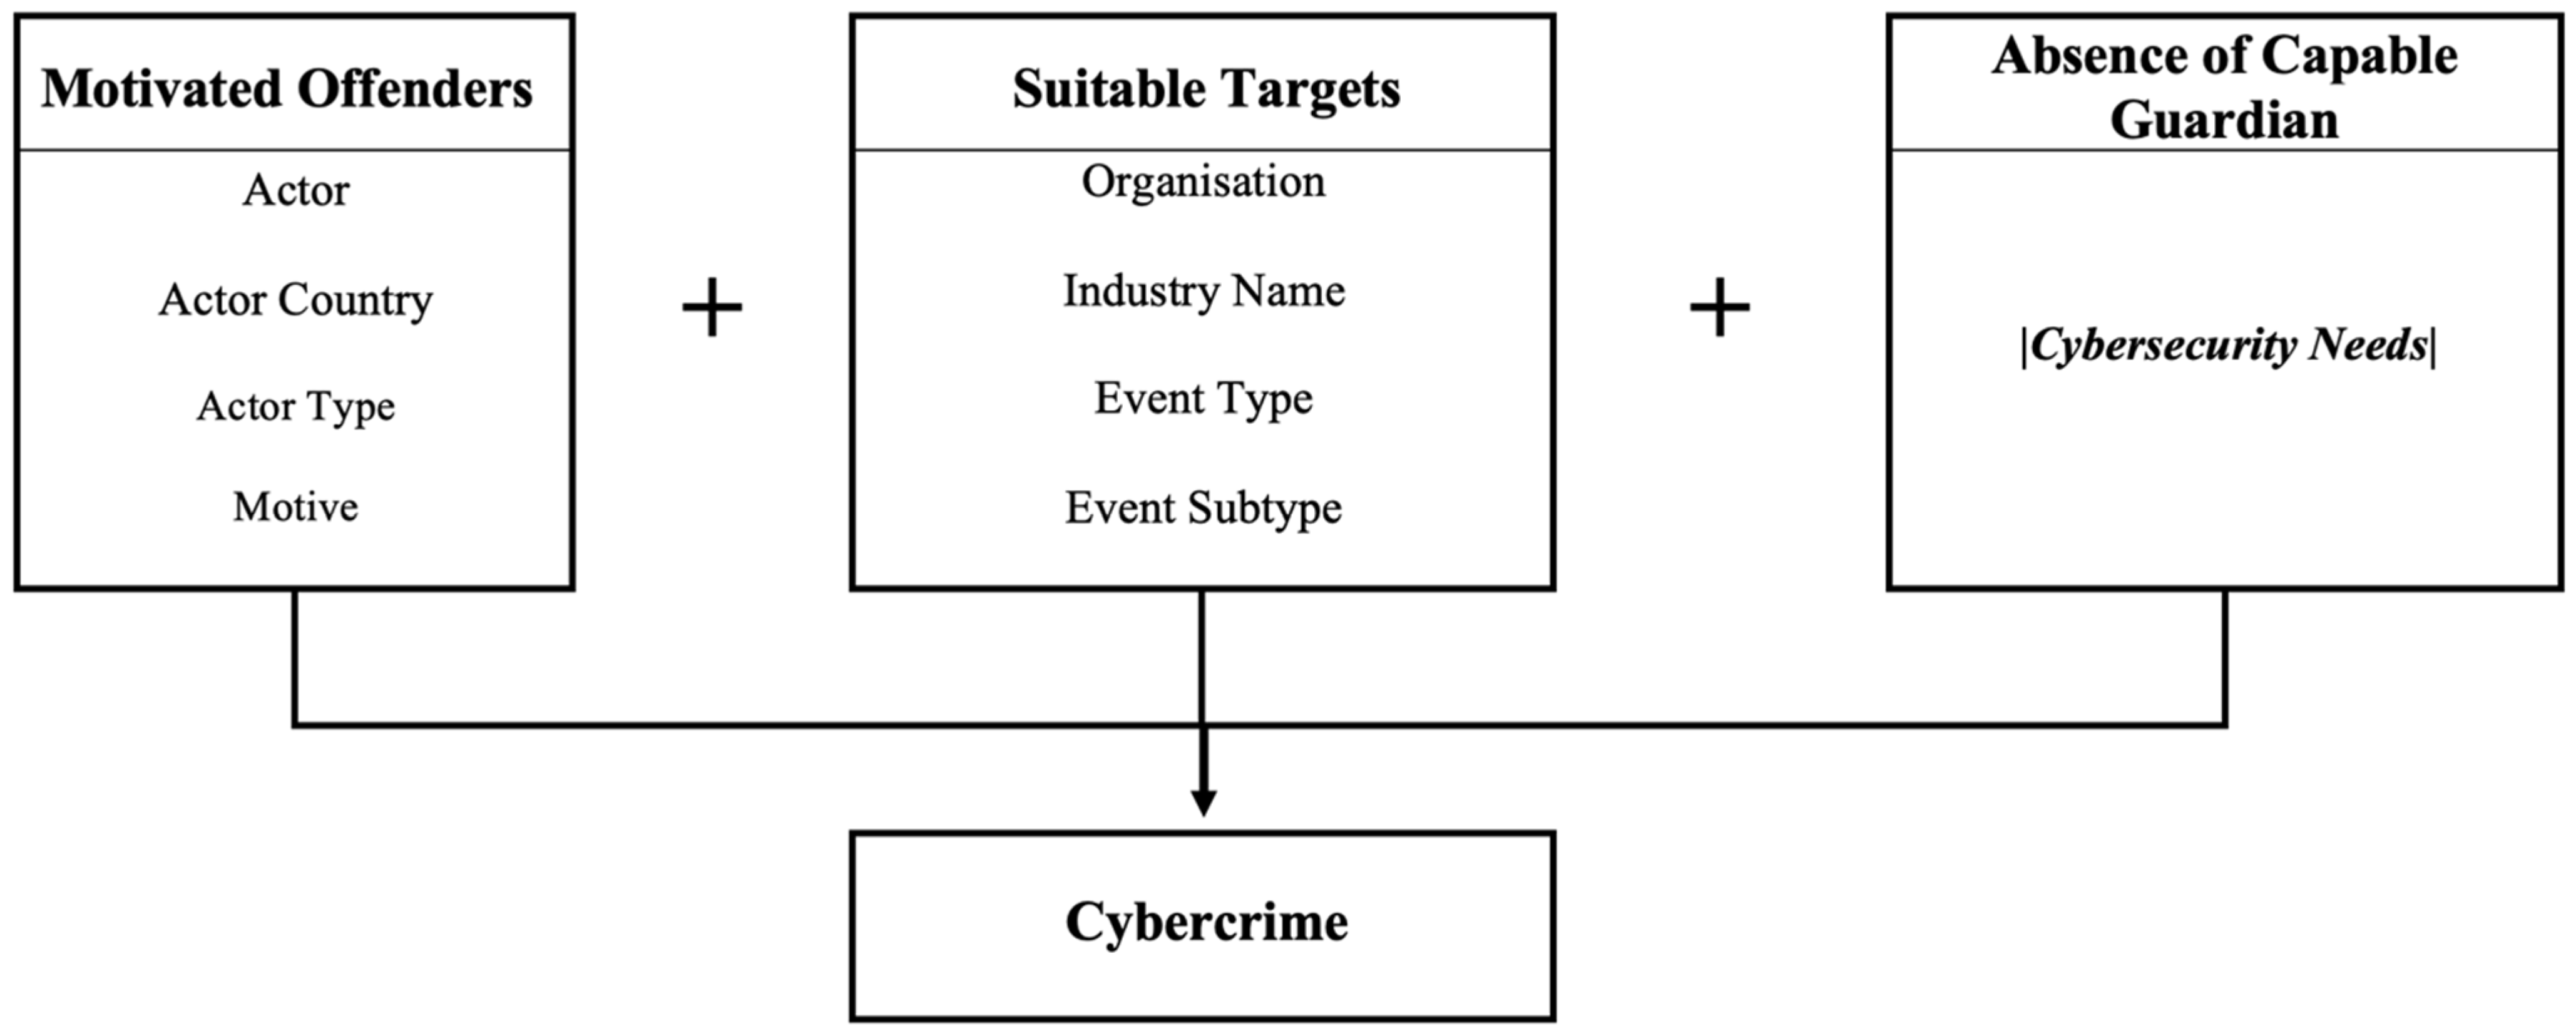
For the analysis, variables were mapped onto the Routine Activity Theory (RAT). Motivated offenders were operationalised using variables describing the initiating actor (actor, actor type, actor country) and the actor’s motive (goal/intent). Suitable targets were captured through variables describing the target (organisation, industry) and the event type/subtype, which are treated as proxies for the type of harm realised and the segment of the target’s IT infrastructure most exposed or compromised. Year was not classified as a RAT component but included as a temporal contextual variable. Capable guardianship is not directly observed in the dataset; accordingly, the clustering results are used to infer preparedness needs by identifying which cybersecurity measures would be most appropriate for each empirical attack cluster. Figure 1 visualises the operationalisation of the variables.

3.3. Clustering Analysis

In the social sciences, clustering analysis has been used to identify patterns and group similar observations by socio-economic and political variables. Cluster analysis is a statistical method for classifying observations into meaningful groups [42]. The primary objective of clustering analysis is to group observations according to their degree of similarity [42]. Prior research in the social sciences successfully used clustering analysis to group observations, such as reflecting economic wealth, regime type, and degree of conflict [43]; typologies of democracies [44]; sustainable development transport policies [45]; and healthcare access inequality and level of digitisation [46]. As clustering analysis becomes increasingly used in the social sciences to categorise observations based on common traits, this method can also be applied to examine patterns of cyber threats. For example, in the maritime sector, hierarchical clustering analysis was used to identify which countries are disproportionately targeted by threat sources [22].
To identify empirically grounded typologies of cyber incidents affecting Thailand, this study applies agglomerative hierarchical clustering using FactoMineR’s HCPC procedure on the active incident attributes (actor type, actor country, motive, industry, and event type/subtypes), while treating the temporal variable (year) as a supplementary descriptor used only for post hoc interpretation. More details about the variables used and their number of levels can be found in Table A1 in Appendix A. Because the variables are categorical, the analysis first uses Multiple Correspondence Analysis (MCA) which first converts each factor level into binary indicator (0/1) variables [47], so distances between incidents can be computed and projects incidents into a low-dimensional factor space based on shared category profiles; hierarchical clustering (using Euclidean distance with Ward’s method) is then performed on the resulting factor coordinates to group incidents by similarity. The number of clusters is selected using HCPC’s inertia-gain criterion, retaining the cut that yields a pronounced improvement in explained within-cluster inertia while preserving interpretability [48,49]. Clusters are characterised using HCPC’s v-tests to identify categories that are significantly over- or under-represented relative to the full sample, enabling each cluster to be labelled as a distinct incident profile. Finally, the supplementary year variable is examined across profiles to assess whether specific clusters systematically cluster in a particular year, thereby assessing temporal trends. Overall, this methodology can provide results that can inform training priorities, organisational readiness, and capability development.

4. Results

4.1. Main Findings

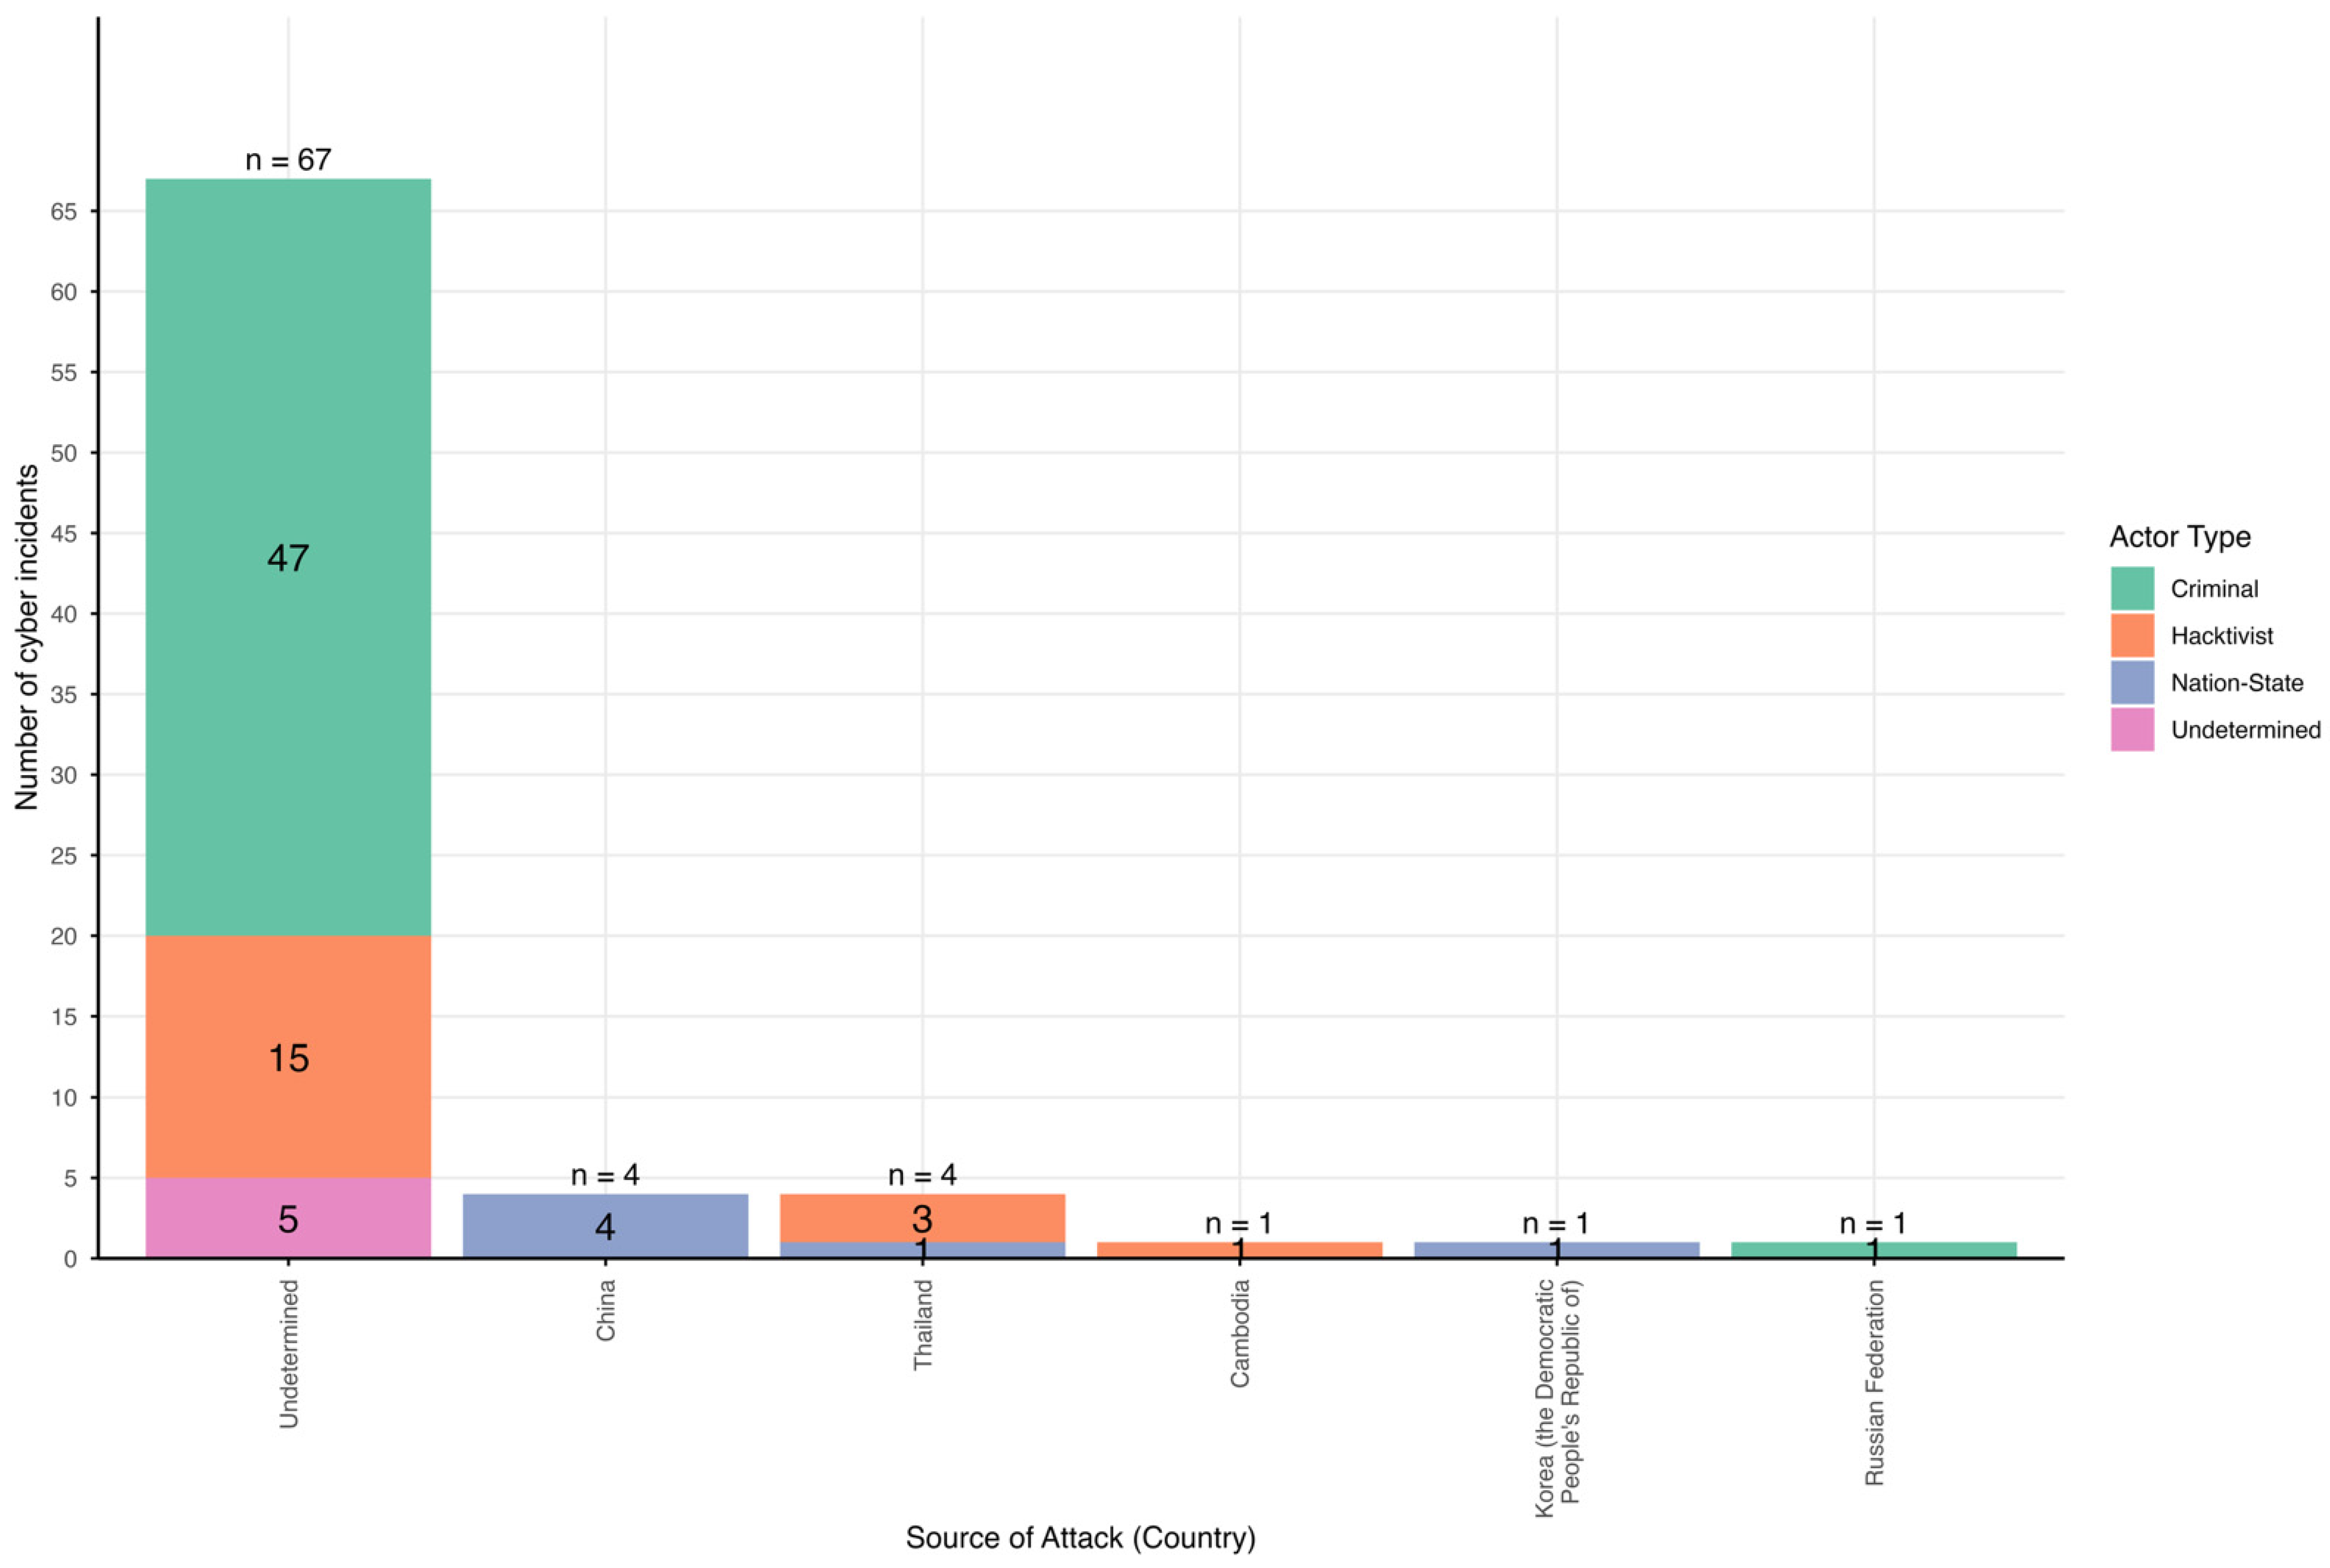
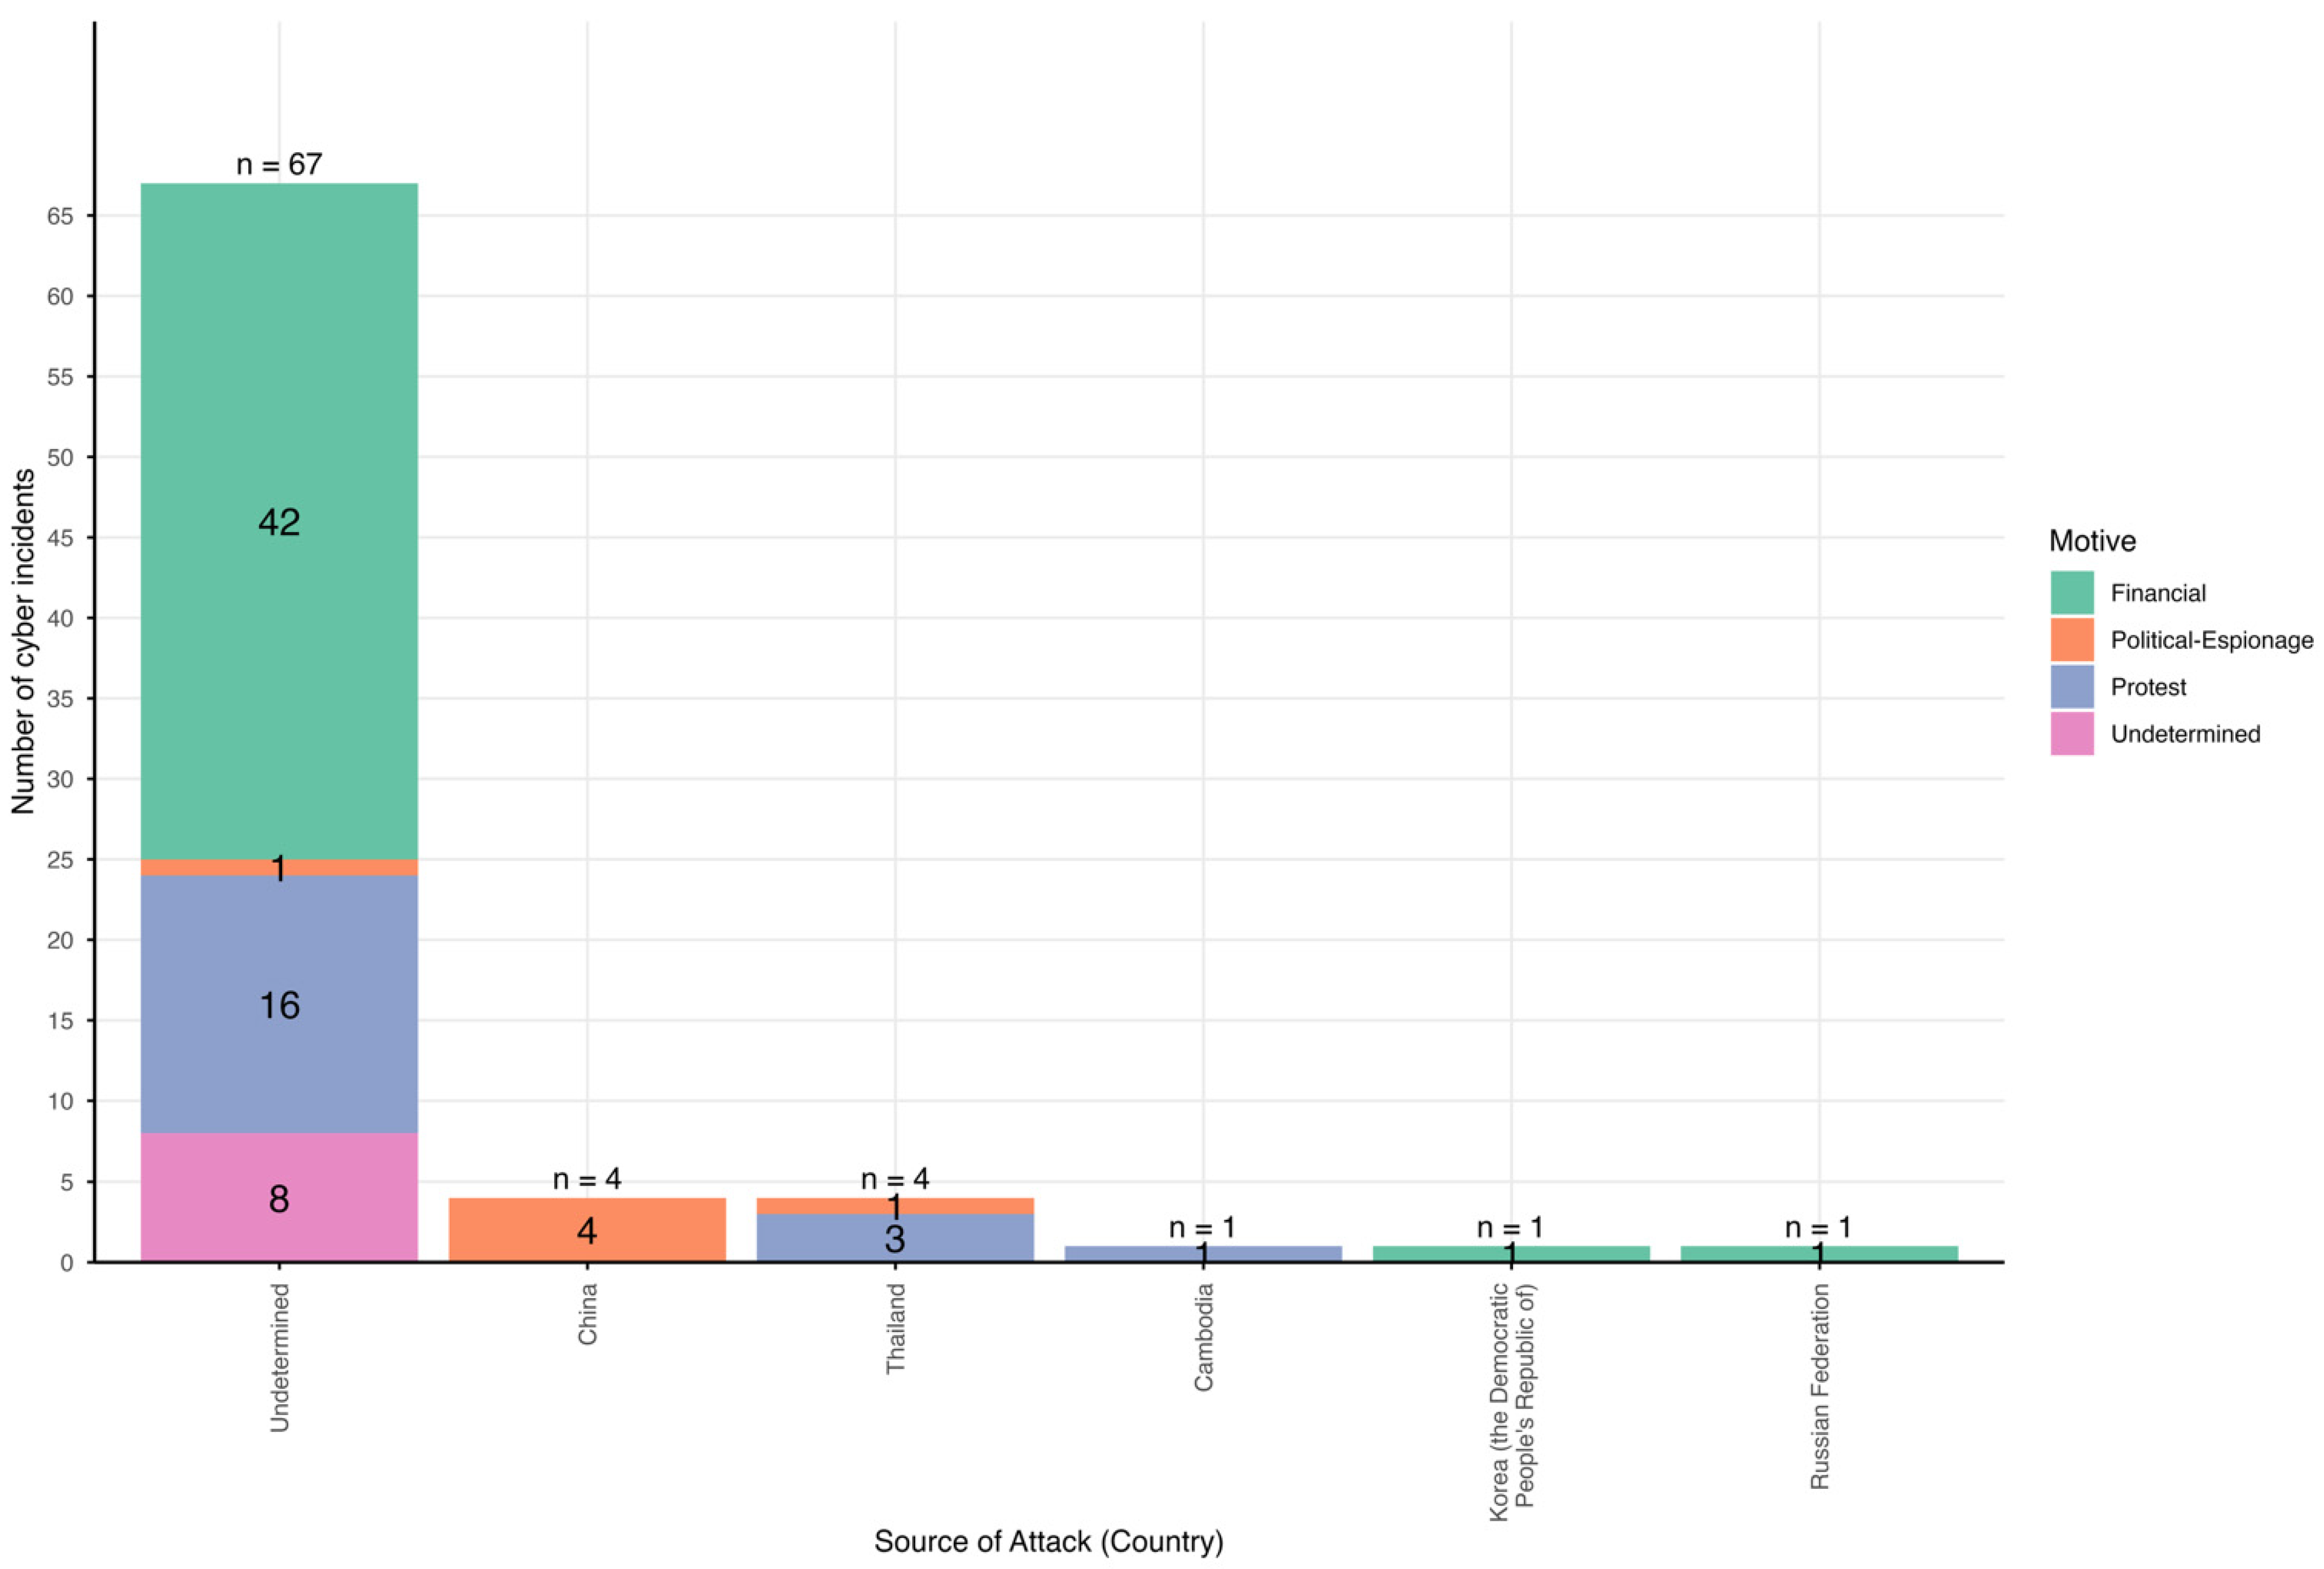
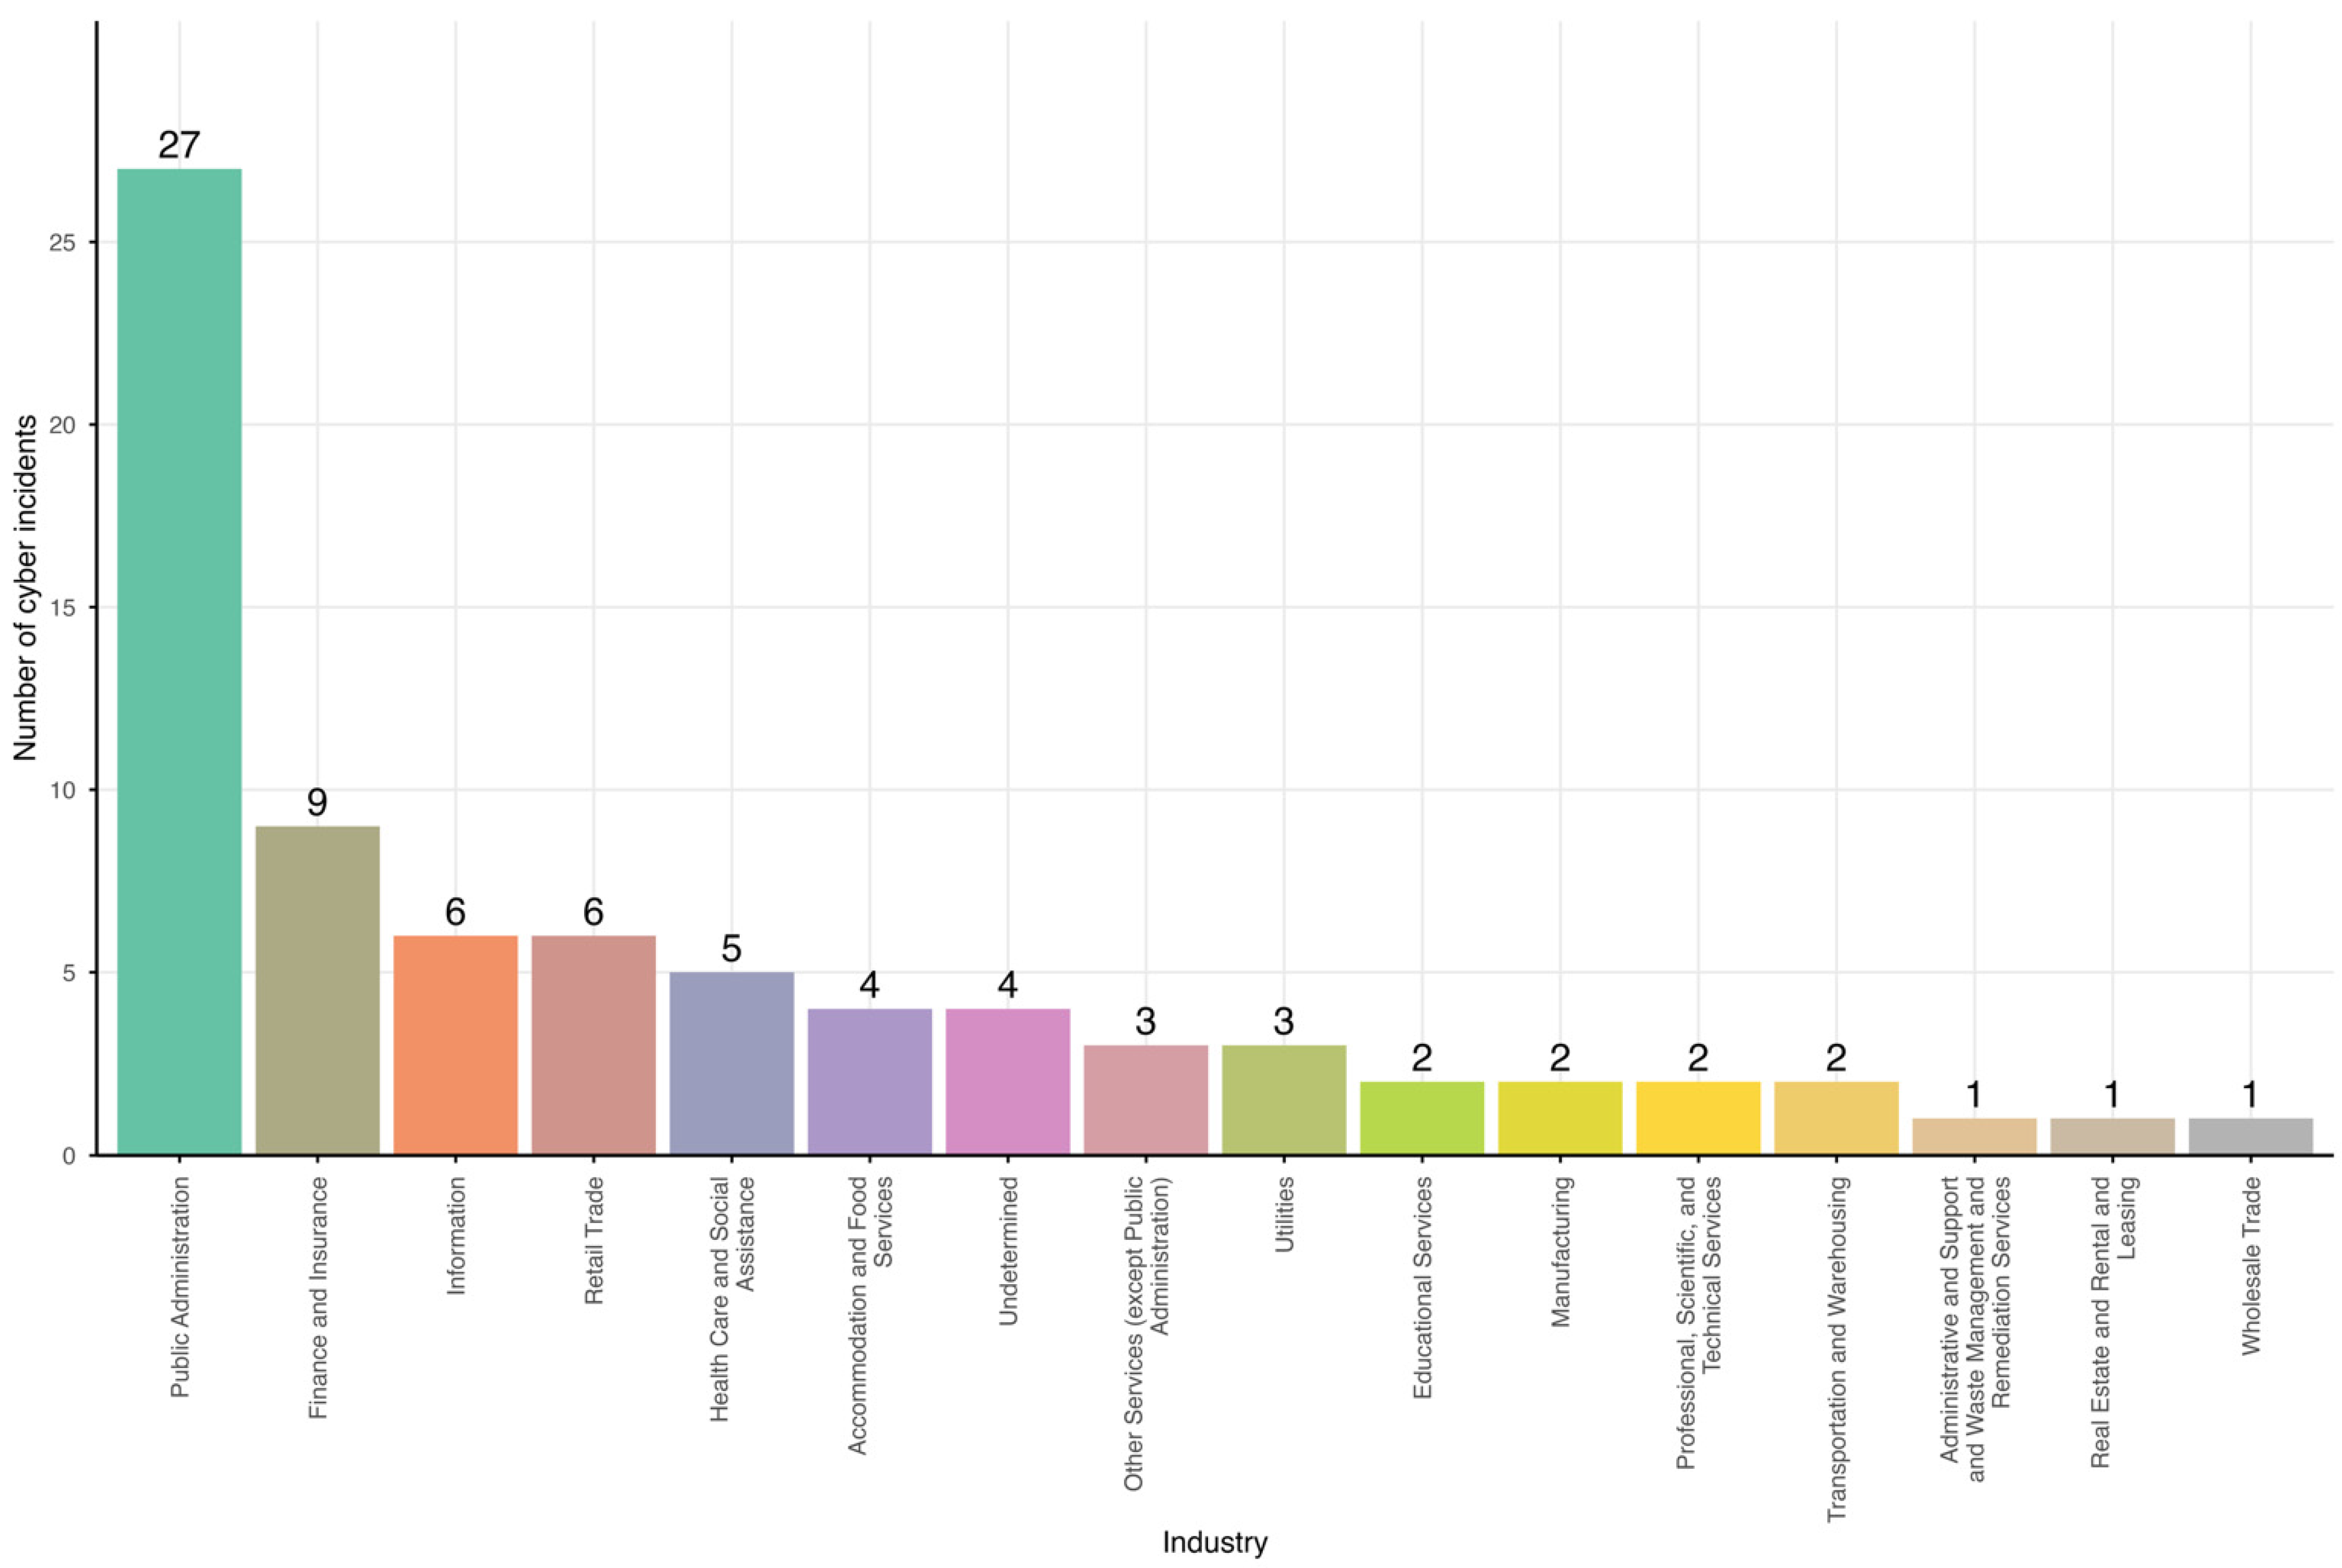
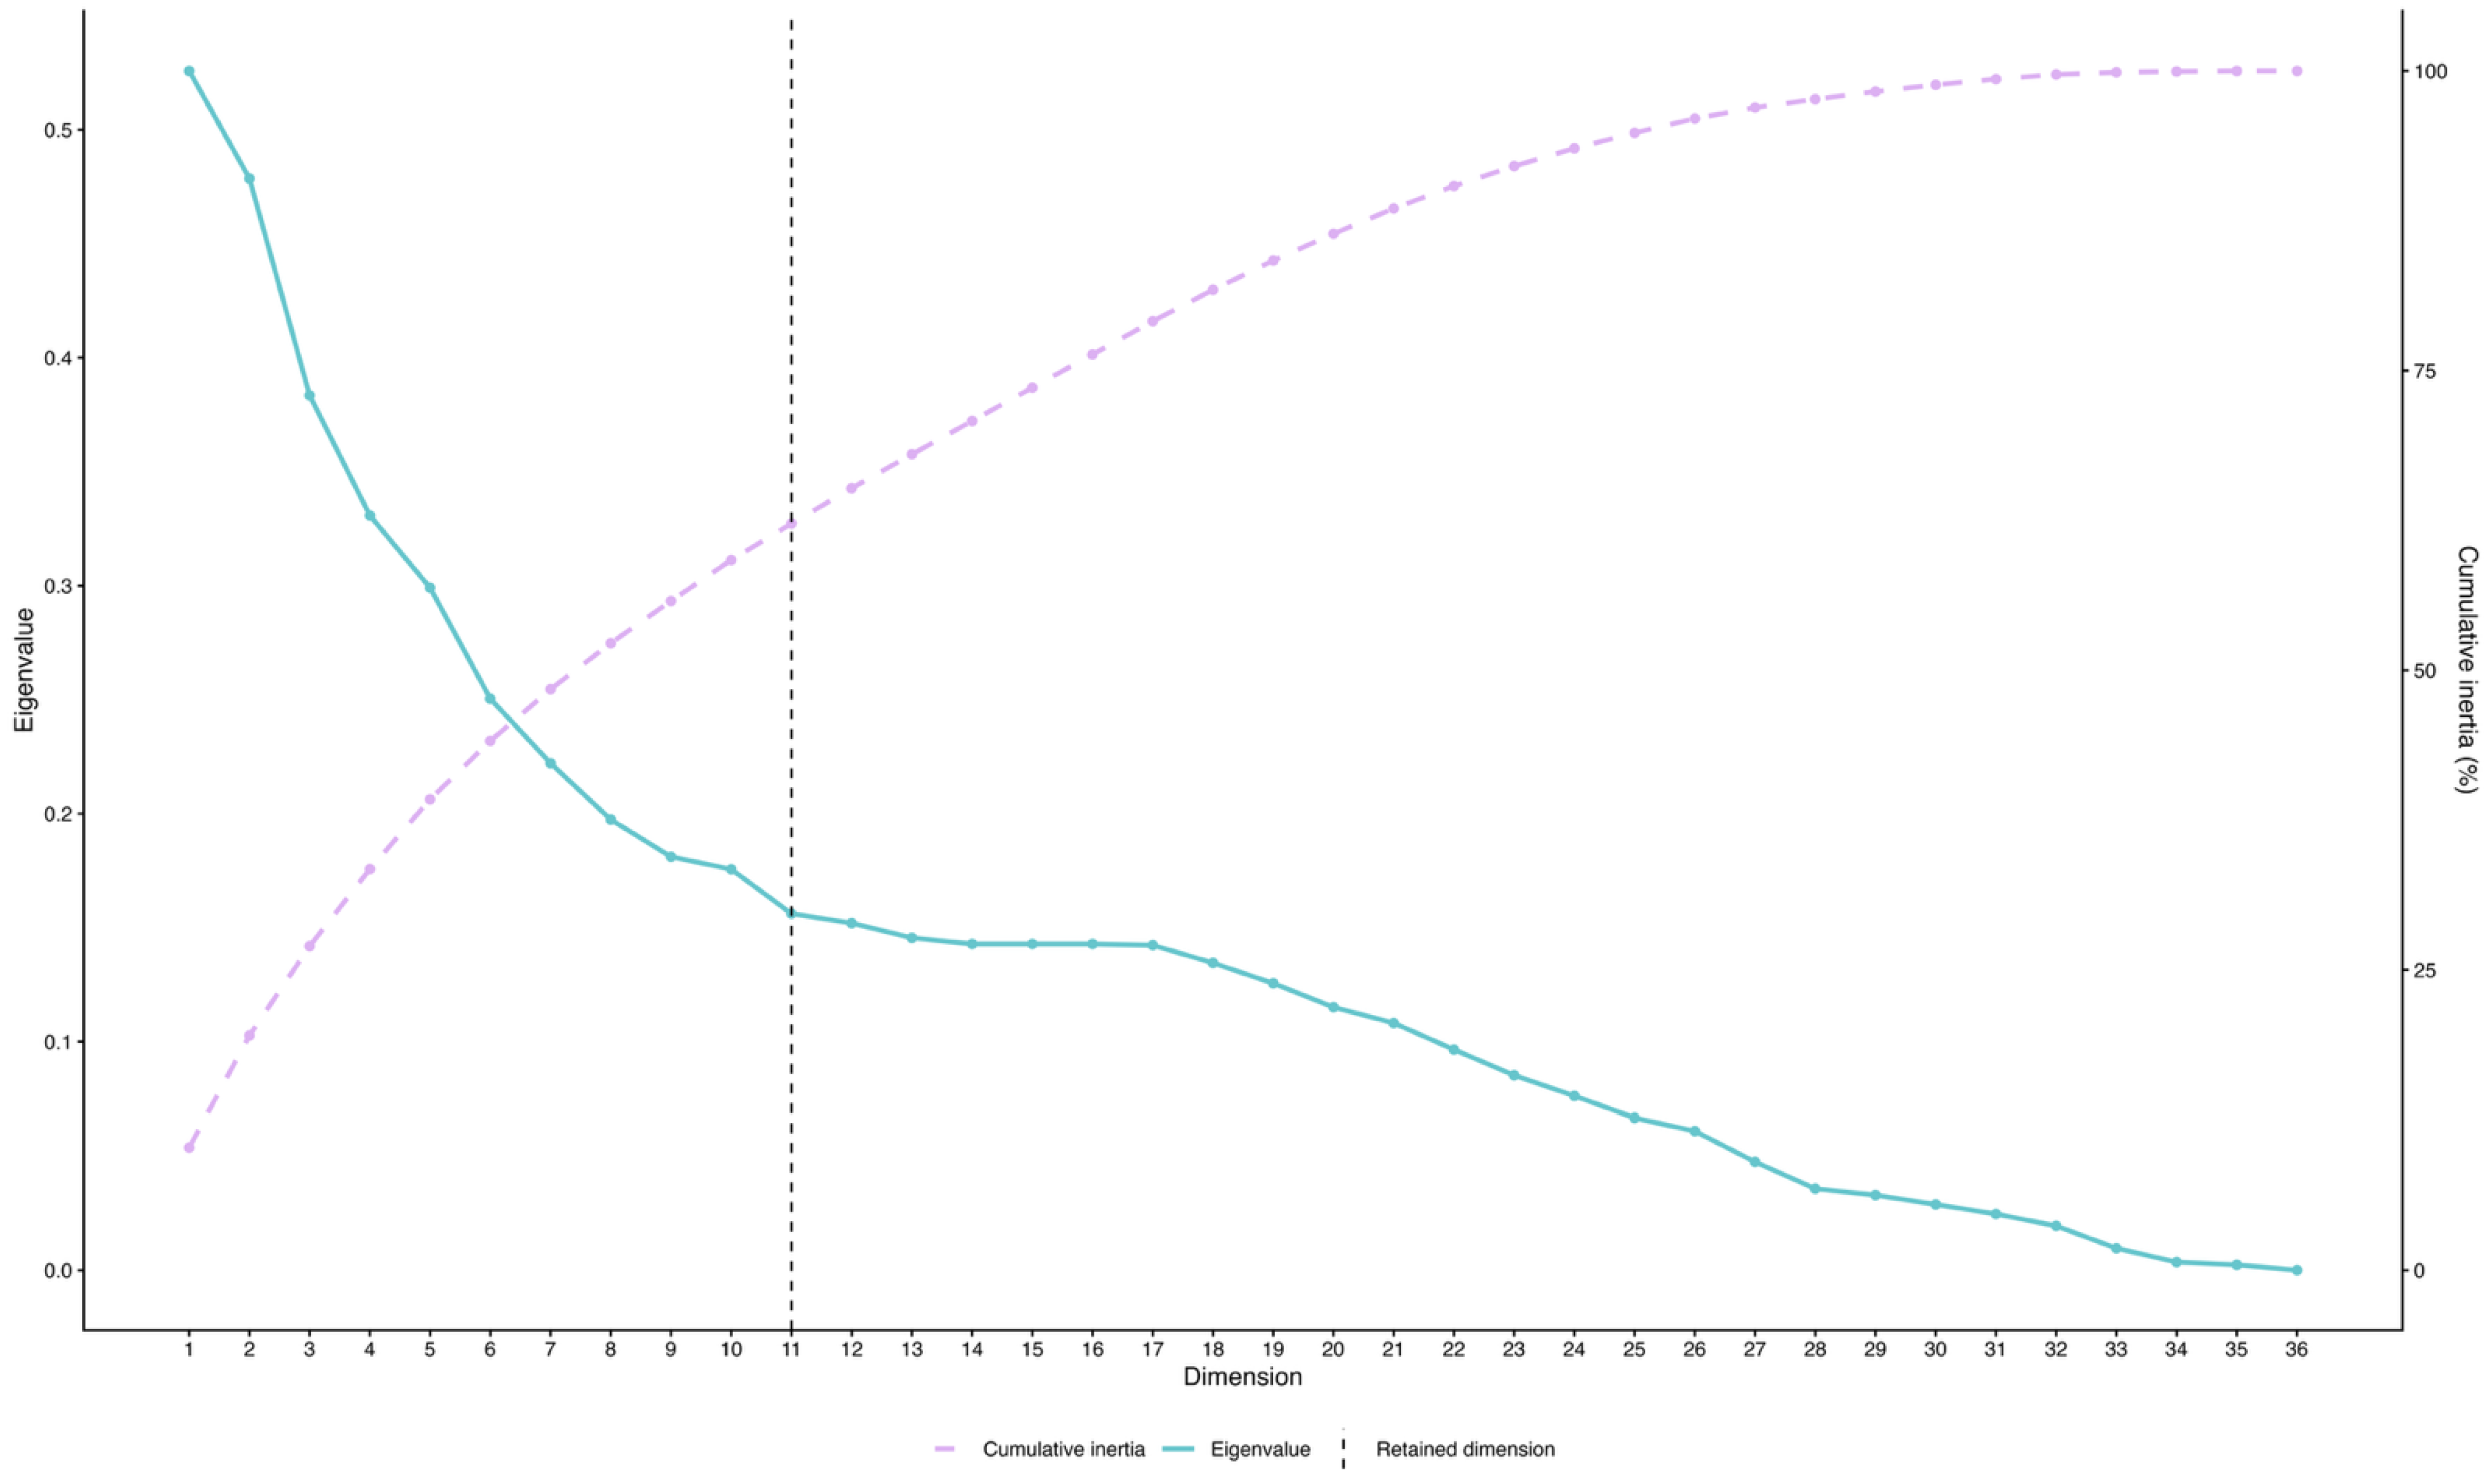
Figure 2, Figure 3 and Figure 4 present a descriptive visualisation of cyber events in Thailand. Figure 2 and Figure 3 reveal that most attacks originate from an undetermined source and are diverse in actor types and motives. Undetermined means that the actor responsible for the attack could not be successfully identified, reflecting the attribution problem in cyberspace. However, this remains relevant for the research, as it helps determine the characteristics of attacks whose actors are normally unidentified. For clustering analysis, diagnostic tests reveal the retention of 11 dimensions, as appropriate for analysis. Figure A1 and Figure A2 in Appendix A explain this justification. Figure 4 shows that the majority of attacks target the public administration, finance and insurance, and information sectors.
In Table 2, chi-square tests of association using Monte Carlo simulation (B = 100,000) indicate that cluster membership is most strongly associated with actor type and motive, both of which show very large effect sizes (adjusted Cramer’s V = 0.92). Actor country, event subtype 1, year, and industry also show substantial associations with cluster membership, while event type shows a smaller but statistically significant association. However, all tests should be interpreted cautiously because each contingency table contains small expected cell counts, with minimum expected counts below 1. Furthermore, adjusted Cramer’s effect sizes must be treated as descriptive effect sizes and not as causal evidence. The Supplementary Materials provide the observed and expected counts for each cluster. Full statistical results are provided in the Supplementary Materials.
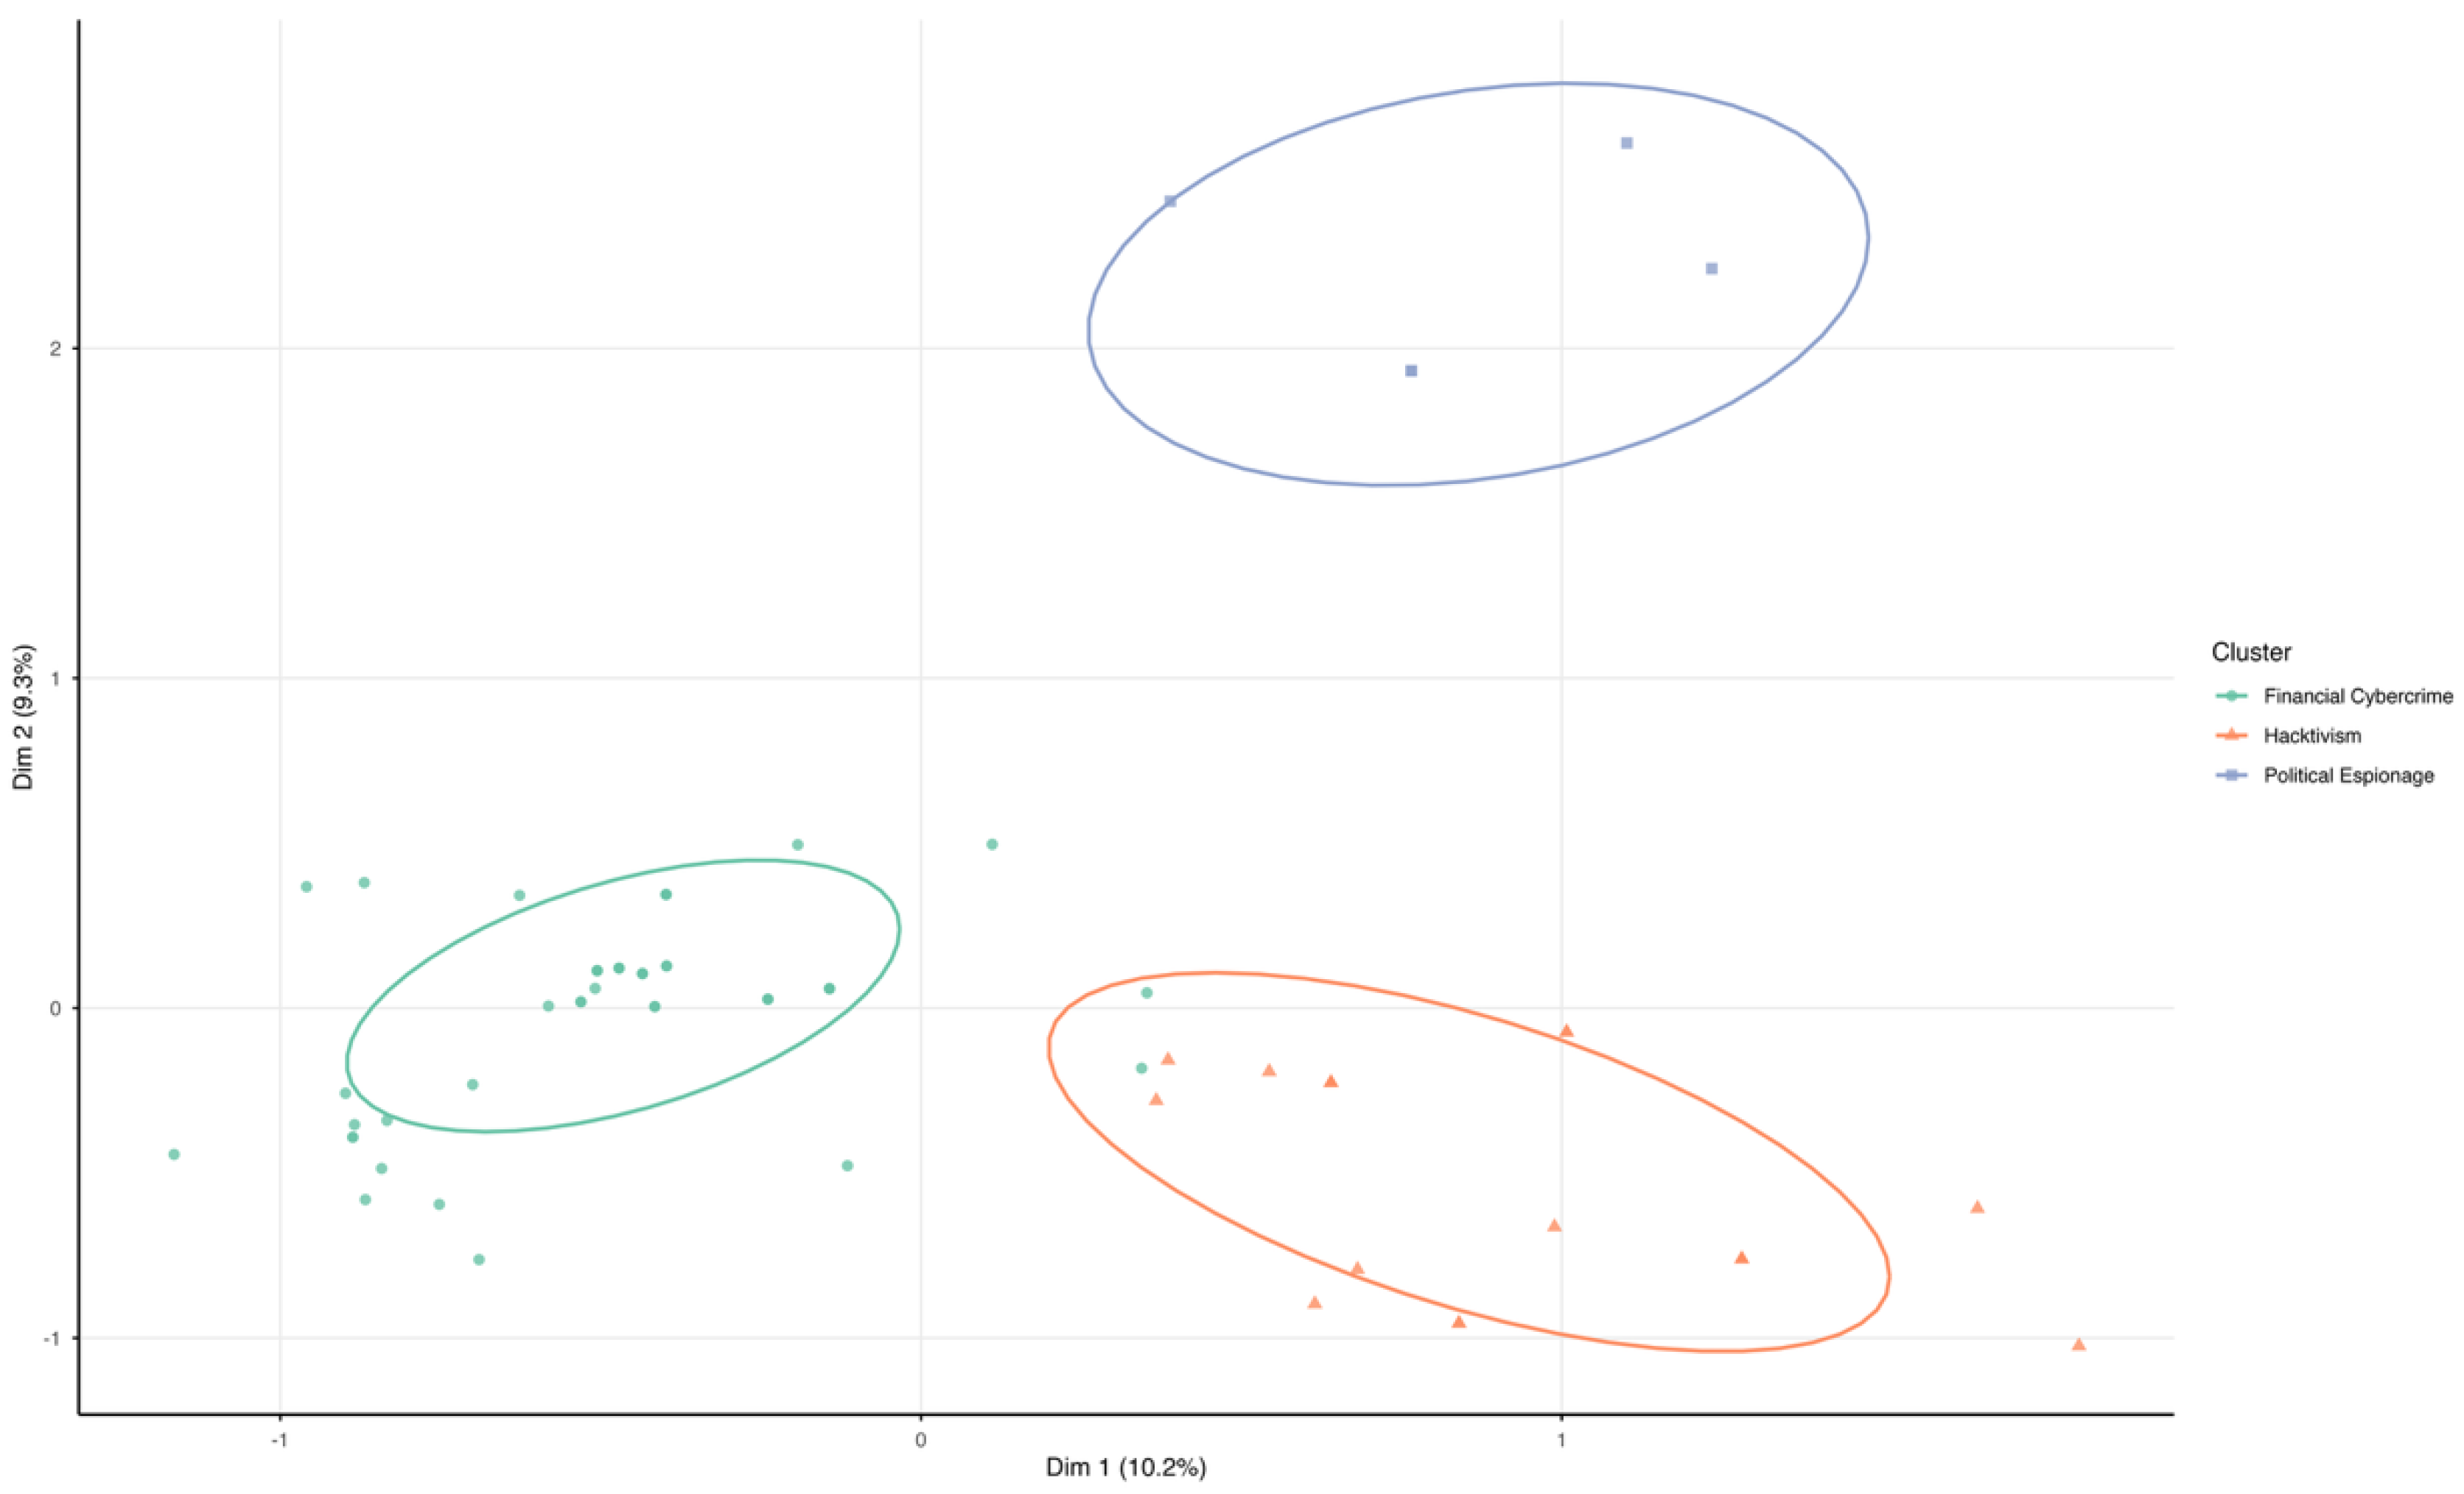
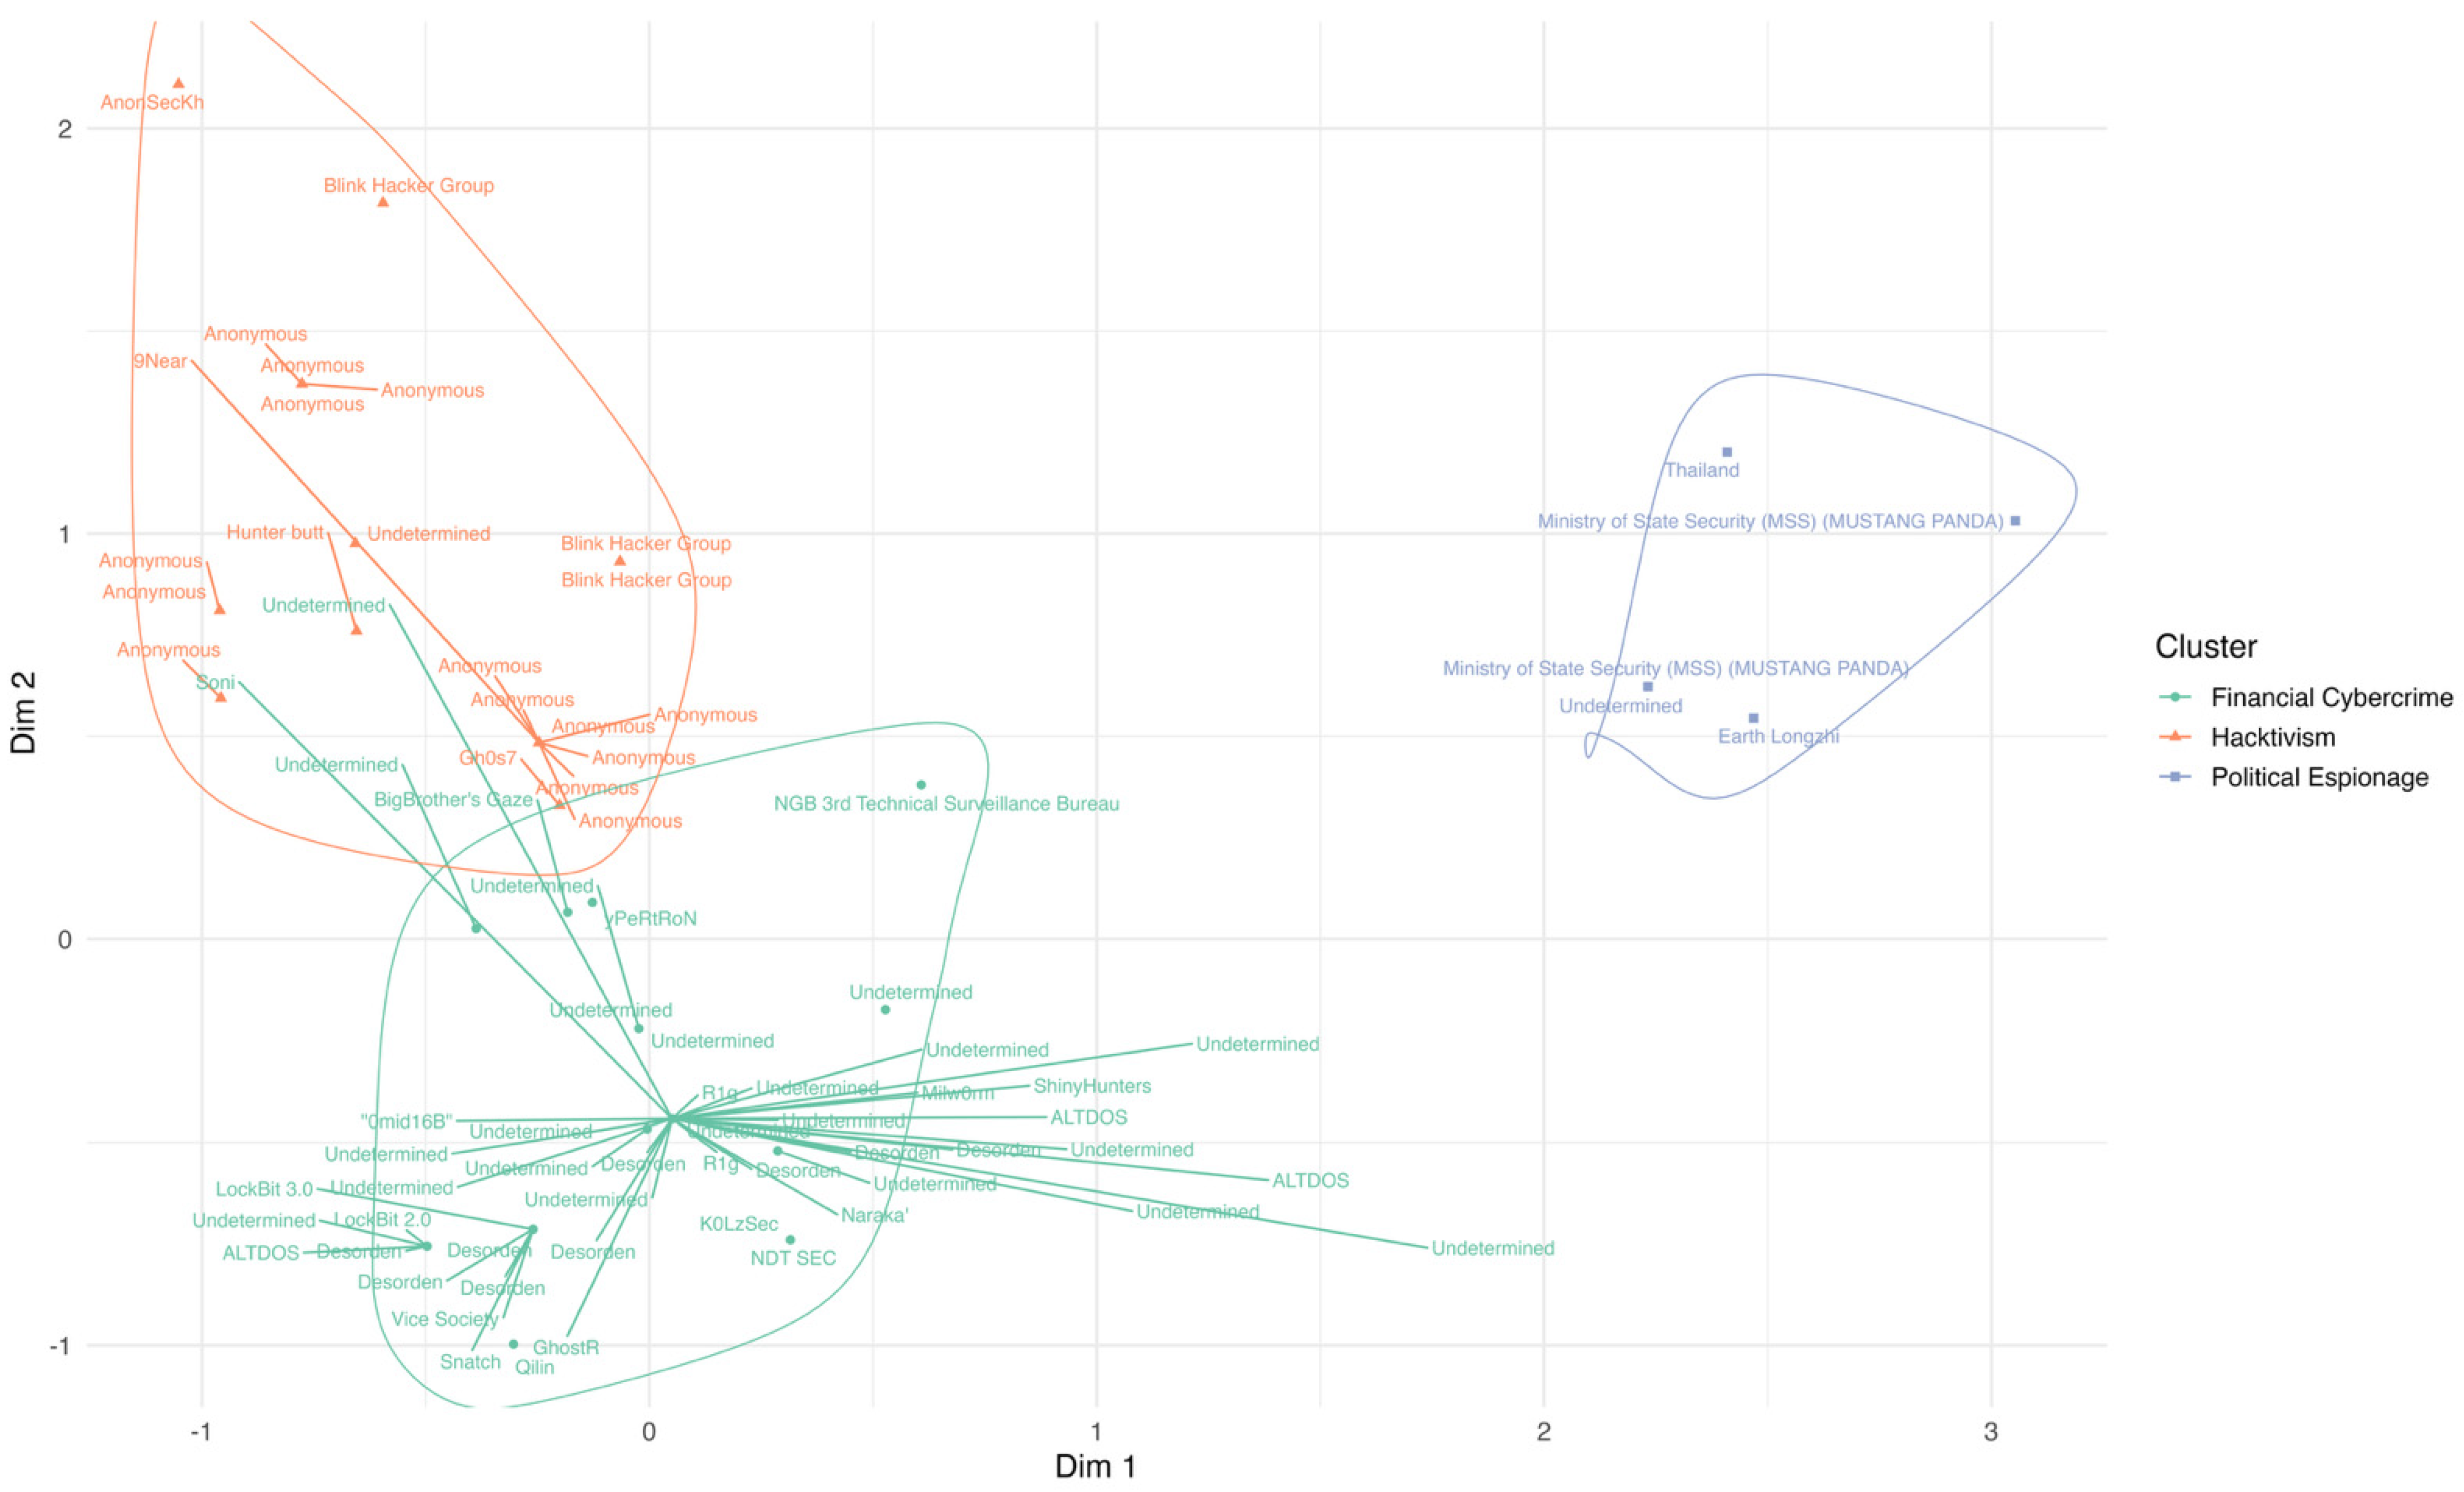
Hierarchical clustering yields three distinct profiles of cyber incidents affecting Thailand. Table 3 presents detailed statistical results for the clusters. ‘Cla/Mod’ indicates the percentage of all observations with a given category that fall into the cluster or simply the cluster concentration of the category. ‘Mod/Cla’ indicates the percentage of observations in the cluster that have that category or the dominance of the category within the cluster.
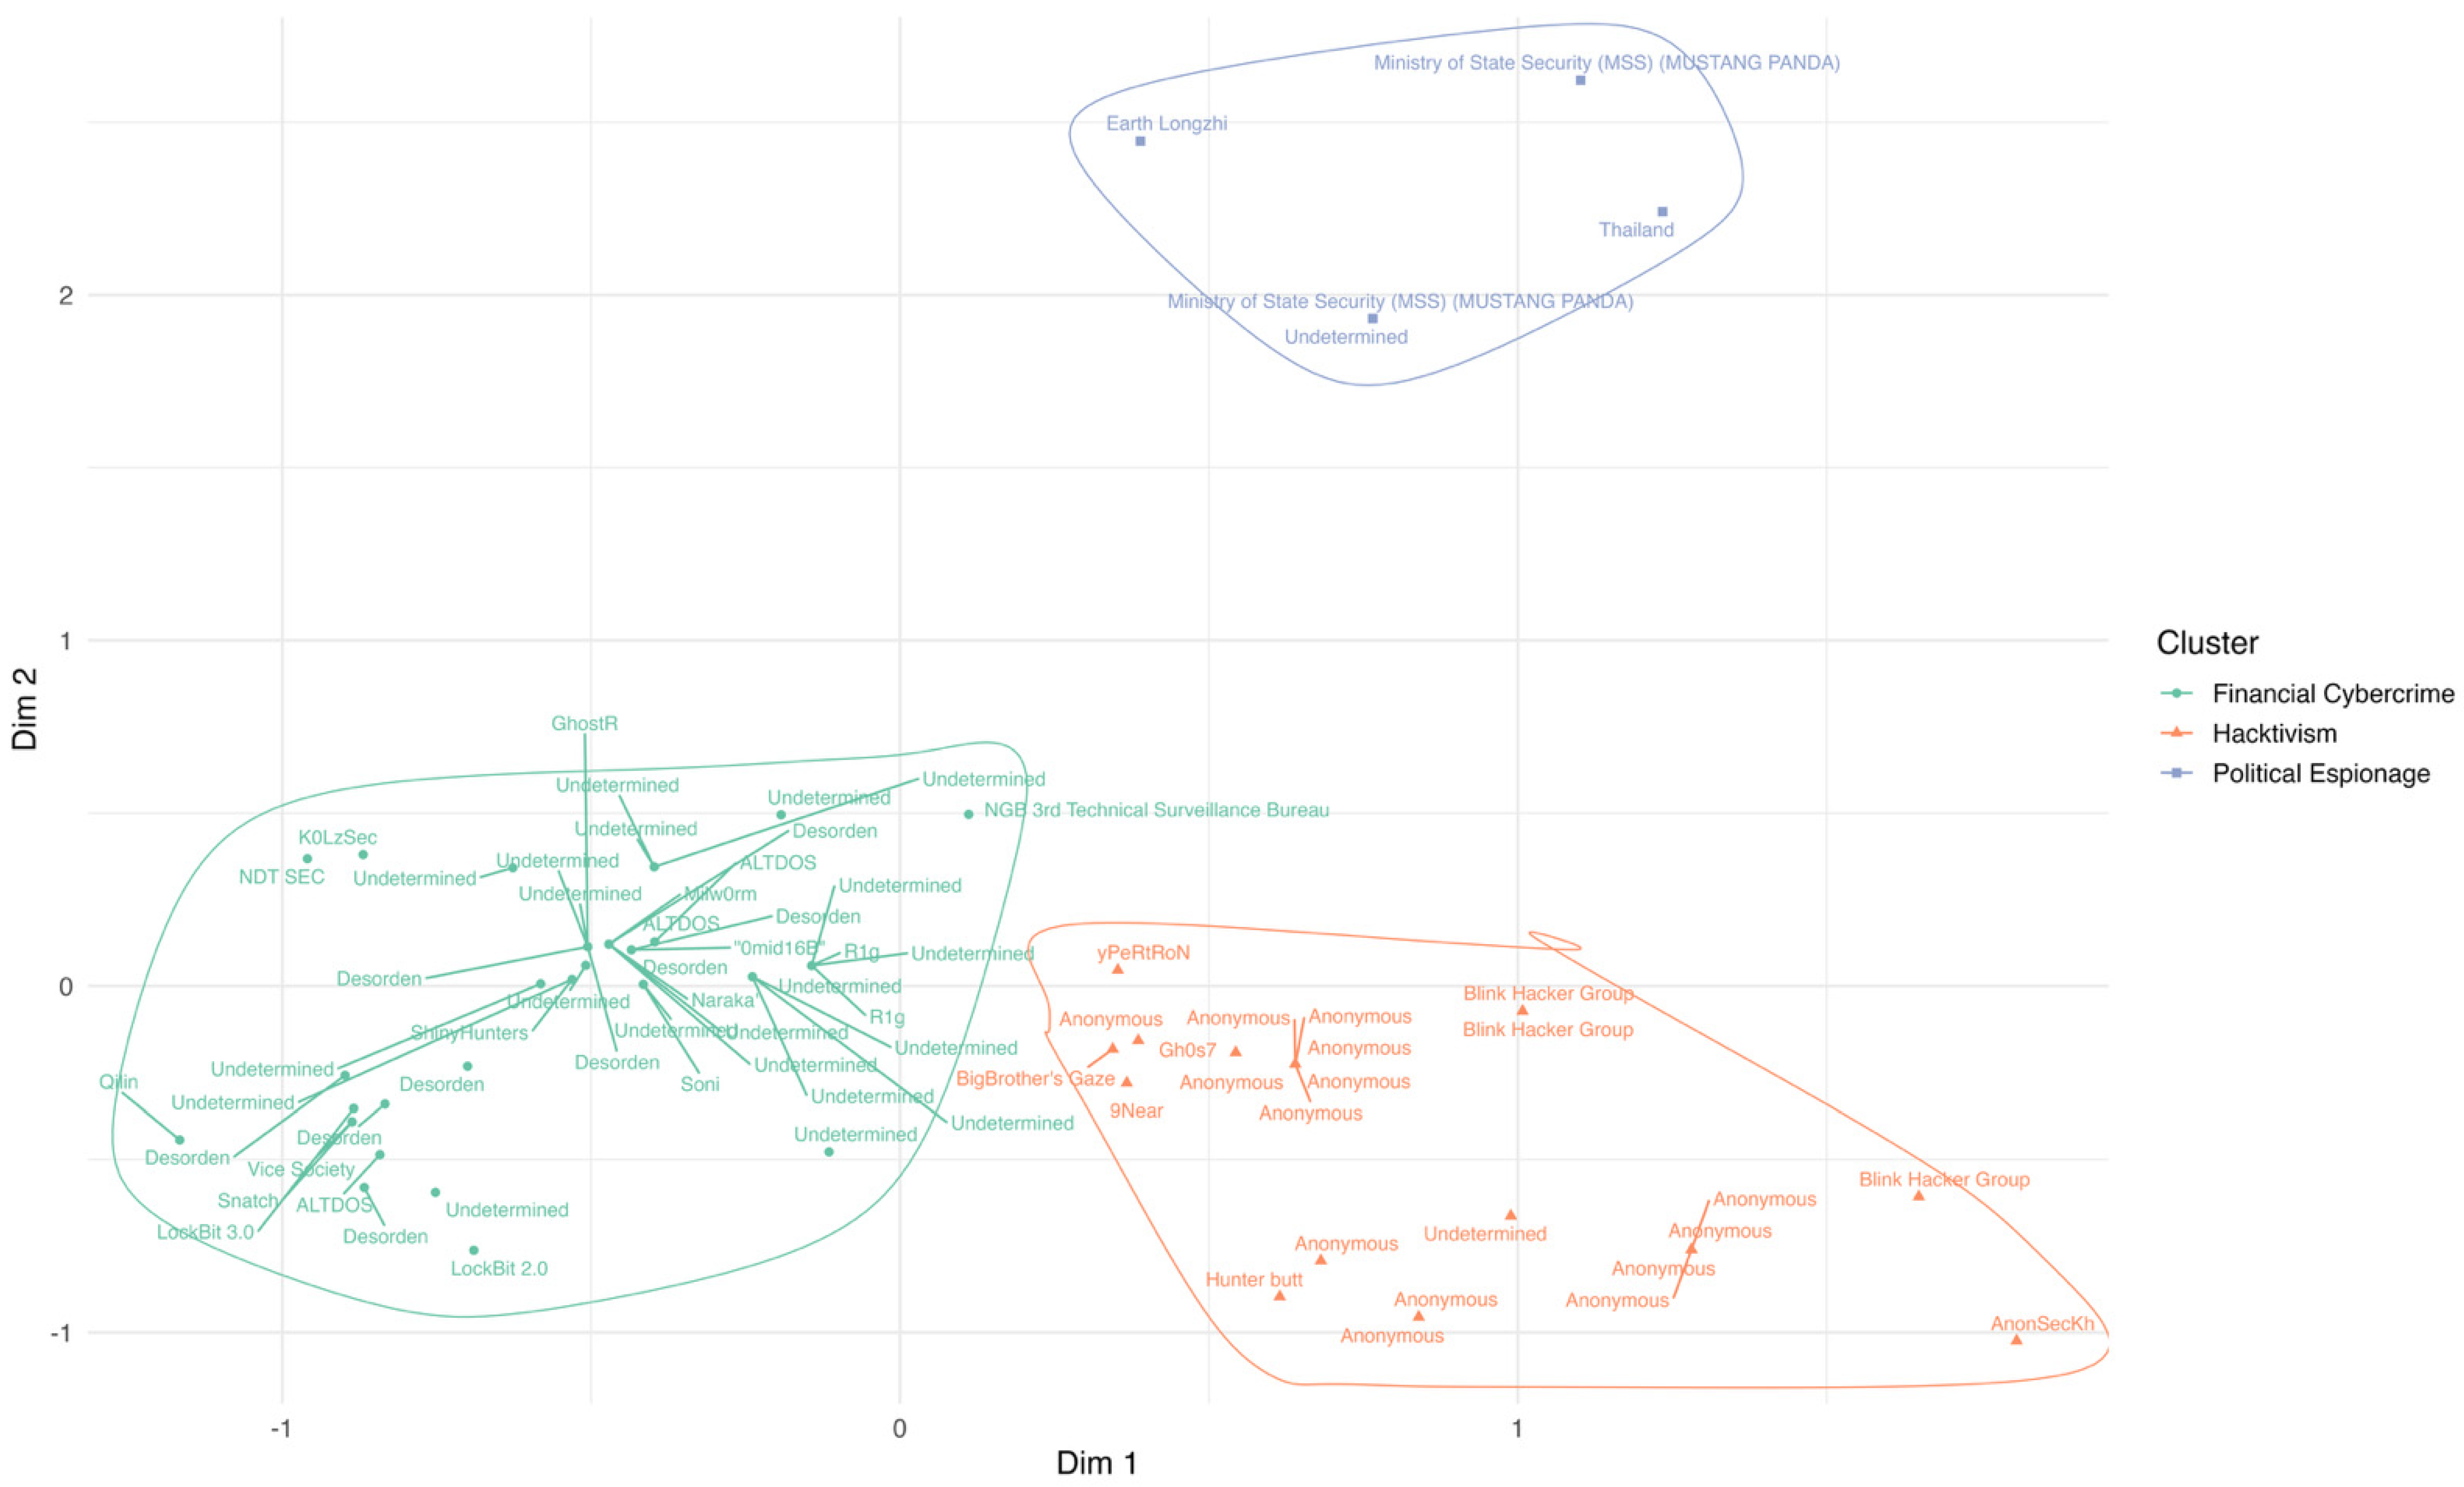
Cluster 1 (n = 51; 65.4%) has a pronounced criminal–financial signature: incidents are almost entirely attributed to criminal actors (Mod/Cla = 94.1%; v = 8.6) and are predominantly financially motivated (Mod/Cla = 86.3%; v = 7.8). The profile is further characterised by substantial attribution uncertainty, with the country of the attributed actor recorded as ‘undetermined’ for nearly all incidents (Mod/Cla = 96.1%; v = 3.3). By sector, incidents affecting finance and insurance and retail trade are over-represented. Supplementary year descriptors indicate that this profile is disproportionately concentrated in 2022–2023, suggesting a concentration of financially motivated criminal activity in the later period of the sample. However, since year is used as a post-ad hoc supplementary variable, it does not prove real temporal changes.
Cluster 2 (n = 22; 28.2%) corresponds to a hacktivist–protest profile centred on the public sector. Protest motivation (Mod/Cla = 90.9%; v = 8.3) and hacktivist actors (Mod/Cla = 86.4%; v = 7.9) are strongly overrepresented, as are incidents affecting public administration (Mod/Cla = 81.8%; v = 5.3). Disruptive event types are also over-represented (v = 3.5), while criminal and financial categories are sharply under-represented. Supplementary year descriptors show a pronounced concentration in 2016.
Cluster 3 (n = 5; 6.4%) captures a low-frequency but coherent nation-state espionage profile. It is defined by nation-state actors (Mod/Cla = 100%; v = 5.1) and political-espionage motivation (Mod/Cla = 100%; v = 5.1), with China-attributed incidents concentrated in this cluster (Cla/Mod = 100%; Mod/Cla = 80%; v = 4.6). However, as indicated by the low stability of Cluster 3 in Table 3, these results should be interpreted with caution. Rather than providing definitive evidence of a distinct threat profile, this cluster points to a possible exploratory pattern that requires further validation.
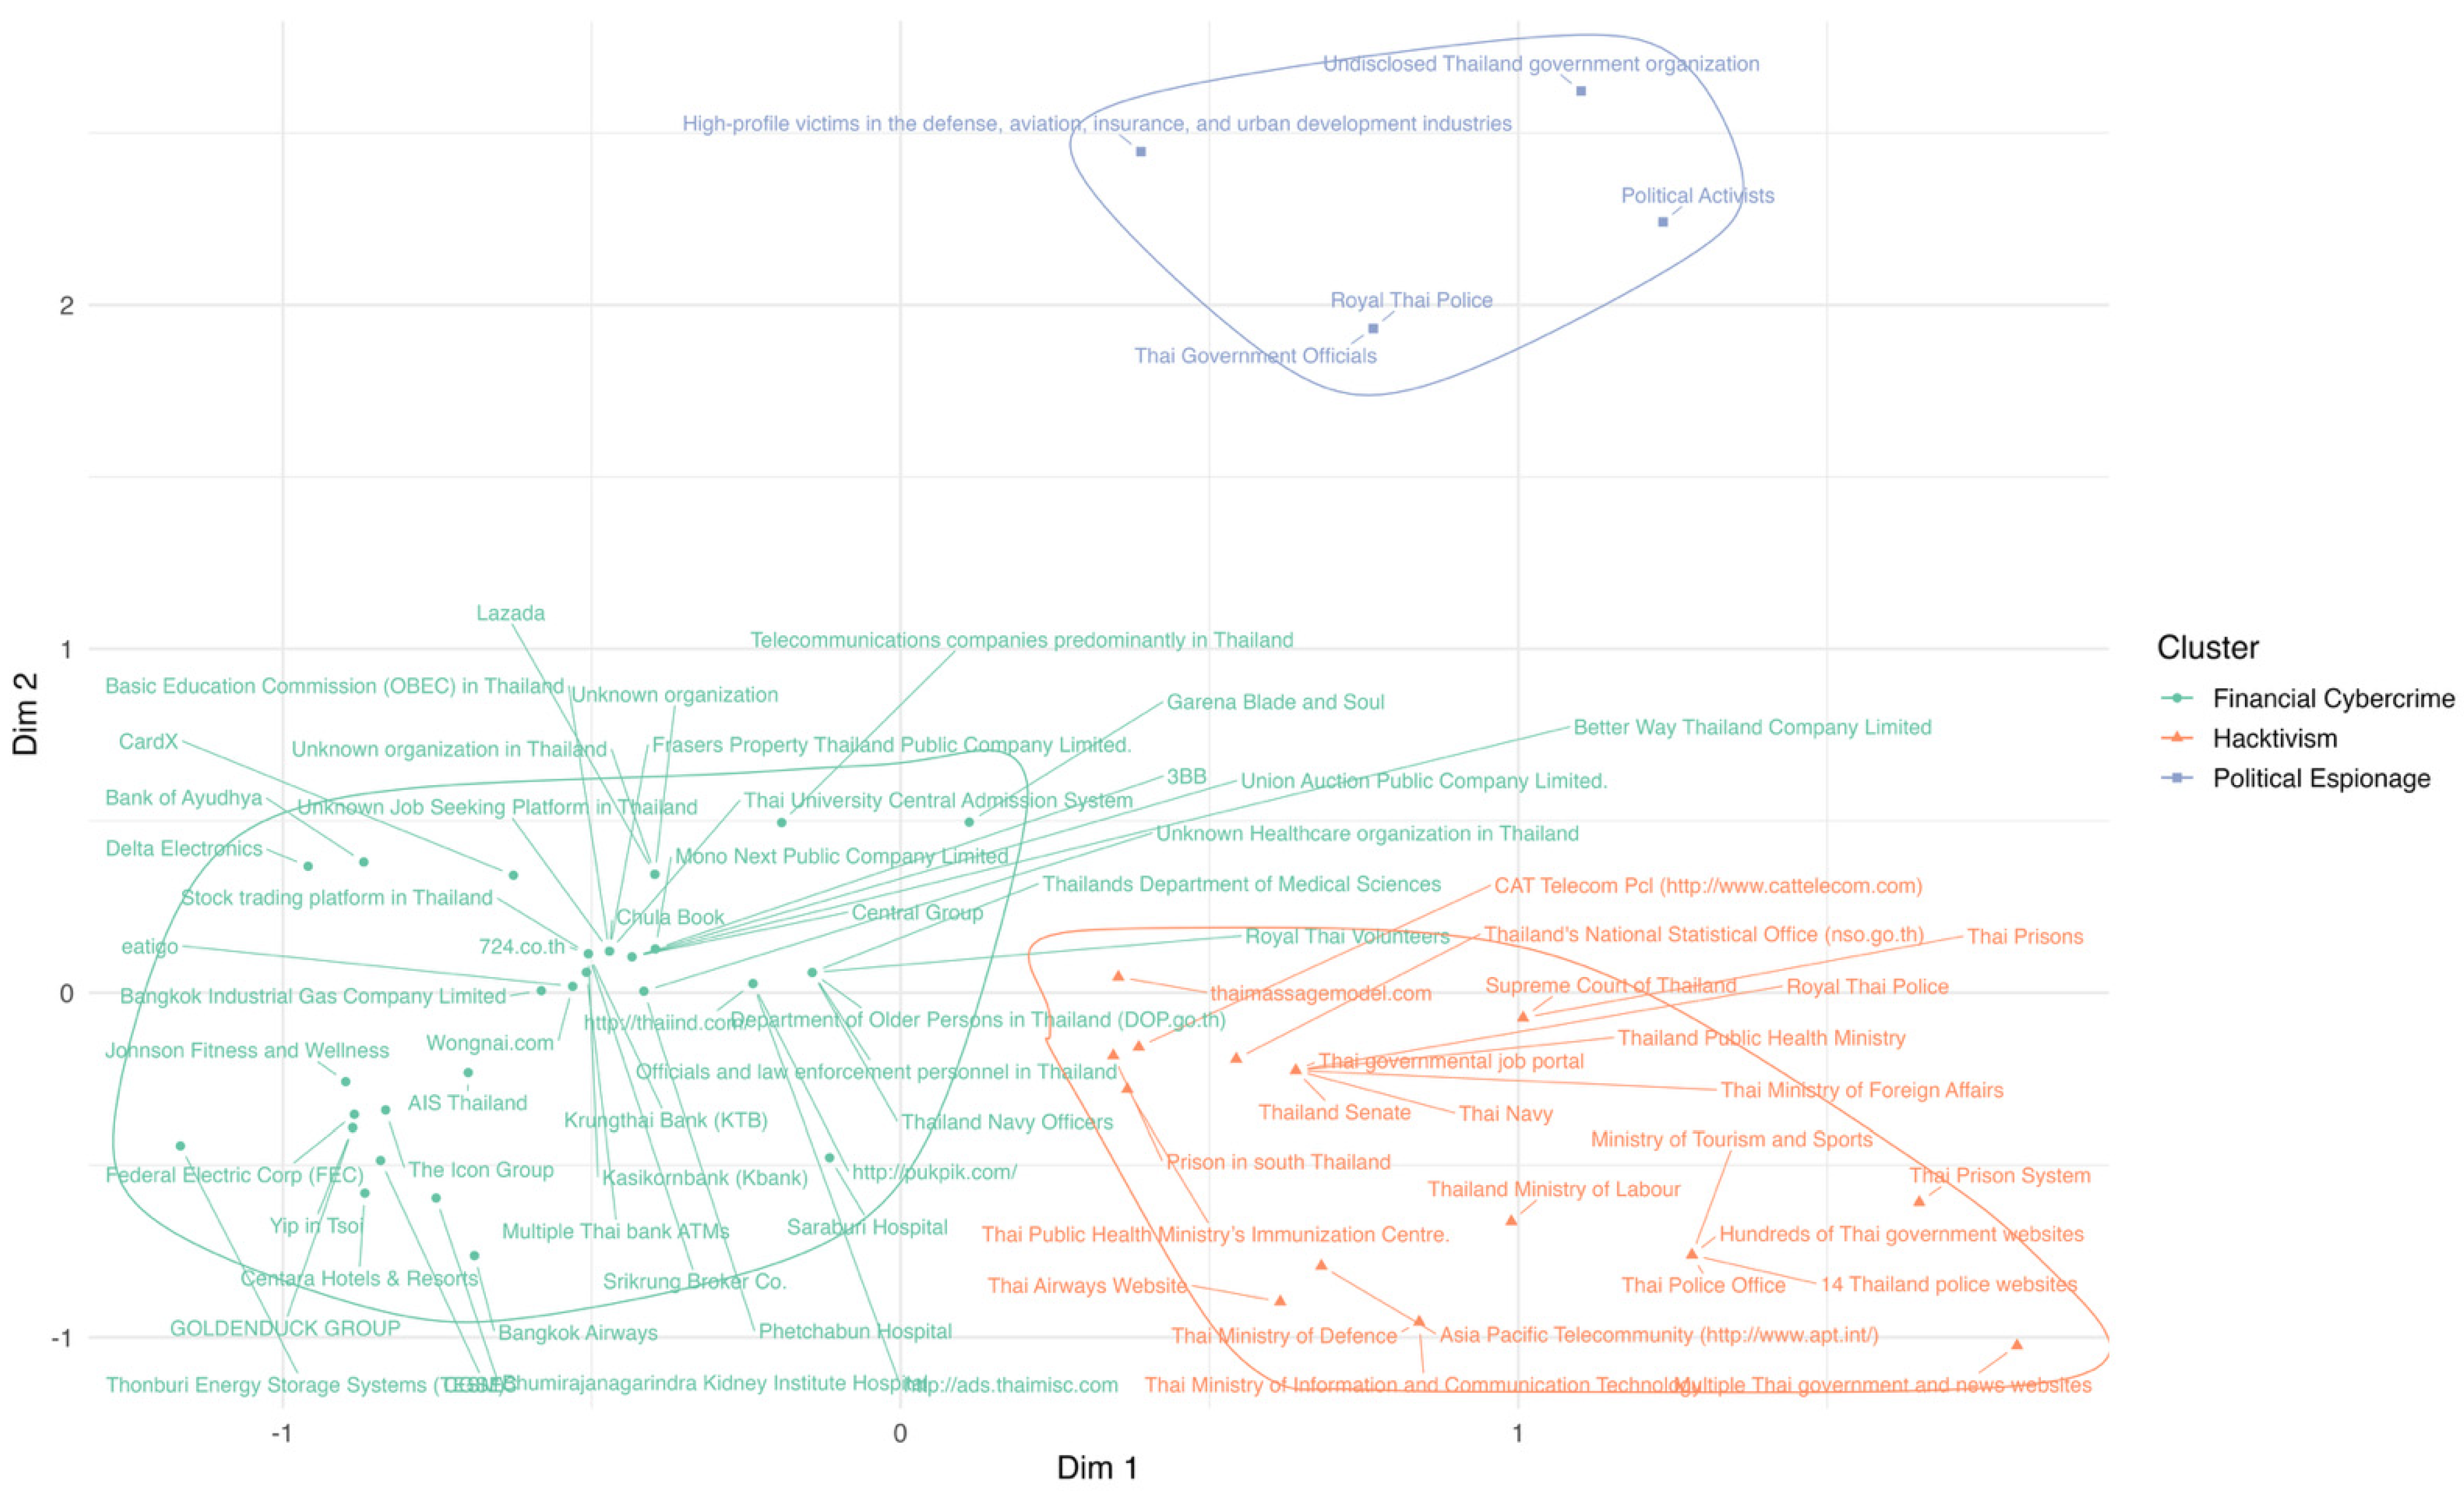
Overall, the exploratory typology differentiates Thailand’s incident landscape into (i) financially motivated criminal activity with high attribution uncertainty, (ii) protest-driven hacktivist disruption of public administration, and (iii) a smaller set of state-linked espionage incidents. The characterisation of these clusters based on v-test values remains exploratory, particularly due to the small size of Cluster 3. These clusters should be interpreted as differentiated preparedness needs inferred from observed incident profiles, rather than as direct evidence of specific organisational or technical weaknesses, particularly given possible reporting bias, attribution constraints, and the absence of richer technical indicators such as intrusion vectors, dwell time, and exploited vulnerabilities. Figure 5 visualises these clusters. Full cluster labels and cluster validation metrics are presented in Appendix A.
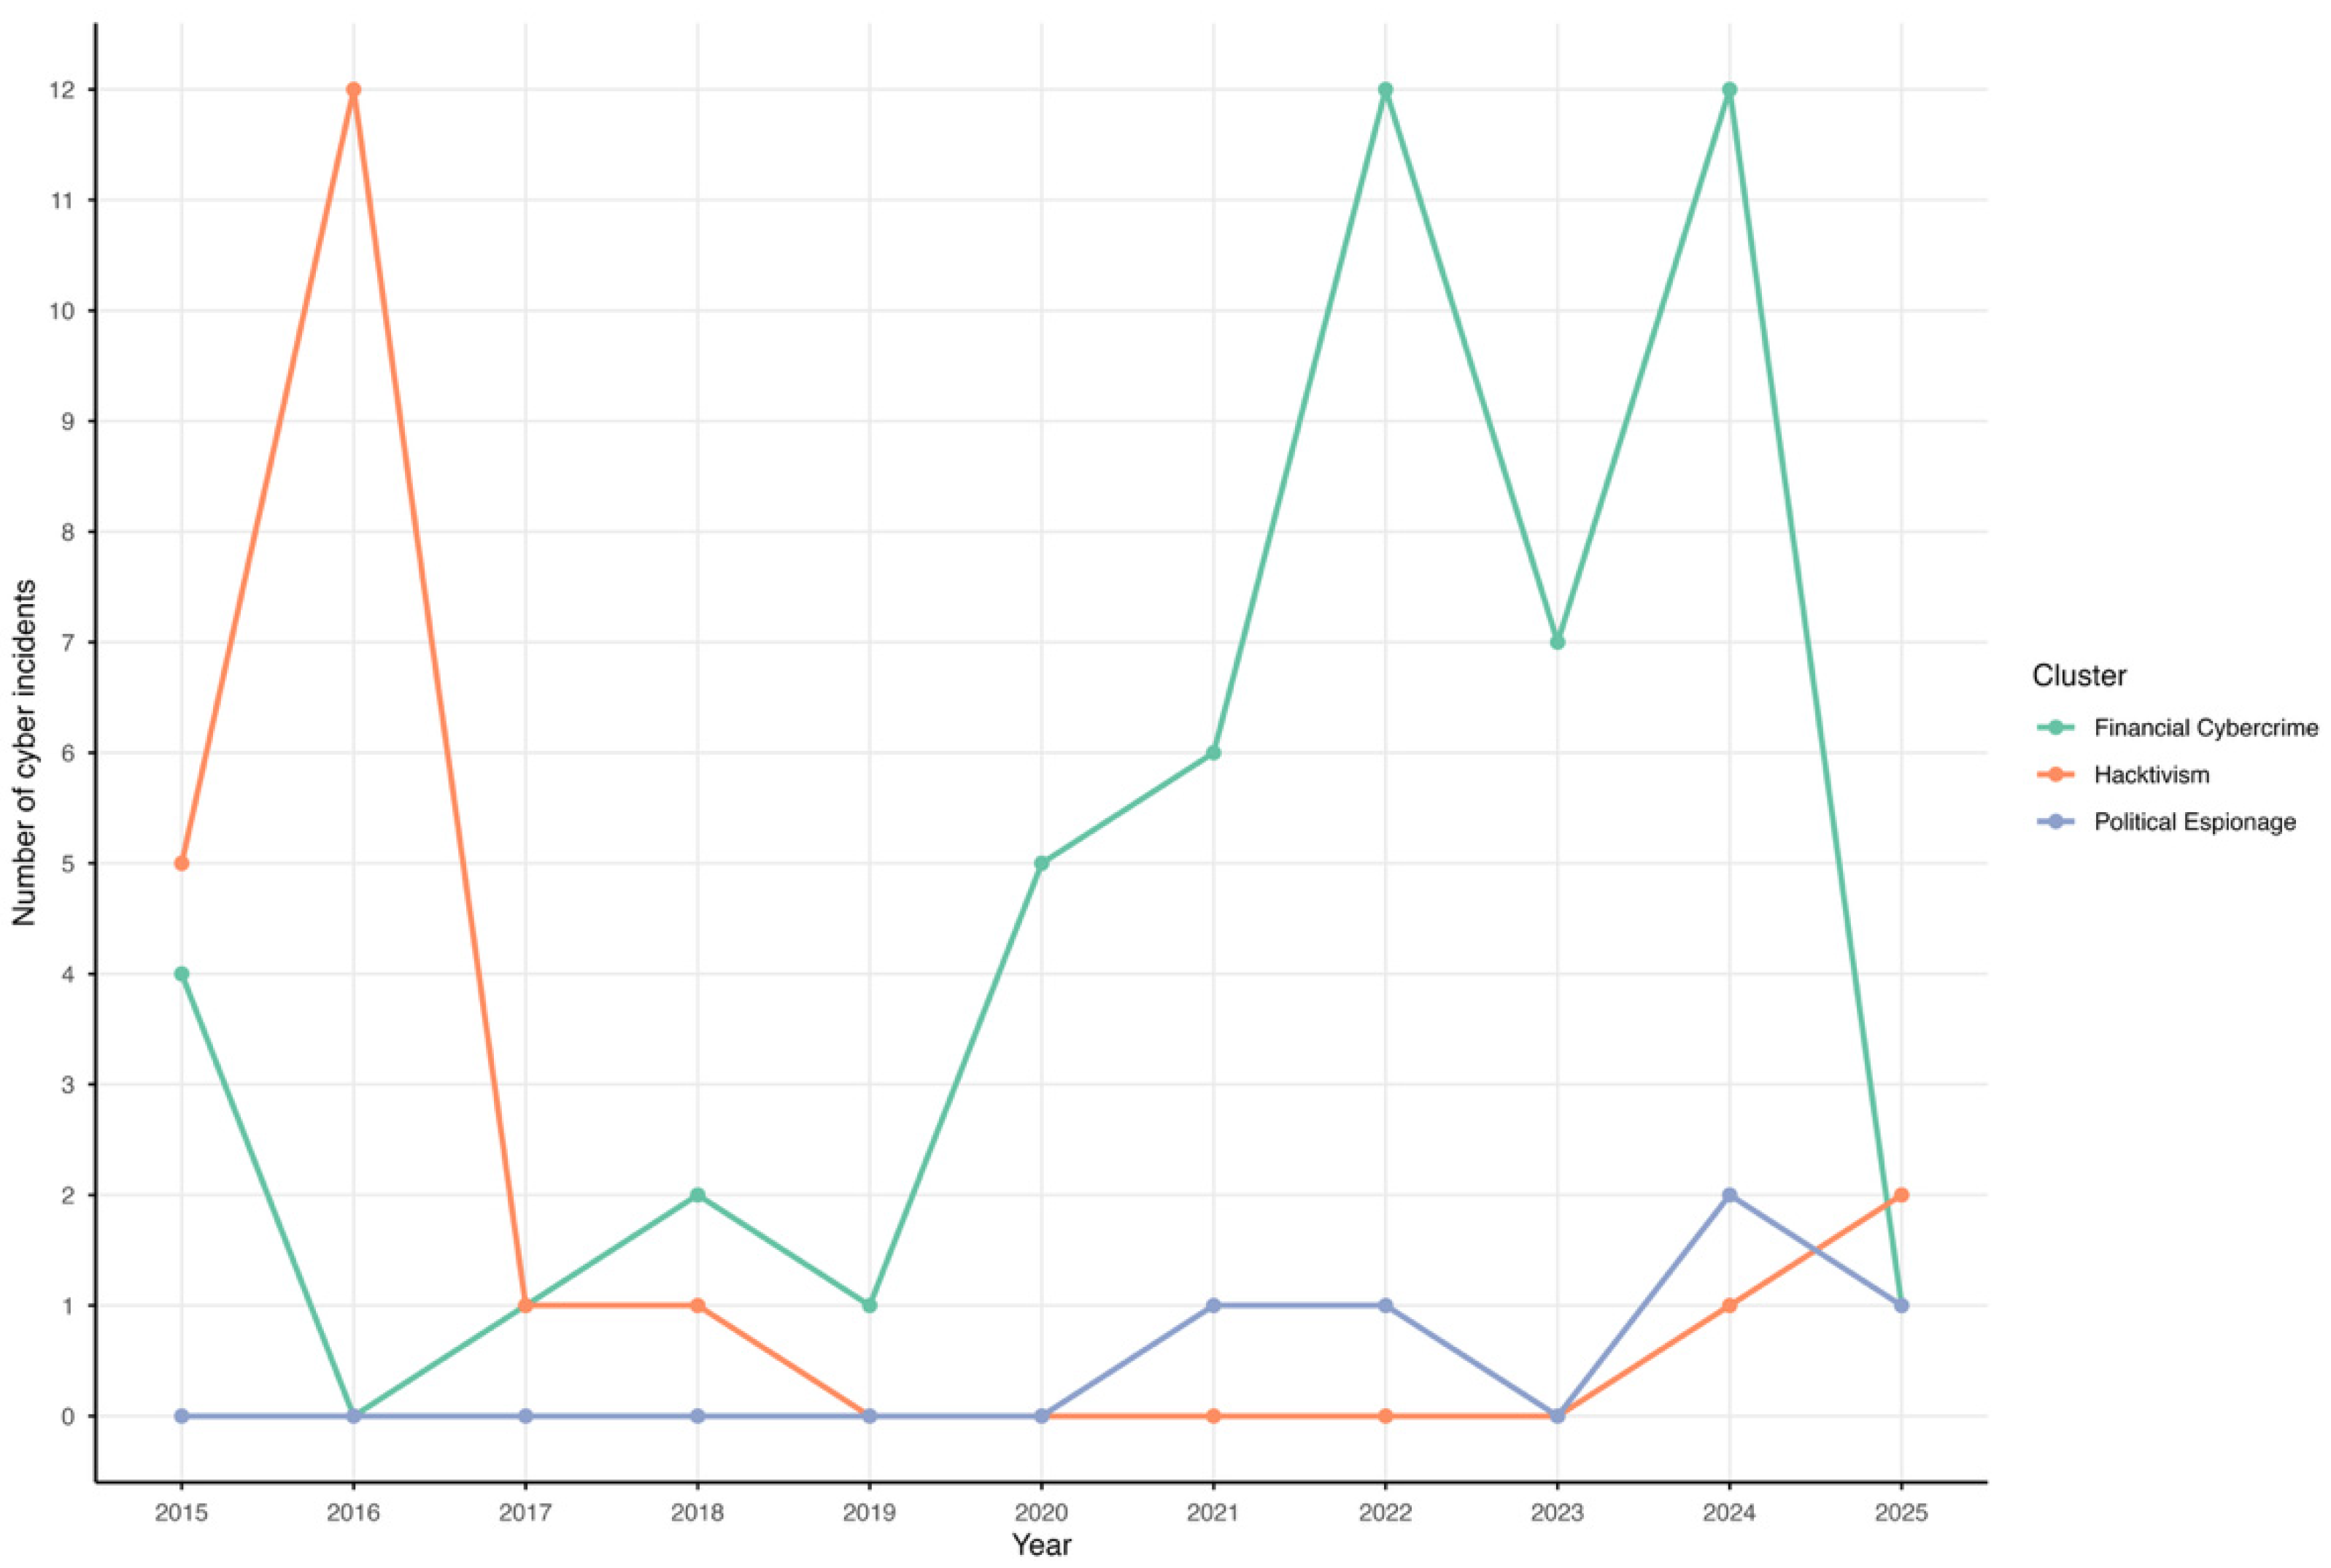
Figure 6 shows the annual counts of cyber incidents by cluster. Since year was included only as a supplementary variable, the figure is used for post hoc description rather than as evidence that year shaped the cluster solution. The financial cybercrime cluster is more prominent in the latter years of the dataset, particularly in 2022 and 2024. However, only 2022 and 2023 appear in the cluster characterisation results, so 2024 should be read only as a descriptive pattern in the annual counts. The hacktivism cluster is mainly concentrated in 2015 and 2016, with 2016 strongly associated with this cluster in the characterisation results. These patterns are interpreted cautiously because they may also reflect changes in reporting or incident visibility over time.
Bootstrap cluster stability was assessed using 100,000 resampling replications. The results indicate that the three-cluster solution should be interpreted cautiously. For (k = 3), Cluster 1 showed acceptable stability, with a mean Jaccard similarity of 0.773. However, Clusters 2 and 3 showed low stability, with mean Jaccard values of 0.529 and 0.323, respectively. The third cluster was particularly unstable, being dissolved in 78.8% of bootstrap samples and recovered in only 7.4% of samples. Therefore, the three-cluster solution is treated as a substantively meaningful but statistically cautious typology rather than as a highly stable clustering structure. Table 4 reports the full results of the bootstrap stability check. For comparison, the two-cluster solution also produced an uneven stability pattern: Cluster 1 was highly stable, with a mean Jaccard similarity of 0.888, while Cluster 2 was unstable, with a mean Jaccard similarity of 0.311.

4.2. Sensitivity Analysis

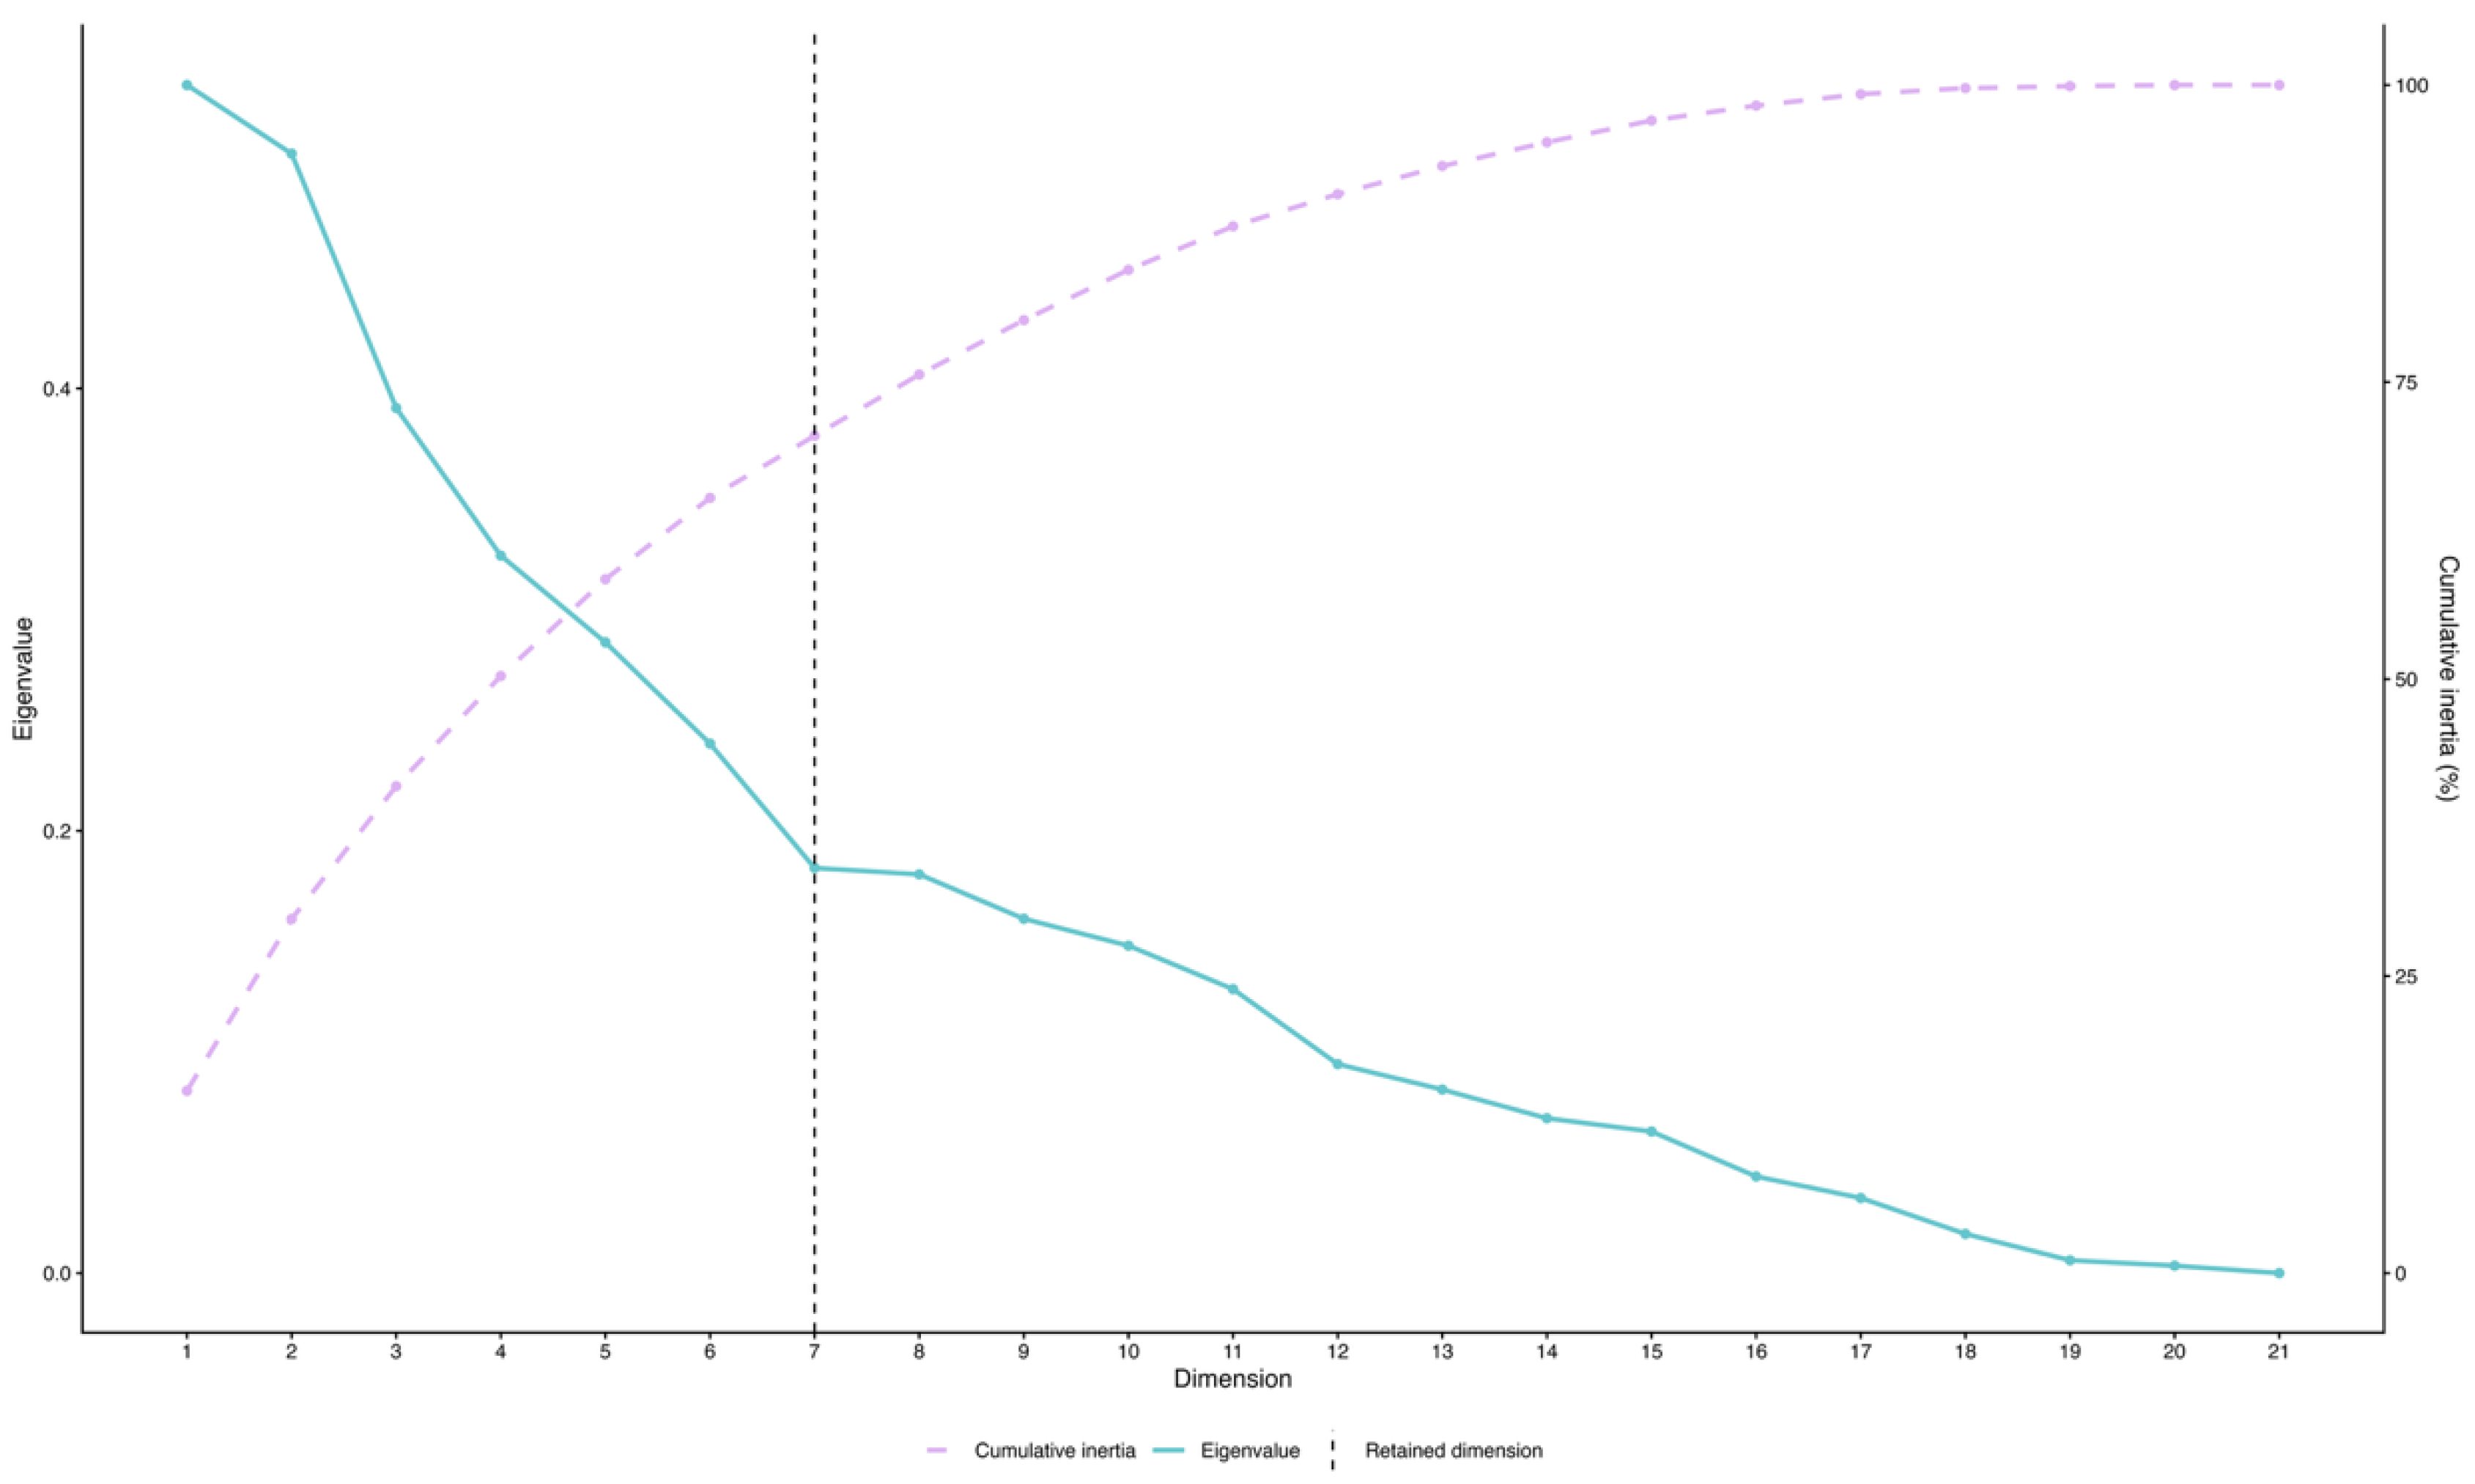
To ensure that the analysis is robust, industry was removed as an active variable and treated as a supplementary variable due to its high cardinality, as indicated in Table A2. As shown in Figure A8, the diagnostics suggested seven dimensions for clustering, which represent 70% of the cumulative inertia. The dimensionality of the sensitivity analysis was selected using the scree-plot elbow criterion. The first seven MCA dimensions were retained because the eigenvalues declined and then flattened after this point. Because the purpose of the sensitivity test was to assess whether the original three-cluster solution was affected by the high-cardinality industry variable, the number of clusters was fixed at k = 3 rather than re-selected automatically. This allowed direct comparison between the main and reduced-variable solutions. The clustering results remain robust to additional sensitivity checks, but the stability diagnostics are worse, suggesting that including the industry variable is preferable for cluster stability. The results are provided in Table A3 and Table A4 as well as Figure A8 and Figure A9.

5. Discussion and Conclusions

5.1. Summary and Significance of Findings

This exploratory study demonstrates that cyber incidents affecting Thailand are not well captured by a single non-traditional security threat frame. Instead, the incident landscape splits into three empirically distinct threat profiles (financial cybercrime, hacktivist disruption, and nation-state political espionage), with the dominant structuring dimensions being actor type and motive, followed by actor country and event subtype, with weaker (but still significant) differentiation by sector and event type. This matters for policy because generic prescriptions, such as more training, more cooperation, and more technology, implicitly assume a homogeneous threat environment. The typology produced here supports a differentiated readiness model: each cluster corresponds to a different offender–target–guardianship configuration and therefore requires different mixes of doctrine, human capital, and coordination, consistent with routine activity theory’s focus on the convergence of motivated offenders, suitable targets, and inadequate guardianship [12].
The three-cluster solution aligns closely with established distinctions in the literature on cyber threats and offender organisation. The financial cybercrime cluster echoes work identifying economic gain as a central driver of cyber incidents and highlighting how organisational practices and capability gaps shape exposure to and loss from cyber incidents [16,19]. The hacktivist disruption cluster aligns with typologies that distinguish ideologically or politically motivated actors from profit-seeking cybercriminals [10] and is consistent with arguments that hacktivist campaigns frequently pursue visibility and disruption rather than sustained extraction. The nation-state espionage cluster aligns with the strategic literature that distinguishes state-sponsored cyber operations from criminal activity, in which state power and political incentives shape the likelihood and purpose of state-linked attacks [17,30]. Importantly, this cluster is small in terms of case count, yet it is qualitatively distinct. Nation-state actors and a political-espionage motive are universal within the cluster, and therefore, this cluster warrants separate policy treatment rather than being absorbed into broad cybercrime mitigation doctrine.
The results also speak directly to the Thailand-specific literature that characterises Thailand’s cyber posture as institutionally formalised but operationally uneven, with visible governance architecture and legal instruments but weaker operationalisation of cyber power functions [1]. These exploratory clustering results help specify where operational unevenness is most consequential: mass-market financial cybercrime requires scalable civilian response capacity and public–private coordination; hacktivist disruption requires public-sector resilience and crisis routines; and state-linked espionage requires high-end defensive capability and counterintelligence-grade practices.

5.2. Cluster-Level Interpretation Through Routine Activity Theory

Cluster 1 is the most stable cluster and is defined by criminal actors and financial motive, with a strong concentration of “undetermined” actor-country attributions. This profile is consistent with the attribution problem: when attribution is uncertain, deterrence-by-punishment is structurally weak, and prevention must lean more heavily on deterrence-by-denial, such as hardening targets, improving detection and response, and reducing the payoff from compromise [23,24]. In RAT terms, the incident profiles suggest a large and adaptive motivated offender pool and a broad range of suitable targets, especially where cashless transactions and online services expand routine exposure. However, because the dataset does not directly measure organisational practices, technical controls, staffing, training, or response capacity, these patterns are better interpreted as indicating preparedness and guardianship needs rather than confirmed guardianship failures [4,19,33]. Since attribution is not limited to determining the attacker [25], answering the who, what, how, and why questions are crucial for understanding the overall aims of these attacks in this cluster and for mitigating future attacks. But in this context, it is difficult to draw geographical or geopolitical conclusions about the attacker due to lack of data.
A further implication concerns governance boundaries. Because Cluster 1 is heavily concentrated in finance-related sectors, the most direct levers lie with civilian cyber authorities, sectoral regulators, and private firms. The military role is therefore typically one of supporting rather than leading: enabling intelligence sharing, participating in national exercises, and supporting contingency coordination for critical infrastructure, rather than substituting for financial regulators or the private-sector incident-response capacity. This division of labour is important for avoiding capability misallocation by preventing over-investment in military cyber operations and under-investment in civilian and regulatory capacity that address most observed incidents. Successful cybersecurity governance cannot be achieved by states alone but must involve the private sector [3,50]. The Asia Pacific Regional Intelligence and Analysis Centre is one such entity that involves private-sector collaboration and was established to help financial institutions in Southeast Asia, including Thailand, defend against cyber threats [5].
Cluster 2 is characterised by hacktivist actors, protest motives, and disruptive event forms, with a strong signature of the public administration sector and a concentration in 2015–2016. This aligns with typologies that treat ideologically motivated cyber activity as distinct from financially motivated crime [10,11]. The concentration in public administration is substantively coherent: when grievances are directed at the state, state systems become the symbolic and operational target of disruption. Cluster 2 identifies a hacktivist profile within the Thai cyber-incident data, consistent with existing research that recognises hacktivism as an important source of cyber-attacks in Thailand [32]. The cases in this cluster are concentrated particularly in 2015 and 2016 and include incidents attributed to hacktivist groups such as Anonymous, with public administration appearing as a major target. However, because the dataset does not directly measure political events or test their relationship with cyber activity, this temporal concentration should be interpreted descriptively rather than as evidence of a causal link between hacktivism and specific political developments. Nevertheless, this descriptive evidence is consistent with the broader view that hacktivist campaigns are often linked to political events and dynamics of contention [51], although this study does not empirically test such a relationship. In that sense, the temporal pattern is consistent with research showing that political events can matter for contentious activity [51]. The literature on contentious politics indicates that these episodic events are reactions to changes in the political landscape [51]. This online social movement can be interpreted as a response to the 2014 coup, in which hacktivists expressed their dissent. Similar to Thailand, Myanmar activists also used hacktivism to express their dissent with the regime, with techniques such as blocking access to government websites and displaying protest messages [52]. The practical implication is that preparedness for Cluster 2 should be anchored in event-responsive surge capacity (service continuity, DDoS resilience, rapid restoration routines, and crisis communications).
Cluster 3 represents a low-frequency but strategically distinct profile. This low-frequency cluster may be attributed to reporting as for reasons of national security and risk of retaliation and risk of being seen as vulnerable, countries may choose not to report cyberattacks [22,53,54]. The results suggest that this cluster is characterised by nation-state actors, a political-espionage motive, and China-attributed incidents. These findings align with work that links state-sponsored cyber operations to geopolitical and economic factors and state capabilities [17,30]. Furthermore, it aligns with the literature indicating that a disproportionately high number of cyberattacks originate in China and target Southeast Asian countries [22]. Additionally, China has been linked to numerous advanced persistent threats (APTs) [5,17,34]. Even though this cluster is small and unstable, its empirical findings are consistent with prior work identifying China as a cyber threat actor targeting Southeast Asian nations, with cyber espionage as its primary aim [22,34].
Even with a small number of observations, this cluster carries disproportionate significance for defence institutions because it points to intelligence competition, targeted sensitive information, and potential exposure in the defence sector. This cluster, even though small, reflects high internal coherence because 83% of the political espionage attacks are in cluster 3, and 100% of the incidents in cluster 3 are political espionage, 100% of attacks attributed to China are in this cluster, and 100% of incidents in this cluster are attributed to a nation-state actor. Since this is political espionage, successful attribution is crucial. State security remains crucial as APTs continually evolve their methods to maintain a persistent presence in valuable networks [4,5], suggesting that political espionage may still occur unnoticed even when no detection occurs. However, as previously indicated by the low stability of this cluster, these results should be interpreted with caution. The cluster is not sufficiently robust to support definitive conclusions and should therefore be understood as an exploratory pattern rather than a stable empirical grouping.
For state security, the unanswered questions are how intruders gained entry and how to rectify these weaknesses. Answering all attribution-related questions helps protect against future attacks [25]. This directly relates to capable guardianship. From a RAT perspective, this is a different guardianship problem: rather than broad-based basic cybersecurity measures across many targets, it requires high-assurance protection for high-value networks, advanced detection and threat hunting, and stronger integration of cybersecurity with counterintelligence and security culture. In Thailand’s context, where operational capability gaps have been noted despite formal institutional development, this cluster is precisely where unevenness is most costly [1].

5.3. Implications for Thailand’s Cyber Posture and the Role of the Military

A key policy conclusion is that Thailand’s cyber risk governance should be organised around differentiated threat environments rather than a single national checklist. The findings reinforce the critique that national strategies can remain generic in intent while lacking concrete operational plans [6,7,31]. Cyber-risk taxonomy research emphasises that cyber risk is not a single homogeneous phenomenon, but a group of risks that vary by actor, target, attack vector, technical pathway, and organisational context [8]. This exploratory typology provides a practical framework for operationalisation. For the financial cybercrime cluster (Cluster 1), stakeholders should prioritise public–private coordination, regulatory incident reporting standards, workforce development in incident response and digital forensics, and sector-specific operational procedures for finance and related services [4,19,40,41]. In the hacktivist disruption cluster (Cluster 2), the state must strengthen public-sector resilience, including distributed denial of service (DDoS) preparedness, service continuity planning, restoration drills, and coordinated public communication, because the target is frequently the state’s service interface with citizens [10,40]. Finally, for the nation-state espionage cluster (Cluster 3), ring-fencing and other high-end defensive capabilities for sensitive networks are needed. This includes proactive detection, segmentation, secure-by-design architectures, and integration with defence and intelligence procedures [17,30]. For successful attribution and not only answering who did it, but also the what, how, and why questions of the attack, require a capable, experienced team with the necessary skills and tools [25].
This differentiation also clarifies the military’s appropriate role. The military has clear ownership of the defensive posture on defence networks and a supporting role in national coordination; however, the most common incident type in the dataset is financial cybercrime, which primarily falls within civilian and private-sector governance structures. Treating the dominant cyber risk as primarily a military operational problem risks duplicating mandates and neglecting the civilian guardianship needs that RAT helps identify.
Beyond the aforementioned policy implications directly derived from the cluster typology, several broader regional policy extensions may also be considered. These recommendations, however, should be understood as prospective extensions rather than conclusions generated directly by the clustering results. Firstly, the cyber landscape in Southeast Asia is fragile, with attacks coming from many actors [34]. Therefore, cooperation between states is crucial. However, the lack of trust among Southeast Asian countries has limited cooperation on security matters. Nevertheless, regionally, federated learning can help address part of this lack of trust. Federated learning allows users to train models locally and share only model updates or metrics, enabling collective learning without sharing raw security-related data; this approach has been applied in finance, healthcare, and military settings [55,56,57,58]. Overall, federated learning ensures that sensitive data is not shared. The dematerialised nature of cyberspace thus requires cooperation on cybersecurity [3,24]. Secondly, Thailand can leverage technical expertise and training from countries like Singapore, which are well-versed in mitigating cyberattacks [3]. These regional policy recommendations are prospective rather than direct empirical conclusions, as they require additional evidence on regional cooperation, institutional capacity, and the transferability of practices across national contexts.
Furthermore, for general public policy purposes, individuals analysing cyberattacks must be able to translate technical information into plain language [25], as policymakers making the decisions may not be versed in cybersecurity; technical jargon must therefore be minimised to communicate recommendations effectively.

5.4. Methodological Contribution: Clustering for Policy Design

Empirically derived typologies are valuable when they reduce complexity while preserving actionable distinctions. The use of MCA and hierarchical clustering on principal components is well-established as a workflow for constructing interpretable partitions in multivariate data, balancing dimensionality reduction with cluster formation [49]. The approach is consistent with methodological discussions of cluster analysis as a tool for building typologies that are meaningful for social science inference and policy communication [42,43]. In this case, clustering reduces an incident catalogue into three attack environments that can be mapped onto differentiated readiness packages. This serves as an applied bridge between past incidents and the design of prospective capabilities.
At the same time, robustness should remain a standing concern in applied clustering, particularly in relatively small samples. Recent work on robust clustering workflows emphasises the importance of validation, sensitivity checks, and transparency about how partitions are obtained [47]. The primary value of this study is therefore not a claim of immutable true categories, but an empirically justified, interpretable typology that improves policy targeting relative to undifferentiated threat framings.

5.5. Limitations

Several limitations qualify the interpretation and point to priorities for subsequent work. First, there is reporting and visibility bias. Cyber incident datasets are shaped by organisational incentives to disclose and by detection capacity, particularly in critical sectors where reputational costs can suppress reporting [18]. Apparent temporal concentration (e.g., 2022–2023 in Cluster 1) may partially reflect reporting changes rather than underlying incidence shifts. Secondly, and related to the first limitation, the analysis of the data may fully reflect the true landscape of cyberattacks affecting Thailand. Because some cyberattacks may be classified as grave threats to national security, the government might not disclose them to protect national security. Therefore, detailed in-house reporting must be maintained, and individuals with appropriate security clearance should be trained in analysing cyberattacks. This includes not only identifying their sources but also applying machine learning techniques similar to those in this paper and other advanced statistical methods. Such efforts will enable a comprehensive understanding of Thailand’s cybersecurity landscape, even if these analyses are not made public, thereby increasing knowledge among national security practitioners. Thirdly, there are attribution constraints. The dominance of ‘undetermined’ actor-country in Cluster 1 limits geographical and geopolitical inference and reinforces the need to treat country attribution as a weaker evidentiary signal than actor type and motive [23]. Finally, the variable scope for clustering is limited. The typology is constructed from actor, motive, sector, and event descriptors; richer technical indicators (such as intrusion vectors, dwell time, and exploited vulnerabilities) would strengthen the link between clusters and specific defensive controls [13,14,41].
Two extensions would deepen both inference and policy utility. However, these extensions depend on data availability. Firstly, there is a need to account for the disruptive effects of cyberevents. Including the level of disruption or severity from cyber events would allow clusters to capture the criticality of attacks. Research on the cyber threat landscape in Southeast Asia provides ideas for conceptualisation [5]. Finally, there is also a need to measure guardianship explicitly. Incorporating organisational security maturity indicators, such as training coverage, presence of response plans, staffing, and security measures, would allow more direct tests of RAT’s guardianship dimension, rather than relying on the occurrence of incidents as a proxy [12,19].

5.6. Concluding Remarks

Overall, the typology suggests differentiated guardianship needs inferred from observed incident profiles, which may inform differentiated capability investments while remaining subject to the study’s data and measurement limitations. Thailand’s cyber incident environment comprises multiple, systematically different threat profiles, and the most policy-relevant distinctions are anchored in actor type and motive. Interpreted through routine activity theory, the clusters point to differentiated guardianship needs inferred from observed incident profiles and, therefore, to differentiated capability investments. This provides a concrete route for moving from generic national policy statements towards operationally testable readiness programmes, while also clarifying where military leadership is appropriate (defence networks and state-linked espionage) and where civilian–private governance capacity is the decisive constraint (financial cybercrime and sectoral resilience).

Supplementary Materials

The following supporting information can be downloaded at https://www.mdpi.com/article/10.3390/jcp6040124/s1, Figure S1: Chi-Square Test of Association Figures; Table S1: Expected and Observed Values by Variable and Cluster; Table S2: NbClust Results.

Author Contributions

Conceptualization, J.D., C.R. and I.S.; Methodology, J.D., C.R. and I.S.; Software, J.D.; Validation, J.D., C.R. and I.S.; Formal Analysis, J.D.; Investigation, J.D.; Resources, I.S.; Writing—Original Draft Preparation, J.D., and C.R.; Writing—Review & Editing, J.D. and I.S.; Visualization, J.D.; Supervision, I.S.; Project Administration, I.S.; Funding Acquisition, I.S. All authors have read and agreed to the published version of the manuscript.

Funding

This work was supported by the National Research Council of Thailand [grant number N84A680860].

Institutional Review Board Statement

Not applicable.

Informed Consent Statement

Not applicable.

Data Availability Statement

The data underlying this study are drawn from the University of Maryland’s Cyber Events Database [version date 18 February 2026] (Harry and Gallagher, 2018 [15]). Full bibliographic details are provided in the reference list. Replication code and data are available as Supplementary Materials.

Conflicts of Interest

The authors declare no conflicts of interest. The funders had no role in the design of the study; in the collection, analyses, or interpretation of data; in the writing of the manuscript; or in the decision to publish the results.

Appendix A

Based on the scree plot and cumulative inertia, the first eleven MCA dimensions were retained for clustering. The scree plot shows a marked decline in eigenvalues across the initial dimensions, followed by a more gradual decrease after approximately dimension 10. Retaining eleven dimensions preserves 62.23% of the cumulative inertia (cumulative variance explained) while limiting the inclusion of lower-contribution dimensions that may add noise to the clustering solution. Figure A1 visualises these metrics.
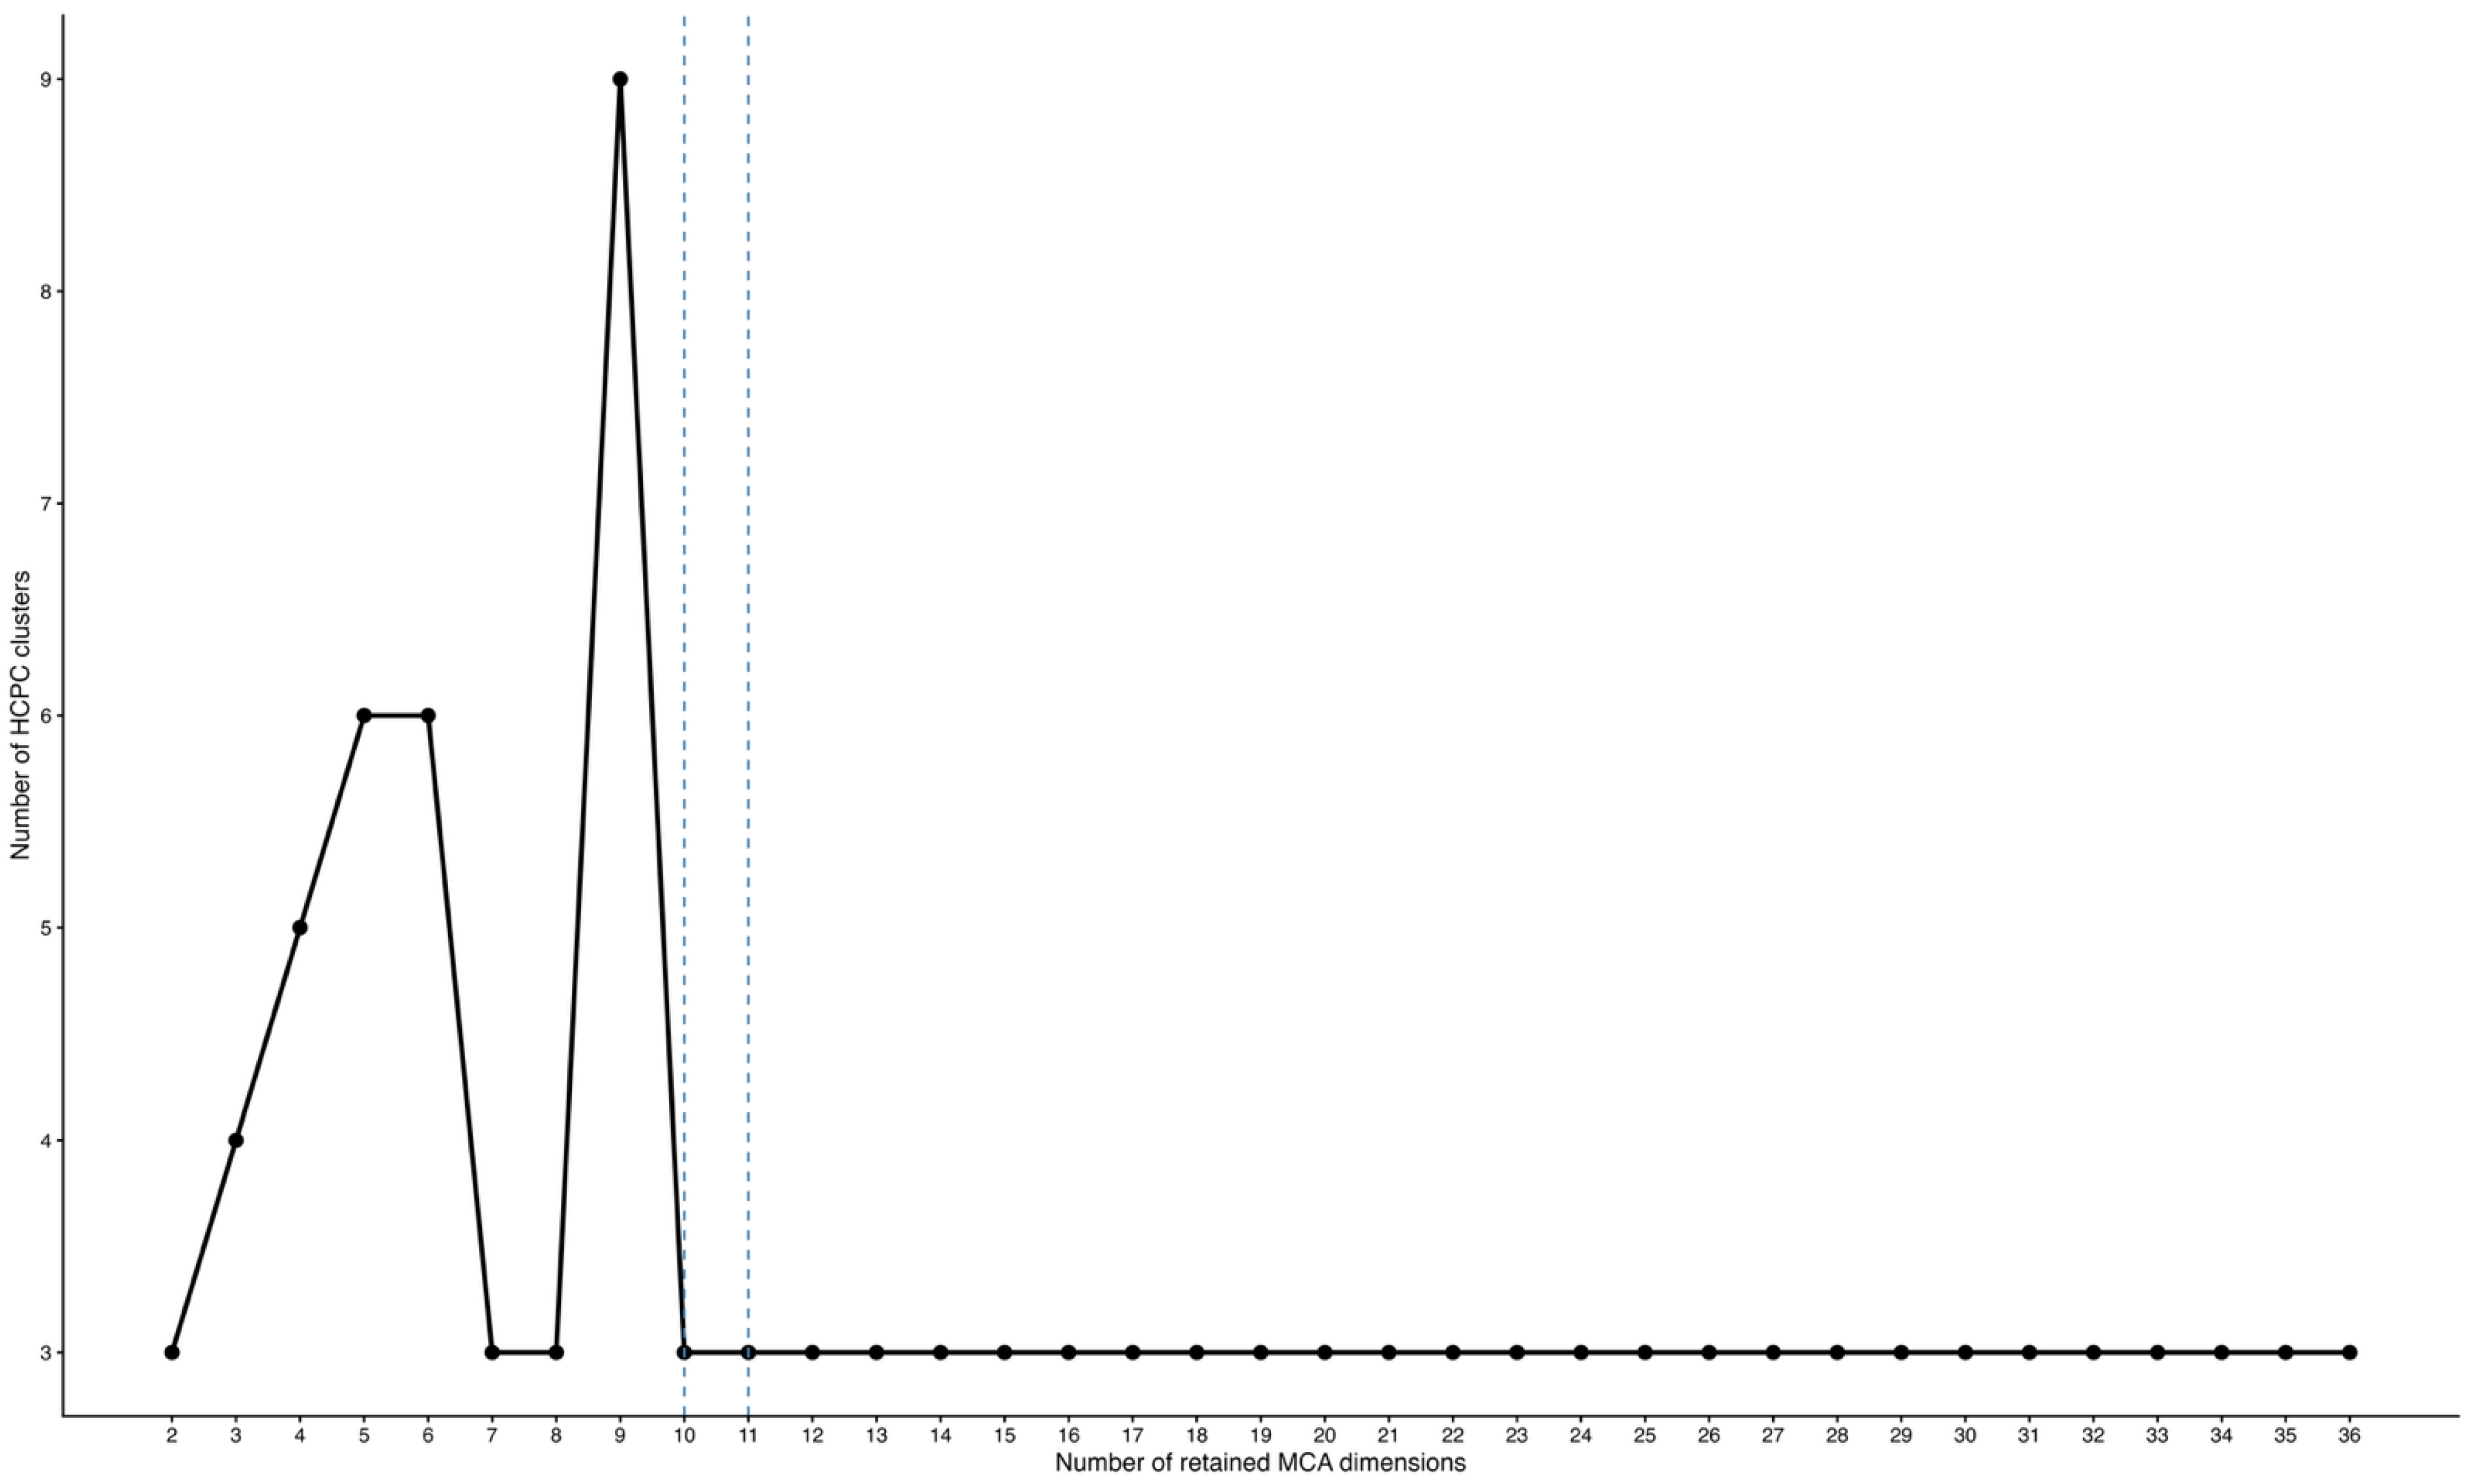
Furthermore, sensitivity checks were conducted by varying the number of retained MCA dimensions. Figure A2 shows that the clustering solution (using inertia gain) was unstable between 2 and 9 dimensions (black solid line), with the number of clusters increasing from three to nine. However, from 10 dimensions onward, the solution consistently produced three clusters (blue dashed line). Also, because the diagnostics from the cumulative inertia and eigenvalue plot suggested 11 dimensions, we retained 11 dimensions, as this represented the specification at which the stable three-cluster solution emerged (blue dashed line). This choice preserves 62.23% of the cumulative inertia while avoiding the unnecessary retention of lower-contribution dimensions that may add noise to the clustering solution.
Figure A1. Cumulative Inertia and Eigenvalue Plot.
Jcp 06 00124 g0a1
Figure A2. Sensitivity of HCPC cluster solution to retain MCA dimensions (Black solid line indicates the stability of the number of clusters relative to the number of retained dimensions; Blue dashed line indicates where the cluster stabilizes).
Jcp 06 00124 g0a2
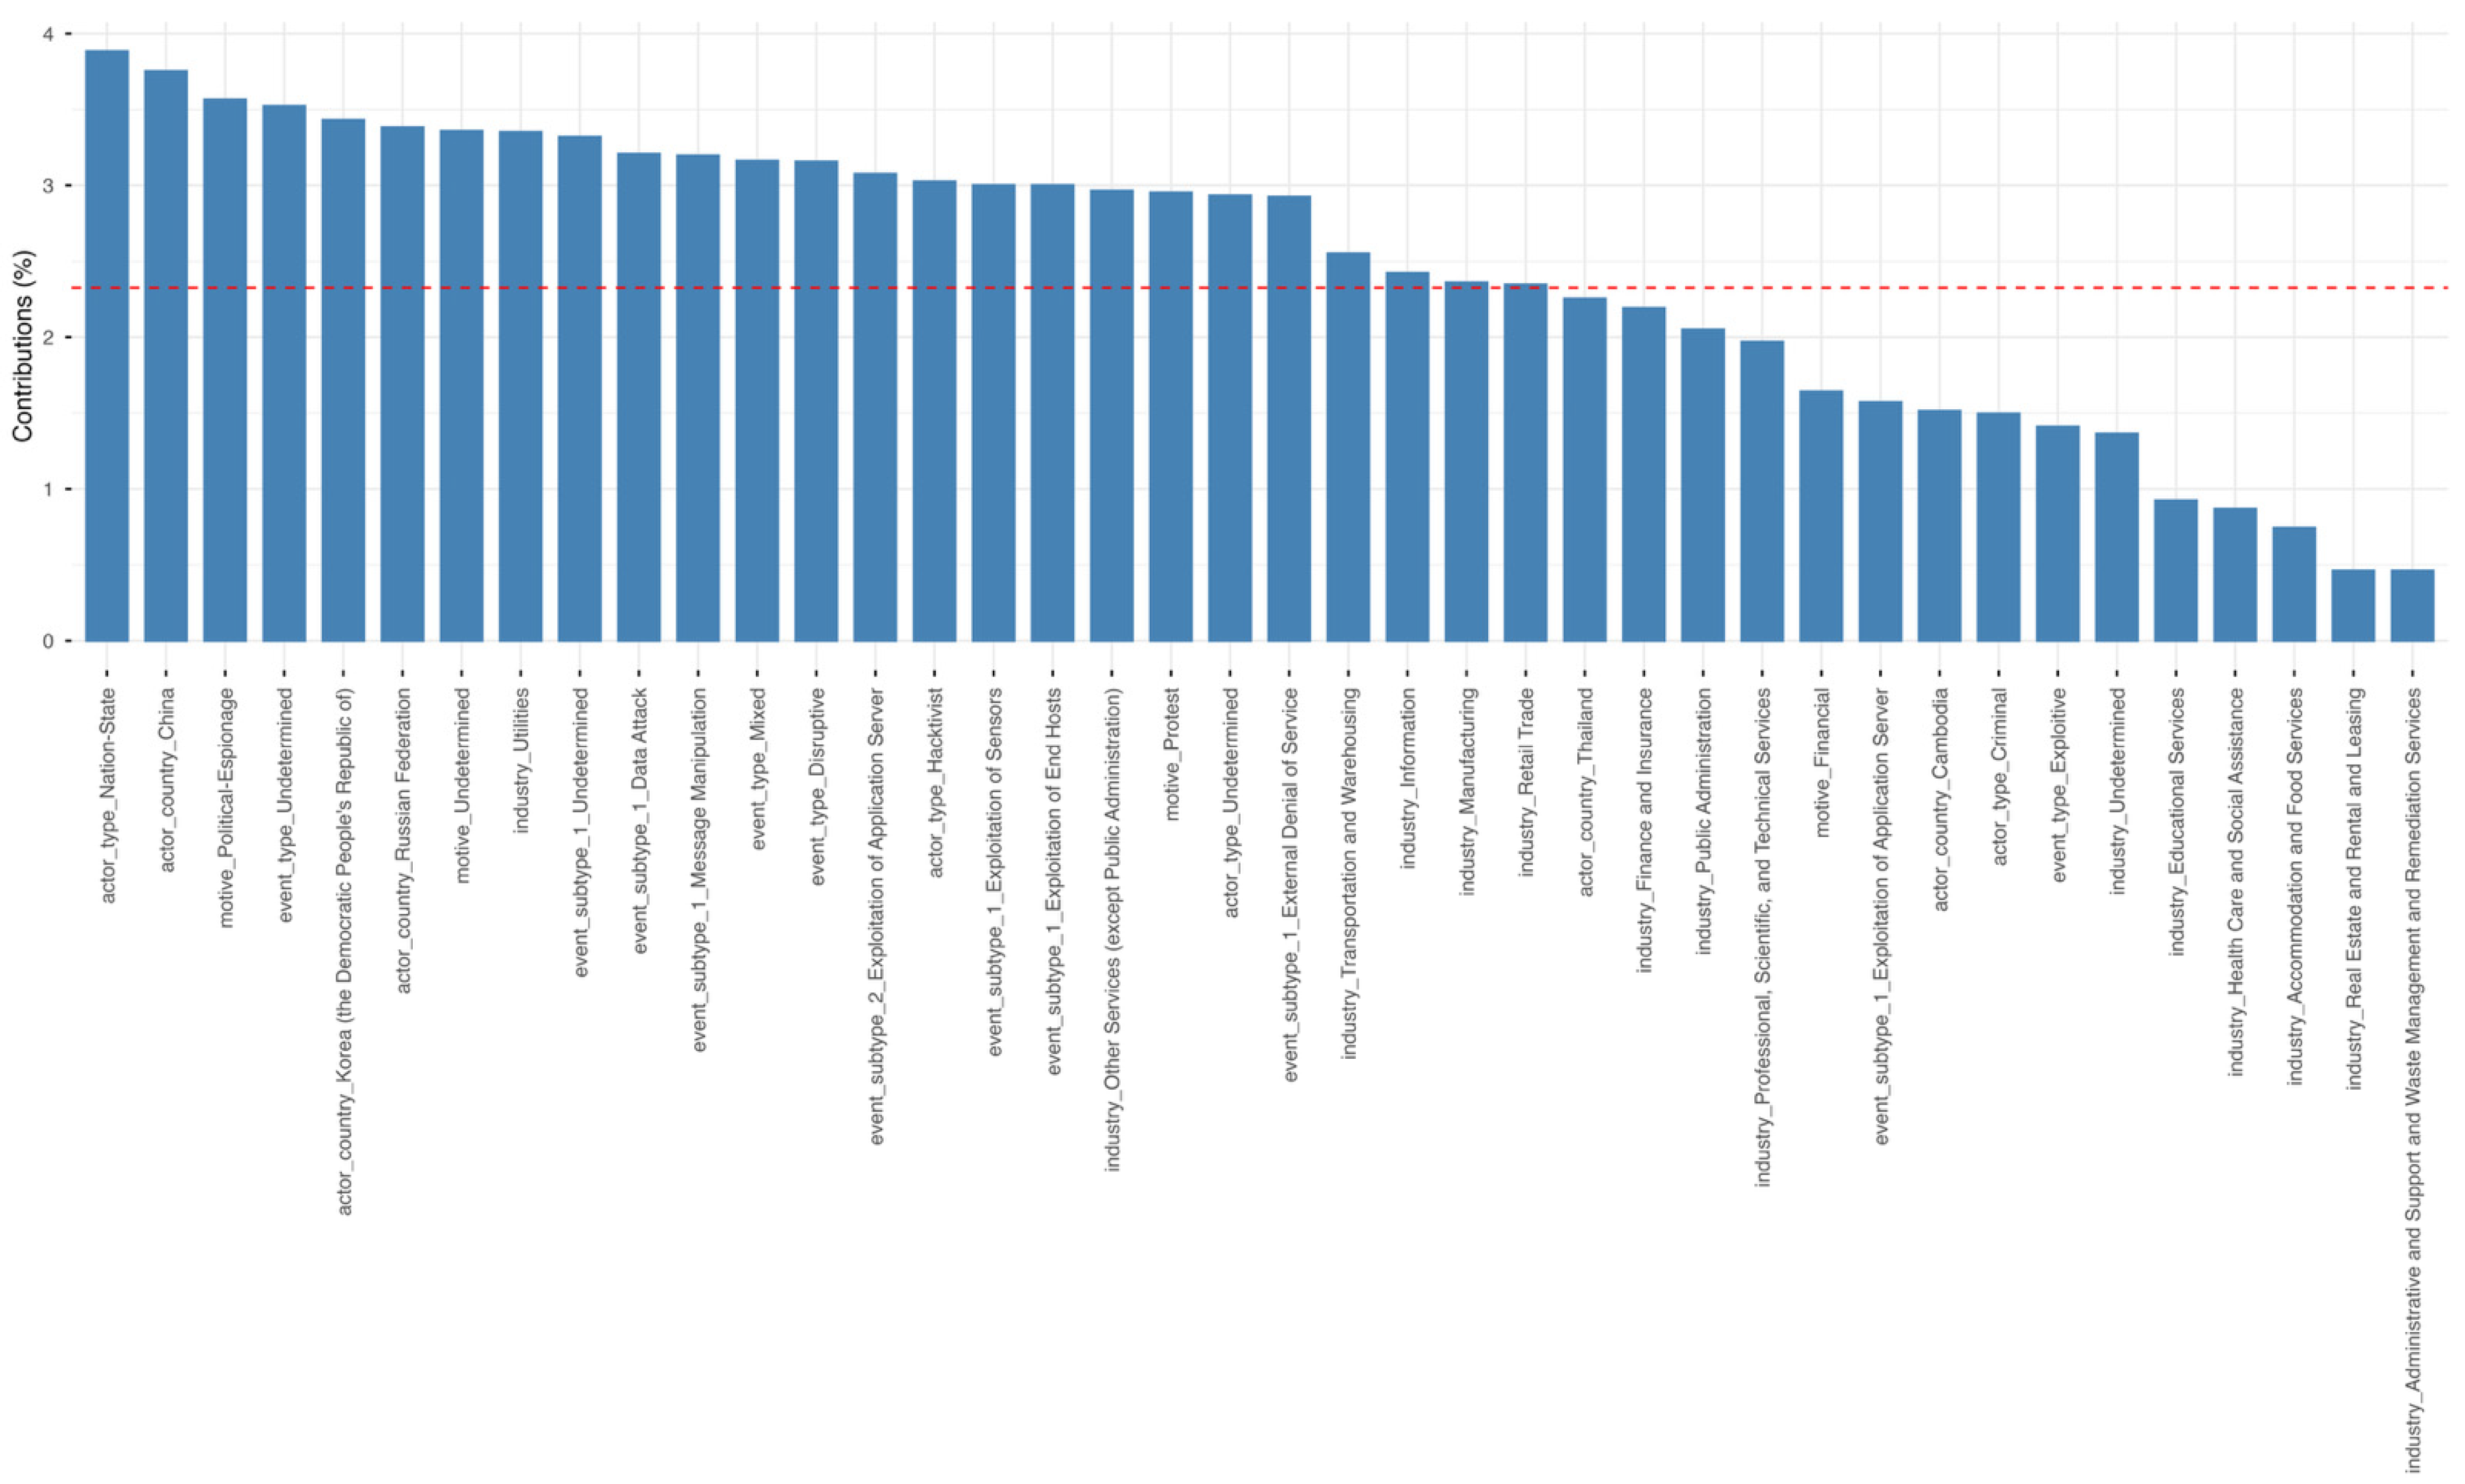
Additionally, the contribution plot (Figure A3) shows the variable categories that contribute most strongly to the first eleven MCA dimensions retained for clustering. Categories above the red dashed reference line contribute more than the average expected contribution and therefore play a stronger role in structuring the MCA space.
Figure A3. Contribution of retained dimensions (The red dashed line indicates the expected average contribution).
Jcp 06 00124 g0a3
Table A1. Overview of Variables.
VariableType of
Variable
LevelsNumber of Sparse (Singleton) CategoriesSparse (Singleton) CategoriesNumber of Categories 2 or LessCategories 2 or Less
YearSupplementary111201922017; 2019
ActorDescriptive
Actor CountryActive63Cambodia; Korea (the Democratic People’s Republic of); Russian Federation3Cambodia; Korea (the Democratic People’s Republic of); Russian Federation
Actor TypeActive4000
OrganisationDescriptive
Industry NameActive16307Administrative and Support and Waste Management and Remediation Services; Educational Services; Manufacturing; Professional, Scientific, and Technical Services; Real Estate and Rental and Leasing; Transportation and Warehousing; Wholesale Trade
MotiveActive4000
Event TypeActive4001Undetermined
Event Sub-Type 1Active7003Exploitation of End Hosts; Exploitation of Sensors; Message Manipulation
Event Sub-Type 2Active2000
Figure A4. Clustering of Cyberattacks (Labelled by Target Organisation).
Jcp 06 00124 g0a4
Figure A5. Clustering of Cyberattacks (Labelled by Responsible Actor).
Jcp 06 00124 g0a5
Table A2. Cardinality Summary.
VariableNumber of Unique CategoriesTotal Number of ObservationsPercent Unique
Year117814.10
Actor297837.18
Actor Country6787.69
Actor Type4785.13
Organisation777898.72
Industry Name167820.51
Motive4785.13
Event Type4785.13
Event Sub-Type 17788.97
Event Sub-Type 22782.56
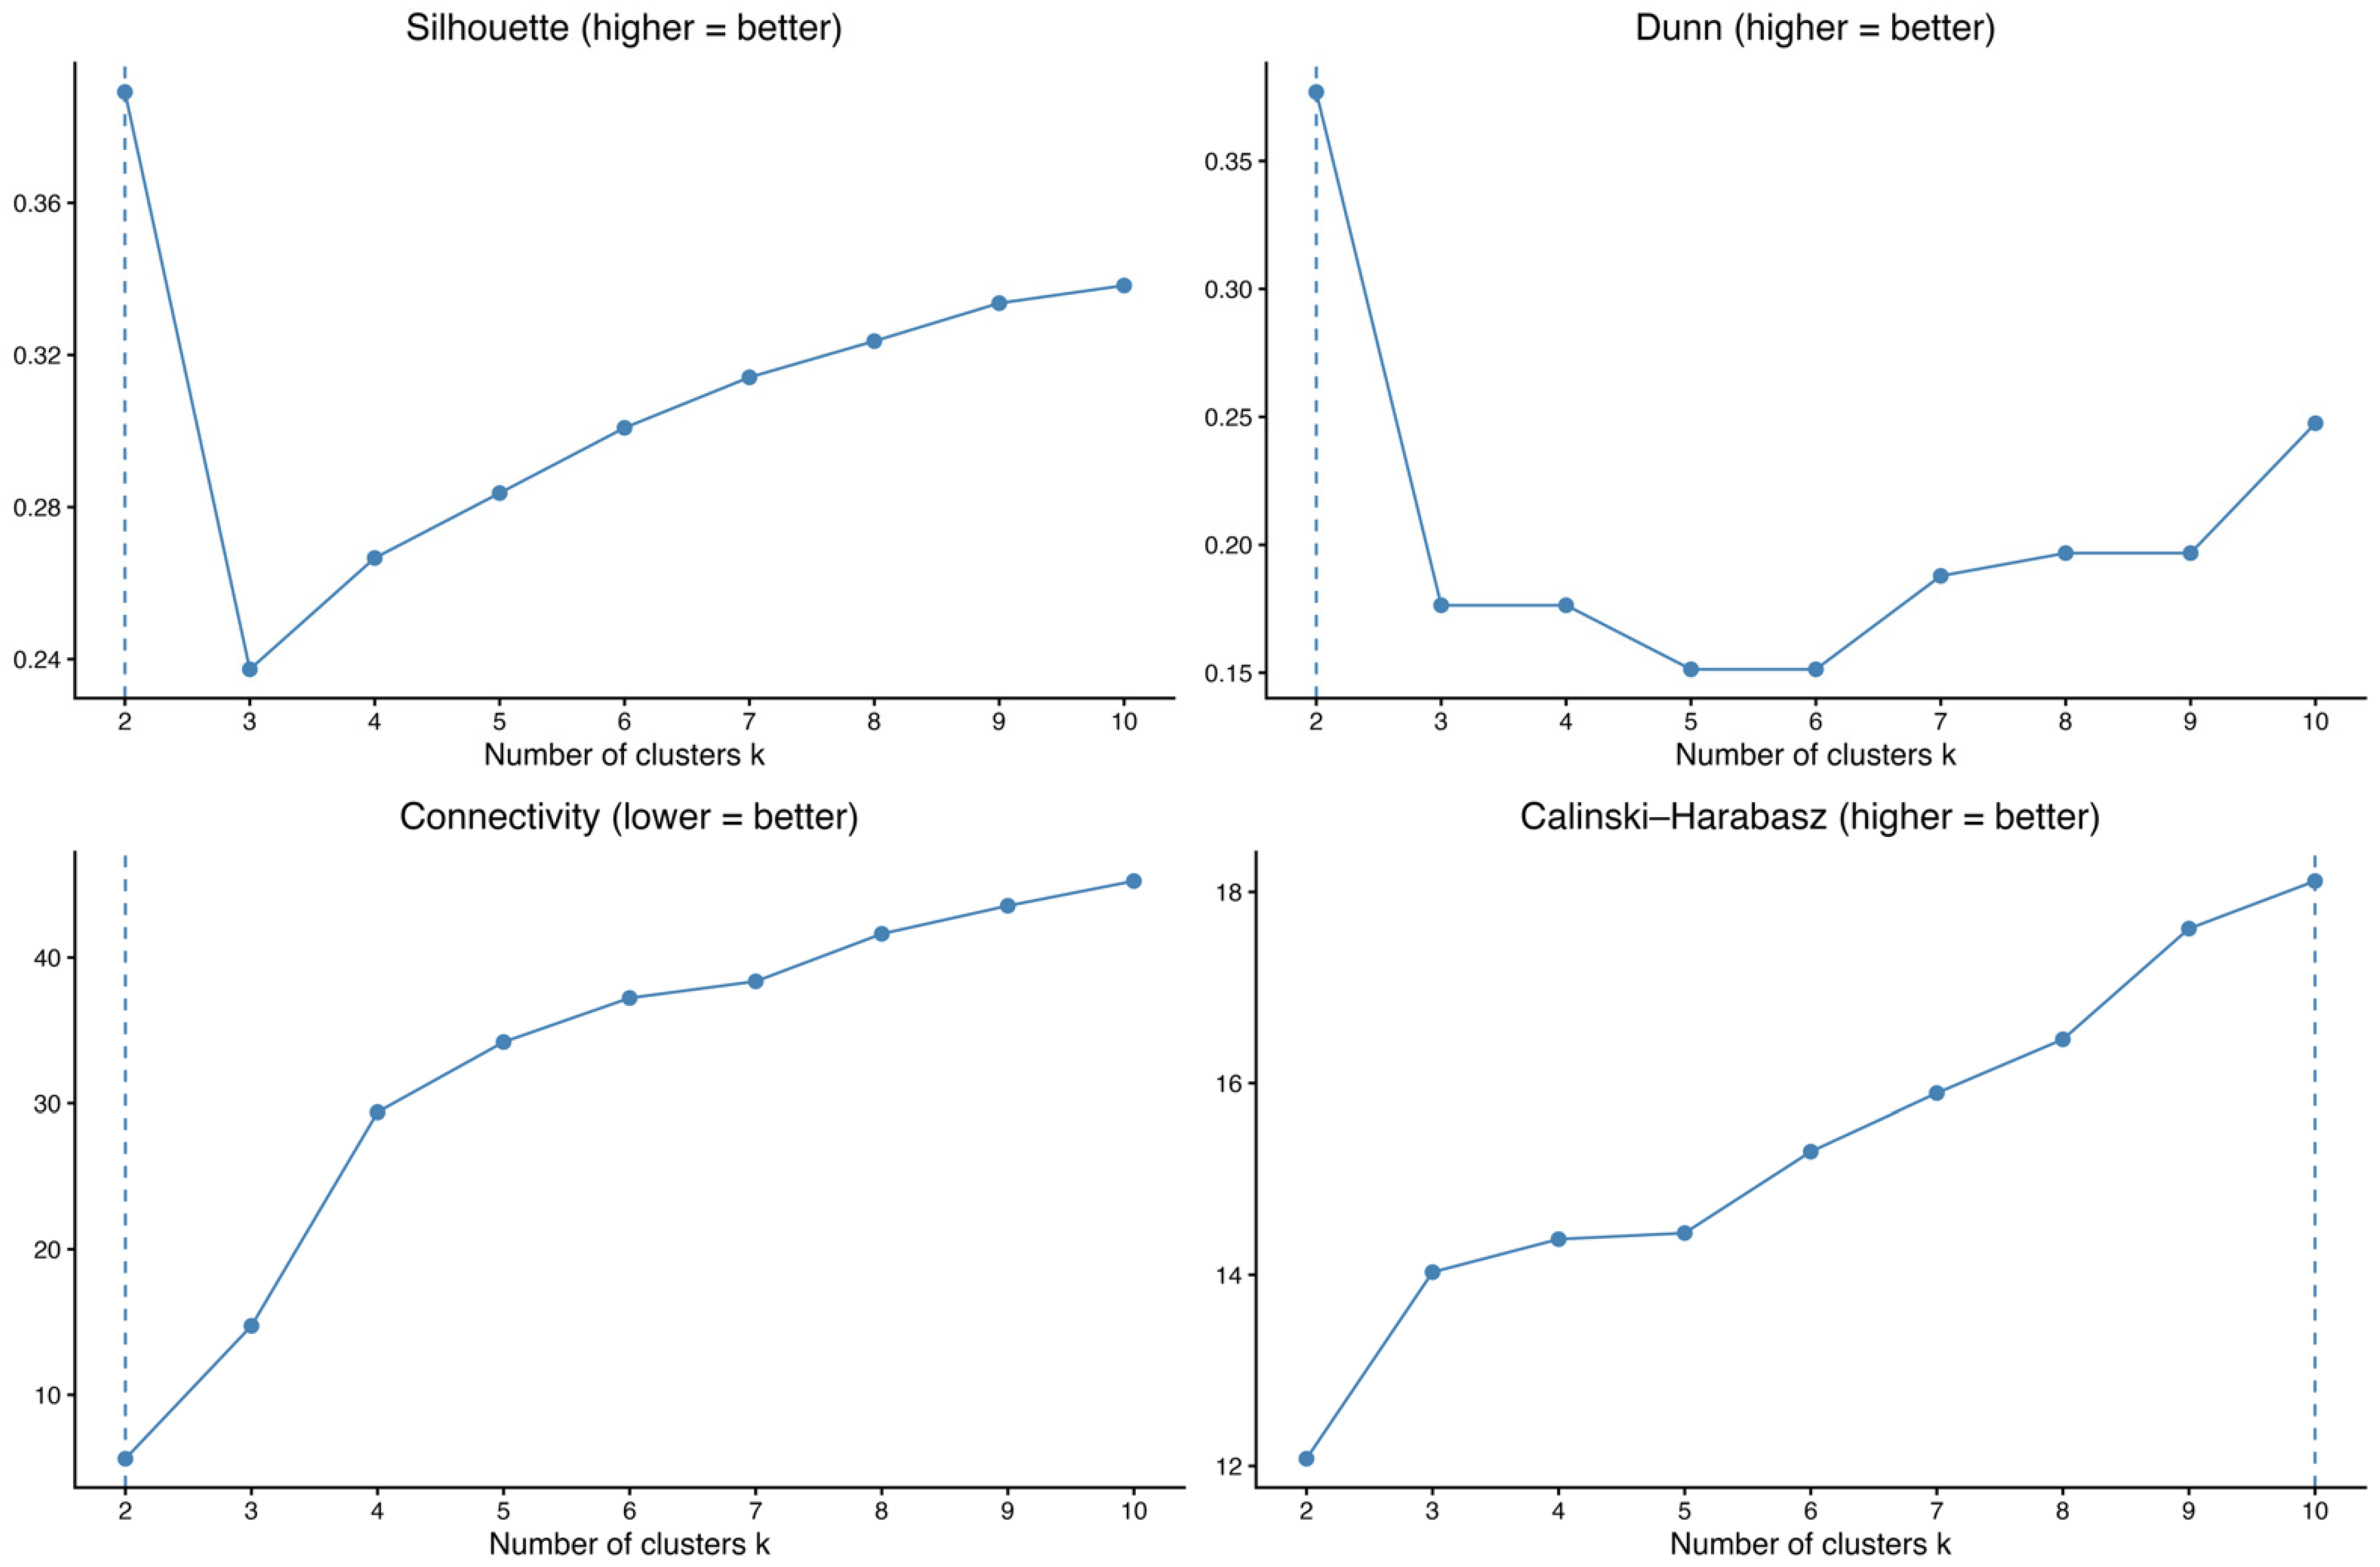
Using NbClust [package version 3.0.1] (Ward + Euclidean; k = 2–10), the majority of internal indices selected 3 clusters as the optimal solution; alternative indices suggested 2 clusters, but k = 3 was preferred as the most consistently supported partition across criteria.
Figure A6. Internal Validation Measures (Solid blue line indicates the diagnostic metric based on number of clusters; Blue dashed line indicates the preferred k based on diagnostic metrics).
Jcp 06 00124 g0a6
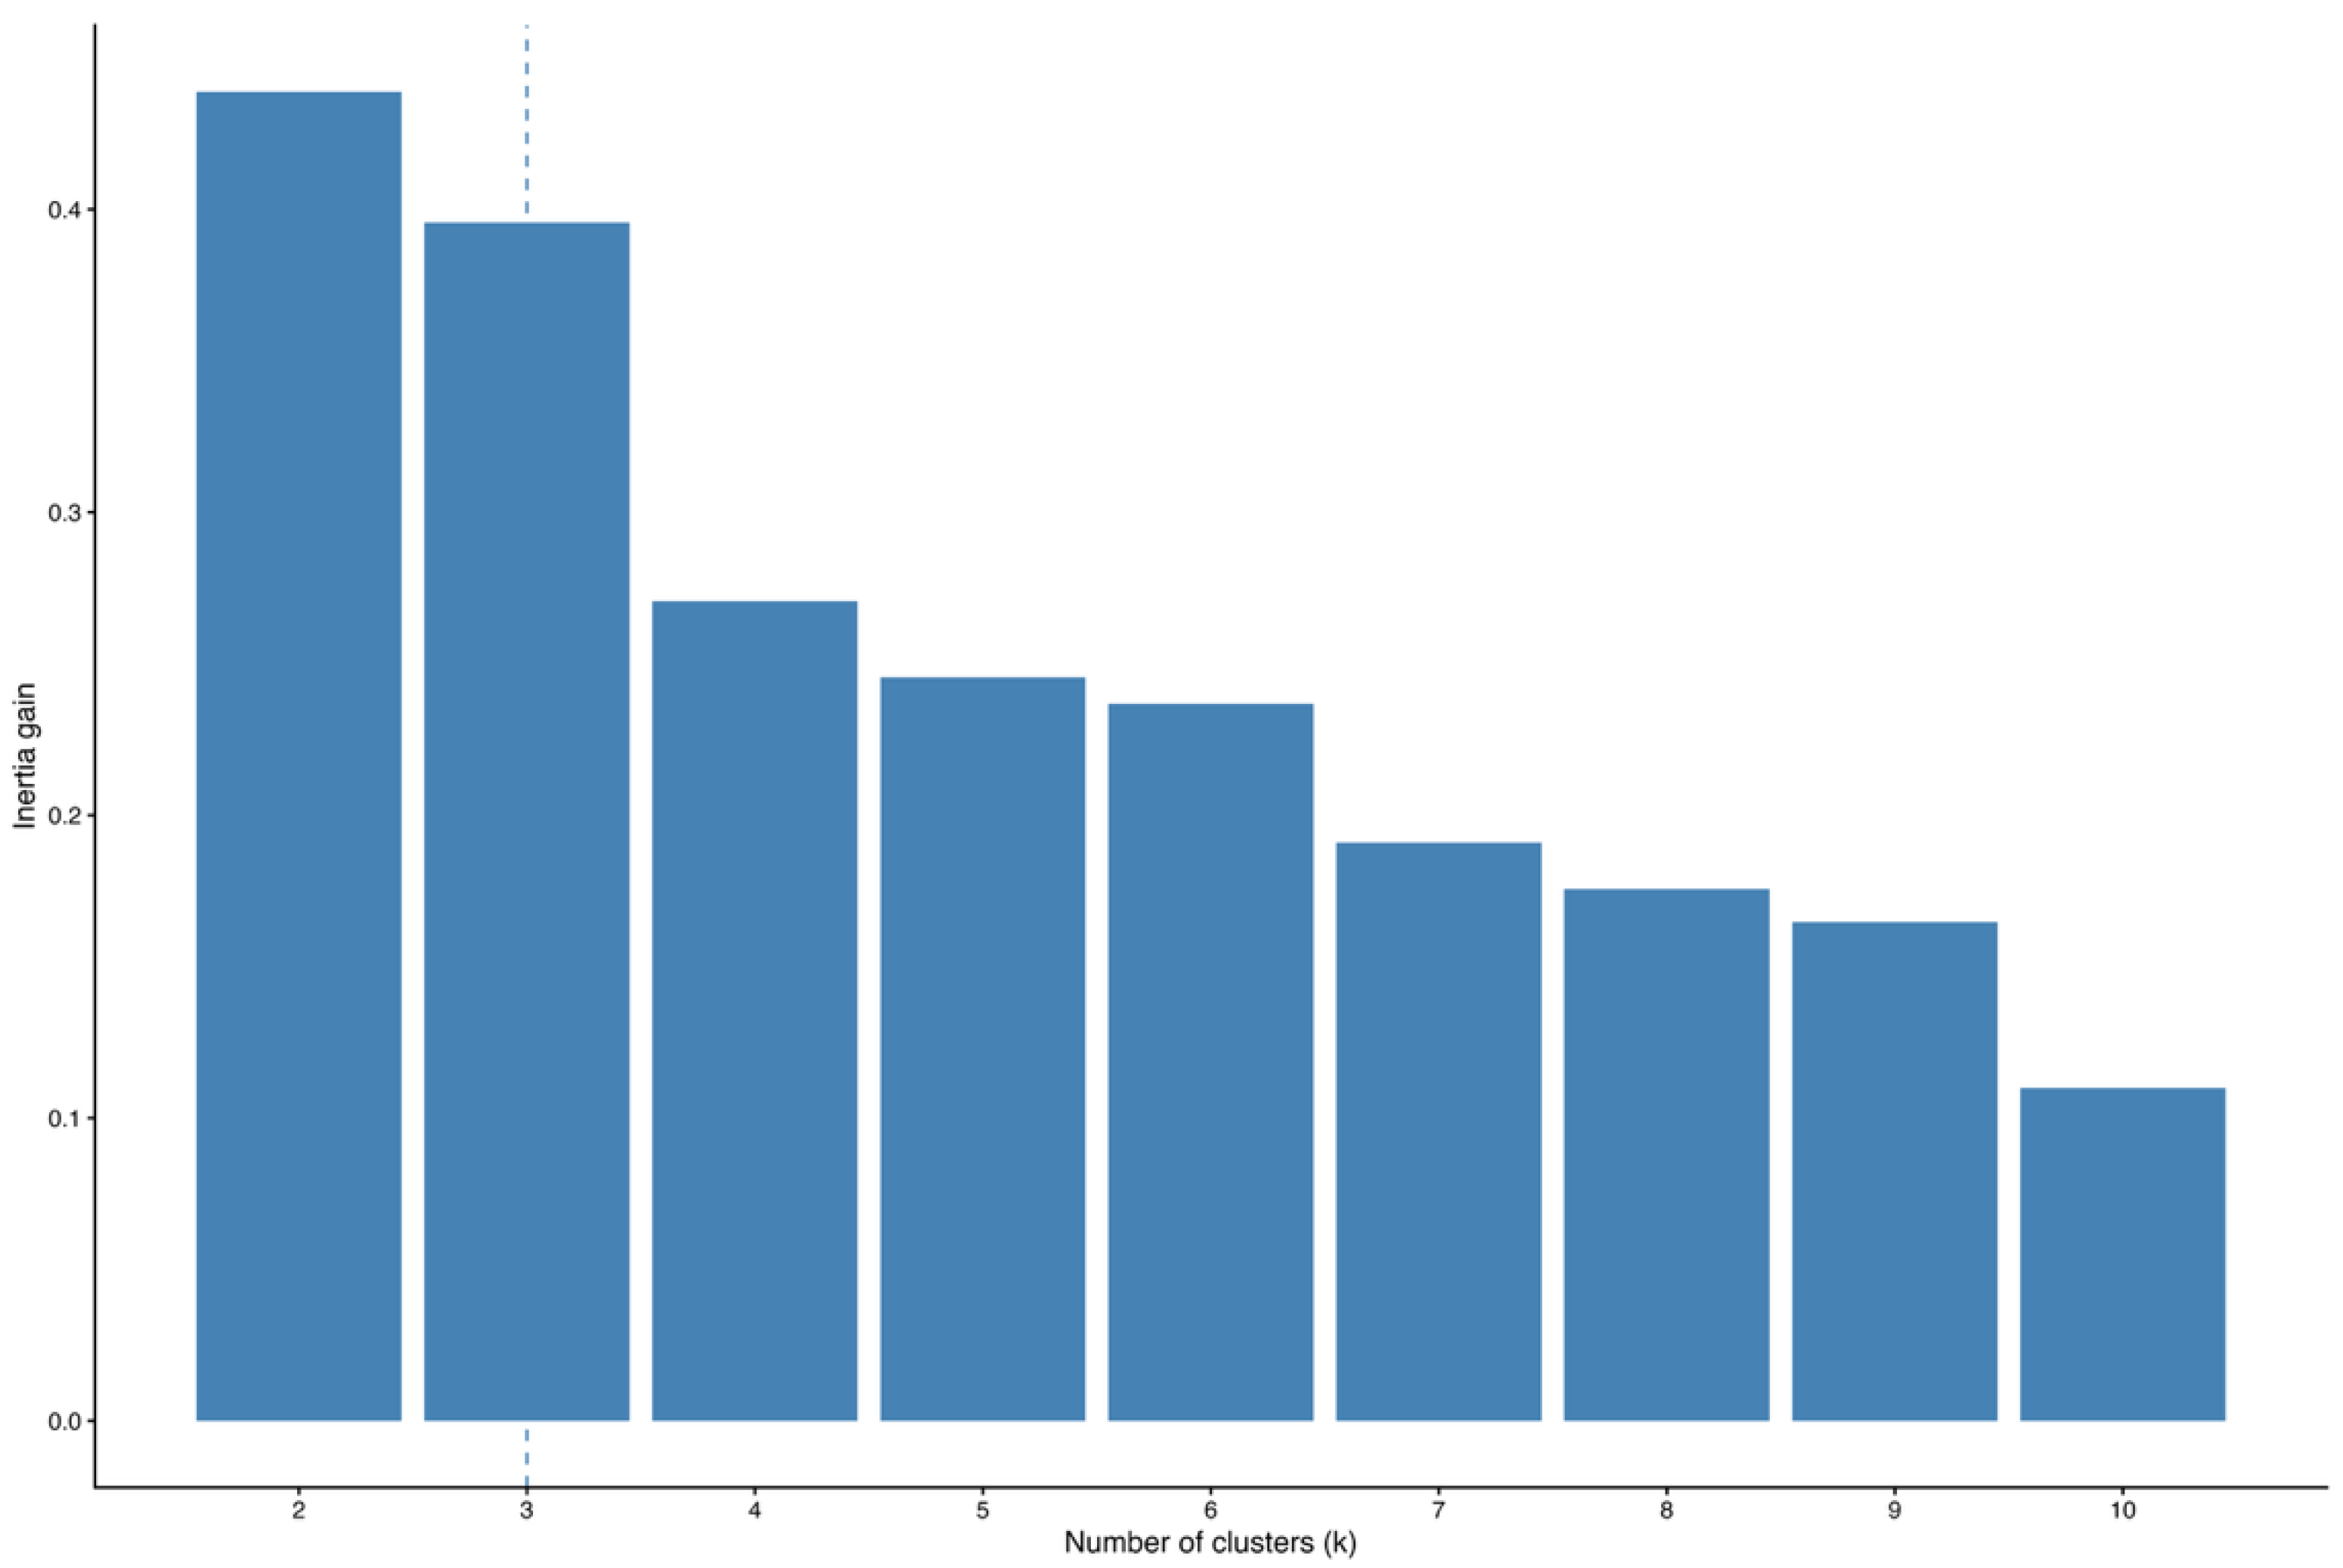
The number of clusters was first assessed using HCPC’s inertia-gain criterion. The number of clusters was selected using the HCPC procedure in FactoMineR (package version 2.13). HCPC first constructs a hierarchical tree and then calculates the within-cluster inertia for each possible partition; the suggested partition corresponds to the highest relative loss of inertia [59,60,61]. In the present analysis, HCPC suggested a three-cluster solution. The relative inertia quotient was lowest at k = 3 (W3/W2 = 0.857), indicating the largest relative reduction in within-cluster inertia among the evaluated early partitions. This is consistent with the absolute inertia-gain sequence, where the gain remains high when moving from two to three clusters but drops substantially when moving from three to four clusters. This indicates that splitting the data into additional clusters yields only marginal reductions in within-cluster differences, so extra clusters mainly subdivide existing groups rather than revealing a new, well-separated type.
To assess the robustness of the cluster solution, we calculated internal validation indices for k = 2 to k = 10 using NbClust. The results did not identify a single dominant solution: seven indices recommended k = 2, seven recommended k = 3, four recommended k = 9, and six recommended k = 10. Although NbClust’s majority rule selected k = 2, the index-level results show that k = 3 received equivalent support. Combined with HCPC’s inertia-based recommendation of three clusters, this suggests that the main empirical choice is between a more parsimonious two-cluster solution and a more substantively differentiated three-cluster solution. Furthermore, inspection of the cluster solution supports k = 3: a two-cluster partition would collapse the financially motivated cybercrime and hacktivist/protest patterns into a single group, blurring substantively distinct profiles. Accordingly, combining the internal validation results with interpretability considerations, we retain three clusters as the preferred solution.
Figure A7. HCPC Inertia Gain (Blue dashed line indicated the preferred k based on inertia gain).
Jcp 06 00124 g0a7
Figure A8. Cumulative Inertia and Eigenvalue Plot without Industry Variable.
Jcp 06 00124 g0a8
The sensitivity analysis excluding industry does not indicate that the high-cardinality variable is the primary source of instability. After removing industry, the three-cluster solution still contains one stable cluster, while the remaining two clusters remain unstable. The mean Jaccard value for Cluster 1 changes only slightly, from 0.773 to 0.759, while Cluster 2 declines from 0.529 to 0.441 and Cluster 3 remains virtually unchanged at approximately 0.323. Therefore, the instability of the smaller clusters appears not to be driven solely by the inclusion of industry, but more likely by weak empirical separation among some cases and the limited size of the dataset.
Table A3. V-Tests of Categorical Variables for Each Cluster (Industry Variable as Supplementary Variable).
ClusterVariable/CategoryCla/ModMod/ClaGlobalp-ValueV-Test
1
(Hacktivism)
motive_Protest100.090.925.6<0.0018.3
actor_type_Hacktivist100.086.424.4<0.0017.9
year_2016100.054.515.4<0.0015.7
industry_Public Administration66.781.834.6<0.0015.3
event_subtype_1_External Denial of Service100.040.911.5<0.0014.7
event_type_Disruptive80.036.412.8<0.0013.5
industry_Finance and Insurance0.00.011.50.042−2.0
year_20246.74.519.20.037−2.1
event_subtype_1_Data Attack0.00.016.70.009−2.6
year_20220.00.016.70.009−2.6
motive_Financial0.00.056.4<0.001−6.6
actor_type_Criminal0.00.061.5<0.001−7.3
2
(Financial Crime)
actor_type_Criminal100.094.161.5<0.0018.6
motive_Financial100.086.356.4<0.0017.8
actor_country_Undetermined73.196.185.90.0013.3
event_subtype_1_Data Attack100.025.516.70.0023.1
industry_Finance and Insurance100.017.611.50.0172.4
year_202292.323.516.70.0242.3
year_2023100.013.79.00.0442.0
motive_Political-Espionage16.72.07.70.018−2.4
actor_type_Nation-State16.72.07.70.018−2.4
actor_country_Thailand0.00.05.10.012−2.5
actor_country_China0.00.05.10.012−2.5
event_type_Disruptive20.03.912.80.003−3.0
event_subtype_1_External Denial of Service0.00.011.5<0.001−4.2
year_20160.00.015.4<0.001−5.1
industry_Public Administration22.211.834.6<0.001−5.8
actor_type_Hacktivist0.00.024.4<0.001−7.0
motive_Protest0.00.025.6<0.001−7.2
3
(Political Espionage)
motive_Political-Espionage83.3100.07.7<0.0015.1
actor_type_Nation-State83.3100.07.7<0.0015.1
actor_country_China100.080.05.1<0.0014.6
event_subtype_1_Exploitation of End Hosts100.040.02.60.0032.9
motive_Financial0.00.056.40.013−2.5
actor_type_Criminal0.00.061.50.007−2.7
actor_country_Undetermined0.00.085.9<0.001−4.2
Note: ‘Cla/Mod’ indicates the percentage of all observations with a given category that fall into the cluster, meaning how strongly that category is concentrated in the cluster. ‘Mod/Cla’ indicates the percentage of observations within the cluster that have that category, meaning how common or dominant that category is within the cluster. The high share of “Undetermined” actor-country cases in Cluster 1 limits geographical and geopolitical inference. The interpretation of this cluster therefore relies primarily on actor type, motive, and incident characteristics rather than actor-country attribution.
Figure A9. Clustering Results without Industry.
Jcp 06 00124 g0a9
Table A4. Bootstrap Results without Industry Variable.
kClusterMean JaccardTimes
Dissolved
Times
Recovered
StabilityDissolution RateRecovery Rate
2Cluster 10.69037758121,098Pattern present, but membership uncertain0.005810.21098
Cluster 20.40739877,1953127Unstable0.771950.03127
3Cluster 10.758887127754,046Stable0.012770.54046
Cluster 20.44093665,1562884Unstable0.651560.02884
Cluster 30.32379476,00423,363Unstable0.760040.23363

References

  1. Raksereepitak, Y.; Tantayakul, S. Thai Army and Cybersecurity Policy for Non-Traditional Threats (Thai) [บทบาท ของ กองทัพ กับ นโยบาย รักษา ความ มั่นคง ปลอดภัย ไซเบอร์ เพื่อ ป้องกัน ภัย คุกคาม รูป แบบ ใหม่]. วารสาร รามคำแหง ฉบับ รัฐประศาสนศาสตร์ [Ramkhamhaeng J. Public Adm.] 2025, 5, 461–481. [Google Scholar]
  2. Manantan, M.B. Cyber ASEAN: Advancing Cyber Resiliency and Capacity in Southeast Asia. In The Palgrave Handbook on Cyber Diplomacy; Christou, G., Vosse, W., Burton, J., Koops, J.A., Eds.; Springer Nature: Cham, Switzerland, 2025; pp. 905–925. ISBN 978-3-031-93384-4. [Google Scholar]
  3. Ramadhan, I. ASEAN-China Cybersecurity Cooperation: Challenges and Opportunities. J. Soc. Political Sci. 2023, 6, 1–10. [Google Scholar] [CrossRef] [Scilit]
  4. Taeratanachai, C.; Wiriyakitjar, R. Cybersecurity Analysis in Thailand: Trends, Challenges, and Policy Insights from Case Studies of SMEs, Mobile Banking, and Port Infrastructure. Natl. Def. Stud. Inst. J. 2025, 16, 43–61. [Google Scholar]
  5. Tay, K.L. ASEAN Cyber-Security Cooperation: Towards a Regional Emergency-Response Framework; The International Institute for Strategic Studies: London, UK, 2023. Available online: https://www.iiss.org/research-paper/2023/06/asean-cyber-security-cooperation-towards-a-regional-emergency-response-framework/ (accessed on 18 March 2026).
  6. National Institute of Standards and Technology. The NIST Cybersecurity Framework (CSF) 2.0; National Institute of Standards and Technology: Gaithersburg, MD, USA, 2024. [Google Scholar] [CrossRef] [Scilit]
  7. European Union. Directive (EU) 2022/2555 of the European Parliament and of the Council of 14 December 2022 on Measures for a High Common Level of Cybersecurity across the Union, Amending Regulation (EU) No 910/2014 and Directive (EU) 2018/1972, and Repealing Directive (EU) 2016/1148 (NIS 2 Directive). 2022. Available online: https://www.nis-2-directive.com/NIS_2_Directive_Article_21.html (accessed on 7 June 2026).
  8. Rea-Guaman, A.M.; San Feliu, T.; Calvo-Manzano, J.A.; Sánchez-García, I.D. Systematic Review: Cybersecurity Risk Taxonomy. In Proceedings of the International Conference on Software Process Improvement; Springer: Berlin/Heidelberg, Germany, 2017; pp. 137–146. [Google Scholar]
  9. Rabitti, G.; Khorrami Chokami, A.; Coyle, P.; Cohen, R.D. A Taxonomy of Cyber Risk Taxonomies. Risk Anal. 2025, 45, 376–386. [Google Scholar] [CrossRef] [Scilit] [PubMed]
  10. Choo, K.-K.R. Organised Crime Groups in Cyberspace: A Typology. Trends Organ. Crime 2008, 11, 270–295. [Google Scholar] [CrossRef] [Scilit]
  11. Leukfeldt, E.R.; Kleemans, E.R.; Stol, W.P. A Typology of Cybercriminal Networks: From Low-Tech All-Rounders to High-Tech Specialists. Crime Law Soc. Chang. 2017, 67, 21–37. [Google Scholar] [CrossRef] [Scilit]
  12. Cohen, L.E.; Felson, M. Social Change and Crime Rate Trends: A Routine Activity Approach. Am. Sociol. Rev. 1979, 44, 588. [Google Scholar] [CrossRef] [Scilit] [PubMed]
  13. Harry, C.; Gallagher, N.W. Categorizing Cyber Effects. In The Elgar Companion to Digital Transformation, Artificial Intelligence and Innovation in the Economy, Society and Democracy; Carayannis, E., Grigoroudis, E., Campbell, D., Katsikas, S., Eds.; Edward Elgar Publishing: Cheltenham, UK, 2023; pp. 7–31. ISBN 978-1-83910-936-2. [Google Scholar]
  14. Harry, C.; Gallagher, N. Classifying Cyber Events. J. Inf. Warf. 2018, 17, 17–31. [Google Scholar]
  15. Harry, C.; Gallagher, N. Cyber Events Database (Version Date 2026-02-18). Available online: https://cissm.umd.edu/cyber-events-database (accessed on 25 February 2026).
  16. Gandhi, R.; Sharma, A.; Mahoney, W.; Sousan, W.; Zhu, Q.; Laplante, P. Dimensions of Cyber-Attacks: Cultural, Social, Economic, and Political. IEEE Technol. Soc. Mag. 2011, 30, 28–38. [Google Scholar] [CrossRef] [Scilit]
  17. González-Manzano, L.; De Fuentes, J.M.; Ramos, C.; Sánchez, Á.; Quispe, F. Identifying Key Relationships Between Nation-State Cyberattacks and Geopolitical and Economic Factors: A Model. Secur. Commun. Netw. 2022, 2022, 1–11. [Google Scholar] [CrossRef] [Scilit]
  18. Alcaide, J.I.; Llave, R.G. Critical Infrastructures Cybersecurity and the Maritime Sector. Transp. Res. Procedia 2020, 45, 547–554. [Google Scholar] [CrossRef] [Scilit]
  19. Farahbod, K.; Shayo, C.; Varzandeh, J. Cybersecurity Indices and Cybercrime Annual Loss and Economic Impacts. J. Bus. Behav. Sci. 2020, 32, 63–71. [Google Scholar]
  20. Grant Thornton. The Economic Cost of Cybercrime; Grant Thornton: Dublin, Ireland, 2021. [Google Scholar]
  21. Bruce, M.; Lusthaus, J.; Kashyap, R.; Phair, N.; Varese, F. Mapping the Global Geography of Cybercrime with the World Cybercrime Index. PLoS ONE 2024, 19, e0297312. [Google Scholar] [CrossRef] [Scilit] [PubMed]
  22. Dixon Analyzing Cyberattacks in the Maritime Domain Using Hierarchical Clustering and Descriptive Statistics. J. Territ. Marit. Stud. 2025, 12, 7–33. [CrossRef] [Scilit]
  23. Finlay, L.; Payne, C. The Attribution Problem and Cyber Armed Attacks. AJIL Unbound 2019, 113, 202–206. [Google Scholar] [CrossRef] [Scilit]
  24. Richey, M. Cyber Offence Dominance, Regional Dynamics, and Middle Power–Led International Cooperation. In Cybersecurity Policy in the EU and South Korea from Consultation to Action: Theoretical and Comparative Perspectives; Boulet, G., Reiterer, M., Pardo, R.P., Eds.; New Security Challenges; Springer International Publishing: Cham, Switzerland, 2022; ISBN 978-3-031-08383-9. [Google Scholar]
  25. Rid, T.; Buchanan, B. Attributing Cyber Attacks. J. Strateg. Stud. 2015, 38, 4–37. [Google Scholar] [CrossRef] [Scilit]
  26. Chen, S.; Hao, M.; Ding, F.; Jiang, D.; Dong, J.; Zhang, S.; Guo, Q.; Gao, C. Exploring the Global Geography of Cybercrime and Its Driving Forces. Humanit. Soc. Sci. Commun. 2023, 10, 71. [Google Scholar] [CrossRef] [Scilit] [PubMed]
  27. Kshetri, N. Diffusion and Effects of Cyber-Crime in Developing Economies. Third World Q. 2010, 31, 1057–1079. [Google Scholar] [CrossRef] [Scilit]
  28. Kumar, S.; Carley, K.M. Approaches to Understanding the Motivations Behind Cyber Attacks. In Proceedings of the 2016 IEEE Conference on Intelligence and Security Informatics (ISI); IEEE: Tucson, AZ, USA, 2016; pp. 307–309. [Google Scholar]
  29. Srivastava, S.K.; Das, S.; Udo, G.J.; Bagchi, K. Determinants of Cybercrime Originating within a Nation: A Cross-Country Study. J. Glob. Inf. Technol. Manag. 2020, 23, 112–137. [Google Scholar] [CrossRef] [Scilit]
  30. Hunter, L.Y.; Albert, C.D.; Garrett, E. Factors That Motivate State-Sponsored Cyberattacks. Cyber Def. Rev. 2021, 6, 111–128. [Google Scholar]
  31. Office of the National Security Council Thailand. National Security Policy and Plan B.E. 2566–2570 (2023–2027) 2022. Available online: https://www.nsc.go.th/wp-content/uploads/2023/09/ExecutiveSummaryEN.pdf (accessed on 24 February 2026).
  32. Mongkolnchaiarunya, J. The Trouble with Thailand’s New Cyber Approach. The Diplomat. 2016. Available online: https://thediplomat.com/2016/08/the-trouble-with-thailands-new-cyber-approach/ (accessed on 24 February 2026).
  33. Limna, P.; Kraiwanit, T.; Siripipattanakul, S. The Relationship between Cyber Security Knowledge, Awareness and Behavioural Choice Protection among Mobile Banking Users in Thailand. Int. J. Comput. Sci. Res. 2023, 7, 1133–1151. [Google Scholar] [CrossRef] [Scilit]
  34. Sriyai, S. Analysis of Cyber Attacks in Southeast Asia: Strategic Dynamics, Policy Gaps, and Recommendations. ISEAS Perspective. 2025. Available online: https://www.iseas.edu.sg/wp-content/uploads/2025/11/ISEAS_Perspective_2025_104.pdf (accessed on 18 March 2026).
  35. Pimple, K.D. Routine Activity Theory and Research Ethics: A Criminological Approach; Colorado State University Libraries: Fort Collins, CO, USA, 2016. [Google Scholar]
  36. Leukfeldt, E.R.; Yar, M. Applying Routine Activity Theory to Cybercrime: A Theoretical and Empirical Analysis. Deviant Behav. 2016, 37, 263–280. [Google Scholar] [CrossRef] [Scilit]
  37. Yar, M. The Novelty of ‘Cybercrime’: An Assessment in Light of Routine Activity Theory. Eur. J. Criminol. 2005, 2, 407–427. [Google Scholar] [CrossRef] [Scilit]
  38. Vakhitova, Z.I. Cyber-Routine Activity Theory. In Oxford Research Encyclopedia of Criminology and Criminal Justice; Pontell, H.N., Ed.; Oxford University Press: New York, NY, USA, 2025; ISBN 978-0-19-785140-1. [Google Scholar]
  39. Bossler, A.M.; Holt, T.J. On-Line Activities, Guardianship, and Malware Infection: An Examination of Routine Activities Theory. Int. J. Cyber Criminol. 2009, 3, 400–420. [Google Scholar]
  40. Boutemeur, J.; Lella, I.; Bakatsis, I.; Chatzichristos, G.; Foley, K.; Leskinen, J.; Otcenasek, J.; Ziolek, D. ENISA Threat Landscape 2025; European Union Agency for Cybersecurity (ENISA): Attiki, Greece, 2025; Available online: https://www.enisa.europa.eu/sites/default/files/2026-01/ENISA%20Threat%20Landscape%202025_v1.2.pdf (accessed on 2 March 2026).
  41. European Union Agency for Cybersecurity. ENISA Threat Landscape 2024: July 2023 to June 2024; Lella, I., Theocharidou, M., Magonara, E., Malatras, A., Naydenov, R.S., Ciobanu, C., Chatzichristos, G., Eds.; European Union Agency for Cybersecurity (ENISA): Luxembourg, 2024. [Google Scholar]
  42. Filho, D.B.F.; Rocha, E.C.D.; Júnior, J.A.D.S.; Paranhos, R.; Silva, M.B.D.; Duarte, B.S.F. Cluster Analysis for Political Scientists. Appl. Math. 2014, 05, 2408–2415. [Google Scholar] [CrossRef]
  43. Wolfson, M.; Madjd-Sadjadi, Z.; James, P. Identifying National Types: A Cluster Analysis of Politics, Economics, and Conflict. J. Peace Res. 2004, 41, 607–623. [Google Scholar] [CrossRef] [Scilit]
  44. Jang, J.; Hitchcock, D.B. Model-Based Cluster Analysis of Democracies. J. Data Sci. 2021, 10, 297–319. [Google Scholar] [CrossRef] [Scilit]
  45. Arbolino, R.; Carlucci, F.; Cirà, A.; Ioppolo, G.; Yigitcanlar, T. Efficiency of the EU Regulation on Greenhouse Gas Emissions in Italy: The Hierarchical Cluster Analysis Approach. Ecol. Indic. 2017, 81, 115–123. [Google Scholar] [CrossRef] [Scilit]
  46. Majcherek, D.; Hegerty, S.W.; Kowalski, A.M.; Lewandowska, M.S.; Dikova, D. Opportunities for Healthcare Digitalization in Europe: Comparative Analysis of Inequalities in Access to Medical Services. Health Policy 2024, 139, 104950. [Google Scholar] [CrossRef] [Scilit] [PubMed]
  47. Esnault, C.; Rollot, M.; Guilmin, P.; Zucker, J.-D. Qluster: An Easy-to-Implement Generic Workflow for Robust Clustering of Health Data. Front. Artif. Intell. 2023, 5, 1055294. [Google Scholar] [CrossRef] [Scilit] [PubMed]
  48. Berles, P.; Wölfer, J.; Alfieri, F.; Botton-Divet, L.; Guéry, J.-P.; Nyakatura, J.A. Linking Morphology, Performance, and Habitat Utilization: Adaptation Across Biologically Relevant ‘Levels’ in Tamarins. BMC Ecol. Evol. 2024, 24, 22. [Google Scholar] [CrossRef] [Scilit] [PubMed]
  49. Husson, F.; Josse, J.; Pages, J. Principal Component Methods-Hierarchical Clustering-Partitional Clustering: Why Would We Need to Choose for Visualizing Data. Tech. Rep.-Agrocampus. 2010. Available online: http://factominer.free.fr/more/HCPC_husson_josse.pdf (accessed on 2 March 2026).
  50. Watanabe, S. Strategic Analysis of Capacity Building for the Cyber Security of the United States in Asia. J. Asia Pac. Stud. 2020, 4, 100–111. [Google Scholar] [CrossRef] [Scilit]
  51. Tarrow, S.G. Power in Movement: Social Movements and Contentious Politics, 3rd ed.; Cambridge University Press: Cambridge, UK, 2011; ISBN 978-0-521-19890-5. [Google Scholar]
  52. Jaydn; Skidmore, M.; Medail, C. The Role of Social Media and Disruptive Technologies in Post-Coup Democracy Activism. In After the Coup: Myanmar’s Political and Humanitarian Crises; Ware, A., Skidmore, M., Eds.; ANU Press: Canberra, Australia, 2023; pp. 47–70. ISBN 978-1-76046-613-8. [Google Scholar]
  53. Brown, J.M.; Fazal, T.M. #SorryNotSorry: Why States Neither Confirm nor Deny Responsibility for Cyber Operations. Eur. J. Int. Secur. 2021, 6, 401–417. [Google Scholar] [CrossRef] [Scilit]
  54. Baram, G.; Sommer, U. Covert or Not Covert: National Strategies During Cyber Conflict. In Proceedings of the 2019 11th International Conference on Cyber Conflict (CyCon); IEEE: Tallinn, Estonia, 2019; pp. 1–16. [Google Scholar]
  55. Cirincione, G.H.; Verma, D. Federated Machine Learning for Multi-Domain Operations at the Tactical Edge. In Proceedings of the Artificial Intelligence and Machine Learning for Multi-Domain Operations Applications; Pham, T., Ed.; SPIE: Baltimore, MD, USA, 2019; p. 73. [Google Scholar]
  56. Lee, Y.; Park, T.; Lee, Y.; Gong, J.; Kang, J. Exploring Potential Prompt Injection Attacks in Federated Military LLMs and Their Mitigation. In Proceedings of the 2025 IEEE International Conference on Big Data (BigData), Macau, China, 8–11 December 2025. [Google Scholar]
  57. Sharma, S.; Guleria, K. A Federated Learning Mechanism for Preserving Security of Sensitive Data. In Proceedings of the 2023 4th International Conference on Data Analytics for Business and Industry (ICDABI); IEEE: Manama, Bahrain, 2023; pp. 1–5. [Google Scholar]
  58. Tanveer, F.; Iradat, F.; Iqbal, W.; Alsagri, H.S.; Alhakbani, H.A.A.; Ahmad, A.; Khan, F.A. Balancing Privacy and Performance in Healthcare: A Federated Learning Framework for Sensitive Data. Digit. Health 2025, 11, 20552076251381769. [Google Scholar] [CrossRef] [Scilit] [PubMed]
  59. Husson, F.; Josse, J. Multivariate Data Analysis: Special Focus on Clustering and Multiway Methods. Presented at useR, Gaithersburg, MD, USA, 21–23 July 2010; Available online: https://www.r-project.org/conferences/useR-2010/tutorials/Husson+Josse.pdf (accessed on 2 March 2026).
  60. Husson, F. Package ‘FactoMineR’: Multivariate Exploratory Data Analysis and Data Mining 2026, Version 2.13; CRAN: Vienna, Austria, 2026. Available online: https://cran.r-project.org/web/packages/FactoMineR/FactoMineR.pdf (accessed on 3 June 2026).
  61. Husson, F.; Le, S.; Pagès, J. Exploratory Multivariate Analysis by Example Using R, 2nd ed.; Chapman & Hall/CRC Computer Science and Data Analysis Series; CRC Press/Taylor & Francis Group: Boca Raton, FL, USA; London, UK; New York, NY, USA, 2017; ISBN 978-1-138-19634-6. [Google Scholar]
Figure 1. Analytical Framework.
Jcp 06 00124 g001
Figure 2. Country Source of Attack by Actor Type.
Jcp 06 00124 g002
Figure 3. Country Source of Attack by Motive Type.
Jcp 06 00124 g003
Figure 4. Number of Attacks by Industry.
Jcp 06 00124 g004
Figure 5. Clustering of Cyberattacks.
Jcp 06 00124 g005
Figure 6. Annual Counts of Cyber Incidents by Cluster.
Jcp 06 00124 g006
Table 1. Description of Variables.
VariableDefinition
Yearyear event occurred
Actororganisation or individual responsible for the event
Actor Countryactor’s location
Actor Typenature of the actor responsible for the event
Organisationtarget organisation whose networks were illicitly breached
Industry Namesector/industry of the target organisation
Motiveintended results sought by the actor committing the event
Event Typeprimary end effects of the event
Event Sub-Type 1 &
Event Sub-Type 2
detailed classification of the nature of an event based on the part of the target organisation’s IT infrastructure that was most seriously impacted, regardless of the tactics or techniques used to achieve the final result
Table 2. Chi-Square Test of Association of Variables.
VariableChi-Squaredfp-ValueAdjusted Cramer’s VMin ExpectedExpected Cells Below 5
Actor Country74.8310<0.0010.650.0616
Actor Type135.646<0.0010.920.328
Event Type17.9760.0090.280.138
Event Subtype 169.3712<0.0010.610.1317
Motive134.116<0.0010.920.387
Year57.9020<0.0010.500.0629
Industry48.53300.0360.350.0645
Event Subtype 21.1620.684<0.0010.454
Note: p-values were estimated using Monte Carlo simulation with 100,000 replications because all contingency tables contained expected cell counts below 5, and the minimum expected count was below 1 for each variable. Adjusted Cramer’s V is reported as a descriptive effect-size measure.
Table 3. V-Tests of Categorical Variables for Each Cluster.
ClusterVariable/CategoryCla/ModMod/ClaGlobalp-Valuev-Test
1
(Financial Crime)
actor_type_Criminal100.094.161.5<0.0018.6
motive_Financial100.086.356.4<0.0017.8
actor_country_Undetermined73.196.185.90.0013.3
event_subtype_1_Data Attack100.025.516.70.0023.1
industry_Finance and Insurance100.017.611.50.0172.4
year_202292.323.516.70.0242.3
year_2023100.013.79.00.0442.0
motive_Political-Espionage16.72.07.70.018−2.4
actor_type_Nation-State16.72.07.70.018−2.4
actor_country_Thailand0.00.05.10.012−2.5
actor_country_China0.00.05.10.012−2.5
event_type_Disruptive20.03.912.80.003−3.0
event_subtype_1_External Denial of Service0.00.011.5<0.001−4.2
year_20160.00.015.4<0.001−5.1
industry_Public Administration22.211.834.6<0.001−5.8
actor_type_Hacktivist0.00.024.4<0.001−7.0
motive_Protest0.00.025.6<0.001−7.2
2
(Hacktivism)
motive_Protest100.090.925.6<0.0018.3
actor_type_Hacktivist100.086.424.4<0.0017.9
year_2016100.054.515.4<0.0015.7
industry_Public Administration66.781.834.6<0.0015.3
event_subtype_1_External Denial of Service100.040.911.5<0.0014.7
event_type_Disruptive80.036.412.8<0.0013.5
industry_Finance and Insurance0.00.011.50.042−2.0
year_20246.74.519.20.037−2.1
event_subtype_1_Data Attack0.00.016.70.009−2.6
year_20220.00.016.70.009−2.6
motive_Financial0.00.056.4<0.001−6.6
actor_type_Criminal0.00.061.5<0.001−7.3
3
(Political Espionage)
motive_Political-Espionage83.3100.07.7<0.0015.1
actor_type_Nation-State83.3100.07.7<0.0015.1
actor_country_China100.080.05.1<0.0014.6
event_subtype_1_Exploitation of End Hosts100.040.02.60.0032.9
motive_Financial0.00.056.40.013−2.5
actor_type_Criminal0.00.061.50.007−2.7
actor_country_Undetermined0.00.085.9<0.001−4.2
Note: ‘Cla/Mod’ indicates the percentage of all observations with a given category that fall into the cluster, meaning how strongly that category is concentrated in the cluster. ‘Mod/Cla’ indicates the percentage of observations within the cluster that have that category, meaning how common or dominant that category is within the cluster. The high share of “Undetermined” actor-country cases in Cluster 1 limits geographical and geopolitical inference. The interpretation of this cluster therefore relies primarily on actor type, motive, and incident characteristics rather than actor-country attribution.
Table 4. Stability Check using Bootstrap.
kClusterMean JaccardTimes DissolvedTimes RecoveredStabilityDissolution RateRecovery Rate
2Cluster 10.8885088,899Highly stable0.00050.889
Cluster 20.31175,23717,750Unstable0.752370.178
3Cluster 10.77374965,122Stable0.007490.651
Cluster 20.52952,43539,661Unstable0.524350.397
Cluster 30.32378,8237395Unstable0.788230.074
Note: Cluster stability was assessed using bootstrap resampling with 100,000 replications. Mean Jaccard similarities of 0.85 or higher were treated as highly stable, values of 0.75–0.85 as stable, values of 0.60–0.75 as indicating a pattern with uncertain membership, and values below 0.60 as unstable. Dissolution and recovery rates refer to the proportion of bootstrap samples in which each cluster was dissolved or successfully recovered.
Disclaimer/Publisher’s Note: The statements, opinions and data contained in all publications are solely those of the individual author(s) and contributor(s) and not of MDPI and/or the editor(s). MDPI and/or the editor(s) disclaim responsibility for any injury to people or property resulting from any ideas, methods, instructions or products referred to in the content.