Article

Mapping Flood in Endorheic Depressions Using Multitemporal and Multiresolution Remote Sensing Data—Example of Chotts Merouane and Melrhir, Algeria


by
Jean-Paul Deroin
1,*,
Belkacem Boumaraf
2 and
Hacini Messaoud
3
1
UR 3795 GEGENA, Faculty of Science, Université de Reims Champagne Ardenne, 51100 Reims, France
2
Department of Agronomy, Faculty of Science, Université Mohamed Khider, Biskra 07000, Algeria
3
Laboratory of Geology of the Sahara, Université Kasdi Merbah, Ouargla 30000, Algeria
*
Author to whom correspondence should be addressed.
GeoHazards 2026, 7(2), 63; https://doi.org/10.3390/geohazards7020063 (registering DOI)
Submission received: 27 March 2026 / Revised: 24 May 2026 / Accepted: 28 May 2026 / Published: 29 May 2026

Abstract

Multisource remote sensing data is utilised for the purpose of monitoring annual and interannual changes associated with climate change in the water bodies of the Chotts of Merouane and Melrhir, which are located in the Zone of Chotts in North Africa. These endorheic depressions are distinguished by recurrent flooding events of varying magnitude and frequency, which are contingent on fluctuations in climate parameters. It has been determined that certain cities located within the surrounding watersheds, such as Biskra, are subject to the intermittent threat of severe flooding. This has been shown to result in land degradation and soil salinisation during the drying-up process. A detailed examination of chronological data from the 1960s onwards reveals a decline in the frequency of flooding in Chott Melrhir in recent years. It is noteworthy that the region has not experienced any substantial flooding since 2020. This phenomenon is concomitant with the marked decline in precipitation levels observed in the region. Since 1980, there have been at least ten significant floods, resulting in varying degrees of damage and disruption. In contrast, Chott Merouane exhibits a more consistent hydrological pattern, with water flowing almost year-round due to wastewater and the drainage of the palm groves by the Oued Righ. Until the 1970s, the occurrence of flooding in the region was exclusively attributable to the direct overflow of the Biskra River and its tributaries. However, from the 1980s onwards, a new type of flooding emerged, linked to insufficient infiltration and drainage capacity in the soil and sewage systems during rainfall that was sometimes considered normal. The hydrological regime in the area has severe ramifications for the water supply and the state of the oases, which are vulnerable to salinisation.

1. Introduction

Endorheic basins are found in arid and hyper-arid climates. The associated risks are elevated, particularly with regard to the potential for sudden and rapid flooding. This subject is seldom addressed, with the exception of instances in which a karstic setting is taken into consideration [1]. The Lake Eyre Basin, which includes much of the arid inland Australian landmass, is the largest modern endorheic system in the world [2]. Famous endorheic basins are located in Asia, including the Caspian Sea [3], Lake Urmia [4], the Aral Sea [5], and the Tarim Basin [6]. They are also common in South America, particularly in the Altiplano region [7]. Endorheic basins have also been observed in Africa, particularly around Lake Chad [8]. Our study focuses on North Africa, and more specifically on the Zone of Chotts, a geographical region stretching from the Gulf of Gabès in Tunisia to the Algerian Sahara. The endorheic nature of these basins results in the formation of temporary lakes, known as sabkha lakes (or chotts in Arabic countries), during periods of flooding [9]. In the case of large-scale depressions, water can be observed to feed internal seas. The relationship between these water bodies and groundwater in arid areas is not yet fully understood [10]. Furthermore, these regions are particularly vulnerable due to the salinisation of oases and cultivated areas [11,12]. The formation of a saline crust, which is subject to significant erosion due to the action of strong winds, has been demonstrated to induce health complications [13]. While saline pans are a well-known occurrence, this particular area has the potential to be conducive to mining activities, particularly in relation to lithium. This phenomenon is especially apparent in the Andean region of South America, where salt pans are designated as ‘salars’ [14]. In such environments, the occurrence of flash floods is frequent, with disastrous consequences for urban areas and agricultural regions. In the context of climate change, this phenomenon is further exacerbated by anthropogenic activities, as evidenced in Biskra in the Algerian part of the Zone of Chotts [15,16,17]. The isolated nature of such areas and the limited number of observatories and reliable field data make the use of remote sensing necessary. Remote sensing methods are particularly useful for surveying salted soils [18], mapping evaporites [19] or for any GIS approach [20]. Satellite data is often used in studies of flooding in arid regions. However, most published work shows that: the use of low-resolution satellite data, such as that from the TRMM, is common for assessing precipitation amounts [21,22]; DTMs are created using SRTM or ASTER GDEM data [23,24]; flood susceptibility maps are based on radar data [25] or a combination of optical and radar data [26,27,28]; models of runoff conceived for flood hazard mapping generally integrate remote sensing data [29,30]; when optical data (e.g., Landsat 7 or 8, Sentinel-2) are used, this is mainly for producing land cover maps [31,32,33]. Some papers investigate the relationship between reflectance and moisture content. For example, the Modified Normalised Difference Water Index (MNDWI) is used to distinguish between water bodies and land [7].
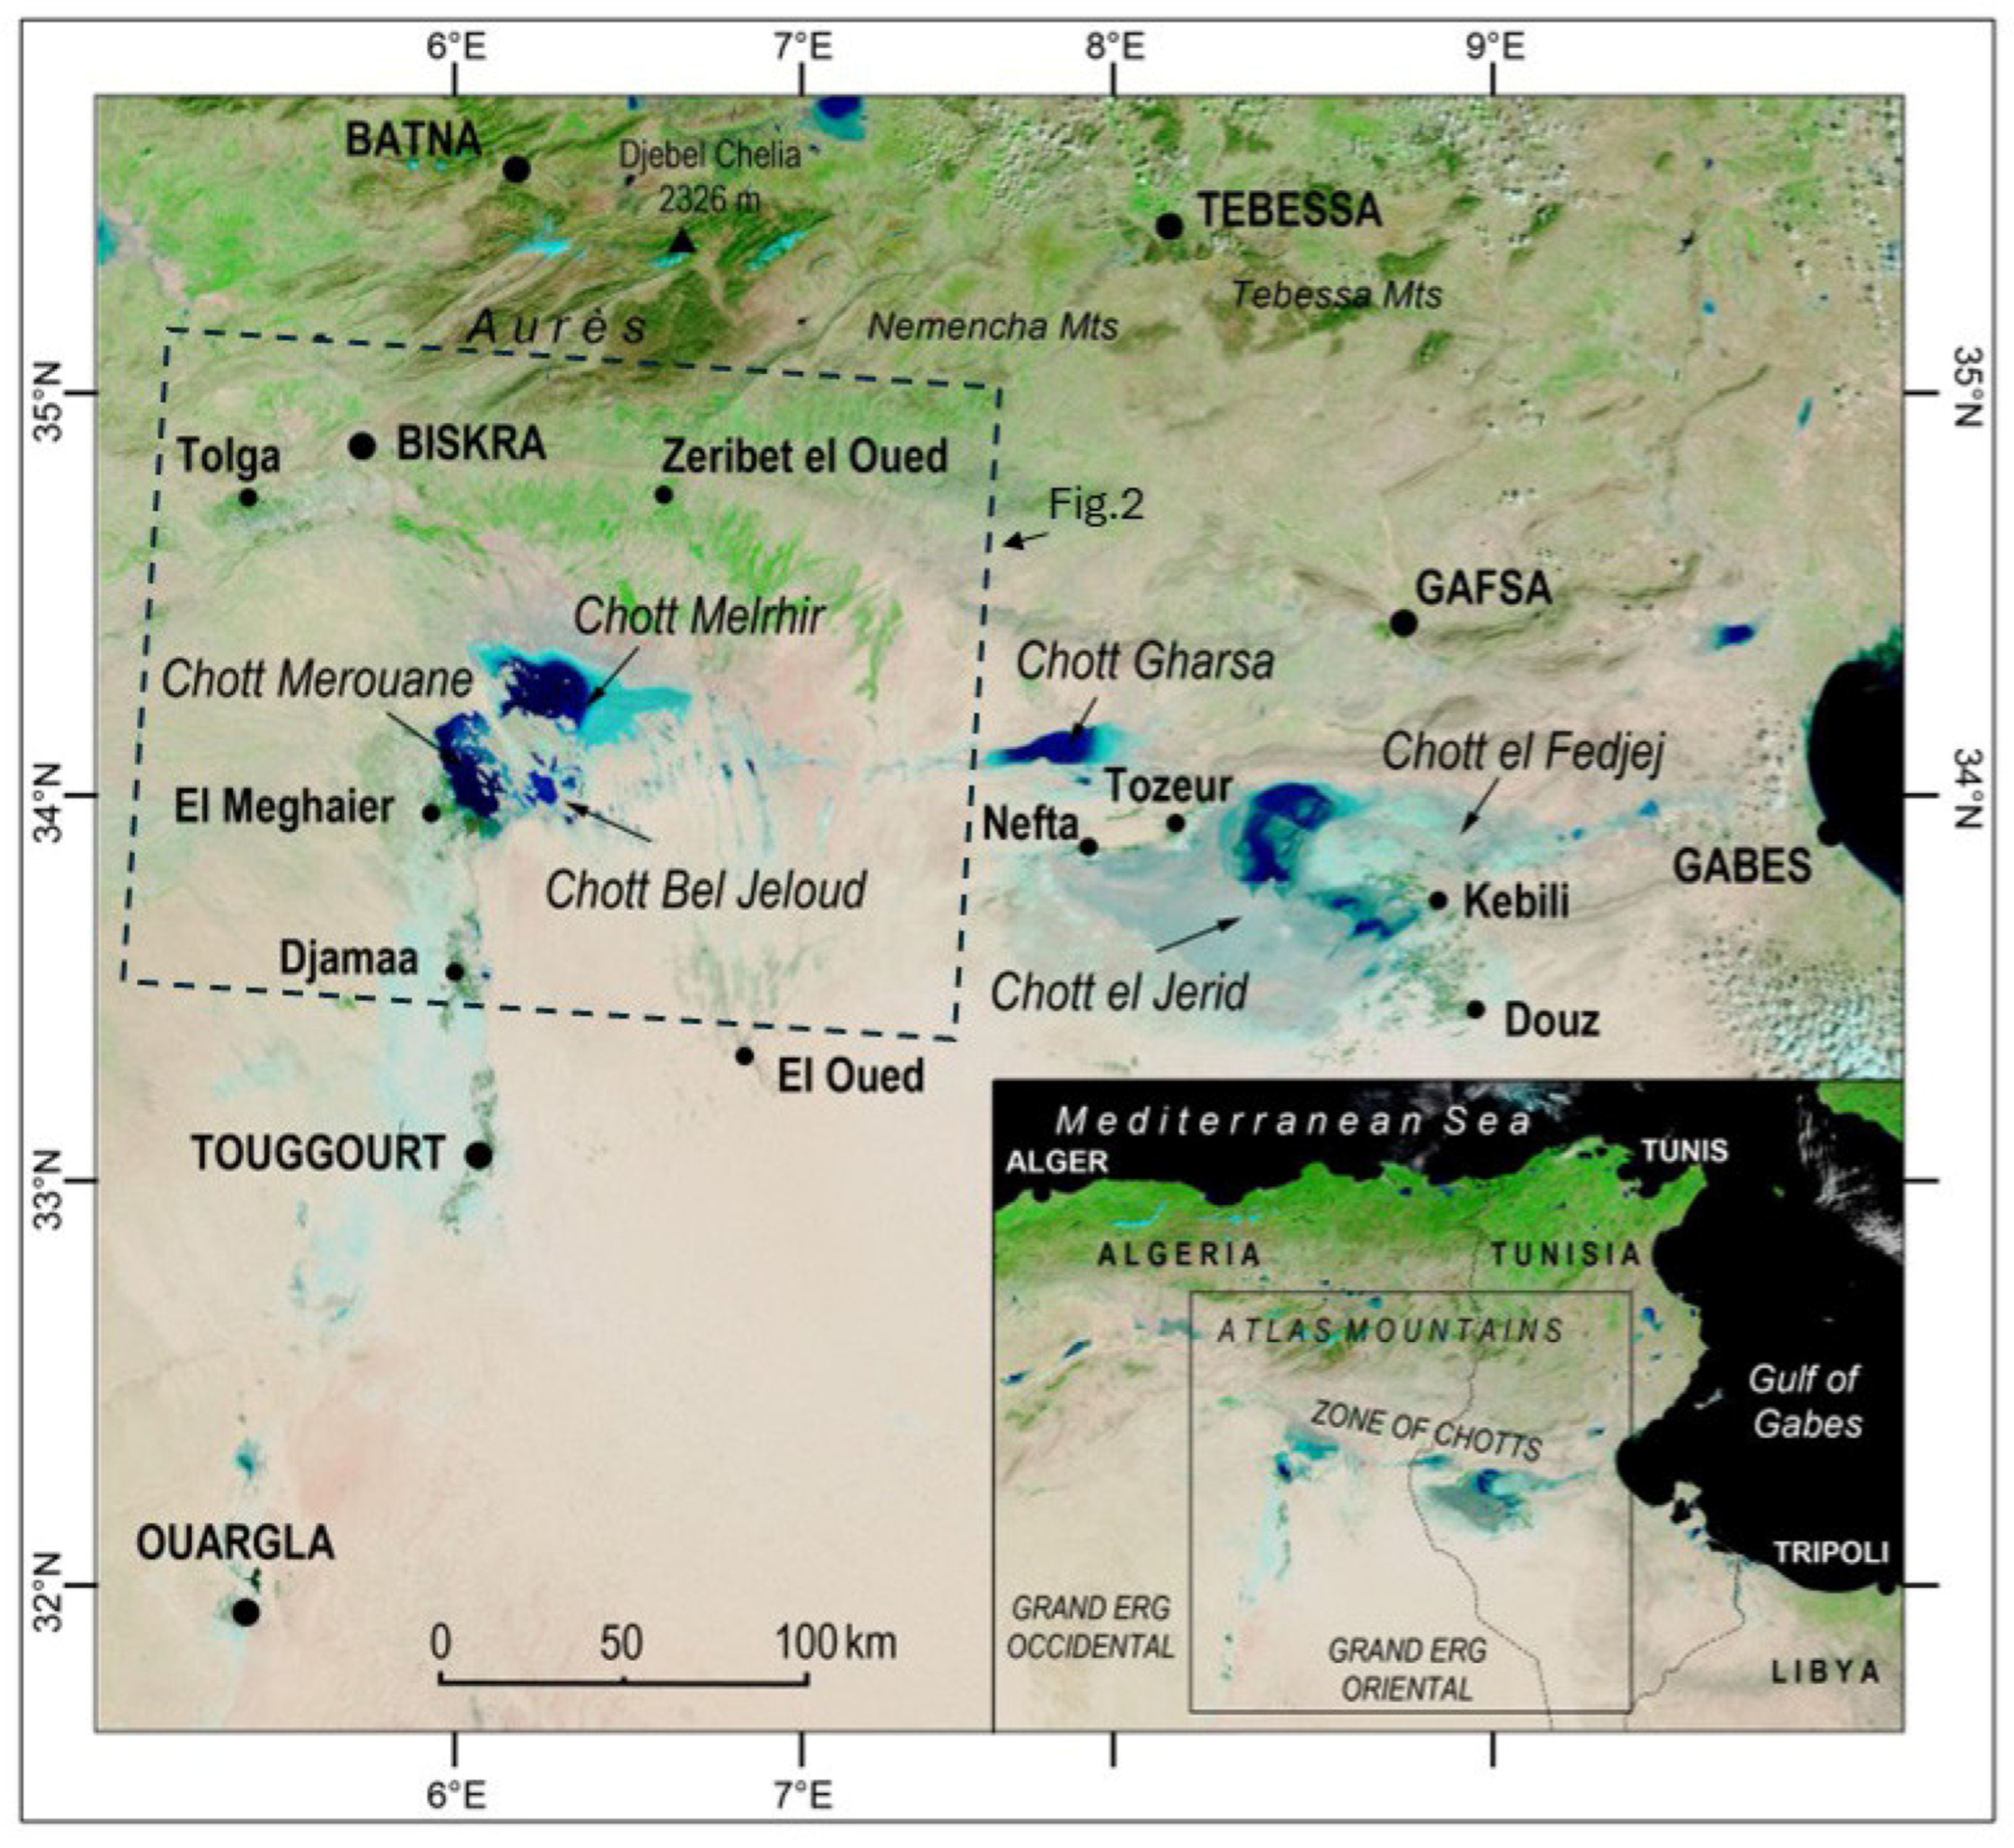
The present paper proposes a methodology for studying flooding events in the Algerian chotts of Merouane and Melrhir, with a particular emphasis on the identification of water bodies within these geographical features (Figure 1). This approach integrates multiple sources and temporal dimensions of remote sensing data, facilitating a comprehensive analysis and understanding of the study area. The subsequent discussion will address the selection of data and the information that can be derived from them. In order to interpret the results, we will also utilise climate chronicles, which are primarily based on temperature and precipitation data. A comparison is made with the Tunisian part of the Zone of Chotts, as well as with other cases worldwide.

2. Materials

2.1. Study Site

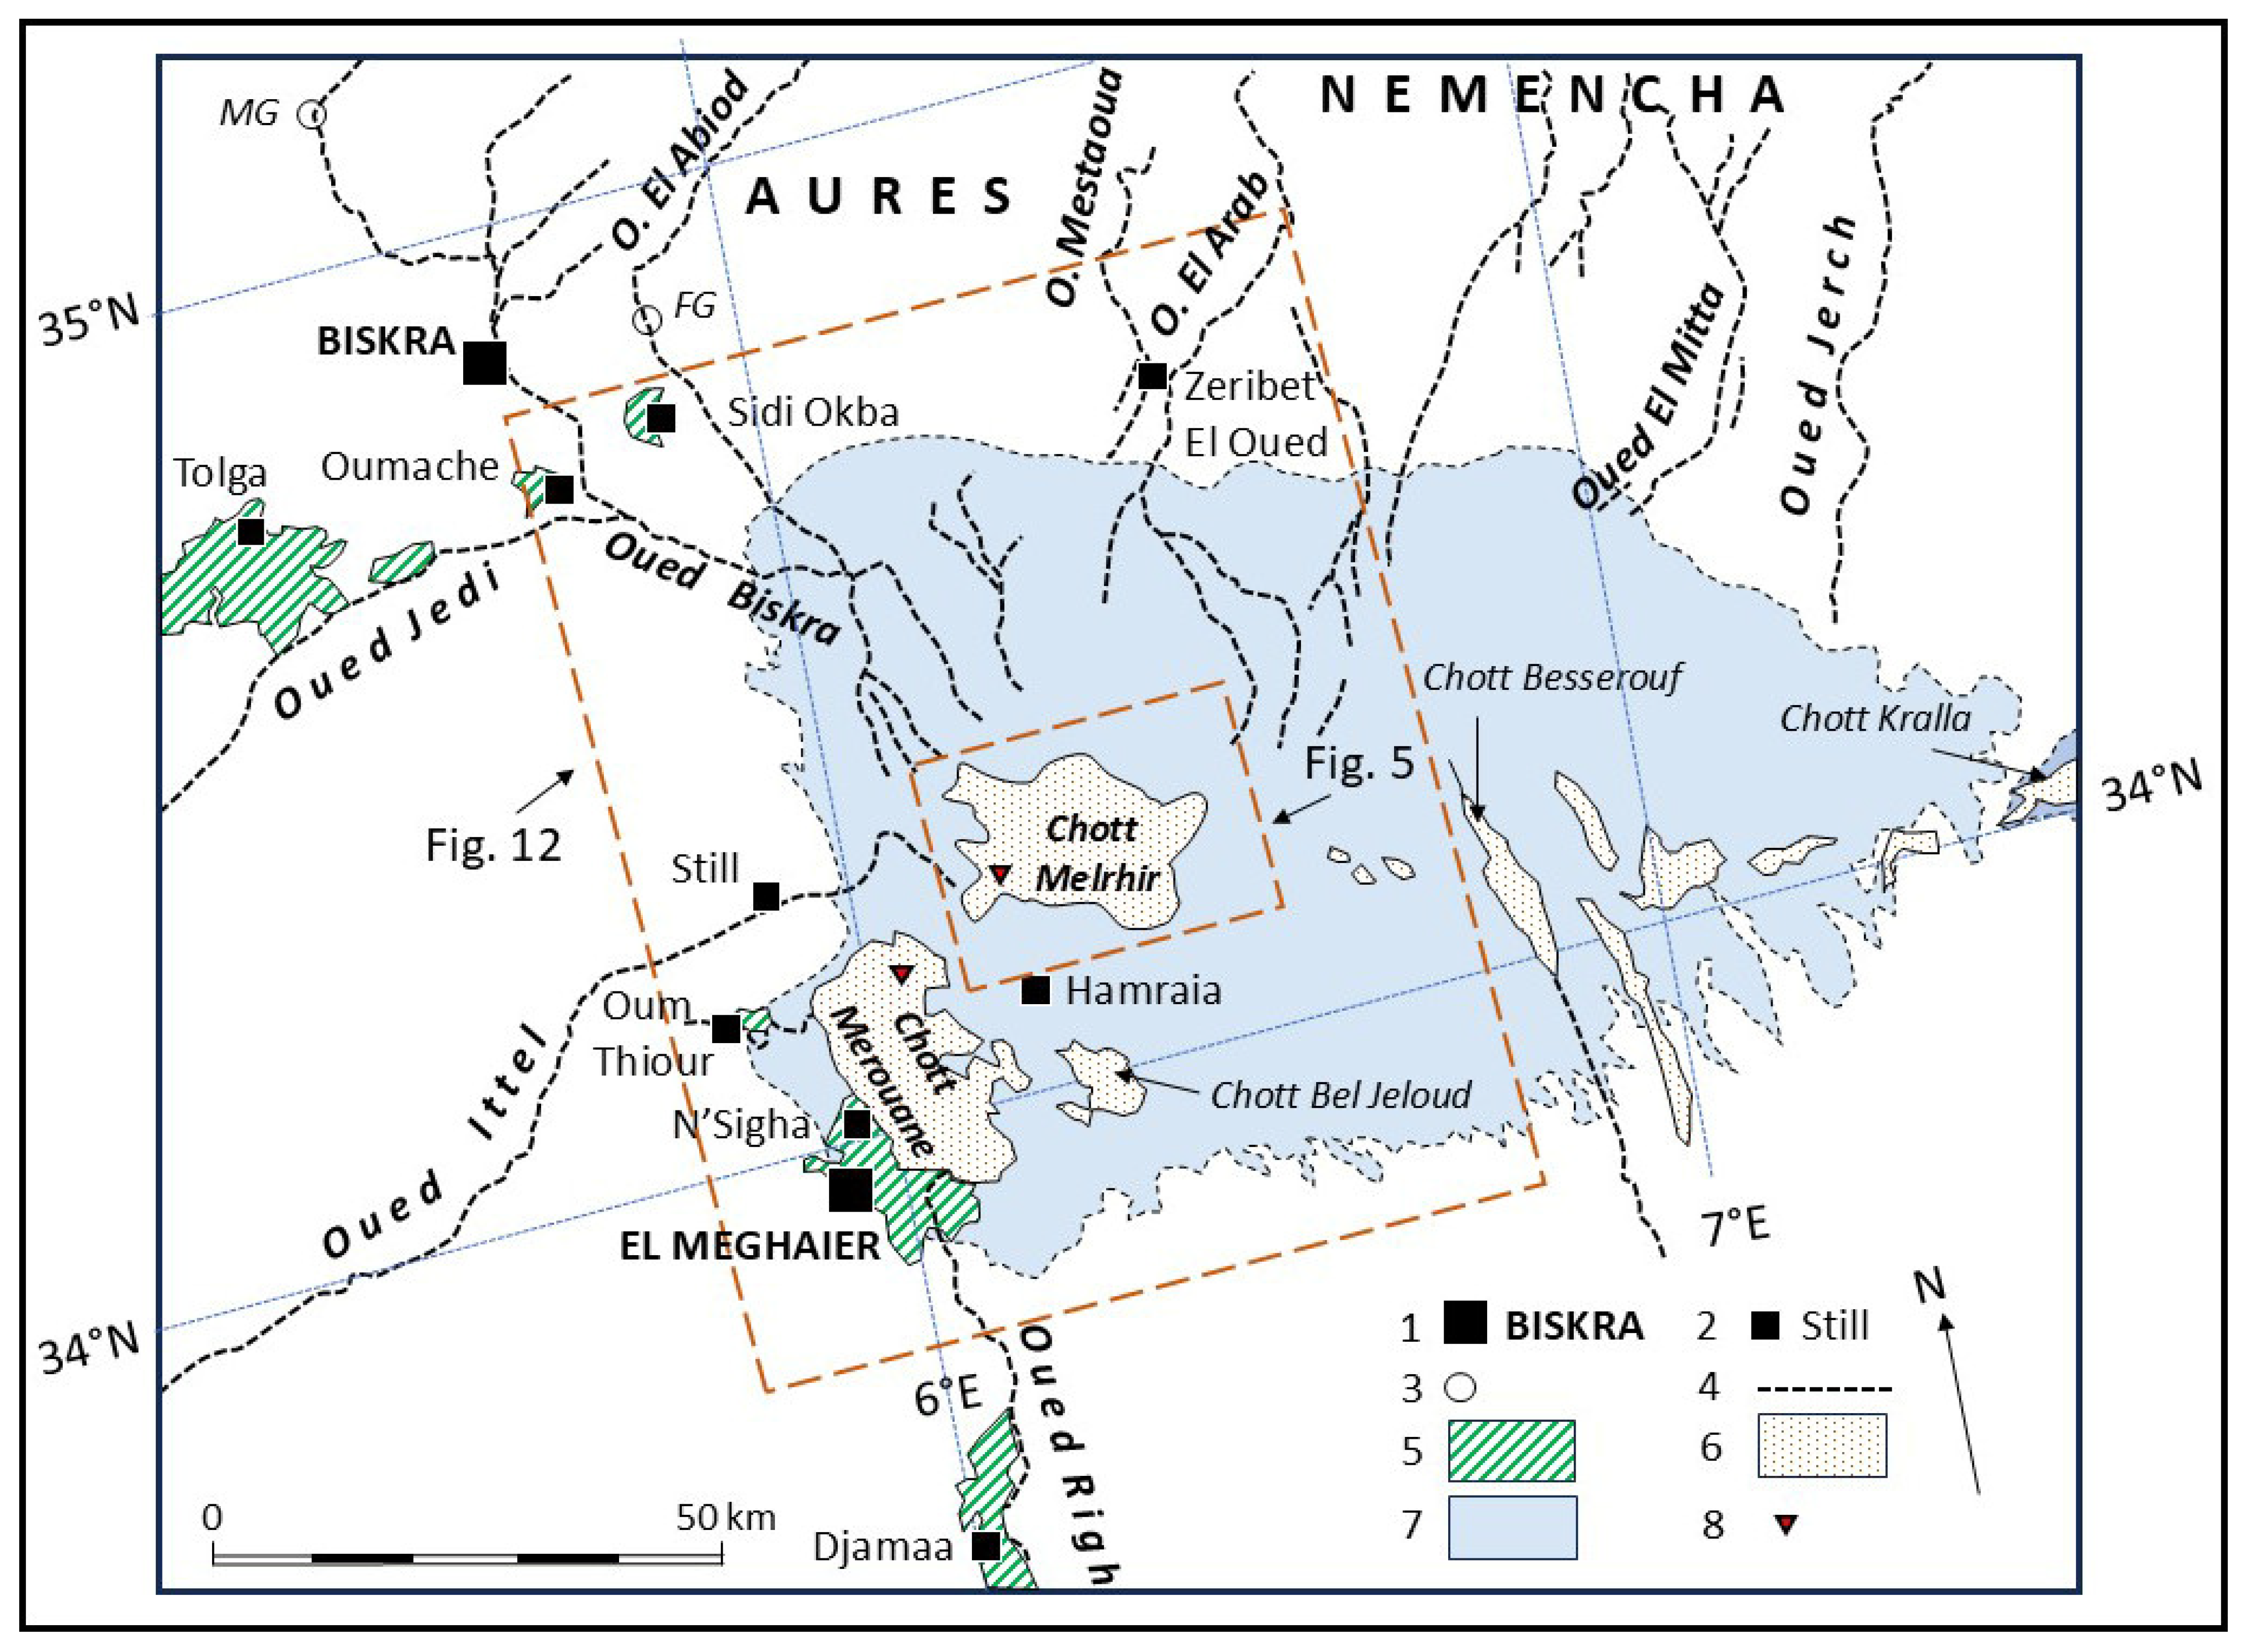
The Algerian Chotts form the western part of the Zone of Chotts, at the meeting point of the wilayas of Biskra, El Oued, El M’ghaier and Touggourt (Figure 2). Geomorphologically, the area lies between the Saharan platform to the south and the Atlas Mountains to the north. The Aurès Mountains reach elevations of over 2300 m in some areas. The chotts were formed on thick Pliocene lacustrine deposits. During the Quaternary period, the alternation of dry and humid periods resulted in the deposition of different layers of gypsum [34]. The chott depression is more pronounced towards the west. The total area below sea level is about 7000 km2. The lowest point in the Algerian Chotts is Chott Melrhir at −33 m, with Chott Merouane reaching −32 m [35]. In areas with arid conditions and intermittent rainfall, such as the Algerian Chotts, shallow endorheic lakes tend to form at the centre of sabkhas. The largest of these lakes is Chott Melrhir, which covers a maximum area of approximately 685 km2. Those in Chott Merouane, by contrast, cover an area of up to 320 km2. Note that there is a cluster of smaller chotts between the two big ones. When inundated, these small lakes can cover 95 km2, with Chott Bel Jeloud representing around 50 km2 of this area. For the multitemporal analysis, Chott Melrhir is divided into a western part (347 km2) and an eastern part (338 km2) by the 6°23′ E longitude line. Similarly, Chott Merouane is divided into a northern part (204 km2) and a southern part (116 km2) using the N34°03′ latitude (N’Sigha saltpan) as the reference point. Therefore, the theoretical maximum surface area of these water bodies is 1100 km2. Several small towns and villages are located south of Biskra, including Sidi Okba along the piedmont of the Aurès Mountains and Zeribet El Oued, and El Meghaier close to Chott Merouane.
Chott Melrhir is occasionally filled by runoff from the Aurès Mountains, primarily from the lower reaches of the Oued Biskra, in the northwest, and, less frequently, from the Oued Ittel in the west. Runoff directly from the north, including from the Nemencha Mountains (Oued El Arab, Oued El Mitta, Oued Jerch), also contributes to this. Chott Merouane is almost permanently fed by the Oued Righ, which drains the palm groves to the south. During periods of heavy rainfall, the smaller chotts to the east of Chott Merouane and south of Chott Melrhir may also flood, with Chott Bel Jeloud being the most significant. Evaporites are deposited in salt pans as a result of the evaporation-driven concentration of natural salt solutions [19,36]. Such areas consist of fine-grained sediments, including colloids and clays, which are permeated with alkali salts. The most common minerals found here are halite, gypsum (known as basanite when dehydrated), anhydrite, primary dolomite and sodium sulphates. Although the salt flats themselves are devoid of vegetation, they are often surrounded by salt-tolerant plants, forming an area known as a ‘chott’.

2.2. Weather Information

The Zone of Chotts is a key area for monitoring the effects of global phenomena. It lies at the intersection of two very different morpho-climatic zones: the Atlas Mountains to the north and the Sahara Desert to the south. The latter is represented by the Grand Erg Occidental and the Grand Erg Oriental. According to the Köppen–Geiger classification, most of the region is classified as BWh (B = arid, W = desert, h = hot arid) [37]. The northern zone, however, is classified as BSk (B = arid, S = steppe, K = cold arid). In the present study, as valuable chronicles are difficult to obtain, we have used the available data at https://www.weatherandclimate.eu/ (accessed on 21 February 2026). For the Algerian Chotts, four stations have been selected from north to south: Biskra, El Oued, Touggourt and Ouargla (see Figure 1 for locations). The reference period is 1960–2024, during which time relatively continuous data was collected. This period also covers the development of the satellite images used to monitor flood events. Unfortunately, the records are not always complete, due to various reasons including a lack of maintenance, periods of conflict, and rain gauges becoming saturated during heavy rainfall.

2.3. Sensitivity to Floods

To the north, the Aurès Mountains rise to an elevation of over 2000 m. The main river, the Oued El Abiod, has a particularly steep watershed (12.5–25% for half of the sector), which makes it dangerous [15]. The town of Biskra is prone to flooding. The most significant flood occurred in April 1949. Other significant floods occurred in the 1960s (on 12 September 1963, 27 January 1964, and 10 September 1969) and in the 1970s (on 27 November 1971, 6 June 1975, 10 March 1976, 6 January 1977, and 3 October 1978) [16]. These floods resulted in the inundation of several wadis, particularly the Oued Biskra, blocking roads and sewers in the process. Further flooding occurred in August 1989, December 1999, January 2003, April 2004 and, most recently, in January 2011 and March 2015. This flooding was primarily due to issues with sewage drainage rather than heavy rainfall. Fathalli et al. recently investigated the potential impact of ‘flooded chotts’ on the local climate of Chott el-Jerid in the Tunisian part of the Zone of Chotts [17]. The most noticeable effects of the lake seem to be confined to its surface. The lake moderates near-surface air temperatures, raising them in winter and lowering them in summer. Due to the temperature gradient between the lake surface and the atmosphere, heat fluxes over the lake increase significantly in winter and decrease in summer. Latent heat fluxes, humidity convergence and the water vapour mixing ratio all increase over the lake throughout the year, particularly in winter. The lake reduces land breeze circulation in winter and increases pressure in summer. Simulated precipitation amounts are higher over the lake in winter, probably due to increased atmospheric instability, whereas they decrease slightly in summer.

2.4. The Satellite Data

As our study covers the period from 1960 to the present day, we used all the images that were available. In order to avoid overly complex scientific considerations, we did not use radar data records in this study. However, it should be noted that radar data can provide interesting information regarding surface roughness and humidity.

2.4.1. CORONA

We consulted the CORONA archives in particular for the period 1962–1975. These are available on the USGS website. CORONA data originates from American spy satellites launched in the 1960s and early 1970s. These images have been in the public domain since 1995 and are available at resolutions of 1.8, 2.75, 7.5 or 140 m. In the absence of aerial photographs, they are a good alternative, as only panchromatic views are available. The available areas covered by CORONA images are relatively random. Most of the low-spatial-resolution images from 1962 to 1964 are cloudy.

2.4.2. Landsat

The Landsat data series is the longest high-resolution image chronicle available, with images dating back to 1972 from Landsat 1–3 MSS (1972–1983), Landsat 4–5 MSS–TM (1982–2013), Landsat 7 ETM+ (1999–2025) and Landsat 8–9 OLI (from 2013 onwards). These images constitute the core of the EarthExplorer website of the USGS (https://earthexplorer.usgs.gov/ (accessed on 13 March 2026)). The various multispectral sensors cover the visible and near-infrared spectrum (MSS), as well as the mid- and shortwave infrared spectrum (TM, ETM+ and OLI). The spatial resolution ranges from 80 m (MSS) to 30 m (TM, ETM+ and OLI), with a 10 m panchromatic band available with ETM+ and OLI. The difficulty of distinguishing between mineral and vegetation surfaces using the broad panchromatic band of ETM+ resulted in a more restricted band for OLI. Landsat data is acquired with a revisit time of 16 days from the Landsat 4 satellite and 18 days previously. Landsat data (Landsat 4–9) is available in a format based on the Worldwide Reference System (WRS-2). Paths represent the satellite’s ground tracks from north to south, while rows represent the longitudinal centre line of a Landsat scene from east to west. Chott Melrhir and Chott Merouane are both covered by images corresponding to path 193 and row 036.

2.4.3. MODIS

Since 2000, the MODIS series has comprised two Earth Observing System (EOS) satellites: Terra (EOS-AM) and Aqua (EOS-PM). They are available on the EarthData website of NASA (https://wvs.earthdata.nasa.gov/ (accessed on 7 January 2026)). These have been supplemented by NOAA-20, NOAA-21 and Suomi within the Joint Polar Satellite System (JPSS). These images are highly relevant as daily acquisitions are possible. Currently, five images are daily acquired between 10 a.m. and 1 p.m. local mean time. The MODIS sensor is a superspectral instrument comprising 36 spectral bands ranging from the visible to the thermal spectrum. In the present study, however, we only use the visible, mid- and shortwave infrared ranges, which are available with a spatial resolution of 250 m instead of 500 m or 1000 m for the others. Different colour composites are available on the MODIS website. Some of these are more relevant to our study (see also the Methods section).

2.4.4. Sentinel-2

The Sentinel-2 series, comprising three satellites launched from 2015 onwards, represents a new generation of high-resolution images with an improved revisit time of 4–5 days (compared to 16 days for Landsat 4–9). They are available on the Copernicus website (https://dataspace.copernicus.eu/ (accessed on 7 January 2026)). The revisit period improves to 2–3 days when two Sentinel-2 satellites are operational. The Sentinel-2 dataset comprises 13 bands, which are available at resolutions of 10, 20 or 30 m. These bands cover the visible, near-infrared, mid-infrared and shortwave infrared ranges. Notably, three bands in the red edge differ from the spectrum covered by Landsat OLI. This enables different types of colour composite and image processing. As with MODIS, the ‘Methods’ section provides further details. Sentinel-2 data is available in a format based on the Military Grid Reference System (MGRS). Chott Melrhir and Chott Merouane are covered by images T32SKD and T32SKC.
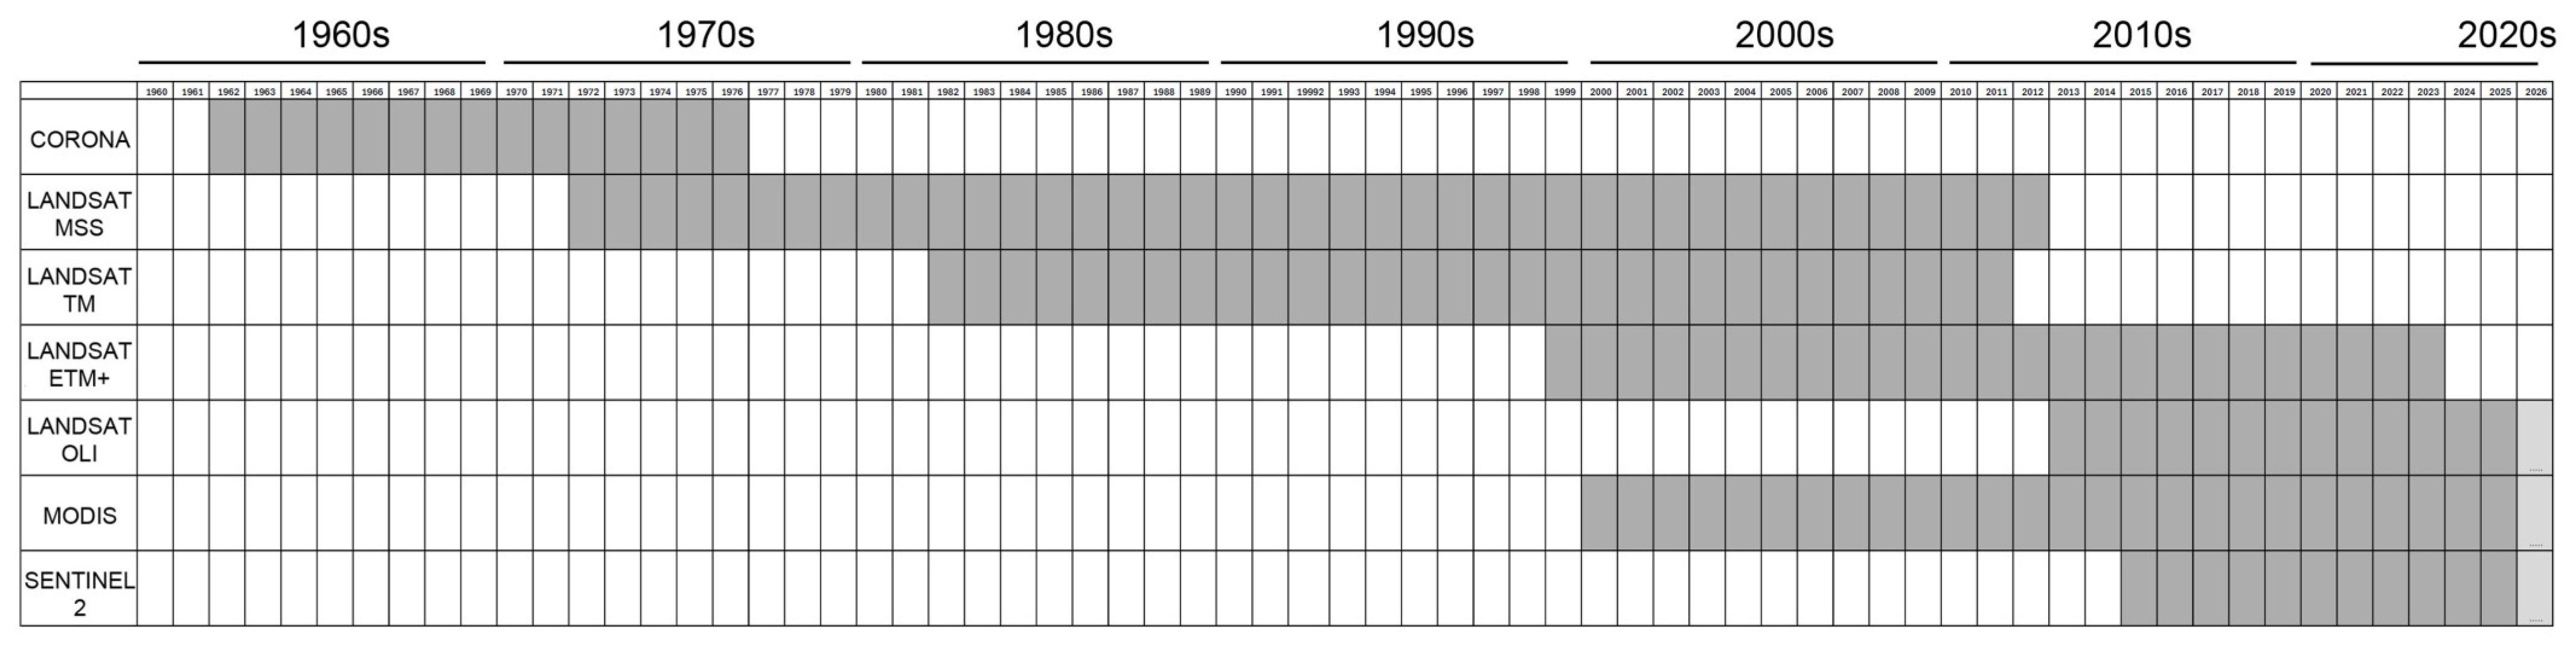
Figure 3 summarises the chronology of the various satellite data employed in the present study.

3. Methods

3.1. Generalities

This article focuses on the added value that satellite data provides when interpreting water surfaces in the case of ephemeral water bodies (sabkha lake). Particular attention is paid to data chronicles and multitemporal and multiscale approaches. The remote sensing data is processed using the ENVI Classic 5.0 and SNAP software packages.
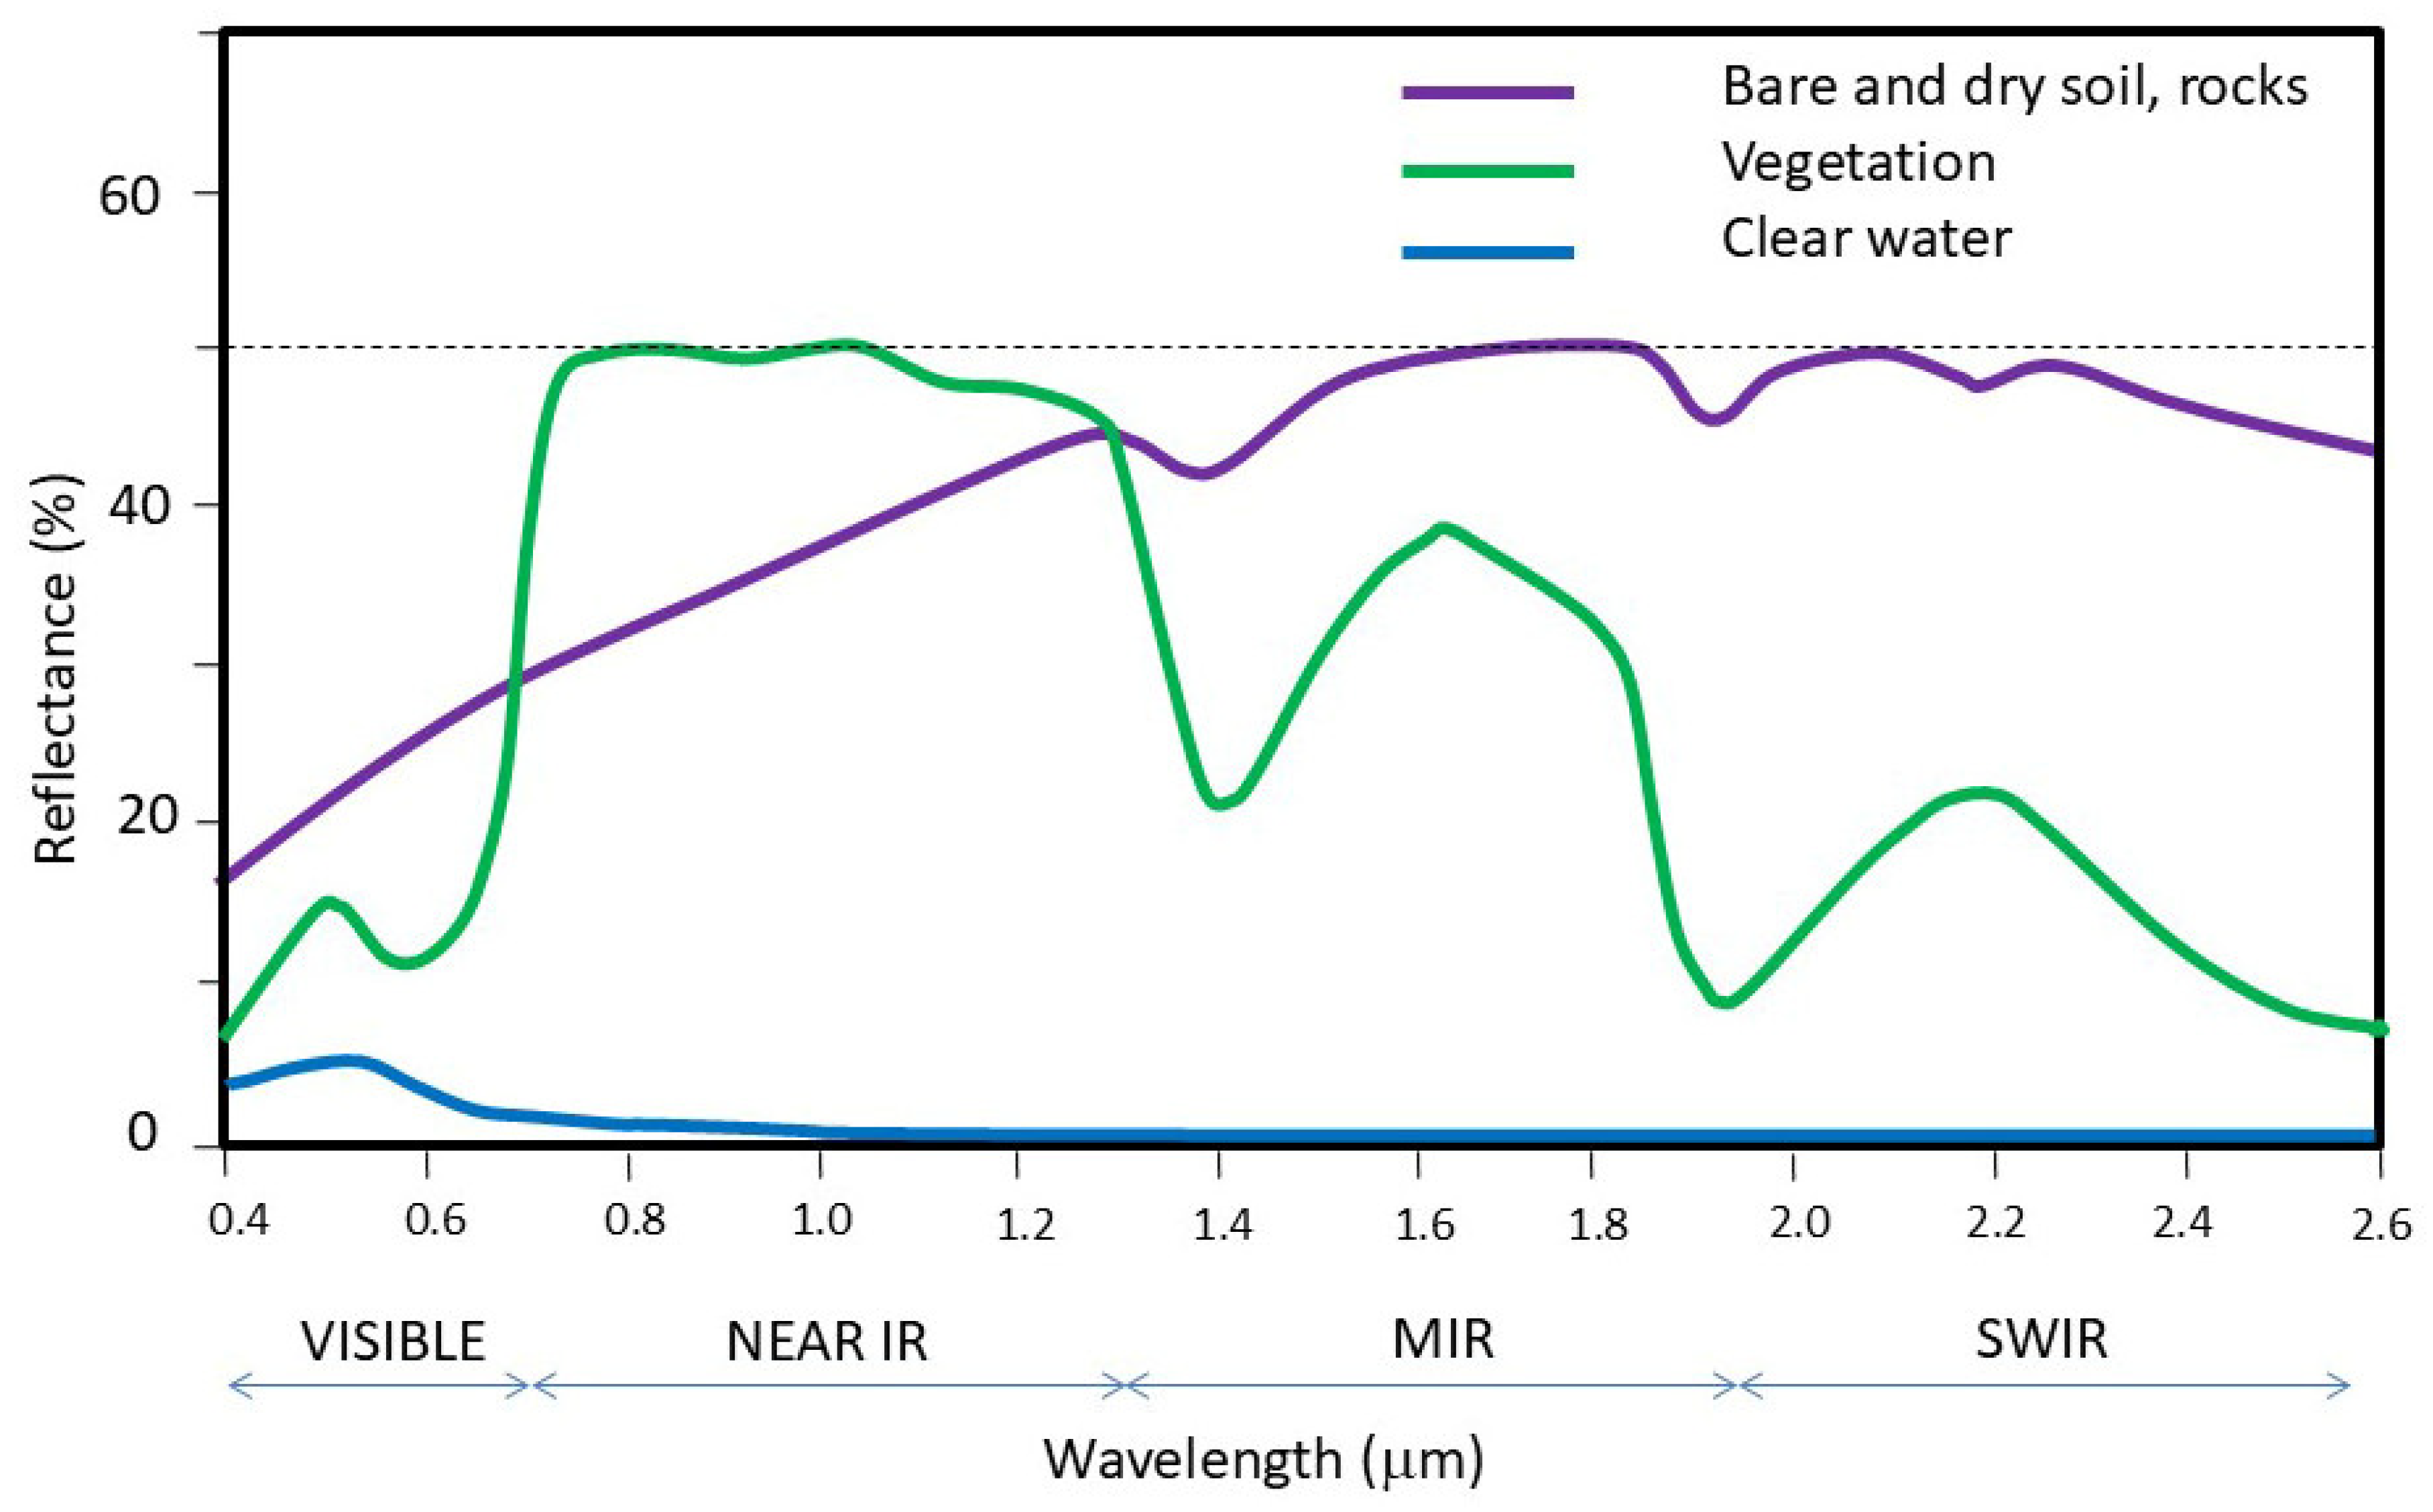
In multispectral remote sensing, the key factor is the spectral behaviour of landscape units such as water bodies, vegetation or mineral surfaces (Figure 4). Water always has a low reflectance (a few per cent in the visible spectrum). As soon as the near-infrared spectrum is reached, water exhibits very low reflectance, showing the lowest values. This makes it possible to distinguish water surfaces using a colour composite comprising only infrared channels. There are also indices that highlight free water. One example is the Normalised Difference Water Index (NDWI), which is defined as follows: NDWI = (GREEN − NIR)/(GREEN + NIR) [38].

3.2. Processing of the Data

All images are used in digital form (Table 1). As a reminder, data from Corona, Landsat, MODIS and Sentinel-2 have been used. They are initially processed in the standard way: selection from existing databases, downloading and, for some of them, resampling, as well as rendering as colour composites or in black and white for panchromatic images. Some images undergo atmospheric correction. The differences in processing (TOA or BOA, i.e., top- or bottom-of-atmosphere) are not particularly relevant here, since the data will not be analysed quantitatively or compared with one another. Landsat or Sentinel-2 data can easily be selected to exclude clouds, as quantified in the respective databases. In contrast, Corona and MODIS data must be viewed to determine cloud presence. It should be noted that the presence of clouds in daily MODIS records sometimes suggests significant rainfall. When it comes to detecting water bodies, the most important factor is the colour composite used, i.e., the most suitable spectral ranges. With Corona, only panchromatic images are available. These can only be used for archival purposes, much like aerial photographs, but they can provide indications of possible flooding of the Algerian chotts between 1962 and 1970. MODIS images, on the other hand, are available since 2000 in colour composites, either true or false. The most relevant colour composite incorporates two infrared spectral bands (RGB = 721) (see below Section 3.3). The advantage of Sentinel-2 data is that they incorporate three infrared spectral bands (NIR, MIR and SWIR). This enables the production of colour composites in which bodies of water appear completely black. Water surfaces can be delineated more accurately than with MODIS data and extracted by thresholding. However, it is still difficult to estimate the depth of water bodies and therefore the volume of water present in both cases. The repetitivity parameter is crucial because floods in arid regions are often sudden, or ‘flash floods’. In this respect, MODIS data, which is acquired daily, and Sentinel-2 data, which is acquired every three to five days, have a clear advantage.

3.3. Thematic Analysis of the Satellite Data

3.3.1. MODIS Data

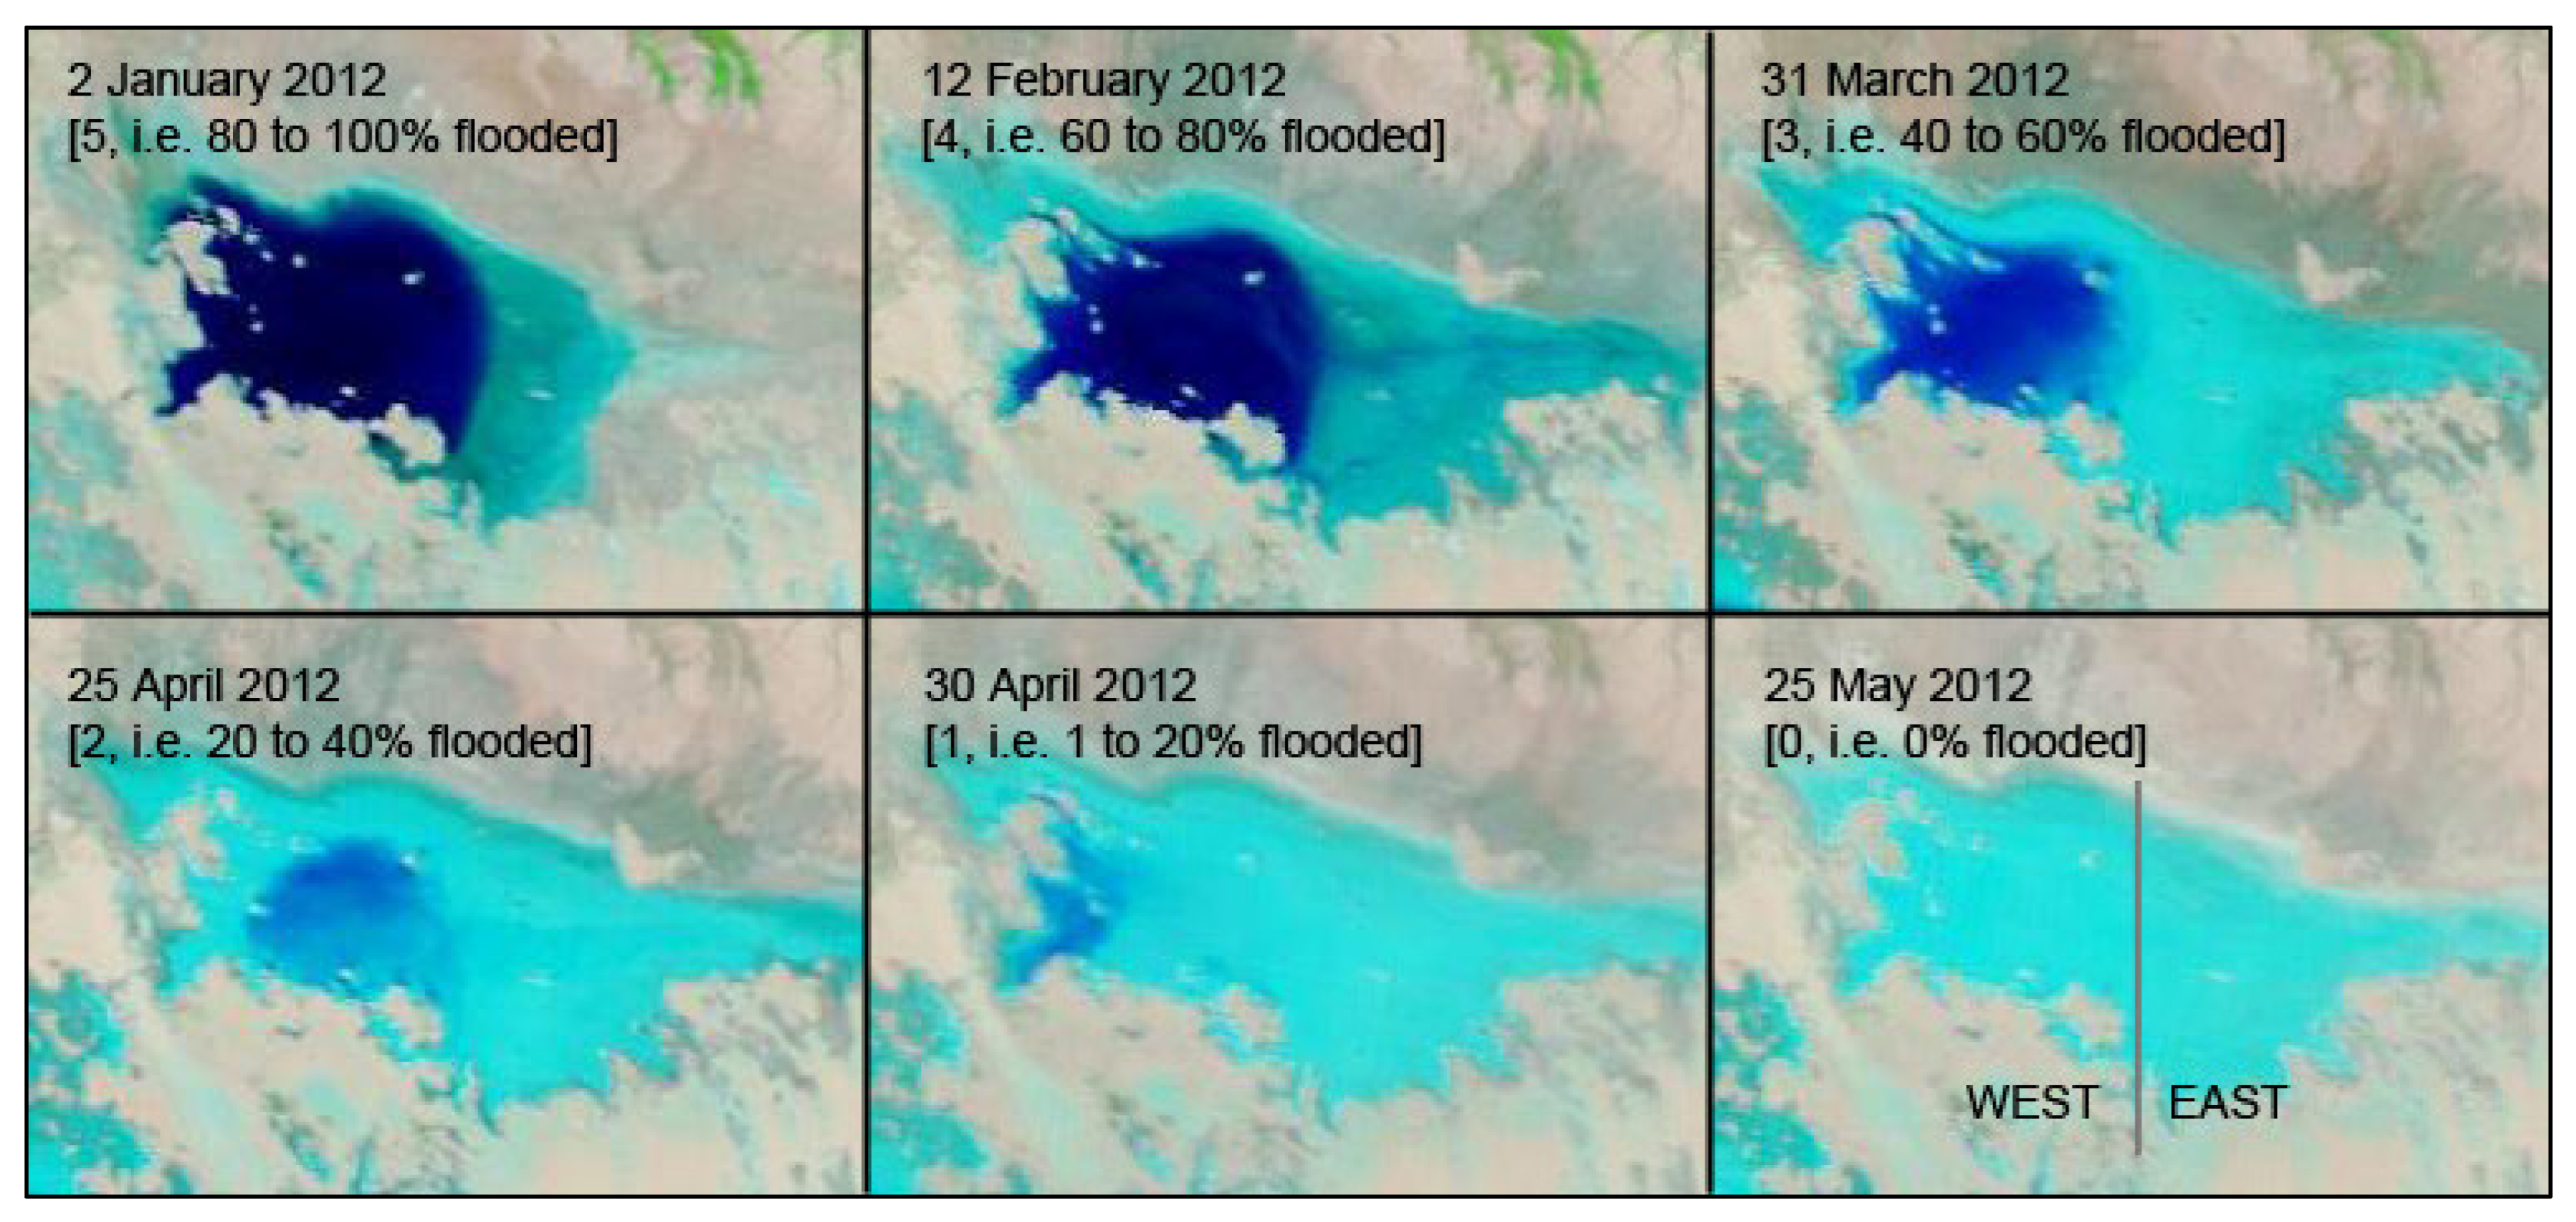
A monthly database was established using a long series of MODIS data to characterise the flooding status of different parts of the chotts. For this purpose, the chotts were divided into five sectors. As mentioned in the geographical presentation, the Melrhir chott is divided into two parts (west and east), the Merouane chott into two parts (north and south), and the smaller intermediate chotts around Bel Jeloud are also examined. Of those available on the MODIS website, the best RGB colour composite for determining the surface of a lake is one that codes the short-wave infrared range (2105–2155 nm) as red, the near-infrared range (841–876 nm) as green, and the red range (620–670 nm) as blue. Infrared domains do not reflect light for water surfaces. Therefore, water bodies appear dark blue. True colour composites are more difficult to use because shallow water surfaces, which are common in chotts, may not be recognised. We use simple visual analysis to determine the severity of flooding in an area. If the area remains dry, a value of ‘0’ is attributed. If less than 20% of the area is flooded, a value of ‘1’ is attributed; if less than 40% is flooded, a value of ‘2’ is attributed; if less than 60% is flooded, a value of ‘3’ is attributed; if less than 80% is flooded, a value of ‘4’ is attributed; and if the area is completely flooded, a value of ‘5’ is attributed. Uncertainty can be estimated at approximately 5%. The indicated status corresponds to the situation on the first day of the month or on subsequent days if the period is cloudy. Figure 5 illustrates the case of Chott Melrhir in early 2012, providing an explanation for interpreting water bodies in dark blue, mineral surfaces in light blue (evaporites) or yellow-red (sand and soils) and vegetation in light green. It should be noted that flooding is a relatively rapid phenomenon, which leaves traces for several weeks after the water has dried up.
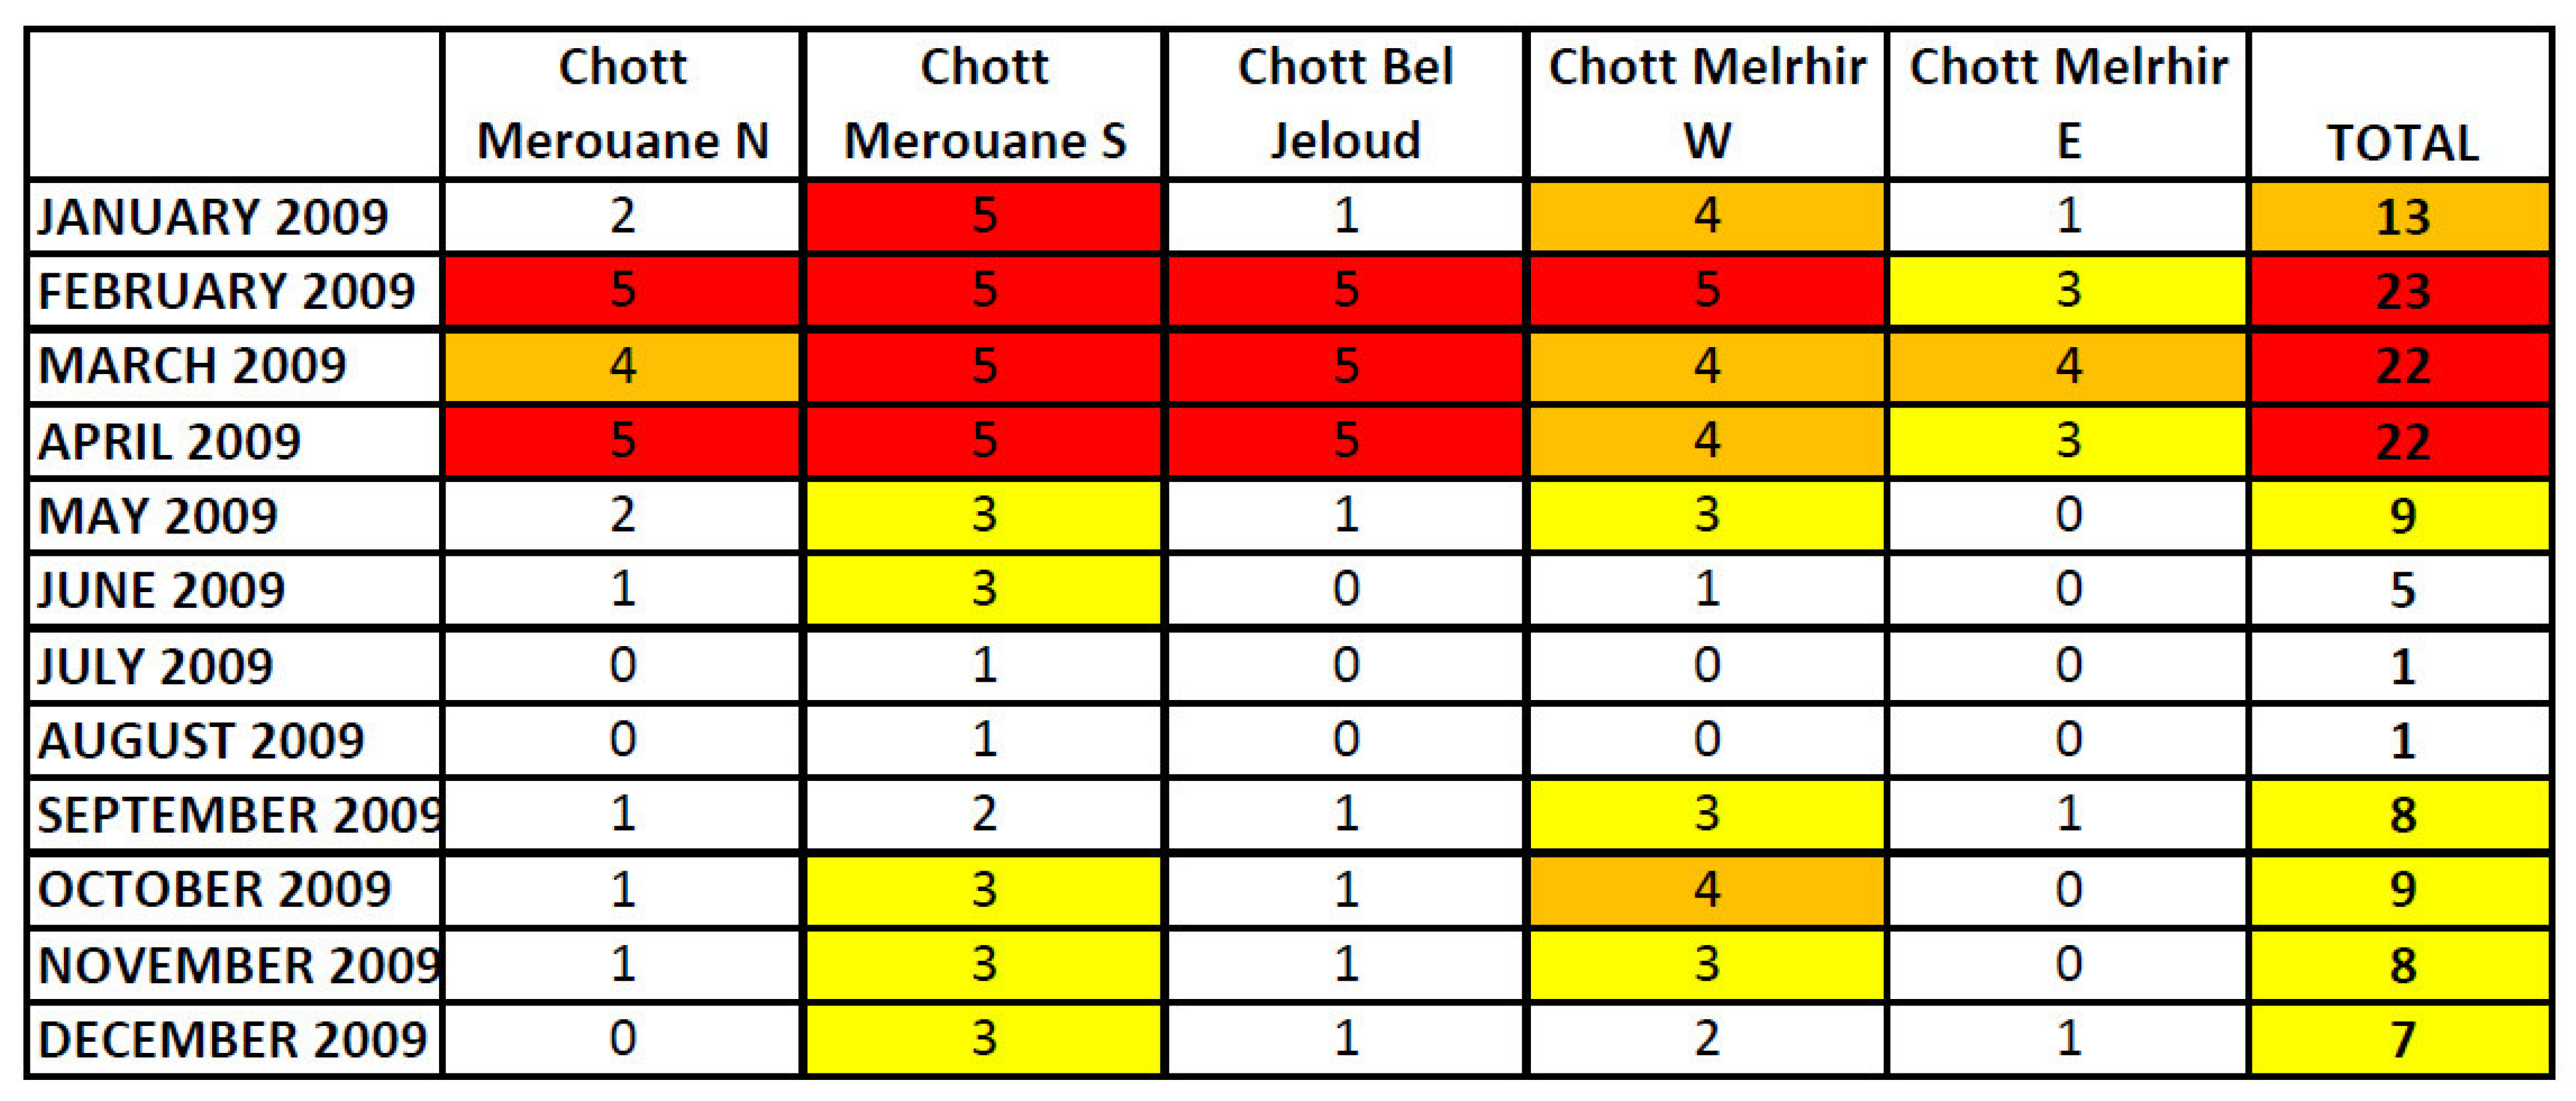
The first target result is therefore a monthly database from the beginning of the 2000s based on MODIS records (Supplementary File S1). This database is supplemented by Landsat data, which is sometimes discontinuous prior to 1994 and has periods of missing data. This is why the database in the appendix starts in 1994 (Supplementary File S2). From this point onwards, a continuous monthly series can be obtained. However, a more comprehensive database includes information dating back to 13 August 1972, which is when the first multispectral image of the area was acquired by the MSS onboard Landsat 1. Figure 6 gives an example of the database content for the year 2009 only.

3.3.2. Sentinel-2

The main flood events can thus be characterised. On a more global scale, differences in flood patterns can be identified over the thirty-year period since 1994. For the most recent period, some events can be surveyed using Sentinel-2 images owing to the enhanced revisit time when compared to the Landsat data. For Sentinel 2 data, we opted for a colour composite based on three infrared channels: the near-infrared range (band 8), coded red; the mid-infrared range (MIR) (band 11), coded green; and the short-wave infrared (SWIR) range (band 12), coded blue. This ensures that water bodies appear black (no reflectance), while mineral surfaces appear bright due to their high reflectance, which generally peaks in the mid-infrared range. Therefore, soils unaffected by flooding usually appear white in the selected colour composite due to their predominantly sandy-muddy nature. Conversely, evaporites typically exhibit a decreased response in the MIR and a greater decrease in the SWIR range when predominantly composed of gypsum, as is the case in Chott Melrhir and Merouane [19]. Consequently, they appear in orange-red hues. Red-orange evaporites can easily be separated from light red vegetation, which always has a strong peak in the near-infrared. The same colour composite, which includes only spectral channels in the infrared, can be produced using Landsat TM, ETM+ or OLI data. However, this has not been developed as part of this work.

3.3.3. Climate Data

It should be noted that acquiring images can sometimes be difficult as flooding episodes are necessarily associated with cloudy periods. More broadly, the analysis aims to identify any particularly dry or wet periods. Therefore, comparing this with meteorological data is essential. Remote sensing data has been used alongside other data, including climate information from various regional stations. Initially, temperature and precipitation data from the 20th century were analysed, focusing on the period since the 1960s, for which the series were more complete. The CORONA archives were then used to identify potential flooding events in the Melrhir and Merouane chott areas during the 1960s. This also makes it possible to determine whether more recent trends are present.

4. Results

4.1. Climate Data Analysis

The main data are summarised in Table 2.

4.1.1. Temperatures

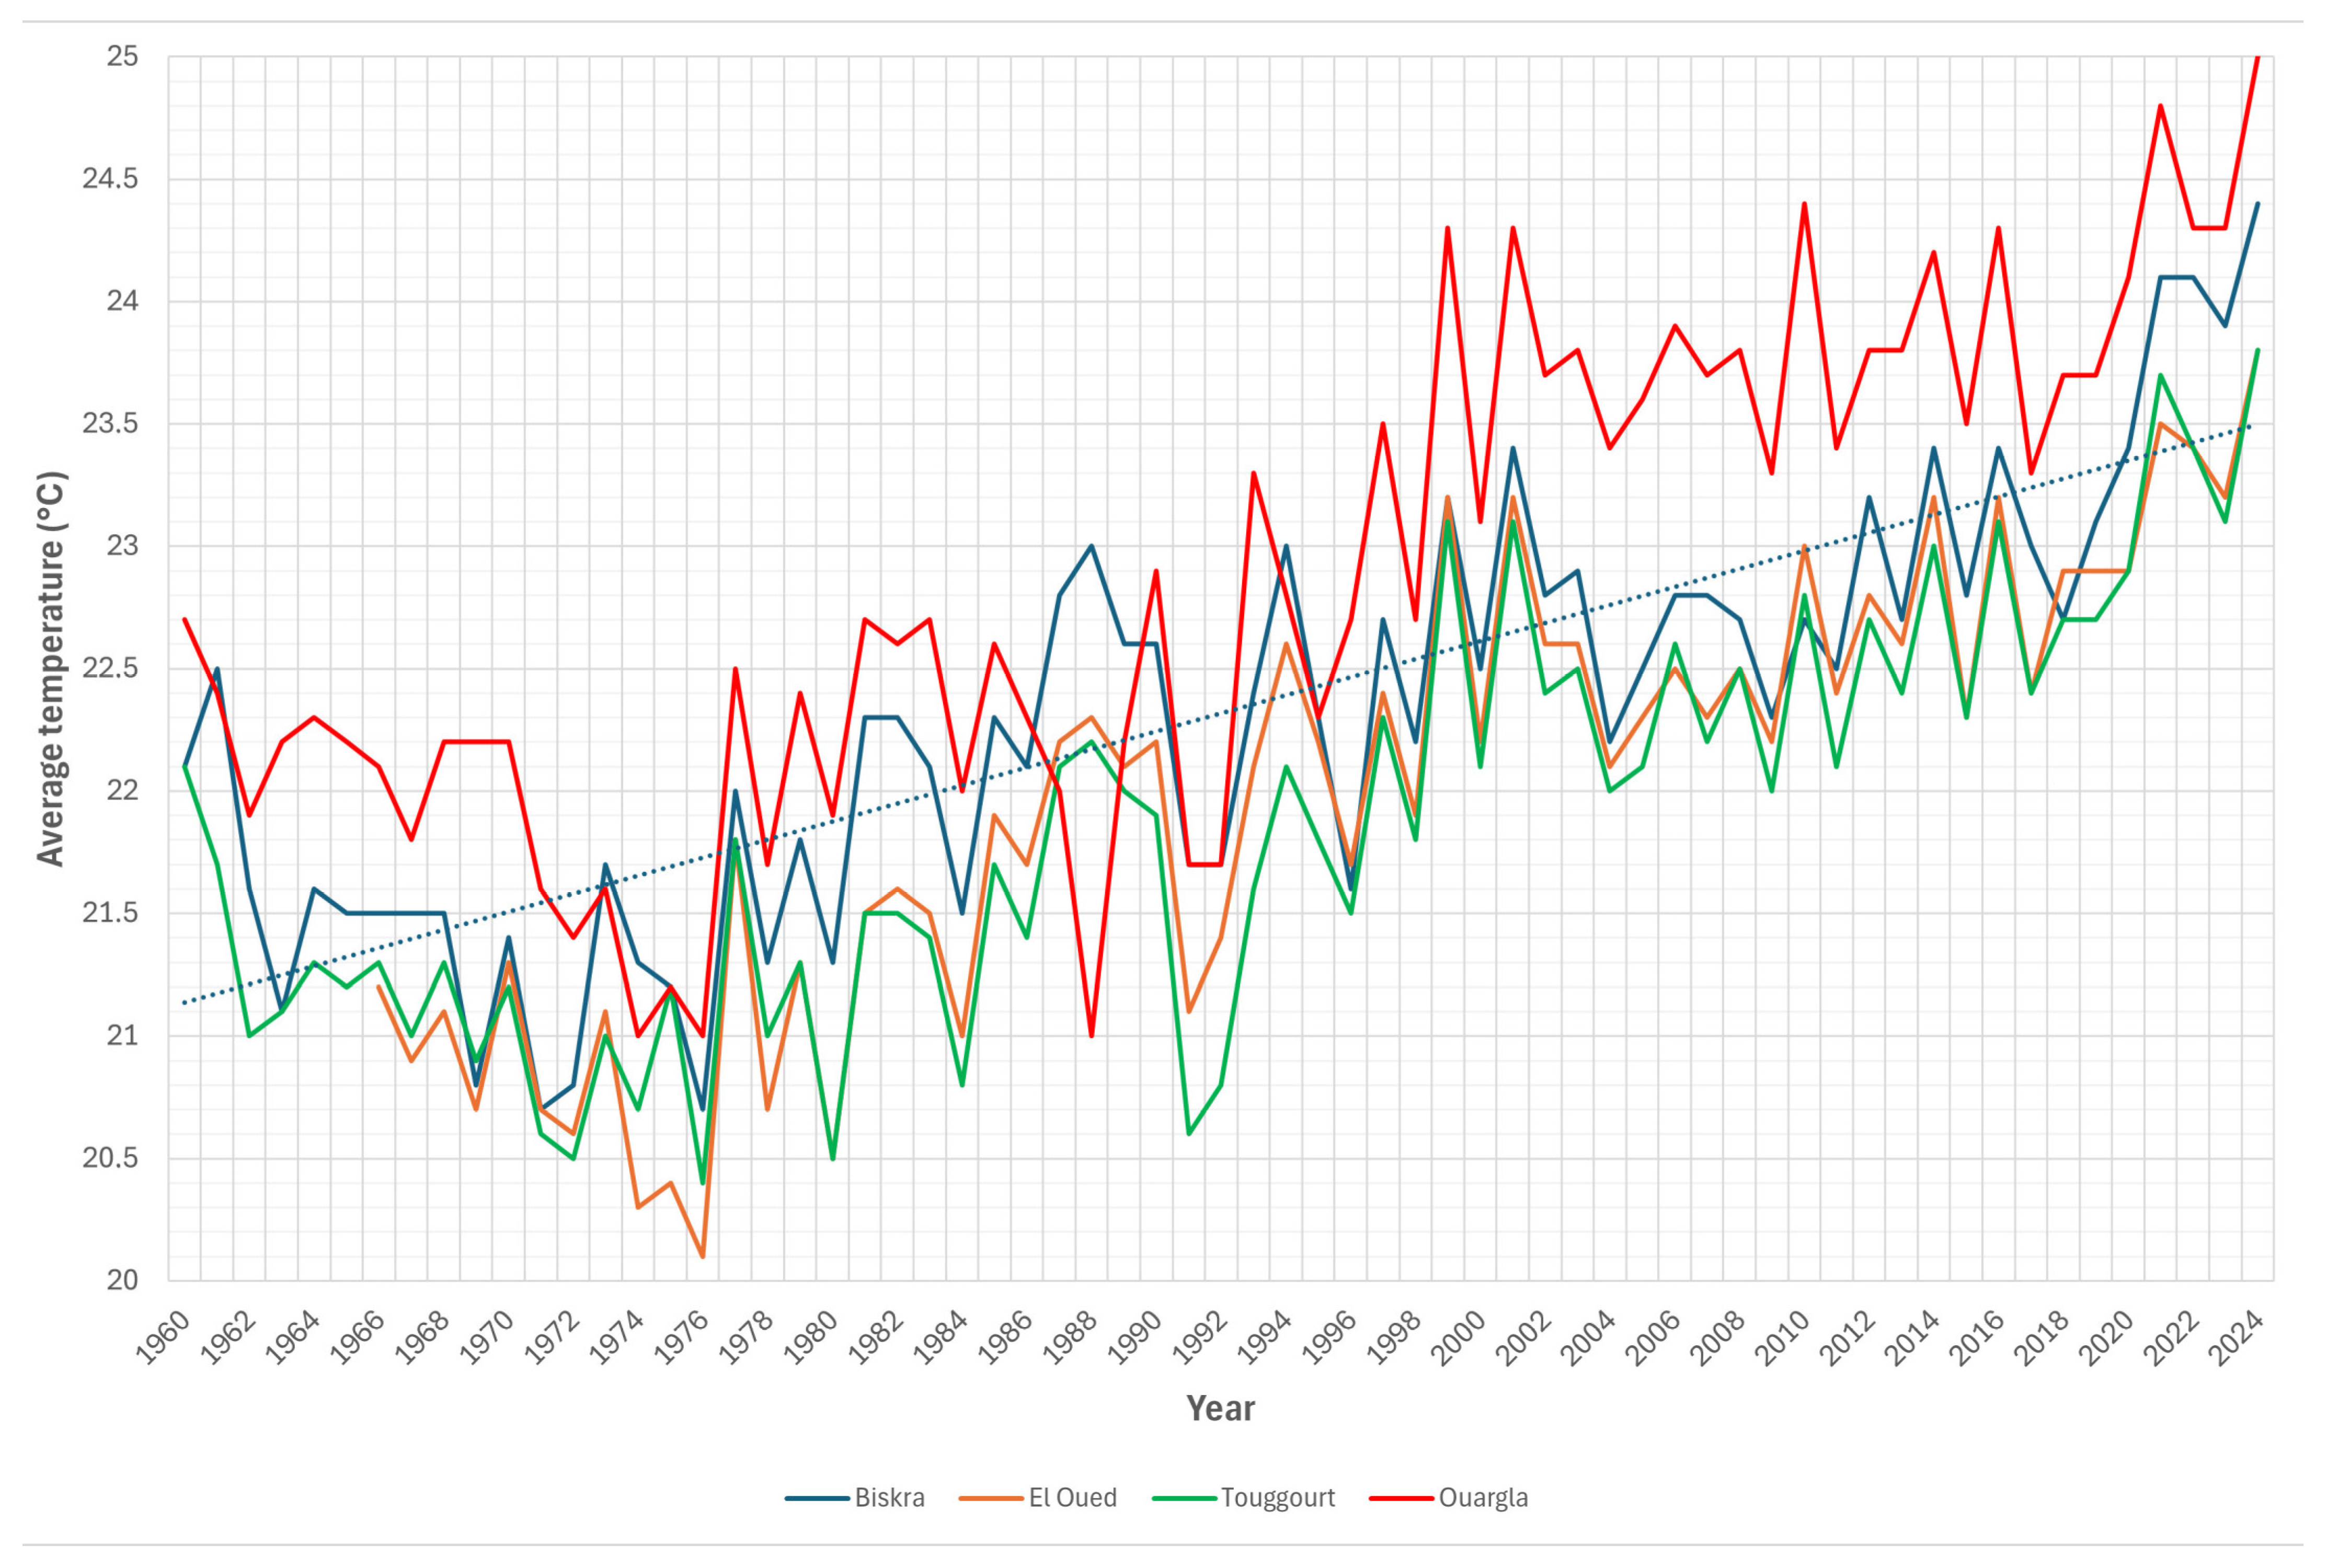
Figure 7 shows the annual average temperature at four Algerian reference stations since 1960. Over this period, temperature data from all stations shows an increase in average temperature of between 2 and 2.5 °C. The coefficient of determination (R2) for a linear fit of the Biskra series is 0.66. Nevertheless, from 1960 to 1989, all stations exhibited a slight decrease in temperature, indicative of a continuous trend that has been observed since the onset of the 20th century. The maximum cooling was reached in 1976. The average temperatures recorded at the various selected stations appear consistent. The station with the consistently highest temperatures is Ouargla, which is located farthest south. However, it should be noted that Biskra has the second highest temperatures among the four Algerian stations, with values comparable to those in Tozeur, Tunisia (not plotted in Figure 7). The stations in El Oued and Touggourt, closer to Chott Melrhir and Merouane, are slightly cooler, with an annual average temperature 1 °C lower than in Ouargla. From a perspective of characterising climate change, it is perhaps more interesting that the average over the latest 35-year period (1990–2024) is 0.5–0.7 °C higher than the average over the previous 30-year period (1960–1989). Calculations for the last ten years (2015–2024) suggest an additional increase of 1–1.2 °C.
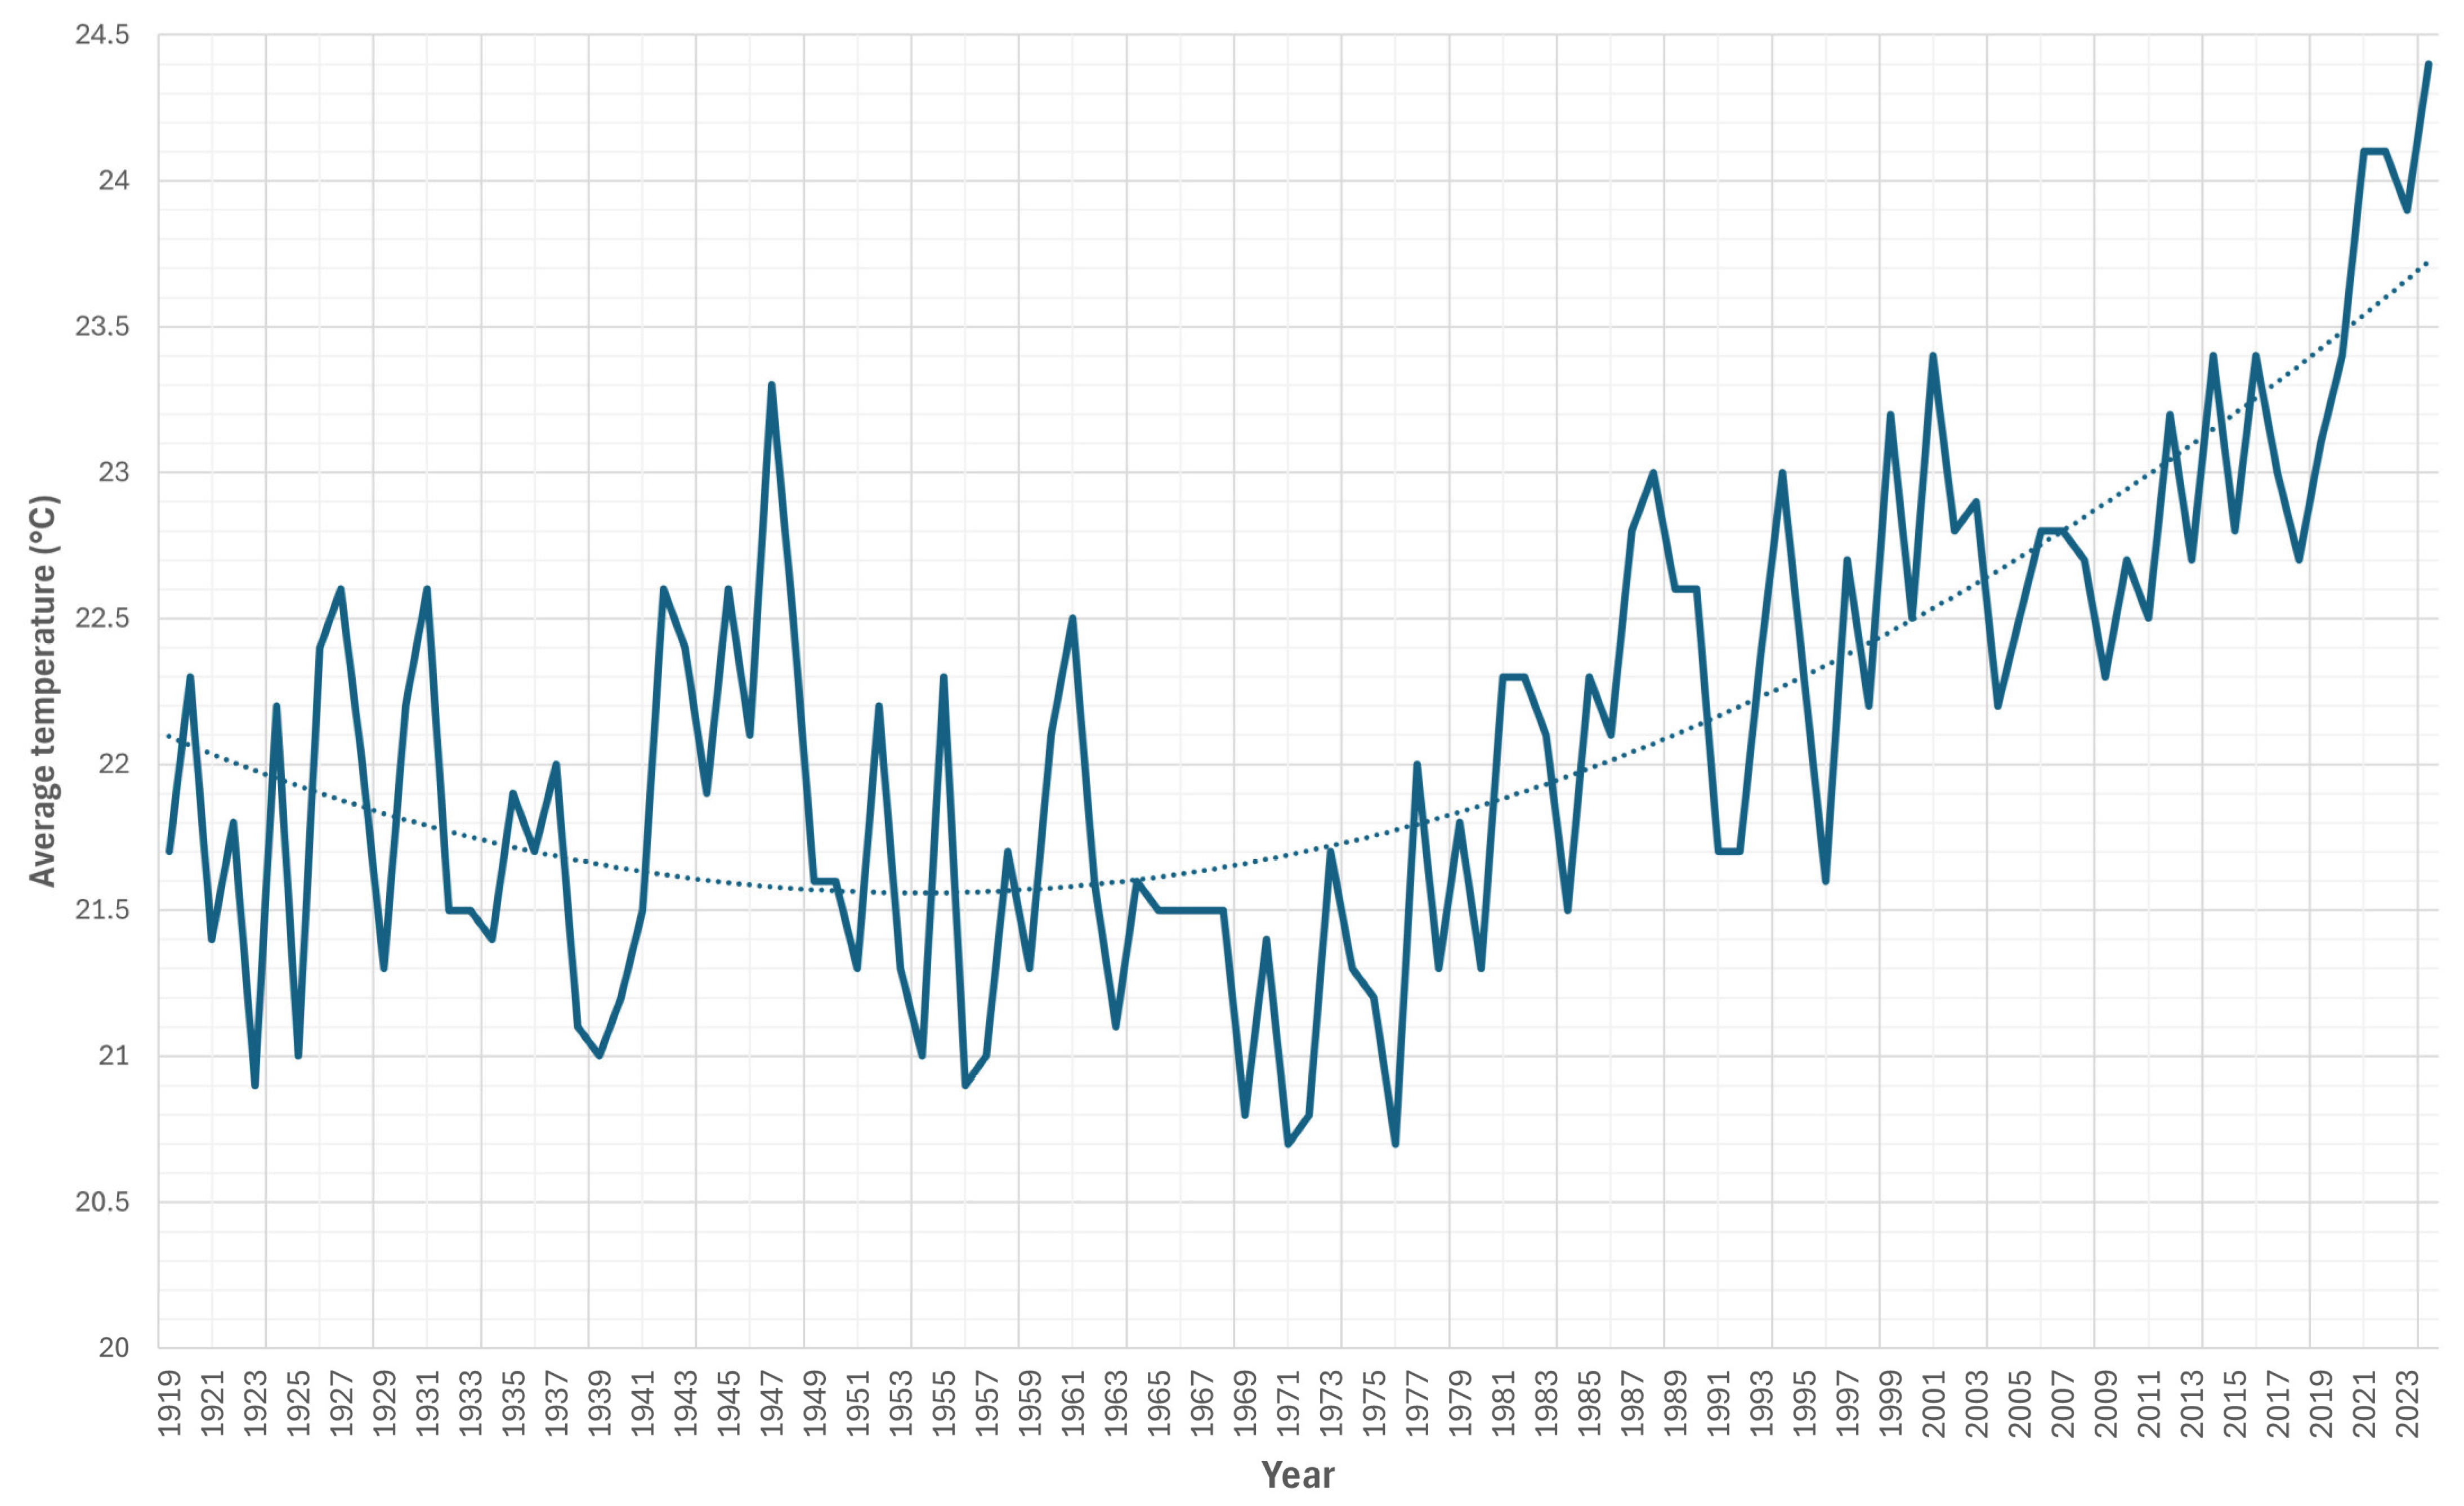
In Biskra, where reliable temperature data has been available since 1919, the average temperature increased by 1 °C between the periods 1919–1976 (21.66°) and 1977–2024 (22.64°). This corroborates broader data on global temperature trends (Figure 8). For the period 1919–2024, the best fit is achieved using a second-degree polynomial (dotted line). In this case, the coefficient of determination (R2) is 0.56, compared to 0.35 for a linear fit. The coolest period was in the 1950s.

4.1.2. Precipitations

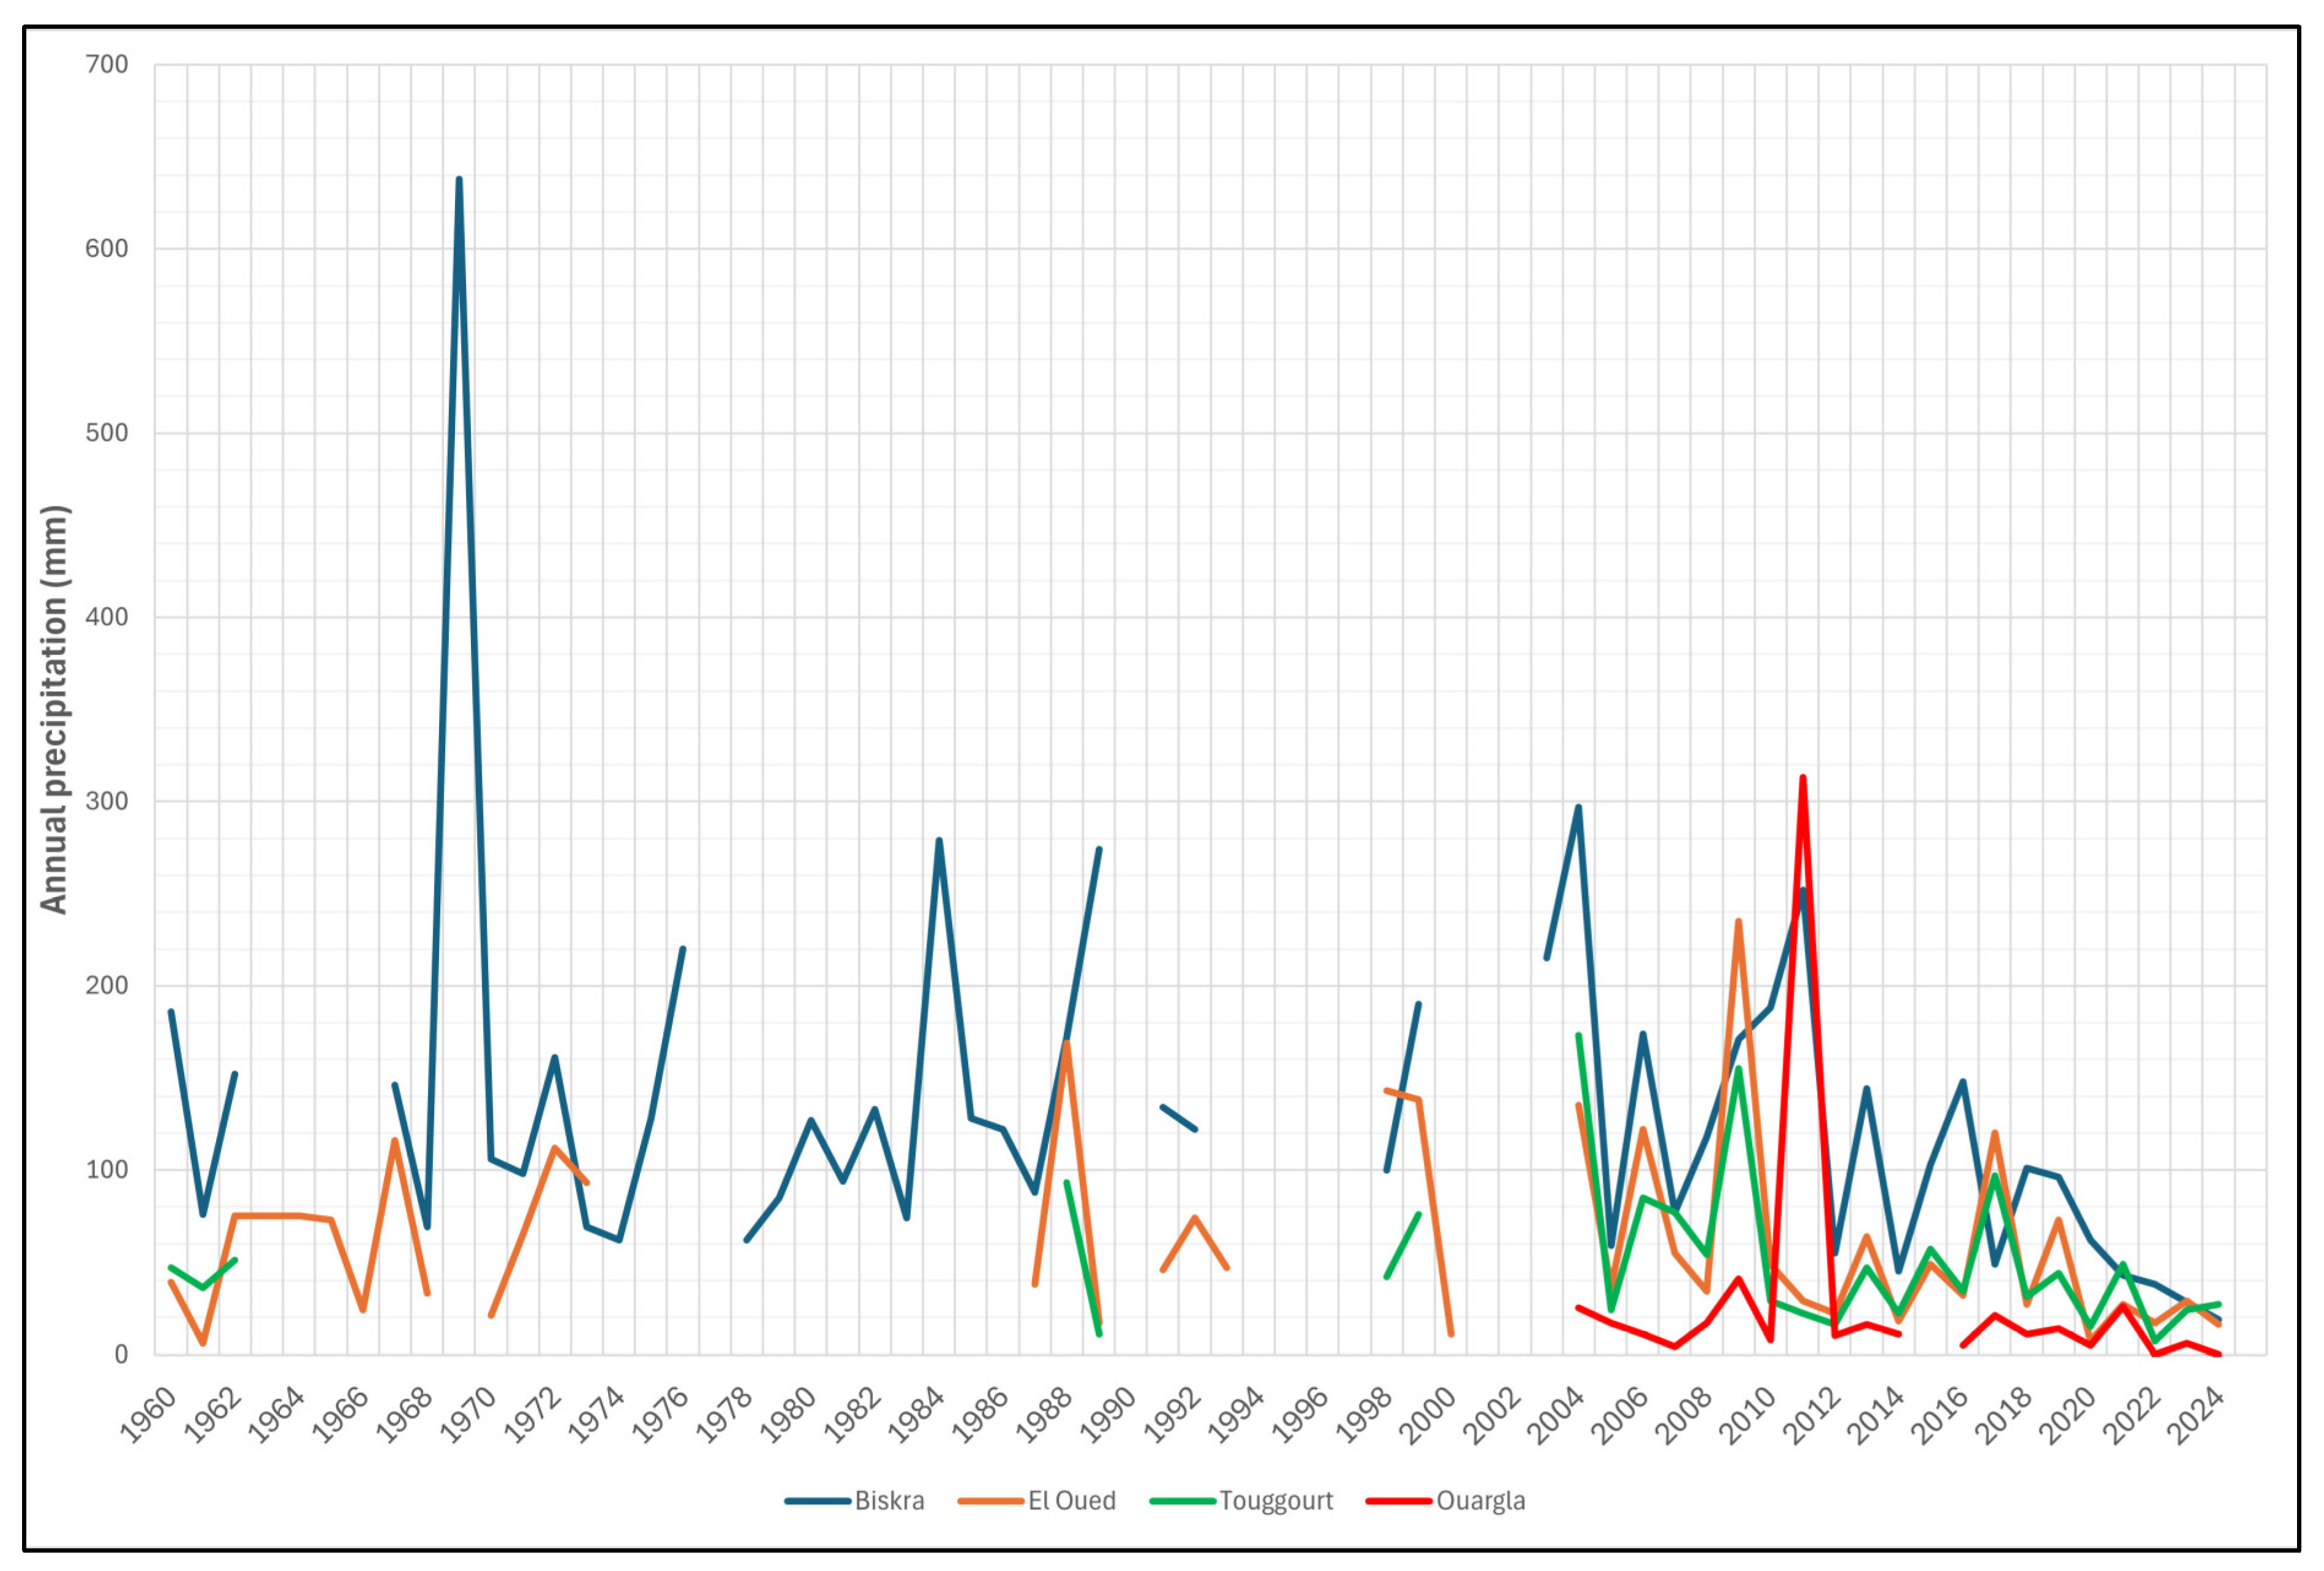
Precipitation is much more complex to analyse, and averages are not very meaningful. In fact, the standard deviation is often greater than the mean (see Table 1). Additionally, the available data is often incomplete, making it difficult to characterise the main flood events (Figure 9). However, it should be noted that Ouargla, in a more desert-like location, receives an average of only 30 mm of rainfall per year (1960–2024), whereas Biskra, near the Aurès Mountains, receives around 130 mm. El Oued and Touggourt show intermediate values of around 50–60 mm, as does Tozeur in Tunisia (not plotted in Figure 9). The maximum amount recorded in Biskra was 638 mm in the exceptional year of 1969 (299 mm in September and 151 mm in October). Yearly values higher than 200 mm were relatively frequent in the 1980s (279 mm in 1984 and 274 mm in 1989), 1990s (at least 292 mm in 1995), 2000s (297 mm in 2004) and 2010s (252 mm in 2011). The last 15 years have been much drier though, with the driest years being 2022, 2023 and 2024, with only 38 mm, 28 mm and 19 mm of rainfall, respectively.
There is almost no regional precipitation during the summer months (June to August). In Biskra, rainfall is most frequent between September and April, peaking in January at around 22 mm. According to Boutouga [32], the T’Kout station, which is located in the Aurès Mountains, experiences the highest average annual rainfall of 307 mm, peaking at 40 mm in September. By contrast, M’Ziraa, which is located at the base of the foothills, is the driest station, with only 67 mm of rainfall (peaking at 16 mm in February), despite being just 50 km east of Biskra.

4.2. Analysis of the Satellite Data (1964–2025)

4.2.1. CORONA Data

Analysis of CORONA data records reveals some interesting information. Summers in the 1960s were characterised by dry chotts, particularly in June–August 1964, June 1965, July–August 1967, July–August 1968, and August 1969. However, two periods of flooding are also evident. One notable period occurred in Chott Melrhir and the northern part of Chott Merouane between December 1967 and January 1968, with two images acquired on 20 December 1967 and 26 January 1968. The other period of flooding is more unusual, as it occurred in June across all the chotts (Melrhir, Merouane and Bel Jeloud), as can be seen in an image taken on 6 June 1970. Unfortunately, the major flood events of 1963, 1964 and especially 1969 are not covered by CORONA imagery.

4.2.2. LANDSAT Data (Before 1994)

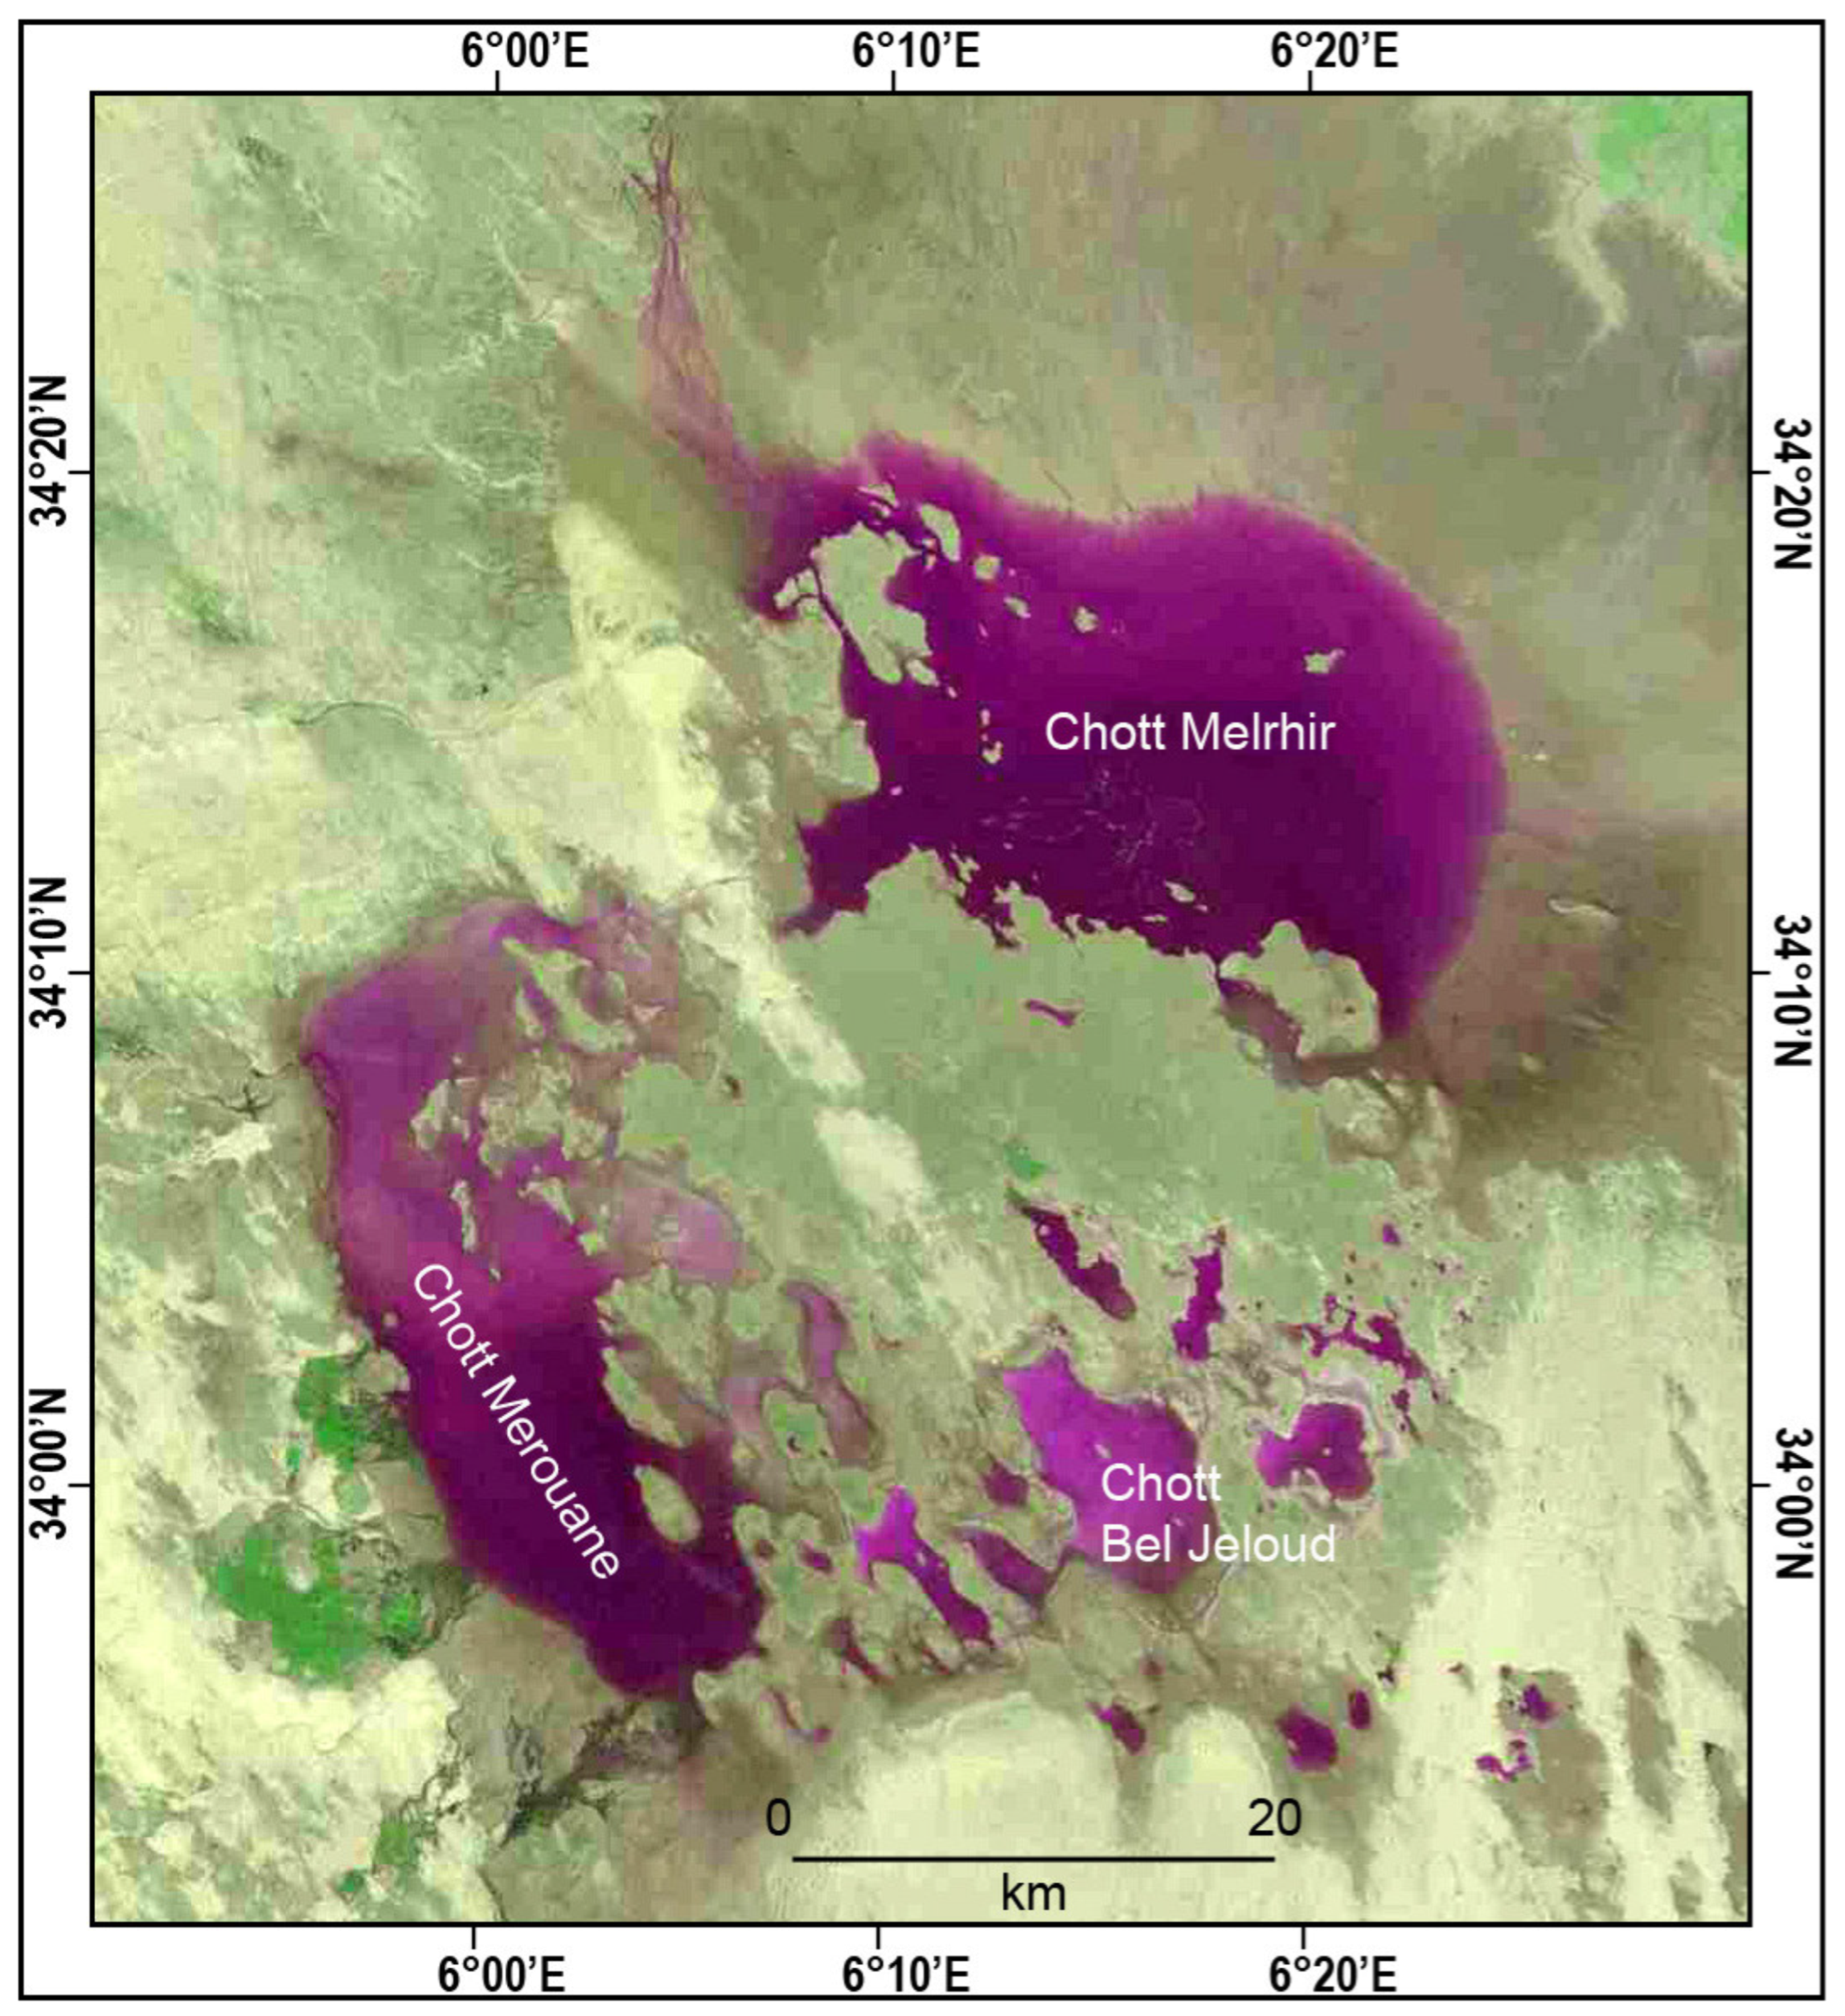
The dataset, which was compiled using Landsat imagery taken before 1994, highlights several major flooding episodes in Chott Melrhir. These occurred in November 1972, from December 1976 to February 1977, in January 1978, in November 1978, in February–March 1983, in June 1990 and in November 1992. Chott Merouane was also full during the events of 1977, 1978 and 1983. The dataset shows two distinct filling phases in March 1979 and March 1981. Figure 10 shows the situation in January 1977, which was one of the periods of major flooding, with a total score of 23 (sum of the five individual scores).

4.2.3. MODIS Data and LANDSAT Data

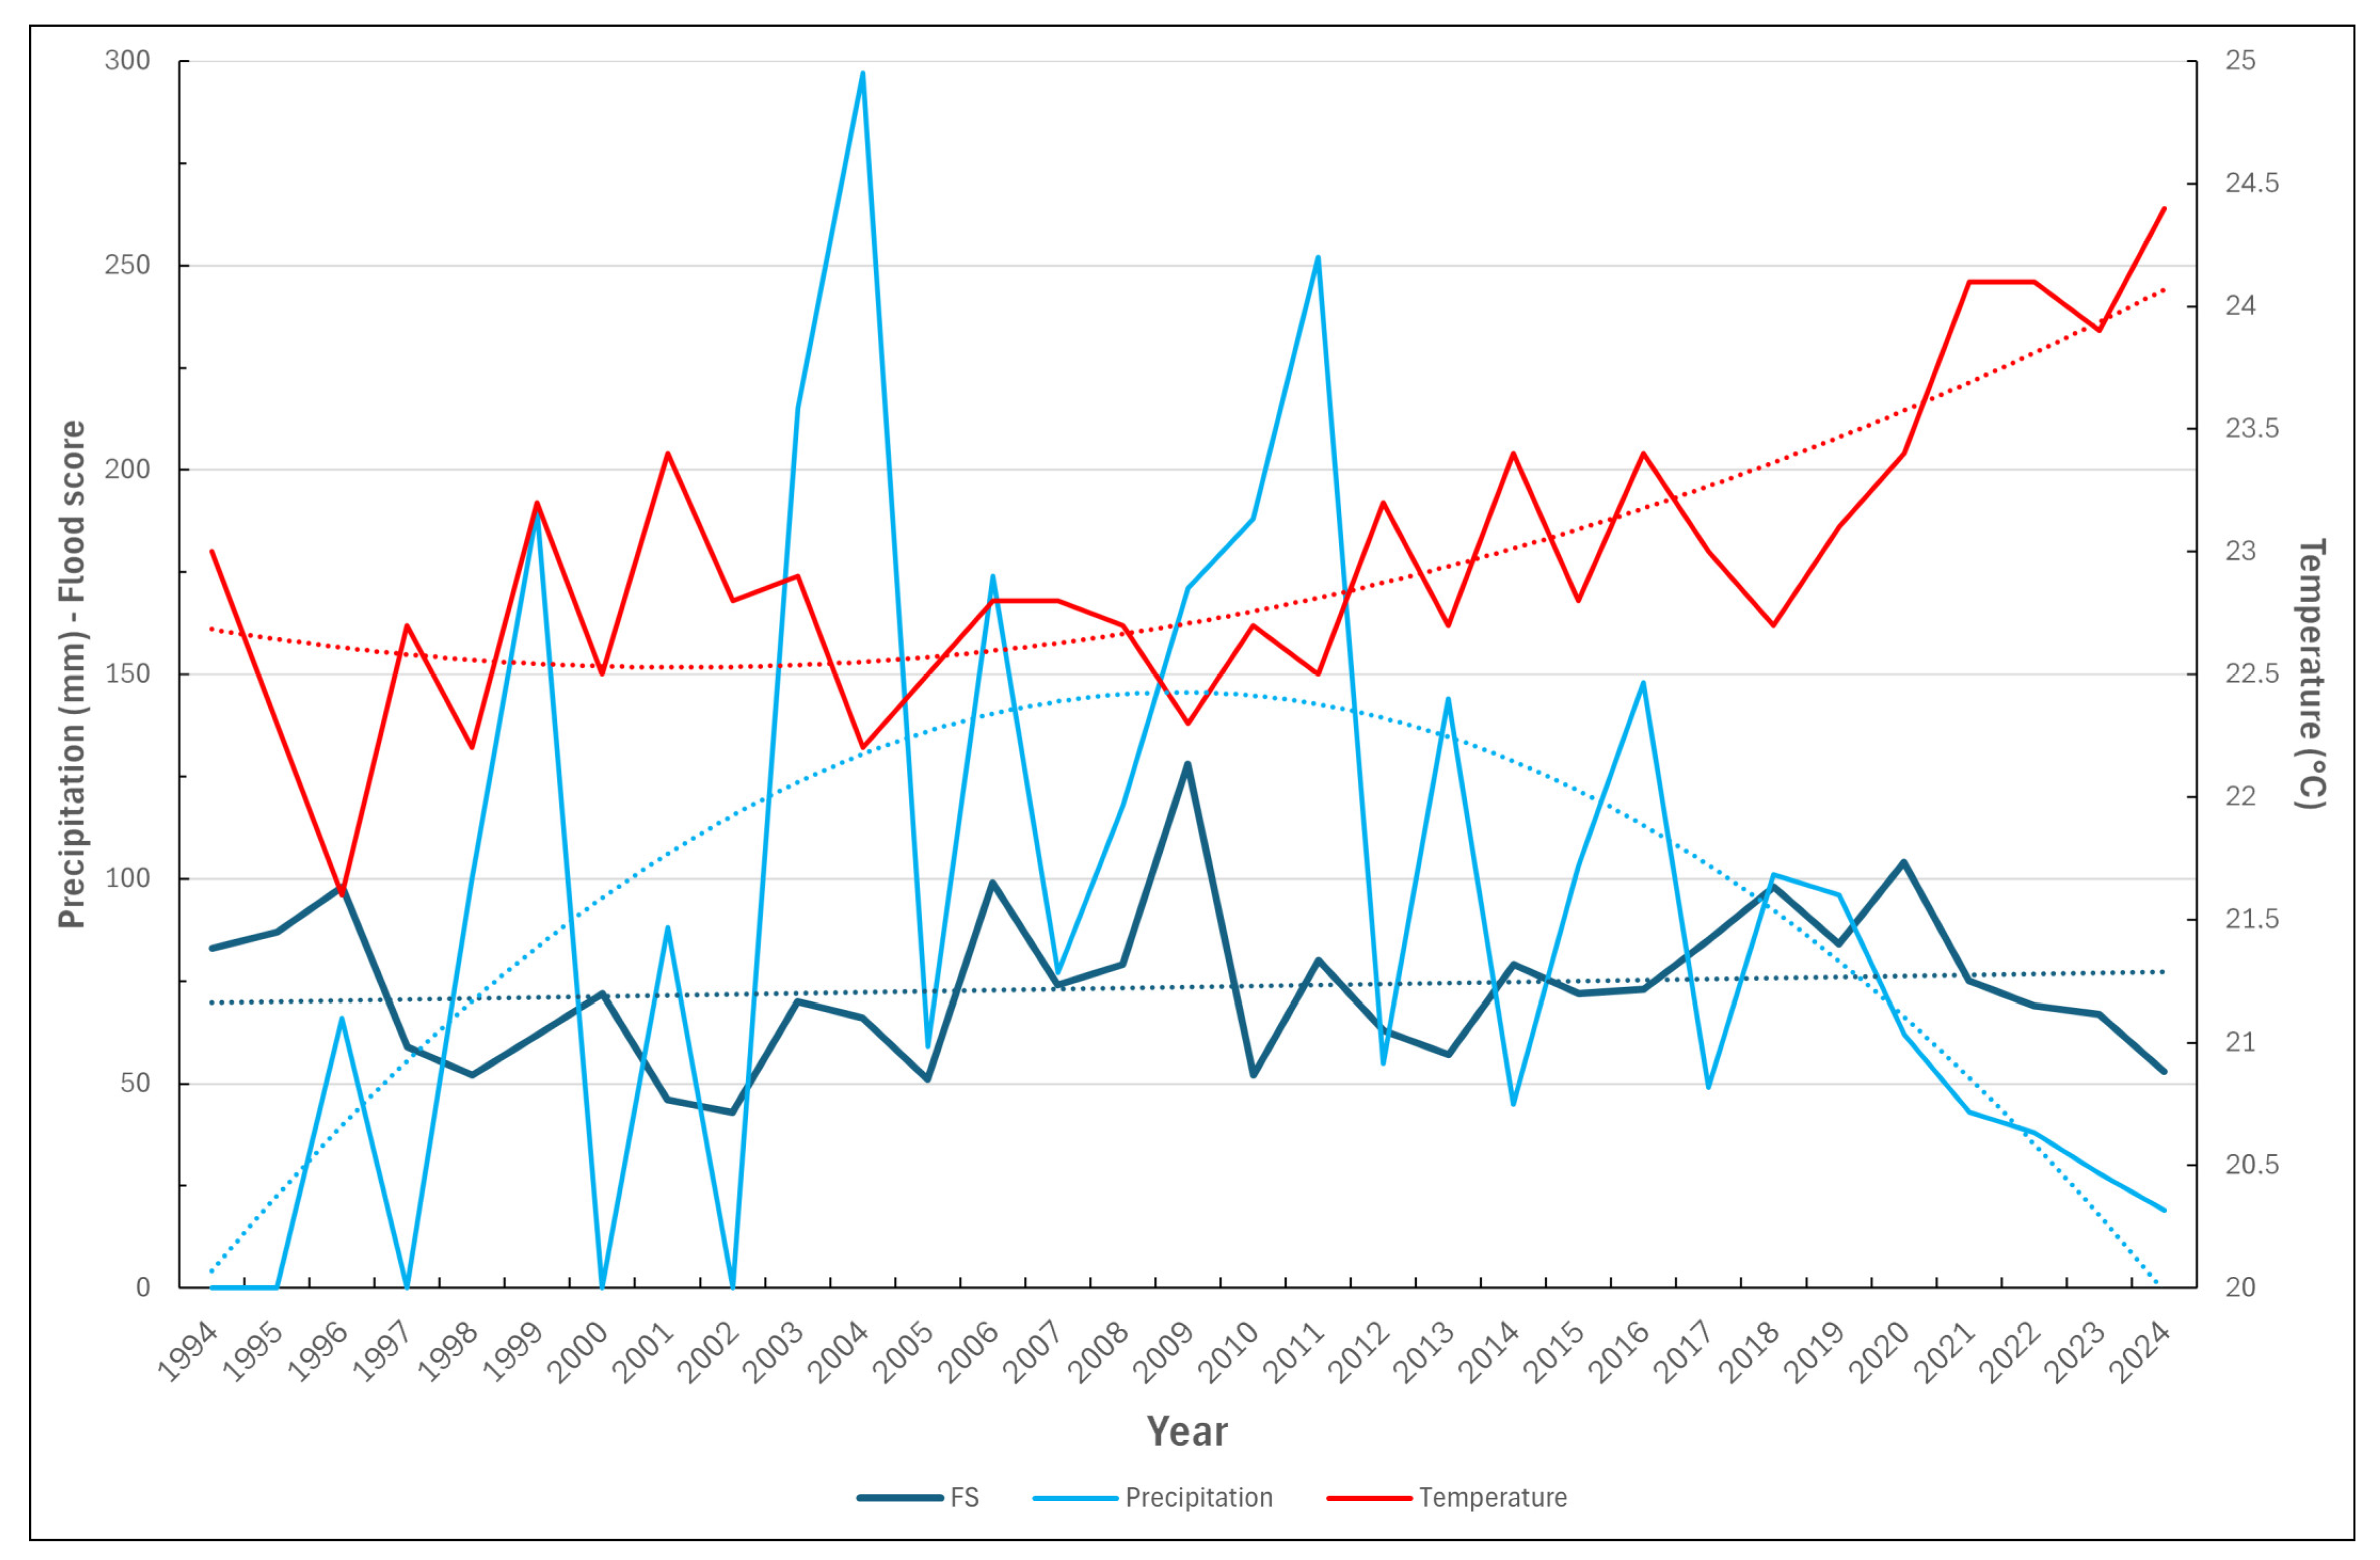
We utilised data from the last three decades (1994–2024) to examine contemporary trends concerning the potential correlation between flooding in the Chotts, temperature, and precipitation. As illustrated in Figure 11, the analysis presents the mean values for the Biskra weather station, along with the flood score, defined as the cumulative total of the monthly values calculated for each of the five predefined sectors. The optimal fit is demonstrated for each dataset. The flood score trend demonstrates a high degree of linearity, with minimal variation. Conversely, there has been an observed increase in the rate of warming in recent years, while precipitation levels have decreased significantly following a period of relative abundance in the early 2000s. From a statistical perspective, there appears to be no obvious correlation between the data series. However, a negative linear correlation between temperatures and precipitation is observed, with an approximate value of −0.5, indicating a rise in temperatures and a fall in precipitation. The 1994–2024 dataset enables us to identify the recent wettest periods in the Chott region.
As we have a continuous chronicle, it is possible to see whether there are significant differences between the years. (Figure 11). In evaluating the flood score, it is notable that the three years with the lowest water levels in the chotts were 2002 (43), 2001 (46) and 2005 (51). On the contrary, the three years with the highest water levels recorded in the chotts were 2009 (128), 2020 (104), and 2006 (99). Given the disparity in these values, it is not possible to identify a clear trend over the thirty-year period. There appears to be no clear correlation with rainfall, as the last three years (2022 to 2024) have seen the least rainfall, whereas the wettest years fall in the middle of the period: 2004 (297 mm), 2011 (252 mm) and 2003 (215 mm). The maximum recorded temperature was recently in 2024 (24.4°), 2021 and 2022 (24.1°), whereas the 1990s and the beginning of the 2000s are evidently cooler (21.6° in 1996, 22.2° in 198 and 2004). This finding corroborates the discernible trend of an association between elevated temperatures and diminished precipitation.
If we now consider the monthly readings for all the chotts, we can see that March–April 2009 and April 2017 are the two periods with the highest scores (22 out of 25 points). Next are February–March 2006 (20 points), February–March 1996, and November 2008 (19 points). Finally, January 2006 and March 2014 scored 17 points. Unsurprisingly, all of these periods tend to fall within the ‘winter’ months (November to April).
Looking at the specific behaviour of Chott Melrhir, Chott Merouane and Chott Bel Jeloud, we can see that Melrhir operates independently of the other two. Furthermore, its two main flood periods were December 2011 (10 out of 10 points) and November 2018 (9 points), which were not previously mentioned. In contrast, the other periods are recorded with a score of 8. A specific period for Melrhir should be added: September–October 2020. This will be illustrated later using Sentinel-2. Chott Merouane reached maximum water levels in February–April 2009 (10 points) and in April 2017 and February–March 1996 (9 points). It is affected by the other events mentioned above that have a regional impact (8 points). However, it has experienced significant filling in recent years, particularly in March 2022, February–April 2023, and February–April 2025 (also scoring 8 points). This appears to be related to specific drainage conditions associated with the Oued Righ, and more generally to runoff management in an area that is much more heavily developed than Chott Melrhir. Chott Bel Jeloud is fully correlated with Chott Merouane in terms of major flooding. However, it does not appear to have been affected by the recent flooding of Chott Merouane in 2022, 2023 and 2025.
Looking at changes in the extent of flooding over a ten-year period reveals some interesting trends (Table 3). Chott Merouane S shows an increasing score, indicating that the area covered by water is increasing on average. The same upward trend is also evident in Merouane N, but the situation is different in Chott Melrhir W, where the score for the last decade (2014–2023) is virtually identical to that for 1994–2003. Chott Melrhir E shows a slight increase in its cumulative score, but its average score remains low compared to Melrhir W (0.4 vs. 1.1). Chott Bel Jeloud shows less significant variations, comparable to those of Melrhir E.
It should be noted that Merouane S has the most consistent water body, with a score of 3.0 between 1994 and 2025. The values are 2.6 for the 1994–2003 decade and 3.3 for the 2014–2023 decade, seemingly confirming the trend towards more active functioning, which is undoubtedly linked to anthropogenic factors such as the development of oases and irrigation systems and urban development in El Meghaier in particular.
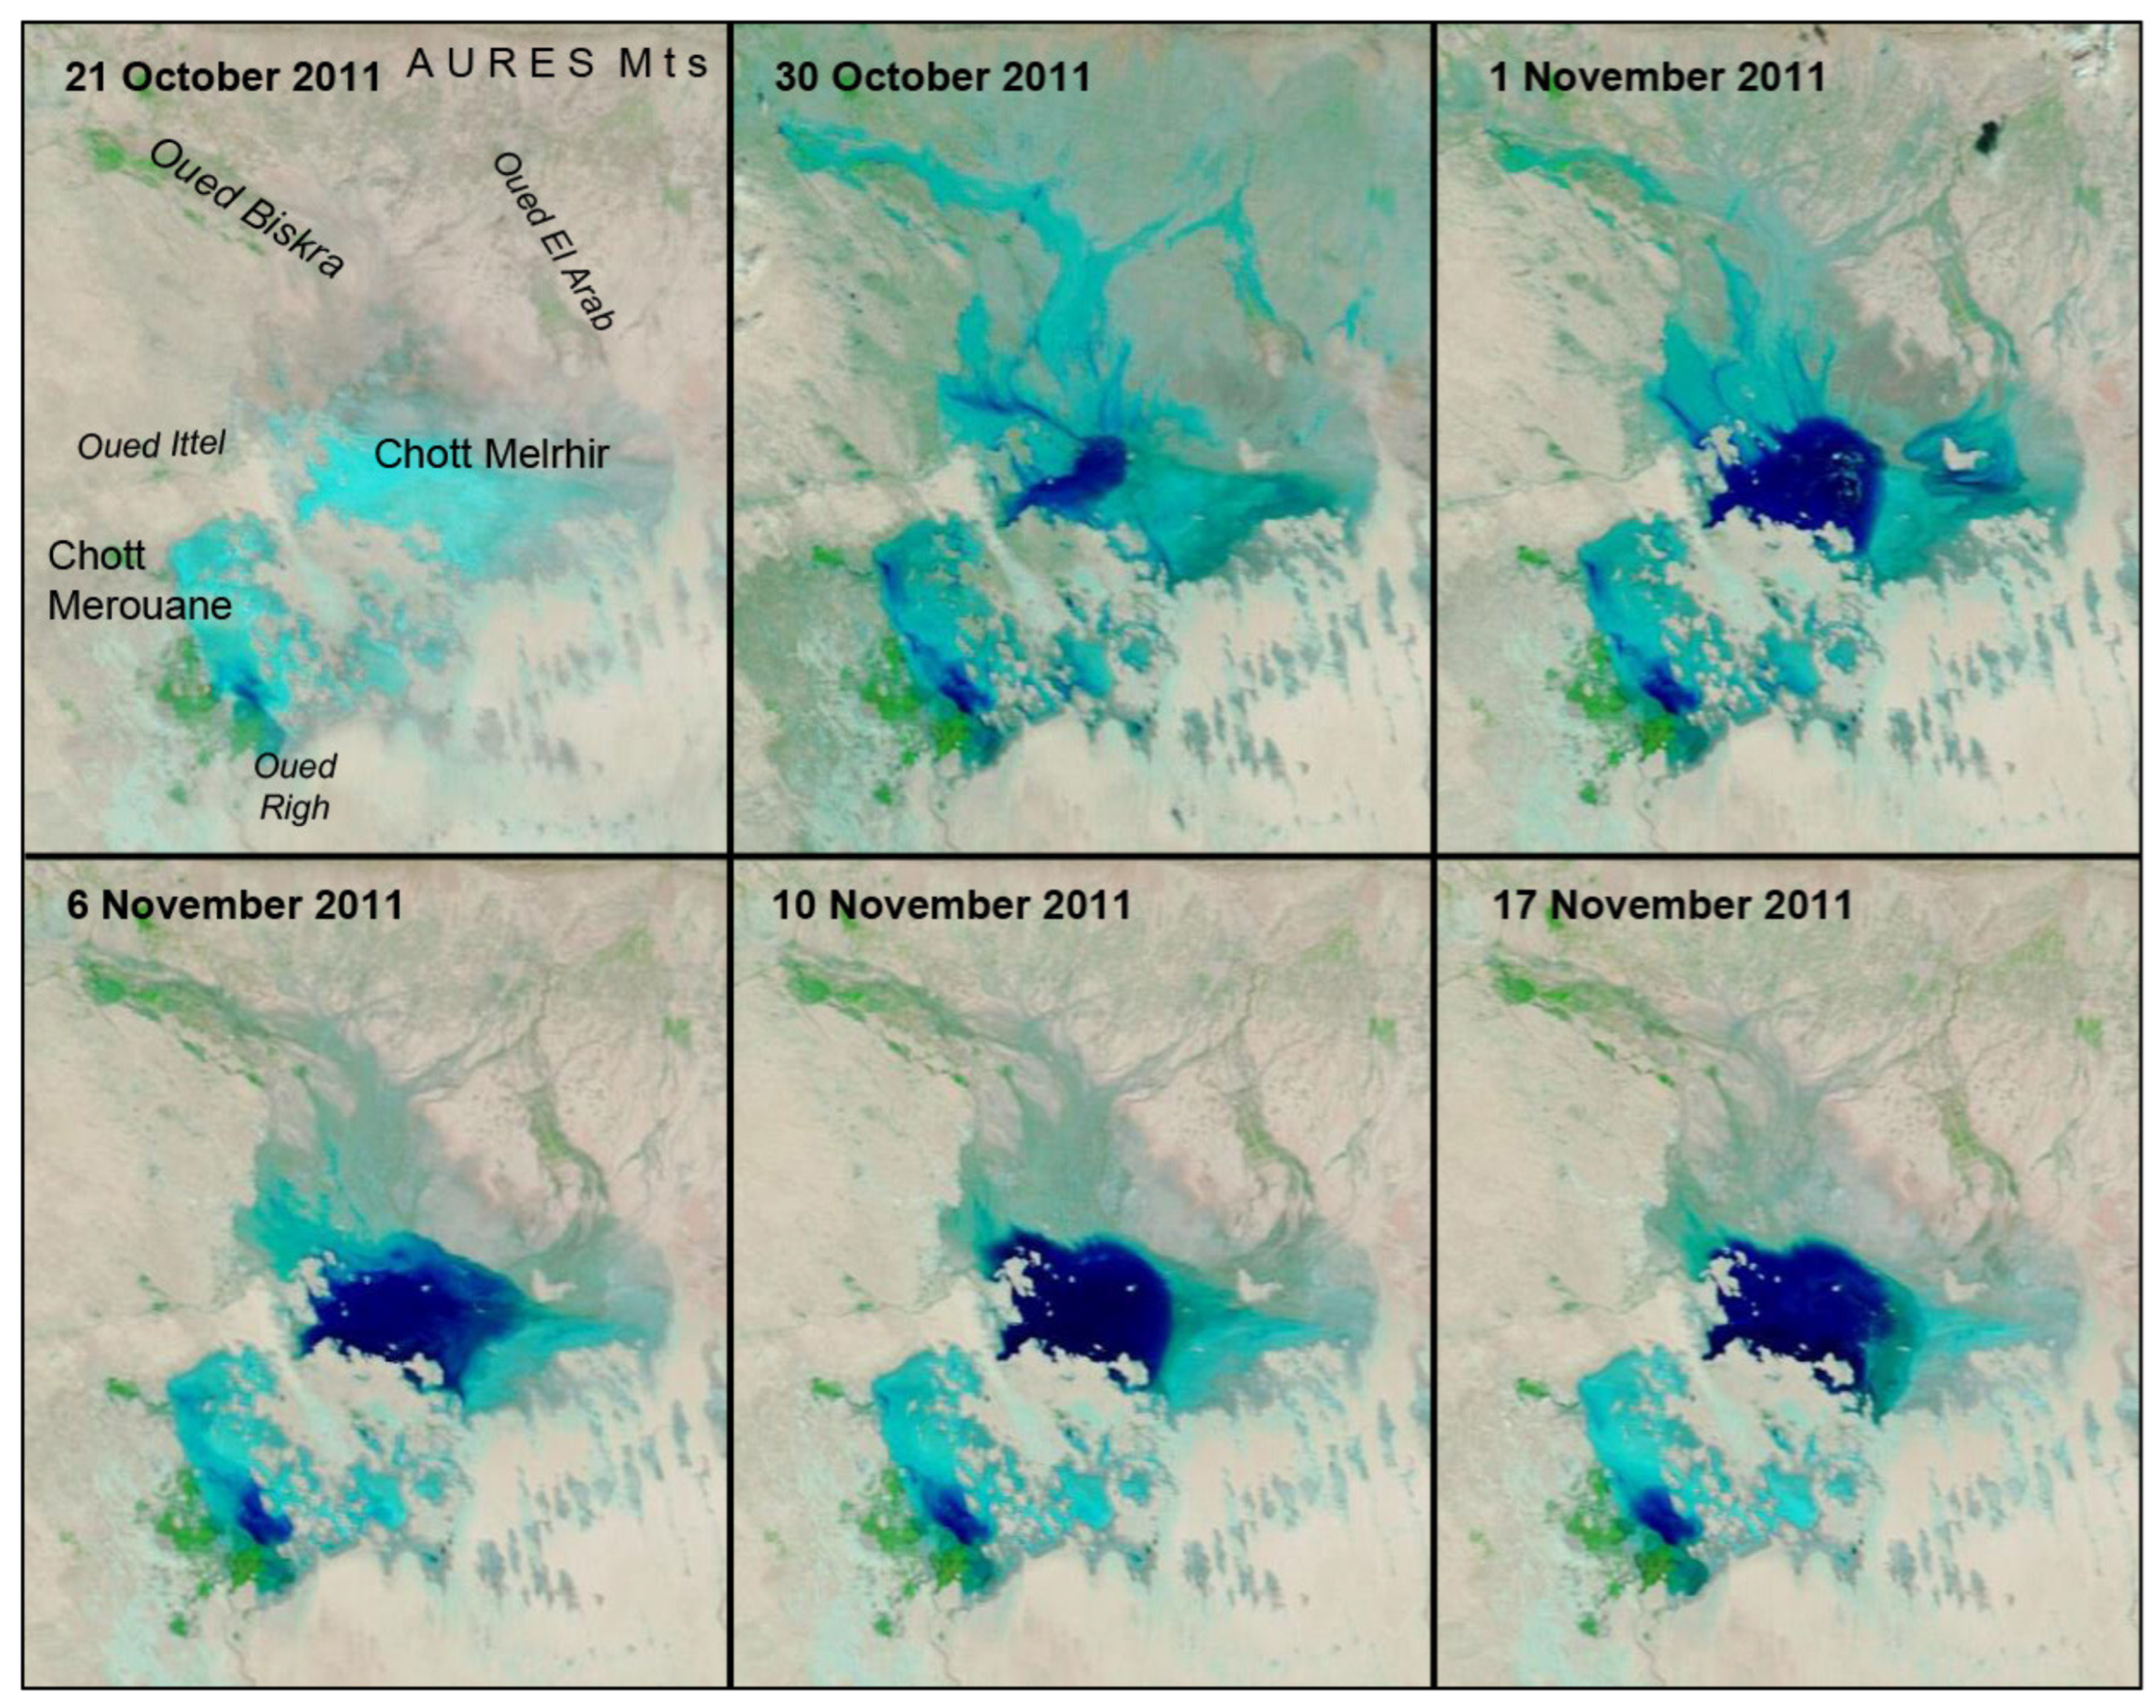
To illustrate the interest of the MODIS data, we present the example of the autumn 2011 flood, which was specific to Melrhir W (Figure 12). Daily MODIS records show that the area remained dry until 21 October, except for the usual water body at the mouth of the Oued Righ (south of Merouane S). While it is not possible to rule out two minor episodes on 22 and 24 October, the main rainfall event occurred on 29 October. The image from 30 October shows very active runoff, with channels (in dark blue) visible despite the low spatial resolution (250-metre pixels). Filling begins in the central part and develops further in the 1 November image, with changes to the channel network and the continued presence of wide north–south-oriented drains. Runoff is also important for the Melrhir E. The rainfall episode appears to have affected the northern part of Chott Merouane slightly and the southern part more significantly, without, however, filling beyond stage ‘3’.
Between 1 and 6 November, the sabkha lake in the Melrhir W expanded from 245 km2 to 378 km2 (an increase of 54%). Then, as the traces of runoff diminished, the water body became more concentrated. By 10 November, only 331 km2 remained, and by 17 November, this had decreased further to 304 km2. It should be noted that further rainfall occurred a few days later, and the sabkha lake in the Melrhir W remained substantial until March 2012.

4.2.4. Sentinel-2 Data

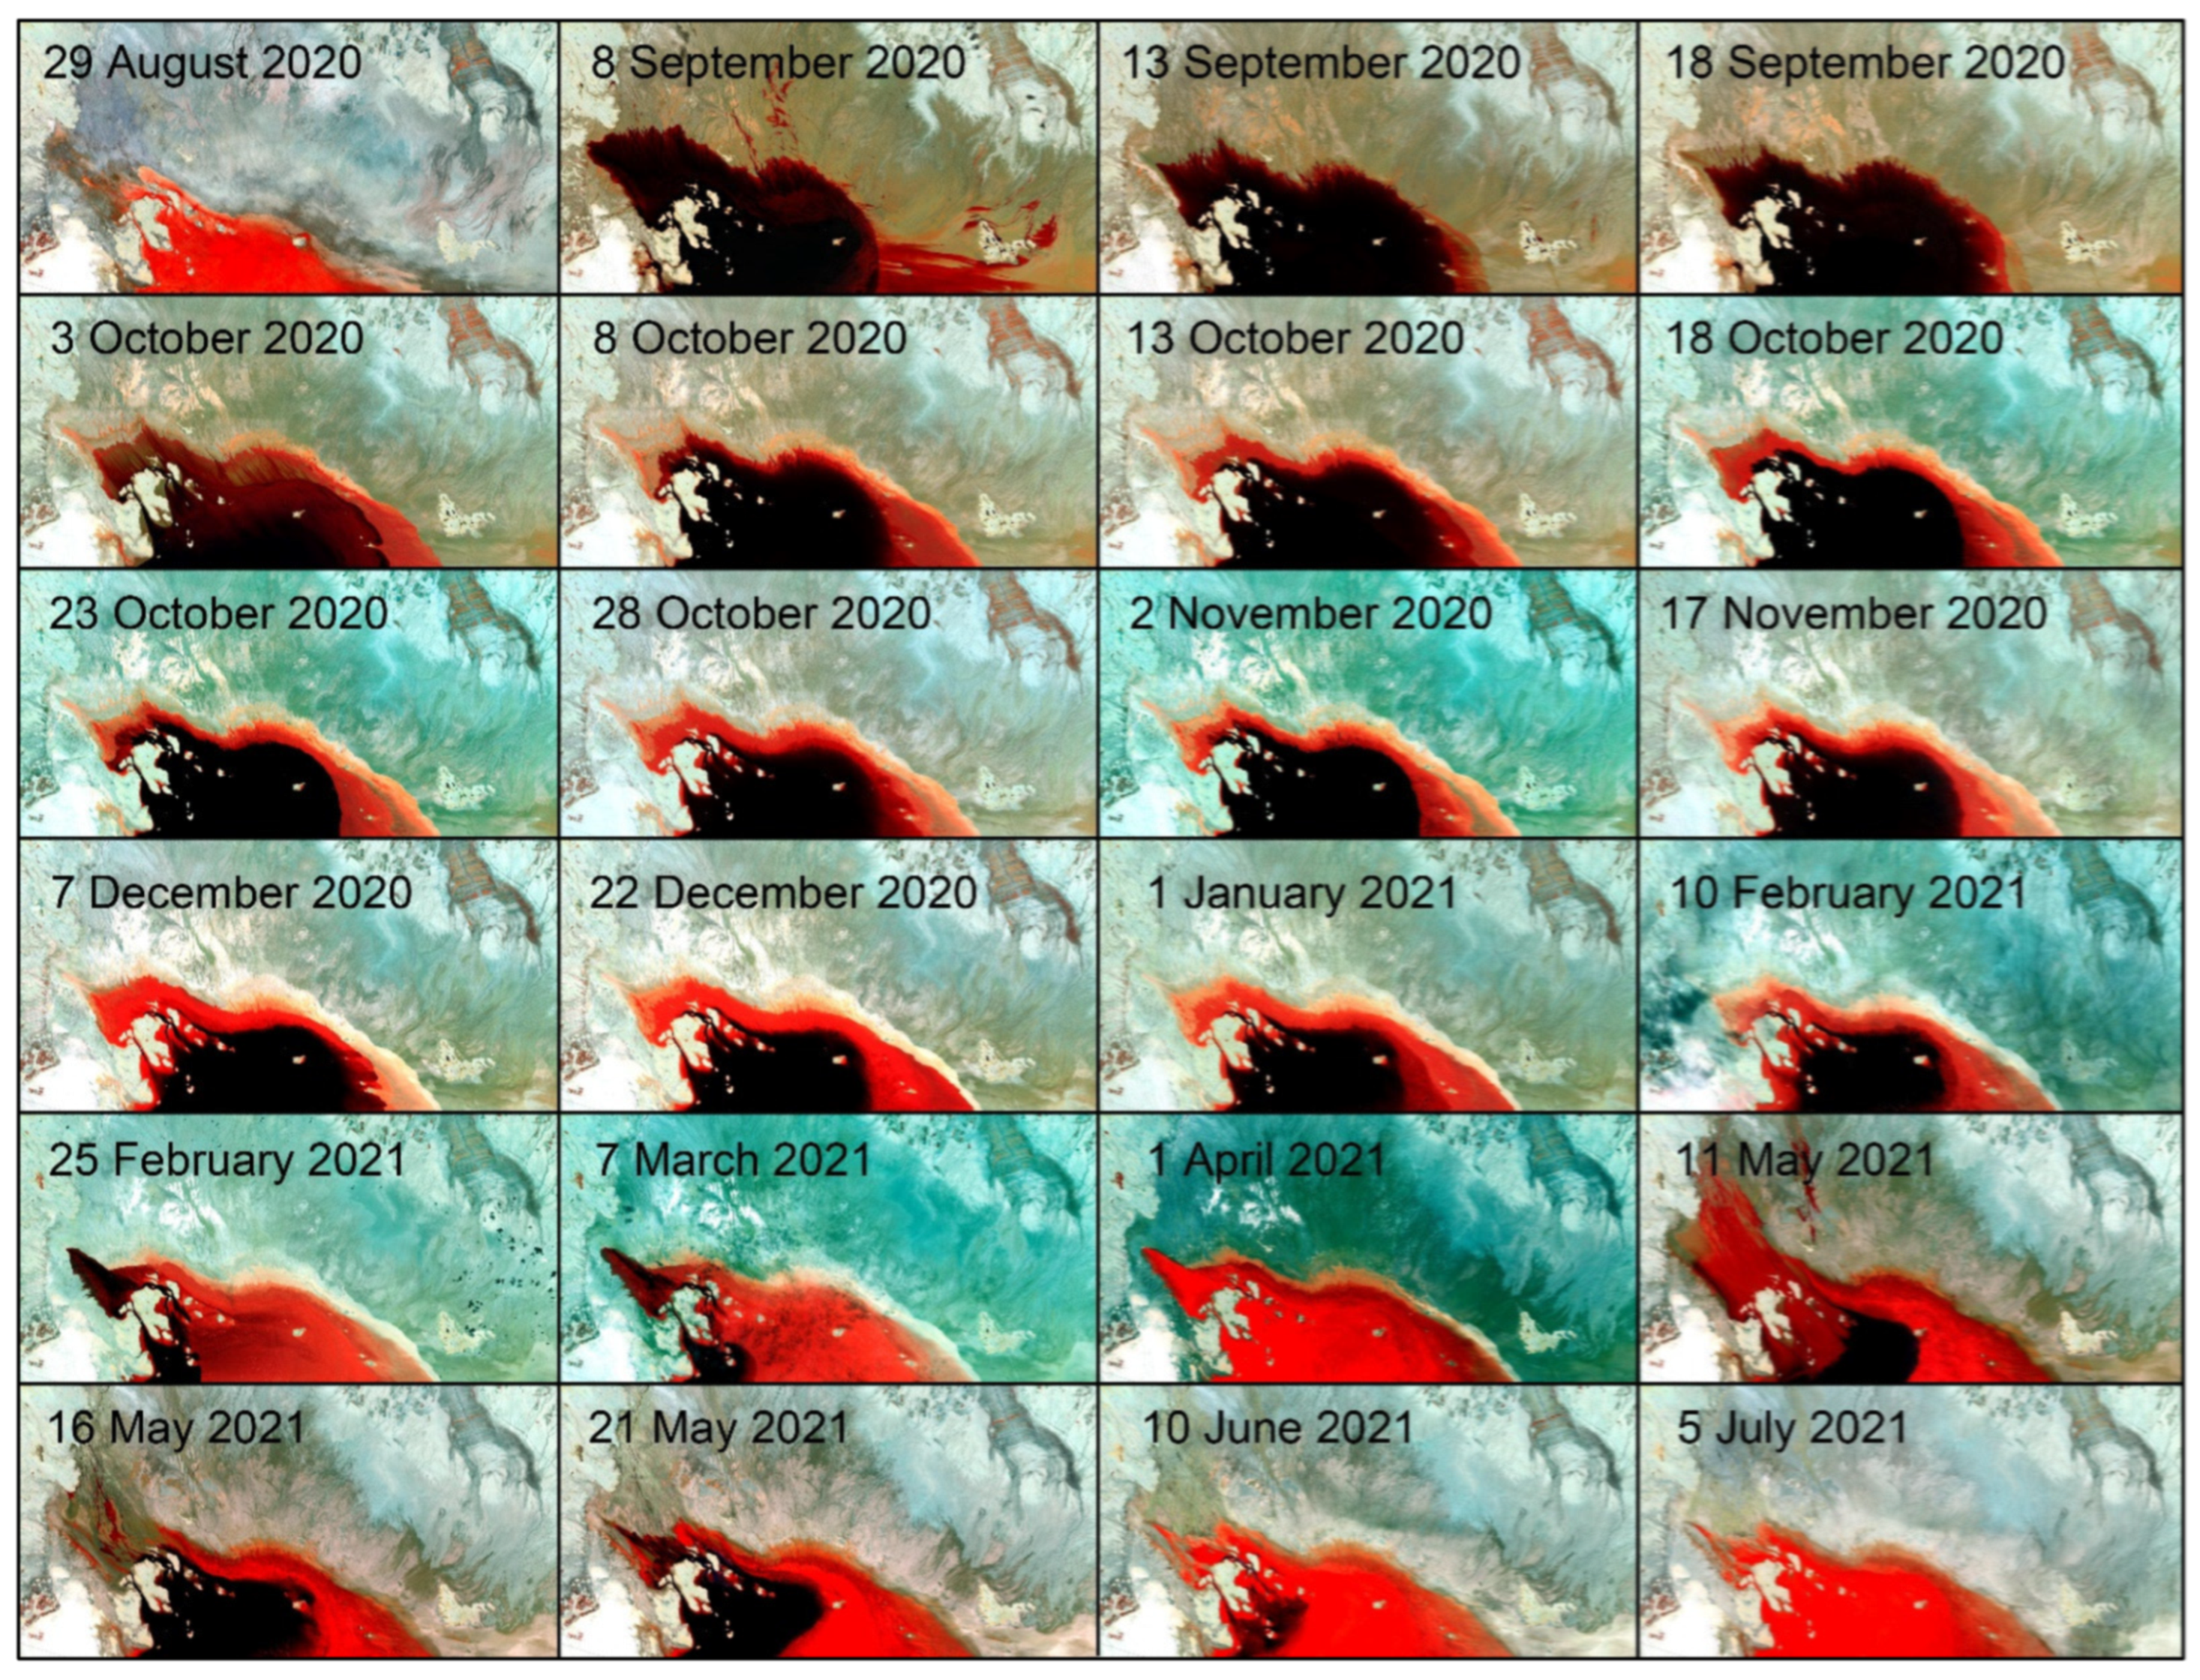
The evolution of the northern part of Chott Melrhir has been studied using a time series comprising 24 images covering 60 km × 40 km each (Figure 13). Two Sentinel-2 satellites (S2A and S2B) were operational in 2020–2021, enabling a revisit period of five days (i.e., approximately 73 images over the course of a year). A detailed analysis of the Sentinel-2 image T32SKD sequence covering the 2020–2021 hydrological season is supplemented by daily MODIS data to allow for finer temporal resolution and precise characterisation of rainfall events. The baseline Sentinel-2 image was taken on 29 August 2020. At this time, Chott Melrhir was experiencing the maximum of the summer drought, with no trace of water detected. The evaporite deposits associated with the previous hydrological cycle are clearly visible as a red-orange hue. The first rainfall event (RE1) occurred on 3 September amid intense cloud cover.
The initial post-RE1 Sentinel-2 image was obtained on 8 September. The image reveals rapid filling in the centre of Chott Melrhir and in the east, where intense runoff coming from the east and north-east (Oued El Arab) is evident. It is also the case on the north-western edge, at the confluence of the lower reaches of the Oued Biskra and the Oued El Abiod, which are the area’s two most significant drainage channels. Traces of runoff from the Oued Mestaoua can also be seen here. This river originates in the Aurès Mountains to the north. The estimated surface area of the sabkha lake is 311 km2. It should be noted that a maximum of 100 km2 of potential sabkha lake located to the south (T32SKC) is not represented in this image. The subsequent two images are of particular interest as they were captured five and ten days after the previous one. On 13 September, the body of water underwent a movement in an eastward direction. It retreated from the areas downstream of the Oued Biskra, extending eastwards by almost 4 km, while the northern part remained relatively stable. By 18 September, the sabkha lake had stabilised in the east. However, it had advanced slightly northwards (by around 1 km) in the central part of the chott, while receding very sharply (by over 5 km) to the west and north-west. By 13 September, a substantial decrease of 271 km2 (representing a 13% decrease) in the surface area of the water body had been recorded. However, by 18 September it had relatively stabilised at 266 km2. On 3 October, a reduction in the water surface area was confirmed in the west and north. Although no further rainfall had been recorded at this stage, the body of water was moving rapidly eastwards, possibly due to the wind. The surface of the water, which is usually completely black, appeared to be rippling slightly, giving it a reddish hue. On 8 October, the situation changed dramatically. The sabkha lake had refilled and become more concentrated. It covered an area comparable to that on 8 September to the east, and parts of areas lost to the west and north-west had been reclaimed by the water. MODIS data enabled us to identify a second rainfall event (RE2) on 5 October that was of lower intensity than RE1. On 8 October, the total surface area of the sabkha lake was measured at 231 km2, representing an increase of 23% in comparison with the RE2 event size. The same phenomenon observed in September following a spell of rain can be seen on 13 October. The western and northern areas dry out significantly while the body of water extends eastwards by a few kilometres. The total surface area is 217 km2. On 18 October, the sabkha lake shifted westwards, but its total surface area remained stable. Light rainfall cannot be ruled out on 17 October. However, there are no signs of heavy enough rainfall for the sabkha lake to reclaim part of the western area. Furthermore, the formation of an evaporitic crust is significant in the eastern areas that have been freed by the water. This leads us to hypothesise that the water body is subject to wind effect. By 23 October, the situation in the east had stabilised completely. The water level fell slightly in the north. However, it appeared to be advancing westwards once again. The surface area of the sabkha lake is 194 km2. On 28 October, the trend reversed once more, with a noticeable advance in the east and a reduction in the north and west. The total surface of the sabkha lake is 180 km2. The west lost 4 to 5 km. On 2 November, the pendulum-like movement was confirmed once more, with a slight reduction in the east and an increase in the west, though not to the level observed on 23 October. The total surface of the sabkha lake is 186 km2. On 7 November, a reduction was observed for the first time across all sectors simultaneously, though this was fairly limited due to the low autumn temperatures (image not included in Figure 13). This situation appears to be temporary, as the previously observed pendulum-like trend reappeared from 17 November, with a reduction in the west and north, but a significant advance of approximately 1 km in the east of the water body. In the absence of further rainfall, the surface area of the sabkha lake continues to shrink slightly, reaching 174 km2. During this period, from early October to early December, no rainfall was recorded. On 7 December, the Sentinel-2 image showed an apparent eastward movement of the body of water in the form of several kilometre-long tongues. However, the MODIS image shows no real change on that date, suggesting that this is likely an effect caused by winds spreading the water. This would confirm the role of winds in the general movement of the water mass. In addition, the sabkha lake covers roughly the same area as previously, at 172 km2. A brief spell of rain occurred on 9 December (RE3). However, there were several periods of cloud cover until 21 December, so further light rain cannot be ruled out. A Sentinel-2 image showing heavy cloud cover in the north and clear skies over the chott (not included in Figure 13) suggests that the body of water has spread eastwards by at least 8 km. This extension is visible in the 22 December image as a red-orange boundary to the east, which corresponds to the evaporitic crust. On this date, the water body is stable to the west, forming wide channels. Its surface area has been reduced to 159 km2.
The situation remained relatively stable in January 2021, with a significant reduction in the water surface area between 1 January (136 km2) and 10 February (112 km2). By 10 February, the sabkha lake appeared to be relatively concentrated. Daily MODIS data indicates a new rainfall event (RE4) on 4 February, affecting the subsequent images (showing flooding in the western sector), but the effects appear to have already subsided by 10 February. However, it was the fifth rainfall episode (RE5) that caught our attention. This occurred on 22–23 February. Surprisingly, the sabkha lake seems to have completely disappeared in the east by 25 February (compared to 10 February). It is concentrated in the channels of the western region, covering an area of just 52 km2. Traces of runoff in the western area are clearly visible in the 25 February image. The Sentinel-2 image of the sabkha lake on 7 March shows a similar pattern to that on 25 February, with water concentrated to the west. This indicates significant evaporation of the 29 km2 water body. From that date until April, the lake dried up rapidly due to rising temperatures and a lack of rainfall. Consequently, the 1 April image shows the chott completely dry for the first time since late August 2020. Only two narrow channels remain between the main island of Chott Melrhir, covering an area of less than 0.4 km2. MODIS images also reveal that the drying-up process was complete by 23 March. However, no Sentinel-2 data is available for this period as it was dry but fairly cloudy. April remained dry until the wet period between 30 April and 6 May (RE6), which did not immediately result in the reappearance of the lake. MODIS indicates the reformation of the water body as early as 9 May, which was confirmed by Sentinel-2 on 11 May. Traces of heavy runoff are visible in the lower valley of the Oued Biskra. The water then tends to concentrate towards the centre of the depression. The sabkha lake covers 55 km2. On 16 May, the flow appeared to continue despite a lack of rainfall, suggesting the significant role played by underground water flow. The lake covers an area of 140 km2 and has spread into the channels of the lower Oued Biskra valley. Meanwhile, the eastern sectors have begun to dry up. This trend was confirmed on 21 May by a reduction in the water level of the sabkha lake (94 km2). To the west, although there is no visible flow in the Oued Biskra valley anymore, the channels directly connected to the chott are partially flooded. From that point onwards, the lake dried up rapidly. By 10 June, only a few traces of water remained in the western part. The sabkha lake is reduced to 27 km2. The Sentinel-2 image taken on 5 July showed the lake completely dry, a situation that persisted throughout July and August. Thanks to its daily images, MODIS once again confirmed that Chott Melrhir had completely dried up by 19 June.
Finally, it is worth noting that Chott Merouane covered by T32SKC images is much less affected by rainfall (not illustrated). The southern sector is largely influenced by RE1. The few changes observed are in the northern part of Chott Merouane, which is affected only by RE5. The southernmost part of Chott Merouane, in connection with the irrigation channel of Oued Righ, was completely dry during the first half of July 2021. Chott Bel Jeloud, a smaller body of water, is also influenced by RE1 and retained some water until February 2021 (never exceeding a water level of 30%). From that date onwards, it was completely dry.

5. Discussion

5.1. Generalities on the Remote Sensing Data Used

Satellite databases are valuable tools for creating and analysing data, particularly in areas that are difficult to access and for which there is little ground-based data. In the case of the occasional floods affecting Chotts Melrhir and Merouane, it is worth noting that the water surfaces can be defined fairly straightforwardly and measured precisely, particularly through the use of infrared imagery. The blue spectral range, or the visible spectrum if that is not available, can be used to distinguish between water bodies of varying depths. However, it is not possible to estimate water volumes, mainly because there are no sufficiently accurate digital elevation models available. The execution of field surveys aimed at quantifying water levels and the concentration of suspended sediments in wetland environments during periods of flooding can also prove to be a challenging endeavour, if not wholly impossible. In cases where such data is deemed relevant, it may be utilised for the purpose of calibrating the analysis of satellite imagery.
By contrast, the conditions for observing the Chott region using multispectral imagery are very favourable. Thanks to Landsat data dating back to 1972, and Sentinel-2 dating back to 2015, average statistics of the cloud coverage can be established (Table 4). This table shows that 25–43% of datasets have cloud-free conditions, 55–66% have 10% or less, and 80–91% have 50% or less. It appears that the cloud algorithms applied to the Landsat 1–3 MSS chronicle struggle to identify cloud-free images of bright targets, such as sand dunes and salt lakes. Therefore, this result is not considered in the commentary.

5.2. Interest of the Meteorological Data

From a meteorological perspective, issues regarding the completeness of the data series and the limited coverage of available weather stations must be considered. Nevertheless, comparing meteorological data with satellite records makes it possible to identify some key findings. The last decade stands out as a period of particularly low rainfall and rising average temperatures. This is reflected by the absence of major flooding events in recent years. Desertification has been particularly evident in the southeast of Chott Merouane in recent years. We can also assume that evaporites have degraded more significantly, as they have been replenishing less frequently. This point will need to be confirmed in future studies.

5.3. Synthesis of the Landscape Changes in the Algerian Chotts

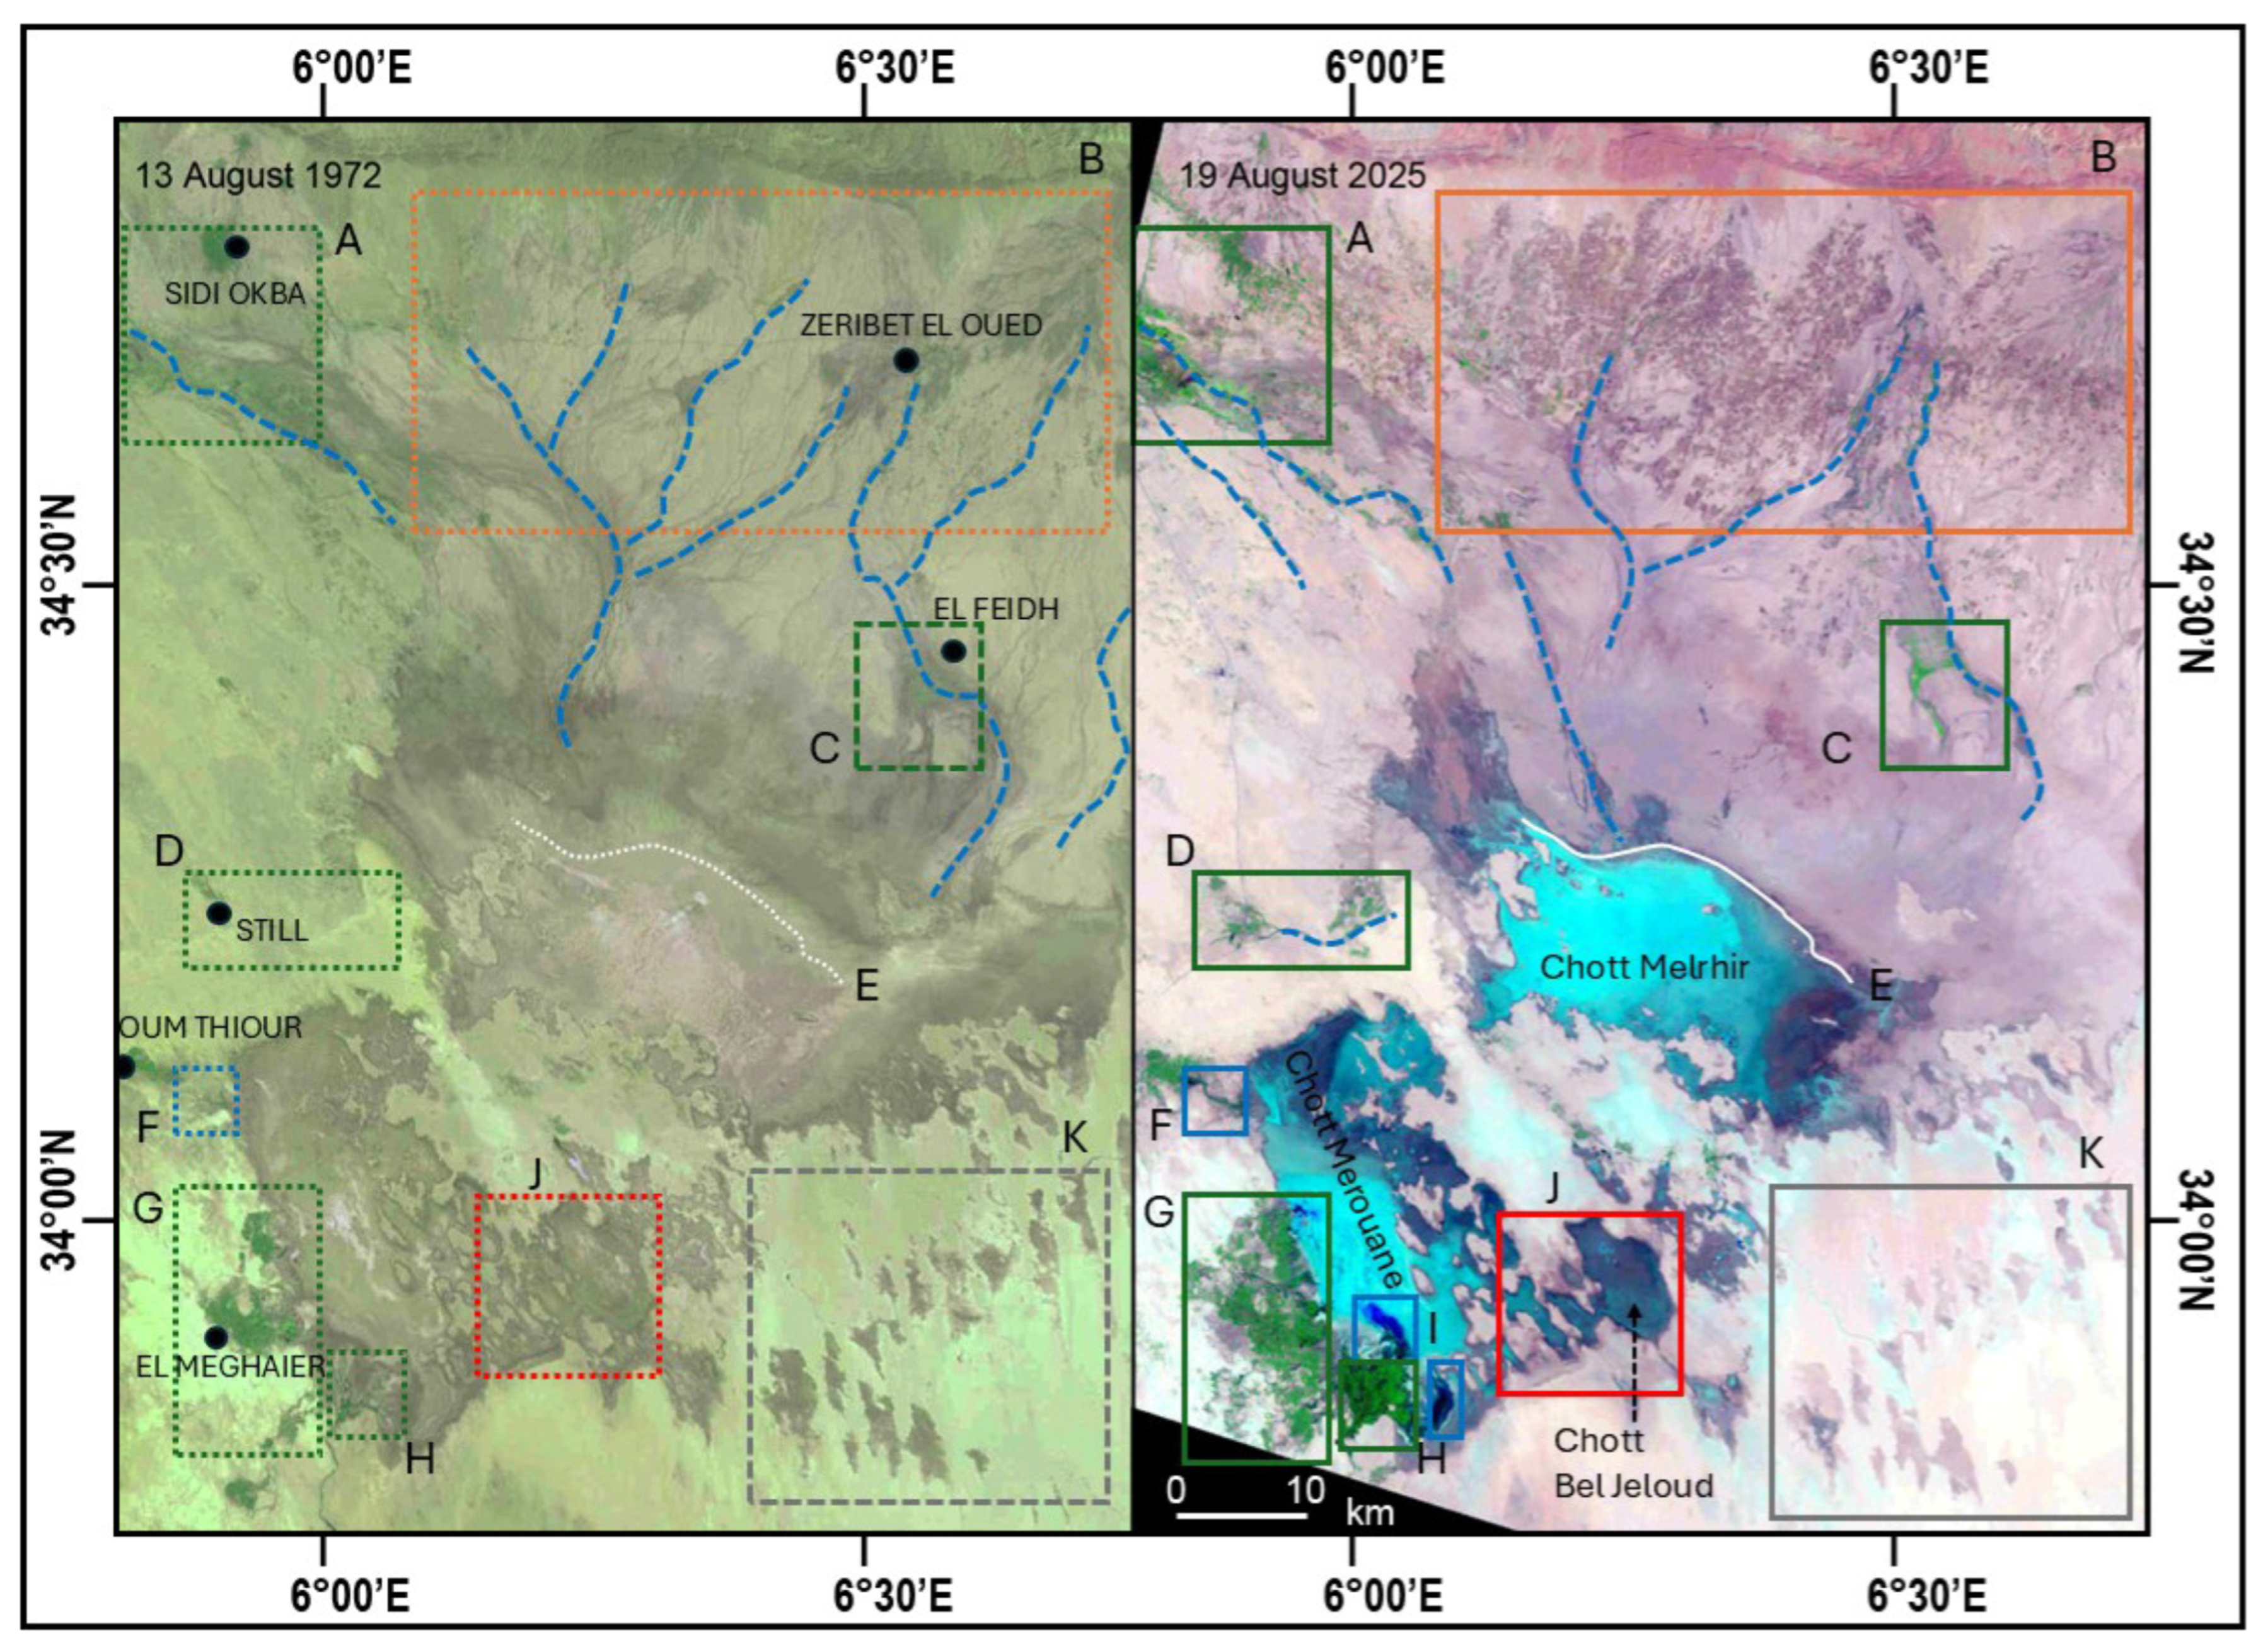
On the scale of the Algerian part of the Zone of Chotts, comparing two multispectral satellite images acquired at the beginning and end of the time series (1972 and 2025, respectively) enables precise monitoring of significant landscape and land use changes (Figure 14). We have selected images from August as the first satellite image was acquired by Landsat 1 (MSS) on 13 August 1972. This is compared with a Landsat 8 (OLI) image acquired on 19 August 2025. The colour composites differ because Landsat MSS images did not record information in the mid-infrared and SWIR bands. For this reason, it is difficult to comment on the specific evolution of evaporites, since the Landsat 8 data is considerably richer in this regard. The Google Earth database can be used to survey the detailed evolution from 1985 onwards. Although vegetation is naturally sparse and has a weak spectral response, it nevertheless shows a vivid response (appearing green in both cases because green represents the near-infrared in the RGB composition). Oases and palm groves have expanded significantly, particularly at El Meghaier on the edge of Chott Merouane (Figure 14G), as well as at Still (Figure 14D) and in the Oued Biskra valley, south of Sidi Okba (Figure 14A) and El Feidh (Figure 14C). There is also evidence of natural marshland vegetation developing at the mouth of the Oued Righ, south of Chott Merouane (Figure 14H). This permanent drainage explains why water bodies persist, even in the height of summer (Figure 14I, shown in dark blue on the Landsat 8 image). To the north of the area, at the foot of the Aurès Mountains (Zeribet El Oued), cultivated land expanded mainly during the 1980s and 1990s (Figure 14B). Drainage conditions have been significantly altered by the construction of small dams and irrigation canals, which block the flow of water and mean that less water now reaches Chott Melrhir. On a smaller scale, the irrigation of the Oum Thiour oasis is clearly visible, where a small drain flows into the north-west of the Chott Merouane (Figure 14F).
The main drainage channels, which are dry in August, are shown as blue dashed lines. The density decreases to the north of Chott Merouane, while the importance of the Oued Biskra–Oued El Abiod axis appears to be increasing in the north-west of the area. As mentioned above, it is difficult to compare the filling of the chotts because the 1970s data did not permit analysis of the evaporite composition. However, it seems that the northern boundary of the sabkha lake (Figure 14E) has shifted significantly, with the salt crust moving northwards. The southern edge of Chott Melrhir and the internal islets within the chott appear to have changed little between the two dates. The southern part of the area shows two major changes. Desertification is clearly evident, with sandy deposits and dunes spreading over the terrain to the southeast (Figure 14K). Even more strikingly, the boundary between Chotts Merouane and Bel Jeloud is now more clearly defined and the area is becoming increasingly arid (Figure 14J). Salt pans are present in Chott Bel Jeloud and elsewhere in Chott Merouane; the operation of these may impact the local environment.

5.4. Other Worldwide Endorheic Depression Case Studies

Further studies have been conducted on endorheic basins. Building on Bryant’s pioneering work [39], Abbas et al. adopted a similar approach in the Tunisian chotts, utilising data from various sources [19]. There are ultimately relatively few studies aimed at quantifying the surface area of lakes formed following rainfall events in low-lying areas. Often, approaches focus on reservoirs, as in northern Tunisia [40], or artificial lakes, as in Egypt [41]. Rather than flash floods, irrigation networks or drains located on foothills are often monitored, as in Jeffara, Tunisia [42]. Analyses of South America often appear to be more in-depth. InSAR coherence-change detection (CCD) was studied by Botey and Bassols [43] and appears to be a promising remote sensing technique capable of mapping areas affected by torrential sediment transport triggered by flash floods. In a companion paper, the same authors propose a methodology that was tested in three study areas in the Salar de Atacama in Chile [44]. This methodology used Sentinel-1 data and meteorological records of rainfall, relative air humidity, and snow cover. In this same region, evaporites have mainly been studied using field and laboratory spectroscopy, with little use of satellite imagery [45]. By contrast, a more recent study of Lake Bonneville, USA, used the Landsat-5 TM and Landsat-8 OLI sensors to empirically establish a set of band-based mathematical indices for mapping the predominant halite, gypsum, and carbonate mineralogical zones [46]. A paper on the Aral Sea Basin, one of the most well-known endorheic depressions, summarises a large amount of satellite data that has been used to monitor the area since 1960 [5].
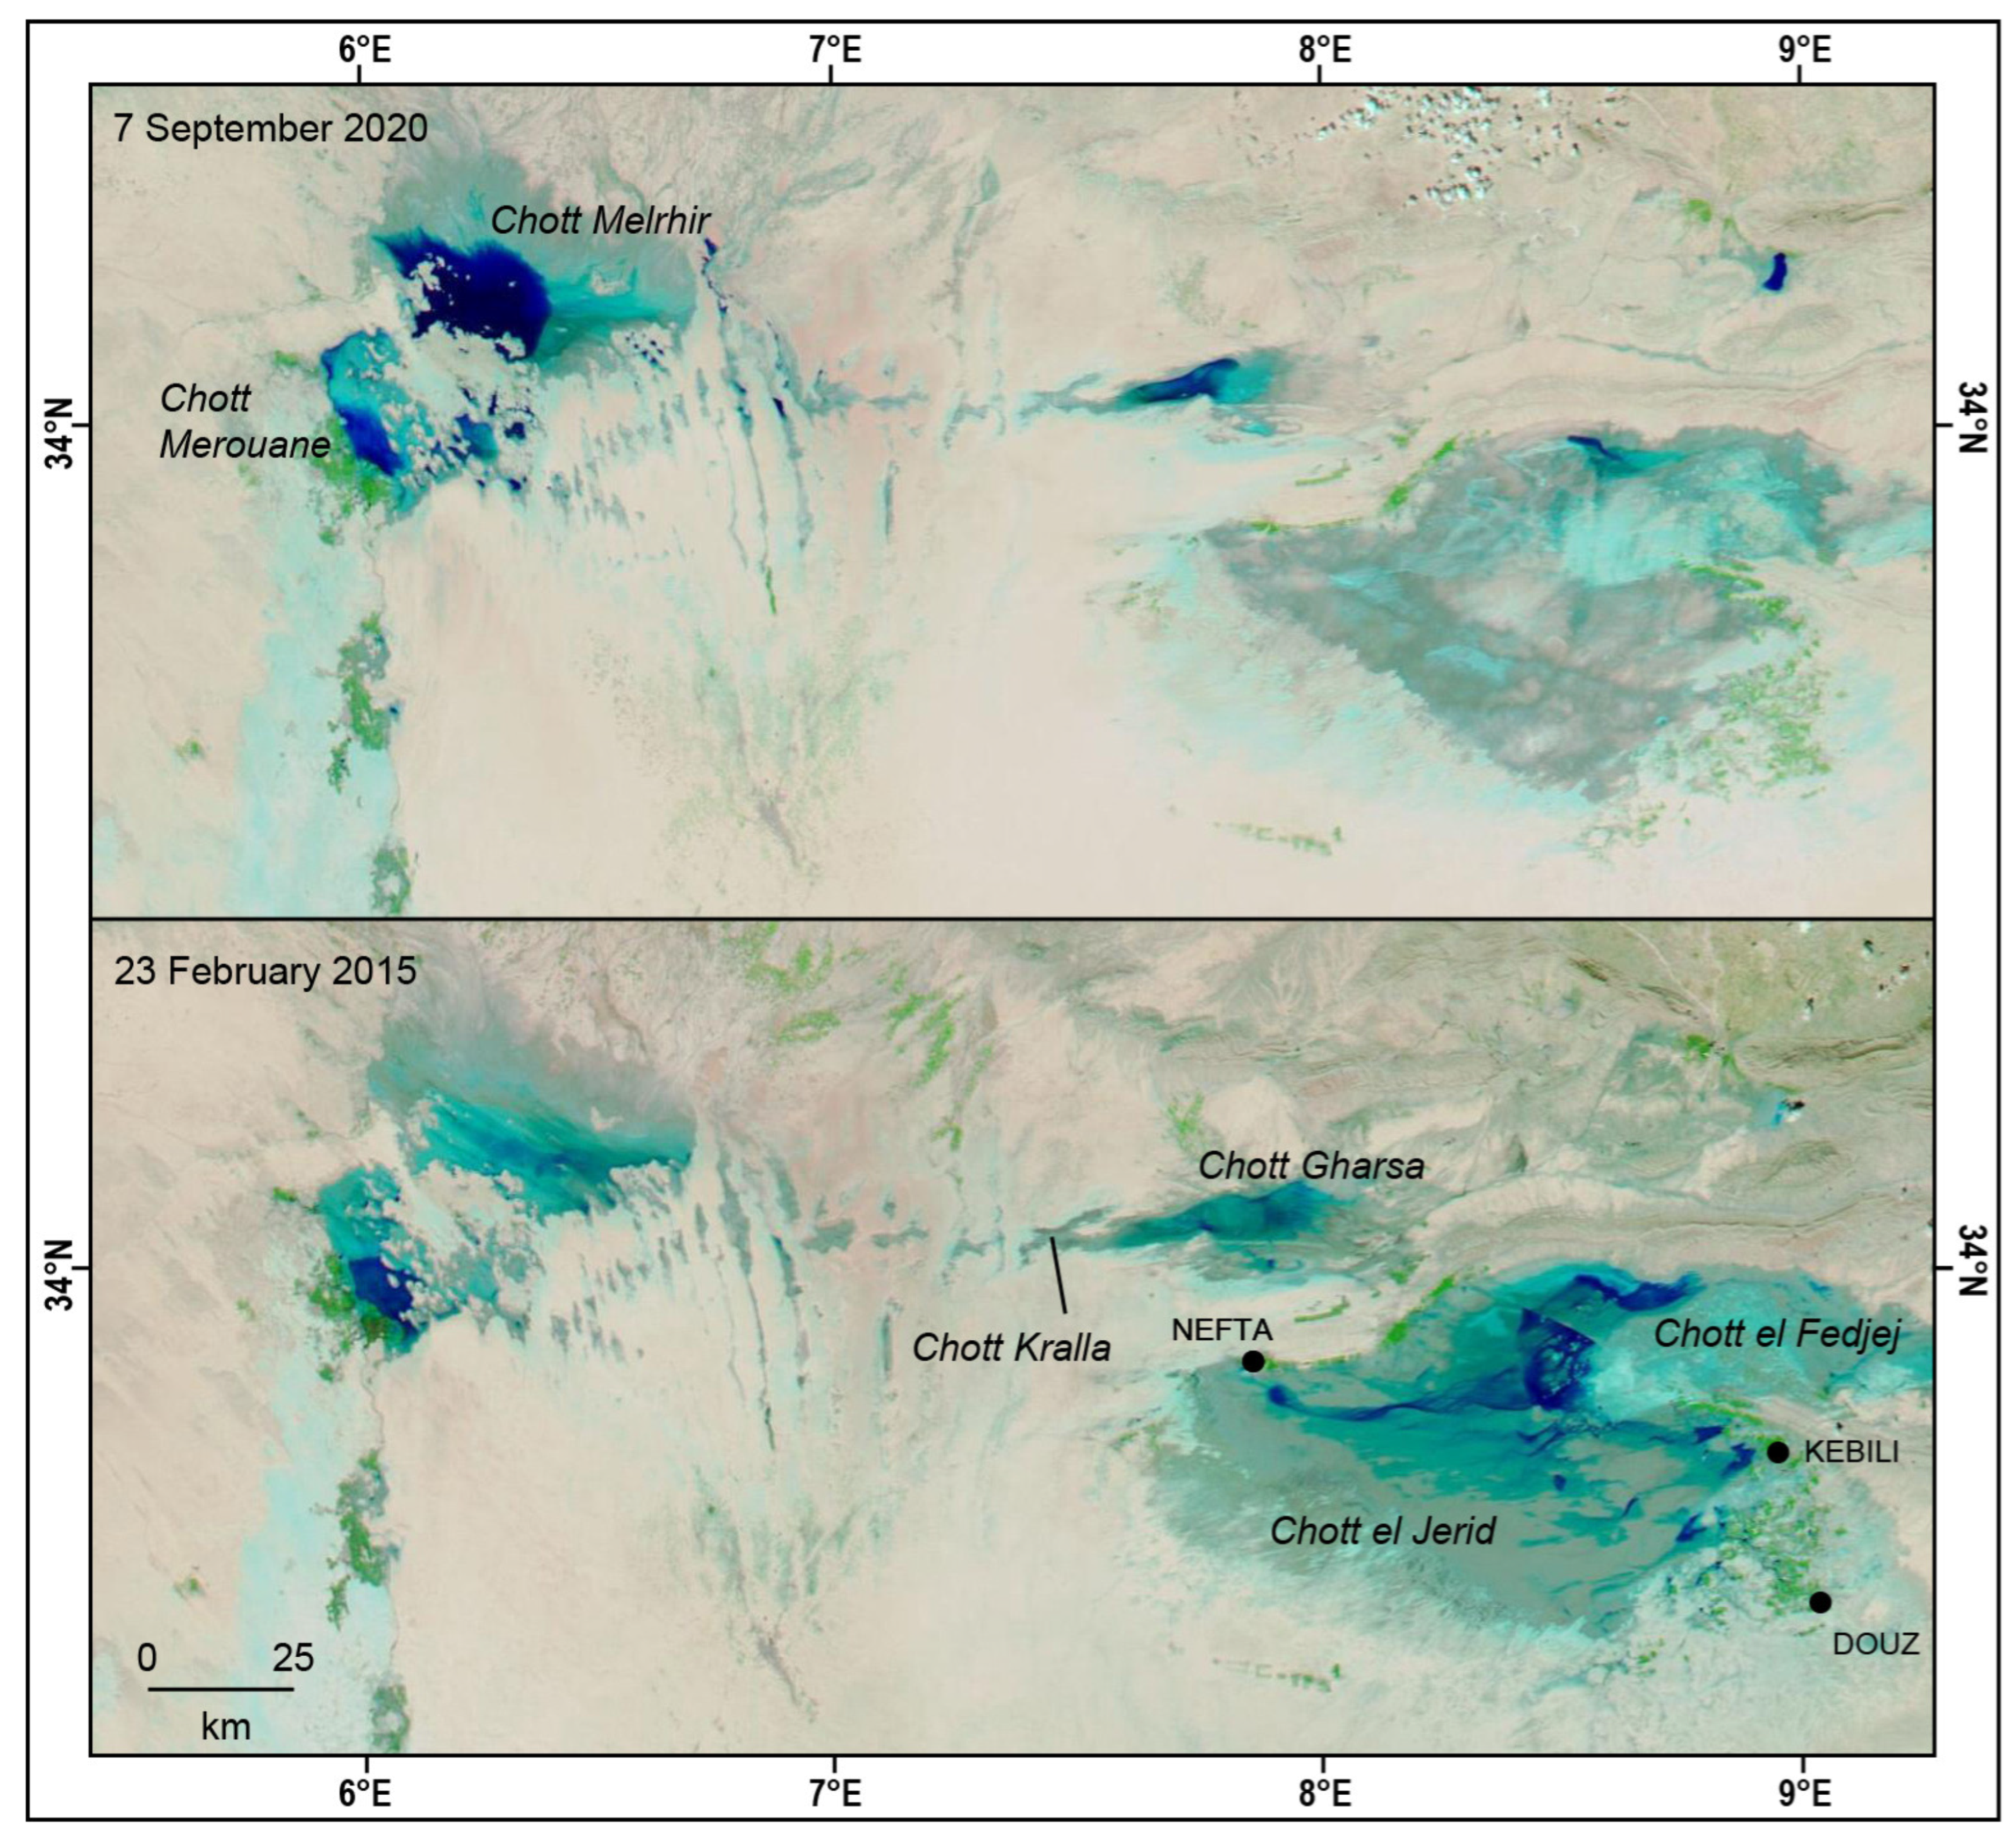
As the Tunisian chotts are part of the same geomorphological entity as Chotts Merouane and Melrhir, it is interesting to observe the major trends primarily affecting the Chott Jerid and, to a lesser extent, the Chotts Gharsa and el Fedjej, in response to flooding events (Figure 1). The MODIS database indicates that, since 2000, the main flooding events occurred in the following order of significance: April 2007, January 2009, June 2014, and February 2015. Minor flooding was also observed in October 2011, September 2013, and October 2017. As on the Algerian side, it can therefore be seen that there have been no significant recent events in the last ten years. Notably, a flood of the Chott el Jerid in January 1990 appears to have been the most significant in the last fifty years, following exceptional rainfall of 150 mm. Clearly, the Algerian and Tunisian chotts are rarely filled simultaneously, with February 2009 being the exception. This undoubtedly reflects the very localised effect of heavy rainfall, with the Aurès Mountains playing a particular role in the case of Chott Melrhir, and the significance of the threshold between Chotts Gharsa and Melrhir at the site of the small Chott Kralla (+20 m) (Figure 2). This threshold acts as a pass between the Melrhir depression and Chott Gharsa, both of which lie below sea level.
A comparison of two significant events affecting the Algerian and Tunisian Chotts highlights notable differences between the two regions (Figure 15). MODIS data has been used to provide an overview of the Zone of Chotts. For the Algerian side, the September 2020 flood has been selected and already illustrated using Sentinel-2 imagery (see Section 4.2.4). For the Tunisian side, the most recent significant event, which occurred in February 2015, has been chosen. The flooding of the Chott el Jerid indicates a build-up of water due to localised rainfall and runoff along drainage channels. The road embankment acts as a barrier, and clearly visible springs have emerged near Nefta, Kebili and Douz. This phenomenon does not occur in the Melrhir and Merouane chotts. In Chott el Jerid, they are referred to as ‘ain’ (Arabic word for spring). ‘Ains’ are quasi-circular wetlands formed around a water source, which is fed by capillary action from the Quaternary ‘Complexe Terminal’ aquifer as well as by groundwater. The flows from these springs are centripetal. They demonstrate the relationship between surface water and aquifers. The spring zone is particularly concentrated to the north-west of the deflation zone and extends 5 km on either side of the road. This area is characterised by variations in the size of the springs, their morphology, and the surface mineralogy [47]. On average, the piezometric surface in the Biskra area lies 3 m below ground level [32]. During dry periods, it can drop even lower due to the high volume of water extracted by boreholes and the intensity of surface evaporation.

5.5. Recommendations for Flood Hazard Mapping

It is widely acknowledged that flash floods represent the most significant hazard in regions characterised by aridity or semi-aridity. For instance, in November 2001, a disaster in Bab el Oued, located west of Algiers, resulted in the loss of 900 lives. The construction and sealing of infrastructure in this area has accelerated significantly over the last few decades, thereby exposing previously unimpacted regions of the valley to the risks associated with development. It is also pertinent to mention the role of linear structures in surface runoff. The ill-suited architecture of Algiers and Biskra, located in an arid environment, has had deleterious effects on these cities. The management of watercourses in urban areas, such as Oued Biskra as it flows through the city, is necessary not only to protect residents from flooding, but also from erosion. In the foothills of the Aurès Mountains, it has been observed that hydraulic works also play a significant role in water flow.
It is evident that risk analyses have not been fully utilised to their potential in the context of multispectral data. Such data has been shown to possess the capability to accurately characterise water bodies and their evolution. This phenomenon has been demonstrated in the case of the chotts. Nevertheless, it is virtually impossible to track a flash flood using this method, given the low probability of acquiring an image at the critical moment and issues with cloud cover. A multifrequency radar approach may prove advantageous; however, the integration of these data with optical sensors remains a challenging endeavour. It is imperative that the scale of observation encompasses the entire catchment area. It is also imperative to refrain from employing an approach that is predicated on administrative units, even if the results can subsequently be presented by wilaya or city. In the Chott region, a significant challenge is the comprehension of the topography and its relationship with aquifer waters. The extremely flat floor of endorheic basins can cause local water flows to alter rapidly due to successive phases of mineralisation and erosion-sedimentation. As previously mentioned, the relationship between surface water and aquifers is undoubtedly pivotal. Nevertheless, the extent of our understanding of the aquifers remains limited. Piezometric levels of the Continental Intercalaire aquifer have been observed to decrease significantly, a consequence of substantial pumping activities directed towards irrigating oases. It is evident that these oases are susceptible to the phenomenon of salinisation, which can ultimately lead to their demise. A notable example of this phenomenon is the decline of Ain Safra oasis in the vicinity of Chott Merouane. A recent study utilising data from Landsat 5, 7 and 8 has yielded intriguing findings regarding the efficacy of oases in mitigating desertification. Tolga has been identified as a notable case study in this regard [48]. The traditional oases of El Oued, known as ‘ghouts’, were also the subject of study using Landsat data [49]. It is widely acknowledged that these systems represent a highly innovative approach to addressing the repercussions of climate change and water overexploitation.

6. Conclusions

A thorough analysis of the Algerian segment of the Zone of Chotts has been conducted. This analysis incorporated multi-source, multi-temporal satellite data, which were then combined with regional observations. The following findings emerged from this analysis:
-
Flood events associated with heavy rainfall are an infrequent occurrence. The majority of these events transpired within the period between 2003 and 2020. There have been no significant events since 2020, despite extremely low rainfall. This trend, and indicators of climate change in general, will require detailed analysis.
-
The establishment of precise links between image analyses is rendered challenging in the absence of an accurate and reliable long-term meteorological record.
-
The behaviour of Chott Melrhir is contingent on runoff from two distinct sources: first, Oued Biskra and Oued El Abiod; and second, direct runoff from the Aurès Mountains. In contrast to the situation in Chott el Jerid in Tunisia, where a spring has been observed, no such evidence has been found in this location.
-
Conversely, Chott Merouane is found to be significantly influenced by anthropogenic activities. An almost permanent lake is located in the southern area, at the mouth of the Oued Righ, which serves to drain the wastewater of the southern region and the oases.
-
It is evident that there is an absence of, or at least a paucity of, flood events emanating from the west.
-
Evaporites formed during significant events are principally gypsum-based. Subsequent studies will endeavour to establish a correlation with the multispectral potential of satellite imagery.
-
Aridification is evidenced by the development of mineral surfaces, particularly in the Chott Bel Jeloud area, and by the presence of sand veneers in the southeastern region.
In general terms, human development in the area has undergone significant changes over the past 50 years. This has led to the development of oases in the southern and western regions of Chott Merouane and the establishment of crop areas in the foothills of the Aurès Mountains. These changes have had a considerable impact on the runoff system.
As this approach involves processing a number of different satellite datasets, machine learning should be explored in the near future. This study has also revealed new avenues of research. It would be worthwhile continuing to analyse evaporites, particularly by attempting to identify variations in mineral deposits across space and time. So far, the contribution of SAR radar has been limited. However, its INSAR capabilities and DEM generation are significant. The multi-frequency approach should also be pursued. The X-, C-, and L-bands have shown certain limitations. If new BIOMASSE P-band data is available for this area, it should be used. This could facilitate a new approach to understanding the relationship between surface runoff and the nature of the substrate and underlying aquifers.

Supplementary Materials

The following supporting information can be downloaded at: https://www.mdpi.com/article/10.3390/geohazards7020063/s1, Supplementary File S1: MODIS_Zone of Chotts_2000–2025_monthly; Supplementary File S2: Flood status_Algerian Chotts_2000-2025.

Author Contributions

Conceptualization, J.-P.D. and B.B.; methodology, J.-P.D. and B.B.; software, J.-P.D.; validation, J.-P.D., B.B. and H.M.; formal analysis, J.-P.D.; investigation, J.-P.D., B.B. and H.M.; resources, J.-P.D.; data curation, J.-P.D.; writing—original draft preparation, J.-P.D.; writing—review and editing, J.-P.D., B.B. and H.M.; visualization, J.-P.D.; supervision, J.-P.D.; project administration, J.-P.D. and B.B. All authors have read and agreed to the published version of the manuscript.

Funding

This research received no external funding.

Data Availability Statement

The original contributions presented in this study are included in the article/Supplementary Material. Further inquiries can be directed to the corresponding author.

Acknowledgments

We would like to express our gratitude to the PHC (Hubert Curien Partnership) committee of the Franco-Algerian Tassili programme for facilitating relations between the University of Reims Champagne-Ardenne and the Mohamed Khider University in Biskra. During the preparation of this manuscript/study, the authors used DeepL write for the purposes of English editing. The authors have reviewed and edited the output and take full responsibility for the content of this publication.

Conflicts of Interest

The authors declare no conflicts of interest.

References

  1. Iacobellis, V.; Castorani, A.; Rosario di Santo, R.; Gioia, A. Rationale for flood prediction in karst endorheic areas. J. Arid Environ. 2015, 112, 98–118. [Google Scholar] [CrossRef]
  2. Chew, C.; Small, E. Estimating inundation extent using CYGNSS data: A conceptual modeling study. Remote Sens. Environ. 2020, 246, 111869. [Google Scholar] [CrossRef]
  3. Sharifi, F.; Samadi, S.Z.; Wilson, C.A.M.E. Causes and consequences of recent floods in the Golestan catchments and Caspian Sea regions of Iran. Nat. Hazards 2012, 61, 533−550. [Google Scholar] [CrossRef]
  4. Dezfuli, A.; Bosilovich, M.G.; Barahona, D. A dusty atmospheric river brings floods to the Middle East. Geophys. Res. Lett. 2021, 48, e2021GL095441. [Google Scholar] [CrossRef]
  5. Deroin, J.-P. Use of Remote Sensing Data to Study the Aral Sea Basin in Central Asia—Geoscience and Geological Hazards. Remote Sens. 2025, 17, 2814. [Google Scholar] [CrossRef]
  6. Ning, G.; Luo, M.; Zhang, Q.; Wang, S.; Liu, Z.; Yang, Y.; Wu, S.; Zeng, Z. Understanding the mechanisms of summer extreme precipitation events in Xinjiang of arid Northwest China. J. Geophys. Res. Atmos. 2021, 126, e2020JD034111. [Google Scholar] [CrossRef]
  7. Li, J.; Yang, X.; Maffei, C.; Tooth, S.; Yao, G. Applying Independent Component Analysis on Sentinel-2 Imagery to Characterize Geomorphological Responses to an Extreme Flood Event near the Non-Vegetated Río Colorado Terminus, Salar de Uyuni, Bolivia. Remote Sens. 2018, 10, 725. [Google Scholar] [CrossRef]
  8. Lemoalle, J.; Bader, J.C.; Leblanc, M.; Sedick, A. Recent changes in Lake Chad: Observations, simulations and management options (1973–2011). Glob. Planet. Change 2012, 80–81, 247−254. [Google Scholar] [CrossRef]
  9. Deroin, J.-P. Permian and Quaternary playas, a discussion based on climatic, tectonic and palaeogeographic settings. J. Iber. Geol. 2008, 34, 11−28. [Google Scholar]
  10. Xiao, Y.; Zhang, Y.; Yang, H.; Wang, L.; Han, J.; Hao, Q.; Wang, J.; Zhao, Z.; Hu, W.; Wang, S.; et al. Interaction regimes of surface water and groundwater in a hyper-arid endorheic watershed on Tibetan Plateau: Insights from multi-proxy data. J. Hydrol. 2024, 644, 132020. [Google Scholar] [CrossRef]
  11. Benziouche, S.E.; Chehat, F. Irrigation problem in Ziban oases (Algeria): Causes and consequences. Environ. Dev. Sustain. 2019, 21, 2693–2706. [Google Scholar] [CrossRef]
  12. Boumaraf, B. Caractéristiques et Fonctionnement des Sols dans la Vallée d’Oued Righ, Sahara Nord-Oriental, Algérie. Ph.D. Thesis, Université de Reims Champagne-Ardenne, Reims, France, 2013; pp. 1–108. [Google Scholar]
  13. Khatei, G.; Rinaldo, T.; Van Pelt, R.S.; D’Odorico, P.; Ravi, S. Wind erodibility and particulate matter emissions of salt-affected soils: The case of dry soils in a low humidity atmosphere. J. Geophys. Res. Atmos. 2024, 129, e2023JD039576. [Google Scholar] [CrossRef]
  14. Jerez, B.; Garcés, I.; Torres, R. Lithium extractivism and water injustices in the Salar de Atacama, Chile: The colonial shadow of green electromobility. Polit. Geogr. 2021, 87, 102382. [Google Scholar] [CrossRef]
  15. Benameur, S.; Benkhaled, A.; Meraghni, D.; Chebana, F.; Necir, A. Complete flood frequency analysis in Abiod watershed, Biskra (Algeria). Nat. Hazards 2017, 86, 519–534. [Google Scholar] [CrossRef]
  16. Azioune, R.; Tatar, H.; Nouaceur, Z. Pluies extrêmes et risque d’inondation dans la ville de Biskra (Algérie). Sci. Technol. D Sci. Terre 2018, 48, 93–106. [Google Scholar]
  17. Fathalli, B.; Castel, T.; Pohl, B. Simulated effects of land immersion on regional arid climate: A case study of the pre-Saharan playa of Chott el-Jerid (south of Tunisia). Theor. Appl. Climatol. 2020, 140, 231–250. [Google Scholar] [CrossRef]
  18. Afrasinei, G.M.; Melis, M.T.; Buttau, C.; Bradd, J.M.; Arras, C.; Ghiglieri, G. Assessment of remote sensing-based classification methods for change detection of salt-affected areas (Biskra area, Algeria). J. Appl. Remote Sens. 2017, 11, 016025. [Google Scholar] [CrossRef]
  19. Abbas, K.; Deroin, J.P.; Bouaziz, S. Monitoring of playa evaporites as seen with optical remote sensing sensors: Case of Chott El Jerid, Tunisia, from 2003 to present. Arab. J. Geosci. 2017, 11, 92. [Google Scholar] [CrossRef]
  20. Lemenkova, P. A GRASS GIS Scripting Framework for Monitoring Changes in the Ephemeral Salt Lakes of Chotts Melrhir and Merouane, Algeria. Appl. Syst. Innov. 2023, 6, 61. [Google Scholar] [CrossRef]
  21. Radwan, N.; Halder, B.; Ahmed, M.F.; Refadah, S.S.; Khan, M.Y.A.; Scholz, M.; Sammen, S.S.; Pande, C.B. Seasonal Precipitation and Anomaly Analysis in Middle East Asian Countries Using Google Earth Engine. Water 2025, 17, 1475. [Google Scholar] [CrossRef]
  22. Alarifi, S.S.; Abdelkareem, M.; Abdalla, F.; Alotaibi, M. Flash Flood Hazard Mapping Using Remote Sensing and GIS Techniques in Southwestern Saudi Arabia. Sustainability 2022, 14, 14145. [Google Scholar] [CrossRef]
  23. Jemai, S.; Belkendil, A.; Kallel, A.; Ayadi, I. Assessment of flood risk using Hierarchical Analysis Process method and Remote Sensing systems through arid catchment in southeastern Tunisia. J. Arid Environ. 2024, 222, 105150. [Google Scholar] [CrossRef]
  24. Hidayatulloh, A.; Bahrawi, J.; Psilovikos, A.; Elhag, M. Integrating MCDA and Rain-on-Grid Modeling for Flood Hazard Mapping in Bahrah City, Saudi Arabia. Geosciences 2026, 16, 32. [Google Scholar] [CrossRef]
  25. Al-Ruzouq, R.; Shanableh, A.; Jena, R.; Gibril, M.B.A.; Hammouri, N.A.; Lamghari, F. Flood susceptibility mapping using a novel integration of multi-temporal sentinel-1 data and eXtreme deep learning model. Geosci. Front. 2024, 15, 101780. [Google Scholar] [CrossRef]
  26. Shawky, M.; Hassan, Q.K. Geospatial Modeling Based-Multi-Criteria Decision-Making for Flash Flood Susceptibility Zonation in an Arid Area. Remote Sens. 2023, 15, 2561. [Google Scholar] [CrossRef]
  27. Mashaly, J.; Ghoneim, E. Flash Flood Hazard Using Optical, Radar, and Stereo-Pair Derived DEM: Eastern Desert, Egypt. Remote Sens. 2018, 10, 1204. [Google Scholar] [CrossRef]
  28. Bouamrane, A.; Derdous, O.; Dahri, N.; Tachi, S.E.; Boutebba, K.; Bouziane, M.T. A Comparison of the Analytical Hierarchy Process and the Fuzzy Logic Approach for Flood Susceptibility Mapping in a Semi-Arid Ungauged Basin (Biskra Basin: Algeria). Int. J. River Basin Manag. 2020, 20, 203–213. [Google Scholar] [CrossRef]
  29. Afra, A.; Berrezel, Y.A.; Abdelbaki, C.; Megnounif, A.; Saber, M.; Benabdelkrim, M.E.A.; Kumar, N. Application of the Rainfall–Runoff–Inundation Model for Flood Risk Assessment in the Mekerra Basin, Algeria. GeoHazards 2025, 6, 2. [Google Scholar] [CrossRef]
  30. Abdelkareem, M.; Mansour, A.M. Risk assessment and management of vulnerable areas to flash flood hazards in arid regions using remote sensing and GIS-based knowledge-driven techniques. Nat. Hazards 2023, 117, 2269–2295. [Google Scholar] [CrossRef]
  31. Al Saodi, R.; Al Kuisi, M.; Al Salaymeh, A. Assessing the vulnerability of flash floods to climate change in arid zones: Amman–Zarqa Basin, Jordan. J. Water Clim. Change 2023, 14, 4376. [Google Scholar] [CrossRef]
  32. Boutouga, F. Ressources et Essai de Gestion des Eaux dans le Zab Est de Biskra. Ph.D. Thesis, University Badji Mokhtar-Annaba, Annaba, Algeria, 2012; pp. 1–172. [Google Scholar]
  33. Subraelu, P.; Ahmed, A.; Ebraheem, A.A.; Sherif, M.; Mirza, S.B.; Ridouane, F.L.; Sefelnasr, A. Risk Assessment and Mapping of Flash Flood Vulnerable Zones in Arid Region, Fujairah City, UAE-Using Remote Sensing and GIS-Based Analysis. Water 2023, 15, 2802. [Google Scholar] [CrossRef]
  34. Ballais, J.L.; Ben Ouezdou, H. Forms and deposits of the Continental Quaternary of the Saharan margin of Eastern Maghreb (tentative synthesis). J. Afr. Earth Sci. 1991, 12, 209–216. [Google Scholar] [CrossRef]
  35. Demnati, F.; Samraoui, B.; Allache, F.; Sandoz, A.; Ernoul, L. A literature review of Algerian salt lakes: Values, threats and implications. Environ. Earth Sci. 2017, 76, 127. [Google Scholar] [CrossRef]
  36. Hacini, M.; Kherici, N.; Oelkers, E.H. Mineral precipitation rates during the complete evaporation of the Merouane Chott ephemeral lake. Geochim. Cosmochim. Acta 2009, 72, 1583–1597. [Google Scholar] [CrossRef]
  37. Kottec, M.; Grieser, J.; Beck, C.; Rudolf, B.; Rubel, F. World Map of Köppen-Geiger climate classification. Meteorol. Z. 2006, 15, 259–263. [Google Scholar] [CrossRef] [PubMed]
  38. McFeeters, S.K. The use of the Normalized Difference Water Index (NDWI) in the delineation of open water features. Int. J. Remote Sens. 1996, 17, 1425–1432. [Google Scholar] [CrossRef]
  39. Bryant, R.G.; Rainey, M.P. Investigation of flood inundation on playas within the Zone of Chotts, using a time-series of AVHRR. Remote Sens. Environ. 2002, 82, 360–375. [Google Scholar] [CrossRef]
  40. Ogilvie, A.; Belaud, G.; Massuel, S.; Mulligan, M.; Le Goulven, P.; Malaterre, P.O.; Calvez, R. Combining Landsat observations with hydrological modelling for improved surface water monitoring of small lakes. J. Hydrol. 2018, 566, 109–121. [Google Scholar] [CrossRef]
  41. Abd Ellah, R.G. Morphometric analysis of Toshka Lakes in Egypt: A succinct review of geographic information systems & remote sensing based techniques. Egypt. J. Aquat. Res. 2021, 47, 215–221. [Google Scholar] [CrossRef]
  42. Chihi, H.; Hammami, M.A.; Mezni, I. Flood susceptibility mapping in data-scarce arid environments: Guided by geology-driven knowledge and multi-event cloud-based validation. Nat. Hazards 2025, 121, 20855–20901. [Google Scholar] [CrossRef]
  43. Botey i Bassols, J.; Bedia, C.; Cuevas-González, M.; Valdivielso, S.; Crosetto, M.; Vázquez-Suñé, E. Evaluating the Uncertainty in Coherence-Change-Detection-Based Maps of Torrential Sediment Transport in Arid Environments. Remote Sens. 2023, 15, 4964. [Google Scholar] [CrossRef]
  44. Botey i Bassols, J.; Bedia, C.; Cuevas-González, M.; Valdivielso, S.; Crosetto, M.; Vázquez-Suñé, E. SAR Coherence in Detecting Fluvial Sediment Transport Events in Arid Environments. Remote Sens. 2023, 15, 3034. [Google Scholar] [CrossRef]
  45. Flahaut, J.; Martinot, M.; Bishop, J.L.; Davies, G.R.; Potts, N.J. Remote sensing and in situ mineralogic survey of the Chilean salars: An analog to Mars evaporate deposits? Icarus 2017, 282, 152–173. [Google Scholar] [CrossRef]
  46. Radwin, M.H.; Bowen, B.B. Mapping mineralogy in evaporite basins through time using multispectral Landsat data: Examples from the Bonneville basin, Utah, USA. Earth Surf. Process. Landf. 2021, 46, 1160–1176. [Google Scholar] [CrossRef]
  47. Abbas, K. Suivi par Télédétection Multi-Source du Bassin Endoréique du Chott El Djérid (Tunisie) Entre 1985 et 2015. Ph.D. Thesis, University of Reims, Reims, France, 2016; pp. 1–281. [Google Scholar]
  48. Mihi, A.; Tarai, N.; Chenchouni, H. Can palm date plantations and oasification be used as a proxy to fight sustainably against desertification and sand encroachment in hot drylands? Ecol. Indic. 2019, 105, 365–375. [Google Scholar] [CrossRef]
  49. Daich, S.; Saadi, M.Y.; Santoro, A.; Piras, F.; Boumaraf, B. Spatiotemporal analysis, monitoring, and future prediction of land use/land cover changes in Ghouts: A sustainable agricultural system in the El Oued Oases, Algeria. Environ. Monit. Assess. 2025, 197, 1062. [Google Scholar] [CrossRef]
Figure 1. Location of the studied area. The Zone of Chotts in Algeria and Tunisia. We use a MODIS image acquired on 3 March 2009 during a regional flood event as the background to highlight water bodies in dark blue. Vegetation appears in light green or dark green (oases) saline crust in light blue and sand deposits in orange yellow.
Geohazards 07 00063 g001
Figure 2. Chott Merouane and Chott Melrhir area. 1. Capital city of province (wilaya); 2. Other cities; 3. Dams (FG. Foum El Gherza; MG. Manbaa El Ghouzlane); 4. Wadis (O means Oued = wadi); 5. Palm groves and oases; 6. Chotts; 7. Area below sea level (≤0 m); 8. Lowest points of the chotts. Sea also Figure 1 for location.
Geohazards 07 00063 g002
Figure 3. Chronology of the satellite data from 1960 to present. The grey boxes show the years in which sensor acquisition is valid. The light grey boxes at the end of the line indicate operational missions in early 2026.
Geohazards 07 00063 g003
Figure 4. Spectral behaviour of mineral surfaces (bare soils and rocks), vegetation surfaces and water surfaces. Note that only the trends should be considered as the actual absorption or reflection may differ from the theoretical curves.
Geohazards 07 00063 g004
Figure 5. Illustration of the different stages of flooding in Chott Melrhir (West) during the first half of 2012. Dark blue indicates water. The darker the blue, the deeper the water body. The final thumbnail also illustrates the boundary between Chott Melrhir (West) and Chott Melrhir (East). Data source: MODIS Terra. Size of each thumbnail: about 60 km × 40 km. See text for details on the colour composite. See also location in Figure 2.
Geohazards 07 00063 g005
Figure 6. Extract from the database for the year 2009 only. The surface area of the sabkha lake in the corresponding area is estimated to range from 0% to 100% each month (i.e., from 0 to 5). See the text for details.
Geohazards 07 00063 g006
Figure 7. Average temperature in four Algerian stations (1960–2024). The dotted line represents a linear fit for the Biskra series and is shown solely for clarity.
Geohazards 07 00063 g007
Figure 8. Average temperature in Biskra (1919–2024). The dotted line represents a polynomial adjustment.
Geohazards 07 00063 g008
Figure 9. Annual precipitation in four Algerian stations (1960–2024).
Geohazards 07 00063 g009
Figure 10. Landsat-2 MSS data acquired on 28 January 1977 showing the filling of almost all the chotts (Melrhir, Merouane, Bel Jeloud and other small chotts). The area measures 65 km × 55 km. In this case the water bodies appear in purple.
Geohazards 07 00063 g010
Figure 11. Flooding in the Chott Melrhir and Chott Merouane areas between 1994 and 2024. Annual flood score (FS) for the five Chott areas. Comparison with the temperature and precipitation evolution (Station of Biskra). The dotted lines represent the best fit for each data set. See the accompanying text for details.
Geohazards 07 00063 g011
Figure 12. Chott Melrhir and Chott Merouane. The flood of October-November 2011 surveyed by MODIS. The area covered by each thumbnail is 125 km × 100 km. See also location in Figure 2.
Geohazards 07 00063 g012
Figure 13. Sentinel-2 images T32SKD. Changes in the sabkha lake in the northern part of Chott Melrhir between August 2020 and July 2021. Please refer to the accompanying text for further information. The area covered by each thumbnail is 60 km × 40 km.
Geohazards 07 00063 g013
Figure 14. Comparison of two satellite images covering the multispectral imaging period from 1972 to the present day. The images were selected for August, the driest month. (Left): Landsat-1 MSS acquired on 13 August 1972 (the first multispectral image available); (right): Landsat-8 OLI acquired on 19 August 2025. Blue dashed line: main ephemeral rivers. Note that the spectral ranges are different. (AK) (see text for the details). The area measures 120 km × 90 km.
Geohazards 07 00063 g014
Figure 15. Comparison of two flooding events affecting the Algerian and Tunisian chotts. The Algerian event occurred on 3 September 2020 and the MODIS image was acquired on 7 September 2020, while the Tunisian event occurred on 20–21 February 2015 and the MODIS image was acquired on 23 February 2015. Dark blue: main ephemeral lakes. See text for details. The area for each image measures 370 km × 180 km.
Geohazards 07 00063 g015
Table 1. Main steps of the remote sensing analysis of flood events. BOA: bottom-of-atmosphere calibrated reflectance; N/A: not applicable; PAN: panchromatic; RGB (red-green-blue colour composite); TOA: top-of-atmosphere calibrated reflectance; XS: multispectral.
Scene DataCoronaLandsatModisSentinel 2
1. Selectionlimited choice<…cloud-freeimages…>
2. Available period1962–19701972–20262000–20262015–2026
3. Download (website)USGSUSGSModisCopernicus
4. Image naturePANPAN or XSXSXS
5. OrthorectificationN/AYesN/AYes
6. Resolution/resampling1.8 to 140 m15 to 80 m250 m10 or 20 m
7. Atmospheric correctionnoyes, TOAyes, TOAyes, BOA
8. Colour compositeN/AMSS RGB = 754RGB = 721RGB = 8-11-12
Red = NIR2Red = SWIRRed = NIR
Green = RedGreen = NIRGreen = MIR
Blue = GreenBlue = RedBlue = SWIR
9. Inclusion in data baseNoPartlyYesPartly
10. Flood events detectedYesYesYesYes
11. Flood events surveyedNoNoYesYes
Repetititivityrandom16–18 days1 day3–5 days
12. Waterbody extractionN/AN/AVisual interp.Thresholding
13. Quantification of theN/AN/A0 to 5Reg. of interest
water bodies 0 to 100%Surface in km2
Table 2. Climate parameters of the Zone of Chotts (DZ, Algeria; TN, Tunisia). Average values and related standard deviation.
Biskra (DZ)El Oued (DZ)Touggourt (DZ)Ouargla (DZ)Tozeur (TN)
Temperature (°C)
Period (1960–2024)22.32 ± 0.8622.01 ± 0.9121.87 ± 0.8422.86 ± 1.0222.14 ± 0.75
Period (1960–1989)21.70 ± 0.6221.19 ± 0.6221.26 ± 0.4922.02 ± 0.5121.57 ± 0.43
Period (1990–2024)22.85 ± 0.6622.57 ± 0.5922.40 ± 0.7023.57 ± 0.7622.64 ± 0.60
Period (2015–2024)23.49 ± 0.6023.05 ± 0.4723.01 ± 0.5124.10 ± 0.5523.07 ± 0.56
Precipitation (mm)
Total130.8 ± 96.761.9 ± 49.554.8 ± 42.931.2 ± 70.953.3 ± 30.0
Period1960–20241960–20241960–20242004–20242018–2024
Missing years12213610
Table 3. Flood score in the five Chotts areas over ten-year periods.
1994–20032004–20132014–2022Month-Average (1994–2025)
Merouane North1201141541.1
Merouane South3143403853
Bel Jeloud7589870.7
Melrhir West1271471261.1
Melrhir East4559540.4
Table 4. Cloud cover as indicated in the USGS database for the Landsat chronicles (August 1972 to February 2026) and Copernicus website for Sentinel-2. The results for cloud-free images obtained using Landsat 1–3 MSS are clearly too low, so this result is not considered. * Indicates that it was in operation in late February 2026. ** Cloud-free images are defined as having a cloud cover of ≤1% on the Copernicus website.
Satellite/SensorReferenceNumber of Scenes≤50%≤10%0
Landsat 1–3 MSS208-3611093 (85%)27 (25%)7 (6%)
Landsat 4–5 MSS193-36197179 (91%)120 (61%)85 (43%)
Landsat 4–5 TM193-36501428 (85%)277 (55%)125 (25%)
Landsat 7 ETM+193-36389351 (90%)258 (66%)125 (32%)
Landsat 8–9 OLI *193-36389346 (89%)232 (60%)107 (28%)
Sentinel 2 MSI *32SKD14631172 (80%)858 (59%)580 (40%) **
Disclaimer/Publisher’s Note: The statements, opinions and data contained in all publications are solely those of the individual author(s) and contributor(s) and not of MDPI and/or the editor(s). MDPI and/or the editor(s) disclaim responsibility for any injury to people or property resulting from any ideas, methods, instructions or products referred to in the content.