Article

Automatic Sentiment Analysis of Citizen Comments: The Case of the Albania Earthquake

by
Diana Contreras
1,*,
Enes Veliu
2,3,
Dimosthenis Antypas
4,
Javier Hervas
5,
Matthieu Landès
6,
Laure Fallou
6,
Damiano Koxhaj
7,
Rémy Bossu
6,8,
Sean Wilkinson
9,
Jose Camacho-Collados
4 and
Edmond Dushi
7
1
School of Earth and Environmental Sciences, Cardiff University, Cardiff CF10 3AT, UK
2
Reco Consulting Ltd., 1000 Tirana, Albania
3
Faculty of Engineering, University of Porto, 4200-465 Porto, Portugal
4
School of Computer Sciences, Cardiff University, Cardiff CF24 4AG, UK
5
Independent Researcher, Cardiff CF10 2HS, UK
6
European-Mediterranean Seismological Centre, 91297 Arpajon, France
7
Institute of Geosciences, Polytechnic University of Tirana, 1024 Tirana, Albania
8
CEA, DAM, DIF, 91297 Arpajon, France
9
School of Engineering, Newcastle University, Newcastle upon Tyne NE1 7RU, UK
*
Author to whom correspondence should be addressed.
GeoHazards 2026, 7(2), 62; https://doi.org/10.3390/geohazards7020062
Submission received: 6 January 2026 / Revised: 14 May 2026 / Accepted: 19 May 2026 / Published: 27 May 2026

Abstract

Collecting and analysing data after an earthquake is essential to determine its impact. In 2014, the European Mediterranean Seismological Centre launched the LastQuake system. Its app collects reports on the intensity users feel, along with comments that provide situational awareness. However, text data collected through crowdsourcing platforms is unstructured. Therefore, natural language processing techniques such as sentiment analysis and aspect-based sentiment analysis are necessary to extract meaningful information. On the 26 November 2019, following an earthquake in Albania, the LastQuake app recorded 28,220 reports with user comments. For the current analysis, we sampled comments posted on the exact day of the earthquake, in Albanian: 1678 comments (6%). The most frequent polarity detected in comments from LastQuake app users was negative (52%), followed by positive and neutral. However, manual classification is time-consuming and not feasible during the emergency phase. Therefore, we tested the accuracy of two automatic classification models for sentiment analysis: ‘troberta’ and ‘txlm’. These models were fine-tuned using already-classified text data from the 2020 Aegean earthquake. Using the manual classification as the reference to evaluate the accuracy of the automatic classification models for sentiment analysis yields accuracies of 71% for the ‘troberta’ model and 56% for the ‘txlm’ model.

1. Introduction

In our daily lives, we post about our achievements, problems, activities, opinions, and/or upload videos on social media platforms such as Facebook, Instagram, Twitter/X, Reddit, Snapchat, TikTok, or YouTube to interact with our contacts, followers, or subscribers on those platforms. When an earthquake or any other kind of natural phenomenon or man-made disaster happens, social media platforms such as Twitter/X, Instagram, Facebook and YouTube ‘explode’ with posts including images and videos of the event, reporting trapped people, damage to buildings and infrastructure, requesting and announcing humanitarian aid and donations, portraying humanitarian actions, sending solidarity messages, expressing their emotions or seeking assistance [1]. After an earthquake, it is necessary to understand its impact to provide relief and improved mitigation strategies [2]. Eyewitness reports have always been part of seismology [3]. Text and image data provided by users through social media platforms are valuable for emergency response [1,3,4,5,6,7,8], post-disaster needs assessments, earthquake reconnaissance missions [2,7,9], post-disaster recovery assessments, and preparedness projects. Social media also provides insight into public emotions and behaviours during disasters [1,10].
In addition to social media platforms, there are crowdsourcing platforms that collect text and image data from volunteers. In the field of earthquake reconnaissance, seven crowdsourcing platforms have been identified [6]: LastQuake app [11], Did You Feel It? (DYFI) [12], Earthquake Network [13], MyShake Project [14], Raspberry Shake [15], QuickDeform [16] and the Taiwan Scientific Earthquake Reporting (TSER) system [17]. The LastQuake app is a smartphone app for global earthquake eyewitnesses launched in 2014 by the European Mediterranean Seismological Centre (EMSC) as part of a multichannel rapid information system that also includes websites and a Twitter quakebot. Its app collects reports of perceived intensity from users using the Modified Mercalli Intensity (MMI) Scale, which is integrated into the app, along with their comments, to provide rapid situational awareness [11]. The novelty of this research is that we use these comments as the source of our text data, while most research on emergency response and social media bases its analysis on text data extracted from Twitter/X.
Text data obtained from posts on social media and comments accompanying the intensity-felt reports from LastQuake app users is unstructured, which is why it is necessary to identify patterns and trends to extract information, a process known as text mining [18]. This process applies natural language processing (NLP) techniques [19,20]. Natural language processing is a branch of artificial intelligence that enables machines to understand human language [21,22] by analysing sentences and words, applying various approaches to extract information, and delivering outputs. One specific NLP technique is sentiment analysis, also known as ‘opinion mining’. This is a method for analysing human emotions expressed in text, such as anger, anticipation, disgust, fear, joy, sadness, surprise, and trust. Another approach [18] is to classify people’s opinions, attitudes and emotions towards entities [23] and their attributes, as expressed in sentences, phrases and text volumes, into a specific polarity (positive, negative or neutral) [18,24,25] by detecting patterns from the emotions and feedback from users [26]. These entities can be products [10], services, events, organisations, individuals, issues, or topics [27].
Sentiment analysis can be performed at three levels of granularity: document, sentence, feature or aspect level. In the case of sentiment at the document level, the aim is to detect the polarity of an entire review or of a whole opinion, which could consist of several sentences; while in sentiment analysis at the sentence level, the goal is to detect the polarity expressed in each sentence [27,28]. However, classifying text data at the document or text level into positive, negative, or neutral polarity is insufficient because this classification does not identify sentiment or opinion targets or assign sentiment to them [29]. Therefore, it is necessary to use aspect-based sentiment analysis (ABSA) a granular variation of sentiment analysis, that identifies the polarity associated with opinions and aspects from a given text [30]. Sentiment analysis can be performed manually or automatically. Manual classification of text data is time-consuming and not feasible during the emergency phase, but it is necessary to train large language models (LLMs). Therefore, sentiment analysis uses automated text analysis to extract information from the text [20]. There are pre-trained LLMs [31] that are further fine-tuned for sentiment analysis, such as Twitter-RoBERTa (referred to as ‘troberta’) [25] and BERTweet (referred to as ‘btweet’) [32]. Both models are based on the RoBERTa architecture [33]. These transformer-based language models [34] consistently outperform prior sentiment analysis approaches and adapt well to domains, including social media text data.
Word frequency analysis presented as word clouds [35] is a complementary analytical step to sentiment analysis. The term word cloud results from the term tag cloud, introduced by the Flickr website [36], which uses text shortening and visualisation [18]. This analysis technique generates separate word clouds for text data that has already been classified into polarities [37]. Word clouds, also known as tag clouds, are a popular way to aesthetically display text data in 2D [38], useful in assessments by identifying keyword paterns [35] and in this way extracting information [18] from text data, providing an overview of the main topics and themes addressed in a text [39]. In this method for visualising text, more frequently used words are highlighted by occupying a more prominent place in the representation. Although a word cloud cannot provide an accurate statistical summary, context, or linguistic knowledge, it can still reveal the overall context of the text [18]. In this way, word clouds constitute a useful tool for analysing and validating findings [39].
There has not been enough research on identifying the polarity of emotions posted by social media users during and after disasters, which can inform emergency response institutions in developing comprehensive situational awareness. Neppalli et al. [10] performed sentiment analysis of tweets posted during Hurricane Sandy and visualised online users’ sentiments on a map. This exercise showed that the polarity of the posts varied with distance from the event and location [10]. Parimala et al. [26] conducted a sentiment analysis of tweets posted in a disaster context at different time intervals for a particular location. Keywords were derived and used by the algorithmic risk assessment sentiment analysis (RASA) to classify tweets and assign a sentiment score for each location. This model was validated by the authors using state-of-the-art algorithms, including convolutional neural networks, in a two-fold scenario: one for a binary class and the other for a multiclass scenario with three target classes. The results indicated that RASA performs better in a binary-class scenario [26].
Using text data collected through the LastQuake app and classifying it manually, Contreras et al. (2022) found that, for the case of the 2020 Aegean earthquake, the positive polarity is predominant in comments reporting low intensity felt (I-II), while the negative polarity prevails in the comments associated with intensity felt levels from III to VIII and X [40]. However, the authors did not observe any consistent pattern in the spatial distribution of the polarities.
Other authors have explored the spatiotemporal characteristics of emotional responses among social media users to disasters, such as Guo et al. [1]. These authors collected text data from Weibo posts after the Jishishan earthquake in 2023 and extracted information using snow NLP for sentiment analysis, complemented by the DUTIR method for sentiment classification. Their research analysed the spatial distribution and the expression of emotions over time after the earthquake. The authors found that the volume of posts on Weibo was influenced by socio-economic conditions, the progress of rescue efforts, and the impact of the earthquake on social media users, all of which presented spatial and temporal changes. Additionally, a negative correlation between the spatial distribution of emotional expressions and the earthquake’s impact level was observed, a pattern not observed around the epicentre. Areas that faced disasters in the past displayed a higher level of ‘sadness’ in the posts on Weibo, while the most affected areas exhibited a greater proportion of ‘discontent’, and a high volume of ‘fear’ was revealed in posts from users located around the epicentre [1]. They also used Weibo posts after the 2023 Türkiye–Syria Earthquake as a source of text data to assess the attention of the Chinese population towards a disaster abroad. The authors found significant social media engagement with posts that included chronicles of the earthquake response, disaster reporting, and search-and-rescue efforts. The sentiment and emotional analysis reveals that the polarity in the posts was positive during the initial three-day period focused on disaster reporting, whereas the comments showed negative polarity, characterised by ‘sadness’ and ‘discontent’. The greatest level of attention to this earthquake was identified through spatial analysis in Sichuan Province and other regions with better internet access [41].
We hypothesise that automatic text classification of comments accompanying intensity-felt reports from LastQuake app users, along with the spatial distribution of this sentiment analysis, is helpful for earthquake reconnaissance and preparedness planning.

2. Materials and Methods

2.1. Case Study Area

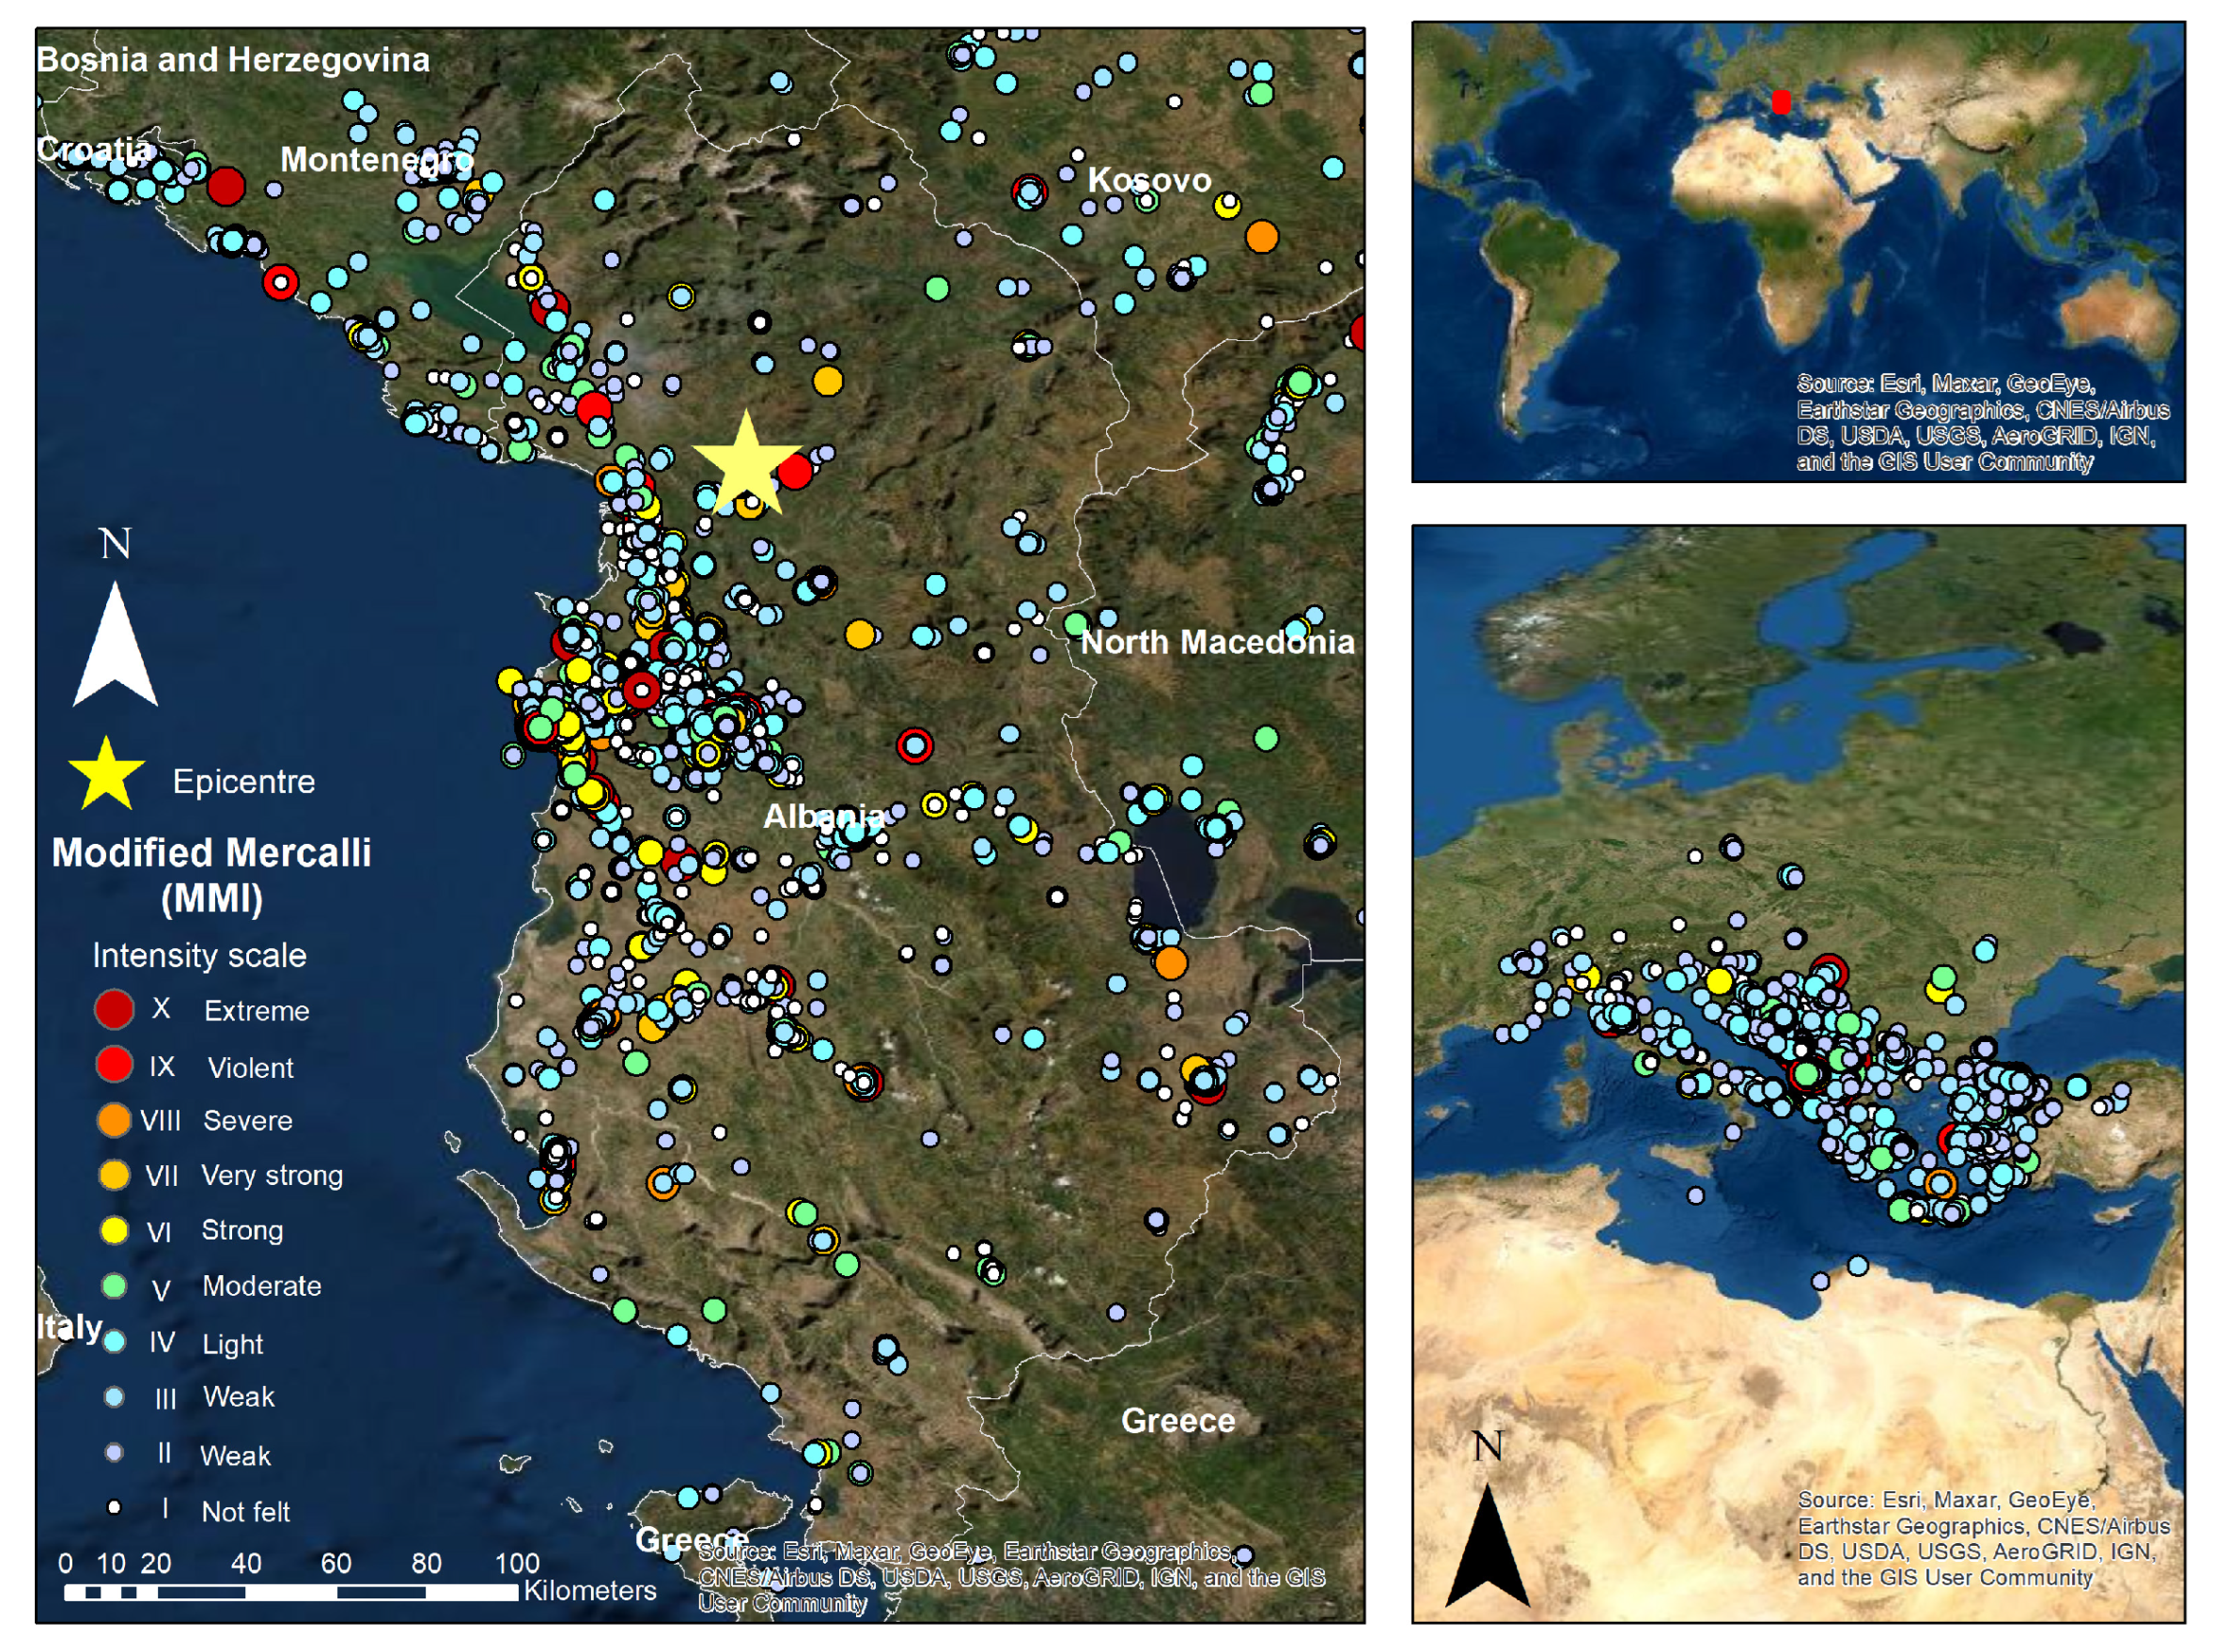
The 2019 earthquake series in Albania started with an Mw 5.6 earthquake at 15:15 Central European Time (CET) on the 21 September [42,43]. However, the data analysed in this article is about the earthquake with a moment magnitude of MW 6.4 [43,44] and a focal depth of 20 km that struck Albania’s northwest region at 03:54 (CET) [3,45] on the 26 November 2019 [43]. The epicentre was 16 km west–southwest of the town of Mamurras in Kurbin municipality (41.511° N 19.522° E). It was the strongest earthquake in Albania in the last 40 years, causing damage in the municipalities of Lezhë, Tiranë [3,46], Krujë, Shijak, Kamëz, Kavajë, and Kurbin [45], but mainly in the city of Durrës, the village of Kodër-Thumanë, Thumanë [43], and the town of Laç. The second shock had an MW of 5.1, and the third and largest aftershock had an MW of 5.4 and occurred at 07:10 CET [46] on the same day. The epicentre location and intensity felt reports submitted by users of the Last Quake app 2.1.0 on the MMI Scale for the first earthquake on the 26th are depicted in Figure 1 and listed in Table 1.
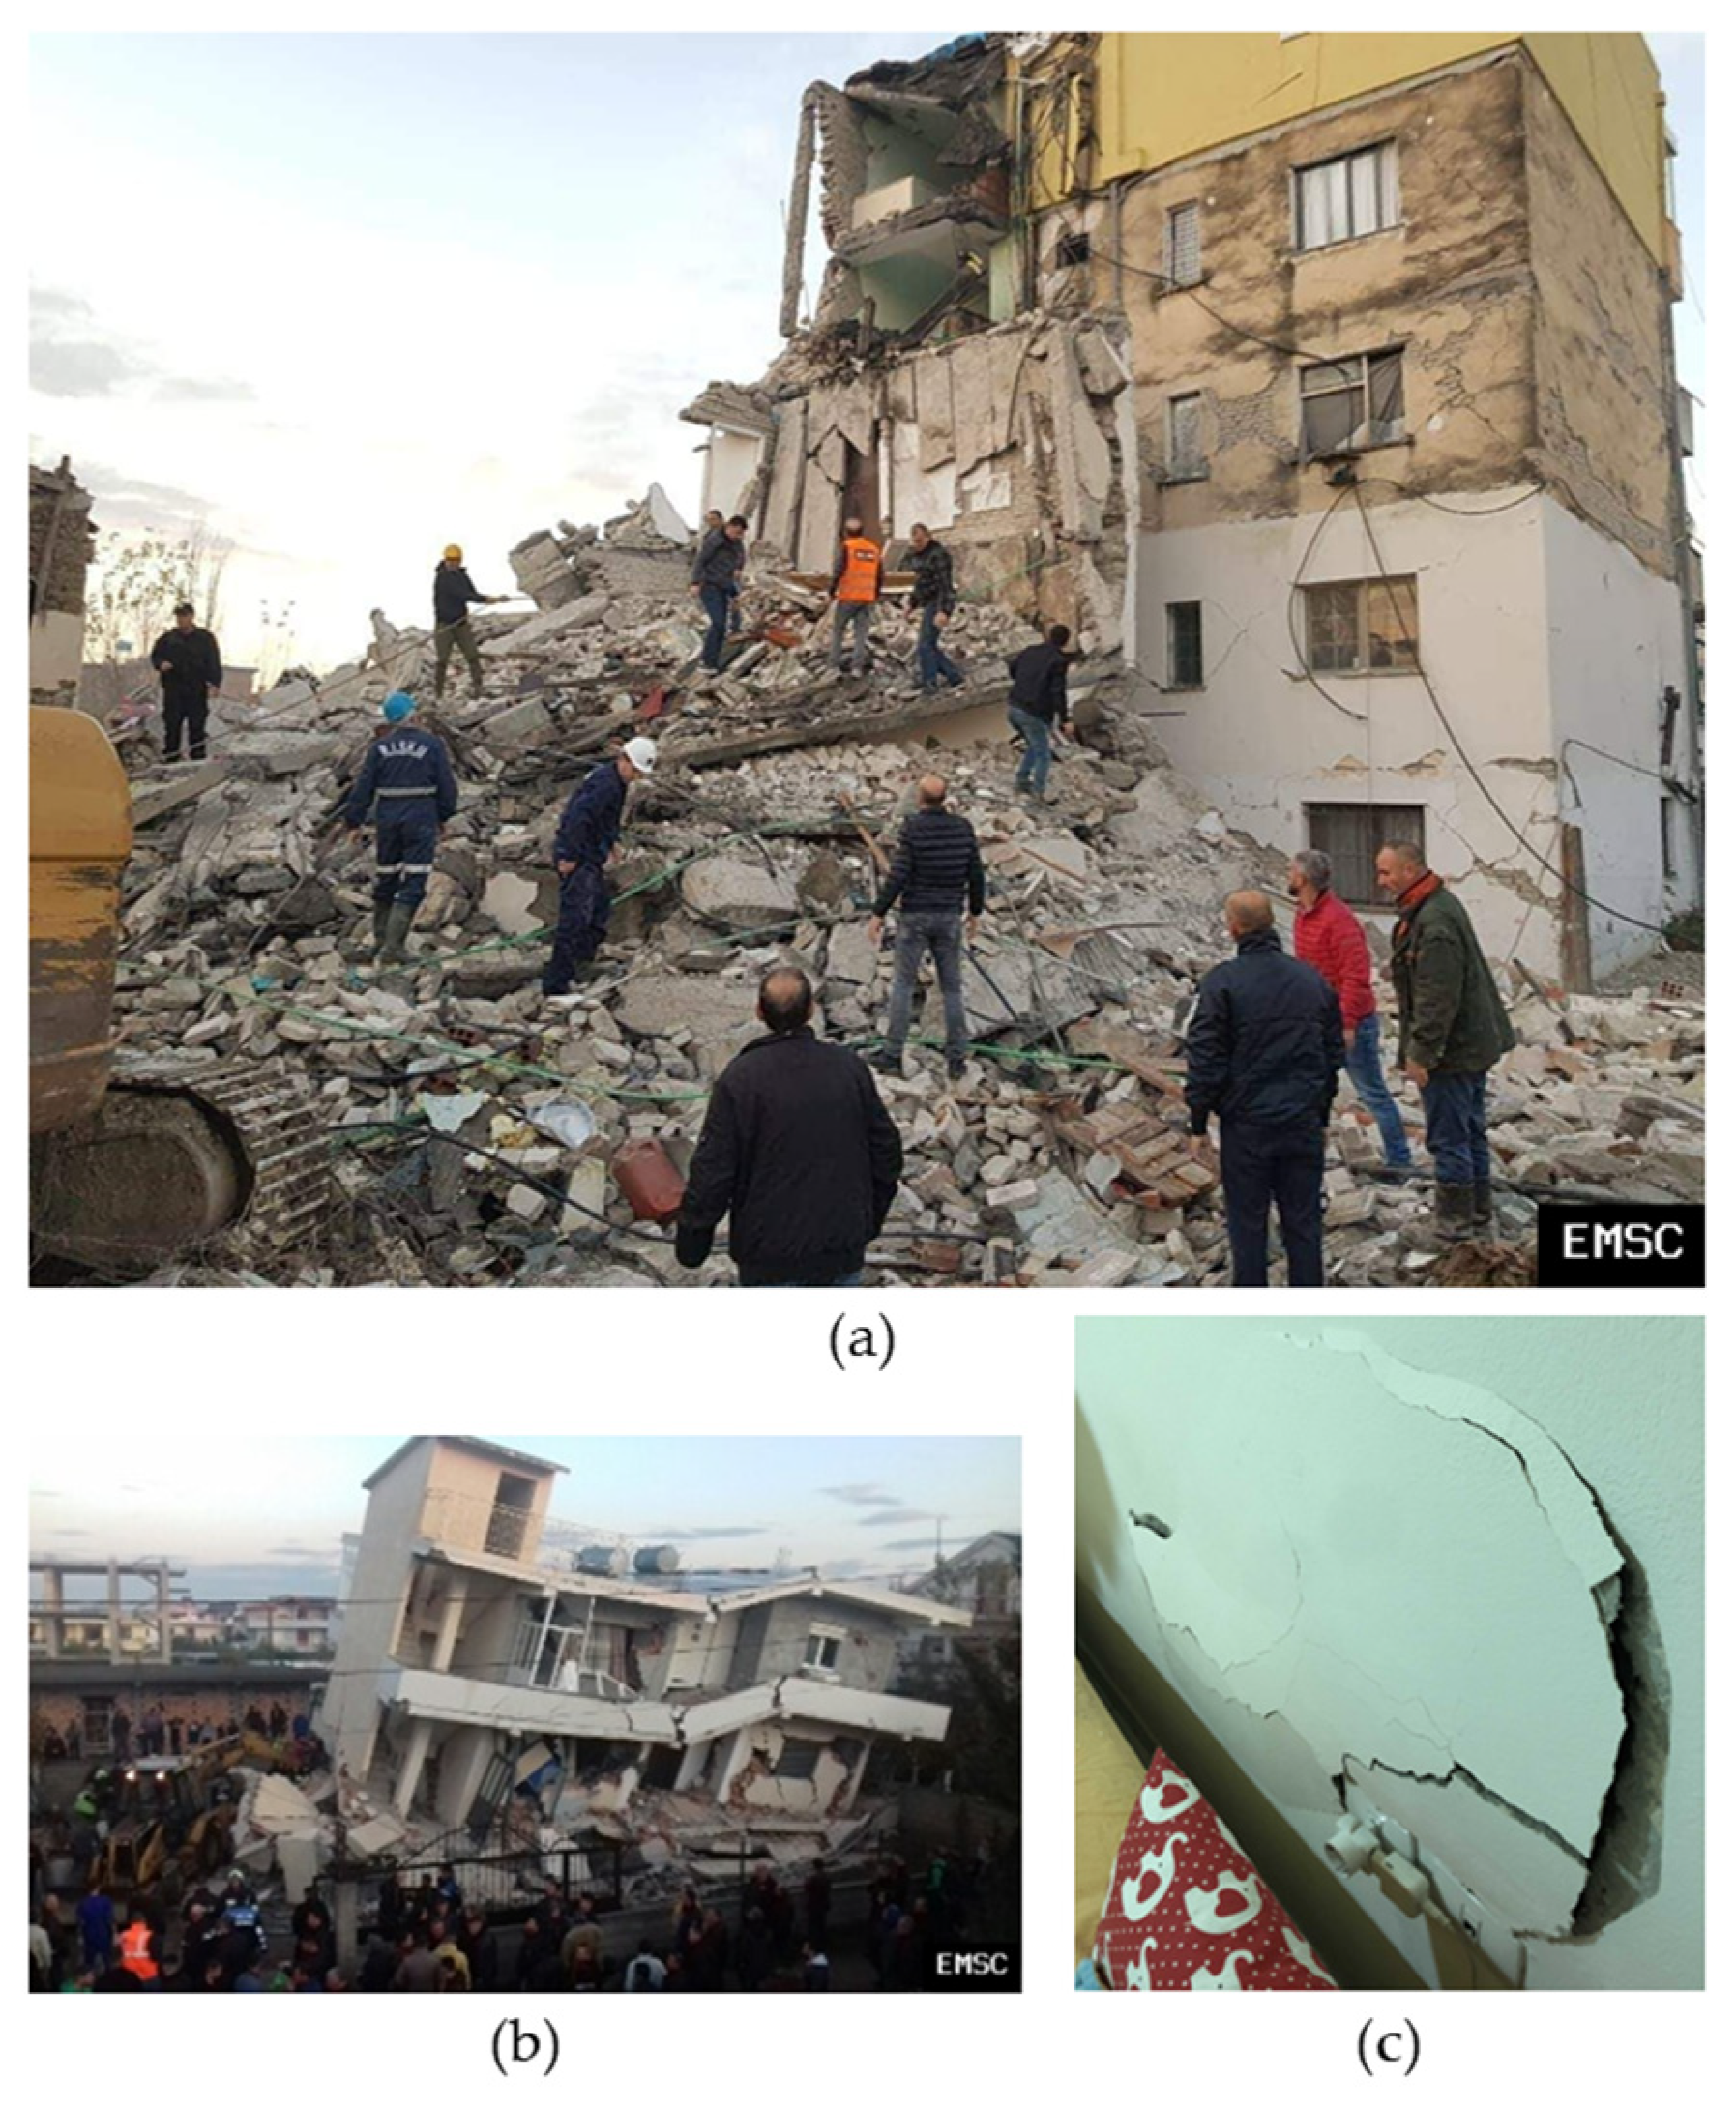
The earthquake caused 51 deaths [43] and between 600 [3] and 913 injuries, including 255 from the aftershocks [42]. Reports indicated that 11,490 housing units were categorised as either destroyed (see Figure 2a) or requiring a complete rebuild (see Figure 2b). Additionally, 83,745 housing units were partially or slightly damaged (see Figure 2c). This level of destruction is the result of a combination of hazard and physical vulnerability conditions in the affected cities in Albania, including site amplification, soil liquefaction [44], strong ground motion, and impacts on buildings from the 21 September 2019 Mw 5.6 foreshock, ageing of building materials, poor construction quality, and building workmanship, and pre-existing stress on buildings that sustain differential displacement due to soft soil conditions in their foundations [43]. The shaking caused by this earthquake was amplified by the weak, unconsolidated basins and coastal estuaries around the epicentre. Amplification factors of 4–5 over the shaking that was experienced at bedrock sites, like in the epicentre itself, were shown by Temblor’s STAMP model [44]. A total of 1200 people were evacuated from Thumanë, Tiranë, Durrës, Krujë, and Lezhë [48]. Around 17,000 people were displaced to live in temporary shelters [46].

2.2. Data Collection

LastQuake app users submitted 28,220 reports of the intensity felt during the earthquakes between 25 November 2019 and the 11 January 2020. However, for this sentiment analysis and to test the accuracy (ACC) of the pre-trained large language models, we took only a sample of 1678 (6%) intensity felt reports submitted through the LastQuake app on the day of the earthquake, the 26 November 2019, written in Albanian. We took this sample of text data provided by LastQuake app users 24 h after the earthquake because it is the most critical moment in the emergency response, when there is still an opportunity to reduce the earthquake’s impact, given the high probability of finding survivors among the debris, and to prevent secondary effects such as fires, explosions, leaks, and spills. Therefore, the priority is to save lives by deploying search-and-rescue teams, evacuating unsafe buildings, and addressing post-disaster needs [49].

2.3. Data Processing and Analysis

The comments accompanying the intensity-felt reports submitted by LastQuake app users were translated into English by the second author, who is not only a native speaker but also an expert in seismic risk, and were manually classified into each polarity by the first author according to rules defined and agreed with the ninth author for the classification of tweets posted after the same event [2] and other earthquakes such as the 2020 Zagreb [7] and the 2020 Aegean earthquake [40]. These authors established these classification rules based on their expertise in emergency response, earthquake reconnaissance, and recovery after earthquakes. Afterwards, descriptive statistics were applied to the frequency of each polarity and its percentage in the entire dataset to determine the predominant polarity. In this research, we applied ABSA [29,30] at the document or comment level to identify sentiment in text data from comments accompanying intensity-felt reports from LastQuake app users regarding the seismic movement, the earthquake’s impact, and their attitude to both. The classification rules are listed in Table 2.
Examples of intensity felt reports classified into each polarity can be read below:
  • Positive
    • Slight
    • Felt nothing
    • The only thing is to pray that it doesn’t happen again. I hope you are well and there are no more victims. May they rest in pace…
  • Negative
    • Fear
    • Horrible, May God protect us
    • They are not stopping; there are a lot of shakings. We do not know what to do, to stay inside or outside
  • Neutral
    • Shaking
    • Yes, it was felt
    • This was the second earthquake and scientifically it is stronger and longer than the first. Now there shouldn’t be much going on. Perhaps this was the last
The manually classified sample of text data will serve as the benchmark to evaluate the ACC of two automatic classification models for sentiment analysis: ‘troberta’ and ‘txlm’. While ‘troberta’ classifies comments that have already been translated into English, txlm is a multilingual model that classifies the original Albanian text. These models were fine-tuned using already-classified text data from the 2020 Aegean earthquake [40]. The models were trained using the Hugging Face Trainer API with the following hyperparameter configurations: we utilised the AdamW optimiser with an initial learning rate of 5 × 10⁻⁵ and a weight decay of 0.01. The training ran for up to 20 epochs with a batch size of 16. Finally, we applied an early stopping mechanism with a patience of 3 epochs, i.e., the training stopped early if no performance improvement was observed over 3 consecutive epochs.

2.4. Information Extraction

2.4.1. Keyword Extraction

To extract information, we initially used word frequency analysis to summarise the text data. Keywords from each polarity’s dataset are extracted using word clouds [38,39]. For this research, we extracted complete sentences written in Albanian from reports of the intensity felt by LastQuake app users. The frequency of a word, expression, or sentence is represented by the font size and its placement on the word cloud; the higher the frequency, the larger the font and its placement near the centre of the word cloud. The keywords were extracted based on their high frequency in comments [18,38], allowing us to detect a pattern of the seismic intensity felt, expressed in words and feelings [18], among the population affected by the earthquake.

2.4.2. Spatial Distribution

Taking advantage of the fact that LastQuake app comments are georeferenced, their spatial distribution, including their polarity, is plotted in the case study area to check where there is a correlation between the number of comments or the frequency of a specific polarity with respect to the location of the epicentre.

2.4.3. Validation

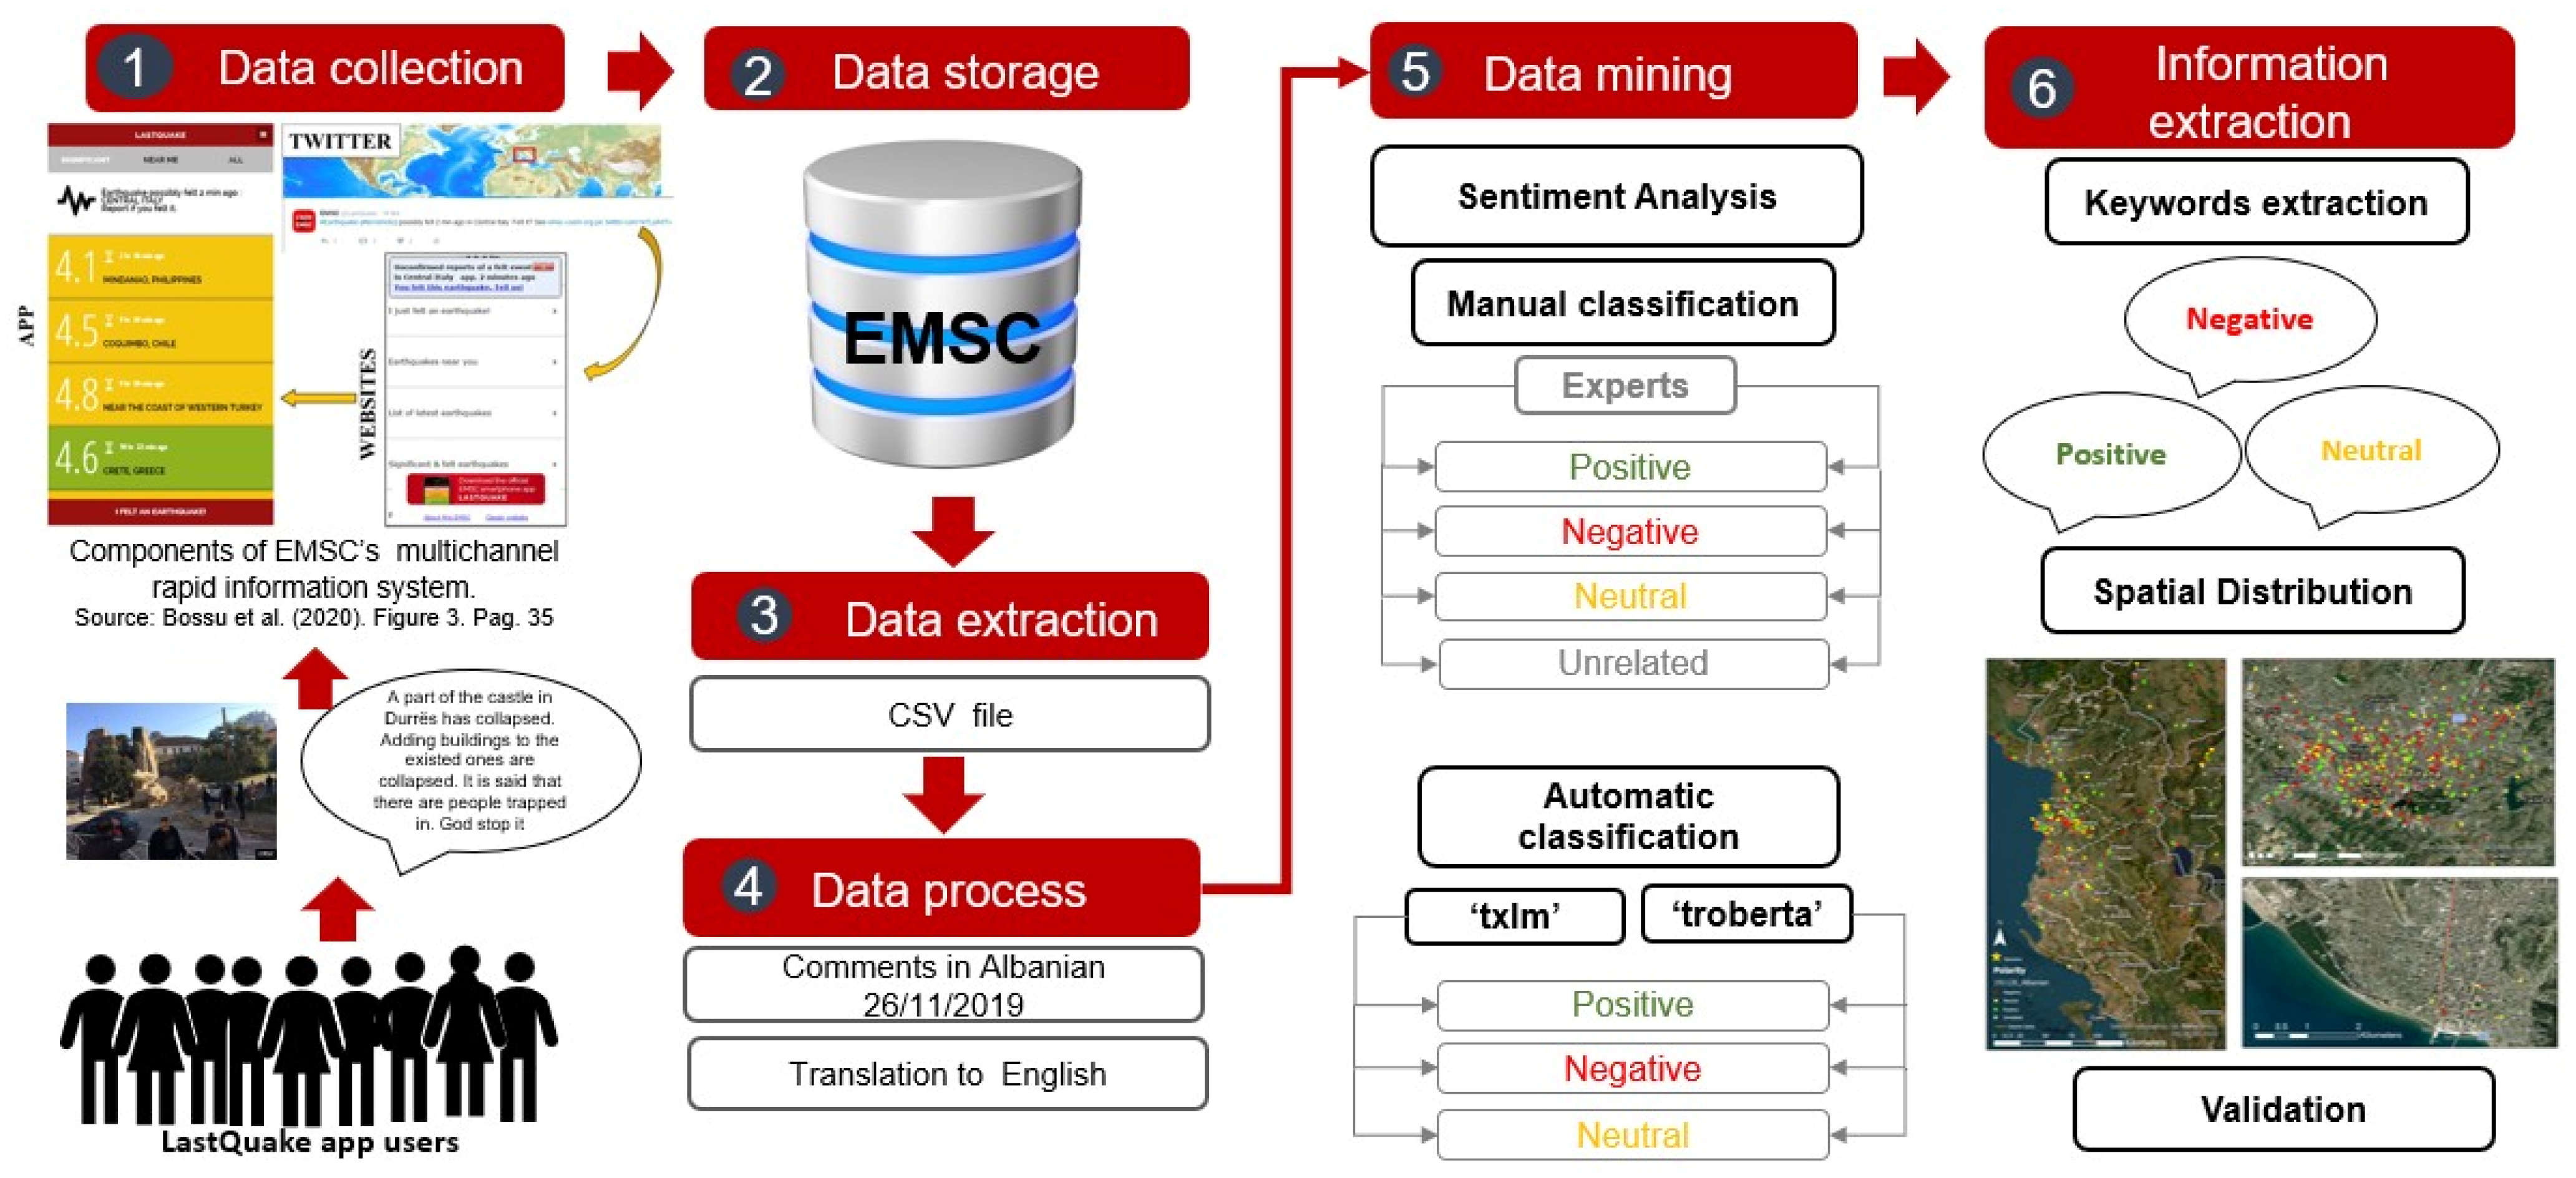
The validation of the rules and the result of the sentiment analysis must ideally be done by representatives of the government, emergency response agencies, academic institutions and representatives of the communities; however, given the lack of funding to call these stakeholders, we decided to carry out a pilot exercise of validation that took place in the framework of the International Scientific Symposium on the theme "Earthquake of 26 November 2019 with a magnitude of 6.4 in Durrës, Albania: Regional Seismicity, Regional Geodynamics and Seismic Risk (ISDE)-2023, a conference organised in March 2023 in Tirana, Albania, by the Institute of Geosciences (IGEO), the Albanian Association of Earthquake Engineering (AAEE), and the Empowerment Project Foundation (EMPRO). The methodology followed is presented in Figure 3.

3. Results

3.1. Data Collected

The most frequent intensity reported in the MMI by LastQuake app users was III (weak), followed by II (weak), I (not felt), IV (light), V (moderate), VI (strong), VII (very strong), VIII (severe), IX (violent), and X (extreme). The number of reports per intensity and shake is listed in descending order in Table 3.

3.2. Data Process and Analysis

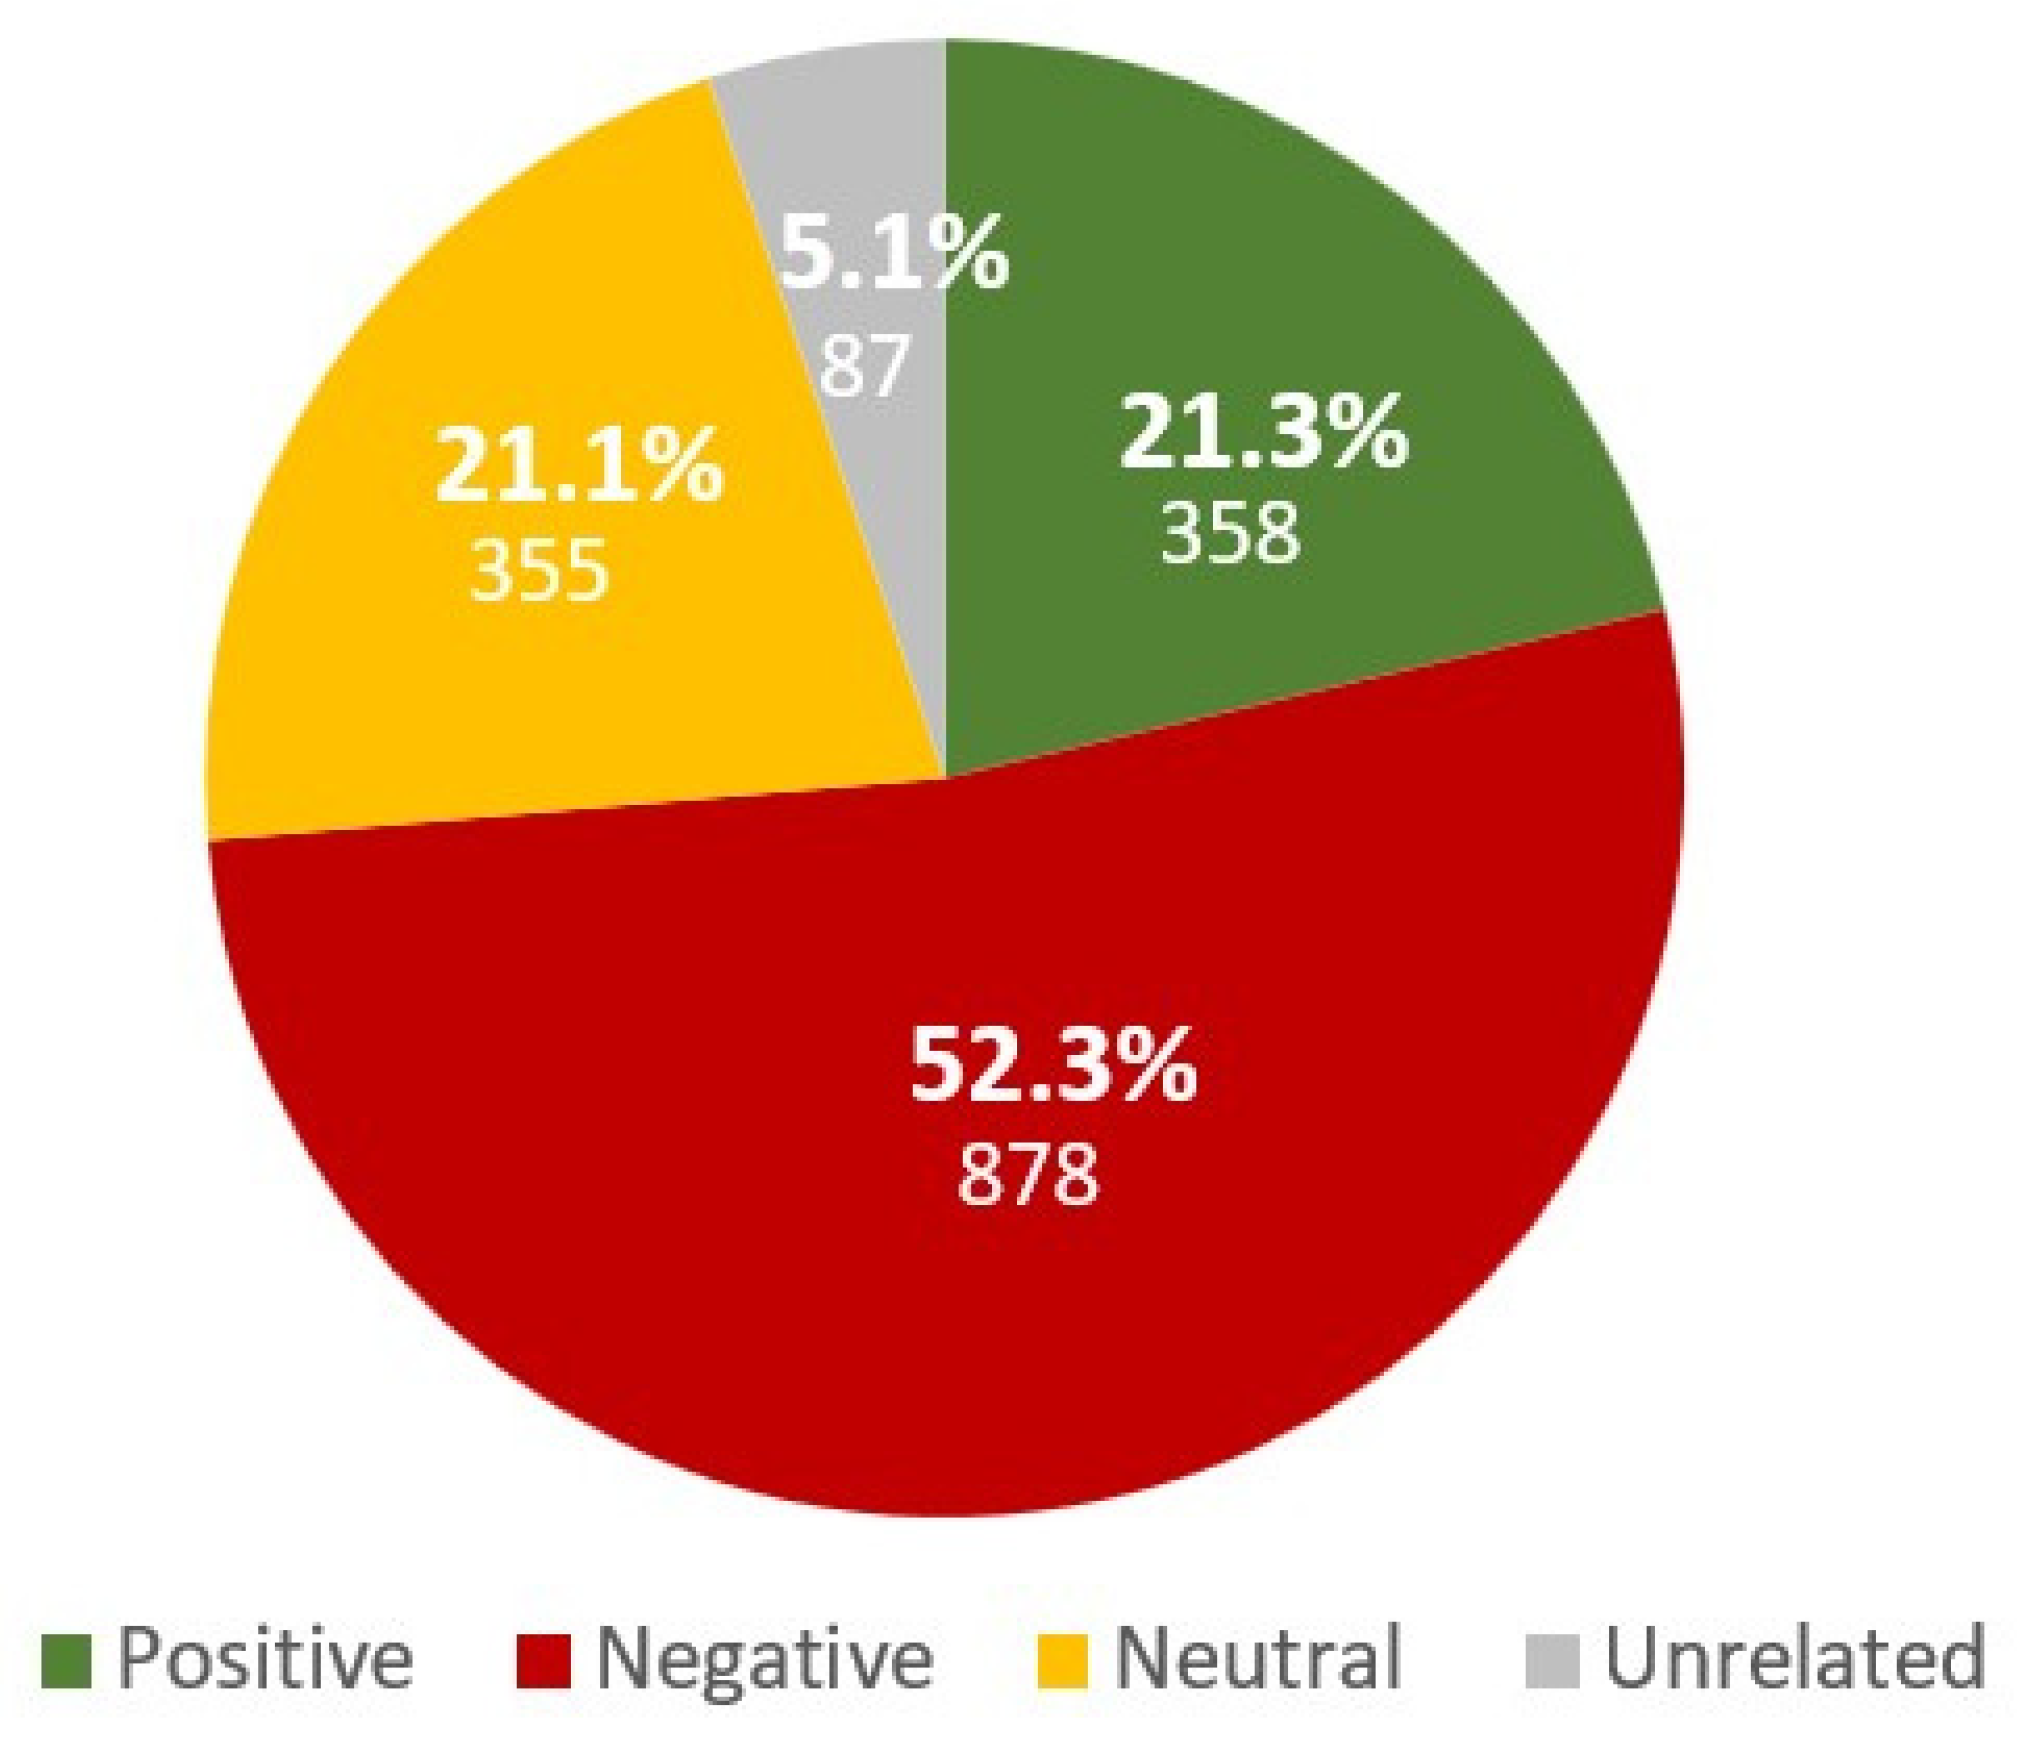
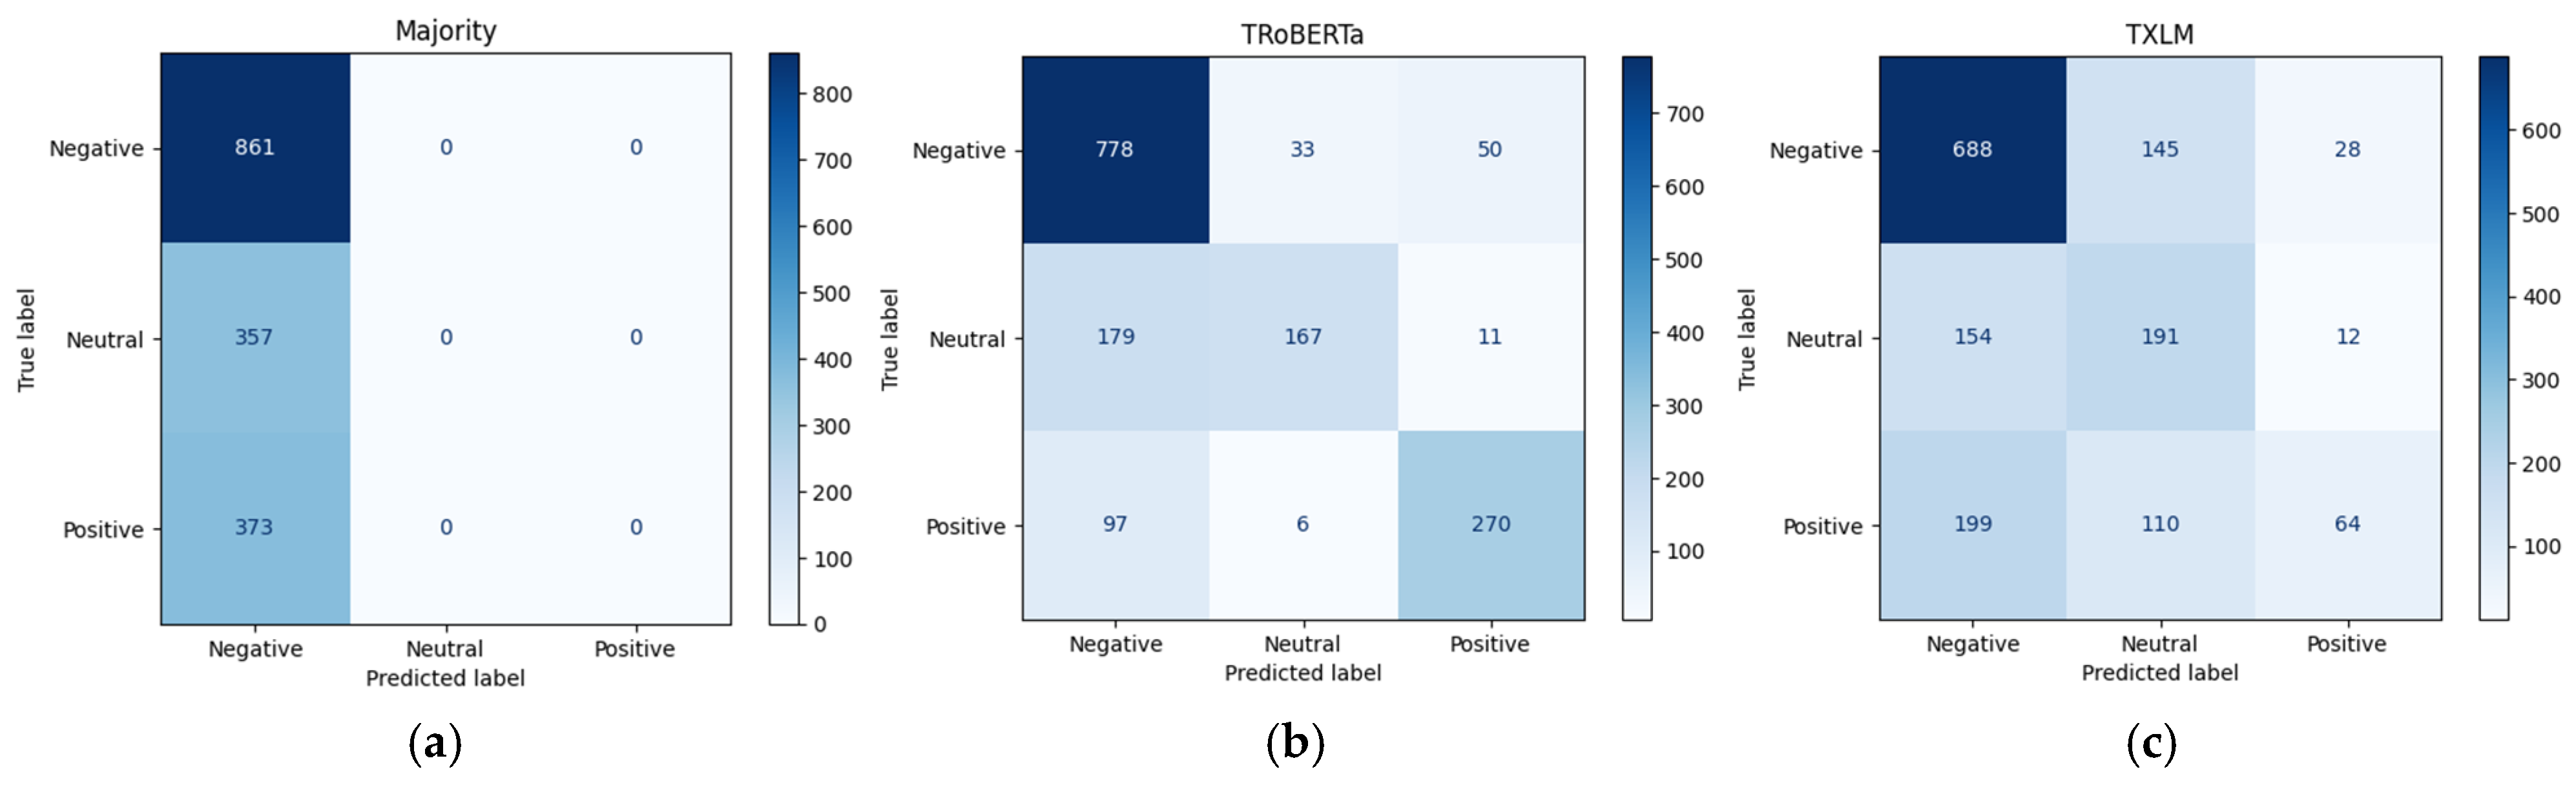
The most frequent polarity detected in comments posted in Albanian from LastQuake app users was negative (52%), followed by positive (21%), neutral (21%), and unrelated (5%). The results of manual sentiment analysis applied to the sample are depicted in Figure 4 and Table 4. Using the manual classification as the reference to test ACC, the comparison of classification results indicates ACCs of 71% for sentiment analysis with the ‘troberta’ model and 56% with the ‘txlm’ model. The ACC results, along with the average classification confidence, are shown in Table 5. In this research, we estimate the ACC of the automatic classification models by counting coincidences with the manual polarity classification. The confusion matrices are depicted in Figure 5.
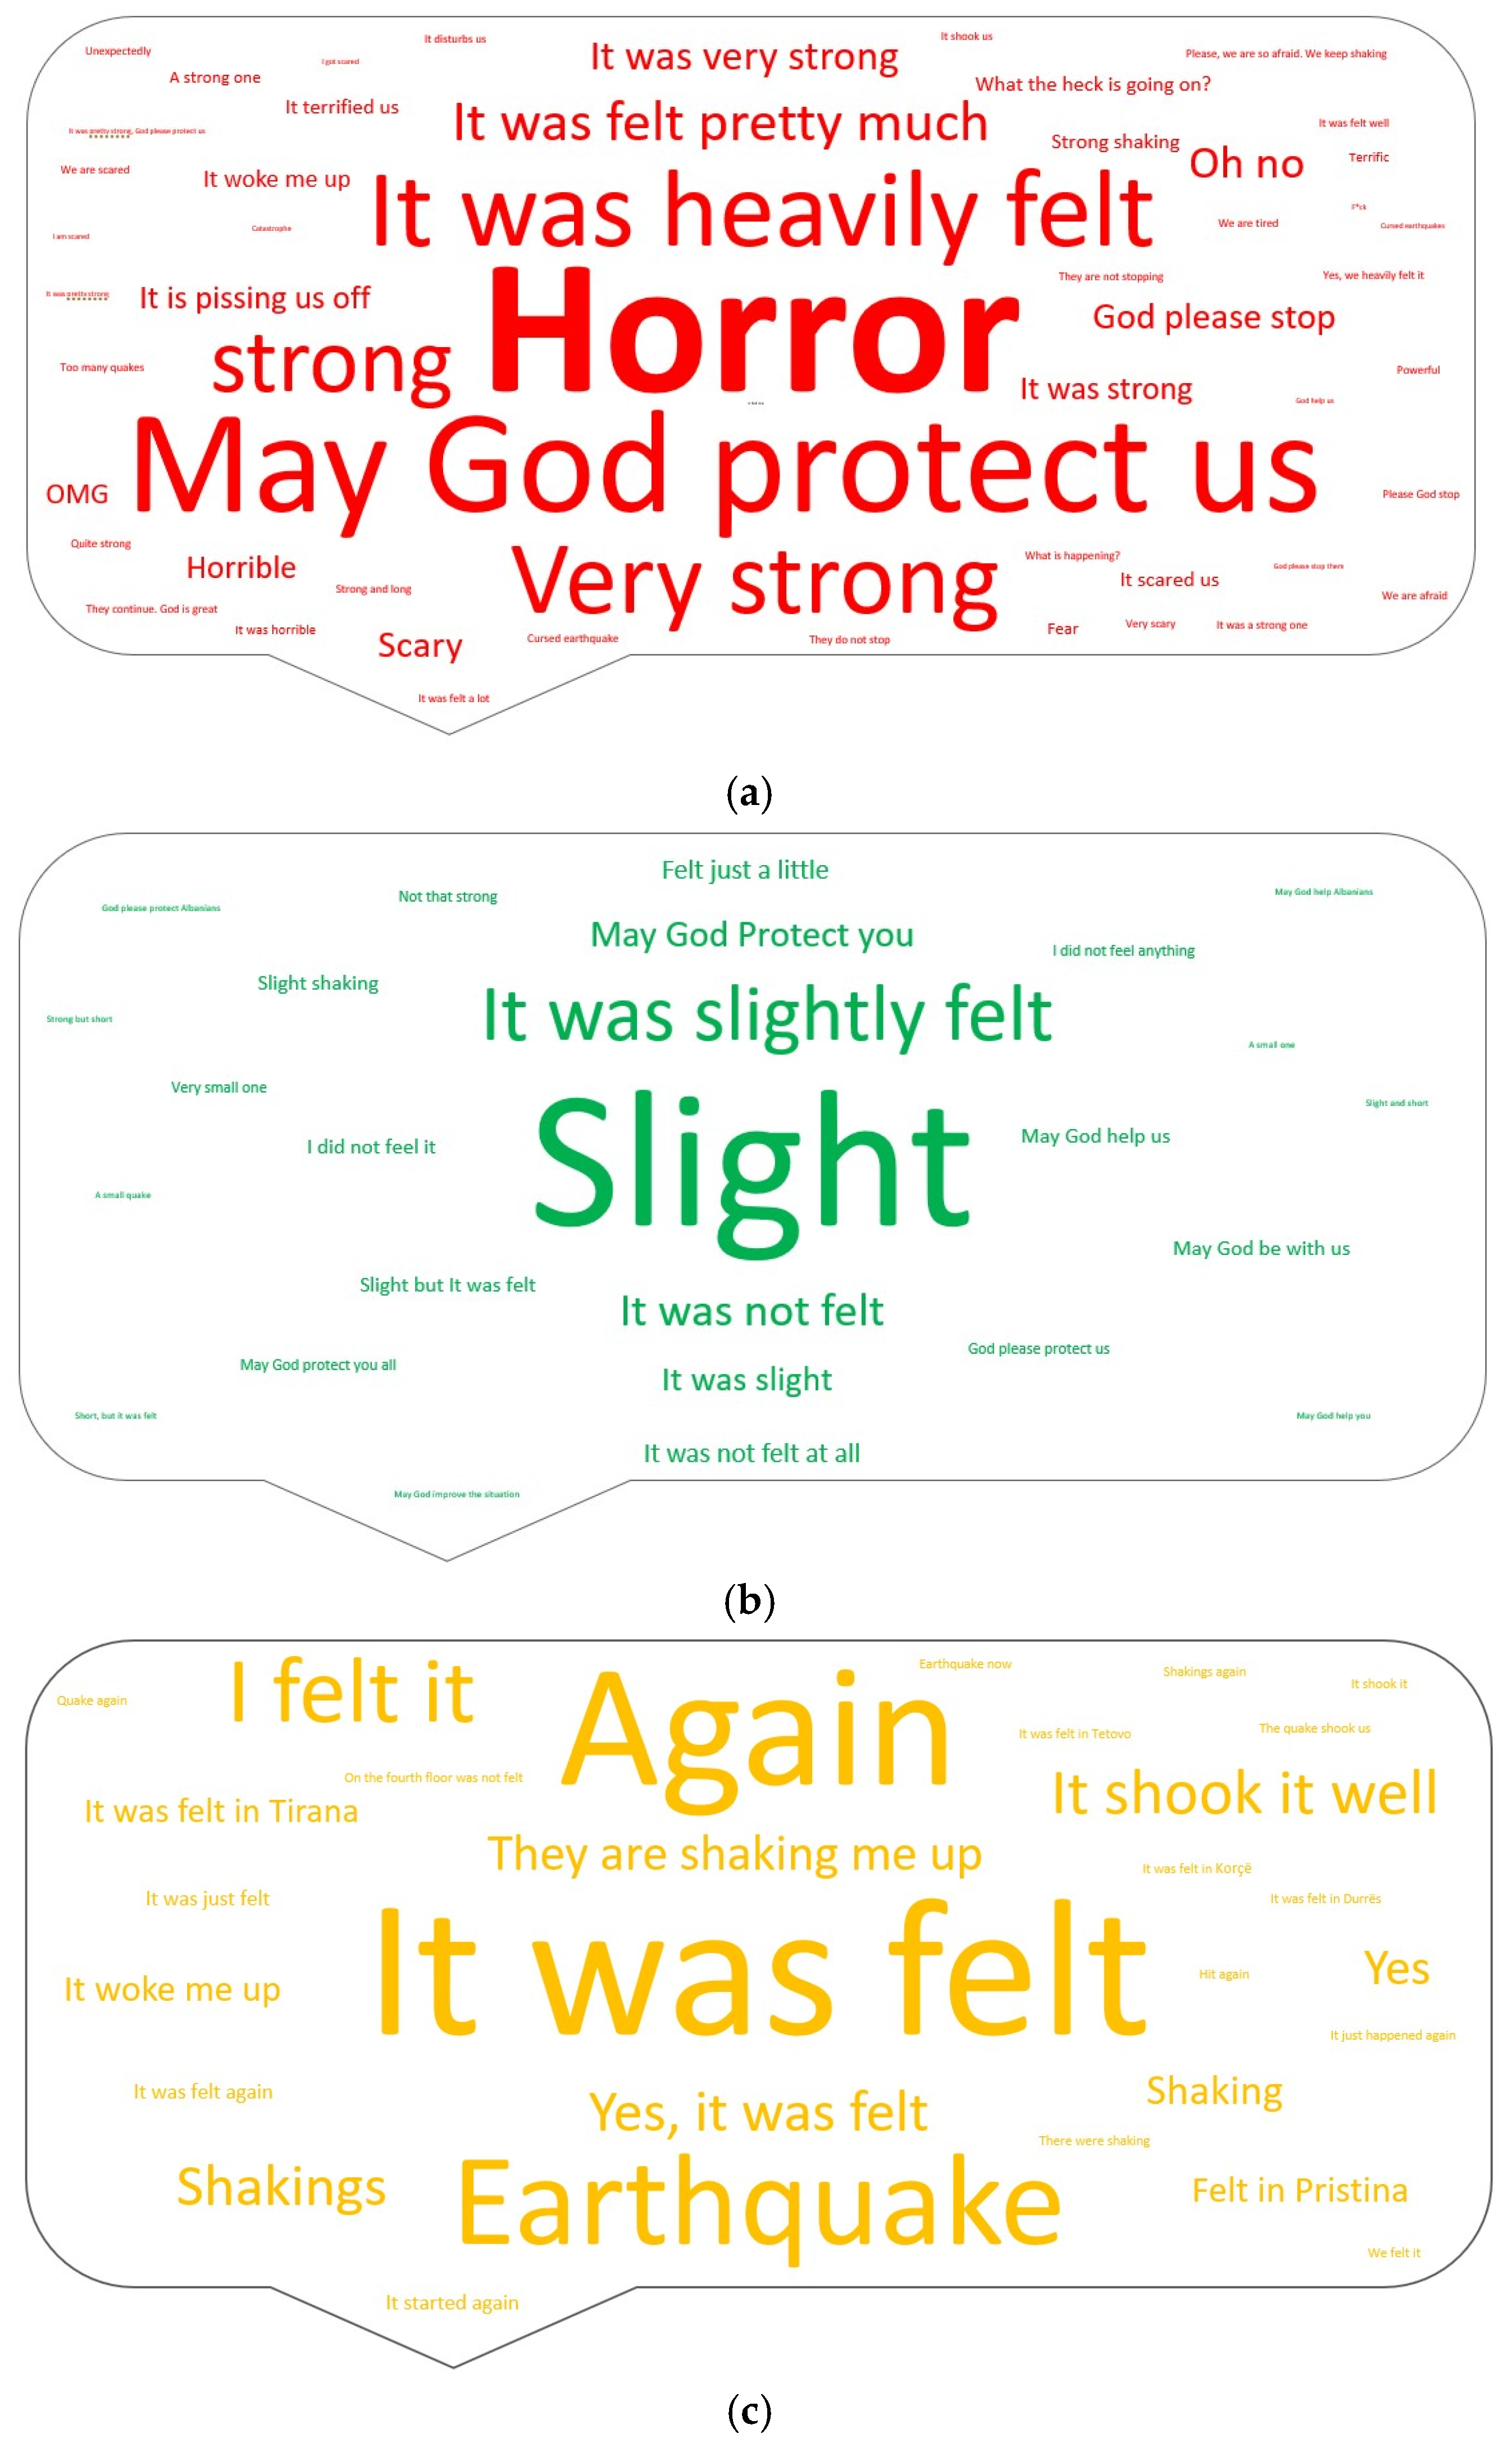
The most common expressions in the comments, accompanied by intensity-felt reports, were identified from word clouds generated with the Free Word Cloud Generator [50]. In the word cloud of comments from LastQuake app users classified into negative polarity, the most common words were: ‘Horror’ (54); for positive polarity, ‘Slight’ (37); and for neutral: ‘It was felt’ (27). A word frequency analysis of unrelated comments was not conducted because it was deemed unnecessary. The word clouds depicting the frequency of expressions with negative, positive, and neutral polarity are shown in Figure 6a, Figure 6b and Figure 6c, respectively.

3.3. Validation

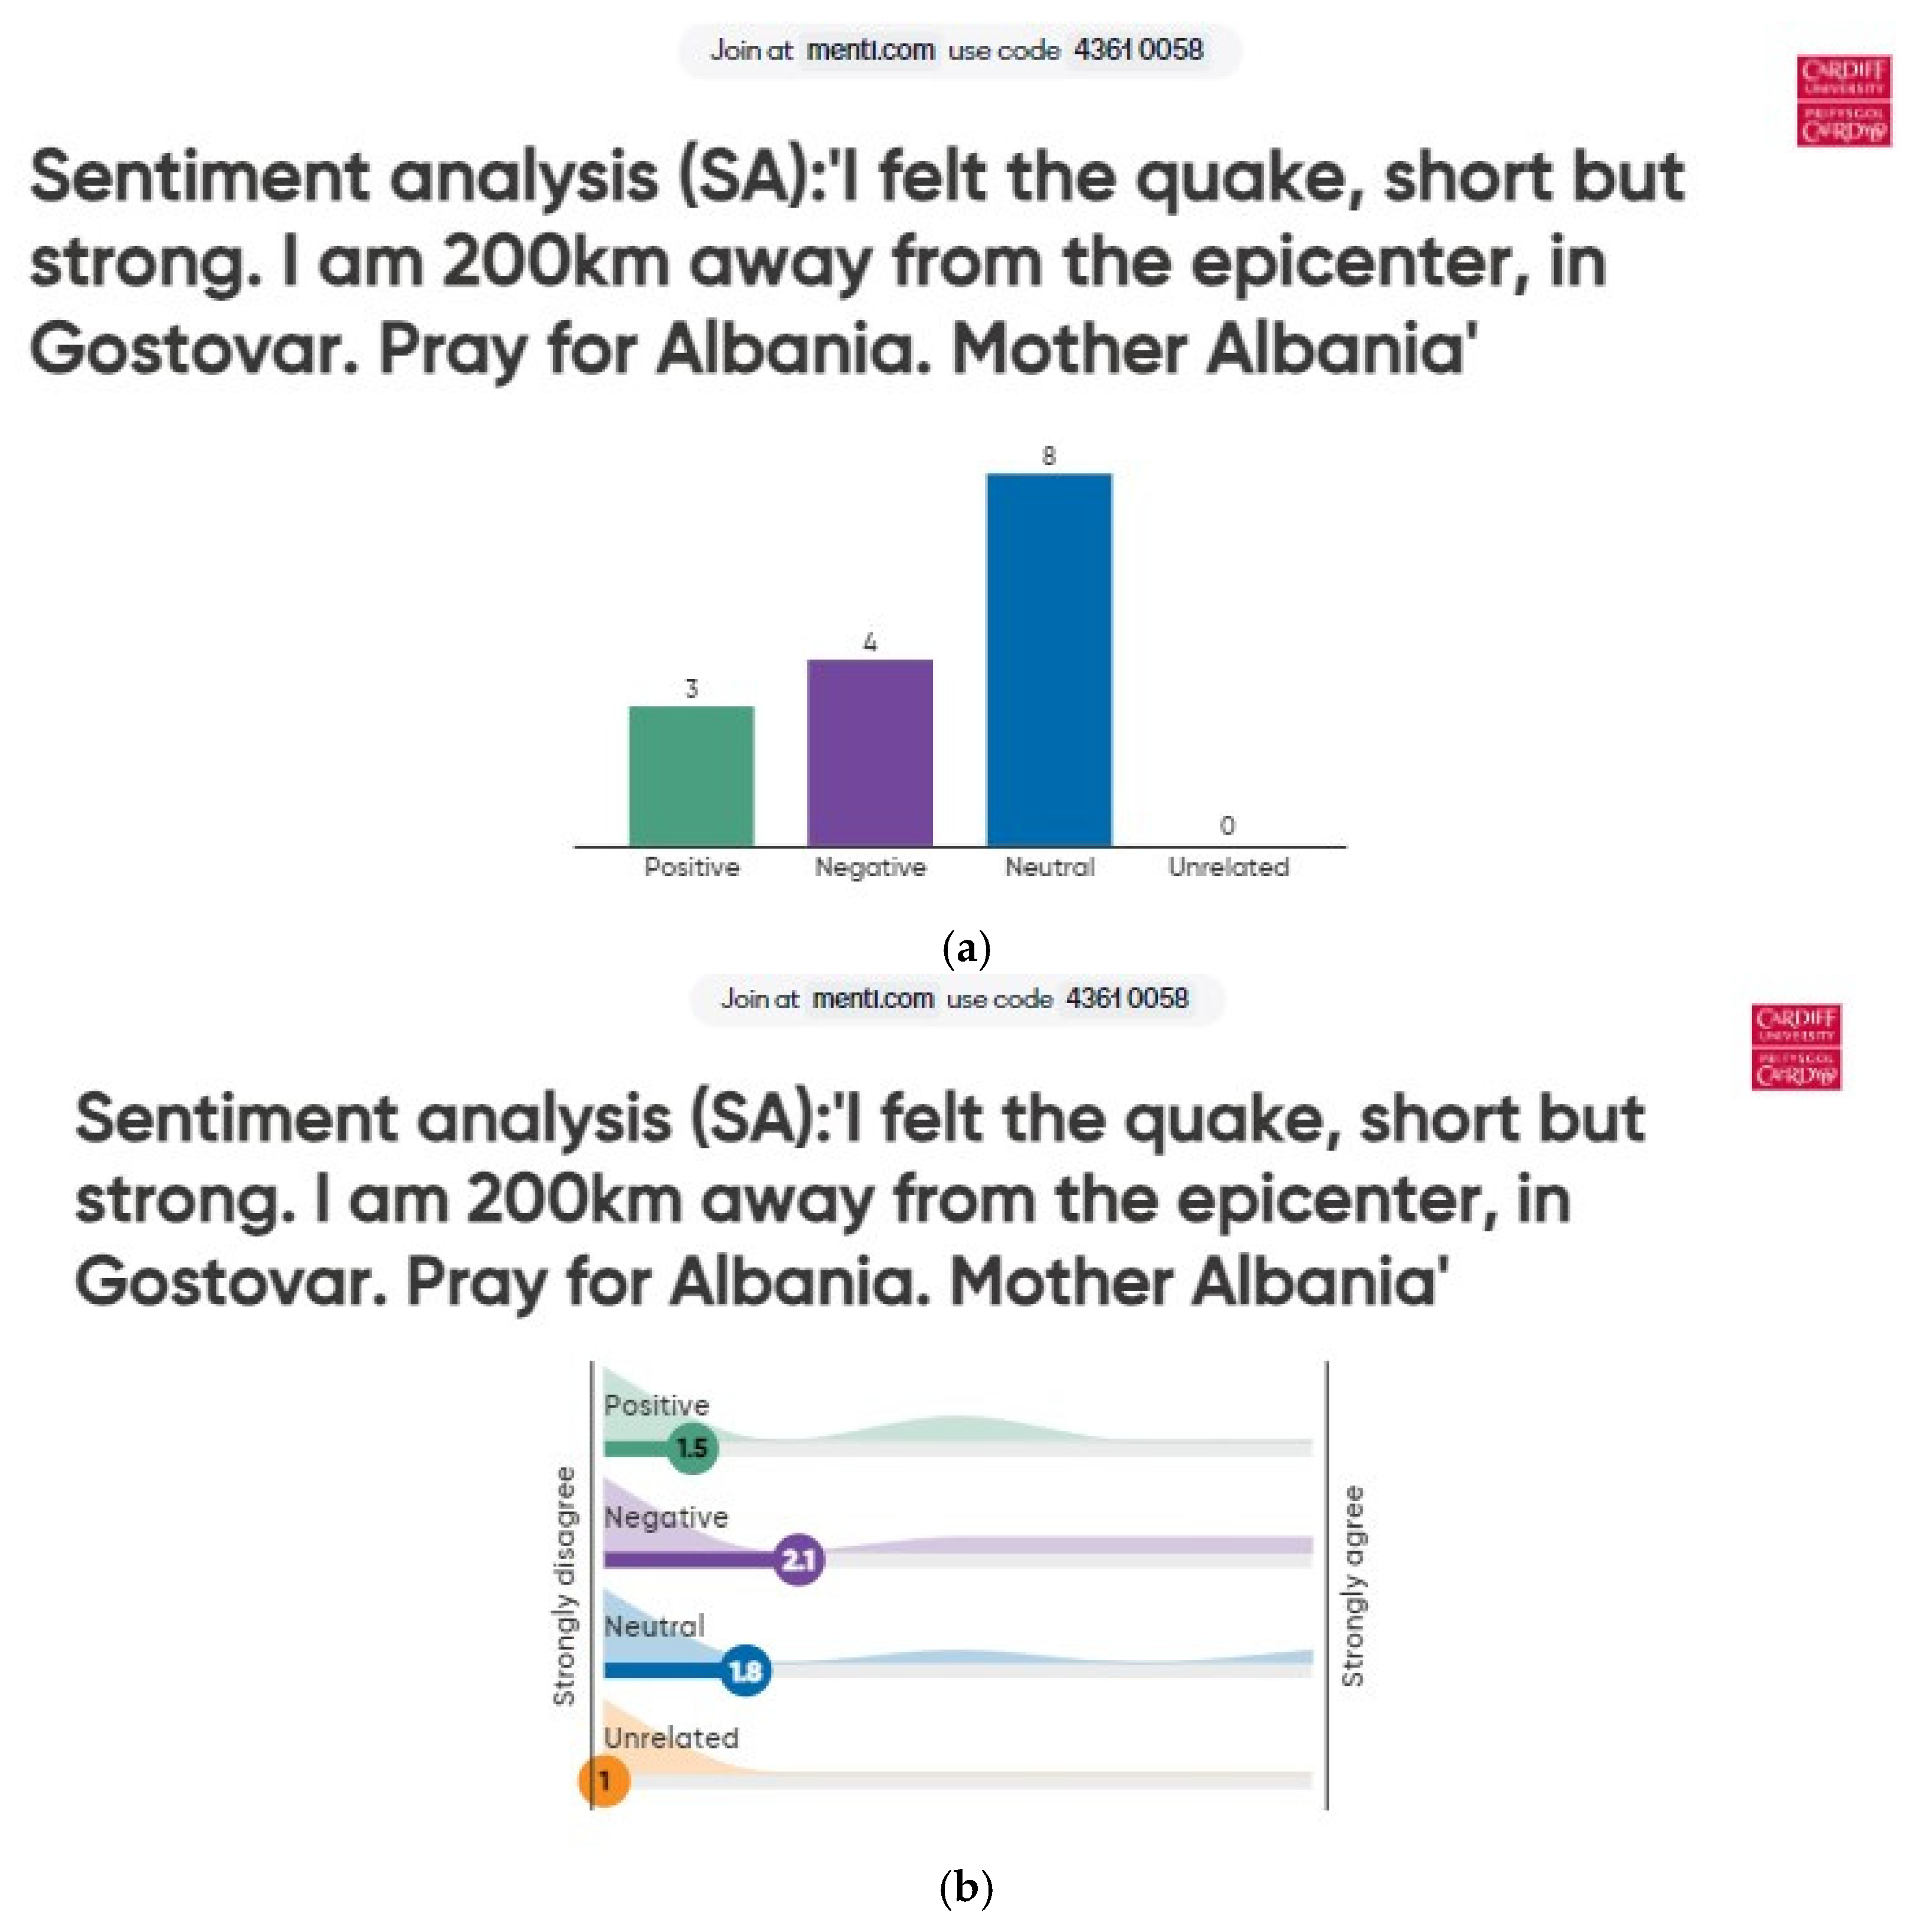
After the concept of sentiment analysis, the methodology applied in this research, and the classification rules were explained to the participants of the ISDE-2023 symposium to ensure participants’ familiarity with the classification method, the first author asked the conference participants to determine the polarity of a comment at the document and sentence levels, using Mentimeter [51]. This is an interactive platform that facilitates audience engagement. The results of the document-level (comment) and sentence-level classification validations are shown in Figure 7a and Figure 7b, respectively.
Although the ISDE-2023 symposium session, in which the preliminary results of this research were presented, was attended by around 70 people, only 18 signed up to Mentimeter; 15 (21%) participated in the classification exercise at the document level, and only 8 (11%) at the sentence level. The sentiment analysis at the document or report level by the participants classified the comments mainly as neutral (8), followed by negative (4) and positive (3), while at the sentence level, most sentences were classified as negative (2.1), followed by neutral (1.8), positive (1.5), and unrelated (1).
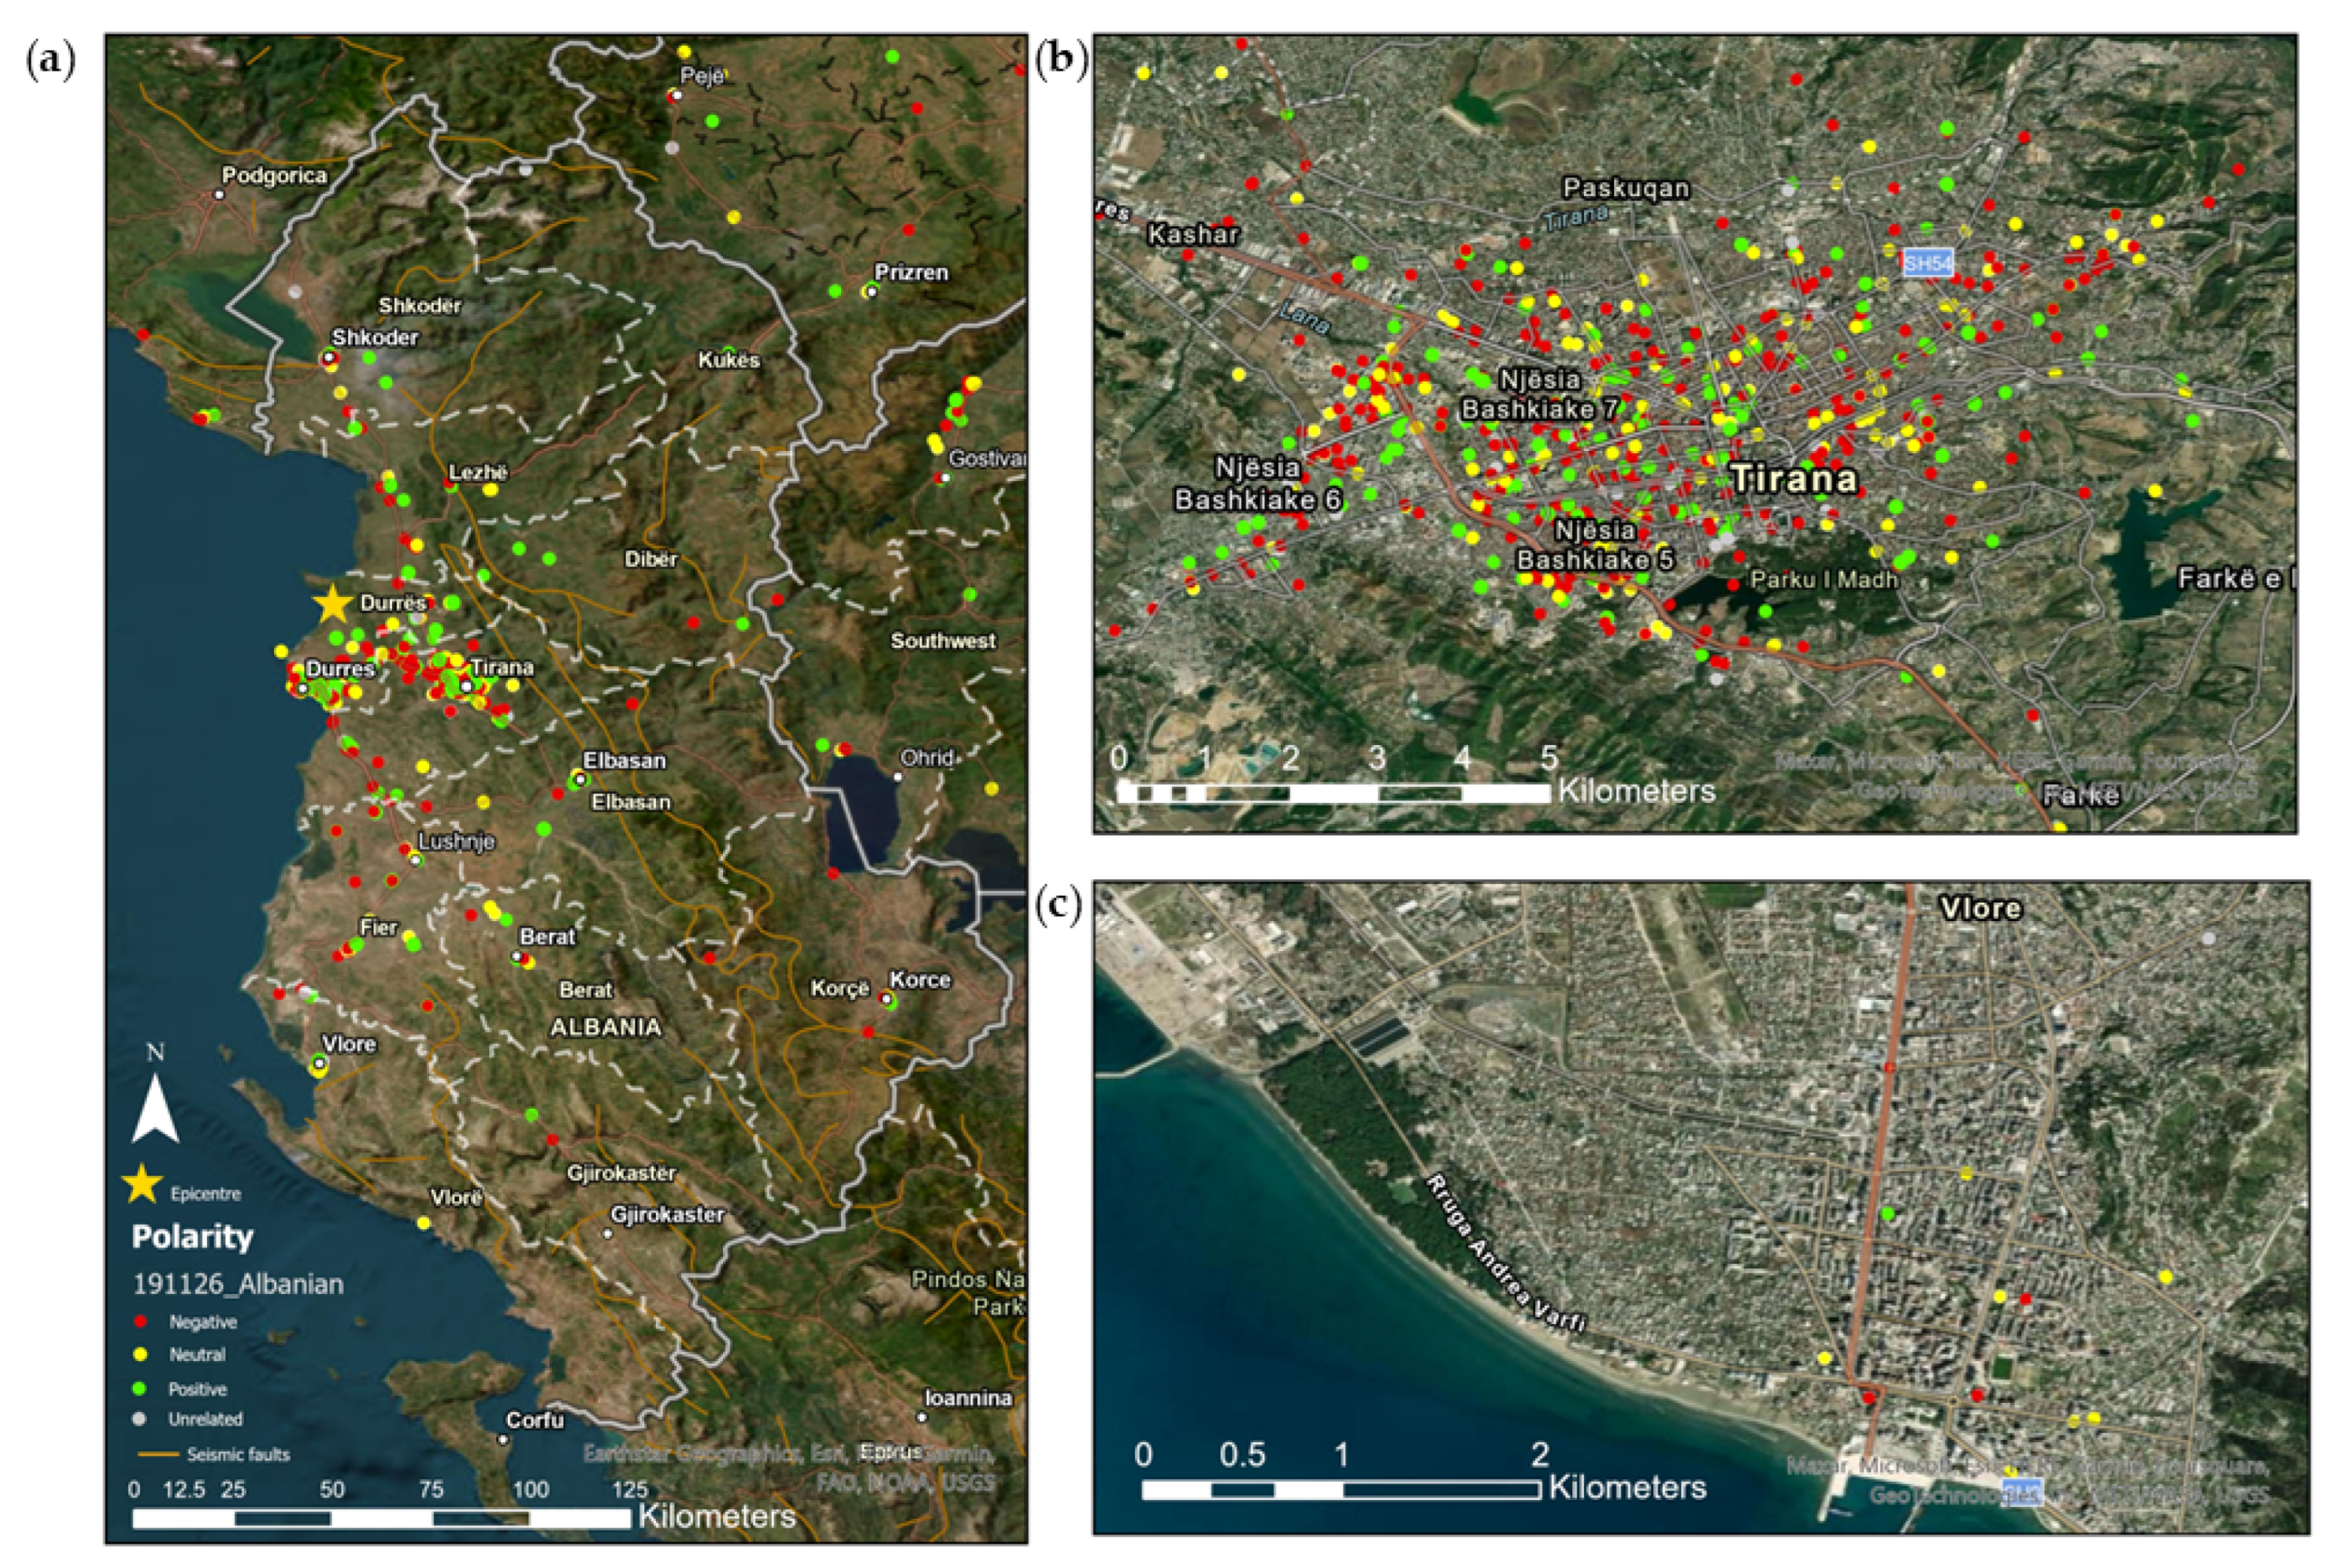
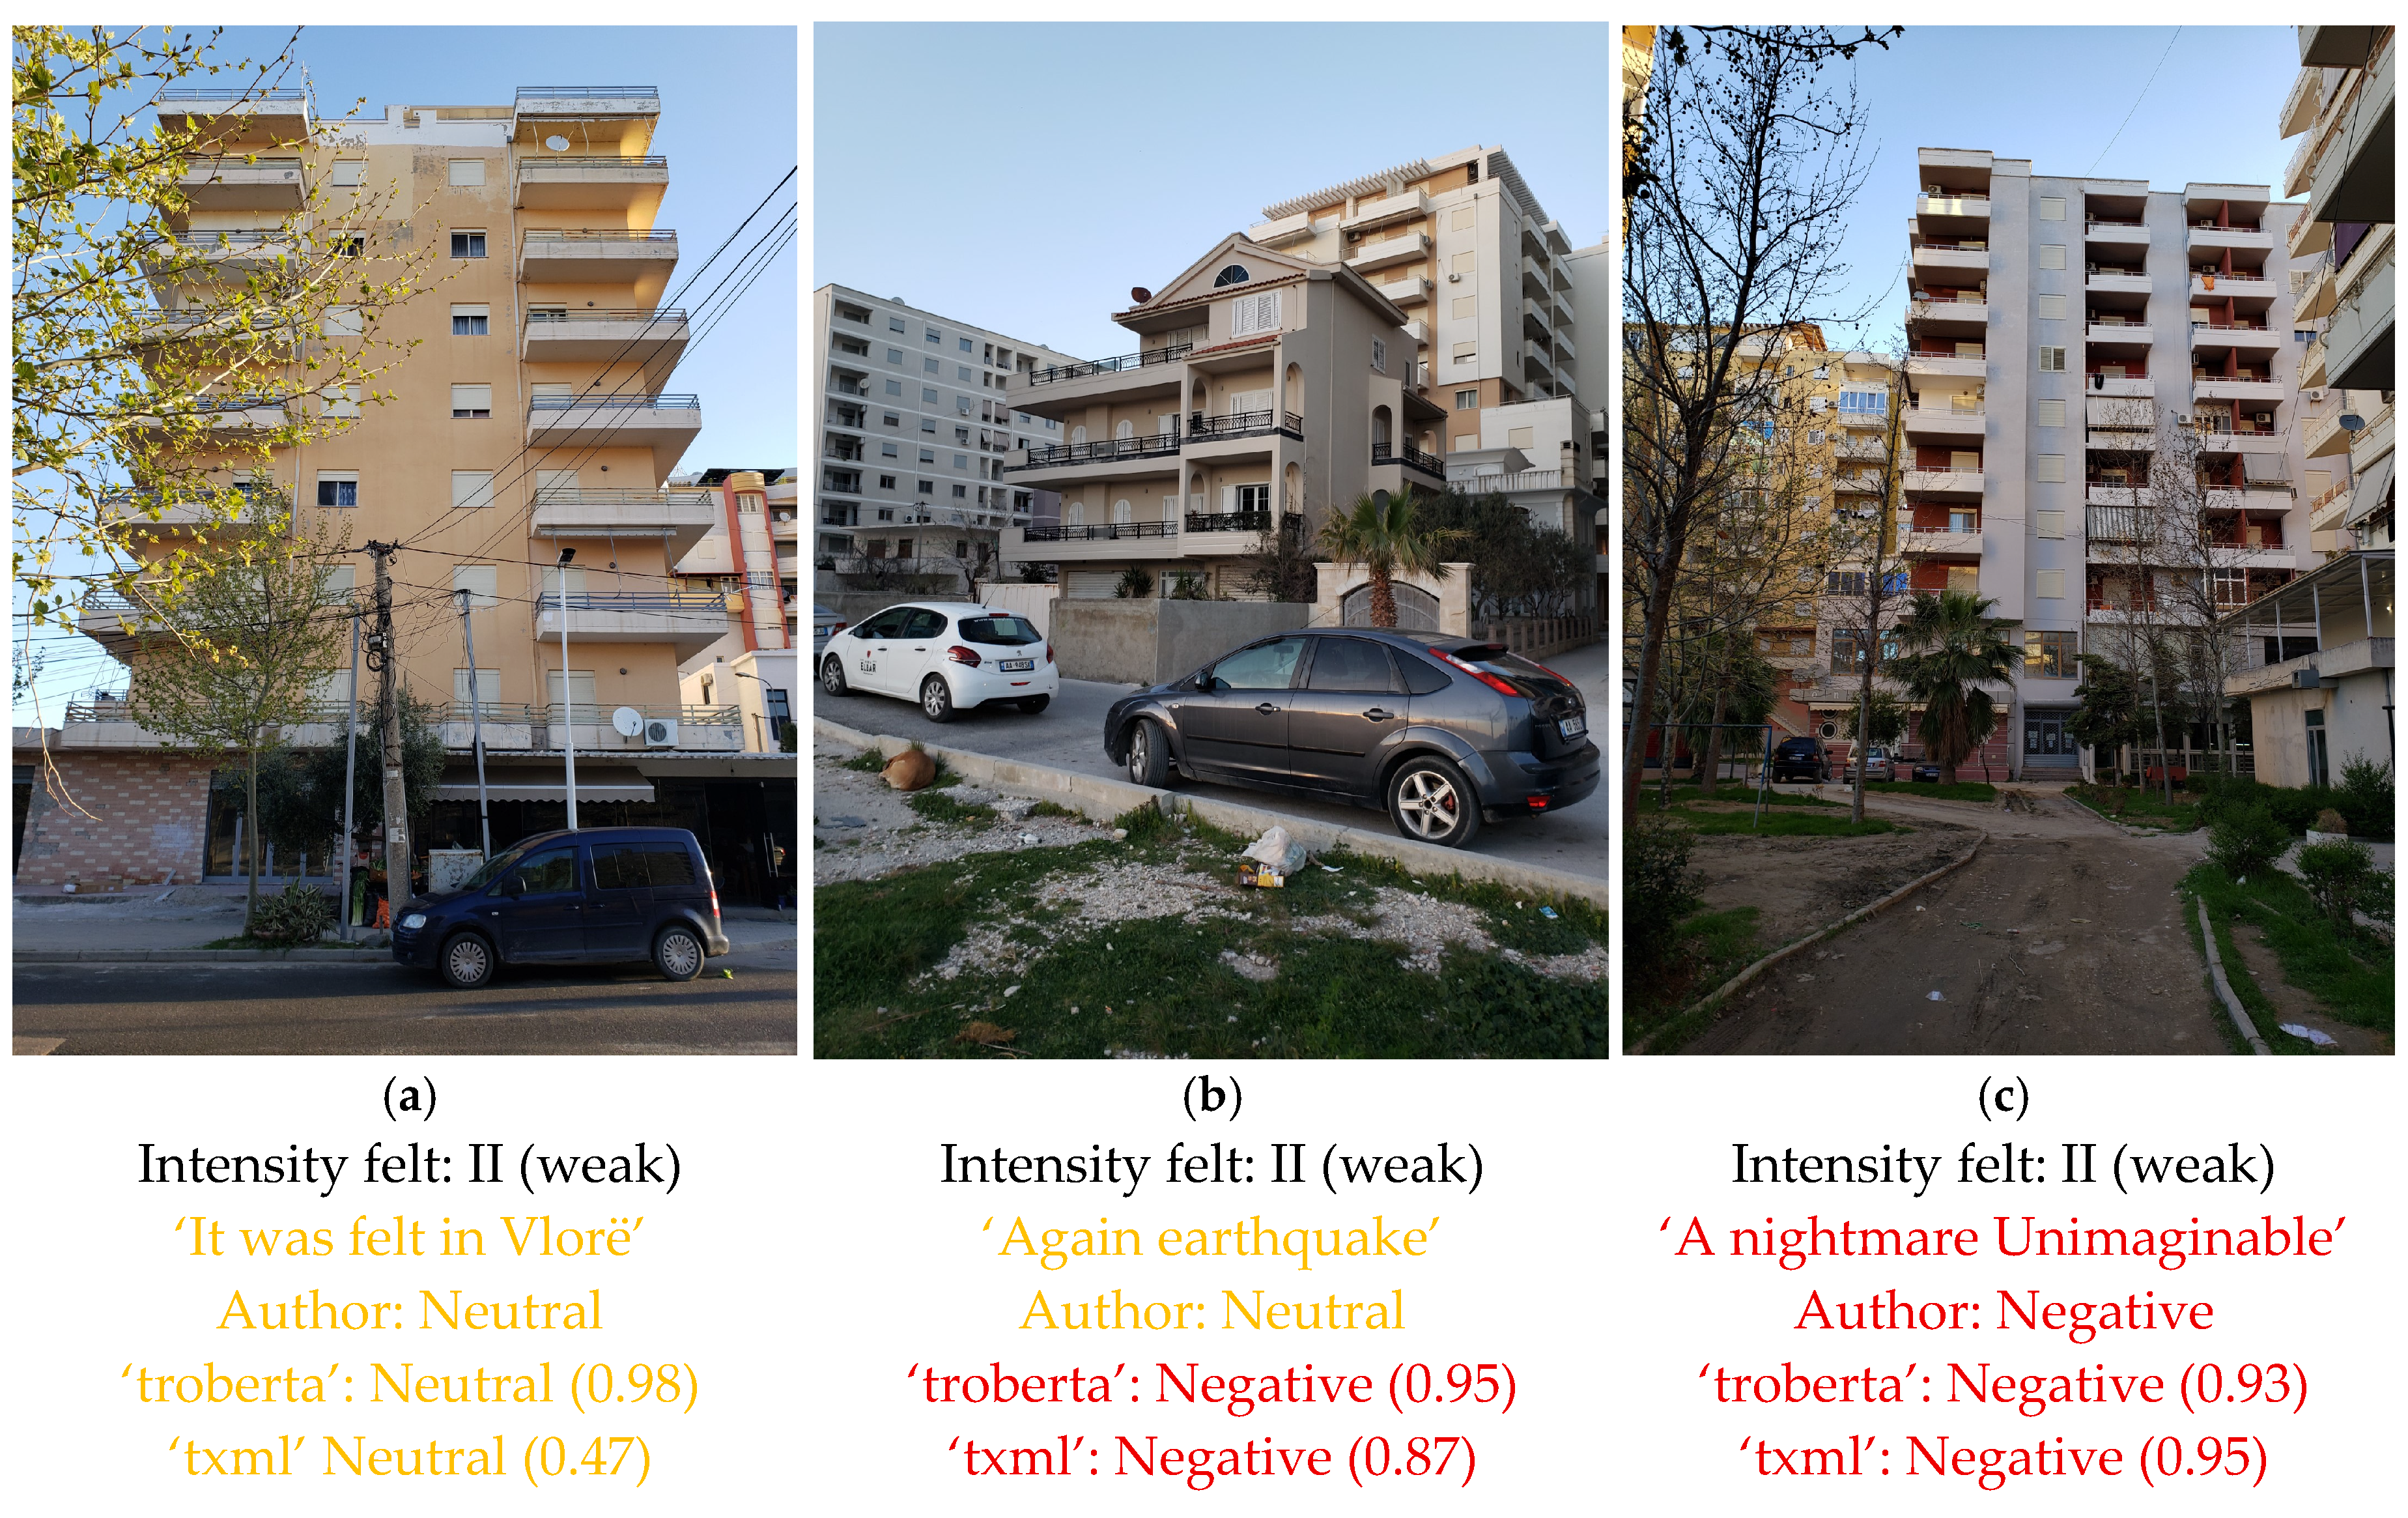
Within the framework of the ISDE-2023 symposium, a tour of the earthquake-affected areas and historical sites in Albania was organised, which allowed the first author to visit some of the places where some intensity reports were submitted in the city of Vlorë. The spatial distribution of the polarity of the intensity reports felt in Albania, Tirana, and Vlorë is mapped in Figure 8a–c, and the location of a sample of three buildings from where the intensity reports were sent is shown in Figure 9a–c.

4. Discussion

Tweets related to the 2019 Albanian earthquake addressed aftershocks, casualties and damage, the support received from the Israel Defence Forces, rescue operations, the arrival and distribution of humanitarian aid, requests for donations, solidarity messages and actions, complaints about construction quality, offers and announcements of support, requests to pray for the country, hate messages, and the celebration of the independence of Albania amidst the earthquake [2,52]. Instead, comments from LastQuake app users focused on the intensity of the ground movement, where the users were located at the time of the earthquake, indicating the city and/or on which floor of the house they were, and what elements in the house indicated the occurrence of an earthquake, what they were doing, what they did after the earthquake, and their distress [53].
The intensity felt reported by LastQuake app users is guided by pictures that illustrate the effects of each intensity level on the MMI Scale for the population and the built environment. However, the intensity reported by LastQuake app users will vary depending on their location relative to the earthquake epicentre, the construction characteristics of the building where they are at the time of the earthquake, the soil on which that building was constructed, their personal experience with earthquake activity and their willingness to report useful, reliable information. These conditions can explain why Papadopoulos et al. 2020 [43] estimated a maximum seismic intensity of VIII-IX also using the MMI and the European Macroseismic 1998 Scales, when only 3% (53) of the LastQuake app users reported those intensities: 2% (36) submitted intensity felt reports of VIII (Severe) and 1% (17) reported XI (Violent) on the MMI scale.
Comments accompanying intensity felt reports from LastQuake app users were also posted in English, French, German, Italian, Spanish and Turkish, which we plan to use in further research. Using ABSA, we identify some of the particularities in the text data provided by LastQuake app users with respect to the case of Albania, such as the large number of comments expressing distress, either praying or cursing, the low number of emergency response actions or preparedness expressed, and the large amount of unrelated comments written in improper language that has not been observed in other datasets also provided by LastQuake app users after the 2020 Zagreb [7,54] and Aegean earthquakes [40] and the 2023 Morocco earthquake.
Most of the comments submitted with the LastQuake app’s intensity reports, which are classified as negative polarity, relate to fear and intensity. Comments classified as positive polarity are related to slight or no intensity felt and emergency response actions, mainly requests for the protection of God, as well as evacuation and solidarity messages, to a lesser extent. Requests for divine protection were classified into positive polarity because research studies indicate that prayer is beneficial for addressing mental conditions such as anxiety [55], which an earthquake could trigger. Comments classified into neutral polarity allowed us to infer characteristics of seismic activity during the observation period. Although the topic of reports submitted by LastQuake app users is considered in the rules for classifying each comment into a specific polarity, this research focuses on sentiment analysis; further research will focus on topic analysis and its correlation with a specific polarity. This research analysed text data from LastQuake app users within 24 h of the earthquake. It is worth conducting further research to run a sentiment analysis of the text data collected afterwards to examine changes in polarity over time. This is to determine whether the daily predominance of positive polarity in the text data could indicate the start of the early recovery phase, including the end of aftershocks, the return of the community to normality, the removal of debris [49] and the repair of affected lifelines.
Between the two automatic transformer-based NLP classification models for sentiment analysis, ‘troberta’ has a higher ACC than ‘txml’. However, the 56% ACC of ‘txml’ (only marginally higher than the zero-rule baseline: 54%) is acceptable according to Maksimava (2020) [56], who considers that an automatic sentiment analysis model must be at least 50% accurate to be considered adequate. This is confirmed by the fact that the F1-scores reveal that the TXLM model learned meaningful patterns beyond simply guessing the majority ‘negative’ class. Specifically, we evaluated the Macro Average F1-score (excluding unrelated comments). The zero-rule (always negative) baseline achieves a Macro F1-score of only 23%. In contrast, the TXLM model achieves a Macro F1-score of 49%, and the ‘troberta’ model achieves an impressive Macro F1-score of 72%. An ACC of 63% with a corresponding misclassification rate of 37% was obtained by Contreras et al. (2022) [2] on the automatic sentiment analysis of Twitter/X data, also related to the 2019 Albania earthquake, but using MonkeyLearn, a cloud no-code machine learning platform, integrated into Medallia [57] since 2022. These results indicate the need to increase the ACC if we wish to rely on a transformation-based NLP classification model for sentiment analysis in decision-making and resource allocation during emergency response.
The word-frequency analysis of the text data written in Albanian, classified as positive polarity, provides an indication of the level of preparedness among LastQuake app users in Albania and their emergency response actions. In this case, the prayer to God was the most frequent after the expression of horror. The word-frequency analysis of the text data written in Albanian, classified as neutral polarity, identified the names of cities where the earthquake was felt, without considering the distance to the epicentre, geological conditions, or the geographic coordinates from which the intensity felt report was submitted.
The result of the interactive sentiment analysis validation of the intensity felt report posted in Albanian at the document level used as an example during the ISDE-2023 symposium session matched the polarity predicted by ‘troberta’ (Confidence: 0.48) and ‘txml’ (Confidence: 0.86): negative, while the first author classified this comment as positive. However, the classification of this intensity felt report at the sentence level indicates that some sentences are positive and others are of neutral polarity, which can explain the modest level of confidence in the polarity predicted by ‘troberta’. It is essential to clarify that the intensity felt report was presented to the public in English. It is also necessary to consider whether, for the complete validation of sentiment classification rules, comments must be presented to stakeholders in their original language, in this case Albanian. Another change to implement in the validation of the classification done by stakeholders at the sentence level is to either use another scale on Mentimeter that requires participants to sum to 1 for each comment or present each sentence separately to participants for classification into a specific polarity to avoid confusion. This is because the classification results from stakeholders for the comment presented at the sentence level were inconsistent. The visit to areas where intensity felt reports were submitted showed no ongoing repairs, allowing us to validate the reported intensity. The polarity detected in comments from LastQuake system users could be used as an indicator of the impact that an area experiences after an earthquake.

5. Conclusions

This research demonstrates the usefulness of accompanying comments from LastQuake app users for earthquake reconnaissance. Intensity felt reports are mainly around the earthquake’s epicentre, but there are also reports far from it, aligned with the seismic faults and with a negative polarity. It would be interesting for further research to compare, for a significant number of case studies, the intensities reported by LastQuake app users with the maximum seismic intensities estimated by experts to determine if there are differences and the reasons for these differences, and to reduce them to increase the reliability of the LastQuake app intensity felt reports for seismic research.
Understandably, the main polarity in the intensity felt reports submitted through the LastQuake system was negative, given that earthquakes are traumatic experiences. However, this conclusion is based on descriptive statistics; therefore, we are considering using additional statistical methods to ensure the robustness of our conclusions for further research. Using ABSA, it is possible to discover the particularities of each case study regarding the seismic movement, the impact of the earthquake and the attitudes and experiences of LastQuake app users with earthquakes, as well as their preparedness levels reflected in the emergency response measures they take and expressed in their comments.
The higher ACC of ‘troberta’ in text classification makes it a suitable transformer-based NLP classification model for an application supporting emergency response, despite the need for translation, which can be addressed by integrating an LLM with multilingual training for real-time [58] and accurate translation from any language to English. Our evaluation shows that the ‘troberta’ model performs significantly better (76% accuracy, 72% Macro F1). Instead, TXLM serves as a benchmark to test the multilingual capabilities of pre-trained models directly on native text (Albanian) in the specific context of earthquake-related citizen comments.
The ISDE-2023 symposium offered us a valuable opportunity to pilot a session with stakeholders to validate sentiment analysis classification rules and determine which scales on Mentimeter to use to capture the classification results. The opportunity to discuss the classification rules for each polarity will improve the results of manual classification and the ACC of the automatic one. Pictures of buildings from which intensity felt reports in Vlorë were submitted serve as evidence of the viability of using sentiment analysis of comments from LastQuake app users to indicate damage or the need to improve preparedness in specific areas of the cities to face future earthquakes, thereby helping control the anxiety they generate.
On the one hand, considering the number of expressions of fear regarding the earthquake and the lack of emergency response actions reported by LastQuake app users in Albania, we respectfully suggest that disaster managers of the cities from where the intensity felt reports were submitted revise community-level preparedness and evaluate the need for training and drills for evacuation, light search and rescue, first-aid, and psychological first aid. On the other hand, we call on LastQuake system users to use the app only to report the intensity felt and damage after an earthquake, and to avoid addressing other topics for which other apps are more appropriate.

Author Contributions

Conceptualization, D.C.; methodology, D.C. and D.A.; software, D.A.; validation, D.C. and E.V.; formal analysis, D.C. and E.V.; investigation, D.C. and E.V.; resources, M.L. and L.F.; data curation, E.V., J.H., M.L. and L.F.; writing—original draft preparation, D.C.; writing—review and editing, D.K. and S.W.; visualisation, D.C. and J.H.; supervision, R.B., S.W., J.C.-C. and E.D.; project administration, R.B., S.W., J.C.-C. and E.D.; funding acquisition, R.B., S.W., J.C.-C. and E.D. All authors have read and agreed to the published version of the manuscript.

Funding

This research was funded by the Engineering and Physical Sciences Research Council (EPSRC) [Grant No. EP/P025641/1] and Cardiff University [Starting Grant No. AJ2200IN01].

Data Availability Statement

The original contributions presented in this study are included in the article. Further inquiries can be directed to the corresponding author.

Acknowledgments

This is Cardiff EARTH CRediT Contribution 54.

Conflicts of Interest

Author Enes Veliu is the CEO of the company Reco Consulting Ltd. The remaining authors declare that the research was conducted in the absence of any commercial or financial relationships that could be construed as a potential conflict of interest.

Abbreviations

The following abbreviations are used in this manuscript:
ABSAAspect-based sentiment analysis
ACCAccuracy
AAEEAlbanian Association of Earthquake Engineering
CETCentral European Time
EMPROEmpowerment Project Foundation
EMSCEuropean Mediterranean Seismological Centre
IGEOInstitute of Geosciences
ISDEThe International Scientific Symposium on the theme “Earthquake of 26 November 2019 with a magnitude of 6.4 in Durrës, Albania: Regional Seismicity, Regional Geodynamics and Seismic Risk”
LLMLarge Language Model
MMIModified Mercalli Intensity Scale
NLPNatural Language Processing
TSERTaiwan Scientific Earthquake Reporting

References

  1. Guo, C.; He, W.; Huang, Y.; Huang, L. Temporal and Spatial Analysis of Public Emotion on Social Media During Earthquake Disaster—A Case Study of Jishishan Earthquake in 2023. Risk Anal. 2026, 46, e70202. [Google Scholar] [CrossRef]
  2. Contreras, D.; Wilkinson, S.; Alterman, E.; Hervás, J. Accuracy of a pre-trained sentiment analysis (SA) classification model on tweets related to emergency response and early recovery assessment: The case of 2019 Albanian earthquake. Nat. Hazards 2022, 113, 403–421. [Google Scholar] [CrossRef]
  3. Bossu, R.; Fallou, L.; Landès, M.; Roussel, F.; Julien-Laferrière, S.; Roch, J.; Steed, R. Rapid Public Information and Situational Awareness After the November 26, 2019, Albania Earthquake: Lessons Learned From the LastQuake System. Front. Earth Sci. 2020, 8, 235. [Google Scholar] [CrossRef]
  4. Simon, T.; Goldberg, A.; Adini, B. Socializing in emergencies—A review of the use of social media in emergency situations. Int. J. Inf. Manag. 2015, 35, 609–619. [Google Scholar] [CrossRef]
  5. Ragini, J.R.; Anand, P.M.R.; Bhaskar, V. Big data analytics for disaster response and recovery through sentiment analysis. Int. J. Inf. Manag. 2018, 42, 13–24. [Google Scholar] [CrossRef]
  6. Wilkinson, S.; Stone, H.; D’Ayala, D.; Verrucci, E.; James, P.; Rossetto, T.; So, E.; Ellul, C. How can new technologies help us with earthquake reconnaissance? In 11th National Conference in Earthquake Engineering; Earthquake Engineering Research Institute: Los Angeles, CA, USA, 2018. [Google Scholar]
  7. Contreras, D.; Wilkinson, S.; Fallou, L.; Landès, M.; Tomljenovich, I.; Bossu, R.; Balan, N.; James, P. Assessing Emergency Response and Early Recovery using Sentiment Analysis (SA). The case of Zagreb, Croatia. In Proceedings of the 1st Croatian Conference on Earthquake Engineering (1CroCEE 2021), Zagreb, Croatia, 9 March 2021; pp. 743–752. [Google Scholar]
  8. Contreras, D.; Wilkinson, S.; James, P. Earthquake Reconnaissance Data Sources, a Literature Review. Earth 2021, 2, 1006–1037. [Google Scholar] [CrossRef]
  9. Aktas, Y.D.; Ioannou, I.; Malcioglu, F.S.; Kontoe, M.; Parammal Vatteri, A.; Baiguera, M.; Black, J.; Kosker, A.; Dermanis, P.; Esabalioglou, M.; et al. Hybrid Reconnaissance Mission to the 30 October 2020 Aegean Sea Earthquake and Tsunami (Izmir, Turkey & Samos, Greece): Description of Data Collection Methods and Damage. Front. Built Environ. 2022, 8, 840192. [Google Scholar] [CrossRef]
  10. Neppalli, V.K.; Caragea, C.; Squicciarini, A.; Tapia, A.; Stehle, S. Sentiment analysis during Hurricane Sandy in emergency response. Int. J. Disaster Risk Reduct. 2017, 21, 213–222. [Google Scholar] [CrossRef]
  11. Bossu, R.; Roussel, F.; Fallou, L.; Landès, M.; Steed, R.; Mazet-Roux, G.; Dupont, A.; Frobert, L.; Petersen, L. LastQuake: From rapid information to global seismic risk reduction. Int. J. Disaster Risk Reduct. 2018, 28, 32–42. [Google Scholar] [CrossRef]
  12. Quitoriano, V.; Wald, D.J. USGS “Did You Feel It?”—Science and Lessons From 20 Years of Citizen Science-Based Macroseismology. Front. Earth Sci. 2020, 8, 120. [Google Scholar] [CrossRef]
  13. Finazzi, F. The Earthquake Network Project: A Platform for Earthquake Early Warning, Rapid Impact Assessment, and Search and Rescue. Front. Earth Sci. 2020, 8, 243. [Google Scholar] [CrossRef]
  14. Kong, Q.K.; Martin-Short, R.; Allen, R.M. Toward Global Earthquake Early Warning with the MyShake Smartphone Seismic Network, Part 2: Understanding MyShake Performance around the World. Seismol. Res. Lett. 2020, 91, 2218–2233. [Google Scholar] [CrossRef]
  15. Subedi, S.; Hetényi, G.; Denton, P.; Sauron, A. Seismology at School in Nepal: A Program for Educational and Citizen Seismology Through a Low-Cost Seismic Network. Front. Earth Sci. 2020, 8, 73. [Google Scholar] [CrossRef]
  16. Zhao, R.; Liu, X.T.; Xu, W.B. Integration of coseismic deformation into WebGIS for near real-time disaster evaluation and emergency response. Environ. Earth Sci. 2020, 79, 414. [Google Scholar] [CrossRef]
  17. Liang, W.T.; Lee, J.C.; Hsiao, N.C. Crowdsourcing Platform Toward Seismic Disaster Reduction: The Taiwan Scientific Earthquake Reporting (TSER) System. Front. Earth Sci. 2019, 7, 79. [Google Scholar] [CrossRef]
  18. Hossain, A.; Karimuzzaman, M.; Hossain, M.M.; Rahman, A. Text Mining and Sentiment Analysis of Newspaper Headlines. Information 2021, 12, 414. [Google Scholar] [CrossRef]
  19. Radianti, J.; Hiltz, S.R.; Labaka, L. An Overview of Public Concerns During the Recovery Period after a Major Earthquake: Nepal Twitter Analysis. In Proceedings of the 2016 49th Hawaii International Conference on System Sciences (HICSS), Koloa, HI, USA, 5–8 January 2016; IEEE: Piscataway, NJ, USA, 2016; pp. 136–145. [Google Scholar]
  20. Berger, J.; Packard, G. Using Natural Language Processing to Understand People and Culture. Am. Psychol. 2022, 77, 525. [Google Scholar] [CrossRef]
  21. Erickson, J. What Is Natural Language Processing (NLP)? Available online: https://www.oracle.com/asean/artificial-intelligence/natural-language-processing/ (accessed on 22 December 2025).
  22. Eligüzel, N.; Çetinkaya, C.; Dereli, T. Comparison of different machine learning techniques on location extraction by utilizing geo-tagged tweets: A case study. Adv. Eng. Inform. 2020, 46, 101151. [Google Scholar] [CrossRef]
  23. Medhat, W.; Hassan, A.; Korashy, H. Sentiment analysis algorithms and applications: A survey. Ain Shams Eng. J. 2014, 5, 1093–1113. [Google Scholar] [CrossRef]
  24. Pirnau, M. Sentiment analysis for the tweets that contain the word “earthquake”. In Proceedings of the 2018 10th International Conference on Electronics, Computers and Artificial Intelligence (ECAI), Iasi, Romania, 28–30 June 2018; IEEE: Piscataway, NJ, USA, 2018; pp. 1–6. [Google Scholar]
  25. Barbieri, F.; Camacho-Collados, J.; Anke, L.E.; Neves, L. TweetEval: Unified Benchmark and Comparative Evaluation for Tweet Classification. In Proceedings of the Findings of the Association for Computational Linguistics: EMNLP 2020, Online, 16–20 November 2020; Association for Computational Linguistics: Stroudsburg, PA, USA, 2020; pp. 1644–1650. [Google Scholar]
  26. Parimala, M.; Swarna Priya, R.M.; Praveen Kumar Reddy, M.; Lal Chowdhary, C.; Kumar Poluru, R.; Khan, S. Spatiotemporal-based sentiment analysis on tweets for risk assessment of event using deep learning approach. Softw. Pract. Exp. 2021, 51, 550–570. [Google Scholar] [CrossRef]
  27. Liu, B. Introduction. In Sentiment Analysis: Mining Opinions, Sentiments, and Emotions; Cambridge University Press: Cambridge, UK, 2015; pp. 1–15. [Google Scholar][Green Version]
  28. Su, J.; Chen, Q.; Wang, Y.; Zhang, L.; Pan, W.; Li, Z. Sentence-level sentiment analysis based on supervised gradual machine learning. Sci. Rep. 2023, 13, 14500. [Google Scholar] [CrossRef]
  29. Liu, B. Aspect Sentiment Classification. In Sentiment Analysis: Mining Opinions, Sentiments, and Emotions; Liu, B., Ed.; Cambridge University Press: Cambridge, UK, 2015; pp. 90–136. [Google Scholar]
  30. Hua, Y.C.; Denny, P.; Wicker, J.; Taskova, K. A systematic review of aspect-based sentiment analysis: Domains, methods, and trends. Artif. Intell. Rev. 2024, 57, 296. [Google Scholar] [CrossRef]
  31. Wolf, T.; Debut, L.; Sanh, V.; Chaumond, J.; Delangue, C.; Moi, A.; Cistac, P.; Rault, T.; Louf, R.; Funtowicz, M.; et al. Transformers: State-of-the-Art Natural Language Processing. In Proceedings of the 2020 Conference on Empirical Methods in Natural Language Processing: System Demonstrations, Online, 16–20 November 2020; Association for Computational Linguistics: Stroudsburg, PA, USA, 2020; pp. 38–45. [Google Scholar]
  32. Nguyen, D.Q.; Vu, T.; Nguyen, A.T. BERTweet: A pre-trained language model for English Tweets. In Proceedings of the 2020 Conference on Empirical Methods in Natural Language Processing: System Demonstrations, Online, 16–20 November 2020; Association for Computational Linguistics: Stroudsburg, PA, USA, 2020; pp. 9–14. [Google Scholar]
  33. Liu, Y.; Ott, M.; Goyal, N.; Du, J.; Joshi, M.; Chen, D.; Levy, O.; Lewis, M.; Zettlemoyer, L.; Stoyanov, V. RoBERTa: A Robustly Optimized BERT Pretraining Approach. arXiv 2019, arXiv:1907.11692. [Google Scholar]
  34. Devlin, J.; Chang, M.W.; Lee, K.; Toutanova, K. BERT: Pre-training of Deep Bidirectional Transformers for Language Understanding. In Proceedings of the 2019 Conference of the North American Chapter of the Association for Computational Linguistics: Human Language Technologies, Minneapolis, MN, USA, 2–7 June 2019; Association for Computational Linguistics: Stroudsburg, PA, USA, 2019; pp. 4171–4186. [Google Scholar]
  35. DePaolo, C.A.; Wilkinson, K. Get Your Head into the Clouds: Using Word Clouds for Analyzing Qualitative Assessment Data. TechTrends 2014, 58, 38–44. [Google Scholar] [CrossRef]
  36. SmugMug. Flickr. Available online: https://www.flickr.com (accessed on 15 March 2026).
  37. Vijayabhanu, R.; Shenbagam, R. Twitter Data Sentiment Analysis and Word Cloud. J. Emerg. Technol. Innov. Res. (JETIR) 2018, 5, 316–322. [Google Scholar]
  38. Bao, C.; Wang, Y. A Survey of Word Cloud Visualization. J. Comput. Aided Des. Comput. Graph. 2021, 33, 532–544. [Google Scholar] [CrossRef]
  39. McNaught, C.; Lam, P. Using Wordle as a Supplementary Research Tool. Qual. Rep. 2010, 15, 630–643. [Google Scholar] [CrossRef]
  40. Contreras, D.; Wilkinson, S.; Aktas, Y.D.; Fallou, L.; Bossu, R.; Landès, M. Intensity-Based Sentiment and Topic Analysis. The Case of the 2020 Aegean Earthquake. Front. Built Environ. 2022, 8, 839770. [Google Scholar] [CrossRef]
  41. Liu, H.; Han, Z. Earthquake resilience and public engagement: A social media perspective. Risk Anal. 2025, 45, 2667–2684. [Google Scholar] [CrossRef] [PubMed]
  42. Andonov, A.; Andreev, S.; Freddi, F.; Greco, F.; Gentile, R.; Novelli, V.; Veliu, E. The Mw6.4 Albania Earthquake on the 26th November 2019; EEFIT: London, UK, 2020. [Google Scholar]
  43. Papadopoulos, G.A.; Agalos, A.; Carydis, P.; Lekkas, E.; Mavroulis, S.; Triantafyllou, I. The 26 November 2019 Mw 6.4 Albania Destructive Earthquake. Seismol. Res. Lett. 2020, 91, 3129–3138. [Google Scholar] [CrossRef]
  44. Stein, R.; Sevilgen, V. Albania Earthquake Strikes Highest-Hazard Zone in the Balkans, Devastating Nearby Towns. Available online: https://temblor.net/earthquake-insights/albania-earthquake-strikes-highest-hazard-zone-in-the-balkans-devastating-nearby-towns-10153/ (accessed on 9 May 2026).
  45. Freddi, F.; Novelli, V.; Gentile, R.; Veliu, E.; Andreev, S.; Andonov, A.; Greco, F.; Zhuleku, E. Observations from the 26th November 2019 Albania earthquake: The earthquake engineering field investigation team (EEFIT) mission. Bull. Earthq. Eng. 2021, 19, 2013–2044. [Google Scholar] [CrossRef]
  46. IFRC. Albania: Final Valuation of the 2019 Albania Earthquake Emergency Appeal; Gert Venghaus. Humanitarian Consulting 2021; IFRC: Geneva, Switzerland, 2021; p. 66. [Google Scholar]
  47. USGS. Modified Mercalli Intensity Scale. Available online: https://www.usgs.gov/media/images/modified-mercalli-intensity-scale (accessed on 29 March 2026).
  48. Reliefweb. Albania: Earthquake—Nov 2019; OCHA: New York, NY, USA, 2019. [Google Scholar]
  49. Contreras, D. Fuzzy Boundaries Between Post-Disaster Phases: The Case of L’Aquila, Italy. Int. J. Disaster Risk Sci. 2016, 7, 277–292. [Google Scholar] [CrossRef]
  50. FreeWordCloudGenerator.com. Free Word Cloud Generator. Available online: https://www.freewordcloudgenerator.com/generatewordcloud (accessed on 29 March 2026).
  51. Contreras, D. Citizen’s Reports Sentiment and Topic Analysis: 26th November, 2019, Albania Earthquake. 2023. [Video]. YouTube: Tirana, Albania. Available online: https://www.youtube.com/watch?v=61Bpogosa_A&t=845s (accessed on 24 April 2026).
  52. Contreras, D.; Wilkinson, S.; Alterman, E. Supervised & Unsupervised Polarity Classification of Twitter Data Related to the Albania 2019 Earthquake; New Castle University: Newcastle upon Tyne, UK, 2021. [Google Scholar] [CrossRef]
  53. Veliu, E.; Contreras, D.; Fallou, L.; Bossu, R.; Landès, M. Sentiment and Topic Analysis of LastQuake App’ Users Comments—26th November 2019 Albania Earthquake; New Castle University: Newcastle upon Tyne, UK, 2023. [Google Scholar] [CrossRef]
  54. Contreras, D.; Wilkinson, S.; Fallou, L.; Landès, M.; Tomljenovich, I.; Bossu, R.; Balan, N.; James, P. Supervised Polarity and Topic Classification of LastQuake App User’s Pictures with Comments—Zagreb 2020 Earthquake; New Castle University: Newcastle upon Tyne, UK, 2021. [Google Scholar] [CrossRef]
  55. Anderson, J.W.; Nunnelley, P.A. Private prayer associations with depression, anxiety and other health conditions: An analytical review of clinical studies. Postgrad. Med. 2016, 128, 635–641. [Google Scholar] [CrossRef]
  56. Maksimava, M. Sentiment Analysis: What Is It and How Does It Work? Awario 2020, 2021. Available online: https://awario.com/blog/sentiment-analysis/ (accessed on 24 April 2026).
  57. Medallia. Available online: https://www.medallia.com/es/ (accessed on 26 December 2025).
  58. Zhou, X.; Zhou, J.; Wang, C.; Xie, Q.; Ding, K.; Mao, C.; Liu, Y.; Cao, Z.; Chu, H.; Chen, X.; et al. PH-LLM: Public Health Large Language Models for Infoveillance. medRxiv 2025. [Google Scholar] [CrossRef]
Figure 1. Epicentre and intensity reports after the Albanian earthquakes in 2019 between the 25 November 2019 and the 11 January 2020. Data Source: EMSC. Source: [2]. Figure 1. Page 405.
Geohazards 07 00062 g001
Figure 2. Damage to buildings caused by the 2019 Albania earthquake. (a) Housing unit destroyed; (b) housing requiring a complete rebuild and (c) housing unit slightly damaged. Source: EMSC.
Geohazards 07 00062 g002
Figure 3. Methodology. Adapted from [40]. Figure 3. Page 5.
Geohazards 07 00062 g003
Figure 4. Sentiment analysis results at the report level (manual classification) posted in Albanian.
Geohazards 07 00062 g004
Figure 5. Confusion matrices: (a) majority, (b) troberta and (c) txlm.
Geohazards 07 00062 g005
Figure 6. (a) Word frequency analysis for expressions written in Albanian with negative polarity. (b) Word frequency analysis for expressions written in Albanian with positive polarity. (c) Word frequency analysis for expressions written in Albanian with neutral polarity.
Geohazards 07 00062 g006
Figure 7. (a) LastQuake app user comment related to the 2019 Albania earthquake classified at document level (comment) by participants at the ISDE-2023 conference on the 29 March 2023. (b) LastQuake app user comment related to the 2019 Albania earthquake classified at the sentence level by participants at the ISDE-2023 conference on the 29 March 2023.
Geohazards 07 00062 g007
Figure 8. Spatial distribution of the polarity of the intensity reports felt by LastQuake app users in (a) Albania, (b) Tirana and (c) Vlorë.
Geohazards 07 00062 g008
Figure 9. Sample of three buildings in Vlorë from where LastQuake app users sent the intensity reports. Photos: Diana Contreras. The 31 March 2023.
Geohazards 07 00062 g009
Table 1. Intensity felt, as reported by LastQuake app users, during and after the 26 November 2019 earthquake in Albania.
Shaking [47]IntensityCommentsPercentage
MMINr%
Not FeltI27016
WeakII30818
WeakIII42425
LightIV24715
ModerateV16610
StrongVI1328
Very strongVII704
SevereVIII362
ViolentIX171
ExtremeX80
Table 2. Classification rules for sentiment analysis.
PolarityRules
Positive
Emergency response actions.
Expressions of solidarity.
Preparedness measures.
Reports of light intensity felt.
Reports of light shakes felt.
Reports of short seismic movements.
Negative
Reports of aftershocks
Reports of damages in buildings and/or lifelines.
Reports of fear and anxiety.
Reports of injuries and/or casualties.
Reports of long seismic movements.
Reports of strong intensity felt.
Reports of strong shakes.
Neutral
Seismic information.
Table 3. Number of intensities felt reports by LastQuake app users in descending order, over 24 h after the 26 November 2019 earthquake in Albania.
Shake [47]IntensityCommentsPercentage
MMINr%
WeakIII42425
WeakII30818
Not feltI27016
LightIV24715
ModerateV16610
StrongVI1328
Very strongVII704
SevereVIII362
ViolentIX171
ExtremeX80
Table 4. Sentiment analysis results at the report level (manual classification) posted in Albanian.
PolarityReportsPercentage
CategoryNumber%
Negative87852
Positive35821
Neutral35521
Unrelated875
Total1678100
Table 5. ACC results of the automatic classification of reports posted in Albanian.
Transformer-Based NLP Classification ModelsAverage ConfidenceACC
troberta0.8871%
txlm0.7856%
Disclaimer/Publisher’s Note: The statements, opinions and data contained in all publications are solely those of the individual author(s) and contributor(s) and not of MDPI and/or the editor(s). MDPI and/or the editor(s) disclaim responsibility for any injury to people or property resulting from any ideas, methods, instructions or products referred to in the content.