Article

A Context-Aware Flood Warning Framework Integrating Ensemble Learning and LLMs

by
Adnan Ahmed Abi Sen
1,*,
Fares Hamad Aljohani
2,
Nour Mahmoud Bahbouh
3,
Adel Ben Mnaouer
1,
Omar Tayan
1 and
Ahmad. B. Alkhodre
4
1
Hussein ElSayyed Research and Innovation Center, Deanship of Scientific Research and Graduate Studies, University of Prince Mugrin, Madinah 42241, Saudi Arabia
2
Department of Information Systems, Northern Border University, Rafha 91911, Saudi Arabia
3
Department of Information and Communication Sciences, Granada University, 18071 Granada, Spain
4
Department of Information Technology, Islamic University, Madinah 42351, Saudi Arabia
*
Author to whom correspondence should be addressed.
GeoHazards 2026, 7(1), 35; https://doi.org/10.3390/geohazards7010035
Submission received: 24 January 2026 / Revised: 27 February 2026 / Accepted: 1 March 2026 / Published: 11 March 2026

Abstract

Smart cities require effective disaster management (like flooding, solar storms, sandstorms, or hurricanes), as it directly impacts people’s lives. The key challenges of disaster management are timely detection and effective notification during the crisis. This research presents a smart multi-layer framework for notification classification and management before and during flooding disasters. The framework includes an early detection module as the main phase in the alerting process. This step depends on an Ensemble Learning (EL) model based on a triad of the three best selected models (Deep Learning (DL), Random Forest (RF), and K-nearest Neighbor (KNN)) to analyze data collected continuously from the Internet of Things (IoT) layer. In the boosting phase, the framework utilizes Large Language Models (LLMs) with DL to analyze social textual crowdsourcing data. The results will enable the framework to identify the most affected areas during a flood. The framework adds a fog computing layer alongside a cloud layer to enable instantaneous processing of user responses and generate specialized alerts based on contextual factors such as location, time, risk level, alert type, and user characteristics. Through testing and implementation, the proposed algorithms demonstrated an accuracy rate of over 98% in detecting threats using a dataset of real, collected weather and flooding data. Additionally, the framework proposes a centralized control panel and a design of a smartphone application that offers essential services and facilitates communication among managed civil defense teams, citizens, and volunteers.

1. Introduction

Disaster management is vital for smart cities because it affects people’s lives and connects to systems like health, transportation, security, and safety. Natural disasters include events like landslides, earthquakes, wildfires, tornadoes, floods, tsunamis, and pandemics. Early warnings are key to reducing the damage caused by disasters. Managing these events is challenging and urgent, as it relates to weather, climate change, and water resources on Earth [1].
Floods are highly destructive and cause major damage. Tomar et al. [2] reported that between 2000 and 2014, floods made up 39.26% of global natural disasters, causing USD 397.3 billion in losses. EM-DAT data shows that Asia is the hardest-hit region by floods and storms. Much of this damage is linked to human actions like deforestation, urbanization, and poor planning. Climate change has also worsened flooding, leading to heavier rainfall [3]. Floods cause major losses and are expensive to manage [4]. Their environmental impact is deep and complex. They immediately result in property damage and loss of life. Floods can also lead to livestock deaths, crop destruction, and a rise in water-borne diseases [5].
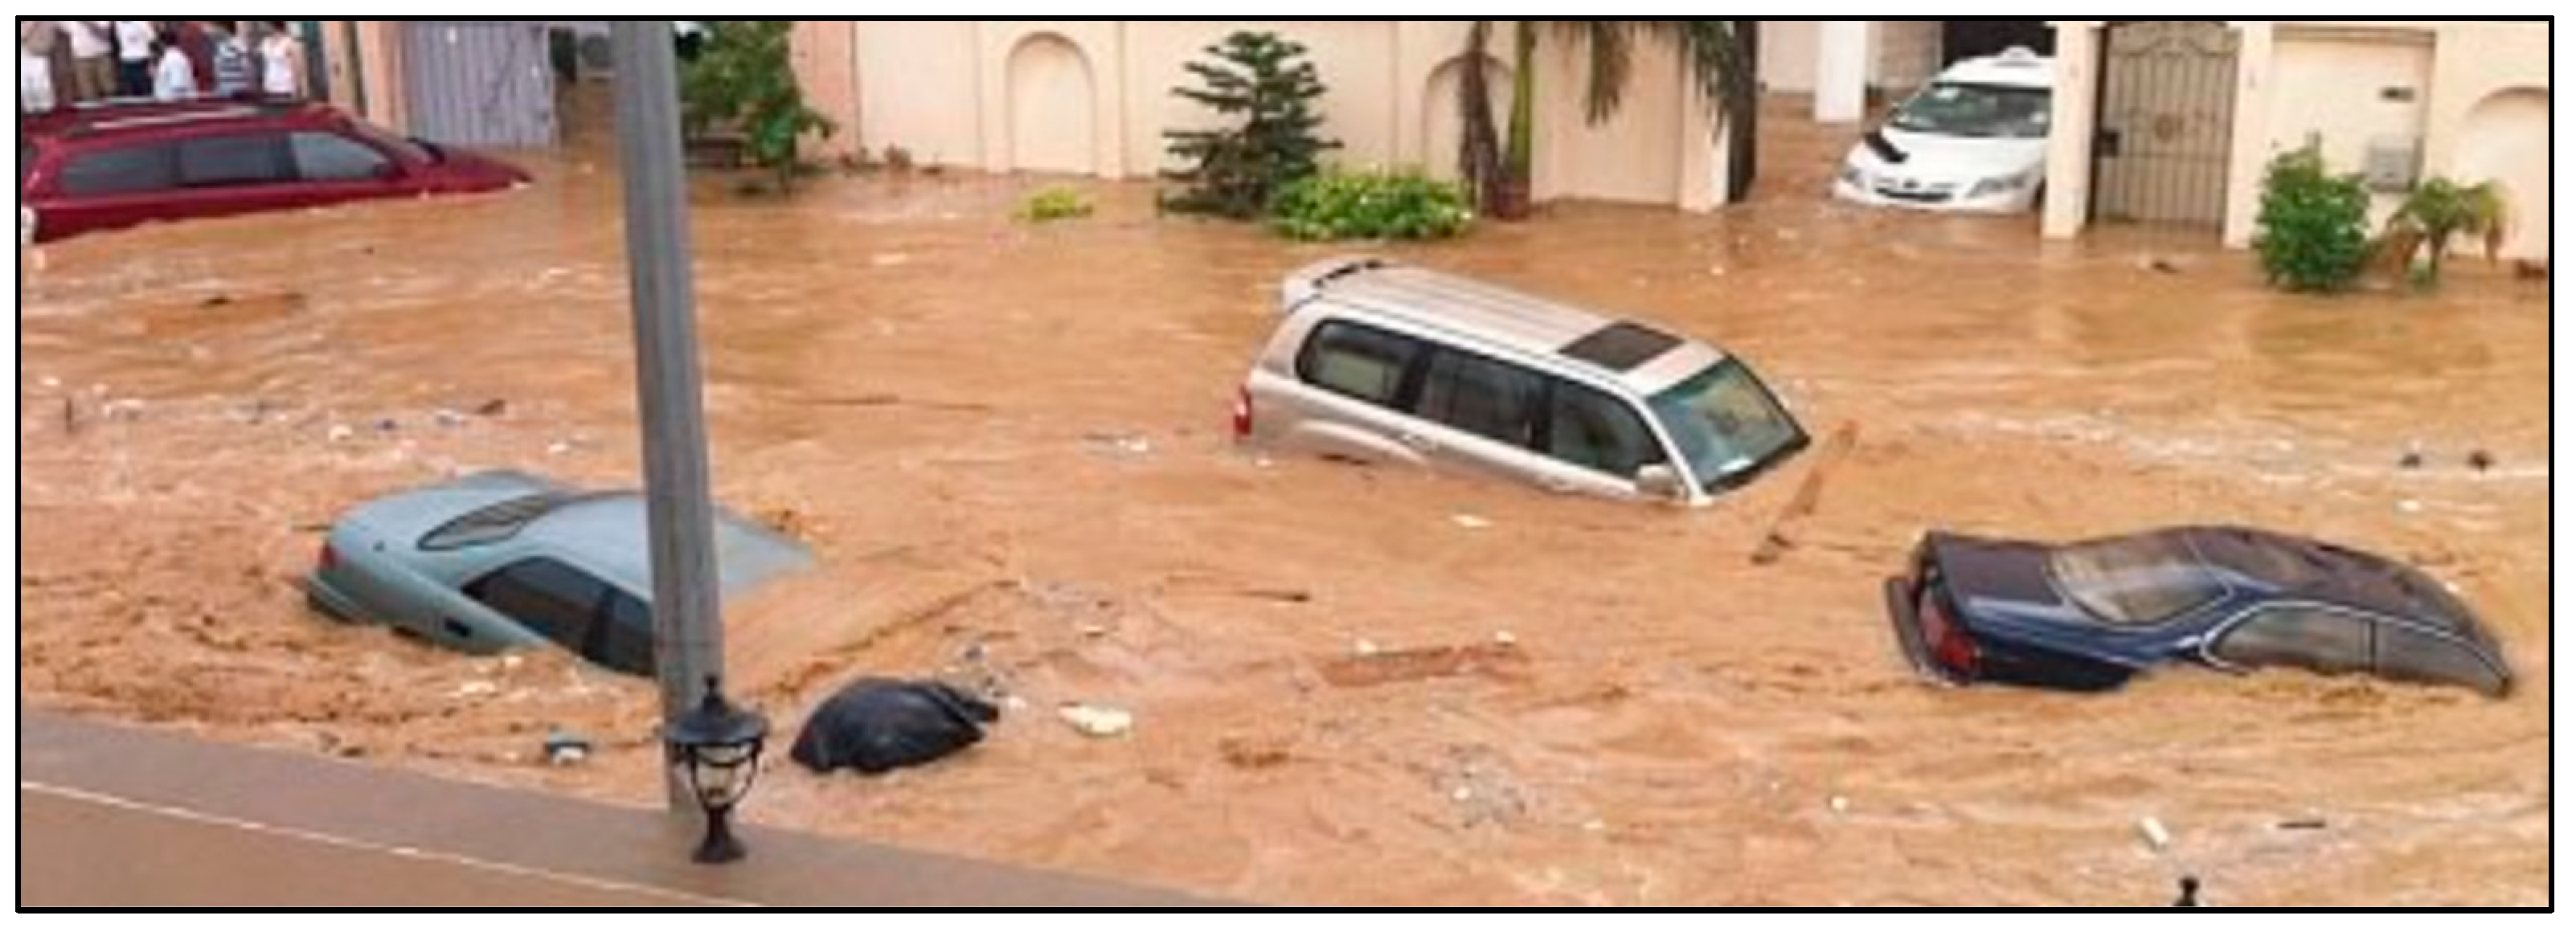
Floods also slow down economic growth because of the high costs of relief and recovery efforts. This can harm infrastructure projects and other development plans, possibly weakening the regional economy (see Figure 1) [6]. It is crucial to take action to reduce these negative effects. Accurately identifying flood hazard zones requires considering factors like elevation, rainfall patterns, land use, flow accumulation, and slope. These factors interact and create challenges. Technologies like the Internet of Things (IoT) and machine learning (ML) help predict floods but have limitations.
For example, different areas within the same city may require different responses [7,8]. The most vulnerable flood zones are determined by many key factors. In addition to elevation, rainfall intensity, land use, flow accumulation, and slope, an important factor is the watershed lag time, which is a critical hydrological factor influencing flood response speed. Lag time reflects the temporal delay between peak rainfall and peak runoff discharge. The level of risk varies across city areas, as these factors affect flood hazards differently [8,9].
In flood risk management, most research methods have used traditional physical techniques and machine learning for prediction. However, these methods can be imprecise, as flood risk varies by region and even within neighborhoods, based on local geography. As a result, different areas within the same city may have different levels of flood vulnerability. For example, low-lying and densely populated areas are at higher risk of flooding and losses. To improve prediction accuracy, algorithms need to use multiple data sources [9].
Accurate and reliable data are essential for effective flood management models. Real-time data is mainly provided through the Internet of Things (IoT), which uses wireless sensor networks (WSNs) to monitor environmental conditions like temperature, pressure, water levels, and more across various locations. IoT also employs radio frequency identification (RFID) technology to track and connect objects based on their locations [10,11]. Notably, related studies can also be found in the literature that present other factors related to climate, disasters, and pollution monitoring in a smart city context that employ ML, cloud computing, and IoT [12].
Crowdsourced data from mobile devices and social media can improve accuracy and situational awareness when combined with the IoT. For dynamic events like floods, human input ensures the reliability of crowdsourced data. These models rely on large amounts of rapidly generated data to tackle flood-related challenges. In recent years, crowdsourcing has become a key data source, as smartphones and social media provide fast, valuable, real-time information [13,14]. Crowd-sourced data can often be more useful than IoT data because it relies on human senses and judgment to filter and interpret information before it is sent. For example, analyzing camera data automatically during a flood can be harder and less accurate than having people describe what they see, followed by machine analysis [14].
Textual data from crowdsourcing, like social media, enables highly accurate and context-aware text analysis. Large Language Models (LLMs) demonstrate remarkable capabilities in understanding the semantic meaning, sentiment, and implicit intent of unstructured textual data. In disaster management, such as floods, LLMs can be very effective in analyzing emergency calls on social media, classifying them into meaningful classes, and extracting the most critical situations and areas to take the right secure action. LLM-based systems can interpret local expressions and event-specific terminology and provide a real-time situational awareness for decision-making [15].
LLMs have become an entity that can accept and reject, say and decide, and invent and recommend, not only an algorithmic system. They can understand polarization through human interactions and extract sentiment and topics from social networks. However, there are still doubts and threats about the responsibility of these models when they decide without supervision, in addition to the threat of hallucinations and the bias in their information [16,17,18].
Combining IoT-based data collection with crowdsourced data is especially helpful in situations like disaster management, traffic monitoring, or events, where people can share useful information through their observations. This paper proposes an intelligent solution for early flood detection that focuses on reliability and accuracy by integrating IoT-based sensing and crowdsourcing modules. The contributions of this paper include:
  • A flood detection framework that combines IoT-based and crowdsourced data to provide efficient responses.
  • A fog-based architecture to reduce the response delay and provide context-aware notifications to stakeholders.
  • A novel threat level classification Ensemble Learning (EL)-based algorithm that ensures higher reliability of the decision.
  • An LLM base with a DL model to analyze textual data during a disaster.
  • A mockup mobile application for volunteers and a dashboard for civil defense officers.
This paper relies on two types of data to provide comprehensive coverage compared to other solutions; the types are:
  • Data from IoT devices (WSNs): These are used continuously during the first classification phase (Algorithm 1). The system here is based on ten years of meteorological data obtained from the weather authority in the city of Jeddah in Saudi Arabia.
  • Crowdsourced data: This type of data is expected to come from volunteer users who have the application, in the form of distress calls or textual information. These data are used within Method 2, but only when the risk index from Algorithm 1 exceeds a certain threshold. (More details were presented in Section 4).
Algorithm 1: EL algorithm for training and testing the dataset
Require: Data in the cloud
Ensure: Data processing and splitting the dataset into training and testing
1: for all data in the cloud do
2:   Process outlier values by replacing them with the median
3:   for each record containing empty values, do
4:     Delete records
5:     Apply normalization to numerical data
6:     Use the Synthetic Minority Over-Sampling Technique (SMOTE) to address the imbalance
7:     Split the dataset into training and testing
8:     Train the dataset on the training part
8:       If performance metrics are the best for a model candidate, then
9:          Select the winning model hyperparameters
10:       else
11:           Select other values for hyperparameters
12:         end if
13:      end for
14:    end for
16: for testing phase in the fog node (for a specific region), do
17:    Read data from the sensor layer
18:    Process data and detect outliers by matching values across multiple sensors
19:    Configure data and apply normalization.
20:       Apply the three selected machine learning models (as the chosen EL set).
21:       Choose the majority decision (minimum 2 models from 3 classified data as 1 or 0).
23:     if the choice is 1 (threat present), then
24:              Increase the threat index by 1
25:           else
26:              Keep the same value
27:             if the threat level exceeds a certain threshold, then
28:                    Send immediate warning alerts according to the region
29:                else
30:                 Keep monitoring
31:           end if
32:        end if
33:  end for
The rest of the paper is structured as follows: Section 2 reviews related work in disaster management. Section 3 outlines the proposed approach, framework, tools, and algorithms. Section 4 presents the results and insights, while Section 5 concludes and summarizes key findings and contributions.

2. Related Work

Within this section, an extensive exploration of the literature about flood risk management models is undertaken. Specifically, this encompasses a detailed examination of two primary models: The Smart Model and the Physical Model. The discussion delves into the intricacies and applications of these models within the context of flood risk management.
Furthermore, an analysis of tweets as a novel approach to understanding and evaluating flooding risk is presented, elucidating the significance and potential insights gleaned from social media data in this domain.

2.1. Models Used in Flood Risk Management

Floods pose immense threats to lives and property, impacting the environment, social fabric, and economies globally. Recent years have underscored an urgent demand for precise flood modeling to aid decision-makers and communities in responding to, managing, and alleviating flood impacts. Among the most formidable obstacles encountered by experts is the intricate task of forecasting floods accurately. The precision of predictions plays a pivotal role in devising effective strategies to mitigate the severity of floods and minimize their potential devastation to lives and properties [19].
The most widely used models in flood risk management are physical modeling and intelligent data-based modeling. Physical modeling is based on hydraulic experiments, through which predictive maps are generated showing areas that may be flooded. On the other hand, machine learning approaches rely on data and analysis [20]. Table 1 summarizes methods for dealing with flooding.
Intelligent data-driven modeling and the Physical Model have risen to prominence as leading methodologies within the realm of flood risk management. These approaches reflect various perspectives for solving the problems brought on by flood disasters. The Smart Model improves early warning systems by providing rapid and precise flood predictions using real-time data from the IoT and advanced analytics as text analysis. The Physical Model, on the other hand, depends on accurate simulations of flood scenarios, providing insightful information about hydraulic processes and assisting in the comprehension of flood behavior [30].

2.2. Text Analysis in Flooding Risk

Social media data can help crisis managers and responders meet their data needs by providing valuable information on the social aspects, impacts, and flexibility of cities in the face of a natural disaster [31]. Using Twitter data for flood risk analysis is a promising new field of study. This is because Twitter data can provide real-time information about flood events, which can be used to improve early warning systems and assist emergency responders in flood event management [32].
However, some issues must be addressed, such as the need to develop more precise methods for extracting and analyzing Twitter data. Text analysis entails using natural language processing techniques to extract information from Twitter posts, such as the flood’s location, severity, and impact on people and infrastructure [33].
According to the findings of some studies [34,35] in the field of tweet analytics in flood risk management, Twitter data can be used to predict the location of floods with a high degree of accuracy. Twitter data can also be used to identify flood-prone areas before they occur [36]. The text of the tweet contains helpful and trustworthy information about damaged main roads and streets. This information could help with emergency response coordination and resource allocation [37].
Crowdsourcing is a model that uses people’s intelligence via online human input to achieve specific organizational goals [38]. Crowdsourcing, according to a study conducted by Tripathy et al., provides a viable source of reliable information on floods and waterlogging in Mumbai. Crowdsourced data can detect hotspots and has the potential to generate real-time monitoring. This information can then be used to create a flood forecasting framework. When fine-resolution observed datasets are unavailable, crowdsourced information can be extremely useful. These datasets can be used to create a robust, modern, and decision-making system that will allow for more precise and effective decisions in the event of a disaster [39].
Although there is interest from researchers in studies on social media platform-based crowdsourcing in disaster management, smartphone sensor-based crowdsensing in disaster incidents appears to still be in need of more research. Table 2 summarizes the algorithms and methods for traditional text analysis based on ML and text mining (TM), as well as a few new methods that depend on LLMs. The main steps and functions of traditional methods include tokenizing, stemming, lemmatizing, removing stop words, weighting, and training models, while new models rely on LLMs to understand semantics and cluster topics or tag data like tweets automatically. Semantics can provide more information about the type of threat, severity, effects, location, and sentiment.
Although LLMs provide more information and summarize the time required for text processing, depending solely on LLMs (which are unsupervised models) can lead to hallucinations and bias, which are very dangerous in critical systems like disaster management [45,46]. Although these methods (traditional and new ones) make important contributions to text classification and information retrieval in many applications, they still face some drawbacks (depend on many manually designed features with sequence processing steps, do not utilize cumulative training and pre-trained models, such as transfer learning models or adaptive models like DL, and suffer from hallucinations and bias in LLM cases).
Based on the previous discussion, this research merged LLMs and DL to get the benefits of LLMs and avoid their shortcomings. LLMs save training time and data and increase semantic meaning understanding, while DL increases accuracy and adaptability and avoids the hallucinations and biases of LLMs. So, the semi-supervised proposed model will achieve a key transformation in the domain of natural language processing with superiority in analyzing and understanding the content’s meaning within an accurate semantic context.
Based on that, the proposed framework uses LLMs and DL techniques, with anonymous agents deployed on fog nodes. This wide dispatching enabled the framework to reduce response time compared to the centralized approach while providing greater local context awareness, thereby enhancing the efficiency and reliability of responses to emergency calls.

3. Proposed Methodology

To create comprehensive disaster management, the solution must deal with a disaster before it occurs, during its occurrence, and thereafter. Previous solutions dealt with one side only, like providing a prediction model that only addresses the stage before the disaster. Early detection is not effective in cases where no efficient warning and follow-up are in place. Moreover, the addition of a set of useful rescue services during a crisis would be highly desirable.
This research presents a comprehensive framework to manage disasters, particularly focusing on floods. The proposed framework proposes an enhancement in the accuracy of early prediction models using continuous, real-time monitoring and classification by means of an EL model involving a DL model, a KNN model, and an RF model.
Moreover, the framework collects data at the sensory-level layer from two different resources: an IoT platform for sending and reporting measurement data, in addition to a crowdsourcing mechanism that includes extracting data from a social network (i.e., the X platform) and from a dedicated smart application designed for public use. This double use of resources provides a deeper understanding of disaster impacts based on analyzing users’ involvement in reporting observations and comments from the event scene.
In addition, the framework uses a fog layer of gateway devices with computing capability [47] to provide an accurate evaluation of the risk level in each area (covered by a fog node), where each area has a different topological and geographical location. The fog nodes enable the provision of context-based, smarter, and more effective notifications.
To achieve the previous goals, the research proposes two algorithms: the first being a classification algorithm deployed before any disaster occurrence based on IoT-sensed data, while the second algorithm is a TM algorithm for textual data during a disaster. Moreover, the framework provides public users with a smart application with several hot services, in addition to a dashboard that provides real-time statistics and decision-aiding tools.
Based on the data coming from the sensing layer (IoT and crowdsourcing), the fog node applies a first-hand algorithm to assess and determine the perceived current threat level. This process is repeated periodically. When the threat level crosses a threshold, required notifications are sent to the proper stakeholders. Thereafter, the text mining-based method (Method 2) is used to analyze users’ tweets and reported observations on the flood level and conditions to show on the control panel of the civil defense team dashboard.
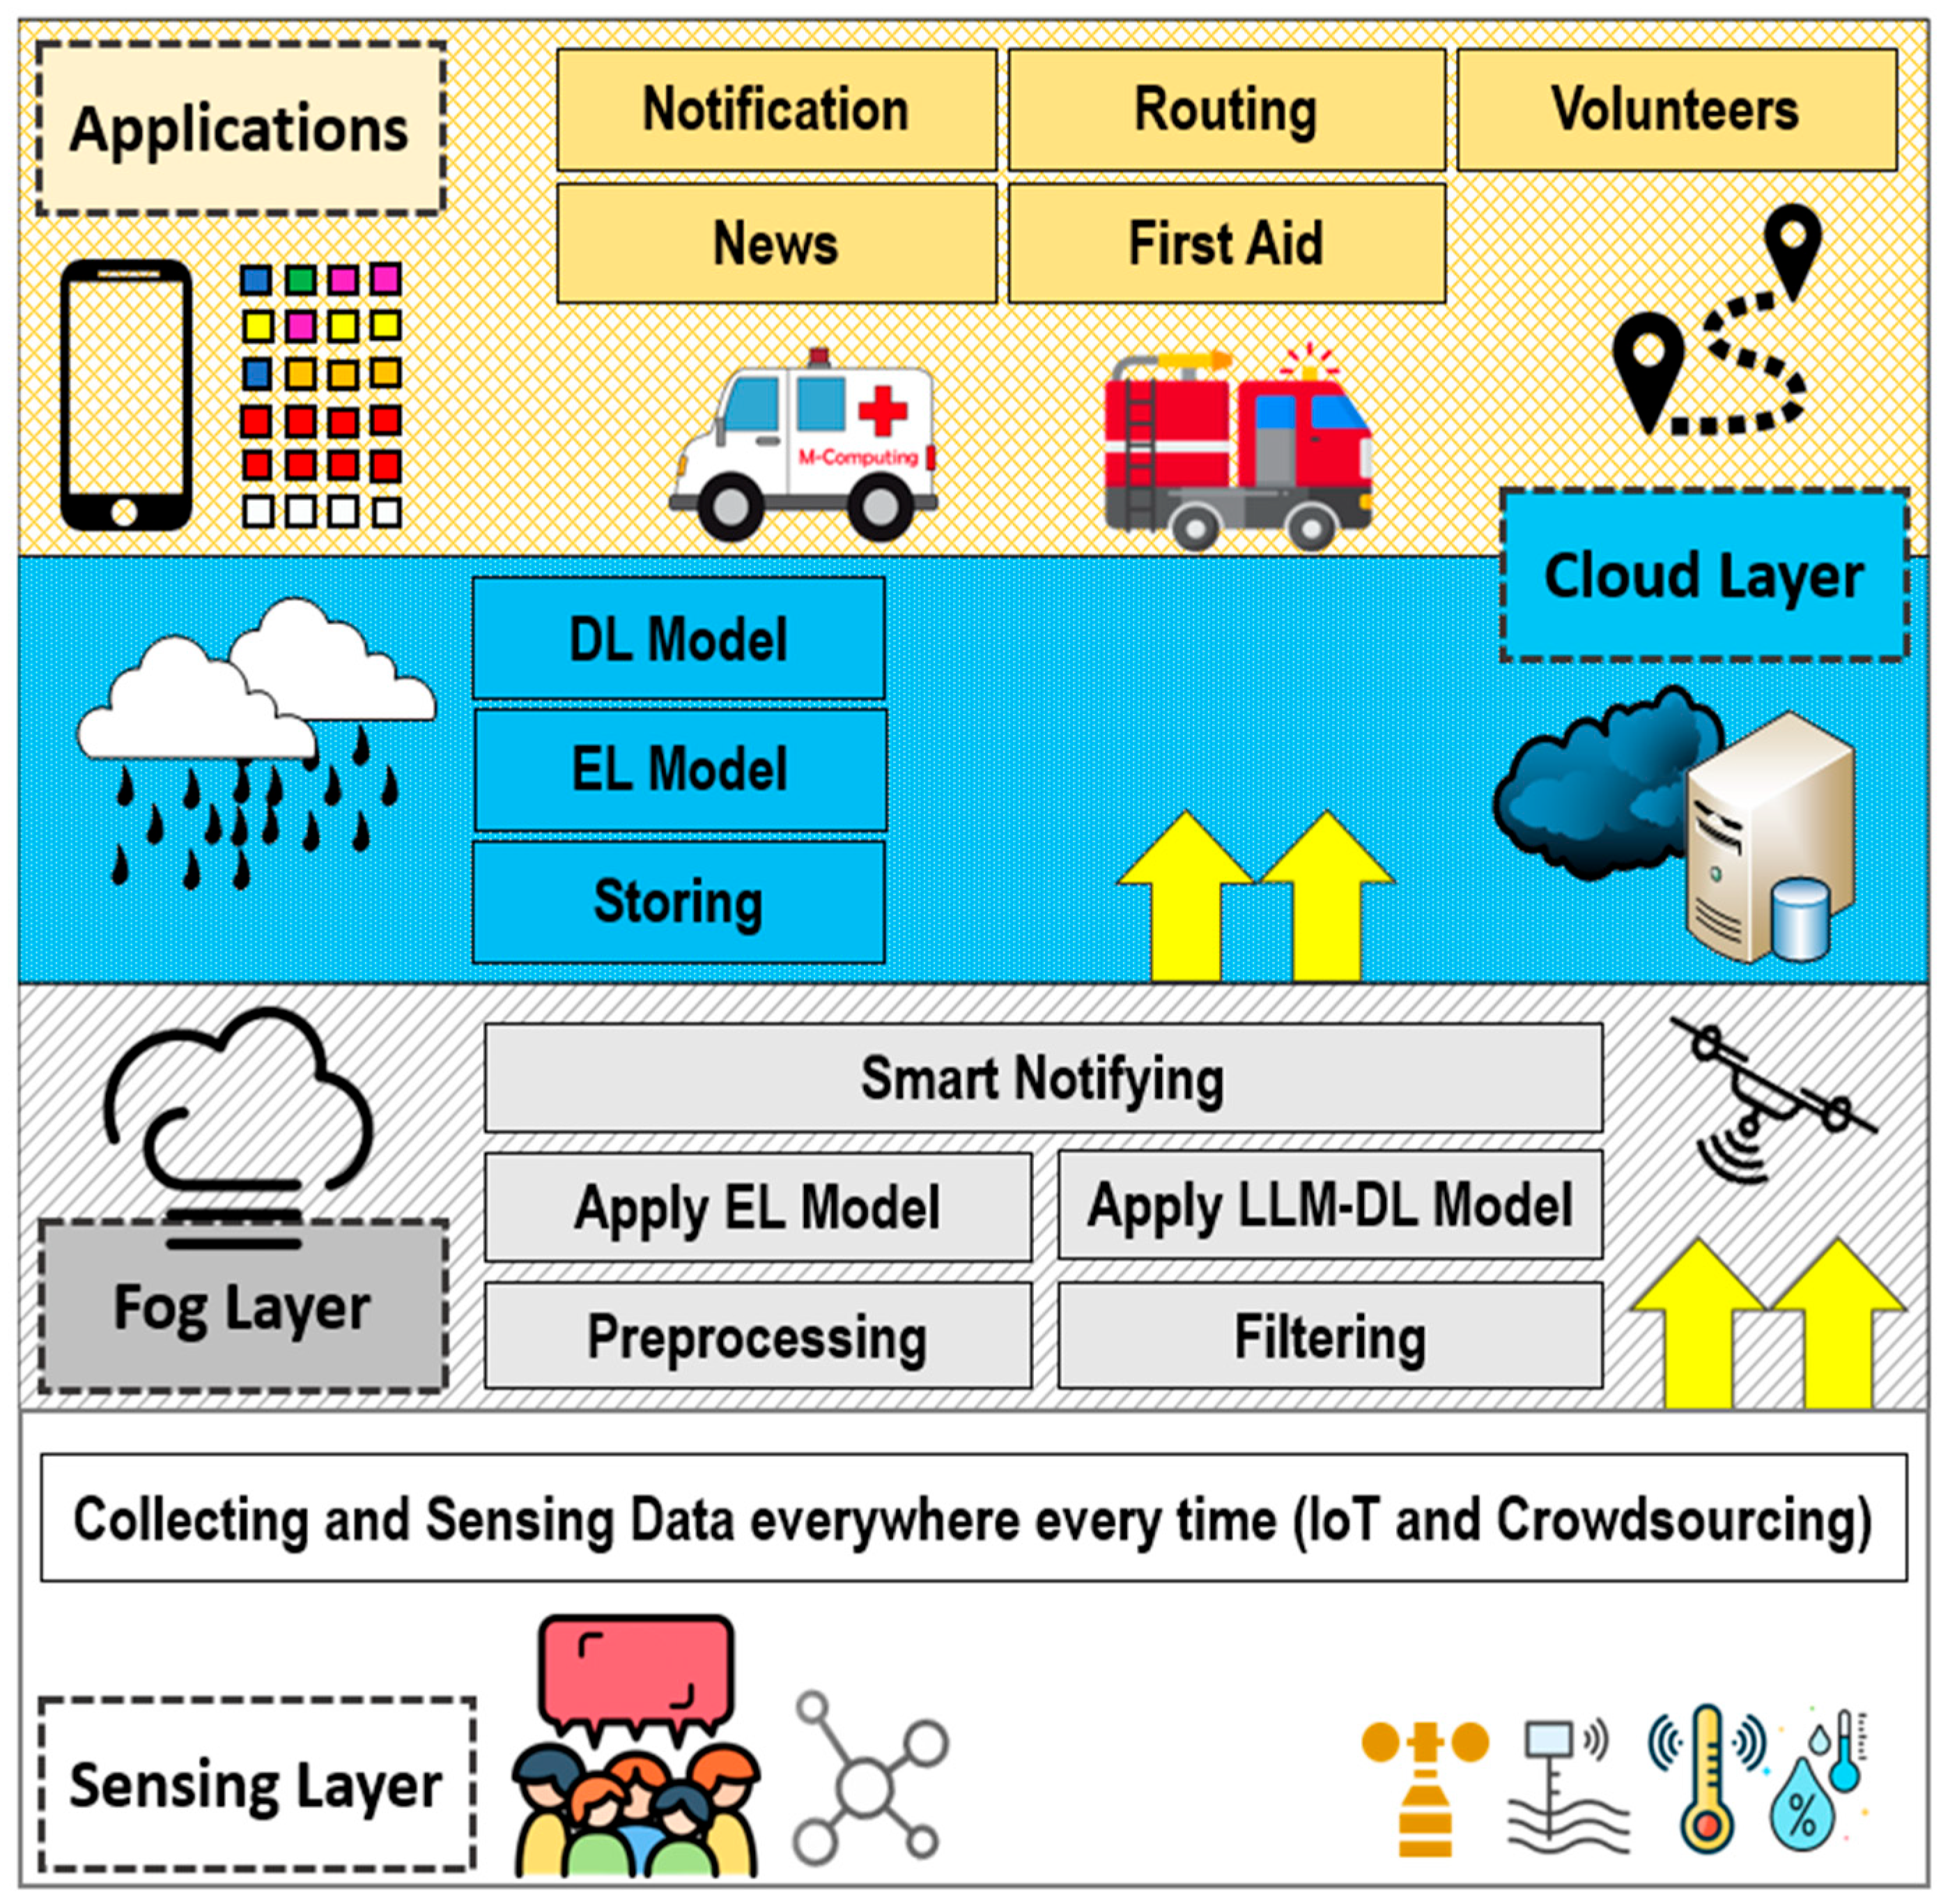
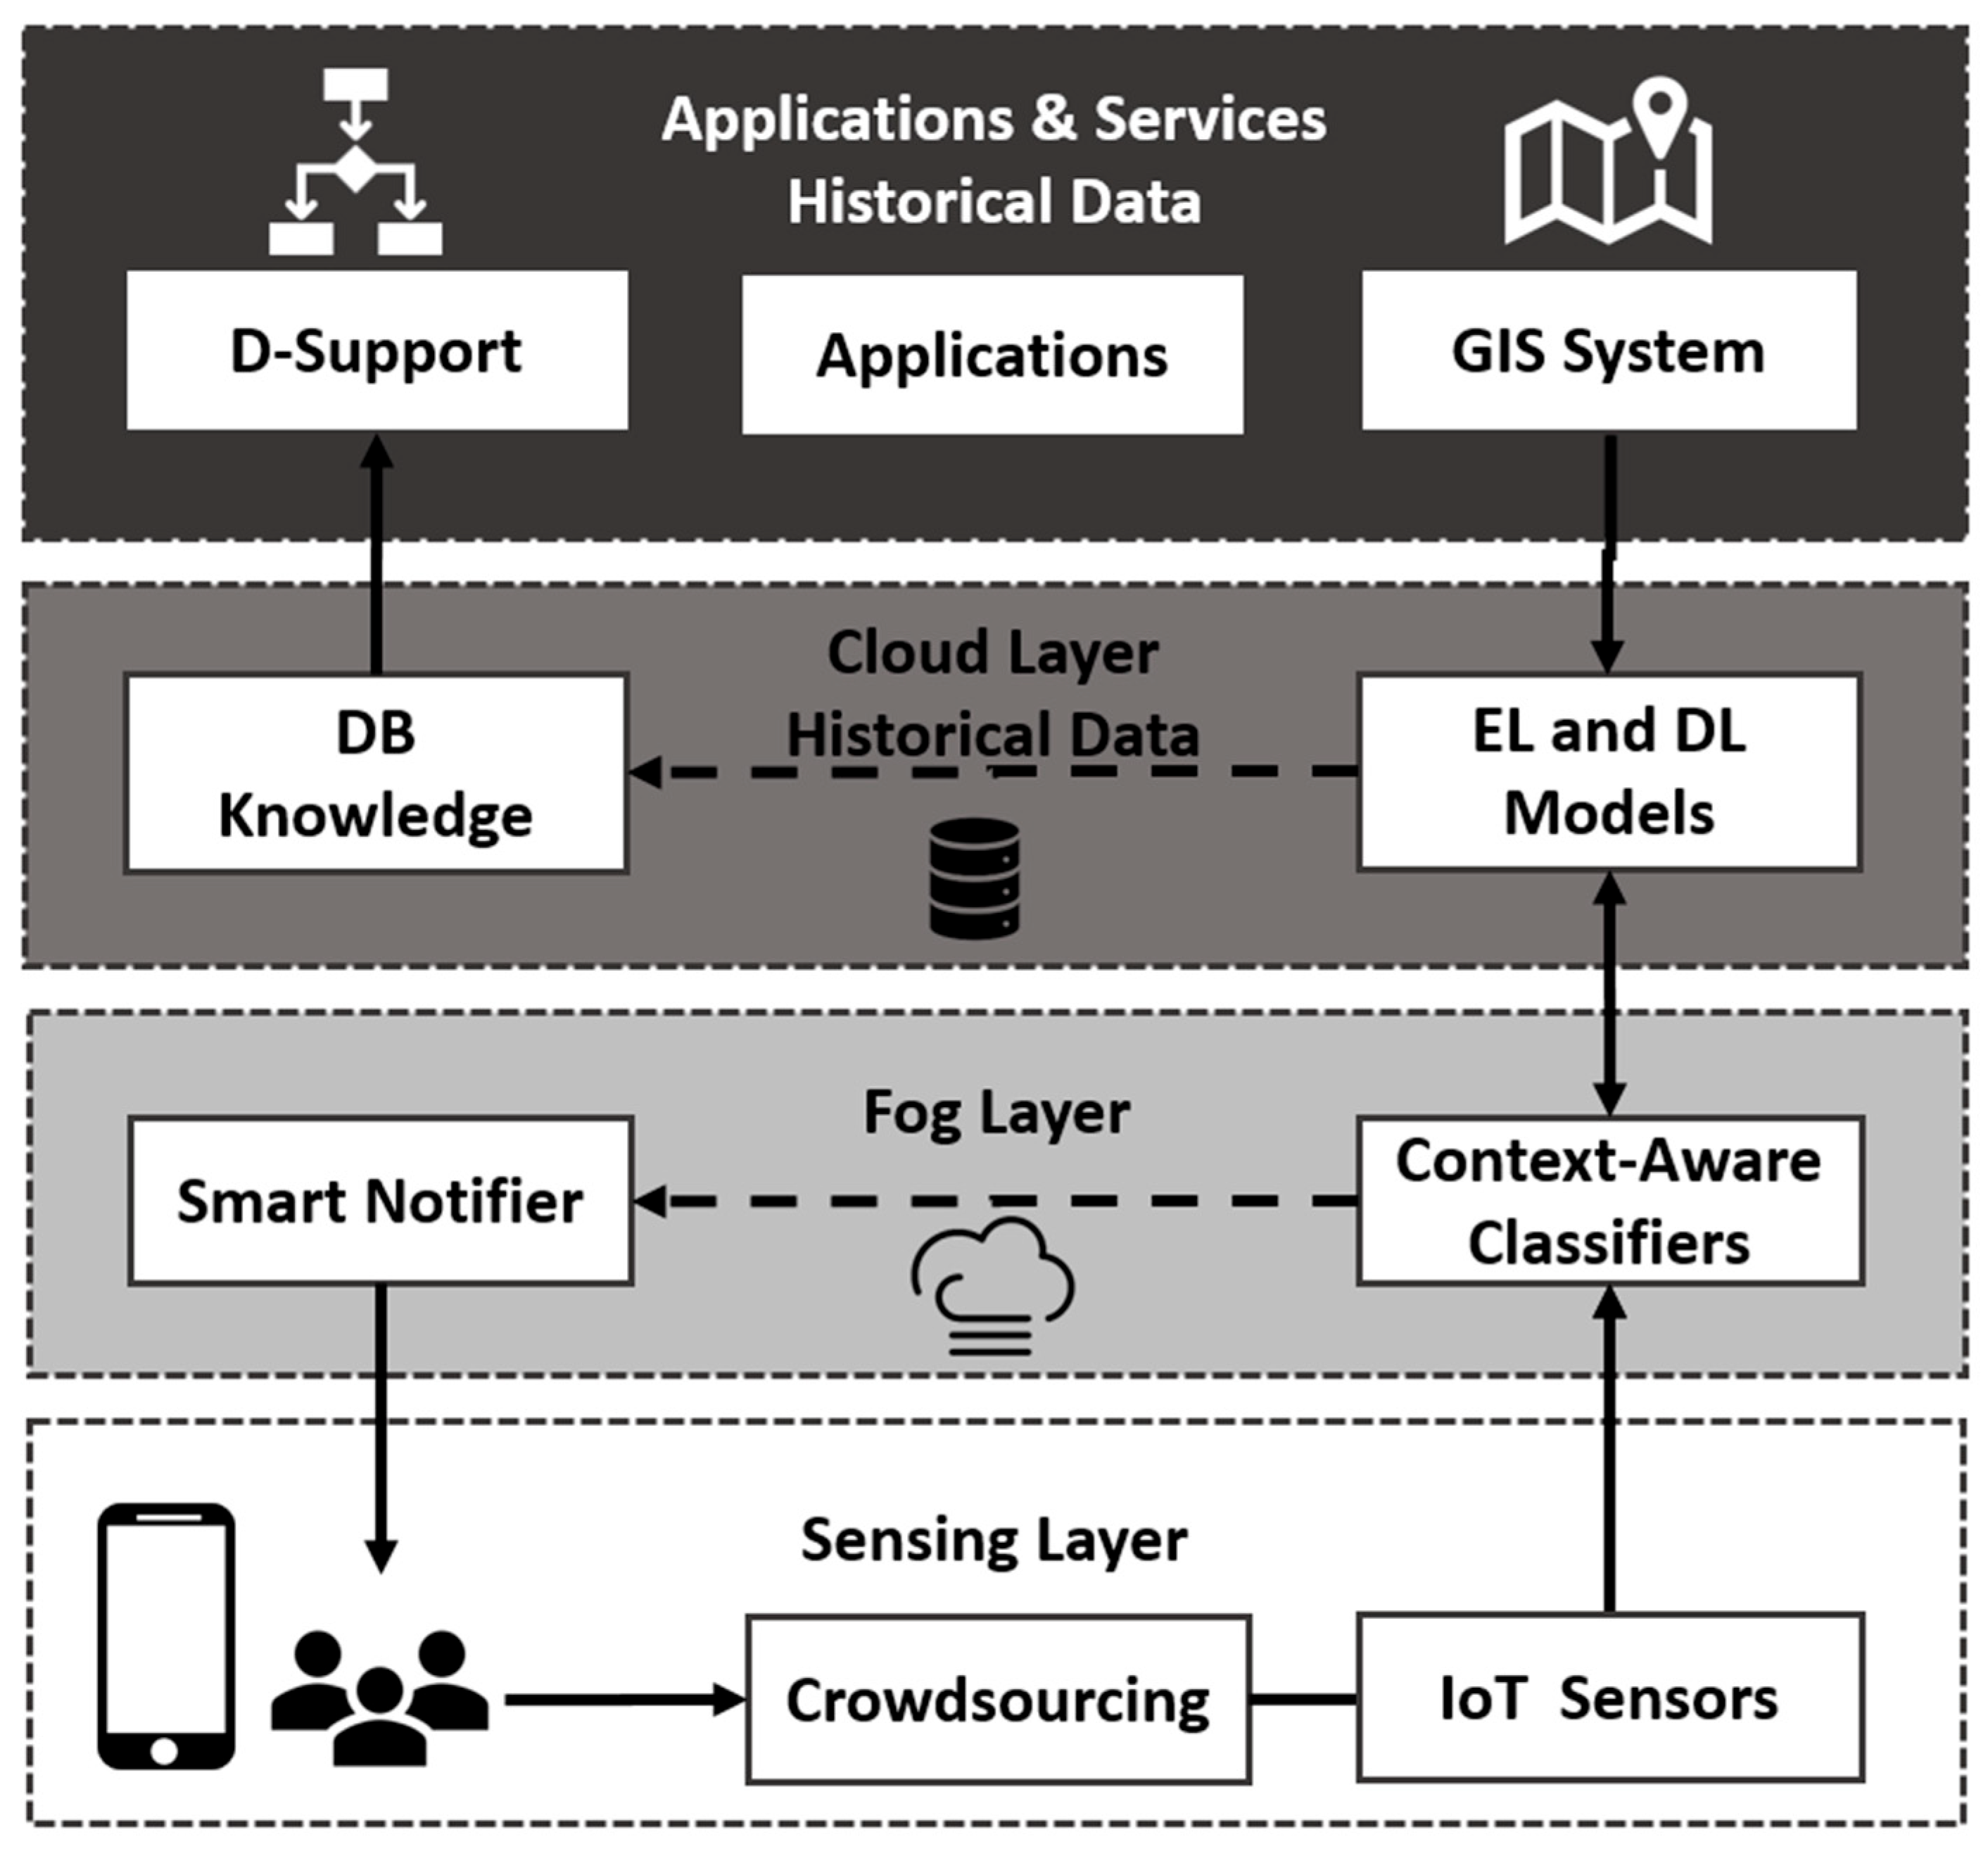
Figure 2 depicts the general view and layers of the proposed framework, while Figure 3 presents a detailed view of the framework. Note that the second algorithm is executed only during a disaster, so alerts are sent only when a threat is detected and classified.
The main components of the proposed framework (see Figure 3):
  • The deployed IoT sensors (water level sensors, temperature and humidity sensors, and wind speed sensors): their mission is to collect data from the actual environment (the city) and send it to the nearest fog node in charge.
  • A platform for data crowdsourcing: a service that enables users to share data with service providers through either a dedicated app (developed specifically) or through social media platforms (e.g., the X tweeting platform).
  • Threat-level classifiers: use two automated classification algorithms that identify the threat level based on the rules generated by the EL and TM training models applied to the data coming from the sensing layer.
  • A smart notifier: an intelligent alert model that is responsible for issuing appropriate alerts based on information from the classifiers and using the geolocation context.
  • A multi-model classifier that comprises an EL classifier responsible for identifying classification rules based on historical IoT sensor data, and an LLM-DL classifier that processes and analyzes textual data from the crowdsourcing platform to confirm the EL classifier’s decisions.
  • A knowledge database (DB) that is used to store statistical information after the analysis of historical data processed by both classifiers.
  • A geographic information system (GIS) that provides information about the location and topology of the target fog node-controlled area. It focuses on the following criteria: land elevation, whether the land is surrounded by mountains, slope direction and stiffness, the nature of the land’s flatness, the availability of water drainage points, and the presence of tunnels.
  • Applications and support services: used for managing alerts, enabling volunteers to participate in data collection, and providing first aid to others.
  • A decision support system (D-Support) that relies on the knowledge base in order to provide useful information for the civil defense teams carrying out disaster management duties.

3.1. Integration Between Cloud and Fog Computing

The cloud is responsible for processing available collected historical data (with high-performance capabilities). These data were used for training and testing to produce an accurate final model. The final model was then sent to the fog nodes, which continuously test and classify real-time readings based on the model they have received. Periodically, the cloud re-optimized/re-tuned the adopted models using newly collected fresh data that were added to the existing historical dataset. As for the spatial context related to the geographical nature of the area, this was proposed within the research methodology to enhance the proposed framework. However, the testing was done on the whole city area due to the lack of data specific to each region.
Therefore, our conceptual proposal requires that each geographically distinct area (e.g., lowland, highland, floodplain, or areas with or without sewage systems) be managed by a dedicated fog node. Based on this additional information, the risk threshold level in each area can be adjusted according to its specific nature (context-based) in a way that fog nodes will use a context-based threshold level, as opposed to using a unified level in the case of treating the entire city as a single region.
This will improve the classification accuracy in each area based on its unique characteristics. However, this was not implemented in practice, as the available dataset covers the whole city of Jeddah (in Saudi Arabia). In this regard, we started working on a Proof of Concept (PoC) in collaboration with the city’s municipality to apply the approach to a specific area within the city of Medina (Saudi Arabia), where stagnant water frequently accumulates in different locations characterized by different topologies.

3.2. The EL Classifier (Algorithm 1)

The Internet of Things (IoT) infrastructure comprises many sensors that periodically send their values to enable continuous real-time monitoring of the surrounding environment. In this research, we relied on four types of sensors: water level sensors, temperature sensors, wind speed sensors, and humidity sensors. This selection was made based on consultations with weather experts and after conducting tests on the correlation index between variables in our historical data (over ten years).
The proposed algorithm was trained on historical data for specific sensor readings. The threats were classified in binary format, where 1 indicates the presence of a threat and danger, and 0 indicates no threat. The main idea behind the proposed algorithm is to transform the prediction process into a real-time classification process. In other words, the fog node, responsible for a specific area, performs the classification process for the collected data periodically.
The current situation is classified as either a threat or not. In the case of a threat, the time period is shortened to half, and the process is repeated as needed. If the threat persists, the system speeds up the monitoring process (increasing frequency). In addition, the counter of the threat level of the current fog node-controlled area will be increased by 1. If the counter of the threat level exceeds a certain threshold, appropriate alerts are sent to concerned users, based on their current locations.
Moreover, to enhance the accuracy of the proposed classification algorithm (Algorithm 1), three machine learning models (selected based on empirical experimentations) were adopted as part of the EL model: a Deep Learning model (based on Artificial Neural Networks (ANNs)), a K-nearest Neighbor (KNN) model, and a Random Forest (RF) model. The classification result is based on the majority consensus among the three models. As the ensemble is made up of three models, Algorithm 1 needs at least 2 votes to identify the new sensor read as a threat (majority voting).
Note: Algorithm 1 provides continuous monitoring and alerting indicators for users. Its success is attributed to its ability to leverage fog node coverage, where each node is responsible for a specific area. This allows the fog node to periodically repeat the testing process and make direct adjustments to the threat level counter when appropriate. Furthermore, each area is handled based on its unique geographic nature, enabling the system to send intelligent, customized alerts to each region based on its conditions.
As a matter of fact, the first algorithm (Algorithm 1) operates continuously to monitor the risk level related to rain, heat, wind, and humidity, depending on the contextual nature of each region. If the risk level exceeds a tunable threshold (defined by the weather experts’ advice), alerts are sent to the residents (including the volunteer users) of that area. At that point, the system begins monitoring incoming tweets through the application from that specific region to handle and respond to any emergency requests using Method 2.

3.3. The LLM-Based DL Classifier (Method 2)

The importance of crowdsourcing data is that it comes from people at the heart of the event, where human sense and perception could be leveraged to analyze data before sending it to the final classification model. Consequently, the accuracy of the classification during a disaster will improve, and the estimated impact level will be more accurate.
In this endeavor, we propose a smart agent based on an LLM and DL to process textual crowdsourcing data. Regarding the analysis of crowdsourcing data, this work adopts two methods for the textual acquisition of data extracted from:
  • Tweets of the X platform, which has proven to be one of the fastest means of news dissemination.
  • A dedicated proposed mobile smartphone application, which allows volunteer users to send textual information to service providers (SPs) based on their real-world perception of the event.
The received data are preprocessed and analyzed by a real-time, lightweight algorithm used by the LLM, then classified by a DL model to support decision-making for disaster management and civil defense teams. The smart agent calls the LLM API to clean the data and remove stop words. Then, it selects the most important words and matches the highly repeated list of key terms during a disaster. The LLM ensures perfect matches even if users use new synonyms, different languages, or different forms for the same term. After that, the DL classifies each tweet or phrase into two categories (normal, emergency call) and reflects the number of emergency cases on the dashboard.

3.3.1. Phase 1–Creating a List of Key Terms and Training the DL Model

The steps include:
  • Collect and label data by an expert (0 normal, 1 threat): the algorithm used a labeled dataset of 1500 tweets [48].
  • Apply LLM-API, which will
    Clean data and remove special characters such as (,:,., etc.) to retain only essential letters. This step, known as “cleaning,” is instrumental in preparing text for further analysis.
    Apply LLM-API to tokenize data and divide the text into distinct words. This step breaks down the text into components to extract meaningful insights. It helps reduce data size and expedite processing.
    Apply LLM-API to remove stop words. This step is important for eliminating common stop words, such as “the”, “is”, “to”, etc., according to each language.
    Apply LLM-API to lemmatize each word and find its root without concern about the ISRI or Porter stemmer algorithm that are used in traditional TM. This standardization process ensures the consistency of the analysis data.
    Build a word cloud to find the most frequent terms as a metric to create a list of key terms. The result of this step will be a list of the most used terms during the flood disaster, which could be validated by a human expert. Then, this expert will validate and refine this list using another list generated by the LLM system without a dataset.
  • Create a vector of each tweet in the dataset, which is already classified as normal or a threat.
  • Train a DL mode (ANN) on the vectors (30/70 with cross-validation) to create a trained DL model, which will be distributed on fog nodes to retain the context-awareness of location with fast responses.
Hint: the phase 1 steps will be repeated on any new data collected to re-train and enhance the DL model.

3.3.2. Phase 2: Testing Phase (Based on the LLM and DL Model)

The steps include:
  • Receive Data: Receiving tweets through the X platform API and users’ messages from the dedicated mobile application (volunteers).
  • Preprocess data based on LLM-API, match to the list of key terms, and create a vector of the tweet.
  • Classify the vector into threat or normal to update the threat level of each spatial context area on the dashboard.
The outcome of the above steps is integrated with Algorithm 1 to reflect end results on the dashboard of the civil defense teams, where the results are visualized and tracked geographically for improved decision-making.

3.4. Smart Application and Services

The most important service of the proposed framework is the smart alert service. In addition to its dependence on data from crowdsourcing and IoT, the smart alert service deals with the spatial topological context (to distinguish each area from one another within the city itself). For example, in the case of floods, low-rise and slope-shaped areas that do not contain drainage facilities will be more vulnerable to flooding than high-rise areas. The same is to be said about areas inside tunnels, which also have a high risk of flooding when no proper drainage is present.
The inefficiencies of alert dispatching to users in danger were one of the common shortcomings highlighted in previous work. For example, sending a generic SMS to all city residents, urging caution without specifying actionable steps or hazards to avoid, leads to mistrust in the notification system (especially for those who were not subject to danger at all). This generalization overlooks geographical variations between areas and the relative vulnerability to flood risks. Another defective notification method is posting general warnings on websites that ignore active roles that volunteer users could play by providing accurate data/information about the current flood situation and assisting civil defense teams on the ground.
To address these shortcomings, this work has introduced a smart application designed to deliver specially tailored notifications considering users’ location context. Furthermore, beyond its core functionalities, the proposed smart application endeavors to redefine disaster preparedness and response. It proposes providing a spectrum of crucial services to users in times of emergency, covered in the next sub-section. These services are divided into Emergency Alerts and Information Services and User Engagement and Support Services.
A.
Emergency Alerts and Information Services:
  • Direct Alert Service: Users receive location-based alerts in real time, ensuring that they get critical information tailored to their current location and to the unique characteristics of the area where each user is. This service is essential for timely and relevant notifications during emergencies.
  • Awareness Service: Users stay informed with periodic articles and notices on what to do and what to avoid during disasters.
  • Status of Areas Service: Users will be able to navigate through the areas that are less dangerous during emergencies and learn how to reach them safely.
  • Road Condition Service: Users will be able to access information about road closures due to disasters and identify available routes.
  • Emergency Numbers: Quick access to essential numbers like civil defense, ambulance, or police.
B.
User Engagement and Support Services (Volunteer Users or Defense Teams):
  • Data Sharing: Users can play active roles by sharing real-time data about the location of users to help authorities assess damages and risks accurately. The framework collects and processes these data to verify alert reliability and refine threat level classifications.
  • First Aid: Users can access vital information on how to provide first aid assistance in cases of the delayed arrival of ambulance crews. Users can learn, through text and video resources, how to handle various emergency scenarios, from drowning to bleeding, etc.
The enhanced framework includes a control panel (dashboard) that summarizes information about the disaster and facilitates the process of monitoring based on each area’s characteristics, relief calls, and the distribution of locations on the map. This, in turn, will support appropriate decision-making and better disaster management by rescue teams. The next section presents the experimental results of the proposed framework.

4. Implementation and Results

This section is organized into five sub-sections that aim to test the main components of the proposed framework to demonstrate its feasibility and effectiveness.

4.1. Testing the Proposed EL Algorithm (Algorithm 1)

The proposed classification algorithm was tested on real data collected over 10 years (from 15 June 2013 to 15 June 2023) from the Saudi Arabian Meteorological Authority for the city of Jeddah. During these years, Jeddah experienced five floods due to rainfall, with the most recent occurring in 2022. The data included daily averages of temperature, humidity, wind speed, sea level elevation, wave height, and rainfall rate. Days that witnessed threats or floods were classified as number 1, while other days were assigned as number 0.
The work was carried out in the Google Colab environment using the Python 3.12 language. After applying the correlation coefficient, the sea level elevation and the sea water level were removed. Preliminary data processing involved replacing some missing values with the median and then applying normalization to all numerical values. Finally, the Synthetic Minority Over-Sampling Technique (SMOTE) was applied to address data imbalance issues, given that the number of threat days was much lower than normal days.
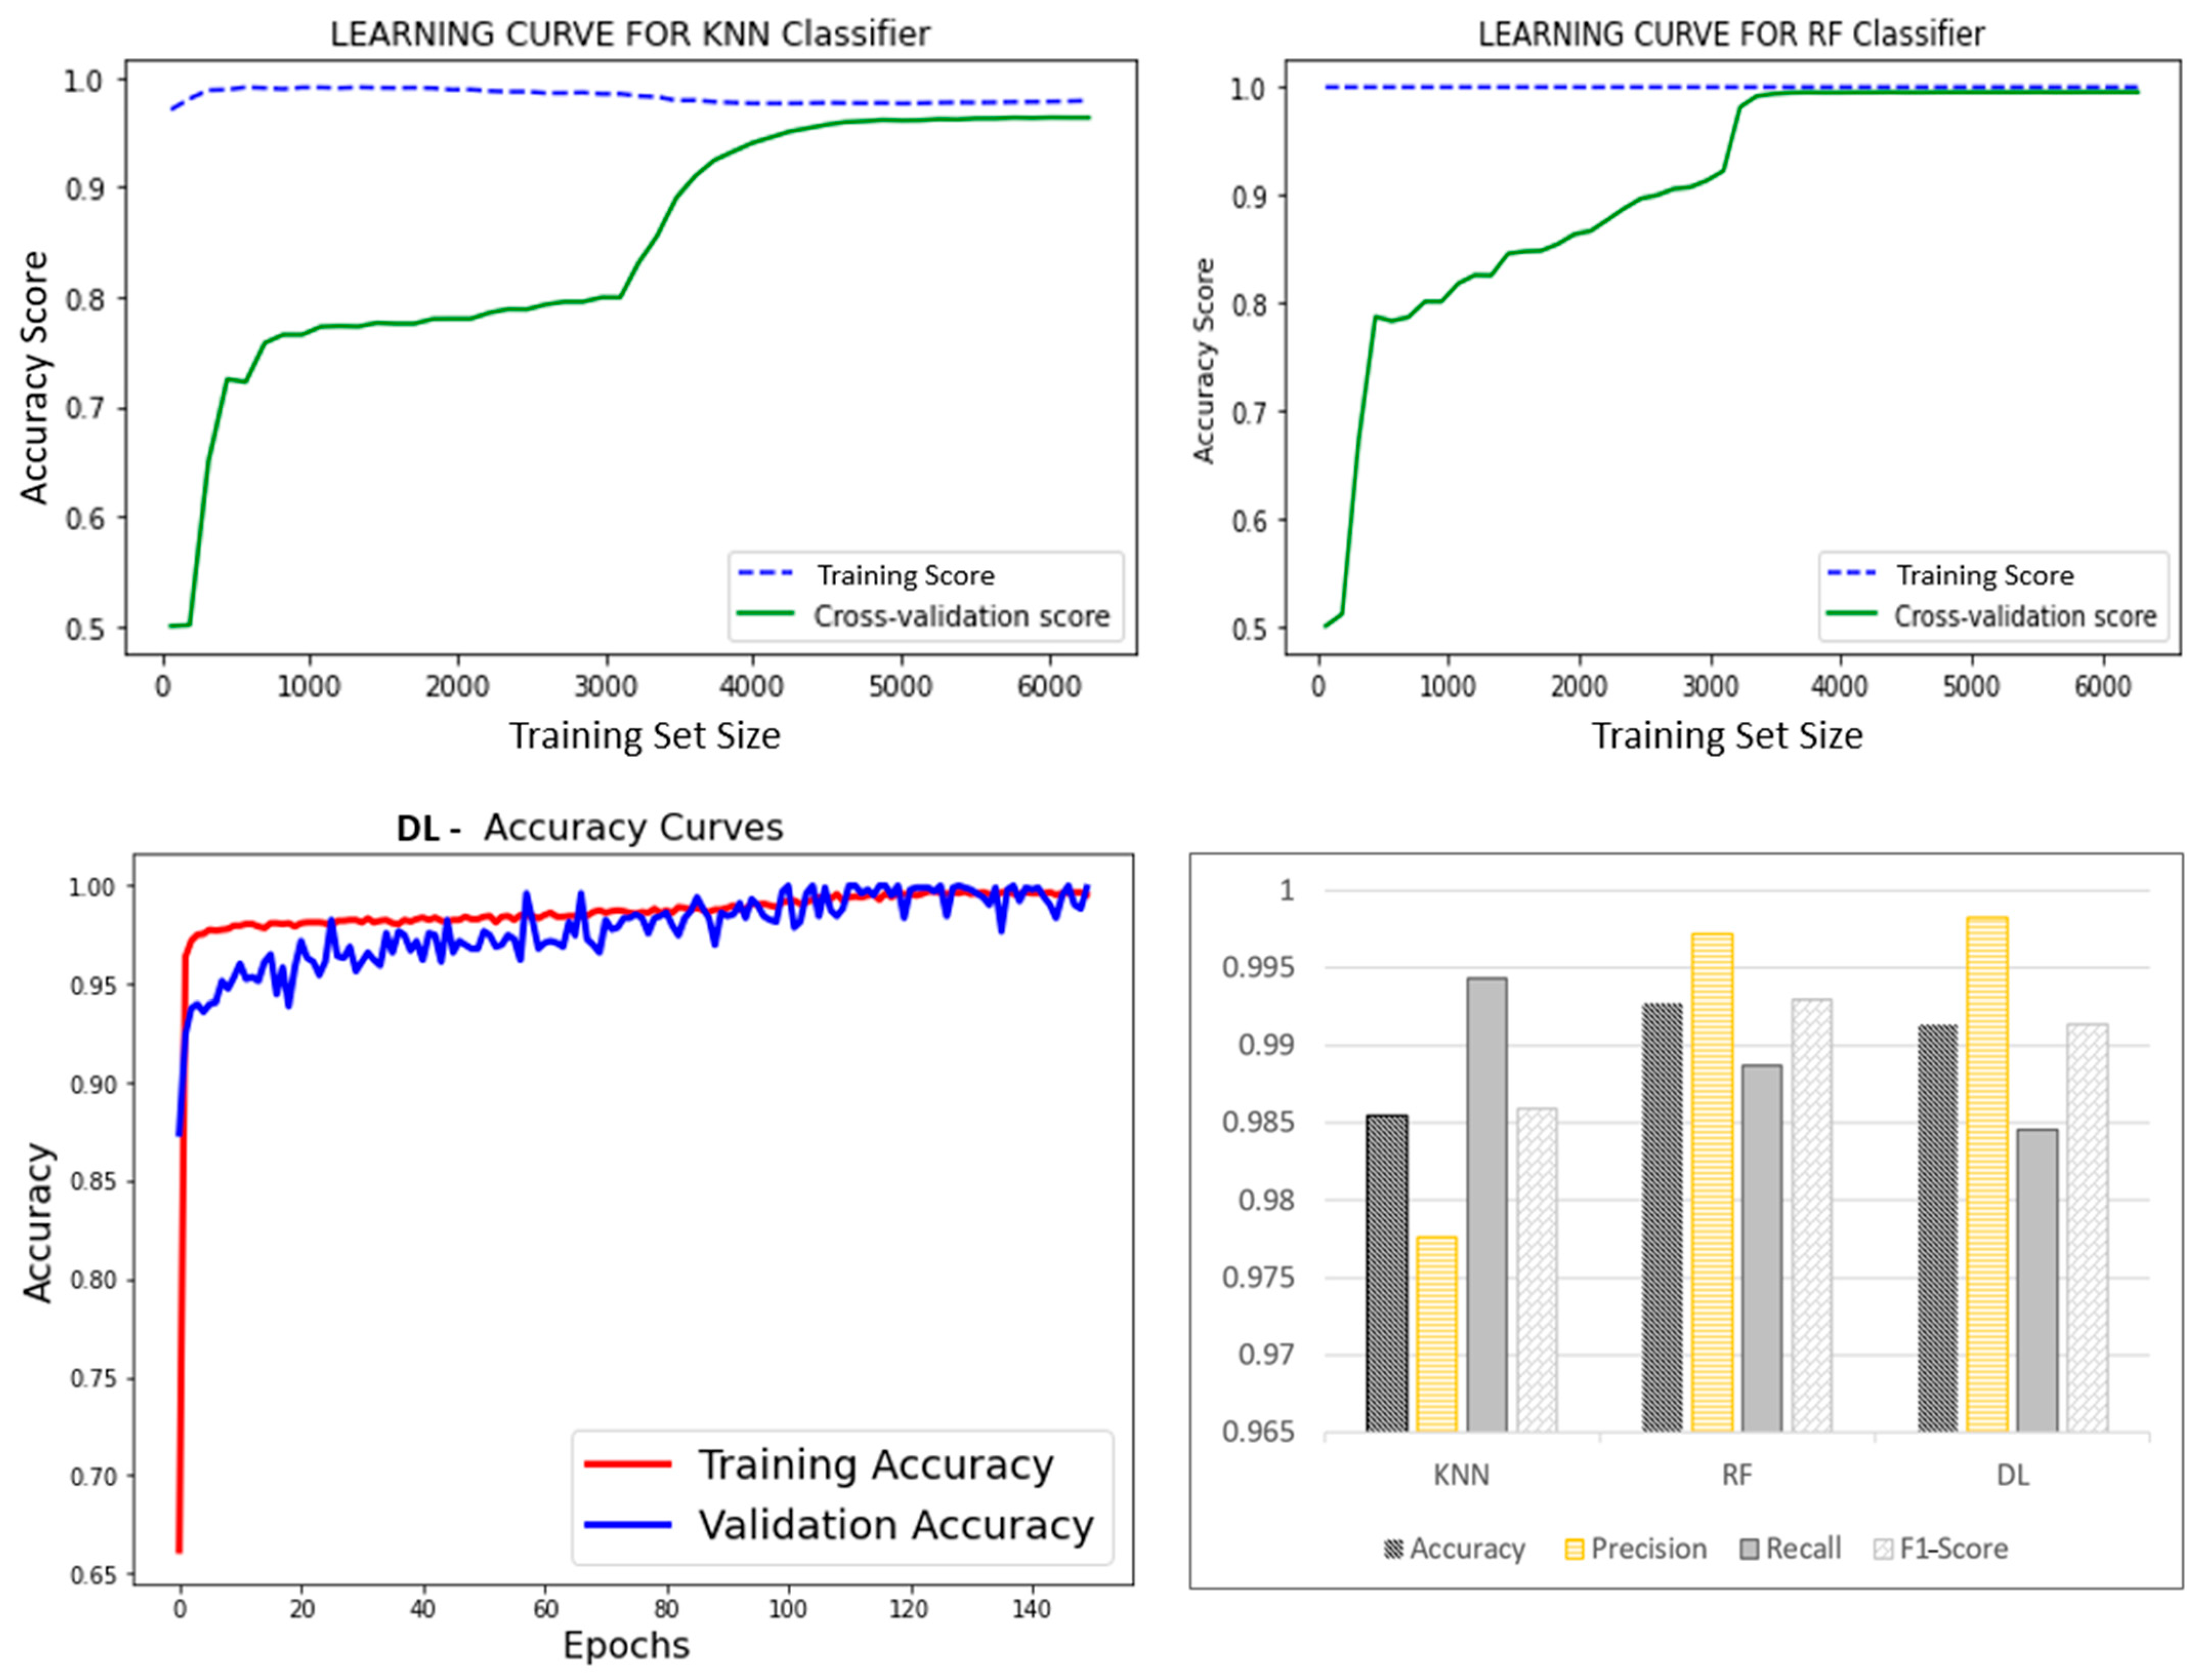
We applied an EL approach, where we selected Deep Learning, Random Forest, and K-nearest Neighbor as our learning ensemble, among several others (all applied to the dataset), as they showed the best accuracy rate, which approached 99% precision. To enhance the accuracy of our proposed algorithm, the majority result among the three models was adopted.
Figure 4 illustrates the comparison results for the previous models, based on the learning curve, and the relevant comparison metrics related to the confusion matrix, such as accuracy, precision, recall, and F1-score, as defined in the following equations:
Accuracy, precision, recall, and F1-score.
Accuracy = (TP + TN)/(TP + FP + FN + TN)
Precision = TP/(TP + FP)
Recall (Sensitivity) = TP/(TP + FN)
F1-Score = 2 * (Recall * Precision)/(Recall + Precision)
where TP (True Positive): correctly predicted positive cases, FP (False Positive): incorrectly predicted positive cases (actually negative), FN (False Negative): incorrectly predicted negative cases (actually positive), and TN (True Negative): correctly predicted negative cases. Recall (sensitivity) represents the proportion of actual positive cases (threat) that are correctly identified by the model.

4.2. Comparison to Others

This paragraph provides a comparison between our solution and those of some previous studies that deal with flood prediction using ML. Table 3 presents the differences in the dataset size, selected features, selected ML models, and accuracy.
In [49], the authors built a model for predicting floods using ML models that depend only on historical rainfall data. A notable limitation was the exclusive dependence on daily rainfall data, neglecting crucial weather parameters such as temperature and wind speed. Moreover, the used dataset is considered old, dating from January 1981 to 31 December 2013. This explains the low accuracy of their results, as evidenced by their recorded metrics: DT = 57.14%, LR 85.7%, and SVM = 28.57%.
In contrast, our dataset was more recent than the datasets used in [49,50]. Also, our study exhibited remarkable advancements in accuracy. For instance, the RF and DL models achieved the highest accuracy, scoring 99.6 percent. This substantial improvement underscores the efficacy of our methodology in mitigating the limitations observed in previous research endeavors.
The authors of [50] incorporated additional weather characteristics into the prediction of flood occurrence, including month, temperature, and rain amount (from 1990 to 2002), yet the accuracy remained modest, with a recorded accuracy of KNN = 85.73 and SVM 85.57. Our study surpassed these by adopting the additional feature of “wind speed”.
Moreover, unlike all previous studies, which treated cities as homogeneous entities, our research acknowledges the diverse geographical and climatic characteristics within the city itself. Furthermore, while previous studies predominantly focused on forecasting the amount of rainfall, our research constitutes a paradigm shift toward continuous classification of risk levels for each area in a city.
This strategic divergence allows our model to adapt dynamically to evolving environmental conditions, thereby enhancing their accuracy and practicality. By embracing this innovative approach, our study not only advances the theoretical understanding of flood modeling but also offers practical insights for policymakers and stakeholders tasked with mitigating the impacts of natural disasters.

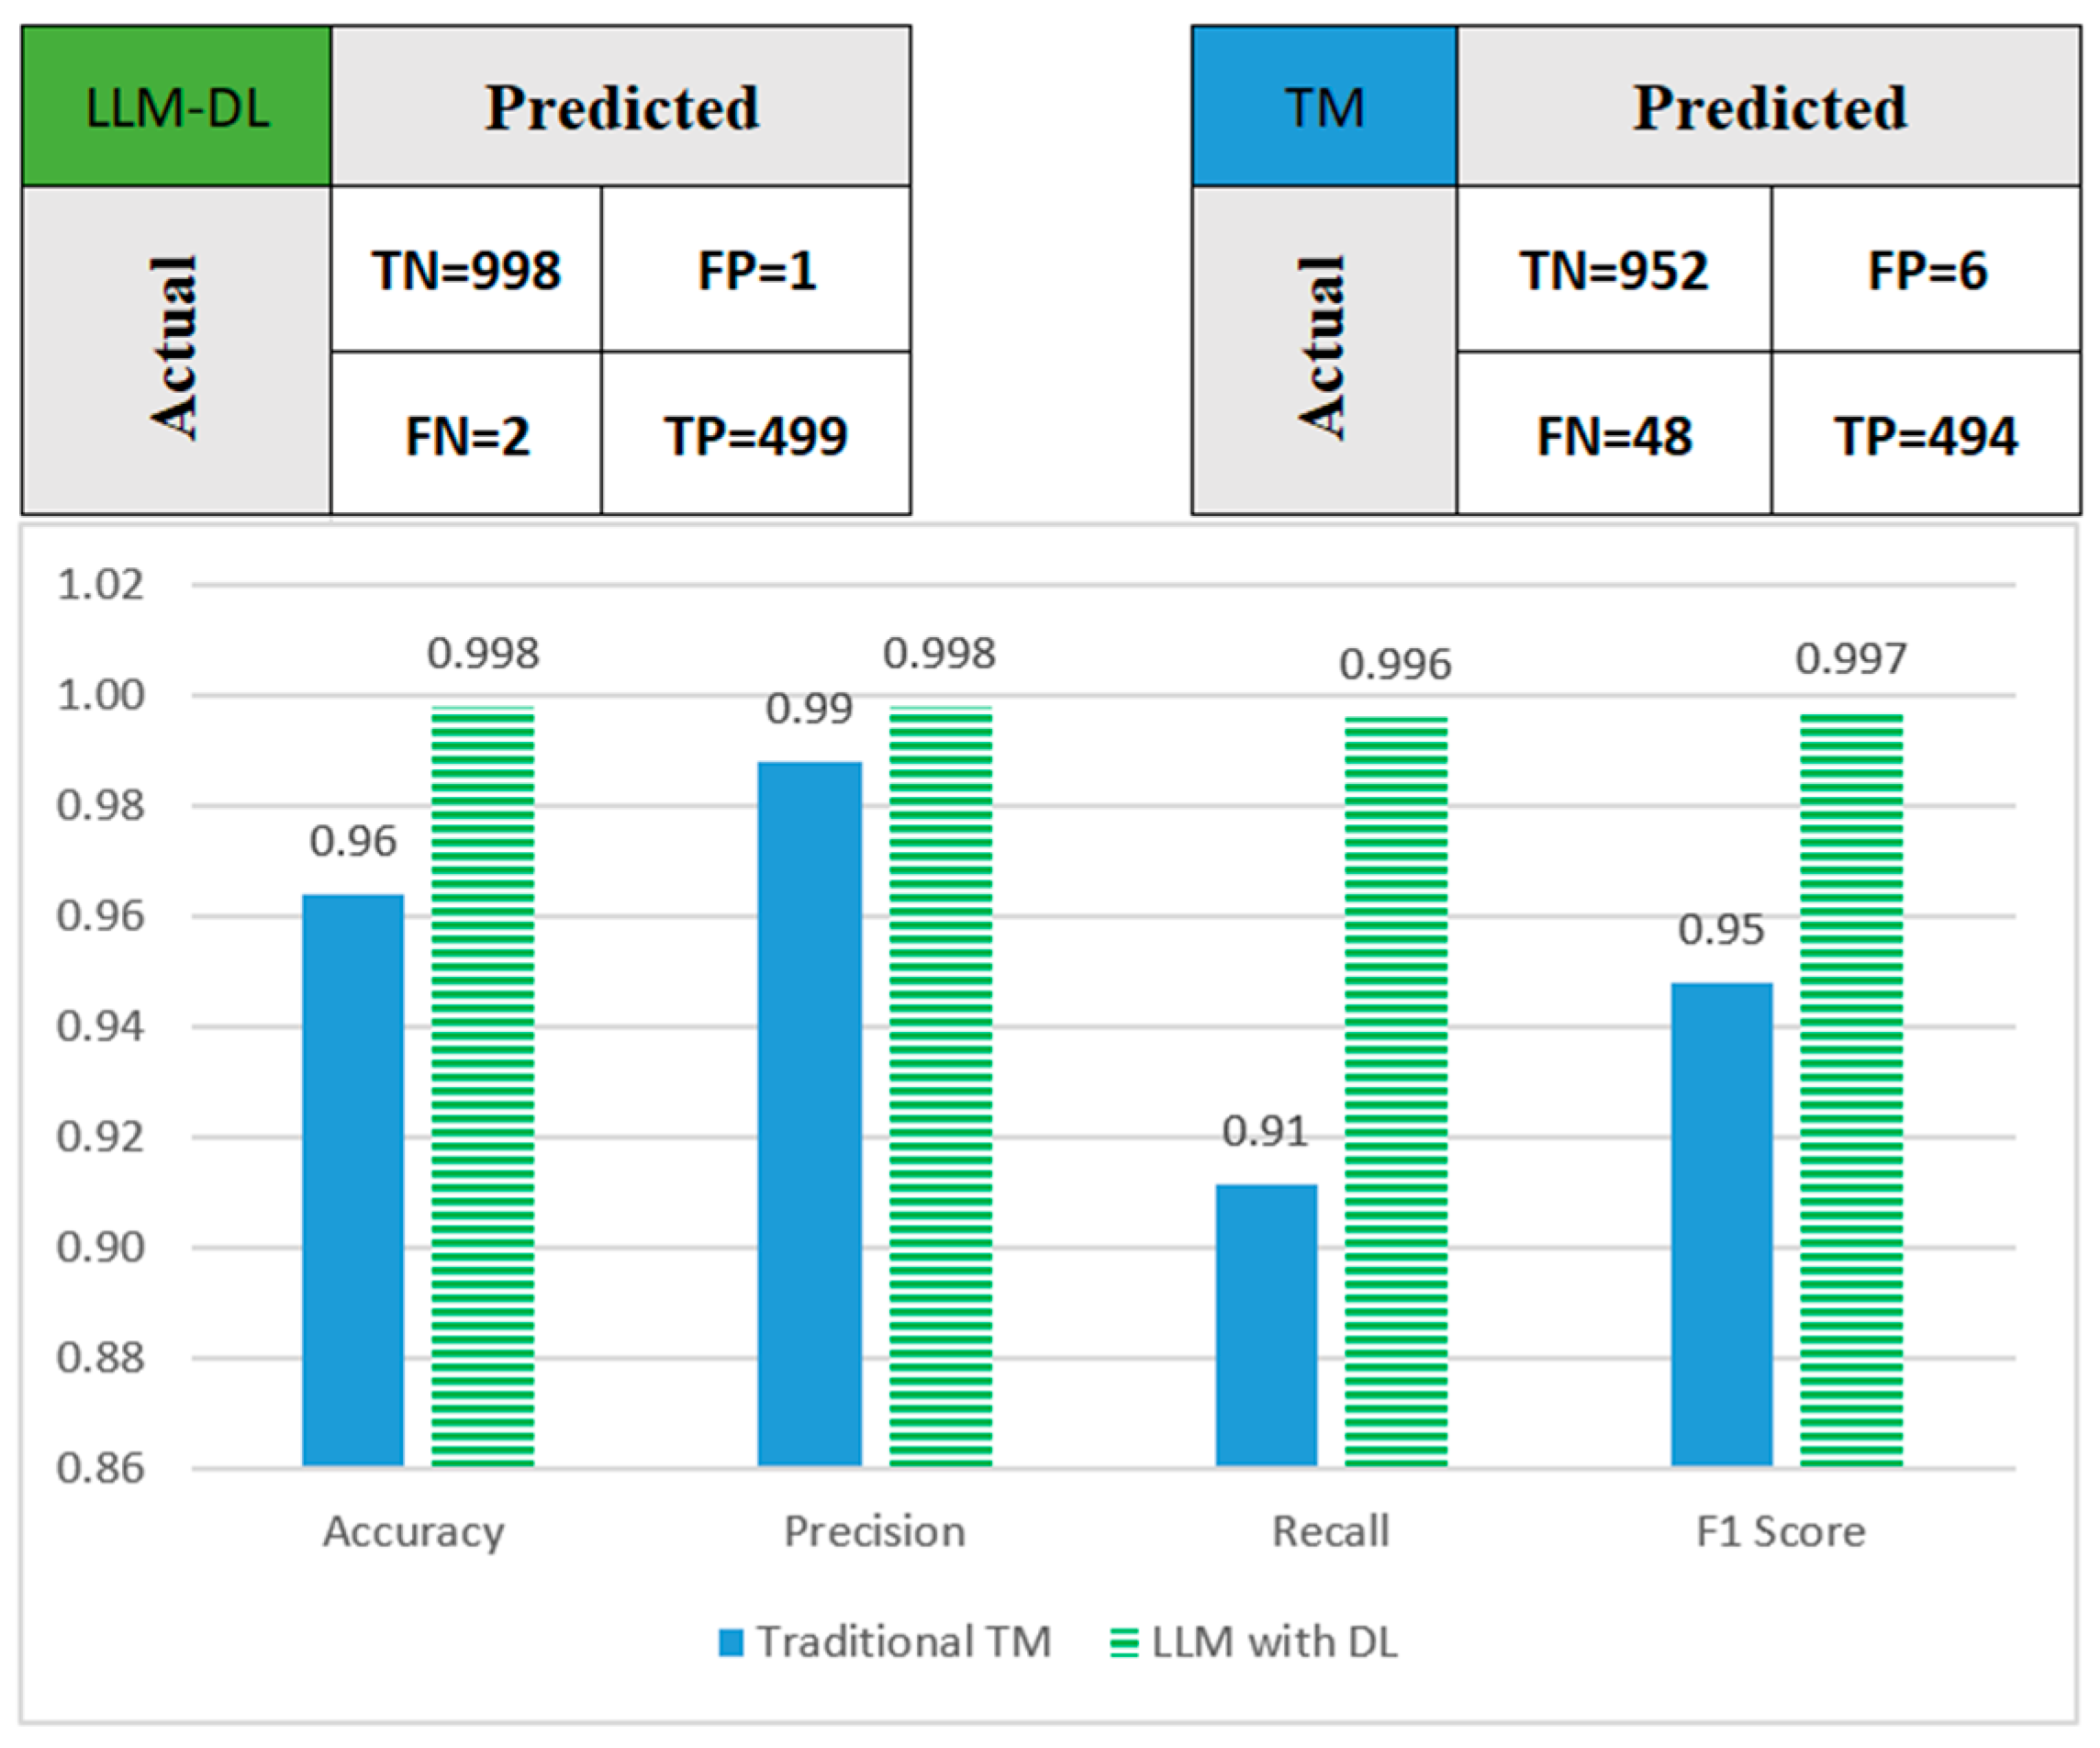
4.3. Testing the Proposed LLM-Agent Method (Method 2)

This section is dedicated to testing the results of the traditional TM algorithm with an LLM for classifying crowdsourced textual data, whether tweets or comments sent by individuals themselves. A simple dataset of 1500 phrases (tweets for real users in Saudi Arabia between 2014 and 2017) [48] was used and classified as an emergency request or a normal one that does not warrant concern. The algorithm was implemented in Python using the Google Colab platform. The algorithm utilizes the NLTK library for text processing [51]. We used the Confusion Matrix to evaluate the proposed algorithm based on the same criteria. Figure 5 illustrates the results of the experiment. The results show that the accuracy was enhanced from 96% to 99.99% after depending on the LLM.

4.4. Implementation of the Proposed Application

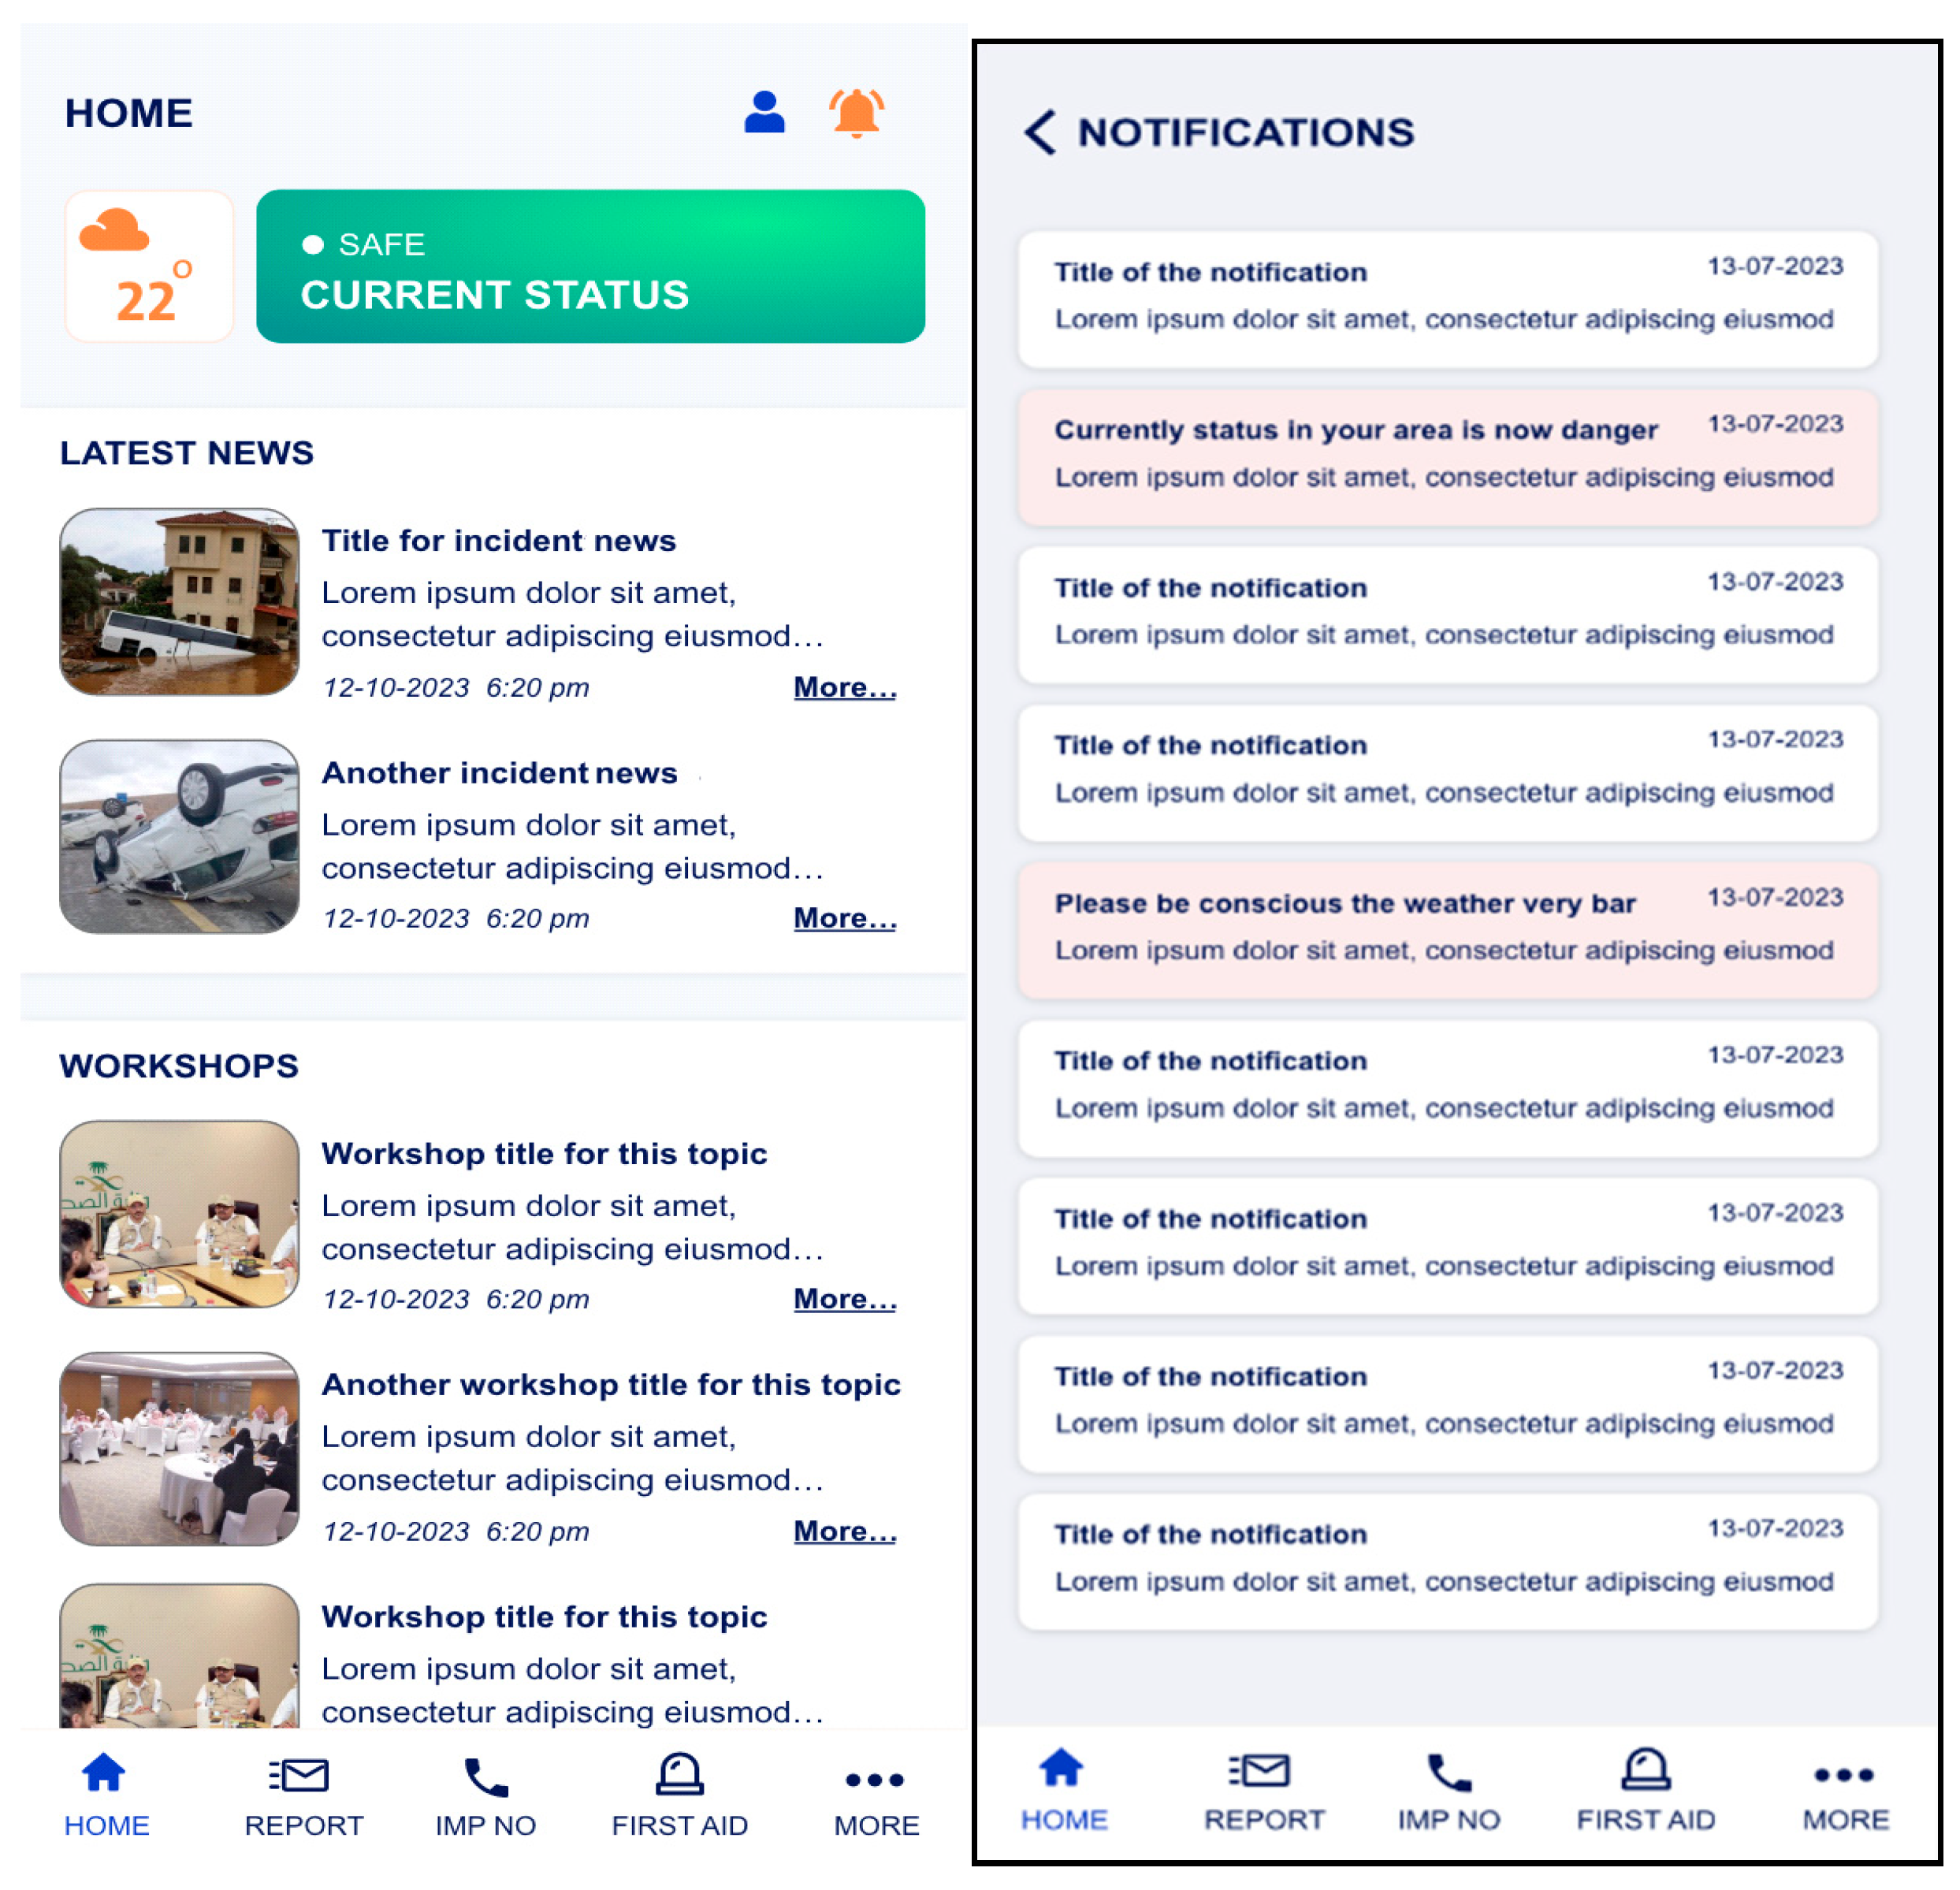
To ease the evaluation process, a simplified prototype of the proposed application was developed as an Android-based system. The prototype was created using Java for the Android application and PHP for the server-side functionality, utilizing MySQL and Firebase as the database systems. Figure 6 and Figure 7 showcase the primary interfaces (mockups) of the proposed application with dummy data.
Figure 6 shows the home screen that displays the main interface of the proposed application, which consists of five distinct sections. The first section includes alerts, the page’s title, and the user’s profile information. The second section features a weather indicator that provides real-time information on the current level of danger or safety based on the user’s location and the current time. The third section is dedicated to delivering crucial news updates. The fourth section provides insights into various workshops, including first aid training, volunteering opportunities, and rescue initiatives. Lastly, the fifth section contains a range of services available within the application. The notification part demonstrates the alerts that are sent to users during times of emergency. The most critical alerts are highlighted with a distinct color scheme to ensure easy identification.
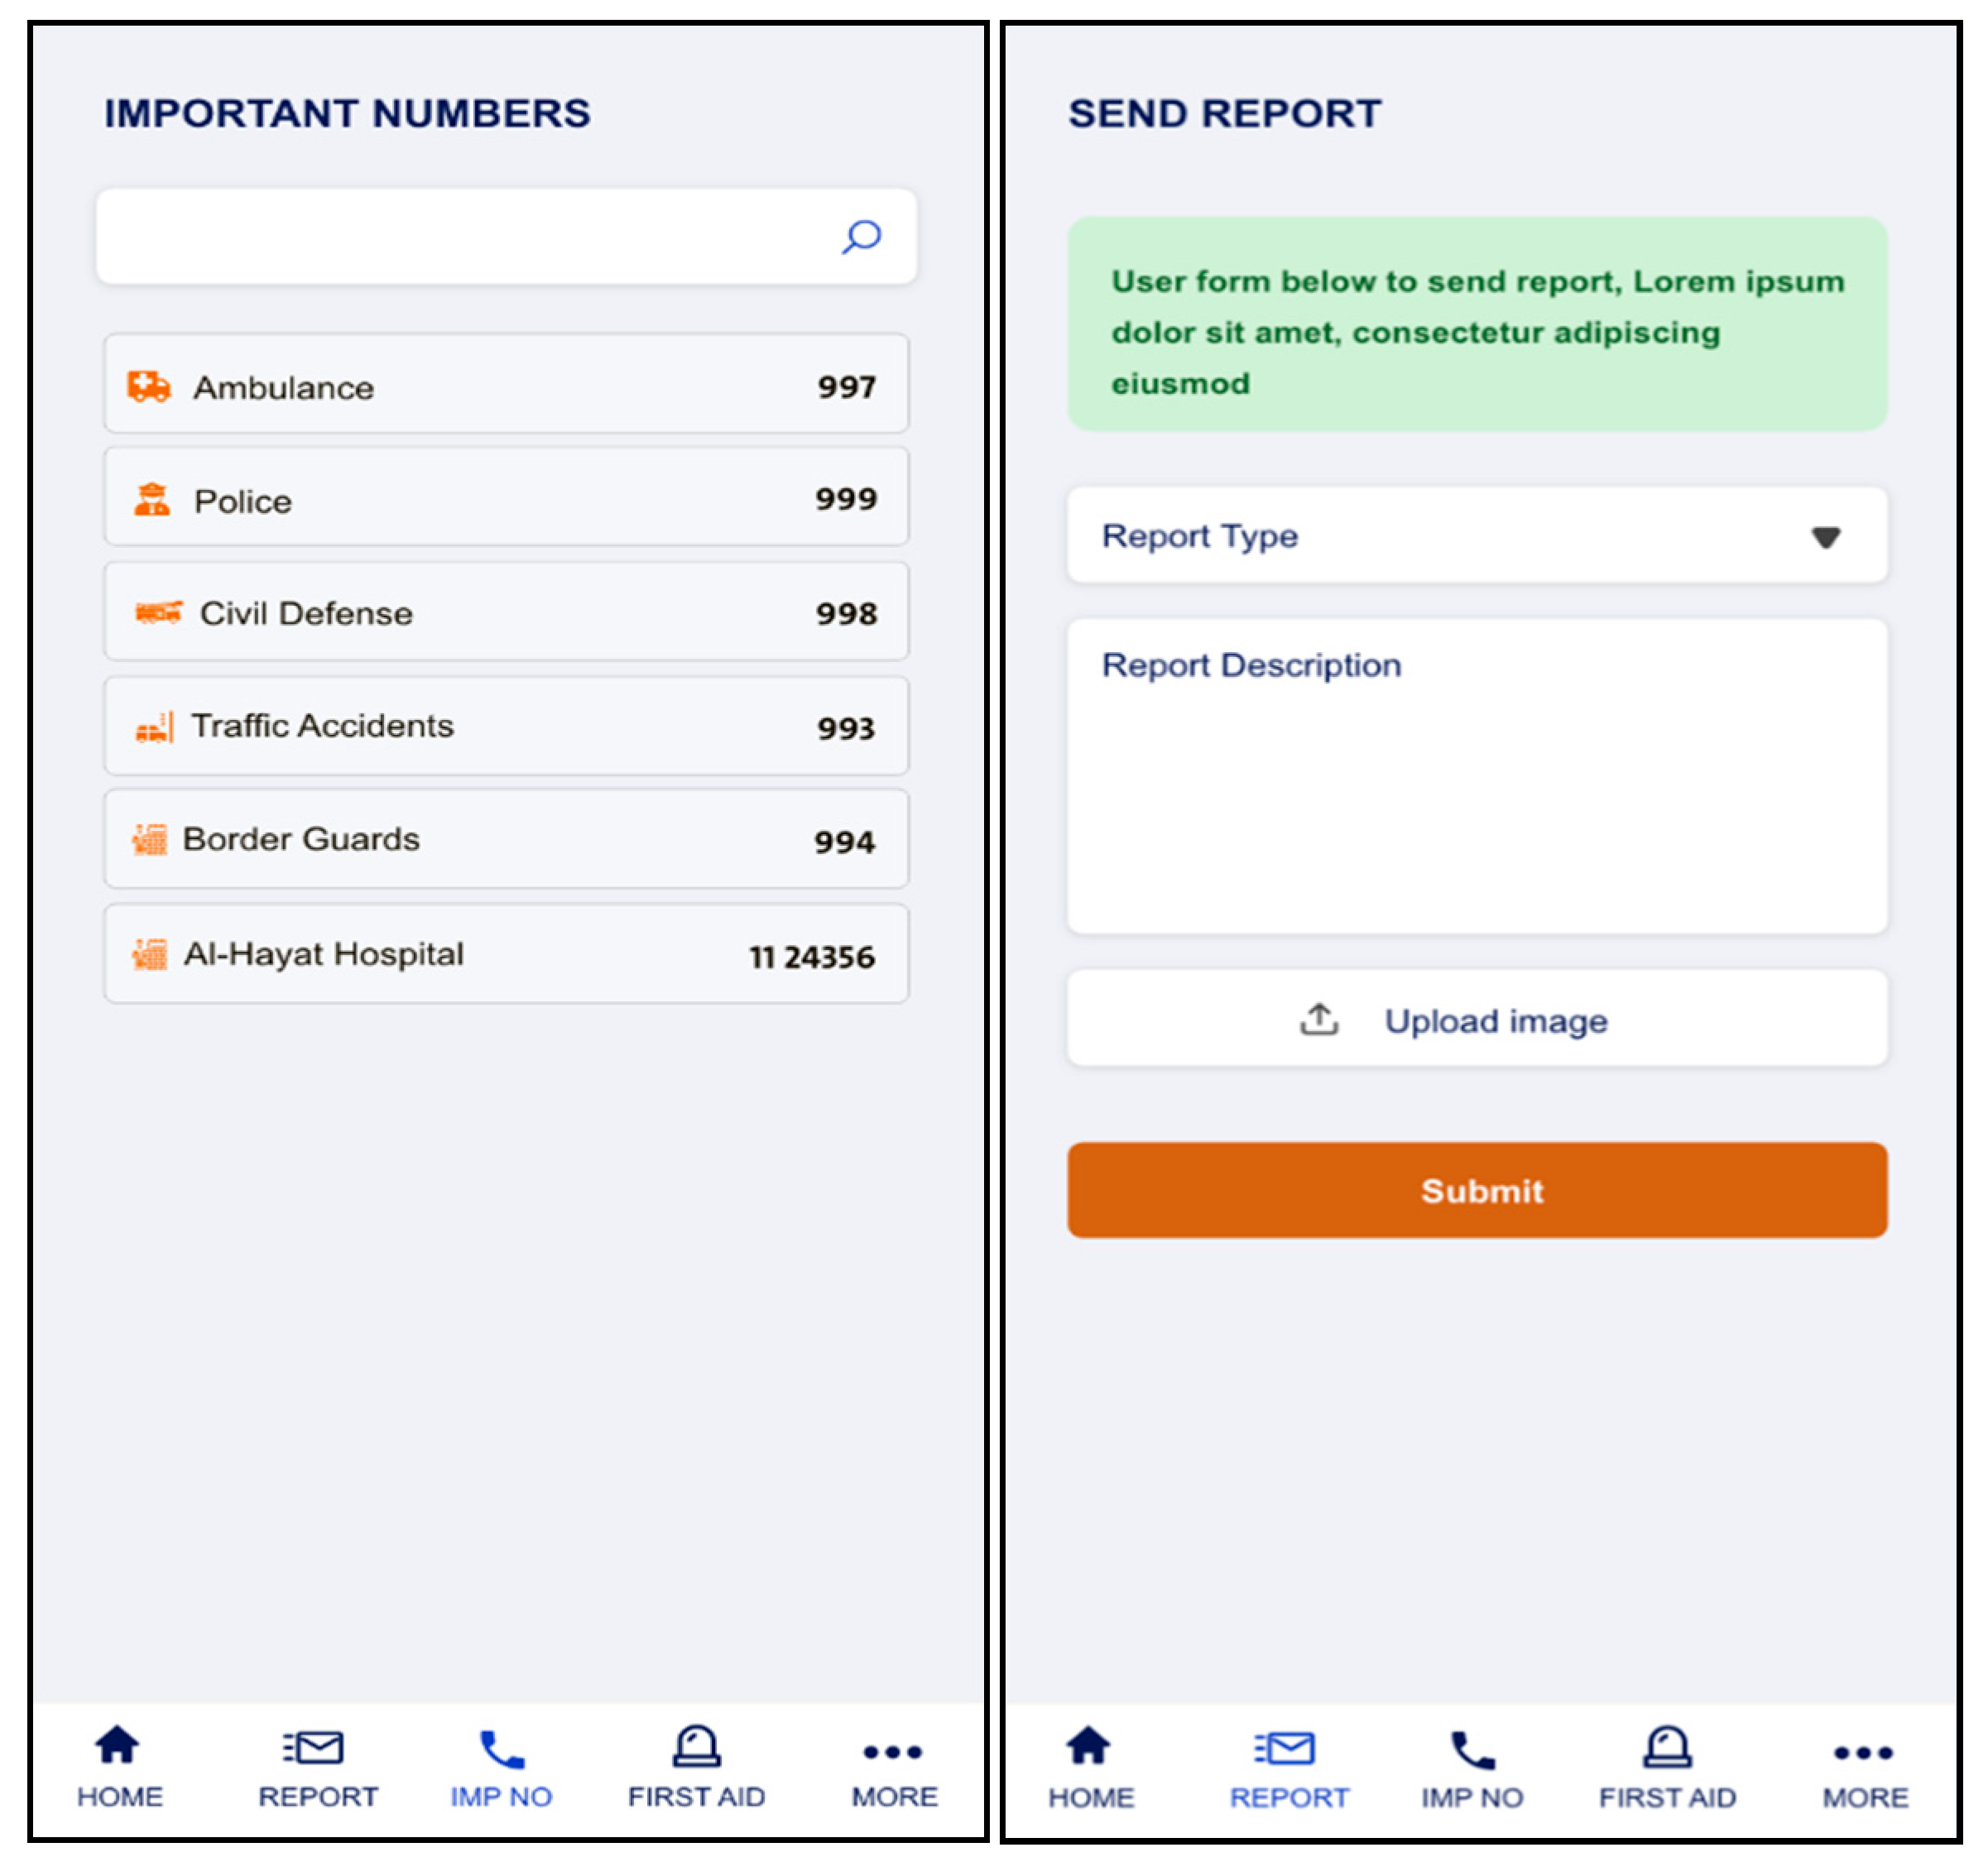
Figure 7 displays the availability of crucial contact information for users to access in urgent situations. This includes direct links to emergency services, like ambulances, civil defense, and traffic management, streamlining swift responses and necessary assistance when required. Moreover, it illustrates the report screen, purposefully designed to streamline data submissions by volunteers and registered users of the application. Volunteers have the option to select the type of disaster, incident, or situation they wish to report. They can provide a detailed description and attach a photo as needed. Additionally, the application automatically includes the location information when forwarding the report to the administration.

4.5. Central Dashboard for Managing Disasters

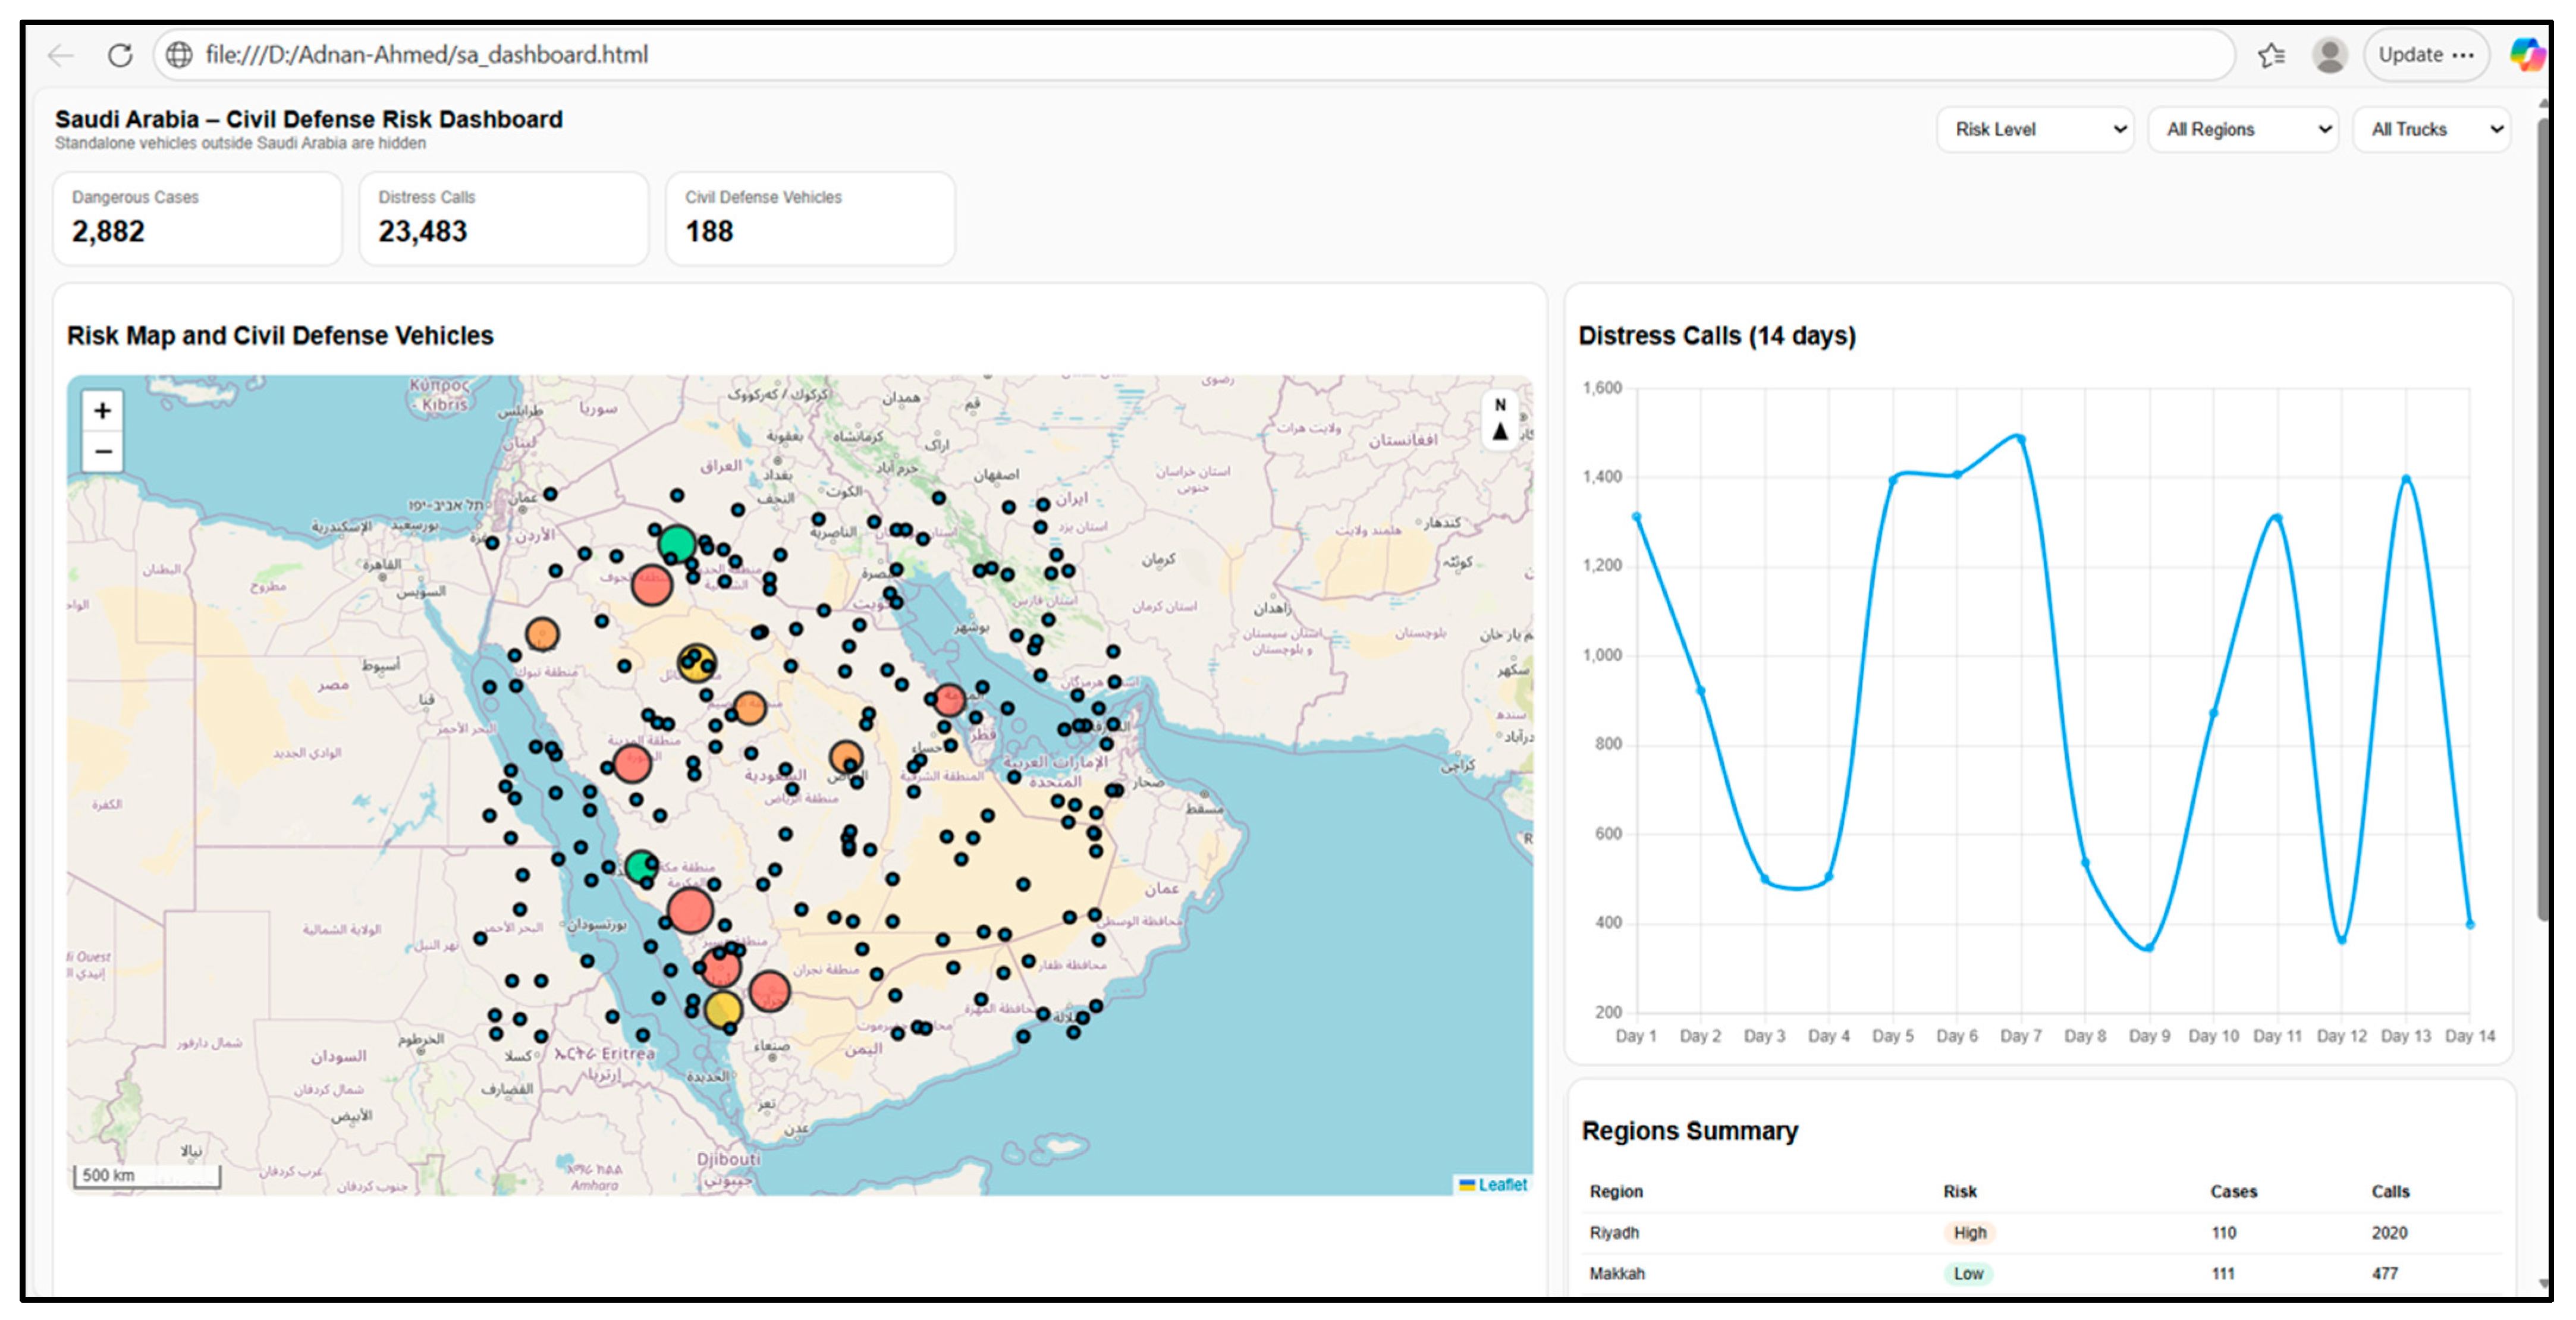
The dashboard is refreshed in real-time based on the results of the ML and LLM-agent algorithms. Figure 8 provides a simple simulated example of a disaster management dashboard that shows areas according to the degree of danger of the threat and the rates of calls for assistance by people. In addition, the dashboard includes a map showing the distribution of ambulances, rescue teams, drones, and roads that are closed due to flooding. The disaster management team can also send instant alert messages and directions to civil defense teams, volunteers, and people in a specific area by simply selecting the area and entering guidance or a message. The proposed smartphone app is connected to both authorities and end-users.

4.6. Discussion About the Fog Layer Implementation in the City of Madinah

Although this research has not yet deployed the proposed framework in practice, the data used in this study were collected from the Jeddah Meteorological Authority and were used to simulate the operations of the fog layer. Furthermore, for a practical application, we contacted the municipality of Madinah to discuss the application of this research idea in a specific area of the City of Madinah, as a Proof of Concept (PoC), where we agreed to use LORA-based gateways as fog nodes, each one covering an area of 5 km radius. In terms of computational capacity, it is not a matter of much concern since this kind of environmental monitoring does not require heavy computation at fog nodes; thus, an average computer with a reasonable processing capability will suffice. The same could be said about latency; the LoRa technology’s affordable latency is acceptable, as it is again an environmental setting where latency is not a stringent constraint [52,53,54].

4.7. Limitations and Discussion

Similar to any solution, there are some challenges that can form the basis for further refinements and future work. The proposed framework also has a few limitations that this work has tried to provide preliminary solutions for; however, there is still a need for further improvements in future work. These limitations are:
  • The collected dataset is geographically and climatologically limited, which may restrict the generalizability of the proposed framework to other regions without retraining. Moreover, flooding patterns, sensor availability, infrastructure resilience, and citizen behavior vary naturally and significantly across regions.
  • To relax this challenge, this work uses a DL model as part of the selected models of the EL process. DL provides fast adaptability to changes. Moreover, the proposed framework includes retraining (“on-demand”) on new collected data in the cloud to enhance the El model.
  • The IoT infrastructure may be vulnerable during severe flooding. The framework mitigates this risk through a multi-layer architecture, sensor redundancy, and integration of crowdsourced data streams as alternative inputs. In addition, we assume the use of waterproof sensors that may be self-powered (e.g., via energy-harvesting platforms [55]) to enable long-term autonomous operations. However, robust communications in disaster cases are an open issue and need new solutions, like satellite connection backup and device-to-device communications, to name a few.
  • The integration of Ensemble Learning, Deep Learning, and LLM-based social data analysis introduces considerable computational complexity. While fog computing is proposed to reduce latency, it still faces scalability and resource consumption costs that increase during large-scale disasters and large-scale datasets. However, compared to a centralized system, a distributed system usually offers greater availability and scalability, but at an additional cost that is warranted when dealing with human life.
Moreover, for resource optimization purposes in the municipality’s tasks and functions, the IoT and sensor layer could serve other use cases and contribute to different solutions for smart city applications, rather than being confined to the flood/disaster problem alone. Moreover, the fog layer is backed up by a cloud computing layer where complex training and model tuning may happen. As a further enhancement, an aggregated fog layer could be introduced between the cloud and the fog layers to assume aggregation of results, with higher computing power than the fog and lower latency as compared to the cloud.
Furthermore, LoRa system infrastructure is currently affordable (a LoRa tower costs between $500 and $1000 US and can cover a region of 1–10 Km2).
The complexity model governing the use of the EL model (involving DL-ANN, RF, and KNN) and LLM at one fog node is expressed as
O E L = O T d + W l + N n = O ( N )
where
  • n: number of features, which is fixed (five features).
  • T: number of trees, which is very small at the fog level.
  • d: level of the tree’s depth, which is small with a low number of features.
  • W: number of weights in each layer, which is fixed after training.
  • l: number of layers, which is one to three hidden layers with a simple ANN.
  • N: In general, it has to be the highest value where the KNN recalculates the distance between a new sample and all stored points.
However, this research uses a simple KNN in which the distance is calculated using only two points (the centers of the threat and normal classes), so the computational complexity is not very demanding for a fog computing node.
Regarding LLM complexity, the model is used without training (for semantic analysis), and, therefore, the complexity would be:
O ( L L M ) = O ( T     w 2 ) = O ( T )
where w is the number of terms in tweets, which is small, i.e., 40–50 words, and T is the number of tweets. Moreover, the tweet analysis is activated only when threat indicators are detected (outside of Algorithm 1 execution). Hence, the total complexity could be expressed as
The O(total) = O(N) + O(T)
which exhibits a linear trend that is acceptable.
  • Another challenge lies in the fact that LLMs with social textual crowdsourcing data analysis are exposed to misinformation, noisy data, sarcasm, multilingual content, or malicious inputs. Consequently, in crisis situations, social media data can be misleading or biased, potentially affecting the accuracy of identifying affected areas.
To mitigate this challenge, our framework is based on a dual use of an IoT-based solution combined with a social data-based analysis.
The main goal of this hybrid solution is to deal with the uncertainty and, sometimes, deceptive nature of social data. Furthermore, the framework provides a dedicated application that enables volunteers to contribute to the monitoring process by sending short messages in addition to using public social data. As a result, this solution guarantees a reduction in data noise and malicious inputs.
Additionally, civil defense officers will be able to examine and identify malicious tweets and bot structures through the dashboard. Reliability is enhanced by averaging tweets (to differentiate between realistic and fake tweets) with a specific confidence threshold. This will reduce the risk of fake tweets, especially since multiple tweets from the same source are ignored.
Finally, it is worth noting that we utilize DL with LLMs to leverage the advantages of semantic language models while avoiding their inherent limitations in the automatic generation process. In addition, fine-tuned prompt engineering with the LLM could be added in the future to further refine LLM responses.
  • The framework was tested using collected datasets, but it was not validated through a full real-time pilot deployment during an actual flooding event. This is a major limitation of the study; however, it is common to use available datasets and apply AI solutions to them when no possible real pilot implementation is cost-wise affordable. Moreover, in our current endeavor, we used a real dataset, for which data were collected for 10 years in the same region with multiple repeated flood cases.
  • In this manuscript, a smartphone application and a centralized control panel are proposed; the study does not include usability testing or user experience evaluation involving citizens, volunteers, or civil defense teams. The effectiveness of notifications depends heavily on clarity, trust, and user responsiveness, which are not empirically assessed. Our study does not include usability testing or user experience evaluation involving citizens, volunteers, or civil defense teams that adversely impact the effectiveness of notifications. Dealing with this issue will be addressed in a future extension of this work.
  • Despite mentioning multiple disaster types in our motivation, the framework is primarily validated for flooding scenarios. Due to limited reliable data and the frequent occurrence of floods in our region in recent years, which are among the most significant natural disasters and threats to the area, this research focuses specifically on floods. However, the proposed framework is general enough to be used for monitoring, detection, and rapid warning of various disasters in the future with different datasets.
  • Since the framework is designed for localized processing at fog nodes and the initial testing was conducted using a city-level dataset, the dataset and validation context are characteristic of urban flooding scenarios. Although this research focused primarily on floods, as they have posed the greatest threat in recent years to residents of several cities in Saudi Arabia, largely due to the lack of drainage systems in many areas of the Kingdom, as rain has been scarce. However, the proposed framework is generic in the sense that it could be used to handle multiple types of threats, such as sandstorms, heat waves common to the region, and public health issues.
  • The area-specific risk threshold definition is a key aspect of the framework. In this work, the threshold values were determined based on the dataset and local context. In addition, the work relied on the experience of professionals working in civil defense, municipal authorities, and meteorological departments. Their practical knowledge, combined with historical records of past flood events across different areas, will play an important role in setting appropriate risk levels during the real implementation phase.
In particular, lower thresholds will be assigned to areas that have experienced more severe damage during recent floods, as well as to zones with specific topographical characteristics (elevation, rainfall intensity, land use, flow accumulation, slope, and the lag time of the watershed). This will increase sensitivity in high-risk locations.
Finally, to introduce flexibility and adaptability, we proposed the use of a Moving Average Window as a simple and efficient mechanism to allow tuning the dynamic adjustment of risk levels based on new data. However, self-adaptive threshold tuning was not implemented in the current work according to the limitations of the available dataset. Future work will focus on developing more advanced dynamic calibration methods that automatically adjust thresholds based on real-time data patterns and additional inputs.
  • A remaining challenge concerns the diversity of regional dialects and colloquial expressions commonly found in emergency-related social media posts. Although the use of LLMs helps address part of this issue, dialect variation (especially in low-resource languages) still requires further research. This issue needs to be addressed further in future work.
  • The stability and robustness of the unsupervised LLM component remain important considerations for future work, particularly in ensuring reliable, accountable, and ethically sound automated decision-making in critical emergency management systems. Although this represents an ongoing research challenge, several measures were adopted in the current framework to enhance robustness. These include integrating IoT sensor data with social media inputs to provide cross-validation, employing multiple models within an ensemble to strengthen decision reliability, and also coupling the LLM with Deep Learning to limit the hallucination effects of the LLM while leveraging its semantic understanding capabilities. Further improvements have to focus on strengthening validation mechanisms and governance safeguards.

5. Conclusions

This work introduces a comprehensive framework for managing disasters, with a particular focus on floods, emphasizing early detection. The framework proposes an efficient location and context-aware alert management system. The framework utilizes two sources of data, IoT-systems collected data and crowdsourced data, to manage floods before, during, and after their occurrence. We proposed two algorithms based on Ensemble Learning (EL) and LLMs to classify IoT-related data and textual data into either a genuine threat (for IoT data) or not, and an emergency call or not (for crowdsourced data). Moreover, the fog computing architecture was proposed to facilitate the provision of real-time notifications that are compatible with the spatial context and threat level. Furthermore, we proposed the design of a dedicated smartphone application with various essential services to assist in the collection of textual data (that is, crowdsourced from users and volunteers). The testing of the proposed EL algorithm on a real dataset achieved an impressive accuracy rate of 98%, while the LLM-DL algorithm achieved more than 99% accuracy for textual data.
Finally, the following points may be directions for future work:
  • Consider incorporating drone deployment during disaster scenarios for monitoring using image analysis algorithms specifically designed to process data captured by these drones or by surveillance cameras located in specific locations. Moreover, including satellite imagery processing can provide another important source of information in difficult accessibility cases.
  • Addressing privacy concerns associated with crowdsourcing and smartphone privacy and security measures will also be a key area of focus.
  • One other application of our framework is to apply it to monitor and proactively detect risks of infections caused by prolonged stagnation of water in ponds, leading to diseases such as dengue fever. This is being addressed in collaborative work with the Municipality of Medina to implement the proposed management model, practically on the ground, in a real scenario.

Author Contributions

Conceptualization, A.A.A.S., A.B.M., O.T., N.M.B. and A.B.A.; methodology, A.A.A.S., A.B.M. and N.M.B.; software, A.A.A.S., O.T., N.M.B. and A.B.A.; validation, A.A.A.S., A.B.M., F.H.A., O.T., N.M.B. and A.B.A.; formal analysis, A.A.A.S., A.B.M., F.H.A., O.T., N.M.B. and A.B.A.; investigation, A.A.A.S., A.B.M., O.T., N.M.B. and A.B.A.; resources, A.A.A.S., O.T. and A.B.A.; data curation, A.A.A.S.; writing—original draft preparation, A.A.A.S., A.B.M., O.T., N.M.B. and A.B.A.; writing—review and editing, A.A.A.S., A.B.M., F.H.A., O.T., N.M.B. and A.B.A.; visualization, A.A.A.S., A.B.M., O.T., N.M.B. and A.B.A.; supervision, A.A.A.S.; project administration, A.A.A.S.; funding acquisition, O.T. All authors have read and agreed to the published version of the manuscript.

Funding

This paper is derived from a research grant funded by the Research, Development and Innovation Authority (RDIA)–Kingdom of Saudi Arabia–with grant number (13465-upm-2023-upm-R-3-1-EF-) as well as the Osamah AlSayyed research center fund award.

Data Availability Statement

The datasets generated and analyzed during the current study are available in the [GitHub] repository, [https://github.com/adnanmnm/Flood-Dataset], available online as of 28 February 2026.

Conflicts of Interest

The authors declare no conflicts of interest.

References

  1. Tuzyak, Y.M.; Tuzyak, O. Risk management and advanced systems for observing, monitoring and forecasting natural disasters and events. In Third EAGE Workshop on Assessment of Landslide Hazards and Impact on Communities; European Association of Geoscientists & Engineers: Bunnik/Houten, The Netherlands, 2021; Volume 2021, pp. 1–5. [Google Scholar]
  2. Tomar, P.; Singh, S.K.; Kanga, S.; Meraj, G.; Kranjčić, N.; Đurin, B.; Pattanaik, A. GIS-based urban flood risk assessment and management—A case study of Delhi National Capital Territory (NCT), India. Sustainability 2021, 13, 12850. [Google Scholar] [CrossRef] [Scilit]
  3. Luu, C.; Tran, H.X.; Pham, B.T.; Al-Ansari, N.; Tran, T.Q.; Duong, N.Q.; Dao, N.H.; Nguyen, L.P.; Nguyen, H.D.; Thu Ta, H.; et al. Framework of spatial flood risk assessment for a case study in Quang Binh province, Vietnam. Sustainability 2020, 12, 3058. [Google Scholar] [CrossRef] [Scilit]
  4. Christian Aid. Counting the Cost 2020: A Year of Climate Breakdown. December 2020. Available online: https://www.christianaid.org.uk/sites/default/files/2022-12/counting-the-cost-2022.pdf (accessed on 28 February 2026).
  5. Xu, H.; Wei, W.; Qi, Y.; Qi, S. Blockchain-Based Crowdsourcing Makes Training Dataset of Machine Learning No Longer Be in Short Supply. Wirel. Commun. Mob. Comput. 2022, 2022, 7033626. [Google Scholar] [CrossRef] [Scilit]
  6. Le, T.; Ngoc, T. Floods and household welfare: Evidence from Southeast Asia. Econ. Disasters Clim. Chang. 2020, 4, 145–170. [Google Scholar] [CrossRef] [Scilit]
  7. Plazas, J.E.; Bimonte, S.; Schneider, M.; De Vaulx, C.; Battistoni, P.; Sebillo, M.; Corrales, J.C. Sense, Transform & Send for the Internet of Things (STS4IoT): UML profile for data-centric IoT applications. Data Knowl. Eng. 2022, 139, 101971. [Google Scholar]
  8. Aljohani, F.H.; Alkhodre, A.B.; Sen, A.A.A.; Ramazan, M.S.; Alzahrani, B.; Siddiqui, M.S. Flood Prediction using Hydrologic and ML-based Modeling: A Systematic Review. Int. J. Adv. Comput. Sci. Appl. 2023, 14, 538–551. [Google Scholar] [CrossRef] [Scilit]
  9. Hu, H.; Yang, H.; Wen, J.; Zhang, M.; Wu, Y. An Integrated Model of Pluvial Flood Risk and Adaptation Measure Evaluation in Shanghai City. Water 2023, 15, 602. [Google Scholar] [CrossRef] [Scilit]
  10. Gulati, K.; Boddu, R.S.K.; Kapila, D.; Bangare, S.L.; Chandnani, N.; Saravanan, G. A review paper on wireless sensor network techniques in Internet of Things (IoT). Mater. Today Proc. 2022, 51, 161–165. [Google Scholar] [CrossRef] [Scilit]
  11. Tan, W.; Sidhu, M.S. Review of RFID and IoT integration in supply chain management. Oper. Res. Perspect. 2022, 9, 100229. [Google Scholar] [CrossRef] [Scilit]
  12. Tayan, O. Context-Aware Framework for Enhanced Smart Urban Pollution Monitoring and Control. In 2022 International Conference on Emerging Trends in Computing and Engineering Applications (ETCEA); IEEE: New York, NY, USA, 2022; pp. 1–5. [Google Scholar]
  13. Esparza, M.; Farahmand, H.; Brody, S.; Mostafavi, A. Examining data imbalance in crowdsourced reports for improving flash flood situational awareness. Int. J. Disaster Risk Reduct. 2023, 95, 103825. [Google Scholar] [CrossRef] [Scilit]
  14. Tashtoush, Y.; Alrababah, B.; Darwish, O.; Maabreh, M.; Alsaedi, N. A deep learning framework for detection of COVID-19 fake news on social media platforms. Data 2022, 7, 65. [Google Scholar] [CrossRef] [Scilit]
  15. Jaradat, S.; Nayak, R.; Paz, A.; Ashqar, H.I.; Elhenawy, M. Multitask learning for crash analysis: A Fine-Tuned LLM framework using Twitter data. Smart Cities 2024, 7, 2422–2465. [Google Scholar] [CrossRef] [Scilit]
  16. Heaton, D.; Nichele, E.; Clos, J.; Fischer, J.E. “ChatGPT says no”: Agency, trust, and blame in Twitter discourses after the launch of ChatGPT. AI Ethics 2025, 5, 653–675. [Google Scholar]
  17. Donkers, T.; Ziegler, J. Understanding Online Polarization Through Human-Agent Interaction in a Synthetic LLM-Based Social Network. In Proceedings of the International AAAI Conference on Web and Social Media, Copenhagen, Denmark, 23–26 June 2025; Volume 19, pp. 457–478. [Google Scholar]
  18. Ghali, M.K.; Farrag, A.; Lam, S.; Won, D. BEYONDWORDS is All You Need: Agentic Generative AI based Social Media Themes Extractor. arXiv 2025, arXiv:2503.01880. [Google Scholar]
  19. Kumar, V.; Sharma, K.V.; Caloiero, T.; Mehta, D.J.; Singh, K. Comprehensive Overview of Flood Modeling Approaches: A Review of Recent Advances. Hydrology 2023, 10, 141. [Google Scholar] [CrossRef] [Scilit]
  20. Hosseiny, H.; Nazari, F.; Smith, V.; Nataraj, C. A framework for modeling flood depth using a hybrid of hydraulics and machine learning. Sci. Rep. 2020, 10, 8222. [Google Scholar] [CrossRef] [Scilit]
  21. Cai, S.; Fan, J.; Yang, W. Flooding risk assessment and analysis based on gis and the tfn-ahp method: A case study of chongqing, china. Atmosphere 2021, 12, 623. [Google Scholar] [CrossRef] [Scilit]
  22. Adeel, A.; Gogate, M.; Farooq, S.; Ieracitano, C.; Dashtipour, K.; Larijani, H.; Hussain, A. A survey on the role of wireless sensor networks and IoT in disaster management. Geol. Disaster Monit. Based Sens. Netw. 2018, 3, 57–66. [Google Scholar]
  23. Baky, M.A.A.; Islam, M.; Paul, S. Flood hazard, vulnerability and risk assessment for different land use classes using a flow model. Earth Syst. Environ. 2020, 4, 225–244. [Google Scholar] [CrossRef] [Scilit]
  24. Abdelkarim, A.; Gaber, A.F. Flood risk assessment of the wadi nu’man basin, mecca, Saudi Arabia (during the period, 1988–2019) based on the integration of geomatics and hydraulic modeling: A case study. Water 2019, 11, 1887. [Google Scholar] [CrossRef] [Scilit]
  25. Ghile, H.; Shirakawa, H.; Tanikawa, H. Application of GIS and machine learning to predict flood areas in Nigeria. Sustainability 2022, 14, 5039. [Google Scholar] [CrossRef] [Scilit]
  26. Daoudi, M.; Niang, A.J. Flood risk and vulnerability of jeddah city, saudi arabia. In Recent Advances in Flood Risk Management; IntechOpen: London, UK, 2019; pp. 634–654. [Google Scholar]
  27. Ullah, K.; Zhang, J. Gis-based flood hazard mapping using relative frequency ratio method: A case study of panjkora river basin, eastern hindu kush, Pakistan. PLoS ONE 2020, 15, e0229153. [Google Scholar] [CrossRef] [Scilit]
  28. Aljohani, H.; Sen, A.A.A.; Ramazan, M.S.; Alzahrani, B.; Bahbouh, N.M. A Smart Framework for Managing Natu-ral Disasters Based on the IoT and ML. Appl. Sci. 2023, 13, 3888. [Google Scholar] [CrossRef] [Scilit]
  29. Ke, Q.; Tian, X.; Bricker, J.; Tian, Z.; Guan, G.; Cai, H.; Huang, X.; Yang, H.; Liu, J. Urban pluvial flooding prediction by machine learning approaches—A case study of Shenzhen city, China. Adv. Water Resour. 2020, 145, 103719. [Google Scholar] [CrossRef] [Scilit]
  30. Arabameri, A.; Saha, S.; Mukherjee, K.; Blaschke, T.; Chen, W.; Ngo, P.T.T.; Band, S.S. Modeling spatial flood using novel ensemble artificial intelligence approaches in northern Iran. Remote Sens. 2020, 12, 3423. [Google Scholar] [CrossRef] [Scilit]
  31. Karimiziarani, M.; Jafarzadegan, K.; Abbaszadeh, P.; Shao, W.; Moradkhani, H. Hazard risk awareness and disaster management: Extracting the information content of twitter data. Sustain. Cities Soc. 2022, 77, 103577. [Google Scholar] [CrossRef] [Scilit]
  32. Bryan-Smith, L.; Godsall, J.; George, F.; Egode, K.; Dethlefs, N.; Parsons, D. Real-time social media sentiment analysis for rapid impact assessment of floods. Comput. Geosci. 2023, 178, 105405. [Google Scholar] [CrossRef] [Scilit]
  33. Yuan, F.; Fan, C.; Farahmand, H.; Coleman, N.; Esmalian, A.; Lee, C.-C.; Patrascu, F.I.; Zhang, C.; Dong, S.; Mostafavi, A. Smart flood resilience: Har-nessing community-scale big data for predictive flood risk monitoring, rapid impact assessment, and situational awareness. Environ. Res. Infrastruct. Sustain. 2022, 2, 025006. [Google Scholar] [CrossRef] [Scilit]
  34. Singh, J.P.; Dwivedi, Y.K.; Rana, N.P.; Kumar, A.; Kapoor, K.K. Event classification and location prediction from tweets during disasters. Ann. Oper. Res. 2019, 283, 737–757. [Google Scholar] [CrossRef] [Scilit]
  35. Jongman, B.; Wagemaker, J.; Romero, B.R.; de Perez, E.C. Early flood detection for rapid humanitarian response: Harnessing near real-time satellite and Twitter signals. ISPRS Int. J. Geo-Inf. 2015, 4, 2246–2266. [Google Scholar] [CrossRef] [Scilit]
  36. Kanth, K.; Chitra, P.; Sowmya, G.G. Deep learning-based assessment of flood severity using social media streams. Stoch. Environ. Res. Risk Assess. 2022, 36, 473–493. [Google Scholar] [CrossRef] [Scilit]
  37. Liu, X.; Kar, B.; Ishino, F.A.M.; Zhang, C.; Williams, F. Assessing the reliability of relevant tweets and validation using manual and automatic approaches for flood risk communication. ISPRS Int. J. Geo-Inf. 2020, 9, 532. [Google Scholar] [CrossRef] [Scilit]
  38. Cicek, D.; Kantarci, B. Use of Mobile Crowdsensing in Disaster Management: A Systematic Review, Challenges, and Open Issues. Sensors 2023, 23, 1699. [Google Scholar] [CrossRef] [Scilit] [PubMed]
  39. Tripathy, S.S.; Chaudhuri, S.; Murtugudde, R.; Mhatre, V.; Parmar, D.; Pinto, M.; Zope, P.E.; Dixit, V.; Karmakar, S.; Ghosh, S. Analysis of Mumbai Floods in recent Years with Crowdsourced Data. arXiv 2023, arXiv:2306.09770. [Google Scholar] [CrossRef] [Scilit]
  40. Podhoranyi, M. A comprehensive social media data processing and analytics architecture by using big data platforms: A case study of twitter flood-risk messages. Earth Sci. Inform. 2021, 14, 913–929. [Google Scholar] [CrossRef] [Scilit] [PubMed]
  41. Alabbas, W. Classification of colloquial Arabic tweets in real-time to detect high-risk floods. In Proceedings of the 2017 International Conference On Social Media, Wearable and Web Analytics (Social Media), London, UK, 19–20 June 2017. [Google Scholar]
  42. Kankanamge, N.; Yigitcanlar, T.; Goonetilleke, A.; Kamruzzaman, M. Determining disaster severity through social media analysis: Testing the methodology with Southeast Queensland Flood tweets. Int. J. Disaster Risk Reduct. 2020, 42, 101360. [Google Scholar] [CrossRef] [Scilit]
  43. Kumar, A.; Singh, J.P.; Rana, N.P.; Dwivedi, Y.K. Multi-Channel Convolutional Neural Network for the Identification of Eyewitness Tweets of Disaster. Inf. Syst. Front. 2022, 25, 1589–1604. [Google Scholar] [CrossRef] [Scilit]
  44. Young, J.; Arthur, R.; Spruce, M.; Williams, H.T. Social sensing of flood impacts in India: A case study of Kerala 2018. Int. J. Disaster Risk Reduct. 2022, 74, 102908. [Google Scholar] [CrossRef] [Scilit]
  45. Caballero, A.; Centeno, R.; Rodrigo, Á. LLM-Based Multi-Agent Models for Multiclass Classification of Strategic Narratives. In Proceedings of the IberLEF 2024, Valladolid, Spain, 24 September 2024. [Google Scholar]
  46. Linardos, V.; Drakaki, M.; Tzionas, P. Utilizing LLMs and ML Algorithms in Disaster-Related Social Media Content. GeoHazards 2025, 6, 33. [Google Scholar] [CrossRef] [Scilit]
  47. Sen, A.A.; Yamin, M. Advantages of using fog in IoT applications. Int. J. Inf. Technol. 2021, 13, 829–837. [Google Scholar] [CrossRef] [Scilit]
  48. Hamoui, B.; Mars, M.; Almotairi, K. FloDusTA: Saudi tweets dataset for flood, dust storm, and traffic accident events. In Proceedings of the Twelfth Language Resources and Evaluation Conference, Marseille, France, 11–16 May 2020; pp. 1391–1396. Available online: https://aclanthology.org/2020.lrec-1.174/ (accessed on 28 February 2026).
  49. Lawal, Z.K.; Yassin, H.; Zakari, R.Y. Flood prediction using machine learning models: A case study of kebbi state Nigeria. In 2021 IEEE Asia-Pacific Conference on Computer Science and Data Engineering (CSDE); IEEE: New York, NY, USA, 2021; pp. 1–6. [Google Scholar]
  50. Sankaranarayanan, S.; Prabhakar, M.; Satish, S.; Jain, P.; Ramprasad, A.; Krishnan, A. Flood prediction based on weather parameters using deep learning. J. Water Clim. Change 2020, 11, 1766–1783. [Google Scholar]
  51. Yeasmin, N.; Mahbub, N.I.; Baowaly, M.K.; Singh, B.C.; Alom, Z.; Aung, Z.; Azim, M.A. Analysis and prediction of user sentiment on COVID-19 pandemic using tweets. Big Data Cogn. Comput. 2022, 6, 65. [Google Scholar] [CrossRef] [Scilit]
  52. Lv, L.; Wu, Z.; Zhang, J.; Zhang, L.; Tan, Z.; Tian, Z. A VMD and LSTM based hybrid model of load forecasting for power grid security. IEEE Trans. Ind. Inform. 2021, 18, 6474–6482. [Google Scholar] [CrossRef] [Scilit]
  53. Lv, L.; Wu, Z.; Zhang, L.; Gupta, B.B.; Tian, Z. An edge-AI based forecasting approach for improving smart microgrid efficiency. IEEE Trans. Ind. Inform. 2022, 18, 7946–7954. [Google Scholar] [CrossRef] [Scilit]
  54. Gia, T.N.; Queralta, J.P.; Westerlund, T. Exploiting LoRa, edge, and fog computing for traffic monitoring in smart cities. In LPWAN Technologies for IoT and M2M Applications; Academic Press: Cambridge, MA, USA, 2020; pp. 347–371. [Google Scholar]
  55. Crescini, D.; Touati, F.; Crescini, P.; Legena, C.; Galli, A.; Mnaouer, A.B. Multi-Parametric Environmental Diagnostics and Monitoring Sensor Node. U.S. Patent No. 10,429,367, 1 October 2019. [Google Scholar]
Figure 1. Jeddah’s disaster after flooding in 2023.
Geohazards 07 00035 g001
Figure 2. General view of the context-aware classification framework.
Geohazards 07 00035 g002
Figure 3. Proposed model and its main components.
Geohazards 07 00035 g003
Figure 4. Results of testing the proposed EL-classification algorithm.
Geohazards 07 00035 g004
Figure 5. Confusion matrix and comparison between LLM results and traditional TM.
Geohazards 07 00035 g005
Figure 6. Home screen and notification screen (mockups).
Geohazards 07 00035 g006
Figure 7. Important number screen and send report screen (volunteer mockups).
Geohazards 07 00035 g007
Figure 8. Demo of the proposed dashboard.
Geohazards 07 00035 g008
Table 1. Summary of flooding management methods.
Ref.MethodologyObjectiveSmartPhysical
[21]GIS spatial statistics Assess and analyze flooding risk in Chongqing, ChinaNoYes
[22]WSNs with IoTInvestigate the roles of IoT and WSNs in disaster management
[23]GIS and hydraulic Study flood risk for different land uses in Surma, BangladeshYesNo
[24]Hydrological modelingIdentify flood-prone urban areas
[25]ANN and LRDemonstrate that machine learning techniques can be used to accurately map and predict flood-prone areas and to develop flood mitigation plans and policiesNoYes
[26]Spatial analysisIdentify and map the city of Jeddah’s flood zones to minimize their susceptibility and include them in flood risk prevention and mitigation methodsNoYes
[27]RFR modelIdentify high-risk areasYesNo
[28]IoT and ML modelsDetermine the level of risk in each area of a cityNoYes
[29]ML modelsUse ML models to predict the occurrence of urban pluvial floodingNoYes
Table 2. Summary of using text analysis for flooding management.
Ref.ObjectivesModelResultsLimitations
[34]Use an automatic tweet parsing system, effectively use social media in locating users asking for help during a disasterMarkov modelDevelop a TM algorithm to detect flood-related tweets in English and Hindi, as well as classify these tweets into high and low priority to identify those that require attention.Some tweets are misclassified by the proposed system and can be studied by researchers to determine the reasons for such misclassification.
[40]Describe the flood alert situation using only tweet messages and investigate if the informative potential of such data is also demonstratedNaïve BayesTwitter messages contain valuable flood spatial information, according to text analysis techniques.Because of the complexity of some language structures, which contain many special characters, some languages will be difficult to implement in such an environment.
[41]Investigate accurate classification for short, informal (colloquial) Arabic tweetsR tool with SVMUsing colloquial Arabic text as a dataset, investigated a variety of text classification techniques.There is a reliability issue because it relies on only one model with low accuracy and a small dataset.
[42]Present the findings of an analysis using an innovative methodology and use the 2010–2011 Southeast Queensland Floods as a case study to demonstrate how disaster severity can be assessed using tweetsDecision treeThe research presented contributes to a better understanding of the systematic use of volunteer crowdsourced data to improve disaster management practices.The inequality of geo-located tweets is a critical constraint.
[43]Build a model to categorize tweets to better organize rescue and relief operations and save livesNeural Network The paper compares several conventional machines and Deep Learning techniques.For the classification task, only English-language tweets were used, whereas during disasters, users posted in their regional languages.
[44]Make a map that characterizes the social impacts of the major flood event in Kerala in 2018Manual inspectionFlood impact maps derived from Telegram and Twitter.On Twitter, relevant data is mixed in with larger amounts of irrelevant data, which means the data needs more filtering steps.
[45]Use LLM-based multi-agent models for multiclassification of tweetsLLM Better results of classification compared to traditional LM models.Stability of performance and responsibility of autoclassification.
[46]Utilize LLMs and ML to classify social media of disastersLLM + MLDetect the type of threat and its severity, with additional information reducing the time needed for tagging training data.Depend only on textual and multi-topic data.
Table 3. Comparison results.
Features of the DatasetML Model Accuracy %Dataset
Size
County
The Selected Models for Our Ensample Learning (KNN, RF, DL)
Ref.Month (No.)TempWind SpeedRain (mm)SVMKNNRFLRDTDLNaïve BayesDNNSCV
[49]NONONOYesNONONO85.757.1NONONO28.5712,053Nigeria
[50]YesYesNOYes85.687.73NONONONO85.7391.18NO3120India
OurYesYesYesYes98.999.299.695.899.399.1NONONO3654KSA
Disclaimer/Publisher’s Note: The statements, opinions and data contained in all publications are solely those of the individual author(s) and contributor(s) and not of MDPI and/or the editor(s). MDPI and/or the editor(s) disclaim responsibility for any injury to people or property resulting from any ideas, methods, instructions or products referred to in the content.