Abstract
The disposal of wastewater resulting from petroleum industries presents a major environmental challenge due to the presence of hard-to-degrade organic pollutants, such as oils and hydrocarbons, and high chemical oxygen demand (COD). In this study, an efficient and eco-friendly method was developed to treat such wastewater using a photocatalyst composed of biochar derived from pistachio shells and loaded with zinc oxide (ZnO) nanoparticles. The biochar-ZnO composite was prepared via a co-precipitation-assisted pyrolysis method to evaluate its efficiency in the photocatalytic degradation of petroleum wastewater (PW). The synthesized material was characterized using various techniques, including scanning electron microscopy (SEM), X-ray diffraction (XRD), and Fourier transform infrared (FTIR) spectroscopy, to determine surface morphology, crystal structure, and functional groups present on the catalyst surface. Photocatalytic degradation experiments were conducted under UV and sunlight for 90 h of irradiation to evaluate the performance of the proposed system in removing oil and reducing COD levels. Key operational parameters, such as pH (2–10), catalyst dosage (0–0.1) g/50 mL, and oil and COD concentrations (50–500) ppm and (125–1252) ppm, were optimized by response surface methodology (RSM) to obtain the maximum oil and COD removal efficiency. The oil and COD were removed from PW (90.20% and 88.80%) at 0.1 g/50 mL of PS/ZnO, a pH of 2, and 50 ppm oil concentration (125 ppm of COD concentration) under UV light. The results show that pollutant removal is slightly better when using sunlight (80.00% oil removal, 78.28% COD removal) than when using four lamps of UV light (77.50% oil removal, 75.52% COD removal) at 0.055 g/50 mL of PS/ZnO, a pH of 6.8, and 100 ppm of oil concentration (290 ppm of COD concentration). The degradation rates of the PS/ZnO supported a pseudo-first-order kinetic model with R2 values of 0.9960 and 0.9922 for oil and COD. This work indicates the potential use of agricultural waste, such as pistachio shells, as a sustainable source for producing effective catalysts for industrial wastewater treatment, opening broad prospects in the field of green and nanotechnology-based environmental solutions in the development of eco-friendly and effective wastewater treatment technologies under solar light.
1. Introduction
Petroleum wastewater is the largest source of wastewater generated by the petroleum industry during oil and gas field exploration and production. It contains various hydrocarbons in free, dispersed, and dissolved forms. Produced water holds a complex mixture of compounds, including organic and inorganic substances, such as grease, dissolved and dispersed oil, formation solids, heavy metals, waxes, radionuclides, dissolved oxygen, treating chemicals, dissolved gases, salts, and microorganisms [1,2,3].
Each day, gas and oil fields generate 250 million barrels of water, with over 40% of it being released into the environment worldwide. This wastewater discharge can cause significant pollution of surface water, soil, and underground sources, and a risk arises if it discharges to the environment without treatment. Various technologies are employed for the purification of petroleum wastewater [4,5] and can be divided into biological, chemical, or physical methods. Suitable technologies for eliminating environmental pollution include photocatalytic oxidation, adsorption, filtration, chemical oxidation, electrochemical oxidation, coagulation, and membrane separation [6,7].
Photocatalytic oxidation is considered one of the most promising methods for removing organic pollutants from petroleum wastewater due to its simplicity, lack of secondary pollution, and strong oxidation–reduction capabilities [8]. Various photocatalysts, including semiconductors (e.g., ZnO and TiO2), have been widely applied in the photocatalytic processes. However, these materials suffer from rapid electron/hole recombination and high charge transfer resistance, decreasing the solar absorption efficiency and restricting the generation of photodegradation radicals [9,10]. One of the key solutions to enhance the visible light response and redox properties of the photocatalyst is to introduce biochar [11]. Biochar is a carbon-rich material synthesized by the pyrolysis of biomass under limited or absent oxygen [12]. The precursors of producing biochar are derived from several sources, such as plant and food wastes from animal and poultry sources, as well as industrial and sewage sludge wastes [13,14]. Biochar-based photocatalysts have emerged as an effective way for enhancing the photodegradation of organic pollutants due to the unique properties of biochar, such as a porous network, abundant functional groups, high surface area, and favorable photoelectric features [15,16]. ZnO has a wide bandgap (~3.2 eV), which means it primarily absorbs UV light (wavelengths < 387 nm), which only constitutes about 4–5% of solar radiation. When biochar is coupled with ZnO, it can narrow the effective bandgap or create mid-gap states, enabling ZnO to absorb visible light more effectively. This occurs due to the interaction between the conjugated structures of biochar and the ZnO conduction band. ZnO has a relatively low surface area and poor affinity for organic pollutants, especially hydrophobic substances like oils, limiting its efficiency in wastewater treatment. Bare ZnO nanoparticles tend to aggregate in aqueous solutions, which decreases their active surface area and catalytic efficiency [16]. Pure ZnO suffers from photocorrosion, UV-only activity, high recombination rates, and limited surface interaction with pollutants, making it suboptimal for effective COD and oil removal unless modified or supported. Biochar enhances ZnO photocatalysis by expanding light absorption into the visible range, improving charge separation, increasing pollutant adsorption, and stabilizing the catalyst structure [17]. Sanei et al. [18] prepared reduced graphene oxide (r-GO) from basil seeds for the synthesis of a novel photocatalyst composed of r-GO/α-Fe2O3/ZnO for the degradation of the antibiotic oxytetracycline (OTC) in wastewater. The highest efficiency removal of OTC under visible light was achieved at 98% at 90 min. Gonçalves et al. [19] prepared biochar derived from spent coffee grounds (COFFs) and chitosan (CTO) as carbon sources to enhance the photocatalytic performance of ZnO for water treatment. The highest removal rates for 5-methylbenzotriazole were> 99%, carbamazepine was 70%, bisphenol A was 70%, and ibuprofen was 95%. Kir et al. [20] fabricated BaMg2 from lemon peel extracts to prepared a novel ZnO/BaMg2 nanocomposite. The photocatalytic efficiency of ZnO/BaMg2 was evaluated for the degradation of methyl orange (MO) and rose bengal (RB) dyes, achieving decolorization rates of 98.71% and 90.2%, respectively, outperforming pure ZnO nanoparticles.
In this study, we utilized biochar prepared from pistachio shells (PSs) to fabricate PS/ZnO composite photocatalysts via a co-precipitation method. Herein, we degraded oil and determined COD to evaluate the enhancement in photocatalytic performance of ZnO after introducing PS biochar under sunlight, LED light, and UV light with different numbers of lamps. Different characterization tests were performed to determine the composition, morphology, structure, and surface chemical properties of the as-prepared PS/ZnO. The photocatalytic degradation of oil and COD under different operating states, such as the initial oil concentration, PS/ZnO dosage, and pH, was investigated. Central composite design (CCD) of response surface methodology (RSM) is employed to optimize the experimental variables and evaluate the relationship between operating factors.
2. Experimental
2.1. Chemicals and Materials
Pistachio shells are provided from household and restaurant consumption. Zinc nitrate hexahydrate (Zn (NO3)2.6H2O ≥ 99.0%) was purchased from HIMEDIA, Maharashtra, India. High-purity sodium hydroxide (NaOH ≥ 98%), hydrochloric acid (HCl), and ethanol were purchased from Sigma Aldrich, Shanghai, China. Oil was supplied from the Petroleum Research and Development Center, Baghdad, Iraq.
2.2. Preparation of PS Biochar
The thermal approach was employed to synthesize the biochar from PS. To achieve this, PSs were thoroughly washed with clean water to eliminate the waste and dust from its surface. Subsequently, it was dried in an oven for two hours at 60 °C. Then, it was milled by utilizing a milling machine (Grain Mill, Moongiantgo, Sandy, UT, USA) at 28,000 rpm to obtain PS powder, and then it was sifted by sieving analysis (GEMINI, Rotterdam, The Netherlands) to maintain the particle size below 125 µm. The PS powder was calcined in a limited oxygen environment using a muffle furnace (MF 8/1100, BOECO, Hamburg, Germany) at 500 °C for 2 h to obtain the biochar [21]. Figure 1 depicts the steps of the biochar (PS) preparation.
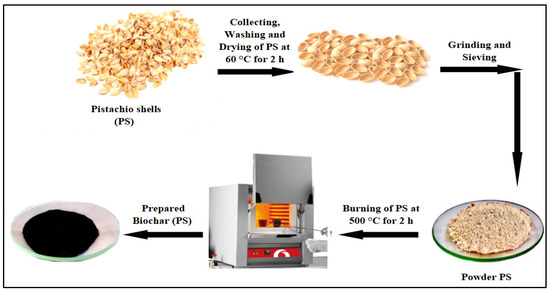
Figure 1.
Synthesis steps for biochar (PS) by thermal technique.
2.3. Preparation of PS/ZnO
The PS/ZnO composite was synthesized using a co-precipitation-assisted pyrolysis method [22] (Figure 2). In this synthesis method, two solutions are prepared; the first one contains different amounts of Zn(NO3)2.6H2O and biochar (PS) (2 g) dissolved in distilled water (80 mL) and stirred for 30 min. The second solution contains 1 M NaOH. Then, the second solution was added dropwise to the first solution under continuous stirring until reaching a pH of 10.5, with the mixture stirring for 2 h at room temperature to obtain a well-mixed solution. After that, the solid product was filtered through a filter paper (Whatman 42), washed several times with deionized water, and dried overnight at 80 °C. Then, the obtained solid was calcined in a muffle furnace at 500 °C for 2 h to obtain the composite. The ZnO content on PS/ZnO was added as 20%, 30%,40%, and 50%, with the optimum content chosen that was 40% after the results of the experiments conducted for preparing the PS/ZnO.
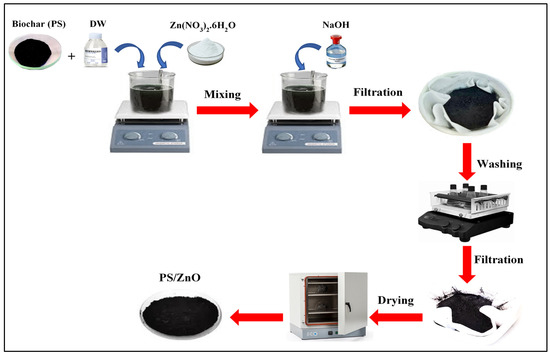
Figure 2.
Synthesis steps in the preparation of PS/ZnO.
2.4. Preparation of Petroleum Wastewater
Petroleum wastewater (PW) was simulated using different concentrations of real crude oil blended with distilled water. To maintain emulsion stability and prevent phase separation, sodium dodecyl sulfate (SDS) was added at an oil-to-emulsifier mass ratio of 10:1 [23]. The mixture was homogenized at 15,000 rpm for 15 min. Then, the concentration of the oil in the synthetic PW was measured using a HORIBA oil content analyzer (OCMA-550, Newcastle, Australia).
2.5. Modelling and Optimization
Response surface methodology (RSM) and central composite design (CCD) were used to model and determine the optimal conditions for oil and COD degradation. The independent variables were pH (2–10), PS/ZnO dose (0–0.1 g/50 mL), oil concentration (50–500 ppm), and COD concentration (125–1252 ppm) in ANOVA analyses using MINITAB®22.
2.6. Experimental Setup of the Photocatalytic Process
To evaluate the photocatalytic efficiency of the PS/ZnO composite, a series of tests were conducted in a Pyrex glass reactor, which was cylindrical with a height of 9 cm and an internal diameter of 6 cm, providing a working volume of 100 mL, as illustrated in Figure 3. The design of the experimental setup aimed to investigate the influence of several operational parameters that are known to affect photocatalytic degradation performance. The experimental conditions were systematically varied to assess the effects of key parameters, including the type and intensity of the light source, pH, catalyst dosage, irradiation time, reaction temperature, and the initial concentrations of oil and COD. Two types of illumination were employed: ultraviolet (UV) light with a power of 14 W, an intensity of 0.7 mW/cm2, and a wavelength of 254 nm, provided by four UV lamps; and visible LED light of the 6060 SMD type, arranged in a 1 m strip containing 60 LEDs with a total power of 14 W and a luminous flux of 1120 lumens (cool white). The pH of the solution was adjusted within the range of 2 to 10. Catalyst dosages varied from 0 to 0.1 g per 50 mL of solution, while the irradiation time spanned from 15 to 150 min. Oil concentrations were tested in the range of 50 to 500 ppm, and COD concentrations were varied between 125 and 1252 ppm. All experiments were conducted at room temperature (15 °C).
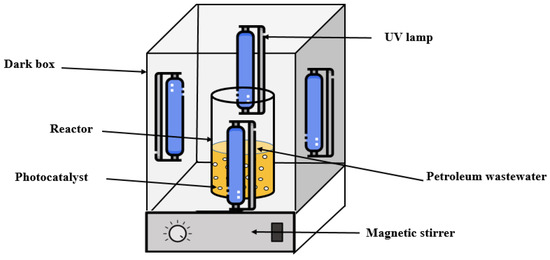
Figure 3.
Schematic of the photocatalytic experimental setup.
To verify the adsorption–desorption equilibrium, 50 mL of the simulated PW was mixed with PS/ZnO at different dosages in the reactor, and the mixture was blended at 250 rpm for 30 min in the dark. The reactor was then exposed to direct light. The treated PW was sampled after a predetermined amount of time, and the oil and COD contents were determined by registering the alteration in concentrations of the oil and COD. An oil content analyzer (OCMA-350, HORIBA, Ltd., Tokyo, Japan) was used to measure the oil content of the treated PW sample (10 mL), which was centrifuged for 10 min at 4000 rpm, while a COD was calculated by utilizing a COD reactor (RD-125 Reactor, LOVIBOND, Dortmund, Germany) to measure the quantity of oxygen consumed by the oxidizing agent technique. Equation (1) was used to determine the degrading efficiency (removal %) of pollutants [24].
where Co and C stand for the initial and end concentrations of oil or COD, respectively.
2.7. Characterizations
To determine the crystal structures and characteristics of PS/ZnO, X-ray powder diffraction (XRD: PW1730, PHILIPS, Amsterdam, The Netherlands) was used. Utilizing field-emission scanning electron microscopy (FESEM, MIRA3, TESCAN, Brno, Czech Republic), the morphology and particle distribution of PSs and PS/ZnO were evaluated. Also, the PSs and PS/ZnO chemical compositions were analyzed using energy-dispersive X-ray (EDX) spectroscopy. Furthermore, the PS/ZnO surface properties were measured using a Brunauer–Emmett–Teller (BET) (BET/BJH Micromeritics, Microtrac, York, PE, USA) analyzer. To determine the functional groups, Fourier transform infrared (FTIR) (spectral range of 600 to 4000 cm−1) spectra of the PSs and PS/ZnO were obtained using a spectrometer (TENSOR 27, Bruker, Berlin, Germany). Additionally, dynamic light scattering (DLS) was used to measure the particle sizes of PSs and PS/ZnO. Additionally, PS/ZnO’s energy band gap (Eg) was calculated using UV vis spectroscopy (UV-1800, RAYLEIGH, Beijing, China).
3. Results and Discussion
3.1. PS and PS/ZnO Characterizations
3.1.1. XRD Analysis
Figure 4 presents data describing the PS and PS/ZnO crystal structure. The XRD peaks at 2θ = 16.6°, 19.5°, 29.6°, 43°, and 61° correspond to the Miller indices (001), (002), (100), (110), and (103), as shown in Figure 4a. The XRD pattern shows that the biochar (PS) is a mixture of amorphous and semi-crystalline carbon, with some mineral content retained from the pistachio shells. This is typical of biochar produced under moderate pyrolysis temperatures. Distinctive diffraction peaks for the PS/ZnO were observed at 2θ = 31.9°, 36.5°, 48°, 57°, 63.2°, and 68.5°, corresponding to the Miller indices (100), (101), (102), (110), (103), and (201), as shown in Figure 4b. These results demonstrate an XRD pattern consistent with the standard pattern of hexagonal ZnO (JCPDS No. 36-1451). Peak appears at 2θ = 29.6° in the XRD patterns, due to the presence of PSs containing amorphous carbon and impurities resulting from thermal decomposition [25,26]. The XRD characteristics of PS/ZnO are illustrated in Table 1. The average crystal size of PSs and PS/ZnO was determined using Debye–Scherer’s Equation (2) [27], and the % crystallinity was calculated using Equation (3) [28].
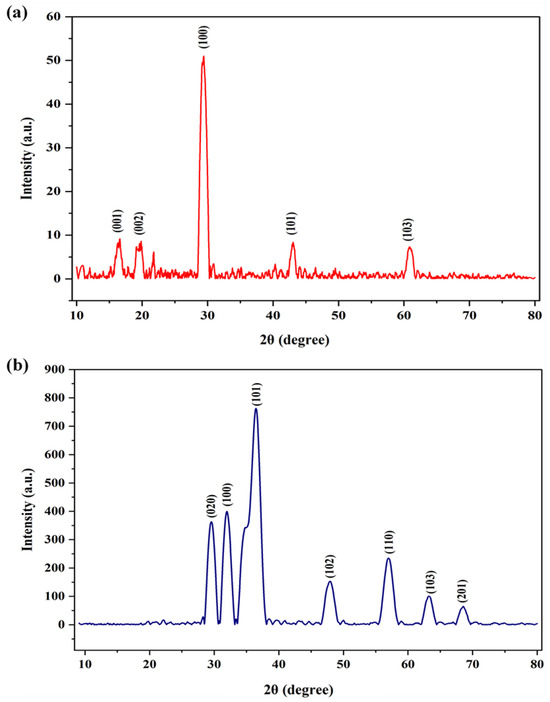
Figure 4.
XRD pattern of (a) biochar (PS) and (b) (PS/ZnO).

Table 1.
XRD characteristics of the PS/ZnO.
3.1.2. FESEM Analysis
The FESEM images of the PSs and PS/ZnO are shown in Figure 5. The PS surface appears granular and uneven, with spherical or semi-spherical structures, as illustrated in Figure 5a–d, which depicts the PS. These features may be carbon aggregates or ash remnants from the pyrolysis process. On the surface, there are visible nanostructured components that may have developed as a result of the organic materials breaking down during pyrolysis [29]. Figure 5a,b shows that there is a sparse distribution of particles on a relatively smooth carbon surface, and the surface is relatively non-porous at this scale. The biochar structure appears amorphous, with few particulates. In addition, it is observed from Figure 5c,d that numerous elongated pores and voids of different sizes are visible, clearly indicating the presence of irregularly shaped cavities and open channels. These voids are typical of lignocellulosic biochar, with hemicellulose and cellulose decomposition channels. This kind of porosity is beneficial for adsorption or as a support material for metal oxides (e.g., ZnO).
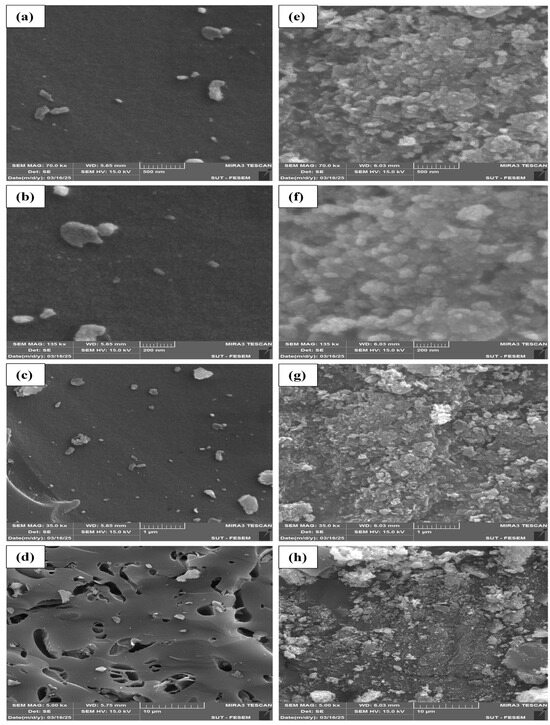
Figure 5.
FESEM analysis of biochar (PS) (a–d) and (PS/ZnO) (e–h).
The biochar from pistachio shells loaded with ZnO nanoparticles is shown in Figure 5e–h. The pictures demonstrate the deposition of ZnO particles by displaying nano-aggregates on the surface of the biochar. The contrast differences between bright and dark regions, where bright parts indicate high ZnO concentrations, show that ZnO usually occurs in spherical or flat nanostructures. Figure 5e,f shows that the PS/ZnO surface becomes denser, with clustered or aggregated bright particles (likely ZnO). ZnO appears as fine granules or nodular formations coating the biochar surface. Furthermore, the uniformity of the ZnO distribution is moderately good, thus indicating successful deposition of ZnO onto the biochar surface. Figure 5g,h represents the PS/ZnO composite; it demonstrate that the biochar pores are partially or completely filled with ZnO particles, exhibiting nano-crystalline features. Visible ZnO appears as rough or sharp-edged crystallites. Possible flower-like or rod-like aggregates form in some areas (common for ZnO grown hydrothermally), suggesting that ZnO has penetrated and anchored well into the biochar’s porous matrix. The ZnO nanoparticles enhance the surface area, active sites, and potential photocatalytic properties. Porosity is reduced due to ZnO loading, but overall pollution degradation reactivity is likely enhanced. The PS/ZnO surface properties are presented in Table 2. These properties refer to the fact that PS/ZnO is a mesoporous catalyst with a decent surface area and pore volume, making it well suited for the photodegradation of organic pollutants (oil and COD) [30].
Table 2.
Surface properties of the PS/ZnO.
3.1.3. EDX Analysis
The elemental compositions of PSs and PS/Zn were revealed by the EDX analysis, as seen in Figure 6. Figure 6a, which represents PS, shows that the amount of carbon was 91.60 weight percent, whereas the EDX analysis from Figure 6b, which represents PS/ZnO, shows that the amounts of Zn, carbon, and oxygen were 36.47 weight percent, 32.42 weight percent, and 19.75 weight percent, respectively. The EDX spectra of the PSs and PS/ZnO showed a greater presence of peaks representing a carbon element (Figure 6a), Zn element, and carbon element (Figure 6b). The high oxygen and zinc concentrations confirm the successful loading of ZnO onto the porous biochar matrix, confirming the success of the co-precipitation process [31].
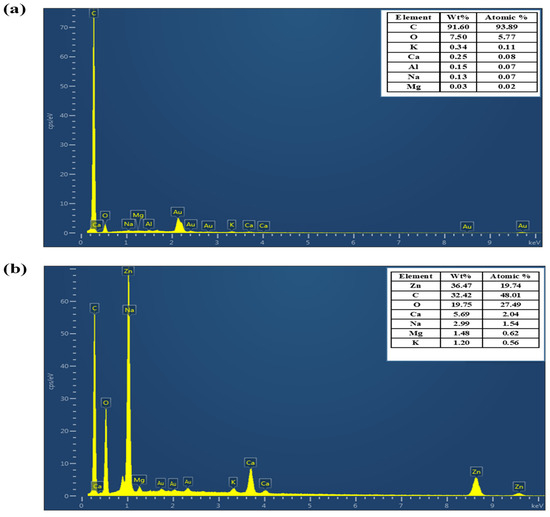
Figure 6.
EDX analysis of (a) biochar (PS) and (b) (PS/ZnO).
3.1.4. Energy Band Gap (Eg)
Figure 7 illustrates the band gap energy of PSs and PS/ZnO and the results of the UV–vis analysis. Equation (4) was used to assess the energy band gap of PSs and PS/ZnO [32].
where α is the absorption coefficient, hʋ represents photon energy, and K denotes the absorption index [33]. Consequently, the Eg was determined by plotting (αhʋ)2 against Eg (hʋ), as shown in Figure 7b,c. The absorption threshold of the PS/ZnO was reached at 365 nm (Figure 7a), where the Eg of PS/ZnO and PSs were approximately 2.8 eV and 2 eV. This result suggests that introducing biochar (PS) will enhance the photocatalytic performance of PS/ZnO by narrowing the band gap of ZnO from ~3.2 eV to 2.8 eV, facilitating the absorption of visible light and reducing the recombination of photogenerated charge pairs, thereby contributing to the improved degradation of pollutants (oil and COD) [34].
α hv1/n = K (hv − Eg)
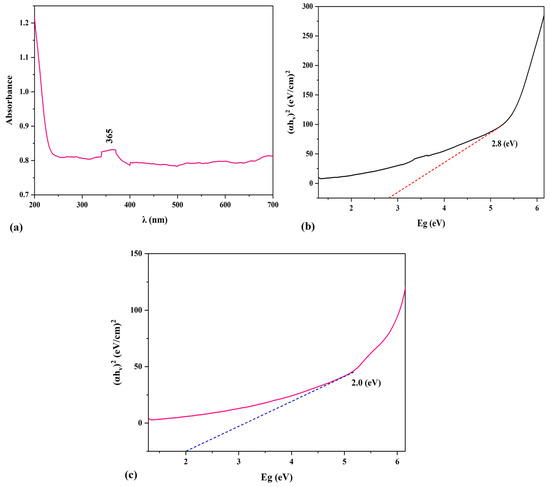
Figure 7.
(a) UV-vis of the PS/ZnO, (b) Eg analysis of the PS/ZnO, and (c) Eg analysis of the PS.
3.1.5. FTIR Analysis
FTIR spectra were acquired using a spectrophotometer over a range from 4000 cm−1 to 600 cm−1 to identify the functional groups present in the biochar (PS) and PS/ZnO. As shown in Figure 8, the peaks at 3367 cm−1 indicate the presence of hydroxyl (-OH) groups within phenolic and aliphatic structures in PS/ZnO, while the peak at 2366 cm−1 suggests the presence of C≡C stretching vibrations in the alkyne group or absorbed CO2 [35]. The peak at 1698 cm−1 indicates C=O stretching, which points to the presence of carbonyl groups, such as carboxylic acids or ketones. This shift suggests that ZnO affects the local chemical environment. The peaks at 1418 cm−1 correspond to vibrations of C-H bonds in aromatics found in PS/ZnO. Additional peaks at 1170 and 1047 cm−1 may reflect the formation or alteration of C–O bonds due to ZnO interactions, indicating the presence of aliphatic C-O stretching, and suggesting an interaction between the ZnO and the oxygen-containing functional groups on PS, indicating a successful surface modification [36]. Most importantly, the peaks appearing at 874, 831, and 711 cm−1 are associated with zinc compounds, such as ZnO, confirming the presence of ZnO nanoparticles in the PS/ZnO sample [37,38]. In the case of PS, the peak at 2364 cm−1 is attributed to C≡C triple bond stretching vibrations in the alkyne group. The characteristic peak at 1701 cm−1 in PSs is assigned to C=O stretching, indicating the presence of carbonyl groups, such as carboxylic acids or ketones [36,39]. A prominent peak at 1574 cm−1 is associated with C=C stretching in aromatic rings, confirming the aromatic nature of the biochar structure [40,41]. Several peaks between 1429 and 1161 cm−1 are related to C–H and C–O stretching vibrations, indicative of esters, ethers, or alcohols [42]. From the FTIR results, it can be concluded that ZnO is successfully loaded on PSs, confirming that PSs alter the structure of ZnO, which may influence its functional properties, such as enhancing bioactivity, conductivity, and chemical stability.
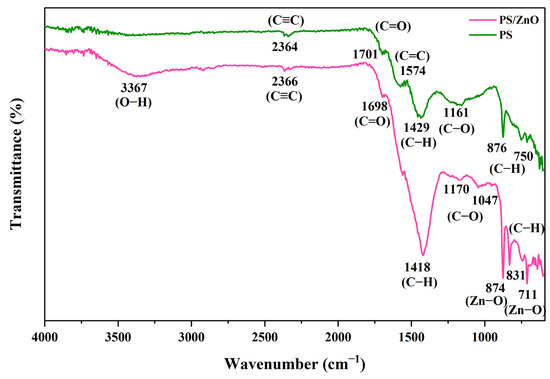
Figure 8.
FTIR Spectrum of biochar (PS) and (PS/ZnO).
3.2. Activity of Photocatalysis for the Degradation of Oil and COD
3.2.1. Comparative Study of Adsorption and Photocatalytic Degradation Pathways
Figure 9 shows the adsorption and photocatalytic degradation performance of biochar (PS), ZnO, and PS/ZnO composite under operational conditions of 100 ppm oil concentration, 290 ppm COD concentration, a dose of 0.05 g/50 mL for PS, ZnO, and PS/ZnO, and a pH of 6.8. It is observed that, during adsorption, oil and COD removal significantly increases over time by using biochar. This is due to its high surface area and porous structure, which promote adsorption [43]. ZnO exhibits lower adsorption because its surface area and affinity for oil in dark conditions are limited. However, the PS/ZnO composite achieves the highest oil removal in the dark. This is due to the synergistic effect of biochar with ZnO; PSs provide adsorption sites, and ZnO may contribute limited surface interaction even in darkness. This confirms that PSs enhance oil adsorption, and the composite (PS/ZnO) combines both functionalities [44].
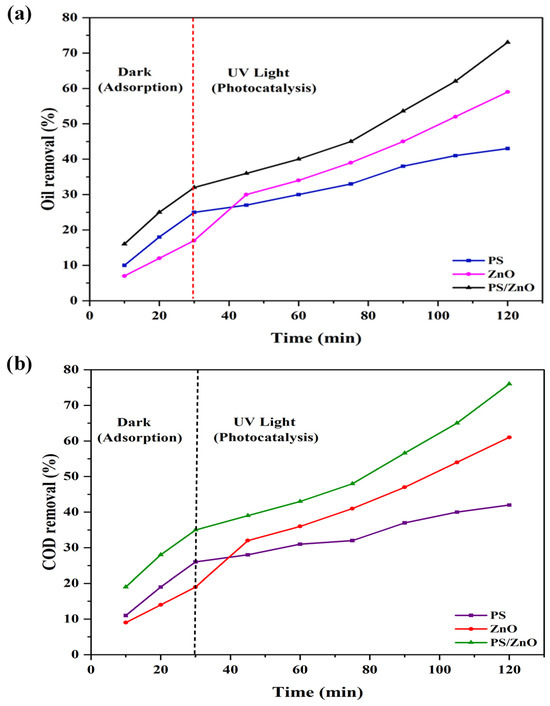
Figure 9.
Adsorption and photocatalytic degradation performance of PS, ZnO, and PS/ZnO in terms of (a) oil removal (%) and (b) COD removal (%).
Under UV light for photocatalytic degradation, it was noted that the oil and COD removal by PSs slightly increased with increasing time because PSs biochar primarily functions as an adsorbent rather than a photocatalyst; it lacks the semiconductor characteristics needed to produce reactive species under light exposure. But with ZnO, the oil and COD removal significantly increased due to the generation of reactive oxygen species (ROS) under UV that degrade oil and COD. PS/ZnO shows a significant increase and the best performance. This demonstrates that PSs serve to adsorb the oil molecules on their surface through adsorption, while the ZnO, upon activation by UV light, facilitates the degradation of these oil molecules via photocatalytic processes. This demonstrates a synergistic mechanism in the PS/ZnO composite: oil is first adsorbed onto the biochar surface and then degraded by ZnO under UV, ensuring a more efficient and complete oil and COD removal [45].
3.2.2. Selection of the Best Catalysts
Figure 10 compares the performance of various catalysts for oil and COD removal, represented by pistachio shell biomass (PS1), pistachio shell biochar (PS2), pistachio shell biochar/ZnO without calcination (PS/ZnO), and pistachio shell biochar/ZnO with calcination (PS/ZnO*). The experiment was conducted with an oil concentration of 100 ppm, a COD concentration of 290 ppm, a pH of 6.8, a catalyst amount of 0.05 g/50 mL, and UV (4 lamps) irradiation for 60 min. Figure 10 proved that the lowest degradation of oil (removal = 28.40%, residual = 71.6 ppm) and COD (removal = 27.59%, residual = 210 ppm) was obtianed by PS1, while PS2 demonstrated greater efficiency in degrading oil (removal = 35. 00%, residual = 65 ppm) and COD (removal = 36.21%, residual = 185 ppm) than PS1. The pyrolysis of biomass into biochar eliminates volatile chemicals and produces a carbon-rich structure that enhances chemical stability and suitability for supporting photocatalytic materials [46]. This is attributed to the biochar’s increased surface area and porosity. Moreover, biochar can be doped with metals or engineered with functional groups to improve electron transport and light absorption, significantly enhancing photocatalytic activity compared to untreated biomass [47]. When using PS2 + Zn(NO3)2, indicated as (PS/ZnO), the results surpass those of PS1 and PS2, with an oil degradation rate of 53.60% (residual = 46.4 ppm) and COD degradation of 50.69% (residual = 143.2 ppm). When using PS2 + Zn(NO3)2 + calcination, represented by (PS/ZnO*), oil degradation was 51.00% (residual = 49 ppm), and COD degradation was 48.97% (residual = 148 ppm), these findings are approximately equal to the results obtained by PS/ZnO.This indicated that the ZnO on PSs provides more active sites for pollutant degradation, reducing recombination rates of photogenerated electron–hole pairs in ZnO, improving the structural stability of ZnO particles (preventing aggregation), and enhancing light absorption [48,49]. Therefore, loading ZnO onto PSs enhances catalytic performance, making it more effective in pollutant photodegradation. Moreover, it was noted from the findings that the removal efficiency of COD was slightly higher than removal of oil by using PS2 compared to other materials. This can be attributed to the PS2 surface properties (hydrophilicity, hydroxyl and carboxyl functional groups, surface area, and pore structure) compared to other materials, and also can be due to the partial degradation of oil by PS2, which leads to the formation of intermediate products from oil. These intermediates (more water-soluble) are not counted as oil but still contribute to the drop in COD. Also, the PS2 can favor the removal of more polar and reactive organic constituents over hydrophobic oil fractions [50,51].
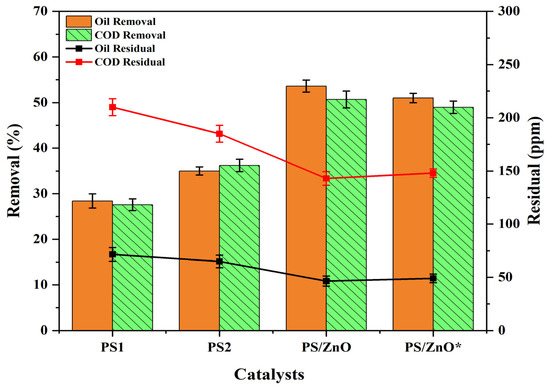
Figure 10.
Comparison of the performance of different catalysts in terms of oil and COD removal efficiency.
3.2.3. Impact of the Irradiation Time
The impact of the irradiation time on the oil and COD degradation is shown in Figure 10. As shown in Figure 11, at the start of the photocatalysis process carried out at a PS/ZnO of 0.05 g/50 mL, oil and COD concentrations of 100 ppm and 290 ppm, and a pH of 6.8 under 15–150 min irradiation by UV light (4 lamps), it is noted that the oil and COD degradation rate increases considerably with increasing irradiation duration. The longer contact time between the pollutant and the photocatalyst surface was the reason for this outcome. It may be caused by the active adsorption sites that are accessible on the surface of the catalyst [52,53]. When adsorbents are combined with photocatalysts such as ZnO, the adsorption facilitates the reaction between the pollutant and UV-generated free radicals [54]. At 90 min, the highest oil removal was 74.20 percent (residual = 25.8 ppm), while the maximum COD removal was 72.41% (residual = 80 ppm). Between 90 and 150 min into the photocatalytic process, the rate of oil and COD degradation reached equilibrium. This equilibrium was probably brought about by saturation of the active surface adsorption sites [55].
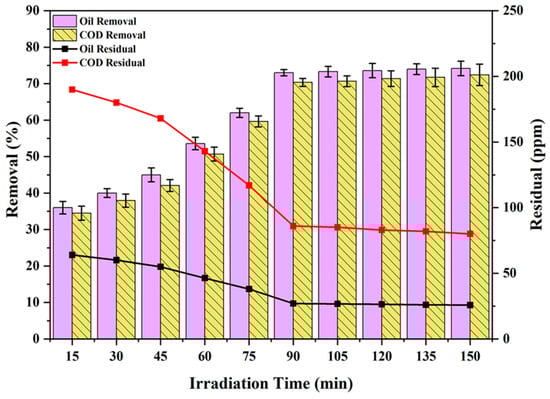
Figure 11.
Impact of irradiation time on the oil and COD degradation (oil = 100 ppm, COD = 290 ppm, pH = 6.8, PS/ZnO = 0.05 g/50 mL, and temperature = 15 °C).
3.2.4. Impact of the Light Source
Figure 12 shows the effect of light sources on oil and COD degradation in the photocatalytic process, utilizing 100 and 290 ppm concentrations of oil and COD concentrations, pH 6.8, PS/ZnO ratio of 0.055 g/50 mL, and irradiation duration of 90 min under different types of light sources: sunlight, LED, and UV with varying numbers of lamps (two lamps (28 W), four lamps (56 W), and five lamps (70 W)). The highest oil degradation (removal = 80.00%, residual = 20 ppm) and COD (removal = 78.28%, residual = 63 ppm) were obtained using sunlight. This can be attributed to the sunlight providing a high intensity of photons in the visible spectrum, especially between 400 and 700 nm, which aligns with the activation window of a 2.8 eV photocatalyst [56]. This means that more photons of suitable energy are available to excite electrons, increasing the generation of free radicals needed to degrade organic pollutants [57,58]. In contrast, the use of LED light exhibited the lowest degradation of the oil (removal = 62.00%, residual = 38 ppm) and the degradation of the COD (removal = 59.66%, residual = 117 ppm). This is mostly due to the fact that ordinary LED lights have a limited light spectrum that does not contain enough UV radiation, which limits their ability to efficiently break down complex organic molecules and start photocatalytic oxidation events [59,60]. When UV lamps were employed, a gradual performance improvement was observed with an increasing number of lamps. Higher removal efficiencies were recorded as the number of UV lamps increased from two to four and then to five lamps. The degradation of the oil increased from 72.60% to 76.40% (decreased residual from 27.4 ppm to 23.6 ppm), and the degradation of the COD increased from 69.66% to 73.45% (decreased residual from 88 ppm to 77 ppm) when the number of UV lamps increased from two to five. This enhancement can be explained by the increased photon energy of UV radiation, which efficiently excites electrons in the photocatalyst material, leading to the formation of reactive oxygen species (ROS), such as hydroxyl radicals (OH•). These radicals are necessary for breaking organic contaminants’ molecular bonds. Consequently, adding more lamps to increase the UV radiation intensity greatly increases the generation of free radicals, which improves pollutant degradation [61,62]. These outcomes are caused by the type of light source, which has varying wavelengths and intensities. Depending on the photocatalyst’s properties, different wavelengths can activate the catalyst’s surface [63,64]. Therefore, the type of light source greatly affects the degradation of oil and COD. Moreover, the PS/ZnO photocatalyst with a band gap of 2.8 eV is optimized for visible light, as sunlight is the most abundant natural source of visible photons. Sunlight is therefore the most efficient, sustainable, and effective source of light for pollutant degradation utilizing a PS/ZnO photocatalyst, exceeding both UV and LED in terms of photon availability, spectrum match, and long-term energy savings.
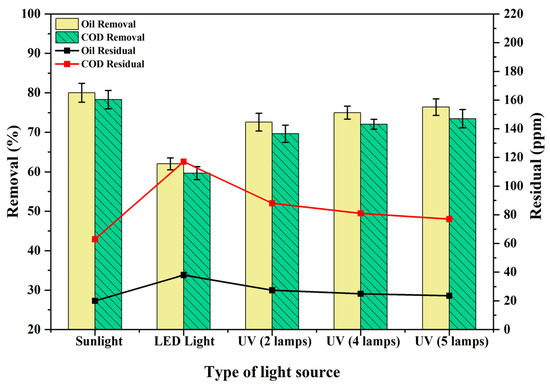
Figure 12.
Impact of light source on the degradation of COD and oil (oil = 100 ppm, COD = 290 ppm, pH = 6.8, PS/ZnO = 0.055 g/50 mL, irradiation time = 90 min, and temperature = 15 °C).
3.2.5. Impact of Temperature
Figure 13 illustrates the effect of temperature (ranging from 15 to 50 °C) on the degradation of oil and COD under the following conditions: photocatalyst (0.055 g/50 mL), oil (100 ppm), COD (290 ppm), pH (6.8), and UV light exposure for 90 min. The results indicated that the rate of oil and COD degradation increased as the temperature rose, as higher temperatures significantly elevate the energy of the interacting molecules and the frequency of collisions between them, which accelerates the reaction and enhances the efficiency of oil and COD degradation [65]. The highest oil and COD degradation efficiency by PS/ZnO was approximately 84.80% (residual = 15.2 ppm) and 85.86% (residual = 41 ppm), respectively, at 50 °C, whereas the lowest was 75.00% (residual = 25 ppm) and 72.07% (residual = 81 ppm), respectively, at 15 °C (see Figure 13), which aligns with the findings of another study [66].
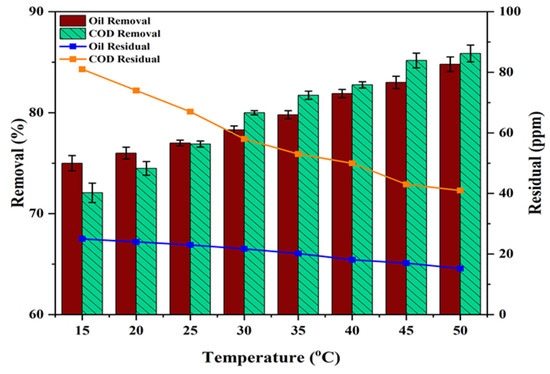
Figure 13.
Impact of temperature on the degradation of COD and oil (oil = 100 ppm, COD = 290 ppm, pH = 6.8, PS/ZnO = 0.055 g/50 mL, and irradiation time = 90 min).
3.3. Modelling and Analysis of Variance
MINITAB®22 was used to conduct ANOVA studies, applying a 0.05 threshold for relevance to examine a variable that is crucial to the execution process. To enhance the effectiveness of oil and COD degradation, response surface methodology (RSM) and central composite design (CCD) were utilized to optimize the photocatalyst dose, oil concentration, COD concentration, and pH, as illustrated in Table 3. An analysis of variance (ANOVA) was performed to ascertain the statistical implications of the model. Table 3 shows that the quadratic regression model is most suited for examining oil and COD photodegradation, as the outcome of the F-value, p-values (the p-value is the probability of obtaining a test statistic at least as extreme), and R2 represents the coefficient of determination in statistics, which is a measure used to evaluate the quality of a predictive model (such as a regression model). For each predictor variable in the design layout, if the p-value is less than the significance threshold (0.05), the effect is considered statistically significant, and if p > 0.05, the effect is considered not significant [67]. Their empirical relationships are represented by the mathematical expressions provided in Equations (5) and (6).
Reoil % = 91.07 − 4.91 A − 0.1145 B + 260 C+ 0.202 A2 + 0.000087 B2 − 1067 C2 − 0.00136 AB + 10.7 AC+ 0.366 BC
ReCOD % = 87.87 − 4.73 A − 0.0386 B + 285 C + 0.179 A2 + 0.000009 B2 − 1343 C2 − 0.000536 AB + 10.7 AC + 0.1622 BC
Table 3.
ANOVA findings for PW oil and COD removal percentage using the quadratic model.
3.3.1. Effect of Variables by Normal Plot and Pareto Chart
The normal plot and Pareto charts in Figure 14 illustrate the standardized effects of individual factors and their two-factor interactions on the studied response, based on a full factorial experimental design aimed at optimizing PW treatment efficiency. The factors under investigation include pH (A), oil concentration (B), photocatalyst dose (C), and several interaction factors on the PW removal % of oil and COD. As a result, the regular effect value of each coefficient must be higher than the critical value of 2.228 to be continually relevant at the 5% level. The terms (C), (B), and (A) indicate a more significant impact, and the terms (BB, BC, AA, CC, AC, and AB) indicate a less significant impact on the removal% of oil, as shown in Figure 14a,c. While terms (C), (B), and (A) indicate a more significant impact and the terms (BC, BB, CC, AA, AC, and AB) indicate a less significant impact on the removal% of COD, as illustrated in Figure 14b,d. The strong influences of the photocatalyst dose (C), oil concentration (B), and pH (A) can be scientifically explained by their direct role in enhancing the removal or breakdown of oil and COD through chemical degradation mechanisms and interfering with treatment mechanisms, thus significantly impacting the response [68]. Interaction effects, such as BB, BC, AA, CC, AC, and AB, fall below the statistical threshold, indicating that their contributions are insignificant under the studied conditions. This approach helps streamline experimental efforts while maintaining analytical precision [69].
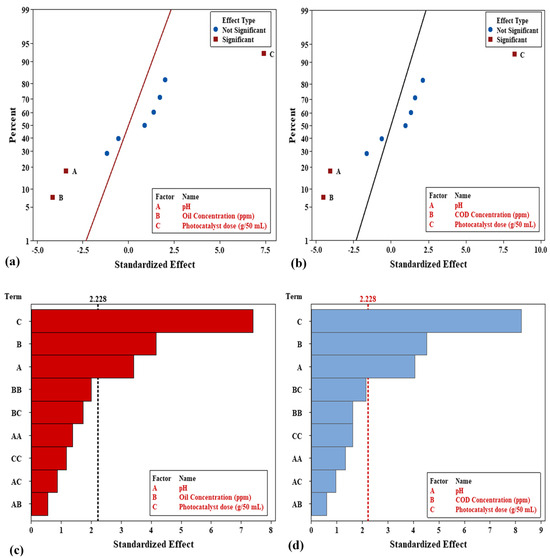
Figure 14.
Effect of variables by normal plot and Pareto chart of the standardized effect of variables on (a,c) oil removal%, and (b,d) COD removal%.
3.3.2. Variables Interaction Plots
The plots presented in Figure 15 are variable interaction plots, which are used to understand how independent variables, such as pH, oil concentration, COD concentration, and photocatalyst dose, interact and collectively influence the dependent variables, which in this case are the mean percentage of oil and COD removal. The illustration below demonstrates that, as concentration and pH rise, oil removal efficiency falls. Removal effectiveness was maximum (over 80%) at low oil and COD concentrations (50 ppm and 125 ppm). Also, efficiency declined to less than 50% at the highest oil and COD concentrations (653.4 ppm and 1765 ppm). It additionally indicates that the system’s performance is adversely affected by high quantities of oil and COD, in addition to basic pH conditions.
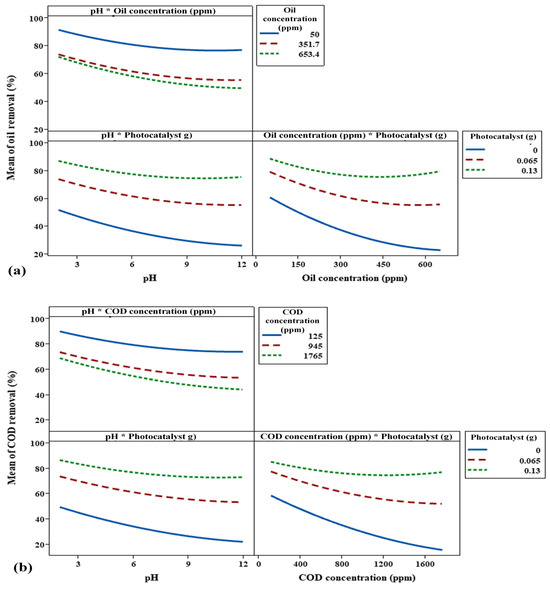
Figure 15.
Impact of concentration of pollutants (oil and COD), pH, and photocatalyst on (a) oil removal%, and (b) COD removal% by interaction plots.
The interaction between oil and COD concentrations, as well as photocatalyst dosage, was also observed. This graph illustrates the positive impact of photocatalyst addition on oil and COD removal efficiencies, particularly at high oil concentrations. The efficiency decreased significantly as the concentrations of oil and COD increased in the absence of a photocatalyst (0 g). However, even at larger concentrations of COD and oil, the removal efficiency was better when 0.13 g of photocatalyst was used. This demonstrates the importance of photocatalysts in improving the removal process.
While the interaction between pH and photocatalyst dose results indicates that increasing the photocatalyst dosage significantly improves oil removal efficiency, this efficiency still decreases as pH increases. At low pH values, the removal efficiency was highest, particularly with 0.13 g of photocatalyst, where it exceeded 80%. However, as pH increased, the efficiency gradually declined, dropping to below 30% in the absence of a photocatalyst. These graphs provide insight into how the combined variance of two factors simultaneously affects oil and COD removal efficiencies.
3.3.3. Response Surface Analysis
The main objective of the 3D surfaces and 2D contour plots is to optimize the process parameters that include the oil and COD concentrations, the PS/ZnO photocatalyst dose, and the pH, to achieve the highest removal percentage for oil and COD from PW while also understanding the interaction between the variables. In Figure 16a,b and Figure 17a,b, it is clear that the oil and COD removal decreases significantly with the increase in concentrations of oil and COD and pH values. This occurs because more oil is adsorbed on the PS/ZnO surface when the oil concentration rises, reducing the active sites and minimizing the production of free radicals [70]. Additionally, the removal of oil and COD increases at lower pH levels because the surface of the composite at low pH values becomes more positively charged, and the electrostatic attraction between the positively charged PS/ZnO and negatively charged oil molecules enhances adsorption, which is a precursor to photocatalytic degradation [71]. Furthermore, the generation of reactive oxygen species (ROS) may be more favorable in acidic environments due to improved electron–hole separation. Thus, the oxidative potential of valence band holes increases under acidic conditions, improving degradation efficiency [72]. From Figure 16c,d and Figure 17c,d, it is noted that the oil and COD removal percentages increase significantly as pH decreases and photocatalyst dose increases. The rise in the percentage of oil and COD removal may be explained by an increase in the number of active sites on the photocatalyst surface; this, in turn, increases the number of reactive radicals, thereby enhancing degradation [73]. The results of this study align with the findings reported by Suara et al. [74]. Figure 16e,f and Figure 17e,f illustrate the interaction between oil and COD concentrations and photocatalyst (PS/ZnO) doses. The removal of oil and COD increases with decreasing oil and COD concentrations and increasing PS/ZnO doses. These figures indicate that high concentrations of oil and COD reduce oil and COD removal, while acidic pH yields better results, and increasing the PS/ZnO dose significantly enhances oil and COD removal.
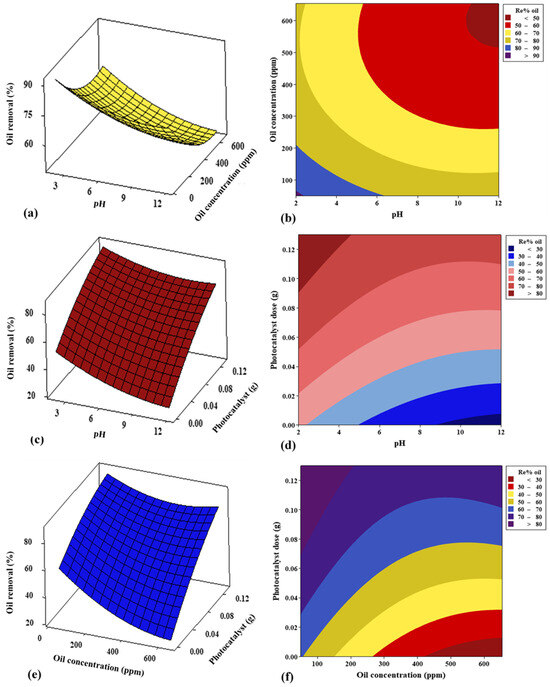
Figure 16.
Effect of 3D surface and 2D contour graphs of (a,b) pH and oil concentration, (c,d) pH and photocatalyst dose, and (e,f) oil concentration and photocatalyst dose on removal% of oil.
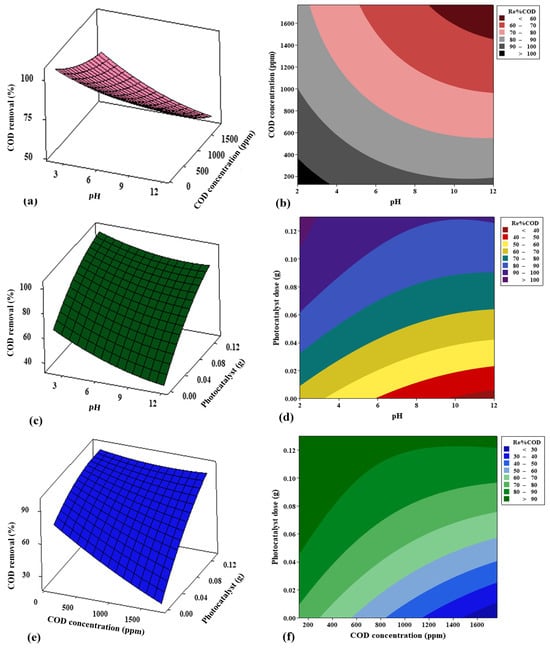
Figure 17.
Effect of 3D surface and 2D contour graphs of (a,b) pH and COD concentration (c,d) pH and photocatalyst dose, and (e,f) COD concentration and photocatalyst dose on removal% of COD.
3.3.4. Predicted Fitted Line Plots
The Minitab prediction of oil and COD removal% was generated using a linear regression function (MINITAB®22). Points demonstrate how the real values are dispersed about the model’s straight line. The determination coefficient (R2) was used to assess how well the model fit. As can be seen in Figure 18a,b, the models of oil removal% and COD removal% have high R2 values of 92.93% and 94.34%, respectively, which indicate a strong connection between the predicted and experimental values, illustrating a good fit of the mathematical models. These findings highlight the model’s considerable promise for predicting and optimizing the percentage of oil and COD removal. Moreover, the residuals versus fits plot in Figure 18c,d was used to assess the model’s dependability. This figure illustrates that no sequence of points increases or decreases, such as a preponderance of positive or negative residuals or growing residuals with increasing shifts. Additionally, the randomness in the residual plot indicates a good fit for the model. Consequently, Figure 18 demonstrates that the empirical correlation accurately characterizes the oil and COD removal percentages using response surface methodology.
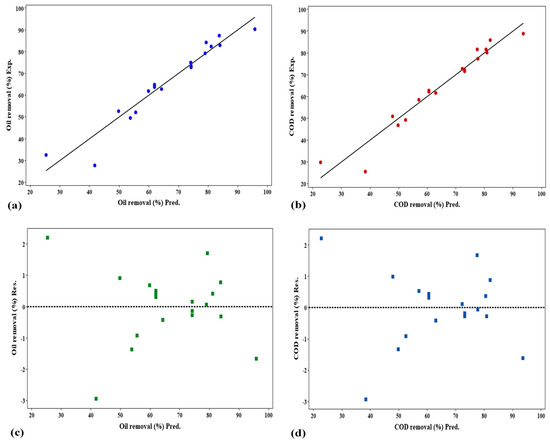
Figure 18.
Predicted vs. actual values and corresponding residuals of the (a,c) oil removal%, and (b,d) COD removal%.
3.3.5. Optimum Condition and Data Validation
To determine the optimum responses of the variables, the desirability function was applied to determine the optimum values, whose scores range from zero to one. In this case, the individual desirability values for multiple responses are combined into a single composite, and the value that is close to one represents the optimal conditions [75]. In our study, the optimal parameters that were established based on the CCD analysis were a pH = 2, catalyst = 0.130 g, and oil = 50 ppm for oil removal, and pH = 2, catalyst = 0.122 g, and COD = 125 ppm for COD removal%. Under these optimum conditions, the difference between the predicted value of the suggested empirical equation (97.37%) and the experimental value (94.5%) was only 2.94% in the case of oil removal. In addition, the difference between predicted (94.18%) and experimental values (91.20%) was found to be only 3.16% for COD removal (Table 4). Therefore, a good agreement between predicted and experimental responses confirms the validity of the developed quadratic model by RSM design.
Table 4.
Oil and COD removal %: predicted and observed values at optimized conditions.
3.4. Reaction Kinetics
The kinetics behavior of PW removal over a PS/ZnO photocatalyst was evaluated using the Langmuir–Hinshelwood model (pseudo-first-order) (Equation (7)). This equation illustrates the relationship between the rate of degradation and the reactant concentrations of oil and COD for a heterogeneous photocatalytic process [76]:
where k1 is the apparent reaction rate constant (min−1) and represents the photocatalyst’s activity in the degradation of a target pollutant, t = irradiation time, Co is the initial oil or COD concentration, and C is the concentration of oil or COD after reaction.
In addition to the pseudo-first order model, zero-order and pseudo-second-order kinetic models were also used and represented by Equations (8) and (9), respectively:
where k0 is zero-order constant and k2 is pseudo-second-order constant.
From Table 5 and Figure 19, it is obvious that pseudo-first order model has a higher correlation value (R2 = 0.9960 for oil and R2 = 0.9922 for COD) compared to other kinetic models, suggesting that the removal of oil and COD by PS/ZnO simultaneously engaged in adsorption and surface reaction, and that surface active sites play an important role to initiate the photocatalytic reaction. As shown, the value of k1 for oil removal is higher than that in COD removal, indicating that the photocatalytic degradation of oil is much faster than the COD degradation [76].
Table 5.
The kinetics parameters of PS/ZnO in oil and COD % removal.
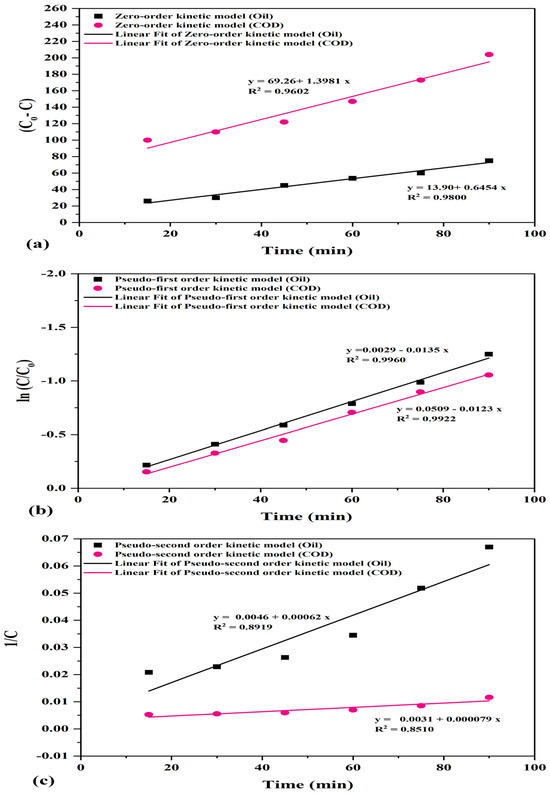
Figure 19.
Plot of kinetics models (a–c) for photodegradation of oil and COD (oil = 100 ppm, pH = 6.8, COD = 290 ppm, PS/ZnO = 0.05 g/50 mL, and temperature = 15 °C).
3.5. Photocatalytic Degradation Mechanism
The COD and oil pollutants are removed using a biochar/ZnO composite under UV light by this mechanism, where the COD easily adsorbs onto biochar via polar interactions (e.g., –OH, –COOH groups) and is degraded efficiently by ZnO-generated reactive oxygen species (ROS) into H2O and CO2. While the oil adsorbs mainly through hydrophobic interactions on the biochar. Oil degradation is less complete due to oil’s nonpolar, water-insoluble nature. The biochar/ZnO composite combines strong adsorption (biochar) with photocatalysis (ZnO).
The reaction between pollutants depends on the presence of strong oxidation and reduction factors (h+ and e−), which are generated from the irradiation of the surface of PS/ZnO photocatalyst by a light source (visible or UV light), and is the basis of the photocatalysis process. Photogenerated electrons migrate from the valence band (VB) to the conduction band (CB) when PS/ZnO is exposed to light, leading to the creation of electron/hole pairs (e−/h+) (Equation (10)). Following electron–hole pair formation, the photogenerated hole (h+) causes oxidation on the PS/ZnO surface, while the photogenerated electron (e−) contributes to the occurrence of reduction on the PS/ZnO surface. Reactive oxygen species (ROS), such as hydroxyl radicals (OH−), are produced when the hydrogen ion H+ in VB oxidizes the donor molecule (Equations (11) and (12)). The donor molecule combines with water molecules to form the OH•. When oxygen species in petroleum wastewater react with e− from the CB, superoxide ions (O2−•) are produced (Equation (13)). H2O2 is produced by the O2−•, and then, it is broken down into OH− and OH• radicals (Equations (14)–(17)). The oil and COD can be effectively oxidized and reduced to CO2 and H2O by reducing and oxidizing agents (h+ and e−) (Equation (18)). Figure 20 provides possible reactions that might occur during photocatalysis by PS/ZnO.
PS/ZnO+ hν → e− CB + h+ VB
h+ + H2O → OH∙+ H+
h+ + OH− → OH
e− + O2 → O2−∙
O2−∙ + 2H+ → HOO
2HOO• → O2 + H2O2
H2O2 + O2−• → OH + OH− + O2
H2O2 + hν → 2OH
Oil/COD + OH∙ → CO2 + H2O
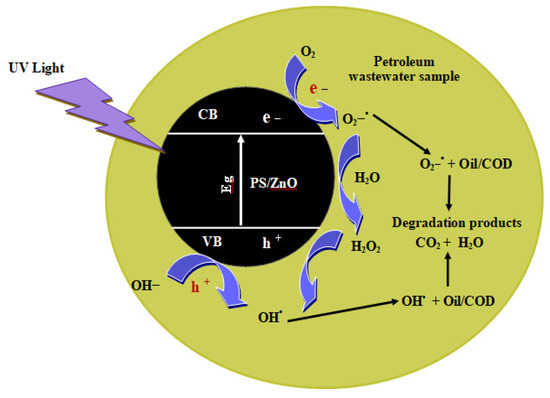
Figure 20.
Photocatalytic mechanism of biochar/ZnO composite for the degradation of petroleum wastewater.
3.6. Recyclability of the PS/ZnO Photocatalyst
The reusability and photostability of PS/ZnO in removing oil and COD from PW were assessed over five consecutive cycles to determine its suitability for industrial use. The recyclability experiment was performed using oil = 275 ppm, COD = 786 ppm, pH = 6, catalyst = 0.13 g/50 mL, and irradiation time = 90 min at 15 °C. The PS/ZnO was washed with ethanol/distilled water, rinsed, filtered, and oven-dried at 70 °C for 2 h, then reused in each cycle of photodegradation under the same operating conditions. Figure 21 illustrates its performance over five cycles. The removal efficiency was 79.27% and 77.35% for oil and COD, but the removal efficiency decreased to 74.55% and 72.77% after the first cycle. After the second cycle, efficiencies declined to 67.27% and 66.03%, then to 60.36% and 62.60% after the third, 52.00% and 50.38% after the fourth, and 43.27% and 42.11% after the fifth. The reduction may be due to mass loss of the PS/ZnO photocatalyst (30.77%) during recovery steps that lower its effectiveness or the depletion of active sites from the surface of the composite with a partial blockage of the porous structure [77,78]. FTIR was used to study the variation in the functional groups post-photocatalytic treatment and post-regeneration of the photocatalyst (Figure 22). New bands at 2918 cm−1, which are associated with aliphatic C–H stretching vibrations, appeared after the removal of oil and COD. The appearance of these bands reflects the incorporation or adsorption of species containing hydrocarbons onto the composite. Upon regeneration, the bands at 2918 cm−1 vanished, which indicates the removal or regeneration of the photocatalyst surface from organic hydrocarbons, thus proving that the regeneration was successfully achieved. Furthermore, it is observed from Figure 23 that all major diffraction peaks remain present for PS/ZnO after regeneration compared to PS/ZnO before regeneration. This confirms that ZnO does not decompose or transform structurally during degradation or regeneration; thus, the XRD pattern after regeneration confirms that the ZnO-biochar composite remains structurally intact. However, reduced peak intensities were observed compared to the fresh catalyst (before regeneration), indicating a decrease in crystallinity, possibly due to some loss of active surface sites, surface fouling by degraded oil residues, agglomeration of ZnO particles, and minor structural distortion after thermal or chemical regeneration [79,80]. Therefore, there may be a potential decrease in photocatalytic efficiency compared to PS/ZnO before regeneration. In addition, no new peaks or new crystalline phases (e.g., Zn(OH)2, ZnCO3, or ZnO2) were detected, suggesting the chemical stability of PS/ZnO under operating and regeneration conditions. Therefore, the PS/ZnO photocatalyst validates its reusability in oily wastewater degradation applications, although with reduced efficiency over time. Regular or more effective regeneration techniques (thermal, chemical washing, or UV treatment) may be needed to restore its full activity.
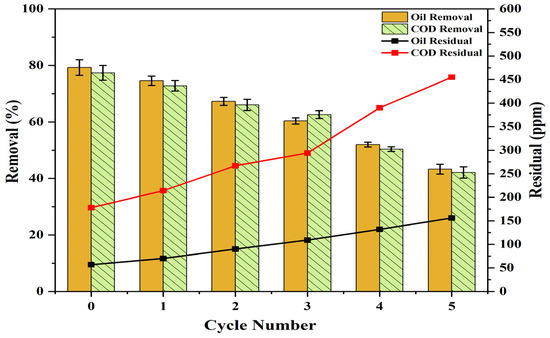
Figure 21.
The reusability of the PS/ZnO photocatalyst for oil and COD degradation while performing five cycles.
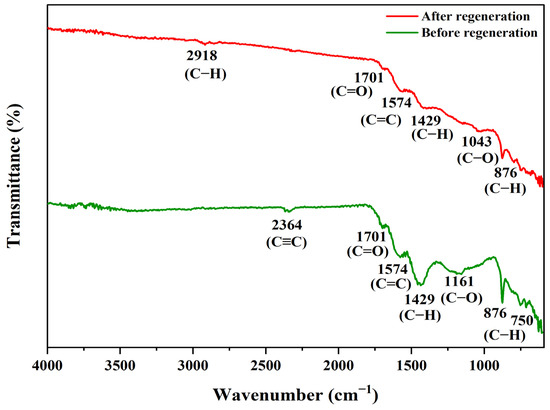
Figure 22.
FTIR of PS/ZnO before and after regeneration.
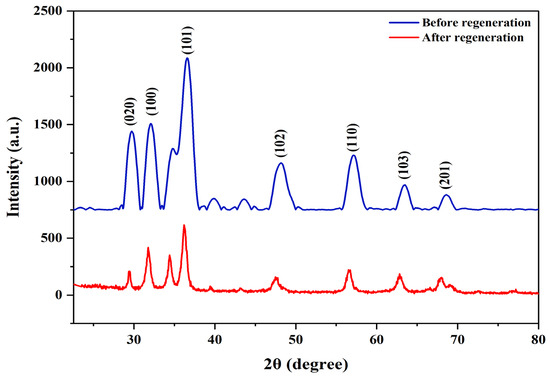
Figure 23.
XRD of PS/ZnO before and after regeneration.
3.7. Comparison with the Previous Studies
Table 6 is a comparison between the photocatalytic activity of the developed PS/ZnO photocatalyst and that reported for other ZnO-based photocatalysts supported on different types of biochar for the degradation of contaminants from wastewater. As shown in the table, no previous studies have utilized biochar derived from pistachio shells for the photocatalytic degradation of oil and COD in petroleum wastewater. Moreover, none have reported using ZnO/biochar composites specifically for the degradation of oil in wastewater. Therefore, the novel PS/ZnO photocatalyst demonstrates promising potential as an eco-friendly material for the efficient removal of oil and COD from petroleum wastewater under both UV and sunlight irradiation.
Table 6.
Comparative study between the various types of biochar/ZnO applied for the degradation of pollutants from wastewater.
4. Conclusions
This study fabricated biochar/ZnO as a photocatalyst by loading ZnO onto biochar prepared from the waste of pistachio shells (PSs) for the first time in the synthesis of PS/ZnO and employed it in the treatment of petroleum wastewater for the removal of oil and COD. The analyses (DLS, XRD, FTIR, EDX, BET, Eg, and FESEM) that described PS/ZnO characterization prove that it has good properties, and ZnO nanoparticles were successfully loaded onto the surface of PS. This study showed that the degradation efficiencies of oil and COD increased as the PS/ZnO dose and irradiation time increased, and decreased with pH and oil concentration. The optimum conditions (pH = 2, catalyst = 0.13 g, and oil = 50 ppm) for oil removal and (pH = 2, catalyst = 0.122 g, and COD = 125 ppm) for COD removal were achieved at 90 min of irradiation under UV (4 lamps). The removal of oil and COD was 97.37% and 94.18% as determined by CCD with the MINITAB®22 software. The results confirmed that sunlight is a better source for pollutant degradation (80% oil removal, 78.28% COD removal) than UV light (77.5% oil removal, 75.52% COD removal). Therefore, it is recommended to enhance the activity of ZnO by loading it onto biochar to achieve excellent degradation of oil and COD. Based on the results of this study, the oil and COD contents were reduced to levels below the minimum allowable limits (oil < 5 ppm, COD < 100 ppm) for discharging treated water into the receiving water bodies or for reusing it for different purposes, such as irrigating crops and industrial processes.
Author Contributions
E.A.D.: Conceptualization, Methodology, Investigation, Data curation, Writing-original draft; T.J.M. and B.A.A.-T.: Methodology, Investigation, Writing-original draft, Supervision; E.H.K.: Writing-review and editing, Supervision. All authors have read and agreed to the published version of the manuscript.
Funding
This research received no external funding.
Data Availability Statement
Data is contained within the article.
Acknowledgments
The authors are grateful to the College of Chemical Engineering at the University of Technology—Iraq.
Conflicts of Interest
The authors declare no conflict of interest.
References
- Igunnu, E.T.; Chen, G.Z. Produced water treatment technologies. Int. J. Low-Carbon Technol. 2014, 9, 157–177. [Google Scholar] [CrossRef]
- Khader, E.H.; Mohammed, T.J.; Albayati, T.M.; Rashid, K.T.; Saady, N.M.C.; Zendehboudi, S. Green nanoparticles blending with polyacrylonitrile ultrafiltration membrane for antifouling oily wastewater treatment. Sep. Purif. Technol. 2025, 353, 128256. [Google Scholar] [CrossRef]
- Khader, E.H.; Abbood, N.S.; Albyati, T.N.; Mohammed, T.J. Performance evaluation of integral process for treatment of oilfield wastewater. In AIP Conference Proceedings; AIP Publishing: Melville, NY, USA, 2022; Volume 2443, pp. 1–11. [Google Scholar]
- Al-Ghouti, M.A.; Al-Kaabi, M.A.; Ashfaq, M.Y.; Da’na, D.A. Produced water characteristics, treatment and reuse: A review. J. Water Process Eng. 2019, 28, 222–239. [Google Scholar] [CrossRef]
- Khader, E.H.; Khudhur, R.H.; Mohammed, T.J.; Mahdy, O.S.; Sabri, A.A.; Mahmood, A.S.; Albayati, T.M. Evaluation of adsorption treatment method for removal of phenol and acetone from industrial wastewater. Desalination Water Treat. 2024, 317, 100091. [Google Scholar] [CrossRef]
- Shakir, H.A.; Mageed, A.K.; Alsaffar, M.A.; Ghany, M.A.R.A. Effect of process parameters and optimization of photocatalytic removal of lead from wastewater over CuZn oxide nanocomposite using response surface methodology. Res. Chem. 2025, 15, 102255. [Google Scholar]
- Fang, S.Y.; Zhang, P.; Gong, J.L.; Tang, L.; Zeng, G.M.; Song, B.; Cao, W.C.; Li, J.; Ye, J. Construction of highly water-stable metal-organic framework UiO-66 thin-film composite membrane for dyes and antibiotics separation. Chem. Eng. J. 2020, 385, 123400. [Google Scholar] [CrossRef]
- Shakir, H.A.; Alsaffar, M.A.; Mageed, A.K.; Sukkar, K.A.; Ghany, M.A.A. Optimizing Photocatalytic Lead Removal from Wastewater Using ZnO/ZrO2: A Response Surface Methodology Approach. ChemEngineering 2024, 8, 72. [Google Scholar] [CrossRef]
- Khader, E.H.; Mohammed, T.J.; Albayati, T.M.; Harharah, H.N.; Amari, A.; Saady, N.M.C.; Zendehboudi, S. Current trends for wastewater treatment technologies with typical configurations of photocatalytic membrane reactor hybrid systems: A review. Chem. Eng. Process. Process Intensif. 2023, 192, 109503. [Google Scholar] [CrossRef]
- Dai, B.; Zhao, W.; Huang, H.; Li, S.; Yang, G.; Wu, H.; Sun, C.; Leung, D.Y. Constructing an ohmic junction of copper@ cuprous oxide nanocomposite with plasmonic enhancement for photocatalysis. J. Colloid Interface Sci. 2022, 616, 163–176. [Google Scholar] [CrossRef]
- Rani, M.; Shanker, U. Green synthesis of TiO2 and its photocatalytic activity. In Handbook of Smart Photocatalytic Materials; Elsevier: Amsterdam, The Netherlands, 2020; pp. 11–61. [Google Scholar]
- An, Z.; Sánchez-Montes, I.; Chelme-Ayala, P.; Chen, C.; El-Din, M.G. Efficient degradation of naphthenic acids in water using a sustainable engineered biochar/ZnO composite under simulated solar light. Chem. Eng. J. 2024, 489, 151308. [Google Scholar] [CrossRef]
- Rostocki, A.; Unyay, H.; Ławińska, K.; Obraniak, A. Granulates based on bio and industrial waste and biochar in a sustainable economy. Energies 2022, 16, 56. [Google Scholar] [CrossRef]
- Parthasarathy, P.; Al-Ansari, T.; Mackey, H.R.; Narayanan, K.S.; McKay, G. A review on prominent animal and municipal wastes as potential feedstocks for solar pyrolysis for biochar production. Fuel 2022, 316, 123378. [Google Scholar] [CrossRef]
- Silvestri, S.; Gonçalves, M.G.; da Silva Veiga, P.A.; da Silva Matos, T.T.; Peralta-Zamora, P.; Mangrich, A.S. TiO2 supported on Salvinia molesta biochar for heterogeneous photocatalytic degradation of Acid Orange 7 dye. J. Environ. Chem. Eng. 2019, 7, 102879. [Google Scholar] [CrossRef]
- Singh, A.K.; Giannakoudakis, D.A.; Arkas, M.; Triantafyllidis, K.S.; Nair, V. Composites of lignin-based biochar with BiOCl for photocatalytic water treatment: RSM studies for process optimization. Nanomaterials 2023, 13, 735. [Google Scholar] [CrossRef]
- Yu, J.; Jiang, C.; Guan, Q.; Ning, P.; Gu, J.; Chen, Q.; Zhang, J.; Miao, R. Enhanced removal of Cr (VI) from aqueous solution by supported ZnO nanoparticles on biochar derived from waste water hyacinth. Chemosphere 2018, 195, 632–640. [Google Scholar] [CrossRef]
- Sanei, A.; Dashtian, K.; Seyf, J.Y.; Seidi, F.; Kolvari, E. Biomass derived reduced-graphene-oxide supported α-Fe2O3/ZnO S-scheme heterostructure: Robust photocatalytic wastewater remediation. J. Environ. Manag. 2023, 332, 117377. [Google Scholar] [CrossRef]
- Gonçalves, N.P.; Lourenço, M.A.; Baleuri, S.R.; Bianco, S.; Jagdale, P.; Calza, P. Biochar waste-based ZnO materials as highly efficient photocatalysts for water treatment. J. Environ. Chem. Eng. 2022, 10, 107256. [Google Scholar] [CrossRef]
- Kir, I.; Laouini, S.E.; Meneceur, S.; Bouafia, A.; Mohammed, H.A.M. Biosynthesis and characterization of novel nanocomposite ZnO/BaMg2 efficiency for high-speed adsorption of AZO dye. Biomass Convers. Biorefin. 2024, 14, 19045–19054. [Google Scholar] [CrossRef]
- Yusuff, A.S. Adsorption of hexavalent chromium from aqueous solution by Leucaena leucocephala seed pod activated carbon: Equilibrium, kinetic and thermodynamic studies. Arab J. Basic Appl. Sci. 2019, 26, 89–102. [Google Scholar]
- Ahmad, F.; Maqsood, A. Influence of nickel dopant on impedance, dielectric, and optical properties of ZnO nanoparticles at low temperatures. J. Mater. Sci. Mater. Electron. 2022, 33, 12674–12700. [Google Scholar] [CrossRef]
- Du, Z.; Li, Q.; Li, J.; Su, E.; Liu, X.; Wan, Z.; Yang, X. Self-assembled egg yolk peptide micellar nanoparticles as a versatile emulsifier for food-grade oil-in-water Pickering nanoemulsions. J. Agric. Food Chem. 2019, 67, 11728–11740. [Google Scholar] [CrossRef]
- Aminuzzaman, M.; Ying, L.P.; Goh, W.S.; Watanabe, A. Green synthesis of zinc oxide nanoparticles using aqueous extract of Garcinia mangostana fruit pericarp and their photocatalytic activity. Bull. Mater. Sci. 2018, 41, 1–10. [Google Scholar] [CrossRef]
- Badry, R.; Sabry, N.M.; Ibrahim, M.A. Enhancing the structural and optoelectronic properties of carboxymethyl cellulose sodium filled with ZnO/GO and CuO/GO nanocomposites for antimicrobial packaging applications. Sci. Rep. 2024, 14, 30591. [Google Scholar] [CrossRef]
- Altintas Yildirim, O.; Hasan, M.M.; Pehlivan, E. Synthesis and performance evaluation of biochar-supported ZTO nanocatalyst for photodegradation of Rhodamine B in water. J. Mater. Res. 2024, 39, 576589. [Google Scholar] [CrossRef]
- Bopape, D.A.; Mathobela, S.; Matinise, N.; Motaung, D.E.; Hintsho-Mbita, N.C. Green synthesis of CuO-TiO2 nanoparticles for the degradation of organic pollutants: Physical, optical and electrochemical properties. Catalysts 2023, 13, 163. [Google Scholar] [CrossRef]
- Alharthi, F.A.; Alshayiqi, A.A.; Al-Nafaei, W.S.; El Marghany, A.; Alanazi, H.S.; Hasan, I. Synthesis of nanocrystalline metal tungstate NiWO4/CoWO4 heterojunction for UV-light-assisted degradation of paracetamol. Catalysts 2023, 13, 152. [Google Scholar] [CrossRef]
- Devi, M.; Rawat, S.; Sharma, S. A comprehensive review of the pyrolysis process: From carbon nanomaterial synthesis to waste treatment. Oxf. Open Mater. Sci. 2021, 1, itab014. [Google Scholar] [CrossRef]
- Naji, H.K.; Oda, A.M.; Abdulaljeleel, W.; Abdilkadhim, H.; Hefdhi, R. ZNO-Ag/PS and ZnO/PS films for photocatalytic degradation of methylene blue. Indones. J. Chem. 2020, 20, 314–323. [Google Scholar] [CrossRef]
- Jing, H.; Ji, L.; Wang, Z.; Guo, J.; Lu, S.; Sun, J.; Cai, L.; Wang, Y. Synthesis of ZnO nanoparticles loaded on biochar derived from spartina alterniflora with superior photocatalytic degradation performance. Nanomaterials 2021, 11, 2479. [Google Scholar] [CrossRef]
- Tauc, J.; Grigorovici, R.; Vancu, A. Optical properties and electronic structure of amorphous germanium. Phys. Status Solidi B 1966, 15, 627–637. [Google Scholar] [CrossRef]
- Haryński, Ł.; Olejnik, A.; Grochowska, K.; Siuzdak, K. A facile method for Tauc exponent and corresponding electronic transitions determination in semiconductors directly from UV–Vis spectroscopy data. Opt. Mater. 2022, 127, 112205. [Google Scholar] [CrossRef]
- Javanmard, A.; Bin Wan Daud, W.M.A.; Patah, M.F.A.; Zuki, F.M.; Verdugo, A.S. Harnessing the potential of biochar-based catalysts for sustainable adsorptive and photocatalytic applications: A comprehensive review. Process Saf. Environ. Prot. 2024, 189, 387–413. [Google Scholar] [CrossRef]
- Saeednia, S.; Iranmanesh, P.; Shabani, T. Green Synthesis of Pistachio Skin Extract-Mediated Zinc Oxide Nanoparticles for Photocatalytic Degradation of Organic Dyes. Inorg. Chem. Res. 2024, 8, 1–7. [Google Scholar]
- Fayazi, M. Synthesis of ZnO nanostructures with different morphologies on biochar support for photocatalytic degradation of organic dye. J. Water Environ. Nanotechnol. 2024, 9, 137–148. [Google Scholar]
- Jahani, F.; Maleki, B.; Mansouri, M.; Noorimotlagh, Z.; Mirzaee, S.A. Enhanced photocatalytic performance of milkvetch-derived biochar via ZnO–Ce nanoparticle decoration for reactive blue 19 dye removal. Sci. Rep. 2023, 13, 17824. [Google Scholar] [CrossRef]
- Eswaran, P.; Madasamy, P.D.; Pillay, K.; Brink, H. Sunlight-driven photocatalytic degradation of methylene blue using ZnO/biochar nanocomposite derived from banana peels. Biomass Convers. Biorefin. 2024, 15, 12347–12367. [Google Scholar] [CrossRef]
- Bordbar, M.; Mortazavimanesh, N. Biosynthesis of waste pistachio shell supported silver nanoparticles for the catalytic reduction processes. IET Nanobiotechnol. 2018, 12, 939–945. [Google Scholar] [CrossRef]
- Pasieczna-Patkowska, S.; Cichy, M.; Flieger, J. Application of Fourier Transform Infrared (FTIR) Spectroscopy in Characterization of Green Synthesized Nanoparticles. Molecules 2025, 30, 684. [Google Scholar] [CrossRef]
- Ibrahim, A.L.S.Y.; Mahmood, S.F.; Younis, A.L.S.A.; Fadhil, A.B. Pyrolysis of Mixed Date Stones and Pistachio Shells: Identification of Bio-Oil and Utilization of Bio-Char as Activated Carbon Precursor. Chem. Biodivers. 2023, 20, e202300103. [Google Scholar] [CrossRef]
- Gurusamy, M.; Thirumalaisamy, R.; Karuppusamy, M.; Sivanantham, G. Pistachio shell biochar as a reinforcing filler in short Turkish hemp fiber composites: A path toward sustainable materials. J. Polym. Res. 2025, 32, 1–26. [Google Scholar] [CrossRef]
- Qiu, B.; Shao, Q.; Shi, J.; Yang, C.; Chu, H. Application of biochar for the adsorption of organic pollutants from wastewater: Modification strategies, mechanisms and challenges. Sep. Purif. Technol. 2022, 300, 121925. [Google Scholar] [CrossRef]
- Xu, R.; Li, M.; Zhang, Q. Collaborative optimization for the performance of ZnO/biochar composites on persulfate activation through plant enrichment-pyrolysis method. Chem. Eng. J. 2022, 429, 132294. [Google Scholar] [CrossRef]
- Liu, L.; Chen, Z.; Zhang, J.; Shan, D.; Wu, Y.; Bai, L.; Wang, B. Treatment of industrial dye wastewater and pharmaceutical residue wastewater by advanced oxidation processes and its combination with nanocatalysts: A review. J. Water Process Eng. 2021, 42, 102122. [Google Scholar] [CrossRef]
- Leng, L.; Xiong, Q.; Yang, L.; Li, H.; Zhou, Y.; Zhang, W.; Jiang, S.; Li, H.; Huang, H. An overview on engineering the surface area and porosity of biochar. Sci. Total Environ. 2021, 763, 144204. [Google Scholar] [CrossRef]
- Han, M.; Liu, Z.; Huang, S.; Zhang, H.; Yang, H.; Liu, Y.; Zhang, K.; Zeng, Y. Application of Biochar-Based Materials for Effective Pollutant Removal in Wastewater Treatment. Nanomaterials 2024, 14, 1933. [Google Scholar] [CrossRef]
- Tuama, A.N.; Alzubaidi, L.H.; Jameel, M.H.; Abass, K.H.; bin Mayzan, M.Z.H.; Salman, Z.N. Impact of electron–hole recombination mechanism on the photocatalytic performance of ZnO in water treatment: A review. J. Sol-Gel Sci. Technol. 2024, 110, 792–806. [Google Scholar] [CrossRef]
- Amdeha, E. Biochar-based nanocomposites for industrial wastewater treatment via adsorption and photocatalytic degradation and the parameters affecting these processes. Biomass Convers. Biorefin. 2024, 14, 23293–23318. [Google Scholar] [CrossRef]
- Jagaba, A.H.; Kutty, S.R.M.; Abubakar, S.; Birniwa, A.H.; Lawal, I.M.; Umaru, I.; Usman, A.K.; Yaro, N.S.A.; Al-Zaqri, N.; Al-Maswari, B.M.; et al. Synthesis, characterization, and performance evaluation of hybrid waste sludge biochar for COD and color removal from agro-industrial effluent. Separations 2022, 9, 258. [Google Scholar] [CrossRef]
- Lopičić, Z.R.; Šoštarić, T.D.; Milojković, J.V.; Antanasković, A.V.; Milić, J.S.; Spasić, S.D.; Avdalović, J.S. Efficient removal of water soluble fraction of diesel oil by biochar sorption supported by microbiological degradation. Processes 2024, 12, 964. [Google Scholar] [CrossRef]
- Lu, Y.; Cai, Y.; Zhang, S.; Zhuang, L.; Hu, B.; Wang, S.; Chen, J.; Wang, X. Application of biochar-based photocatalysts for adsorption-(photo) degradation/reduction of environmental contaminants: Mechanism, challenges and perspective. Biochar 2022, 4, 45. [Google Scholar] [CrossRef]
- John, K.I.; Issa, T.B.; Ho, G.; Nikoloski, A.N.; Li, D. Enhanced Adsorption and Photocatalytic Degradation of Organics Using La-doped g-C3N4 with Ag NPs. Water Cycle 2025, 6, 151–175. [Google Scholar] [CrossRef]
- Umar, M.; Aziz, H.A. Photocatalytic degradation of organic pollutants in water. Org. Pollut. Monit. Risk Treat. 2013, 8, 196–197. [Google Scholar]
- Santoso, S.P.; Angkawijaya, A.E.; Bundjaja, V.; Hsieh, C.W.; Go, A.W.; Yuliana, M.; Hsu, H.Y.; Tran-Nguyen, P.L.; Soetaredjo, F.E.; Ismadji, S. TiO2/guar gum hydrogel composite for adsorption and photodegradation of methylene blue. Int. J. Biol. Macromol. 2021, 193, 721–733. [Google Scholar] [CrossRef]
- Wang, X.; Wang, F.; Sang, Y.; Liu, H. Full-spectrum solar-light-activated photocatalysts for light–chemical energy conversion. Adv. Energy Mater. 2017, 7, 1700473. [Google Scholar] [CrossRef]
- Chen, C.; Ma, W.; Zhao, J. Semiconductor-mediated photodegradation of pollutants under visible-light irradiation. Chem. Soc. Rev. 2010, 39, 4206–4219. [Google Scholar] [CrossRef]
- Li, X.; Chen, Y.; Tao, Y.; Shen, L.; Xu, Z.; Bian, Z.; Li, H. Challenges of photocatalysis and their coping strategies. Chem Catal. 2022, 2, 1315–1345. [Google Scholar] [CrossRef]
- Matafonova, G.; Batoev, V. Recent advances in application of UV light-emitting diodes for degrading organic pollutants in water through advanced oxidation processes: A review. Water Res. 2018, 132, 177–189. [Google Scholar] [CrossRef]
- Jo, W.K.; Tayade, R.J. New generation energy-efficient light source for photocatalysis: LEDs for environmental applications. Ind. Eng. Chem. Res. 2014, 53, 2073–2084. [Google Scholar] [CrossRef]
- Arora, I.; Chawla, H.; Chandra, A.; Sagadevan, S.; Garg, S. Advances in the strategies for enhancing the photocatalytic activity of TiO2: Conversion from UV-light active to visible-light active photocatalyst. Inorg. Chem. Commun. 2022, 143, 109700. [Google Scholar] [CrossRef]
- Kong, E.D.H.; Lai, C.W.; Juan, J.C.; Pang, Y.L.; Khe, C.S.; Badruddin, I.A.; Gapsari, F.; Anam, K. Recent advances in titanium dioxide bio-derived carbon photocatalysts for organic pollutant degradation in wastewater. iScience 2025, 28, 112368. [Google Scholar] [CrossRef]
- Tan, S.N.; Yuen, M.L.; Ramli, R.A. Photocatalysis of Dyes: Operational Parameters, Mechanisms, and Degradation Pathway. Green Anal. Chem. 2025, 12, 100230. [Google Scholar] [CrossRef]
- Kubiak, A.; Dozzi, M.V.; Montalbano, M.; Cegłowski, M. LED-driven photodeposition of Pt nanoparticles on TiO2: Combined effects of titania crystallinity and adopted wavelength on photoactivity. Arab. J. Chem. 2024, 17, 105846. [Google Scholar] [CrossRef]
- Husain, A.; Al-Harthi, M.A. Chemical treatment of oilfield wastewater and the effect of temperature on treatment efficiency: A review. J. Pet. Sci. Eng. 2023, 220, 111089. [Google Scholar] [CrossRef]
- Khader, E.H.; Mohammed, T.J.; Albayati, T.M.; Saady, N.M.C.; Zendehboudi, S. Green nanocatalyst for the photocatalytic degradation of organic pollutants in petroleum refinery wastewater: Synthesis, characterization, and optimization. J. Mol. Struct. 2024, 1304, 137688. [Google Scholar] [CrossRef]
- Di Leo, G.; Sardanelli, F. Statistical significance: p value, 0.05 threshold, and applications to radiomics—Reasons for a conservative approach. Eur. Radiol. Exp. 2020, 4, 1–8. [Google Scholar] [CrossRef]
- Mohammadi, L.; Rahdar, A.; Bazrafshan, E.; Dahmardeh, H.; Susan, M.A.B.H.; Kyzas, G.Z. Petroleum hydrocarbon removal from wastewaters: A review. Processes 2020, 8, 447. [Google Scholar] [CrossRef]
- Nodehi, R.N.; Sheikhi, R.; Gholami, M. Application of response surface methodology in the photocatalytic removal of pollutants–a systematic review: The characteristics, common mistakes, and the qualitative evaluation of articles. Results Chem. 2024, 8, 101584. [Google Scholar] [CrossRef]
- El-Gawad, H.A.; Ebrahiem, E.E.; Ghaly, M.Y.; Afify, A.A.; Mohamed, R.M. An application of advanced oxidation process on industrial crude oily wastewater treatment. Sci. Rep. 2023, 13, 3420. [Google Scholar] [CrossRef]
- Wang, X.; Sun, T.; Zhu, H.; Han, T.; Wang, J.; Dai, H. Roles of pH, cation valence, and ionic strength in the stability and aggregation behavior of zinc oxide nanoparticles. J. Environ. Manag. 2020, 267, 110656. [Google Scholar] [CrossRef]
- Nosaka, Y.; Nosaka, A.Y. Generation and detection of reactive oxygen species in photocatalysis. Chem. Rev. 2017, 117, 11302–11336. [Google Scholar] [CrossRef]
- Tetteh, E.K.; Rathilal, S.; Naidoo, D.B. Photocatalytic degradation of oily waste and phenol from a local South Africa oil refinery wastewater using response methodology. Sci. Rep. 2020, 10, 8850. [Google Scholar] [CrossRef]
- Suara, M.A.; Ganiyu, S.O.; Paul, S.; Stafford, J.L.; El-Din, M.G. Solar-activated zinc oxide photocatalytic treatment of real oil sands process water: Effect of treatment parameters on naphthenic acids, polyaromatic hydrocarbons and acute toxicity removal. Sci. Total Environ. 2022, 819, 153029. [Google Scholar] [CrossRef]
- Yusuff, A.S.; Obende, B.A.; Egbosiuba, T.C. Photocatalytic decolorization of textile effluent over ZnO nanoparticles immobilized on eucalyptus bark biochar: Parametric optimization, kinetic and economic analyses. Water Resour. Ind. 2024, 31, 100245. [Google Scholar] [CrossRef]
- Chen, M.; Bao, C.; Hu, D.; Jin, X.; Huang, Q. Facile and low-cost fabrication of ZnO/biochar nanocomposites from jute fibers for efficient and stable photodegradation of methylene blue dye. J. Anal. Appl. Pyrolysis 2019, 139, 319–332. [Google Scholar] [CrossRef]
- Argyle, M.D.; Bartholomew, C.H. Heterogeneous catalyst deactivation and regeneration: A review. Catalysts 2015, 5, 145–269. [Google Scholar] [CrossRef]
- Wei, K.; Faraj, Y.; Yao, G.; Xie, R.; Lai, B. Strategies for improving perovskite photocatalysts reactivity for organic pollutants degradation: A review on recent progress. Chem. Eng. J. 2021, 414, 128783. [Google Scholar] [CrossRef]
- Lei, H.; Cui, X.; Jia, X.; Qi, J.; Wang, Z.; Chen, W. Enhanced tribocatalytic degradation of organic pollutants by ZnO nanoparticles of high crystallinity. Nanomaterials 2022, 13, 46. [Google Scholar] [CrossRef]
- Jamil, H.; Faizan, M. Facile synthesis of ZnO nanoparticles using Nigella Sativa extract and its role as catalyst in production of bio-oil and degradation of methylene blue dye. Heliyon 2024, 10, 1–16. [Google Scholar] [CrossRef]
- Bhakta, A.K.; Tang, M.; Snoussi, Y.; Khalil, A.M.; Mascarenhas, R.J.; Mekhalif, Z.; Abderrabba, M.; Ammar, S.; Chehimi, M.M. Sweety, salty, sour, and romantic biochar-supported ZnO: Highly active composite catalysts for environmental remediation. Emergent Mater. 2023, 13, 1–15. [Google Scholar] [CrossRef]
- Amir, M.; Fazal, T.; Iqbal, J.; Din, A.A.; Ahmed, A.; Ali, A.; Razzaq, A.; Ali, Z.; Rehman, M.S.U.; Park, Y.K. Integrated adsorptive and photocatalytic degradation of pharmaceutical micropollutant, ciprofloxacin employing biochar-ZnO composite photocatalysts. J. Ind. Eng. Chem. 2022, 115, 171–182. [Google Scholar] [CrossRef]
- Cai, H.; Zhang, D.; Ma, X.; Ma, Z. A novel ZnO/biochar composite catalysts for visible light degradation of metronidazole. Sep. Purif. Technol. 2022, 288, 120633. [Google Scholar] [CrossRef]
- Demarema, S.; Nasr, M.; Ookawara, S.; Abdelhaleem, A. Enhanced synergistic system for the persulfate activation under visible light using novel N–ZnO photocatalyst supported on Lantana camara-based biochar. Chemosphere 2024, 349, 140840. [Google Scholar] [CrossRef]
Disclaimer/Publisher’s Note: The statements, opinions and data contained in all publications are solely those of the individual author(s) and contributor(s) and not of MDPI and/or the editor(s). MDPI and/or the editor(s) disclaim responsibility for any injury to people or property resulting from any ideas, methods, instructions or products referred to in the content. |
© 2025 by the authors. Licensee MDPI, Basel, Switzerland. This article is an open access article distributed under the terms and conditions of the Creative Commons Attribution (CC BY) license (https://creativecommons.org/licenses/by/4.0/).