Article

Fischer–Tropsch Synthesis: Effect of CO Conversion over Ru/NaY Catalyst

1
Center for Applied Energy Research, University of Kentucky, Lexington, KY 40511, USA
2
College of Smart Energy, Shanghai Jiao Tong University, Shanghai 200240, China
3
Department of Biomedical Engineering and Chemical Engineering, University of Texas at San Antonio, San Antonio, TX 78249, USA
4
Department of Mechanical Engineering, University of Texas at San Antonio, San Antonio, TX 78249, USA
5
Electron Microscopy Center, University of Kentucky, Lexington, KY 40506, USA
*
Author to whom correspondence should be addressed.
Reactions 2025, 6(2), 31; https://doi.org/10.3390/reactions6020031
Submission received: 24 March 2025 / Revised: 19 April 2025 / Accepted: 22 April 2025 / Published: 1 May 2025
(This article belongs to the Special Issue Fischer-Tropsch Synthesis: Bridging Carbon Sustainability)

Abstract

:
Unlike on Fe and Co catalysts, the CO conversion effect on Ru catalyst performance is little reported. This study is undertaken to explore the issue using a series of Ru/NaY catalysts under 200–230 °C, 2.0 MPa, H2/CO = 2, and 10–60% CO conversion in a 1 L continuous stirred tank reactor (CSTR). The results are comparatively studied with those of Fe and Co catalysts reported previously. The NaY support and four 1.0%, 2.5%, 5.0%, and 7.5% Ru/NaY catalysts were characterized by BET, H2 chemisorption, H2O-TPD, XRD, HRTEM, and XANES/EXAFS techniques. The BET and XRD results suggest a high surface area (730 m2/g), high degree of crystallinity of the NaY support, and high dispersion of Ru, while an hcp Ru structure and well-reduced Ru were reflected in the HR-TEM FFT and XANES/EXAFS results. The reaction results indicate that the CO conversion effect on CH4 and C5+ selectivities on the Ru is the same as that on the Fe and Co catalysts, with CH4 selectivity decreasing and C5+ selectivity increasing with increasing CO conversion. However, the CO conversion effect on olefin formation for the Ru catalyst was found to be opposite to that of the Fe and Co; increasing CO conversion enhanced olefin formation but suppressed secondary reactions of 1-olefins. The H2O cofeeding experiments showed that H2O impacted olefin formation by suppressing hydrogen adsorption and hydrogenation. The H2O-TPD experiment evidenced a much stronger H2O adsorption capacity (6.8 mmol/g-cat) on Ru followed by Co (1 mmol/g-cat), and then Fe (0.2 mmol/g-cat)., which showed only a very low H2O adsorption capacity.This finding may explain the opposite CO conversion effect on olefin formation observed on the Ru catalyst, and may also explain why low CH4 selectivity (i.e., 3%) occurred on the Ru catalyst and high CH4 selectivity (i.e., 6–8%) occurred on the Co catalyst, both of which possess low water gas shift (WGS) activity.

1. Introduction

Over the next two to three decades, fossil fuels are forecasted to continuously dominate the energy market, accounting for 77–84% of energy consumptions from now to 2040 and 71.5% by 2050 [1]. Thus, Fischer–Tropsch synthesis (FTS) is still one of the important techniques to convert the syngas derived from various carbon resources such as coal, biomass, natural gas, organic waste, and CO2 emitted from various industrial processes (e.g., power plants, steel plants, and cement plants). The technology not only increases national energy security and reduces the consumption of fossil fuels, but it can also promote carbon utilization efficiency, reducing net carbon emissions, and as a consequence, can assist in attaining the national goal of carbon neutrality by 2050 [2].
However, despite FTS having been extensively studied, including the development of catalysts and reactor technology [3,4,5,6,7,8,9,10,11,12,13,14,15,16,17,18], which have resulted in the commercialization of CTL/GTL plants in the world [3,15,19], there are still some important fundamental issues remaining unresolved. For example, over Ru catalysts, the effect of conversion and structure–function relationships need additional investigation due to either the lack of consistency of previous studies or the lack of detailed investigations.
Regarding the structure effect, earlier studies by the groups of Bell [20] and Iglesia [21] suggested structure insensitivity for the FTS reaction in the Ru size range 2–15.5 nm. The Ru TOF based on the CO rate or hydrocarbon rates was reported to be constant and independent of Ru dispersion. In recent years, there has been increasing interest in exploring the Ru particle size effect. For example, Carballo et al. [22] and Eslava et al. [23] reported constant TOF (ca. 0.105 s−1) in the larger Ru cluster range 7–23 nm at 240–250 °C, 0.2–1.5 MPa, and H2/CO = 2–10 using Ru/Al2O3 or 4–17%Ru/C; however, below 7–10 nm, the Ru activity (TOF) was found to decrease with decreasing Ru size, probably due to the oxidation and/or electronic effects of small Ru particles. However, in a subsequent study on Ru/Al2O3, Carballo et al. [24] observed that the initial TOF value increases with a Ru cluster size from 4 nm to 71 nm, which was ascribed to changing step sites on small and big Ru clusters. It appears that Ru TOF does depend on the mean size of Ru particles, with a peak TOF value and better C5+ selectivity present at a mean Ru size of approximately 7 nm or 2 nm [25,26]. Therefore, the Ru size effect is complicated, and additional study is needed to clarify the discrepancy. On Fe and Co catalysts, the structure effect has essentially achieved a consensus [27].
The effect of CO conversion is extremely important for FTS process development since it greatly impacts catalyst productivity, selectivity, and life. This topic has been systematically studied over Fe and Co catalysts in past years [28,29,30,31,32,33,34,35] and consistent results have been reported; that is, intrinsic CH4 selectivity decreases and intrinsic C5+ selectivity increases with increasing CO conversion on both catalysts [28,29,30,31,32,35]. However, a different scenario occurs at CO conversions greater than ~50% for typical iron catalysts and greater than ~80% for typical cobalt catalysts, at which points, the trends were reverse for both CH4 and C5+ selectivities. This was found to be due to the changes in the water gas shift reaction rate on the iron catalyst [33,34,35] and/or the impact of oxidation/deactivation on cobalt catalysts at the higher conversion levels [30,31,32]. An increase in CO conversion usually leads to a decrease in 1-olefin content and simultaneous increases in 2-olefin and paraffin contents. However, to date, little has been reported on the conversion effect on selectivity and stability for Ru catalysts.
The objective of this study is to investigate the effect of CO conversion on the selectivity and stability for Ru catalysts using a CSTR. Ru/NaY with different Ru loadings (1.0–7.5%) was used for the investigation. It is discovered that the CO conversion effects of Ru catalysts on CH4 and C5+ selectivity are similar to those of Fe and Co catalysts below a 60% conversion level. However, the trends of olefin and paraffin formation on Ru catalysts are quite different and opposite to those of Fe and Co catalysts. The results strongly support an important role played by adsorbed water species in olefin/paraffin formation on the catalyst surface, and this reflected different nature of Ru relative to Fe and Co catalysts towards the adsorption of H2O. It is concluded that there is stronger water adsorption (higher adsorption energy) on the Ru surface than on the Fe and Co catalyst surfaces, which was confirmed by H2O-TPD in this study. This in turn greatly inhibited the secondary reactions of olefins and resulted in a different CO conversion effect on Ru catalysts.
The surface area of the catalyst was characterized by BET, while the degree of crystallinity of the support and Ru was assessed by XRD. The degree of reduction and atomic structure were characterized using HR-TEM FFT and XANES/EXAFS.

2. Experimental Section

2.1. Catalyst Preparation

NaY zeolite (Sigma-Aldrich, St. Louis, MO, USA) (760 m2/g) was used as the support for the ruthenium catalyst. The catalyst was prepared by the incipient wetness impregnation (IWI) method, and ruthenium chloride (Alfa Aesar) was used as the precursor. In this method, one impregnation step was used to prepare the 1% and 2.5% Ru catalysts, while two impregnation steps (with interval drying) were used to prepare the 5.0% and 7.5% Ru catalysts. Between each step, the catalyst was dried overnight at 100 °C. After the final impregnation/drying step, the catalyst was calcined under air flow at 350 °C for 4 h. Regarding the preparation of 100Fe5.1Si2Cu1.3K, 0.27%Ag–25%Co/Al2O3, 0.27%Ru–25%Co/Al2O3, and 0.5%Pt–25%Co/Al2O3 discussed in this paper, co-precipitation and impregnation were employed, respectively.

2.2. Catalyst Characterization

2.2.1. Surface Area and Pore Size Distribution

The measurements of the BET surface area and porosity of the calcined catalysts were conducted using a Micromeritics Tri-Star system. Before performing the test, the temperature was gradually ramped to 160 °C and the sample was evacuated for at least 12 h to approximately 50 mTorr. The BET surface area, pore volume (single point), and average pore radius (single point) were obtained for each sample.

2.2.2. Hydrogen Chemisorption

Hydrogen chemisorption was conducted using temperature-programmed desorption (TPD) with a Zeton-Altamira AMI-200 instrument (Pittsburgh, PA, USA). The sample weight was typically ~0.220 g. Catalysts were activated in a flow of 10 cm3/min of H2 mixed with 20 cm3/min of argon at 300 °C for 10 h and then cooled under flowing H2/Ar to 100 °C. The sample was then held at 100 °C under flowing argon to remove and/or prevent the adsorption of weakly bound H2 species prior to increasing the temperature slowly to 300 °C, the reduction temperature of the catalyst. The catalyst was held under flowing argon to desorb the remaining chemisorbed hydrogen until the TCD signal returned to baseline. The TPD spectrum was integrated and the number of moles of desorbed hydrogen determined by comparing its area to the areas of calibrated hydrogen pulses. The loop volume was first determined by establishing a calibration curve with gas-tight syringe injections of nitrogen into a helium flow. Dispersion calculations were based on the assumption of a 1:1 H:Ru stoichiometric ratio and a spherical ruthenium cluster morphology.

2.2.3. X-Ray Diffraction (XRD)

X-ray diffraction (XRD) on the powder samples was performed for freshly reduced cobalt catalysts at room temperature using a Rigaku Diffractometer (DMAX-B, Tokyo, Japan) operating with Cu Kα radiation (1.54 Å). All Ru catalyst samples were reduced at 300 °C by 25%H2/He for 10 h followed by passivation using 1%O2/N2 gas mixture prior to conducting the XRD measurement.

2.2.4. High-Resolution Transmission Electron Microscopy (HR-TEM)/HAADF-STEM

Powder Ru/NaY catalyst samples were prepared following a standard reduction (300 °C for 10 h in hydrogen) and passivation (1%O2 in inert gas) procedure. Afterwards, a small fraction of the prepared sample was dispersed in ethanol and further treated in an ultrasonic bath for 20 min. Two drops of the uniformly dispersed catalyst solution were then added dropwise onto a carbon film on a copper grid (Lacey carbon film, 300 Mesh Cu, TED Pella Inc., Redding, USA). The copper grid was then left in a hood overnight to have the sample be completely dried. High-resolution transmission electron microscopy (HR-TEM) was performed on an FEI Talos F200X instrument operated at an accelerating voltage of 200 kV and with a point-to-point resolution of 0.1 nm. The TEM images were obtained at typical magnifications of 100 K to 1.05 M. Velox digital micrograph software was used to measure the Ru lattice interlayer space and EDX composition.

2.2.5. EXAFS/XANES

In situ H2-TPR XAFS studies were performed at the Materials Research Collaborative Access Team (MR-CAT) beamline at the Advanced Photon Source, Argonne National Laboratory. A cryogenically cooled Si (1 1 1) monochromator selected the incident energy and a rhodium-coated mirror rejected the higher-order harmonics of the fundamental beam energy. The experiment setup was similar to that outlined by Jacoby [36]. A stainless-steel multi-sample holder (3.0 mm i.d. channels) was used to monitor the in situ reduction of six samples during a single run. Between 40 and 55 mg of each sample was loaded as a self-supporting wafer in each channel. The holder was placed in the center of a quartz tube, equipped with gas and thermocouple ports and Kapton windows. The amount of sample used was optimized for the Ru K-edge. The quartz tube was placed in a clamshell furnace mounted on a positioning table. Each sample cell was positioned relative to the beam by finely adjusting the position of the table to an accuracy of 20 μm (for repeated scans). Once the sample positions were fine-tuned, the reactor was purged with helium for more than 5 min at 30 mL/min and then the reducing gas (H2/He, 4%) was flowed through the samples (30 mL/min) and a temperature ramp of ~8.5 °C/min was initiated for the furnace. When the samples reached 170 °C, they were maintained at this temperature for 60 min, and then temperature ramping continued to 300 °C. The temperature was held for 10 min at 300 °C, after which, the reactor was cooled to room temperature. Data reduction of the EXAFS/XANES spectra was carried out using the WinXAS program [37]. EXAFS fittings were carried out on the catalysts in their final state following activation and cooling using the Atoms [38], FEFF [39], and FEFFIT [40] programs. The k-range used for the fittings was 2.5–15 Å−1. Fitting was confined to the first Ru-Ru coordination shell by applying a Hanning window in the Fourier transform magnitude spectra, and carrying out the back-transform to isolate that shell.

2.3. Catalytic Activity Testing

The FTS experiments over different Ru/NaY catalysts were conducted using a 1 L continuously stirred tank reactor (CSTR) equipped with a magnetically driven stirrer with a turbine impeller, a gas inlet line, and a vapor outlet line with a stainless-steel (SS) fritted filter (2 μm) placed external to the reactor. A tube fitted with an SS fritted filter (0.5 μm opening) extending below the liquid level in the reactor was used to withdraw reactor wax (i.e., rewax, which is a solid at room temperature), thereby maintaining a relatively constant liquid level in the reactor. Separate mass flow controllers were used to control the flow rates of hydrogen and carbon monoxide fed to the reactor. Carbon monoxide was passed through a vessel containing lead oxide on alumina to remove traces of iron carbonyl prior to being mixed with hydrogen. The gases were then premixed in an equalization vessel and fed to the CSTR, entering below the stirrer, which was operated at 750 rpm. The reactor temperature was maintained constant (±1 °C) using a temperature controller.
A (15–22 g) sample from 170–325 mesh was loaded into a fixed-bed reactor for 12 h of ex situ reduction at 300 °C and atmospheric pressure using a gas mixture of H2/He (60 NL/h) with a molar ratio of 1:3. The reduced catalyst was transferred to a 1 L CSTR containing 300 g of melted Polywax 3000, under the protection of inert nitrogen gas. The transferred catalyst was further reduced in situ at 230 °C at atmospheric pressure using pure hydrogen (20 NL/h) for another 24 h before starting the FTS reaction. In this study, the FTS conditions were 200–230 °C, 2.0 MPa, H2/CO = 2, 1–3 NL/g-cat/h, and a stirrer speed of 750 rpm.
Tailgas, water, oil, and wax samples were collected daily and analyzed. Wax samples were collected in a 200 °C hot trap that was connected to the filter. The vapor phase in the region above the reactor slurry passed continuously through the warm (100 °C) and then the cold (0 °C) traps located external to the reactor. The oil and water liquid products were collected daily from the warm trap and cold trap. Tailgas exiting from the cold trap was analyzed with an online HP Quad Series Micro GC, providing molar compositions of C1–C7 olefins and paraffins, as well as H2, CO, and CO2. The total mass balance and elemental balances closed in the range of 97–102%.

3. Results and Discussion

3.1. Catalyst Characterization

3.1.1. BET and Hydrogen Chemisorption/Pulse Reoxidation

The BET surface area and pore size distribution of the NaY support and the Ru catalysts supported on NaY calcined at 350 °C are presented in Table 1. The surface area for the support was measured to be 730 m2/g. By increasing the ruthenium loading from 1.0 to 7.5%, the surface areas of the catalysts decreased to 661 m2/g and further to 461 m2/g, which represents decreases of 9.0–35%. For the supported ruthenium catalysts, if the metal oxide is not a major contributor to the surface area but rather only contributes to the mass, then the expected surface areas would be higher than the measured values listed in Table 1. These values indicate that there is some pore blockage in the supported ruthenium catalysts resulting from the ruthenium clusters. Furthermore, the average pore size of the catalysts shifts to slightly greater values relative to the support, i.e., 20 to 21.6 Å, again an indication of the narrower pores of the support being blocked.
The hydrogen chemisorption results of the Ru/NaY catalysts are also provided in Table 1. It is clearly observed that ruthenium dispersion decreases significantly from 20 to 2% with increases in Ru loading from 1.0 to 7.5%. This corresponds to a large increase in the Ru cluster size (i.e., from 6.6 nm to 63 nm), suggesting that the larger particles are located on the exterior of the NaY support (pore size of 2 nm). The high Ru dispersion observed for the low Ru loading (1.0%) catalyst is due to the strong interaction between ruthenium and NaY. The decrease in the Ru dispersion with increasing Ru loading should be due to the formation of larger ruthenium crystallites. From the hydrogen uptake values, the number of Ru active sites available on the NaY surface increases up to 2.5% and then it decreases beyond this loading, and this may be due to Ru agglomeration.

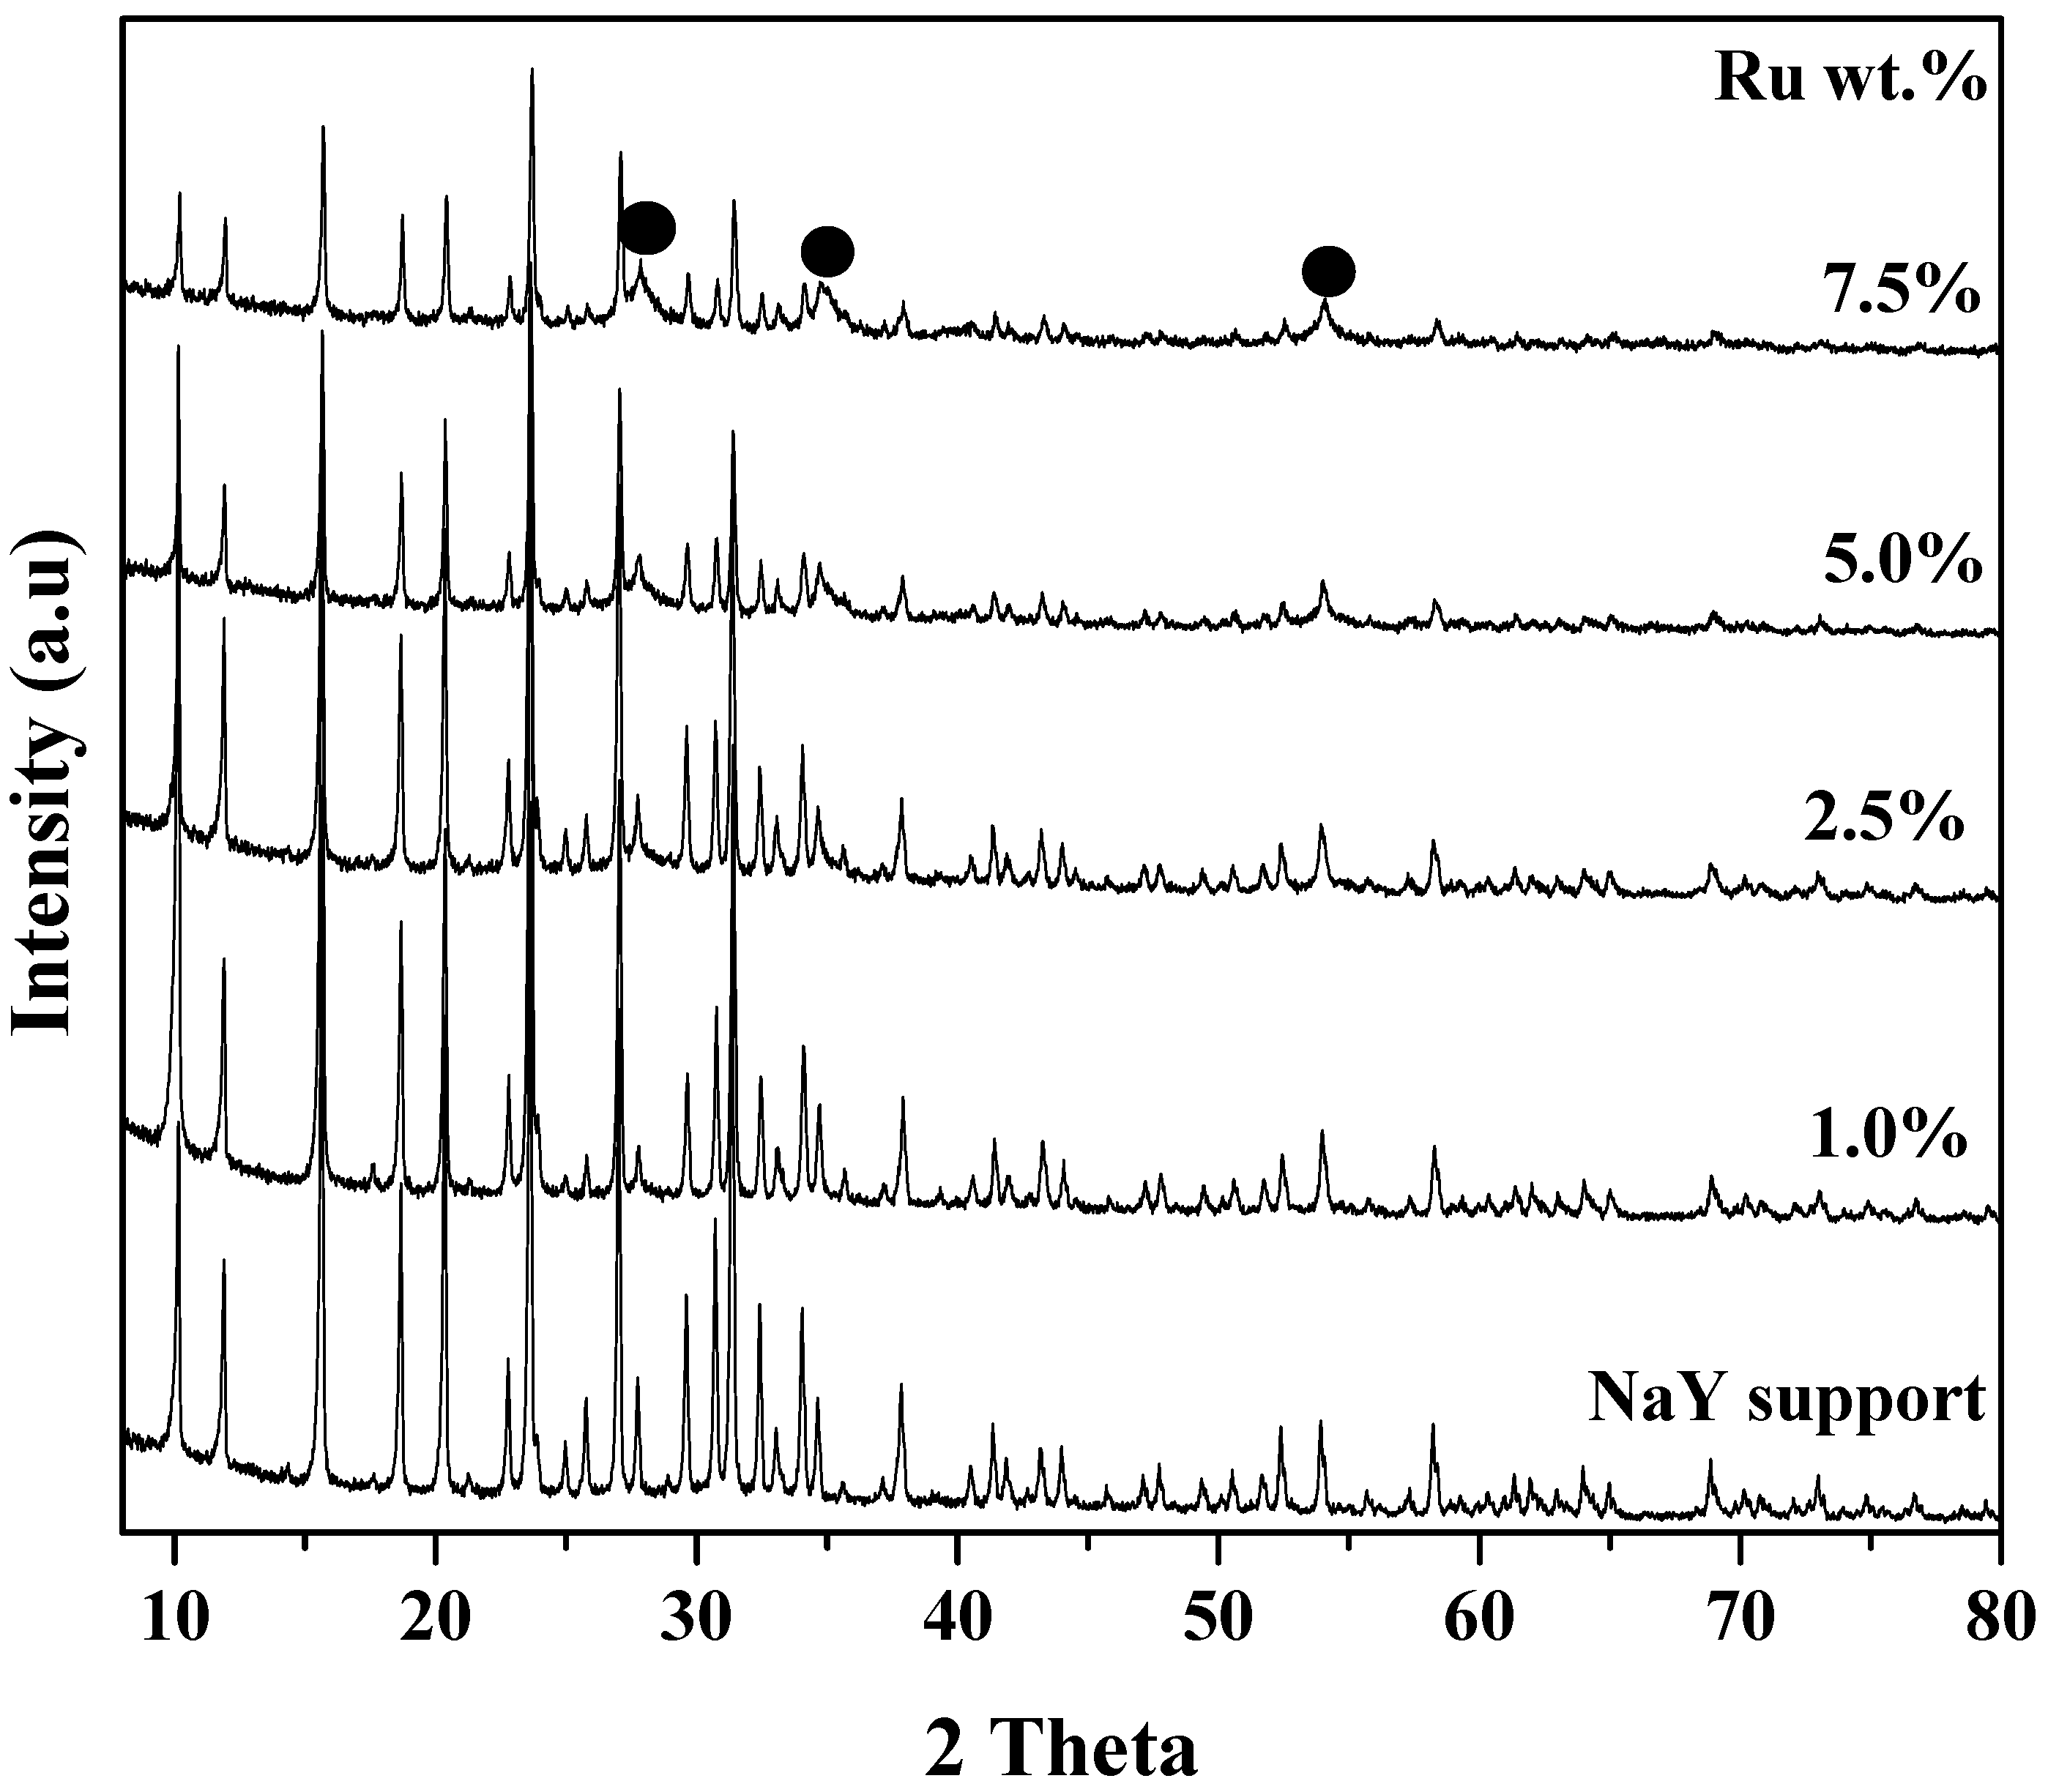
3.1.2. XRD Study of NaY and Ru/NaY Catalysts

The XRD spectra of the NaY support, 1%Ru, 2.5%Ru, 5%, and 7.5%Ru supported catalysts are depicted in Figure 1. It is seen that the XRD pattern of the NaY support exhibits sharp and well-defined peaks, indicating a high degree of crystallinity. Nine intense reflections at 2θ of 10°, 12°, 15°, 18°, 20°, 23°, 27°, 29.5°, and 31° are observed for the NaY support. After loading 1–7.5% Ru, the XRD patterns of the Ru/NaY catalysts do not change except that the peak intensities were slightly lower. Interestingly, the characteristic Ru peaks that usually occur at 2θ values of 42.2° and 44.5 were absent or too weak to be detected in all XRD patterns of the catalysts. The peaks indicated by three dots positioned at 27.5 °, 35.1 °, and 54.9 ° were assigned to RuO2. This indicates that metallic Ru readily oxidized to RuO2 at low temperatures such as 350 °C, and/or ruthenium is highly dispersed on the NaY support.

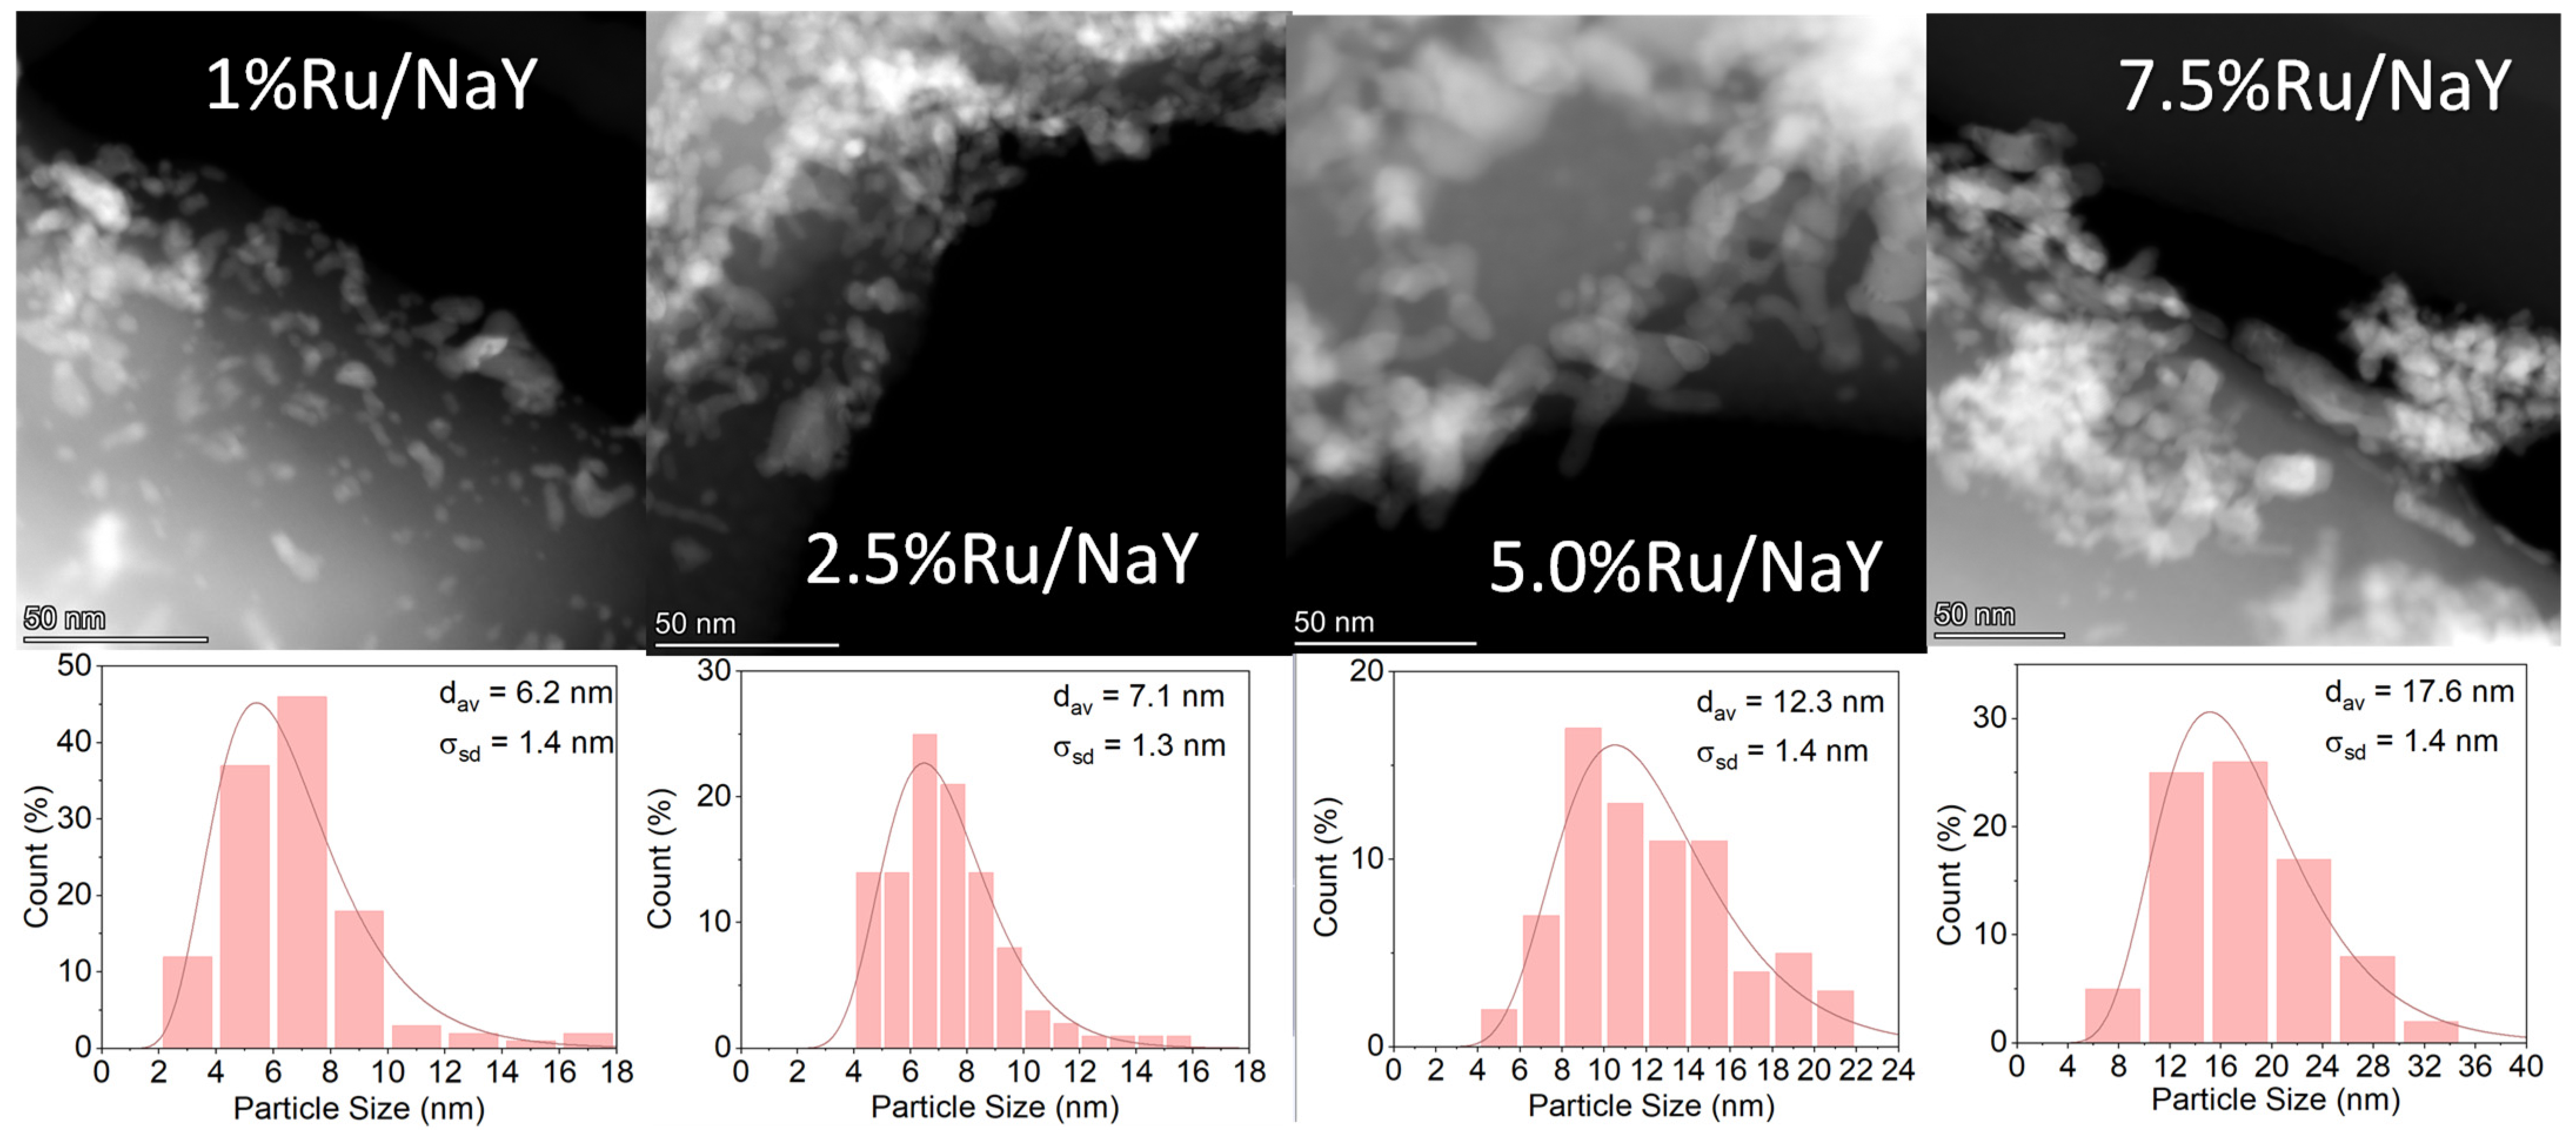
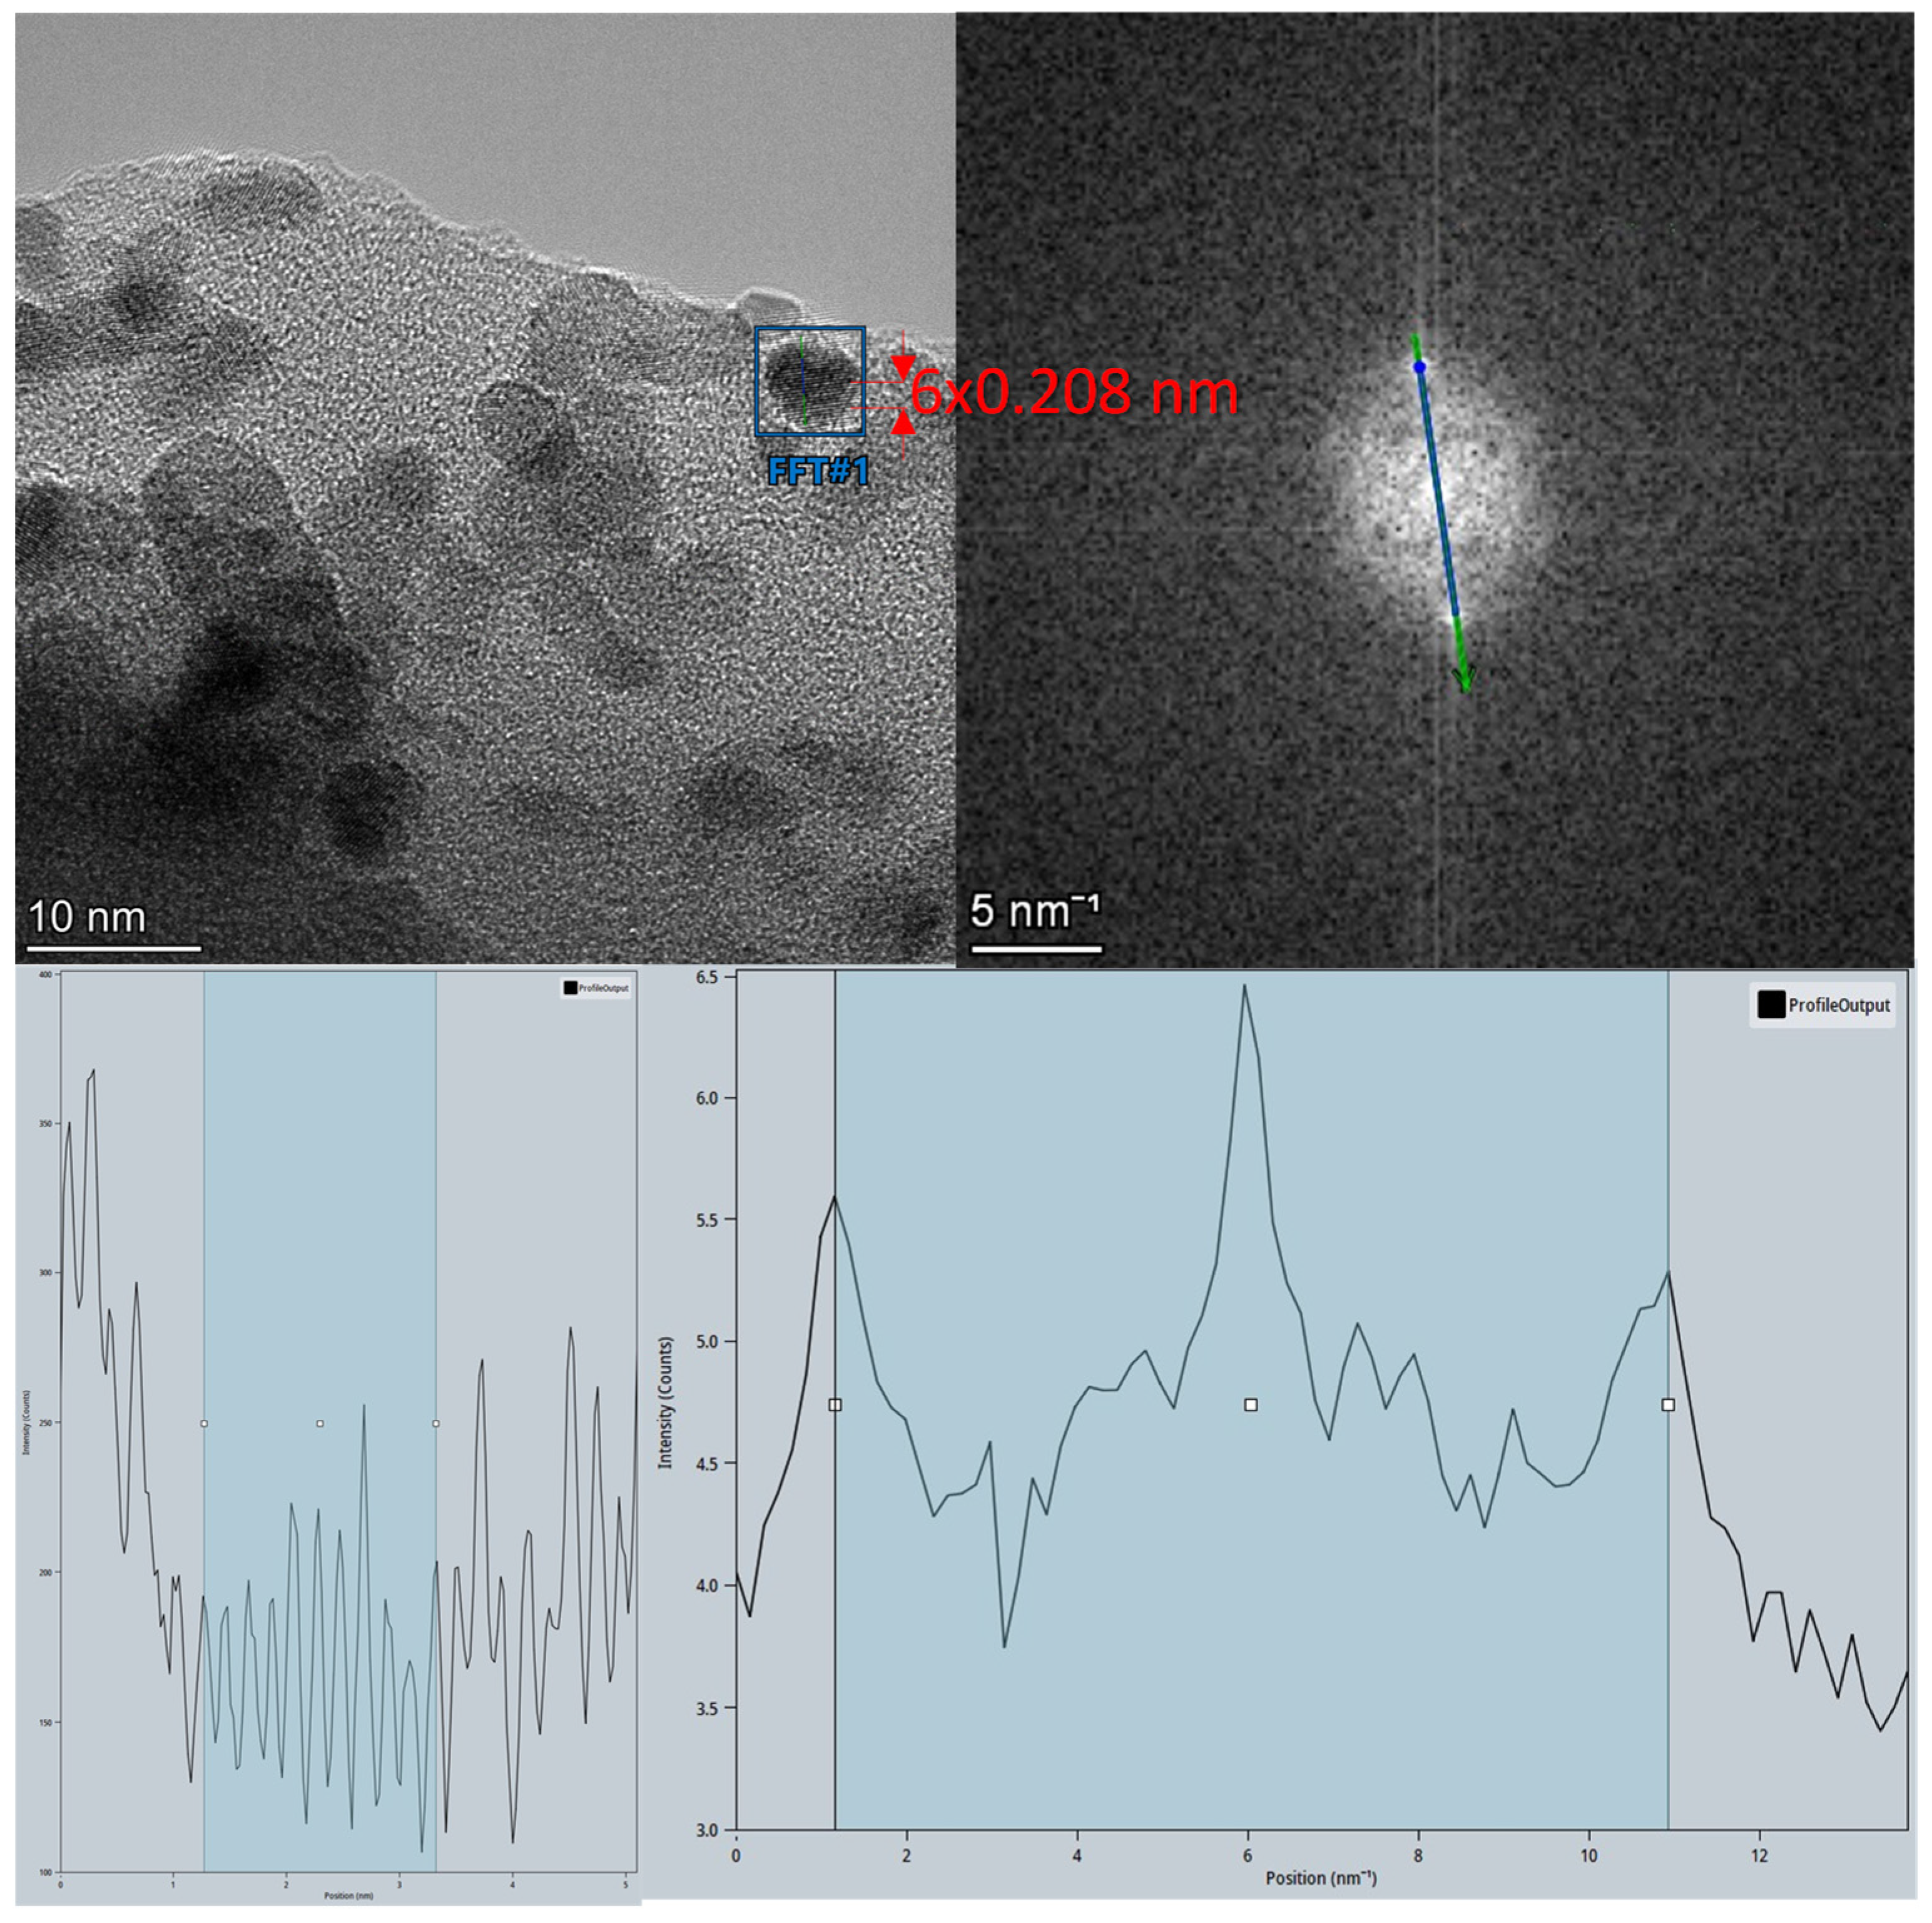
3.1.3. TEM/STEM Study of Ru/NaY Catalysts

To explore the impact of Ru loading on the Ru dispersion, size, and the morphology of Ru particles, HR-TEM and STEM were performed on the 1%, 2.5%, 5%, and 7.5% Ru/NaY catalysts after reduction and passivation. The STEM images and Ru particle size distribution are presented in Figure 2.
The STEM micrographs indicate that Ru particles following the standard H2 reduction procedure are nearly spherical-shaped in all cases. These Ru particles are relatively uniformly distributed in each catalyst. For 1%Ru/NaY, the Ru particle size falls within the range of 2.0–18 nm, which yields an average Ru particle size of 6.2 nm. As Ru loading is gradually increased to 2.5%, 5.0%, and 7.5%, the Ru particle size ranges were enlarged to 2–40 nm and the average Ru particles increased to 7.1 nm, 12.3 nm, and 18.0 nm. These results are consistent with the Ru cluster sizes (6.6, 7.7, 19.4 nm) determined by the H2 chemisorption results except for the 7.5%/NaY catalyst, which could be due to TEM not reaching larger Ru zones. In addition, the STEM of each Ru/NaY indicates that a close interaction between Ru and the NaY support may hinder Ru oxide reduction.
To identify the crystalline structure of Ru, HRTEM and FFT were performed for the four Ru/NaY catalysts. Figure 3 presents an example of the HRTEM and FFT profile using the reduced 1% Ru/NaY catalyst. From the picture, the interplanar spacing (d-spacing) derived from the Ru peak positions and providing information about the Ru crystal structure is determined to be 0.208 nm. Similarly, the d-spacings of the Ru nanoparticles on the 2.5%Ru, 5%Ru, and 7.5Ru% catalysts were determined to be 0.207 nm, 0.208 nm, and 0.205 nm, respectively. These crystal lattice numbers are essentially the same, which are close enough to the Ru hexagonal close-packed (HCP) structure represented by the (101) plane of Ru0 with a d-spacing of 0.206 nm (ICDD PDF: Ru-01-070-0274) on the NaY support.

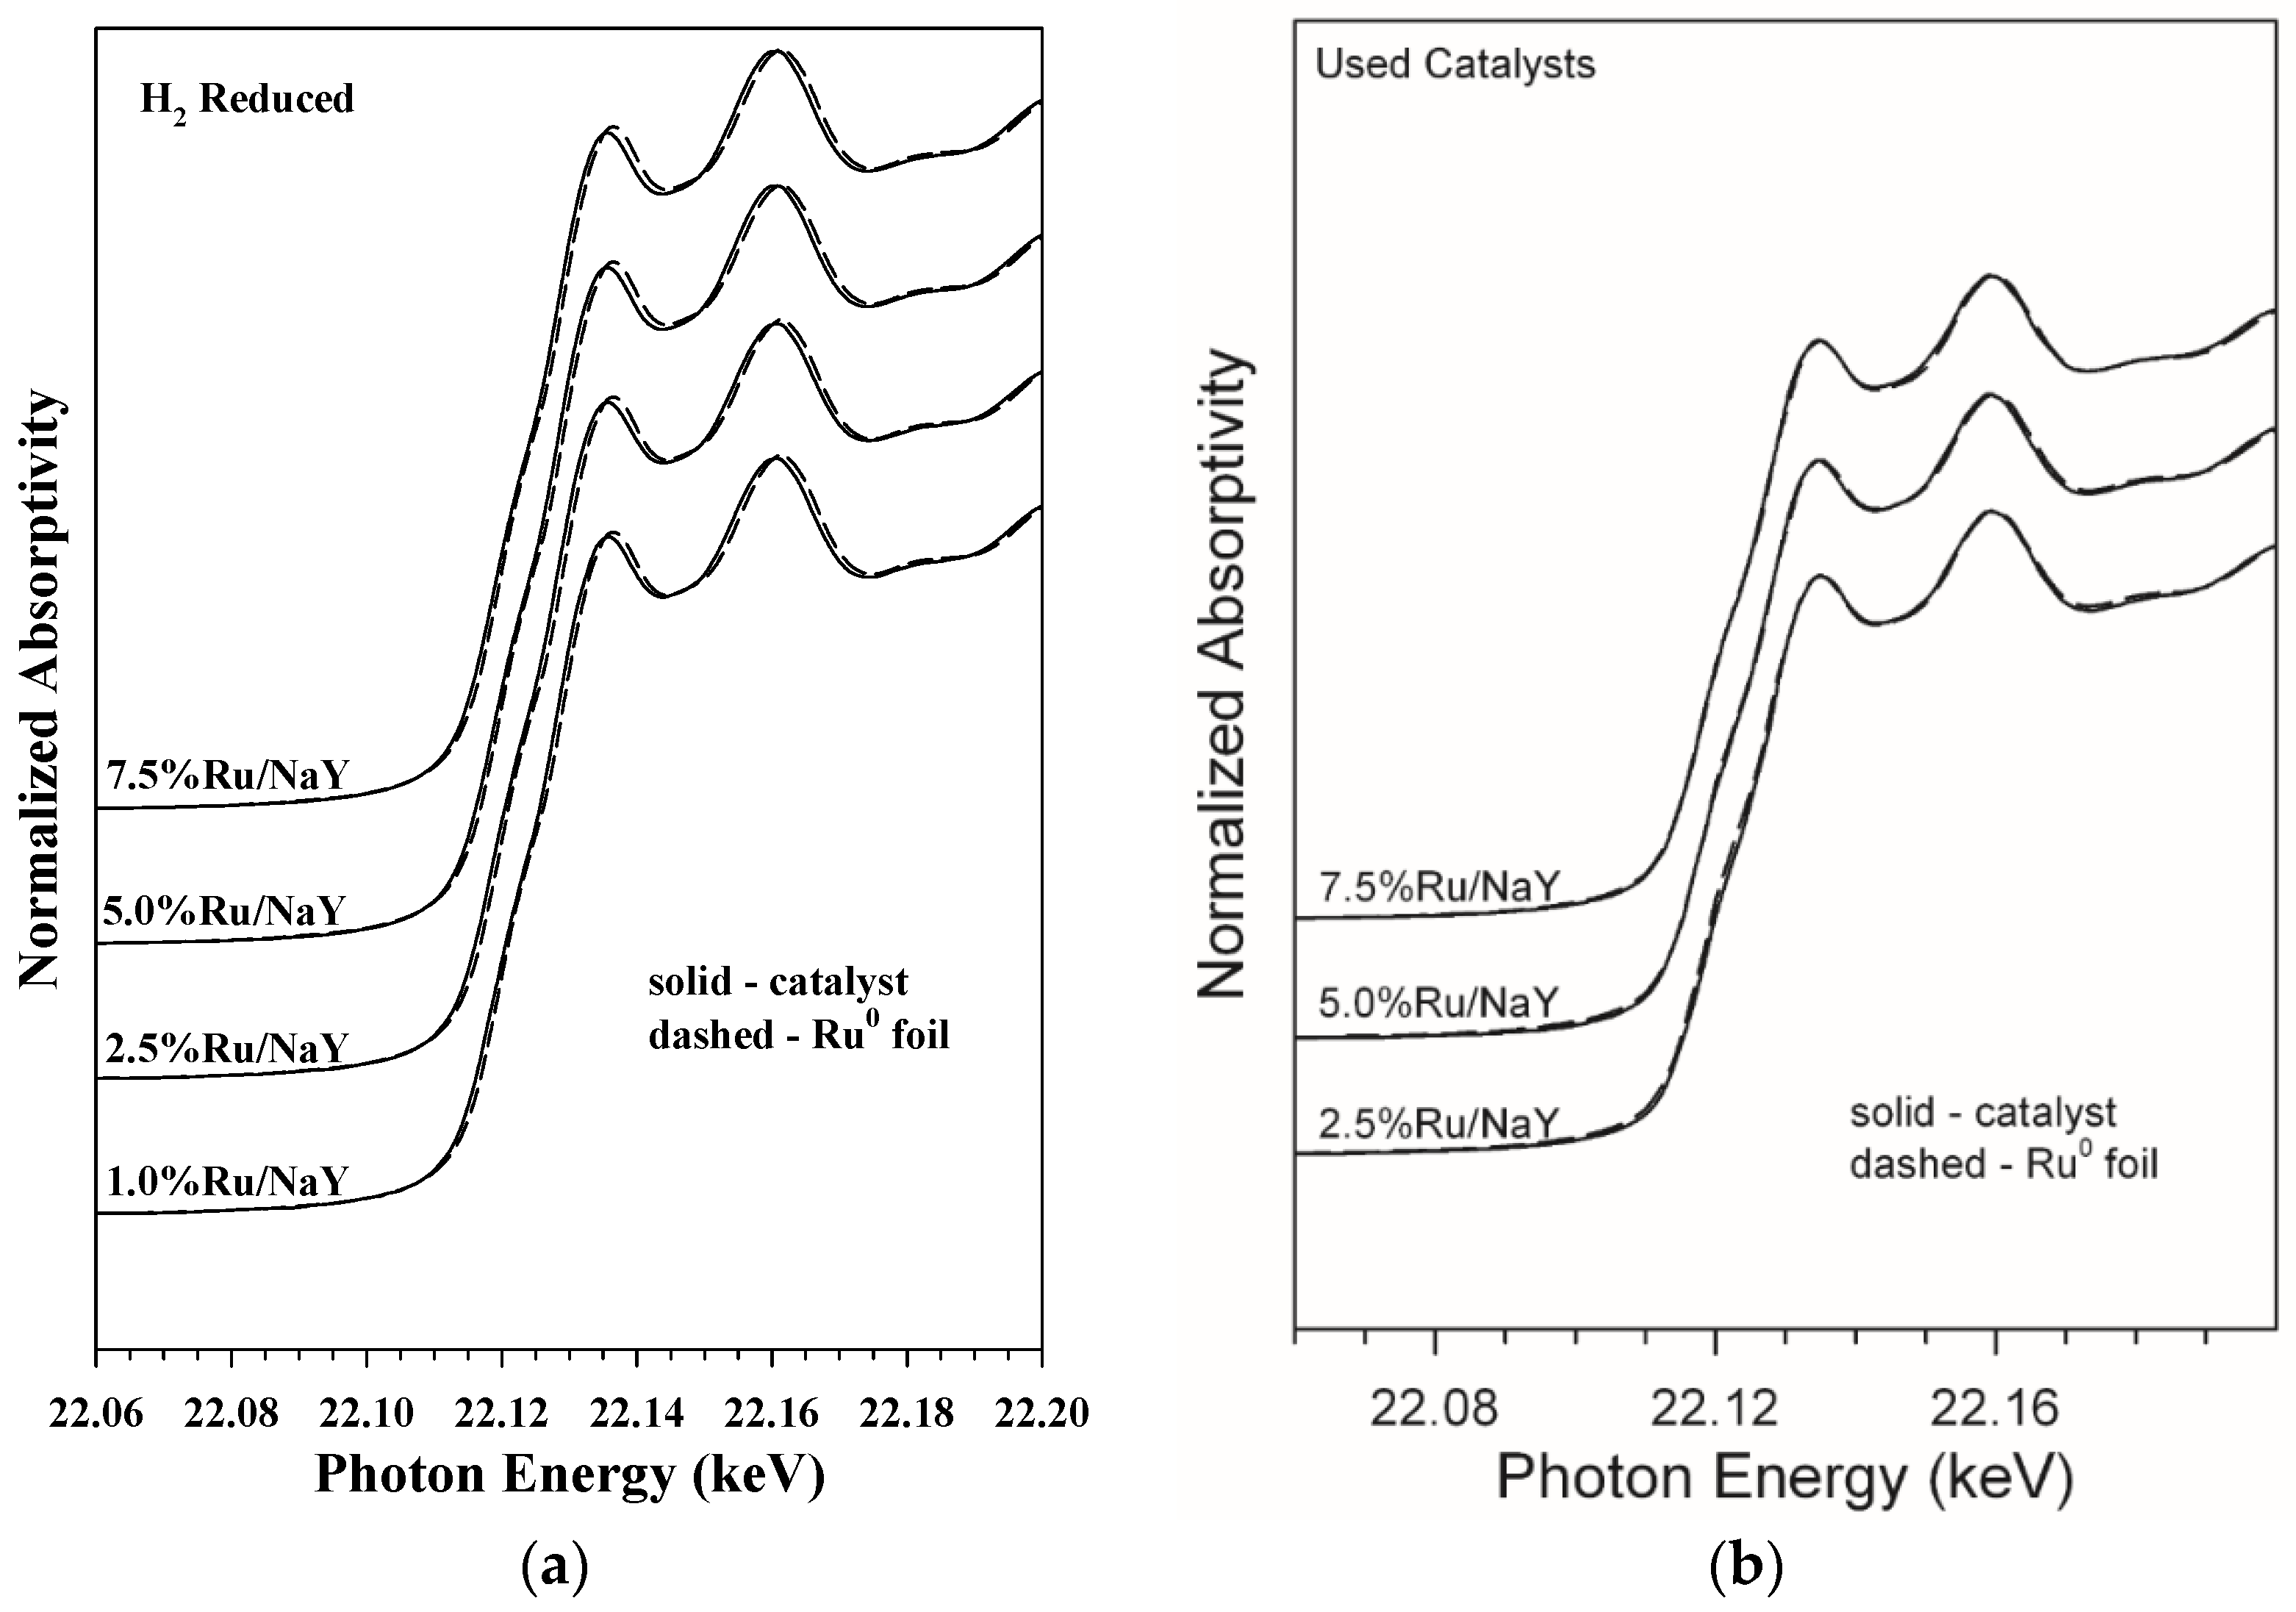
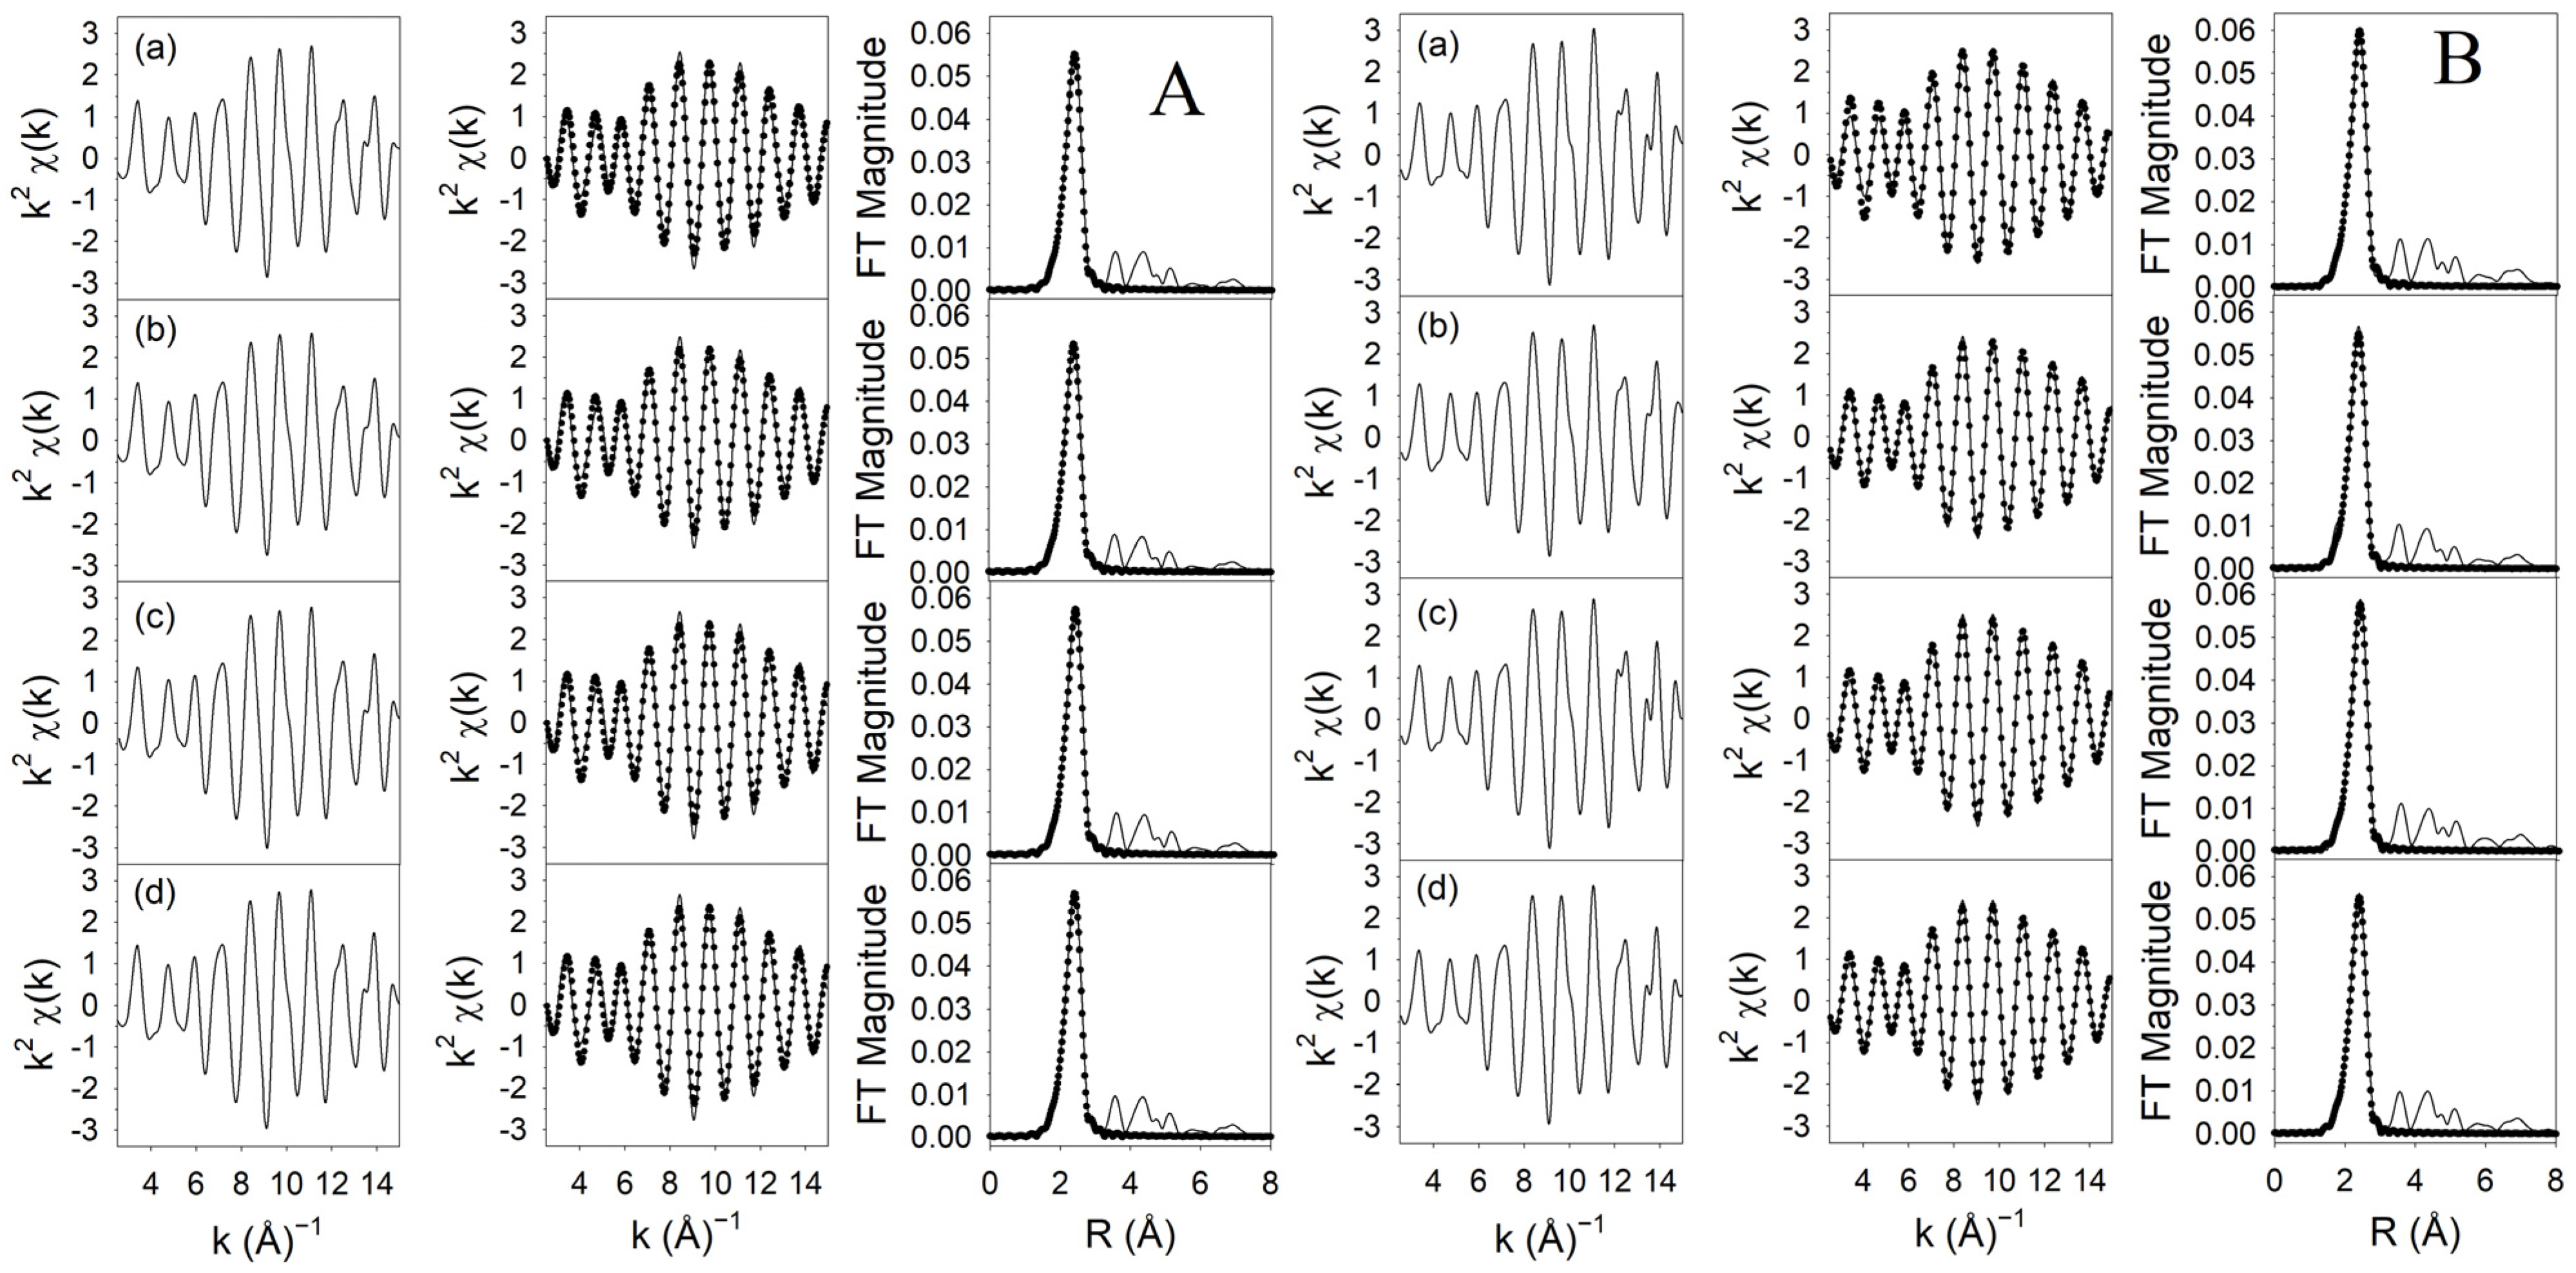
3.1.4. XANES/EXAFS Results

Figure 4 displays the normalized XANES spectra for the Ru metal foil, and the freshly reduced and spent 1.0, 2.5, 5.0, and 7.5%Ru/NaY catalysts. The pre-edge and edge positions in the spectra of all four Ru/NaY catalysts nearly overlap with those of the Ru0 foil at 22.13 keV and *22.16 keV, suggesting all freshly reduced Ru catalysts are nearly completely reduced, which is consistent with the HRTEM/FFT results. On the contrary, a difference occurred in the spectra of the used Ru/NaY catalysts, and the peaks shifted to slightly higher energy for the used Ru/NaY catalysts, suggesting the Ru catalysts are less reduced and that some oxidation occurred during the FTS. The EXAFS fitting results for the freshly reduced and used catalysts are shown in Figure 5 and Table 2. It is seen that slightly higher Ru-Ru coordination numbers are observed for all freshly reduced Ru/NaY catalysts relative to the used Ru catalysts (10.0–10.4 vs. 9.6–10.3), which further indicates that a high extent of Ru reduction occurred for freshly activated catalysts, and that some oxidation of Ru occurred during the FTS. These results are consistent with the XANES results shown in Figure 4. Moreover, the Ru-Ru coordination numbers are slightly smaller on the 1–2.5%Ru/NaY catalysts than the 5–7.5%Ru/NaY catalysts (9.6–10 vs. 10.1–10.4), further suggesting (1) lower loadings of Ru resulting in smaller Ru clusters had relatively stronger interactions with the NaY support, and (2) the extent of oxidation of Ru at smaller Ru sizes was exacerbated during FTS.

3.2. Conversion Effect on Ru/NaY

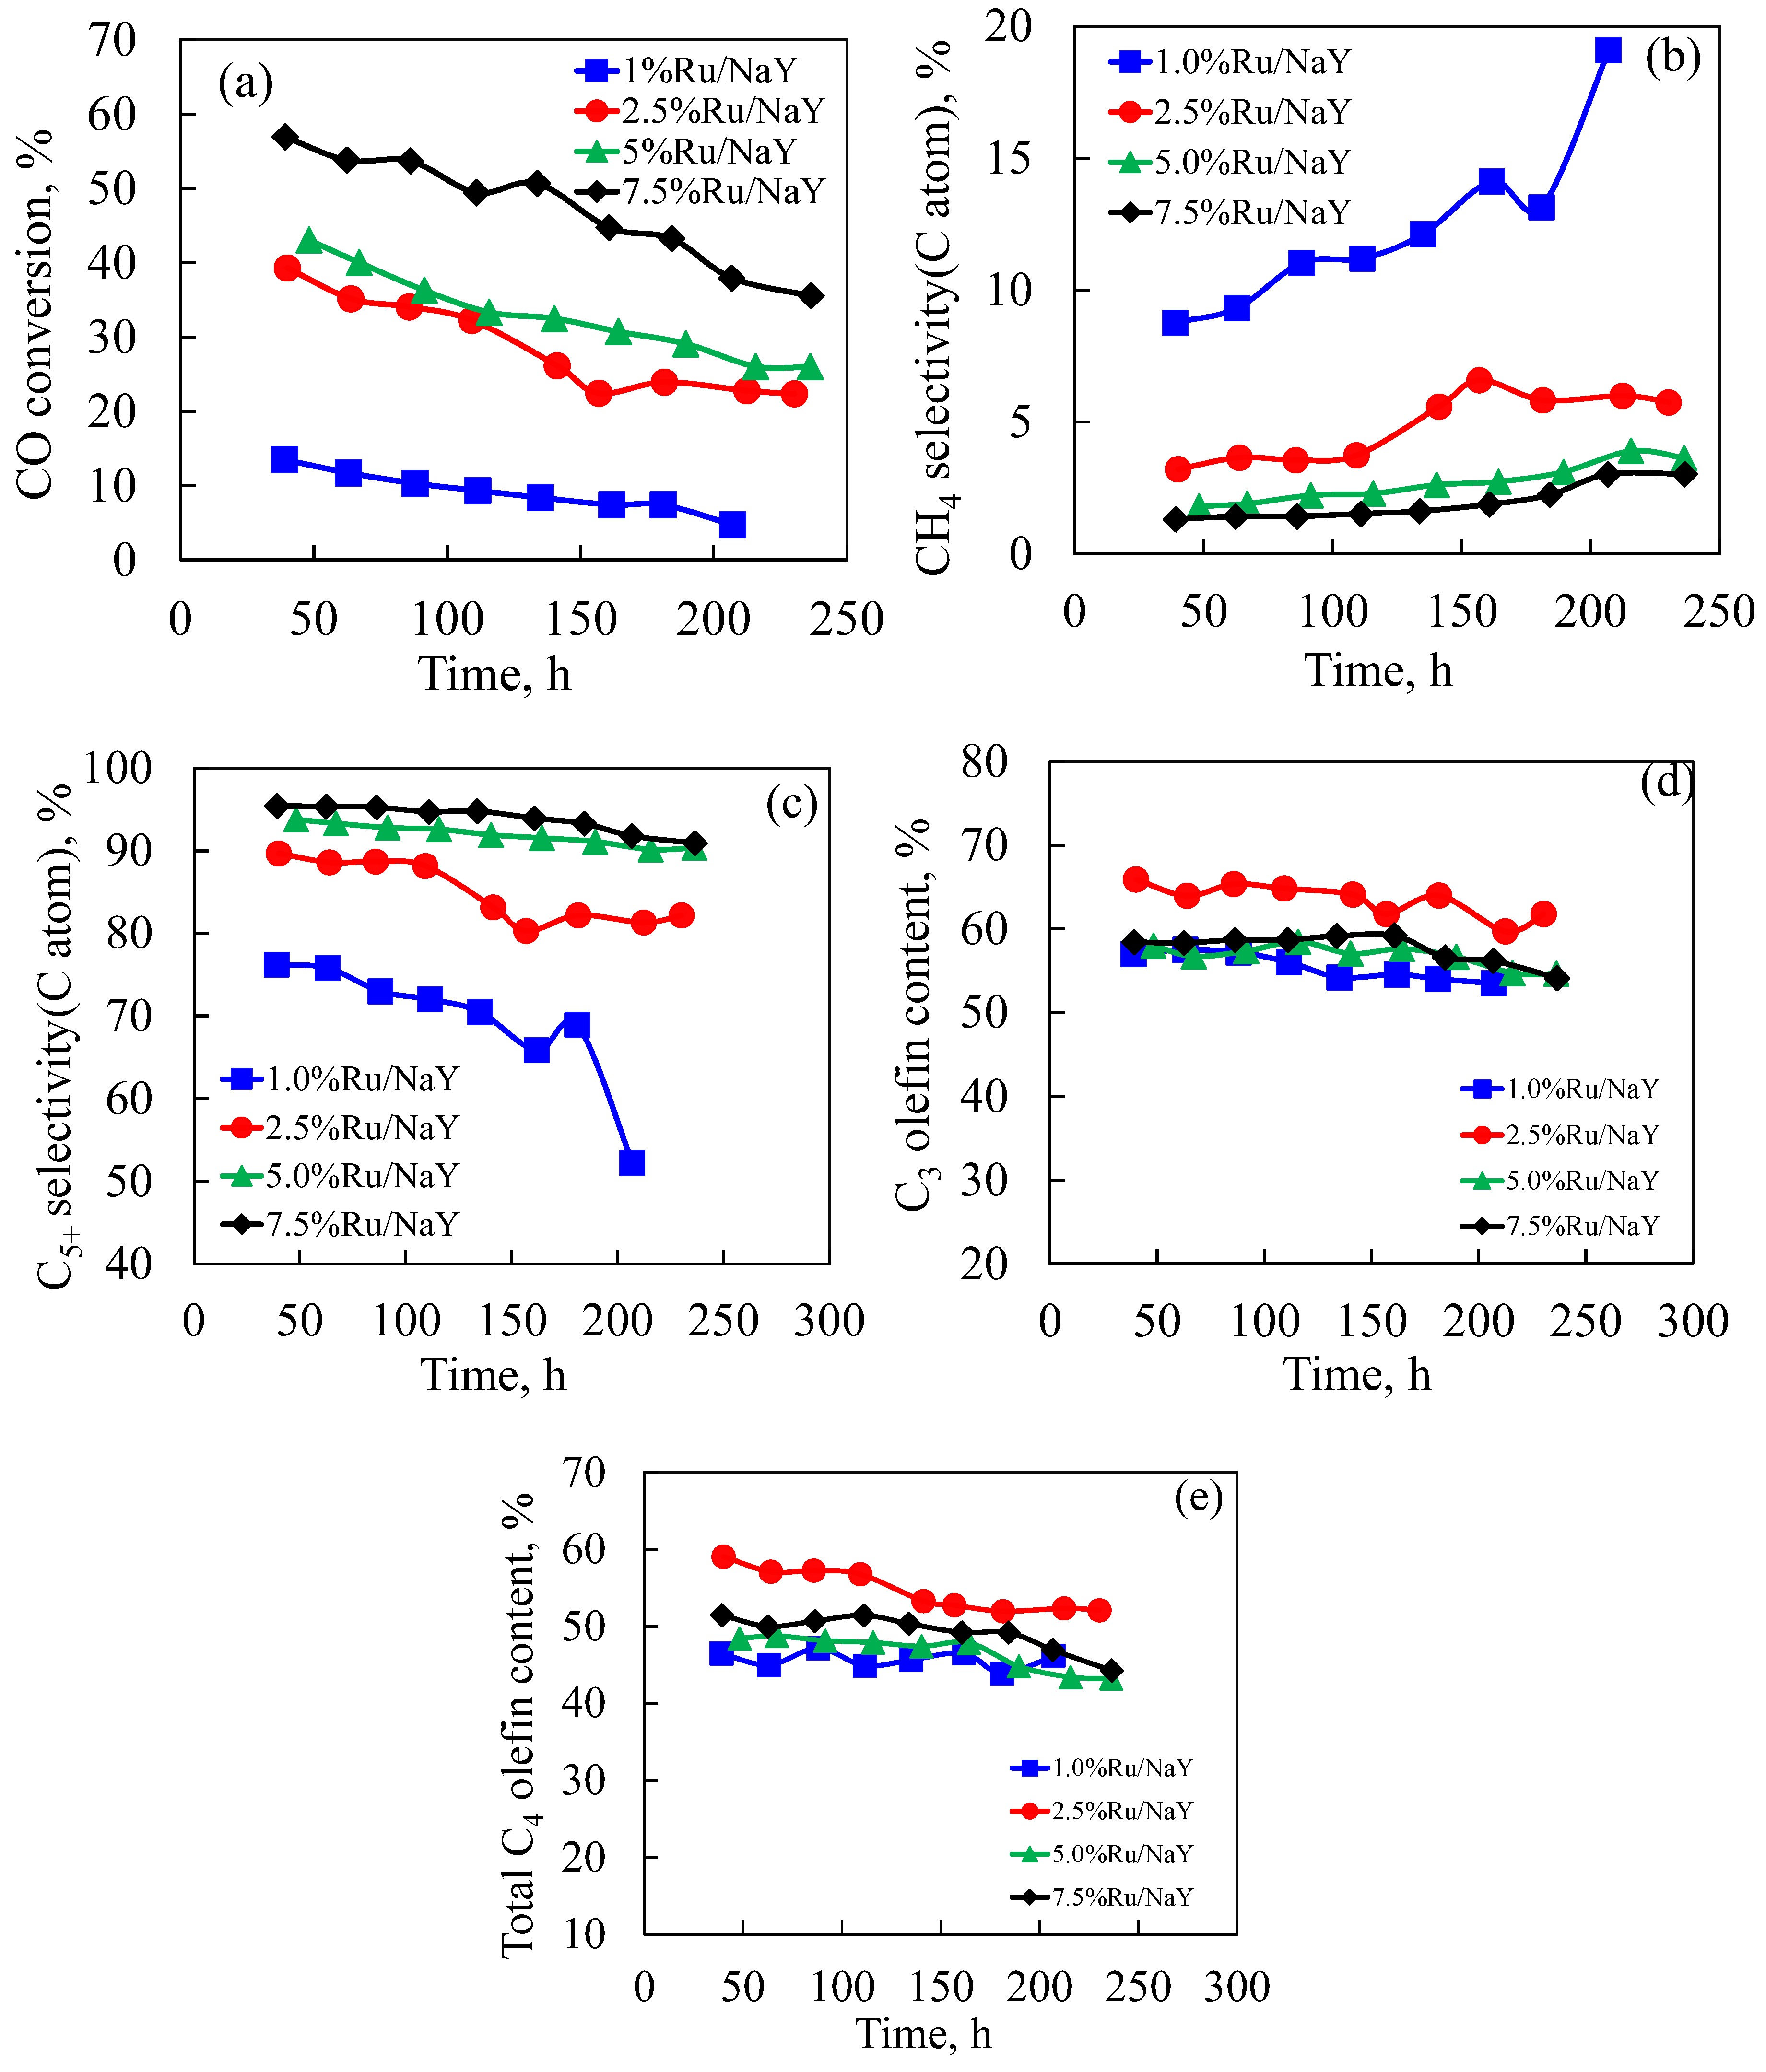
3.2.1. Performance of Ru/NaY Catalysts

The 1.0–7.5% Ru/NaY catalysts were first tested under constant reaction conditions (i.e., 220 °C, 2.0 MPa, and H2/CO 2.0 and 1.5 Nl/gcat/h) in a 1 L CSTR, for ca. 220–250 h. The changes in catalyst activity and selectivity to CH4 and C5+ selectivity, C3 olefin content, and C4 olefin content are illustrated in Figure 6a–e. Apparently, increasing Ru loading from 1 to 2.5% elevates the initial CO conversion by more than double (i.e., from 16 to 40%), further increasing Ru loading to 5.0 and 7.5% leads to continuous increases in CO conversion, but the extent of the increase is not as significant when Ru loading goes from 2.5 to 5%. In all cases, the Ru/NaY catalysts deactivated with time during 250 h of testing. A calculation based on the first 60 h of reaction data indicates that the 1% Ru catalyst displayed the highest deactivation rate, showing 20% of activity loss/day, followed by the 2.5% Ru and 5% Ru catalysts, which had 12–15%/day activity loss, while the 7.5% Ru catalyst gave the lowest deactivation rate, 4.8%/day, with the latter having relatively better stability among the four catalysts. This is probably due to the catalyst having a larger Ru particle size as indicated by the H2 chemisorption study and TEM study, such that it was less prone to being oxidized. The highest deactivation rate for the 1%Ru catalyst is presumably due to the oxidation of small Ru nanoparticles in the micropores of the catalyst, which is partly supported by TEM. Ru loading also significantly affects hydrocarbon formation. Figure 6b,c suggest that increasing Ru loading reduced CH4 formation, and increased C5+ selectivity. Clearly, the 1% Ru loading catalyst gives the highest CH4 selectivity of 9–19% and lowest C5+ selectivities of 52–76%, while the 7.5% Ru loading catalyst displayed the lowest CH4 selectivity of 1.5–3.0% and highest C5+ selectivities of 91–95%. This suggests a Ru particle size effect. The 1%Ru catalyst showed much higher CH4 selectivity than the other three Ru/NaY catalysts (Figure 6b), probably also suggesting that some tiny Ru clusters were present in the micropores of the catalyst, resulting in mass transfer limitations that increased CH4 selectivity. The C3 olefin and C4 olefin contents changed between 55–65% and 45 and 60%, respectively, which slightly decreased with time.

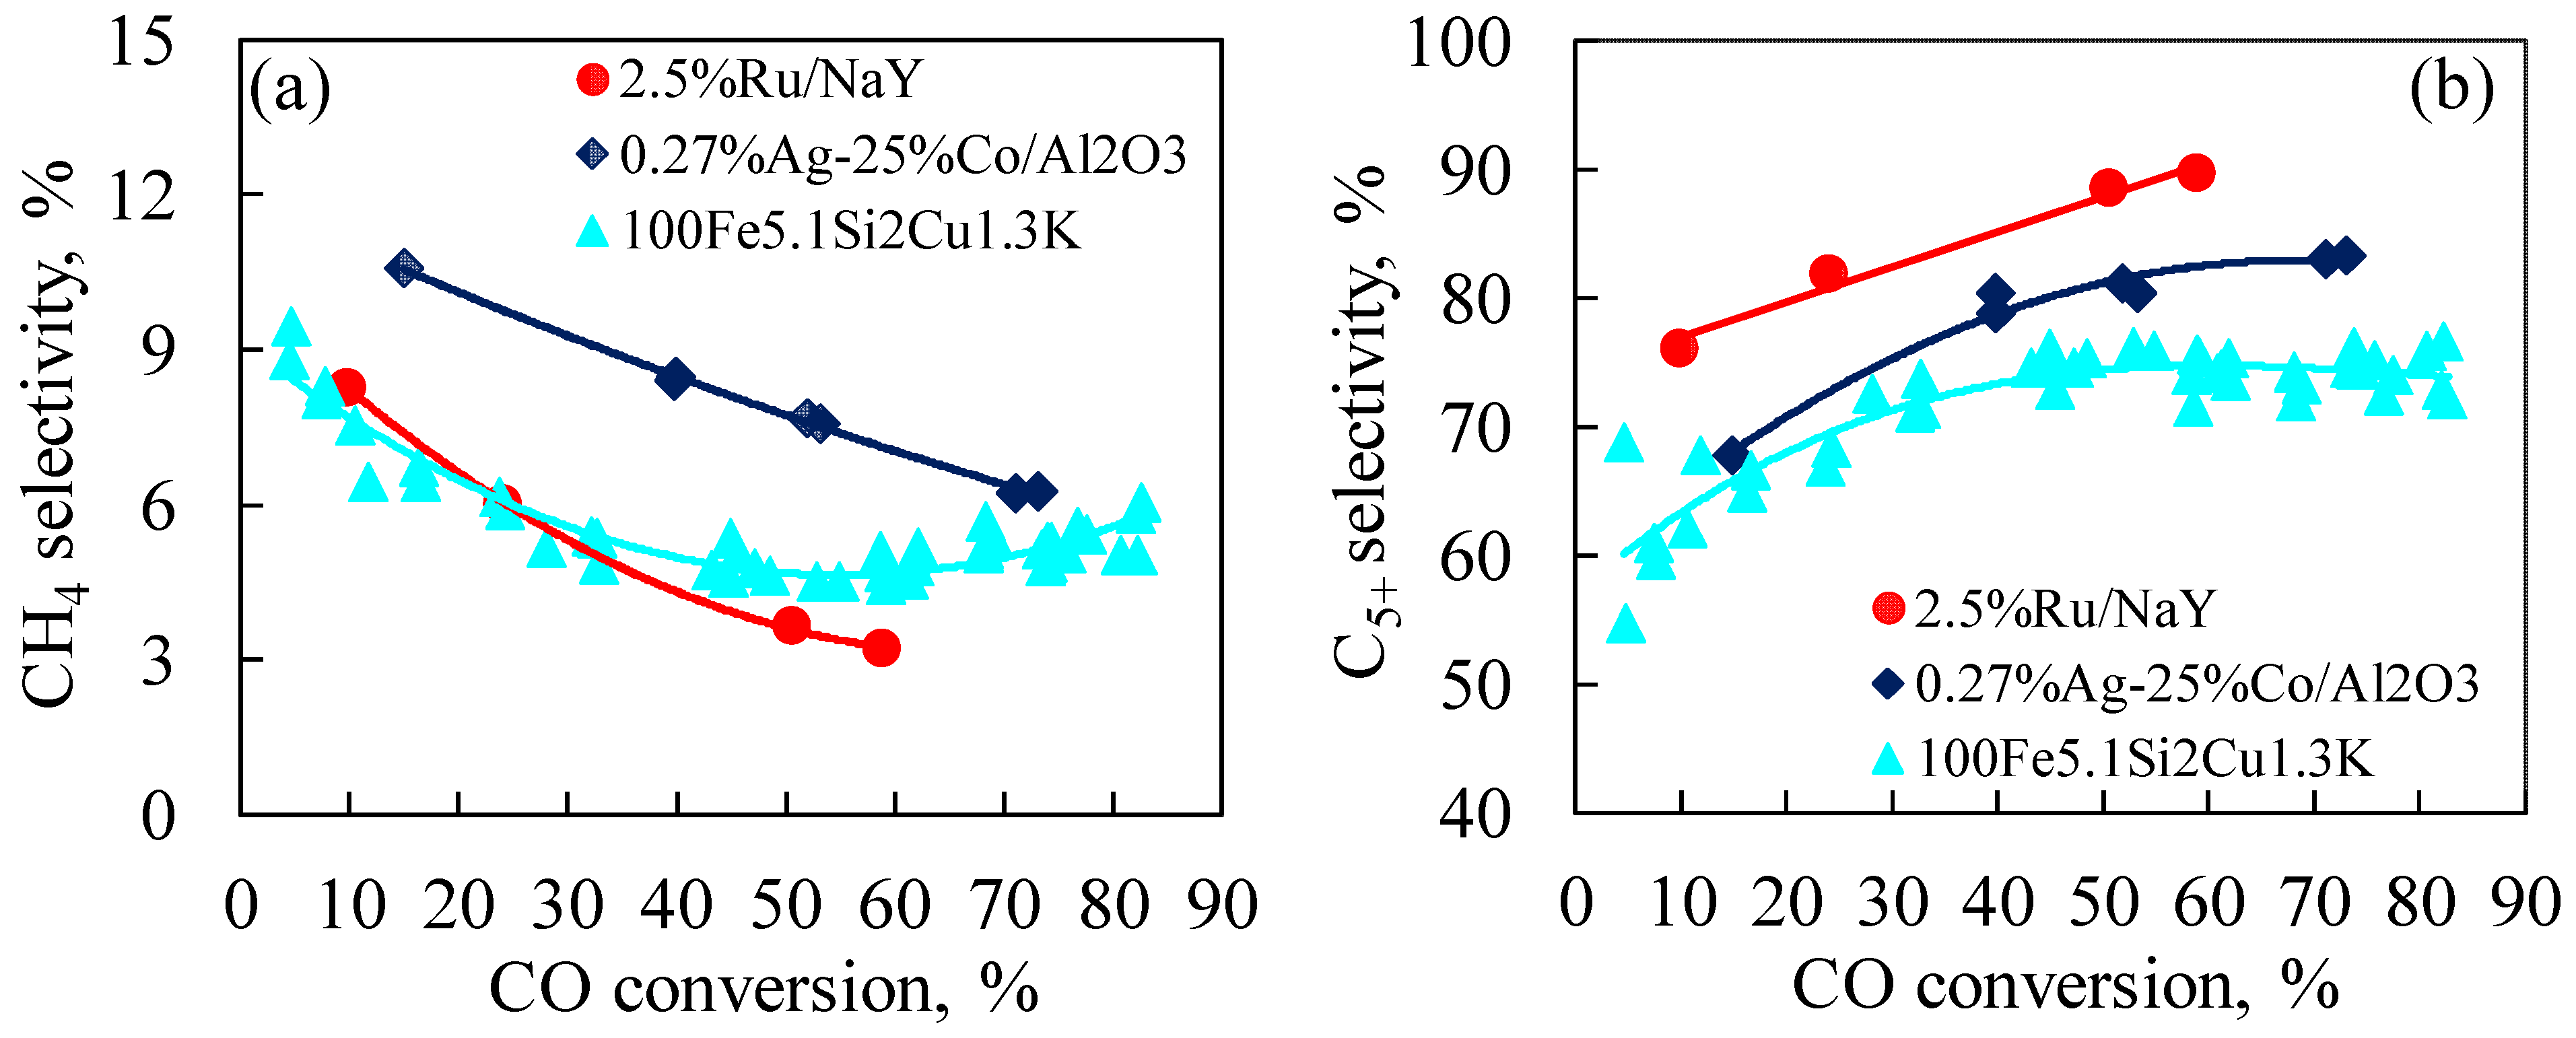
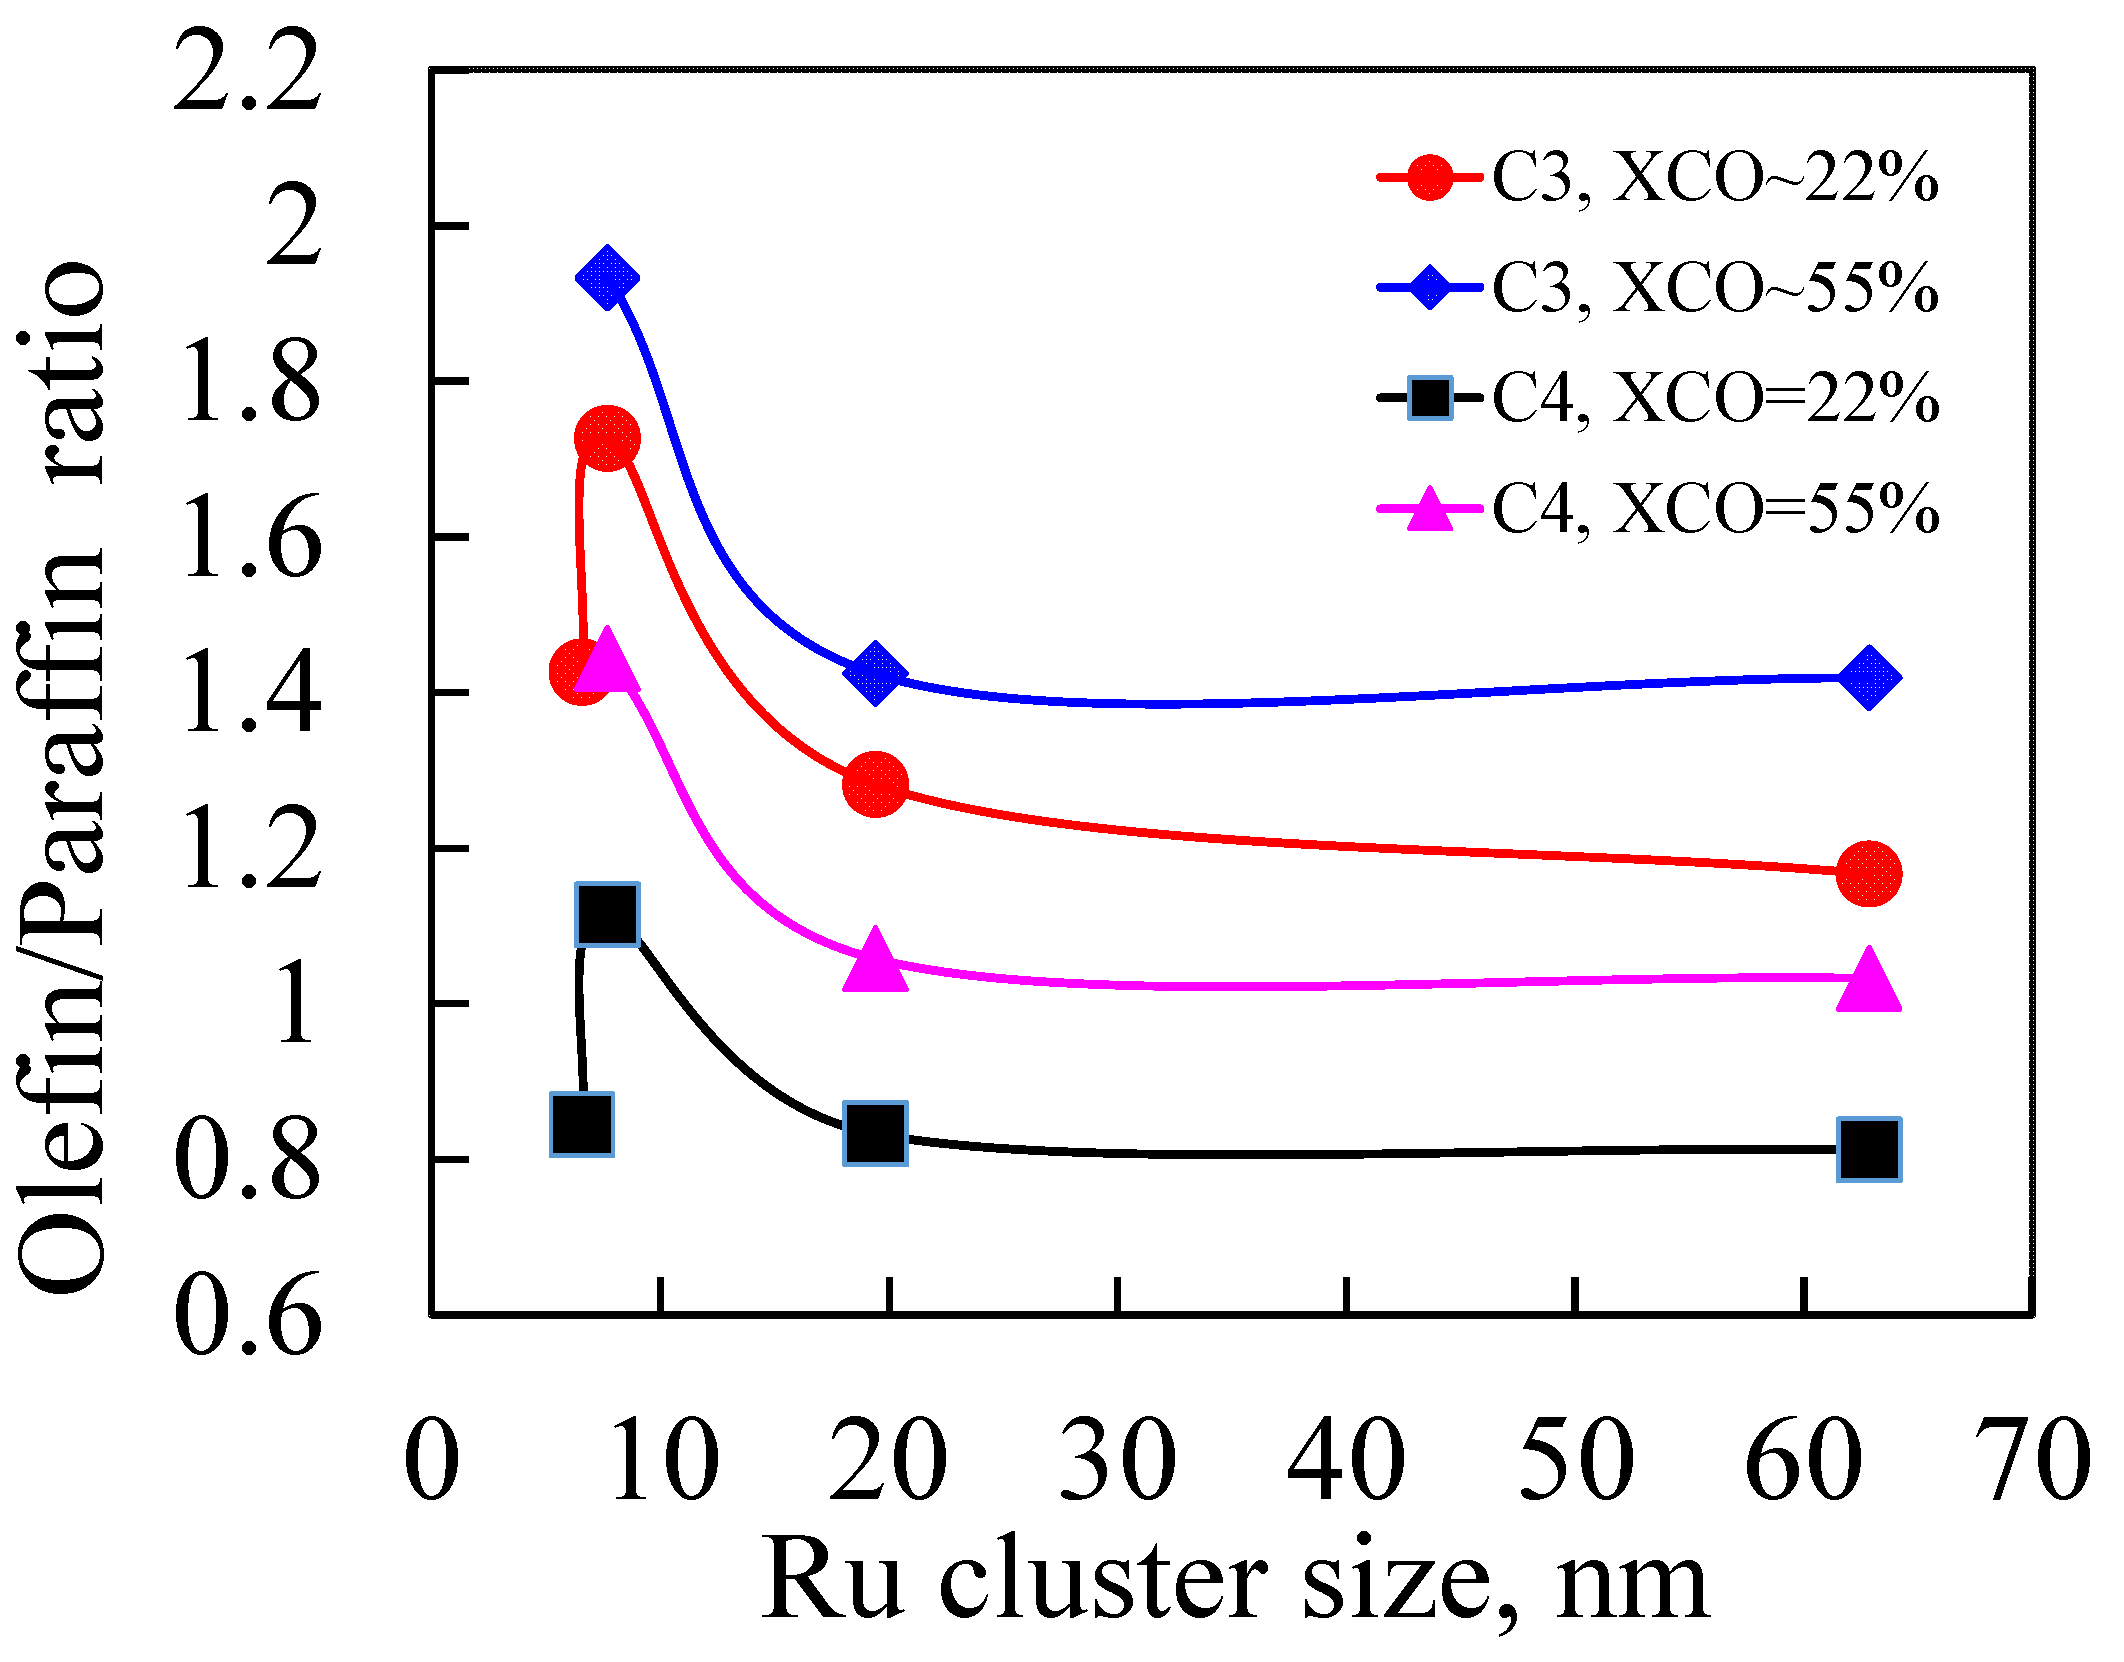
3.2.2. Effect of CO Conversion on Selectivity on Ru/NaY

To study the CO conversion effect on the Ru/NaY catalyst, in a subsequent study, the space velocity was adjusted to obtain 10–60% CO conversion on all four Ru/NaY catalyst test runs. Very consistent results of the CO conversion effect on selectivity and olefin formation were obtained on all four 1.0–7.5%Ru/NaY catalysts. However, to simplify plotting the results, the results in the 10–50% CO conversion range over 2.5%Ru/NaY was chosen for the study, which is shown in Figure 7. For the purpose of comparison, the results in the 5–80% CO conversion range over 0.27%Ag–25%Co/Al2O3 and 100Fe5.1Si2Cu3 K catalysts reported previously [15] are also plotted in Figure 7.
Clearly, CO conversion significantly influences CH4 and C5+ selectivity over all three Fe, Co, and Ru catalysts. As CO conversion increased from 10 to 60% on Ru, CH4 selectivity decreased sharply from 8.8 to 3.0% (Figure 7a), and C5+ selectivity increased dramatically from 77% to 90% (Figure 7b), which is very consistent with the effect of the CO conversion on Fe and Co catalysts reported previously [15]. This has been explained by a positive kinetic water effect on the formation of C* species, and consequently, the CO rate, chain growth, and C5+ formation. On the other hand, H2O suppresses hydrogenation of the chain monomers, CH3, to CH4 formation, because increasing CO conversion usually leads to an elevated partial pressure of water within the reactor. It is noted that C1 and C5+ selectivities for the Fe catalyst changed little after 50–60% conversion (Figure 7a,b). This is because of the significant occurrence of the water gas shift reaction, which yields a peak PH2O at 50% CO conversion on the Fe catalyst promoted with 1.3%K [35]. In addition, the Ru/NaY catalyst displayed higher C5+ and lower CH4 selectivity than the Fe and Co catalysts at similar CO conversion levels, which reflects superior chain growth ability on the Ru catalysts. It appears that the nature of the Ru catalyst for water adsorption is greater than that of Fe and Co catalysts, resulting in lower CH4 and greater C5+ selectivity. This conclusion is further evidenced by the CO conversion effect on olefin/paraffin formation for the Ru catalyst, as discussed below.
However, the effect of CO conversion on olefin formation on Ru catalysts is right opposite to what was observed on the Fe and Co catalysts. According to Figure 7c,d, as CO conversion increased from 10 to 80%, it decreased 1-C4 olefin formation from 62 to 35% on the Co and 80.0 to 57% on the Fe catalyst, simultaneously, the 2-C4 olefin content increased from 0.2–8% and 7.0–21% on the Co and Fe catalysts, respectively. These results have also been observed by several researchers due to enhanced secondary reactions (hydrogenation and isomerization) of olefins at a high CO conversion level [30,31,41,42]. In contrast, as CO conversion increased from 10 to 60% over the Ru catalyst, the 1-C4 olefin content increased from 38–55%, and the 2-C4 olefin content decreased from 13 to 4%. The total C4 olefin content (51–59%, Figure 7e) and paraffin content (49 to 41%, Figure 7f) are also opposite to those of the Fe and Co catalysts. Thus, the trends of olefin formation on Ru are opposite to those of the Fe and Co catalysts. Since water influences olefin formation, it is postulated that the different CO conversion effects on Ru imply dissimilar H2O adsorption ability on Ru relative to the Fe and Co catalysts.
The effects of CO conversion on olefin formation on the other (1%, 5%, and 7.5%) Ru/NaY catalysts are fully consistent with these results over 2.5% Ru/NaY, as illustrated in Figure 8. The olefin/paraffin ratios at C3 and C4 were obtained at 22% and 55% CO conversion levels. At both conversion levels, the O/P ratios for Ru/NaY decline, beginning at ~8 nm Ru particle size up to ~20 nm; afterwards, they remain unchanged. This appears to suggest that olefins are more readily produced on smaller Ru particles. Importantly, the O/P ratios at C3 and C4 at 55% CO conversion (1.4–1.9 and 1.0–1.5) are both greater than those (1.2–1.7 and 0.8–1.1) at 22% CO conversion over each Ru loading catalyst, suggesting the reproducibility of the opposite CO conversion effect on olefin formation discovered for the Ru catalyst.
To understand the different CO conversion effect on olefin formation over Ru in comparison with the Co and Fe catalysts, the effect of H2O on olefin formation was carried out by cofeeding 5–10% H2O during FTS over the 0.27%Ru–25%Co/Al2O3 catalysts [43]. Figure 9 demonstrates the effect of cofeeding 5–10% H2O on the C2 olefin, C3 olefin, 1-C4 olefin, and 2-C4 olefin contents on the catalyst. The results indicate that after cofeeding 5–10% H2O for a period of time (i.e., ca. 2–5 h at a high flow rate), the C2, C3, and 1-C4 olefin contents of the Co catalyst increased by 7 to 34%, while the 2-C4 content was decreased by 11.8%. Once water cofeeding was terminated, the C2 olefin, C3 olefin, 1-C4 olefin, and 2-C4 olefin contents were returned to their original values (i.e., before adding H2O) (Figure 9). The results clearly indicate that indigenous or externally added water on the catalyst surface inhibited H2 adsorption, but enhanced 1-olefin formation, and suppressed 2-olefin formation.
In terms of the above evidence of H2O improving olefin formation and suppressing 2-olefin formation, it is easy to understand the opposite CO conversion effect on olefin formation observed over the Ru catalyst. When CO conversion increases from 10 to 60%, the partial pressure of water in the reactor certainly increases (0.1–0.5 MPa). If the Ru surface has a much stronger H2O adsorption capacity/heat than that of the Fe and Co surfaces, then the water partial pressure on the Ru catalyst surface would be much higher, thereby causing increased H2O inhibition of 1-olefin hydrogenation. Eventually, it resulted in the opposite CO effect on olefin formation on the Ru catalyst. This assumption is evidenced by the following H2O TPD experiment.

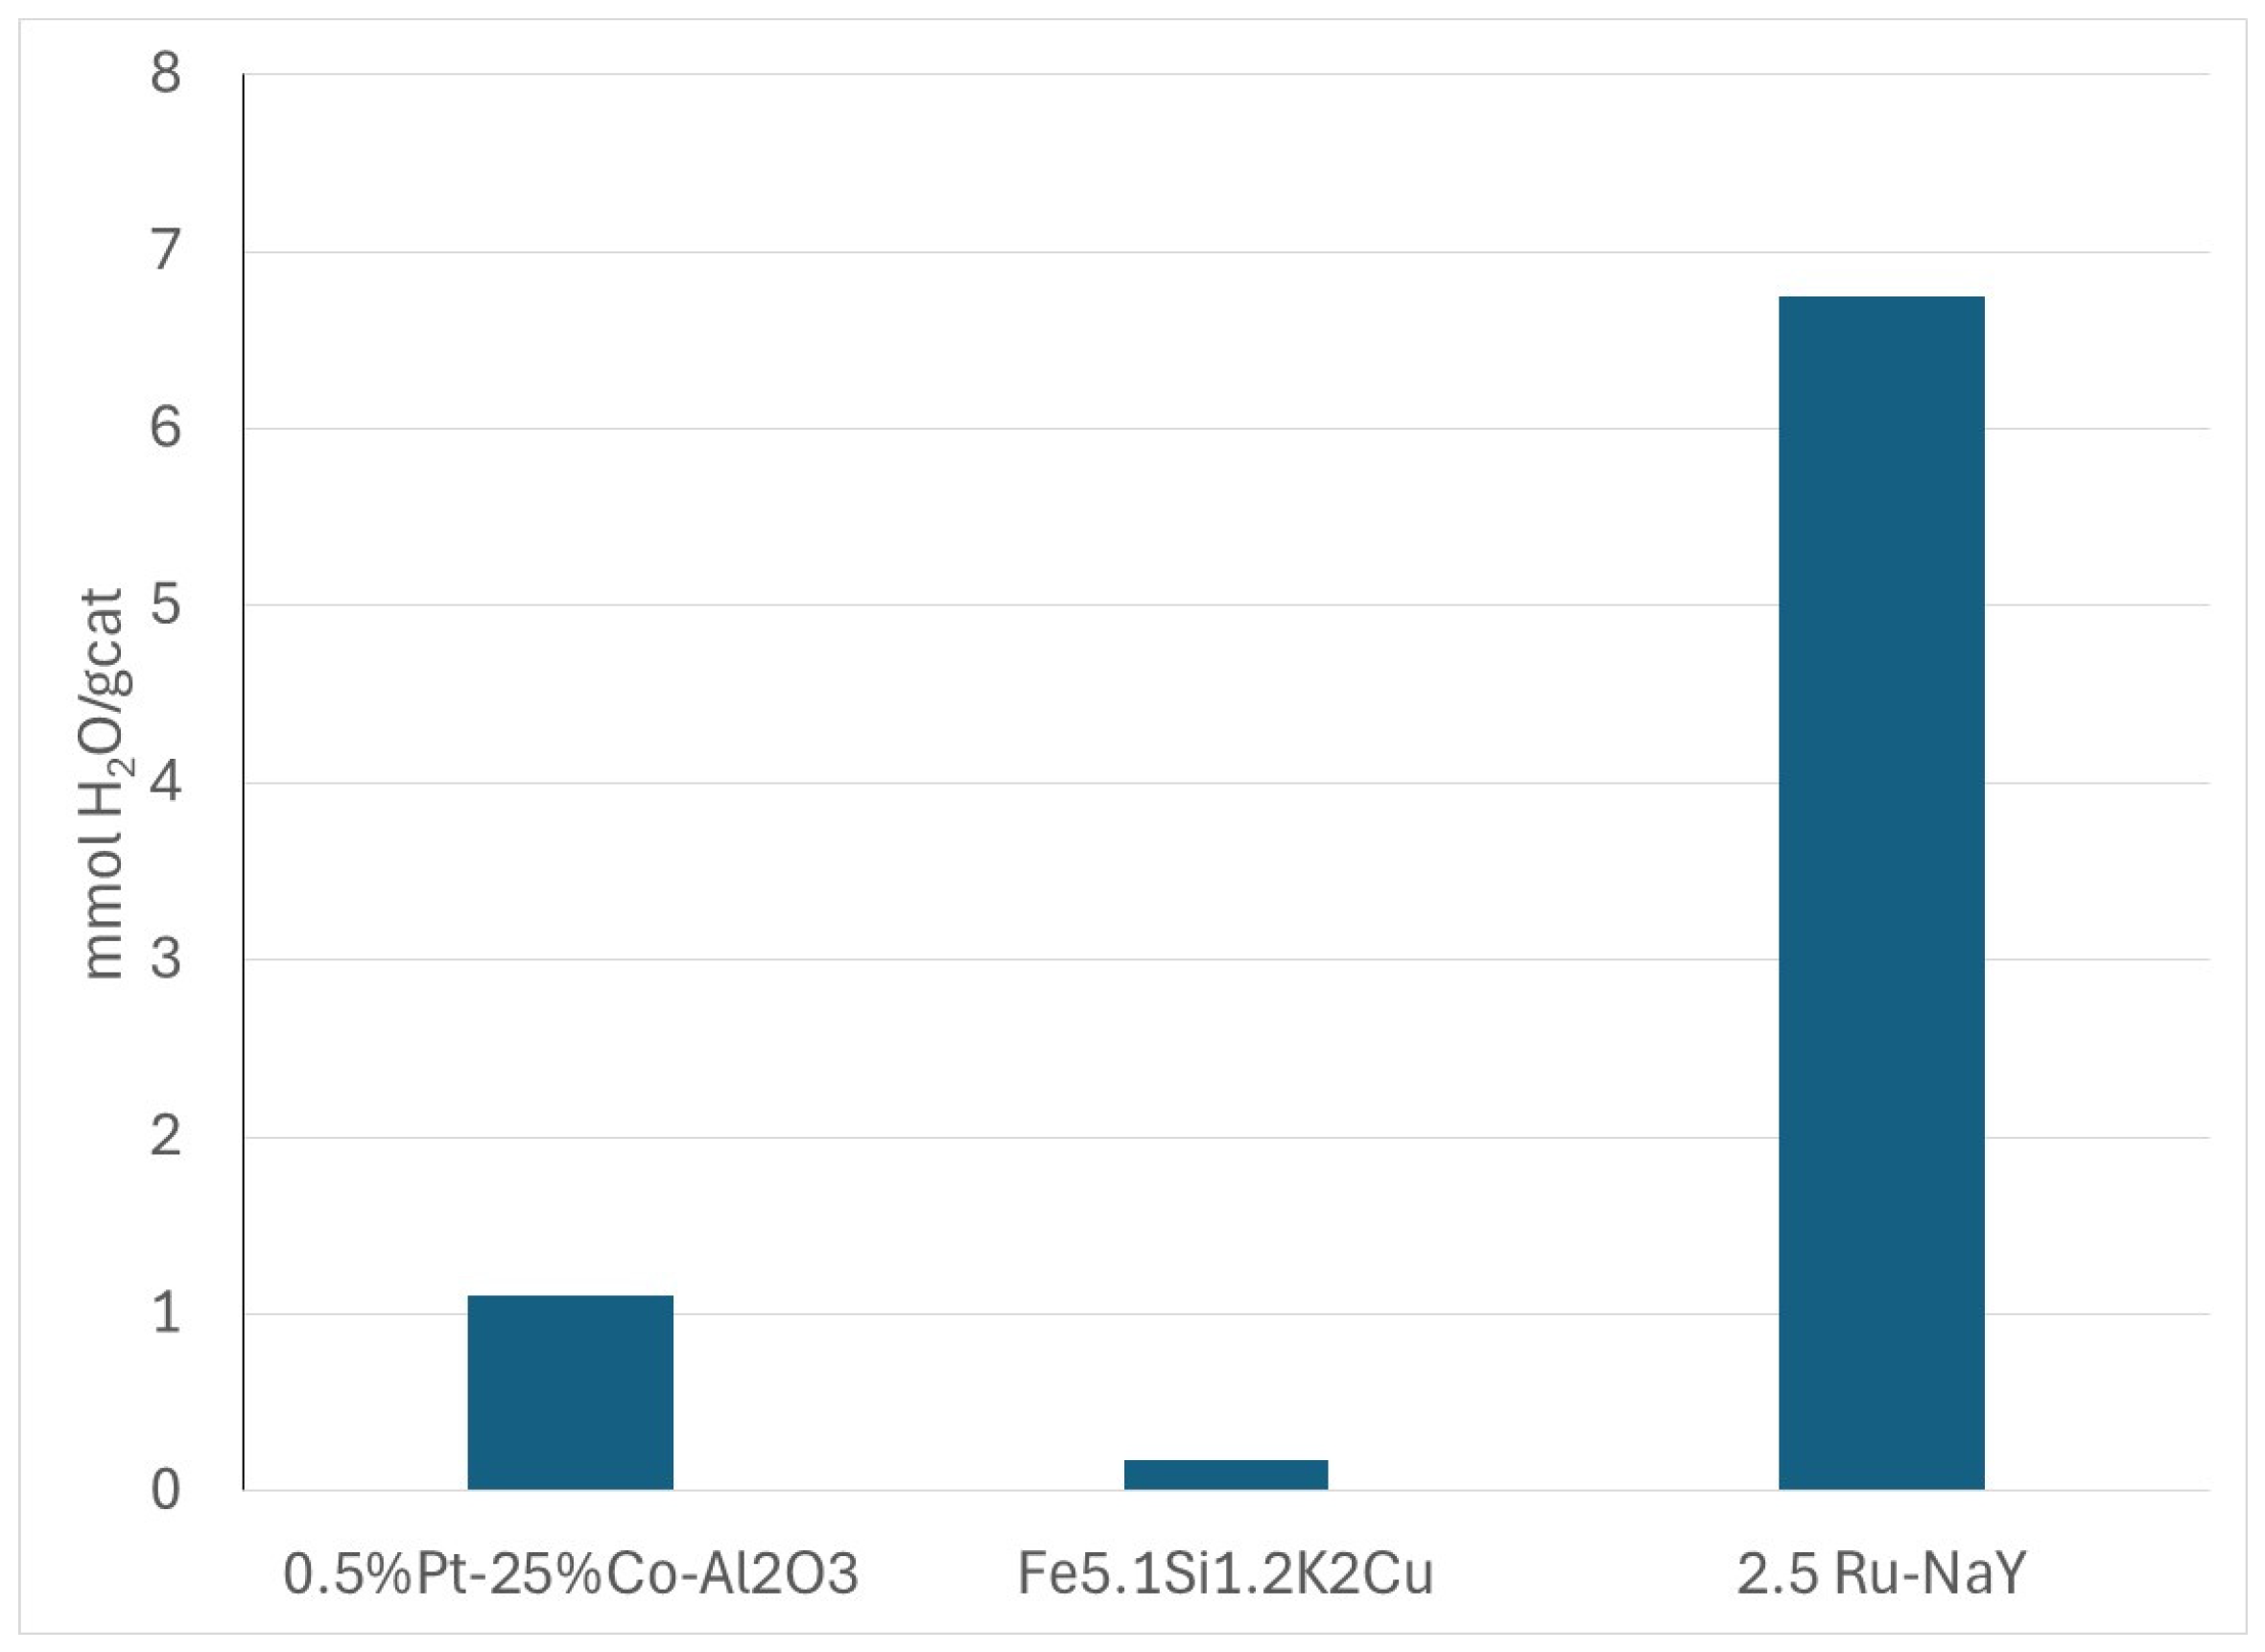
3.2.3. H2O Adsorption on Fe, Co, and Ru Catalysts by H2O-TPD

To verify the hypothesis of stronger H2O adsorption on Ru catalysts than Fe and Co, H2O-TPD experiments were performed over the Fe, Co, and Ru catalysts using an Auto Chem III from Micromeritics following the catalysts being reduced and cooled to 30 °C. Water vapor was generated at 100 °C. The H2O-TPD experiments over all three Fe, Co, and Ru catalysts were performed between 50 and 600 °C. The H2O-TPD results are shown in Figure 10. It is seen that the H2O adsorbed on the Fe, Co, and Ru catalysts desorbed between 50 and 300 °C. The peak values occur at 150 °C for Ru, and ca. 100 °C for Fe and Co. The integrated total adsorbed water on Co was only 1.0 mmol/gcat, while that of the Fe catalyst was only 0.2 mmol/gcat. However, the total adsorbed H2O on the Ru/NaY was significantly higher at 6.8 mmol/gcat. Thus, the water adsorption capacity on the Ru catalyst is ca. 34 times higher than the Fe catalyst and ca. 7 times higher than the Co catalysts. Thus, the H2O-TPD experiment verified remarkably higher water adsorption ability on the Ru catalyst followed by the Co catalyst. The Fe catalyst has the lowest water adsorption ability. The water adsorption study on Co(0001) [43] also reported very weak water adsorption on Co catalyst.
The much larger water adsorption capacity on the Ru surface than the Co surface inhibits hydrogen adsorption, lowers the surface H2/CO ratio, and in turn inhibits hydrogenation, thereby promoting chain growth. This factor contributes to lower CH4 and higher C5+ selectivity on Ru than Co, both of which have a low extent of WGS.

4. Conclusions

The CO conversion effect on C1 and C5+ hydrocarbon formation and olefin formation on Ru were comparatively studied with Fe and Co catalysts using a 1 L CSTR under 200–230 °C, 2.0 MPa, H2/CO = 2, and 10–60% CO conversion. A series of 1–7.5%Ru/NaY catalysts were prepared for the CO conversion effect study. The normal CO conversion effect on C1 and C5 selectivity, and reverse CO conversion effect on olefin formation was demonstrated on the Ru catalyst relative to the Fe and Co catalysts. The H2O cofeeding experiment on Ru-Co/Al2O3 showed enhanced 1-olefin formation by water, while the H2O-TPD experiments suggest a much different H2O adsorption capacity/heat on Fe, Co, and Ru surfaces. Ru has higher H2O adsorption ability than Co and Fe. The reaction testing and catalyst characterization results explained the opposite CO conversion effect on olefin formation on Ru, as well as much lower CH4 (2–3%), higher C5+ selectivity (90–95%) on Ru catalyst, and higher CH4 (6–8%) and relatively lower C5+ selectivity (85–88%) on the Co catalyst, both of which have low WGS activity
The 1.0–7.5%Ru/NaY catalysts were also characterized by BET, H2 chemisorption, XRD, HRTEM, and XANES/EXAFS. The XRD results indicated high dispersion of Ru on NaY and high crystallinity of the NaY support, while BET indicated a high surface area (460–730 m2/g) where micropores dominated the structure of the support and Ru/NaY catalysts. HRTEM and H2 chemisorption provided information on the Ru nanoparticle distribution, which increased from 6.5 to 62.5 nm (H2 chemisorption) on average with increasing loading (1% to 7.5% Ru). The interplanar spacing (d-spacing) for all four Ru catalysts was determined to be 0.205–0.208 nm by FFT, consistent with the Ru HCP structure (0.206 nm). The XANES/EXAFS results also showed mainly reduced Ru metal nanoparticles on NaY, while some oxidation (especially for the smaller Ru nanoparticles associated with the 1%Ru catalyst) occurred after exposure to FTS conditions.

Author Contributions

Conceptualization, experiment, draft preparation, validation, W.M.; experiment, validation, editing, and reviewing G.J. and J.Y.; experiment, D.Q. All authors have read and agreed to the published version of the manuscript.

Funding

This research received no external funding.

Data Availability Statement

Data is restricted access.

Acknowledgments

The authors would like to acknowledge the support of the Commonwealth of Kentucky. The authors thank Robert B. Pace for his assistance with TPD experiments.

Conflicts of Interest

The authors declare no conflicts of interest.

References

  1. Available online: https://www.eia.gov/outlooks/ieo/pdf/ieo2020.pdf (accessed on 5 May 2020).
  2. Ma, W.P. COx hydrogenation on Fe and Co catalysts: An efficient approach to carbon neutrality. In Proceedings of the 3rd International Conference on Energy and Environment, Lexington, KY, USA, 16–19 July 2024. [Google Scholar]
  3. Dry, M. The Fischer–Tropsch process: 1950–2000. Catal. Today 2002, 71, 227–241. [Google Scholar] [CrossRef]
  4. Xiang, H.W.; Yang, Y.; Li, Y.W. Indirect coal-to-liquids technology from fundamental research to commercialization. Sci. Sin. Chim. 2014, 14, 1876–1892. [Google Scholar] [CrossRef]
  5. Khodakov, A.Y.; Chu, W.; Fongarland, P. Advances in the Development of Novel Cobalt Fischer-Tropsch Catalysts for Synthesis of Long-Chain Hydrocarbons and Clean Fuels. Chem. Rev. 2007, 107, 1692–1744. [Google Scholar] [CrossRef] [PubMed]
  6. Iglesia, E. Design, synthesis, and use of cobalt-based Fischer-Tropsch synthesis catalysts. Appl. Catal. A Gen. 1997, 161, 59–78. [Google Scholar] [CrossRef]
  7. Fischer, F.; Tropsch, H. The preparation of synthetic oil mixtures (synthol) from carbon monoxide and hydrogen. Brennst. Chem. 1923, 4, 276–285. [Google Scholar]
  8. Torres, G.H.M.; de Jong, K.P. Catalysts for Production of Lower Olefins from Synthesis Gas: A Review. ACS Catal. 2013, 3, 2130–2149. [Google Scholar] [CrossRef]
  9. Davis, B.H. Fischer−Tropsch Synthesis:  Comparison of Performances of Iron and Cobalt Catalysts. Ind. Eng. Chem. Res. 2007, 46, 8938–8945. [Google Scholar] [CrossRef]
  10. de Smit, E.; Weckhuysen, B.M. The renaissance of iron-based Fischer–Tropsch synthesis: On the multifaceted catalyst deactivation behaviour. Chem. Soc. Rev. 2008, 37, 2758–2781. [Google Scholar] [CrossRef]
  11. Zhang, Q.; Kang, J.; Wang, Y. Development of Novel Catalysts for Fischer–Tropsch Synthesis: Tuning the Product Selectivity-Review. ChemCatChem 2010, 2, 1030–1058. [Google Scholar] [CrossRef]
  12. Anderson, R.B. The Fischer-Tropsch Synthesis; Academic Press: Orlando, FL, USA, 1984. [Google Scholar]
  13. Luo, M.; Bao, S.; Keogh, R.A.; Sarkar, A.; Jacobs, G.; Davis, B.H. Fischer-Tropsch Synthesis: A Comparison of Iron and Cobalt Catalysts. In Proceedings of the AIChE 2006 National Meeting, San Francisco, CA, USA, 12–17 November 2006. [Google Scholar]
  14. Shafer, W.D.; Gnanamani, M.K.; Graham, U.M.; Yang, J.; Masuku, C.M.; Jacobs, G.; Davis, B.H. Fischer–Tropsch: Product Selectivity—The Fingerprint of Synthetic Fuels. Catalysts 2019, 9, 259. [Google Scholar] [CrossRef]
  15. Ma, W.; Jacobs, G.; Sparks, D.E.; Todic, B.; Bukur, D.B.; Davis, B.H. Quantitative comparison of iron and cobalt based catalysts for the Fischer-Tropsch synthesis under clean and poisoning conditions. Catal. Today 2020, 343, 125–136. [Google Scholar] [CrossRef]
  16. Davis, B.H. Fischer–Tropsch synthesis: Overview of reactor development and future potentialities. Top Catal. 2005, 32, 143–168. [Google Scholar] [CrossRef]
  17. Davis, B.H. Fischer–Tropsch synthesis: Current mechanism and futuristic needs. Fuel Proc. Technol. 2001, 71, 157–166. [Google Scholar] [CrossRef]
  18. Bukur, D.B.; Lang, X. Highly active and stable iron Fischer-Tropsch catalyst for synthesis gas conversion to liquid fuels. Ind. Eng. Chem. Res. 1999, 38, 3270–3275. [Google Scholar] [CrossRef]
  19. Xu, J.; Yang, Y.; Li, Y.-W. Recent development in converting coal to clean fuels in China. Fuel 2015, 152, 122–130. [Google Scholar] [CrossRef]
  20. Kellner, C.S.; Bell, A.T. Effects of dispersion on the activity and selectivity of alumina-supported ruthenium catalysts for carbon monoxide hydrogenation. J. Catal. 1982, 75, 251–261. [Google Scholar] [CrossRef]
  21. Iglesia, E.; Soled, R.S.L.; Fiato, A. Fischer-Tropsch synthesis on cobalt and ruthenium. Metal dispersion and support effects on reaction rate and selectivity. J. Catal. 1992, 137, 212–224. [Google Scholar] [CrossRef]
  22. Carballo, J.M.G.; Yang, J.; Holmen, A.; Garcia-Rodriguez, S.; Rojas, S.; Ojeda, M.; Fierro, J.L.G. Catalytic effects of ruthenium particle size on the Fischer–Tropsch Synthesis. J. Catal. 2011, 284, 102–108. [Google Scholar] [CrossRef]
  23. Eslava, J.L.; Sun, X.H.; Gascon, J.; Kapteijnb, F.; Ramos, I. Ruthenium particle size and cesium promotion effects in Fischer–Tropsch synthesis over high surface-area graphite supported catalysts. Catal. Sci. Technol. 2017, 7, 1235–1244. [Google Scholar] [CrossRef]
  24. Carballo, J.M.G.; Alonso, F.J.P.; Ojeda, M.; GarcIa-Garcia, F.J.; Fierro, J.L.G.; Rojas, S. Evidences of Two-Regimes in the Measurement of Ru Particle Size Effect for CO Dissociation during Fischer–Tropsch Synthesis. ChemCatChem 2014, 6, 2084–2094. [Google Scholar] [CrossRef]
  25. Kang, J.; Zhang, S.; Zhang, Q.; Wang, Y. Ruthenium nanoparticles supported on carbon nanotubes as efficient catalysts for selective conversion of synthesis gas to diesel fuel. Angew. Chem. Int. Ed. Engl. 2009, 48, 2565–2568. [Google Scholar] [CrossRef] [PubMed]
  26. Xiao, C.X.; Cai, Z.P.; Wang, T.; Kou, Y.; Yan, N. Aqueous-Phase Fischer–Tropsch Synthesis with a Ruthenium Nanocluster Catalyst. Angew. Chem. 2008, 120, 758–761. [Google Scholar] [CrossRef]
  27. Ma, W.; Dalai, A.K. Effects of Structure and Particle Size of Iron, Cobalt and Ruthenium Catalysts on Fischer–Tropsch Synthesis. Reactions 2021, 2, 62–77. [Google Scholar] [CrossRef]
  28. Iglesia, E.; Reyes, S.C.; Madon, R.J.; Soled, S.L. Selectivity Control and Catalyst Design in the Fischer-Tropsch Synthesis: Sites, Pellets, and Reactors. Adv. Catal. 1993, 39, 221–302. [Google Scholar] [CrossRef]
  29. Borg, Ø.; Eri, S.; Blekkan, E.A.; Storsæter, S.; Wigum, H.; Rytter, E.; Holmen, A. Fischer–Tropsch synthesis overγ-alumina-supported cobalt catalysts: Effect of support variable. J. Catal. 2007, 248, 89–100. [Google Scholar] [CrossRef]
  30. Ma, W.; Jacobs, G.; Ji, Y.; Bhatelia, T.; Bukur, D.B.; Khalid, S.; Davis, B.H. Fischer-Tropsch synthesis: Influence of CO conversion on selectivities, H2/CO usage ratios, and catalyst stability for a 0.27% Ru 25%Co/Al2O3 using a slurry-phase reactor. Top. Catal. 2011, 54, 757–767. [Google Scholar] [CrossRef]
  31. Bukur, D.B.; Pan, Z.; Ma, W.; Jacobs, G.; Davis, B.H. Effect of CO conversion on the product distribution of a Co/Al2O3 Fischer-Tropsch synthesis catalyst using a fixed bed reactor. Catal. Lett. 2012, 142, 1382–1387. [Google Scholar] [CrossRef]
  32. Tucker, C.L.; van Steen, E. Activity and selectivity of a cobalt-based Fischer-Tropsch catalyst operating at high conversion for once-through biomass-to-liquid operation. Catal. Today 2020, 342, 115–123. [Google Scholar] [CrossRef]
  33. Raje, A.P.; O’Brien, R.J.; Davis, B.H. Effect of Potassium Promotion on Iron-Based Catalysts for Fischer–Tropsch Synthesis. J. Catal. 1998, 180, 36. [Google Scholar] [CrossRef]
  34. Yang, J.; Ma, W.P.; Chen, D.; Holmen, A.; Davis, B.H. Fischer-Tropsch synthesis: A review of the Effect of CO Conversion on Methane Selectivity. Appl. Catal. 2014, 470, 250–260. [Google Scholar] [CrossRef]
  35. Ma, W.; Shafer, W.D.; Jacobs, G.; Yang, J.; Sparks, D.E.; Hamdeh, H.H.; Davis, B.H. Fischer-Tropsch synthesis: Effect of CO conversion on CH4 and oxygenate selectivities over precipitated Fe-K catalysts. Appl. Catal. 2018, 560, 144–152. [Google Scholar] [CrossRef]
  36. Jacoby, M. X-ray absorption spectroscopy. Chem. Eng. News 2001, 79, 33–38. [Google Scholar] [CrossRef]
  37. Ressler, T. WinXAS: A program for X-ray absorption spectroscopy data analysis under MS-Windows. J. Synch. Rad. 1998, 5, 118–122. [Google Scholar] [CrossRef] [PubMed]
  38. Ravel, B. ATOMS: Crystallography for the X-ray absorption spectroscopist. J. Synch. Rad. 2001, 8, 314–316. [Google Scholar] [CrossRef]
  39. Rehr, J.J.; Zabinsky, S.I.; Albers, R.C. High-order multiple-scattering calculations of X-ray-absorption fine structure. Phys. Rev. Lett. 1992, 69, 3397. [Google Scholar] [CrossRef]
  40. Newville, M.; Ravel, B.; Haskel, D.; Stern, E.A.; Yacoby, Y. Analysis of multiple-scattering XAFS data using theoretical standards. Phys. B Condens. Matter 1995, 208/209, 154–156. [Google Scholar] [CrossRef]
  41. Storsæter, S.; Borg, Ø.; Blekkan, E.A.; Holmen, A. Study of the effect of water on Fischer-Tropsch synthesis over supported cobalt catalysts. J. Catal. 2005, 231, 405–419. [Google Scholar] [CrossRef]
  42. Todic, B.; Ma, W.; Jacobs, G.; Nikacevic, N.; Davis, B.H.; Bukur, D.B. Kinetic modeling of secondary methane formation and 1-olefin hydrogenation in Fischer-Tropsch synthesis over a cobalt catalyst. Int. J. Chem. Kinet. 2017, 49, 859–874. [Google Scholar] [CrossRef]
  43. Xu, L.; Ma, Y.; Zhang, Y.; Chen, B.; Wu, Z.; Jiang, Z.; Huang, W. Water Adsorption on a Co(0001) Surface. Phys. Chem. C 2010, 114, 17023–17029. [Google Scholar] [CrossRef]
Figure 1. XRD patterns of NaY support and Ru/NaY catalysts.
Reactions 06 00031 g001
Figure 2. Ru/NaY STEM images and Ru particle size distribution.
Reactions 06 00031 g002
Figure 3. HRTEM and FFT profile of reduced 1Ru/NaY catalyst.
Reactions 06 00031 g003
Figure 4. Normalized XANES spectra at the Ru K-edge of the H2 reduced Ru/NaY catalyst (a); and the used Ru/NaY catalysts (b).
Reactions 06 00031 g004
Figure 5. (A) Left—EXAFS results at the Ru K-edge for the H2 pretreated Ru/NaY catalysts. (B) Right—EXAFS results at the Ru K-edge for the used Ru/NaY catalysts; left—the raw k2-weighted χ(k) versus k; middle—(solid line) the filtered k2-weighted χ(k) versus k and (filled circles) the result of the fitting; and right—(solid line) the Fourier transform spectra with (filled circles) the result of the fitting. (a) 1%Ru; (b) 2.5%Ru; (c) 5.0%Ru; (d) 7.5%Ru.
Reactions 06 00031 g005
Figure 6. Change in (a) CO conversion, (b) CH4 selectivity, (c) C5+ selectivity, (d) C3 olefin content, and (e) C4 olefin content with time on 1.0–7.5%Ru/NaY catalysts. Reaction conditions: 220 °C, 2.0 MPa, and H2/CO = 2.0.
Reactions 06 00031 g006
Figure 7. Effect of CO conversion on (a) CH4 selectivity, (b) C5+ selectivity, (c) 1-C4 olefin content, (d) 2-C4 olefin content, (e) total C4 olefin content, and (f) C4 paraffin content over Ru, Co, and Fe catalysts. Reaction conditions: Ru and Co, 220 °C, 2.0 MPa, and H2/CO 2.0; Fe, 270 °C, 1.3 MPa, and H2/CO = 0.7. CH4 selectivity, % = 100x mole of CH4 formed/(mole of COin − mole of COout − mole of CO2 formed). C5+ selectivity, % = 100x (1-mole of C to C1-C4)/(mole of COin − mole of COout − mole of CO2 formed). 1-C4 olefin content, % = 100x mole of 1-C4 olefin/(mole of all C4 olefins + mole of all C4 paraffins). 2-C4 olefin content, % = 100x mole of 2-C4 olefin/(mole of all C4 olefins + mole of all C4 paraffins). Total C4 olefin content, % = 100x mole of (1-C4 olefin + mole of 2-C4 olefin)/(mole of all C4 olefins + mole of all C4 paraffins). n-C4 paraffin content, % = 100x mole of n-C4 paraffin/(mole of all C4 olefins + mole of all C4 paraffins).
Reactions 06 00031 g007aReactions 06 00031 g007b
Figure 8. Effect of Ru cluster size/loading on olefin/paraffin ratios at C3 and C4. Reaction conditions: Ru, 220 °C, 2.0 MPa, and H2/CO = 2.0.
Reactions 06 00031 g008
Figure 9. Effect cofeeding 5–10% H2O on content of C2 = (top), C3 = (middle), 1-C4 = (middle), and 2-C4 = (bottom) on 0.27%Ru–25%Co/Al2O3. Reaction conditions: 220–240 °C, H2/CO = 2.1, syngas = 2.2 MPa, 21–50% CO conversion, and feed rate = 154 Nl/h.
Reactions 06 00031 g009
Figure 10. H2O-TPD profiles of Fe, Co, and Ru catalysts.
Reactions 06 00031 g010
Table 1. Physical adsorption and H2 chemisorption results of various Ru/NaY catalysts.
CatalystBET SA (m²/g)PV (cm³/g)PD (nm)H₂ desorbed (µmoles/g_cat)Ru Disp. (%)Ru Dia. (nm)
NaY support730.00.3591.979.9
1.0%Ru/NaY661.20.3302.002.020.16.6
2.5%Ru/NaY632.30.3202.0221.317.27.7
5.0%Ru/NaY560.20.2882.0616.86.819.4
7.5%Ru/NaY461.00.2482.167.92.162.9
Table 2. Results of EXAFS fitting for data acquired near the Ru K-edge for Ru0 foil and various Ru/NaY catalysts. The fitting ranges were approximately Δk = 2.5–15 Å−1 and ΔR = 1.3–2.9 Å. Tred = 300 °C for fresh catalysts.
CatalystN
Ru-Ru
R
Ru-Ru (Å)
e0
(eV)
σ2
2)
R-Factor
Ru0 foil (Argonne)12
(set)
2.673 (0.0026)6.2
(0.6)
0.0040 (0.0016)0.011
Ru0 foil (Brookhaven)12
(set)
2.675 (0.0031)5.1
(0.7)
0.0042 (0.0018)0.014
1.0%Ru/NaY (fresh)10.2
(0.7)
2.669 (0.0023)5.2
(0.60)
0.0038 (0.00030)0.0087
2.5%Ru/NaY (fresh)10.0
(0.6)
2.668 (0.0024)5.2
(0.56)
0.0039 (0.00031)0.0080
2.5%Ru/NaY (used)9.6
(0.7)
2.667 (0.0027)5.3
(0.65)
0.0034 (0.00033)0.0096
5.0%Ru/NaY (fresh)10.4
(0.7)
2.670 (0.0024)5.2
(0.56)
0.0037 (0.00030)0.0076
5.0%Ru/NaY (used)10.3
(0.8)
2.674 (0.0029)4.7
(0.70)
0.0036 (0.00037)0.0114
7.5%Ru/NaY (fresh)10.4
(0.7)
2.670 (0.0024)5.2
(0.57)
0.0037 (0.00030)0.0078
7.5%Ru/NaY (used)10.1
(0.7)
2.673 (0.0025)4.5
(0.60)
0.0037 (0.00032)0.0086
Fitting # 1—only includes Ru-Ru metal bonding, suggesting large clusters. (FT reaction conditions: T = 220 °C, P = 2.0 MPa, H2/CO = 2.).
Disclaimer/Publisher’s Note: The statements, opinions and data contained in all publications are solely those of the individual author(s) and contributor(s) and not of MDPI and/or the editor(s). MDPI and/or the editor(s) disclaim responsibility for any injury to people or property resulting from any ideas, methods, instructions or products referred to in the content.

