A Comparative Study on Rice Diversity Mapping with PlanetScope and Sentinel-2 Red Edge Bands Based on Key Phenological Characteristics

Highlights
- Classification accuracy for rice varieties peaks consistently at the Heading–Flowering stage for both PlanetScope and Sentinel-2, indicating phenology as the dominant control factor.
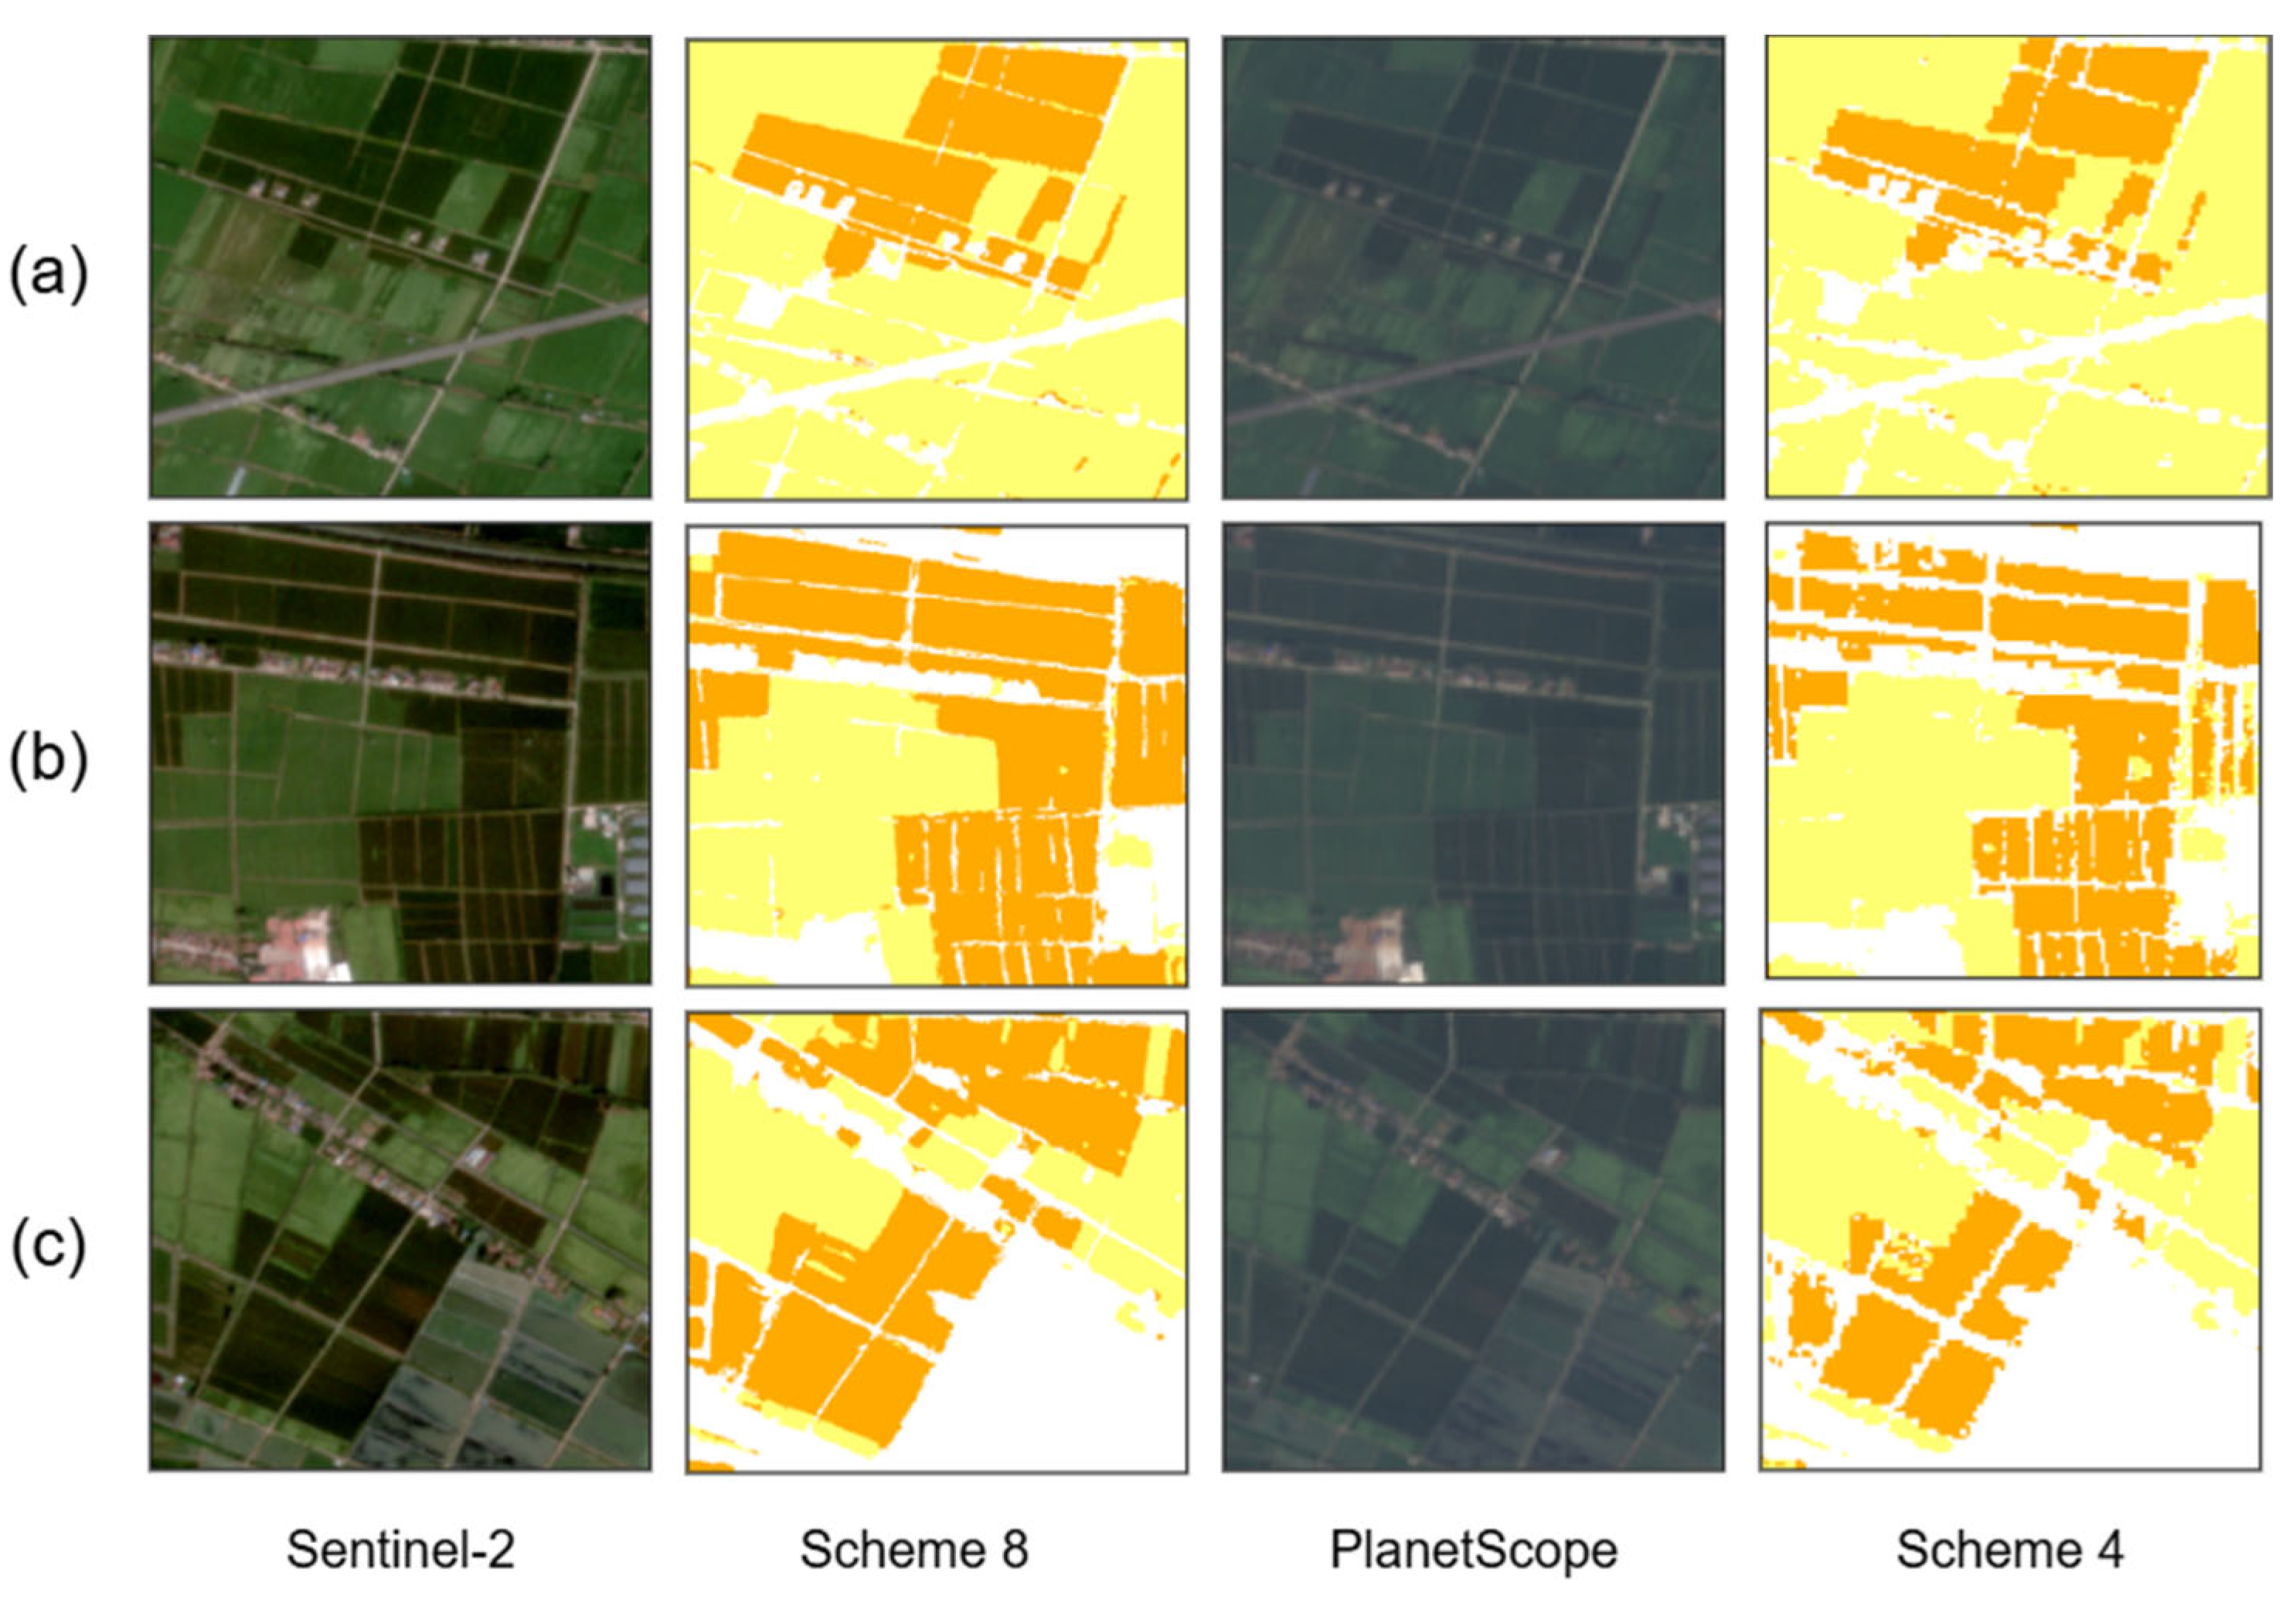
- A single red-edge band from PlanetScope provides classification performance comparable to Sentinel-1 multi-red-edge configurations, while delivering clearer field-scale spatial delineation.
- Increasing the number of red-edge bands does not guarantee proportional gains in variety-level crop mapping; effective performance depends on the synergy among phenology, spatial resolution, and key spectral features.
- High-resolution imagery with essential red-edge information can serve as a practical alternative for fine-scale crop variety monitoring in fragmented agricultural landscapes.
Abstract
1. Introduction
2. Materials and Methods
2.1. Study Area
2.2. Data and Processing
2.2.1. Satellite Imagery
2.2.2. Sample Data
2.3. Methods
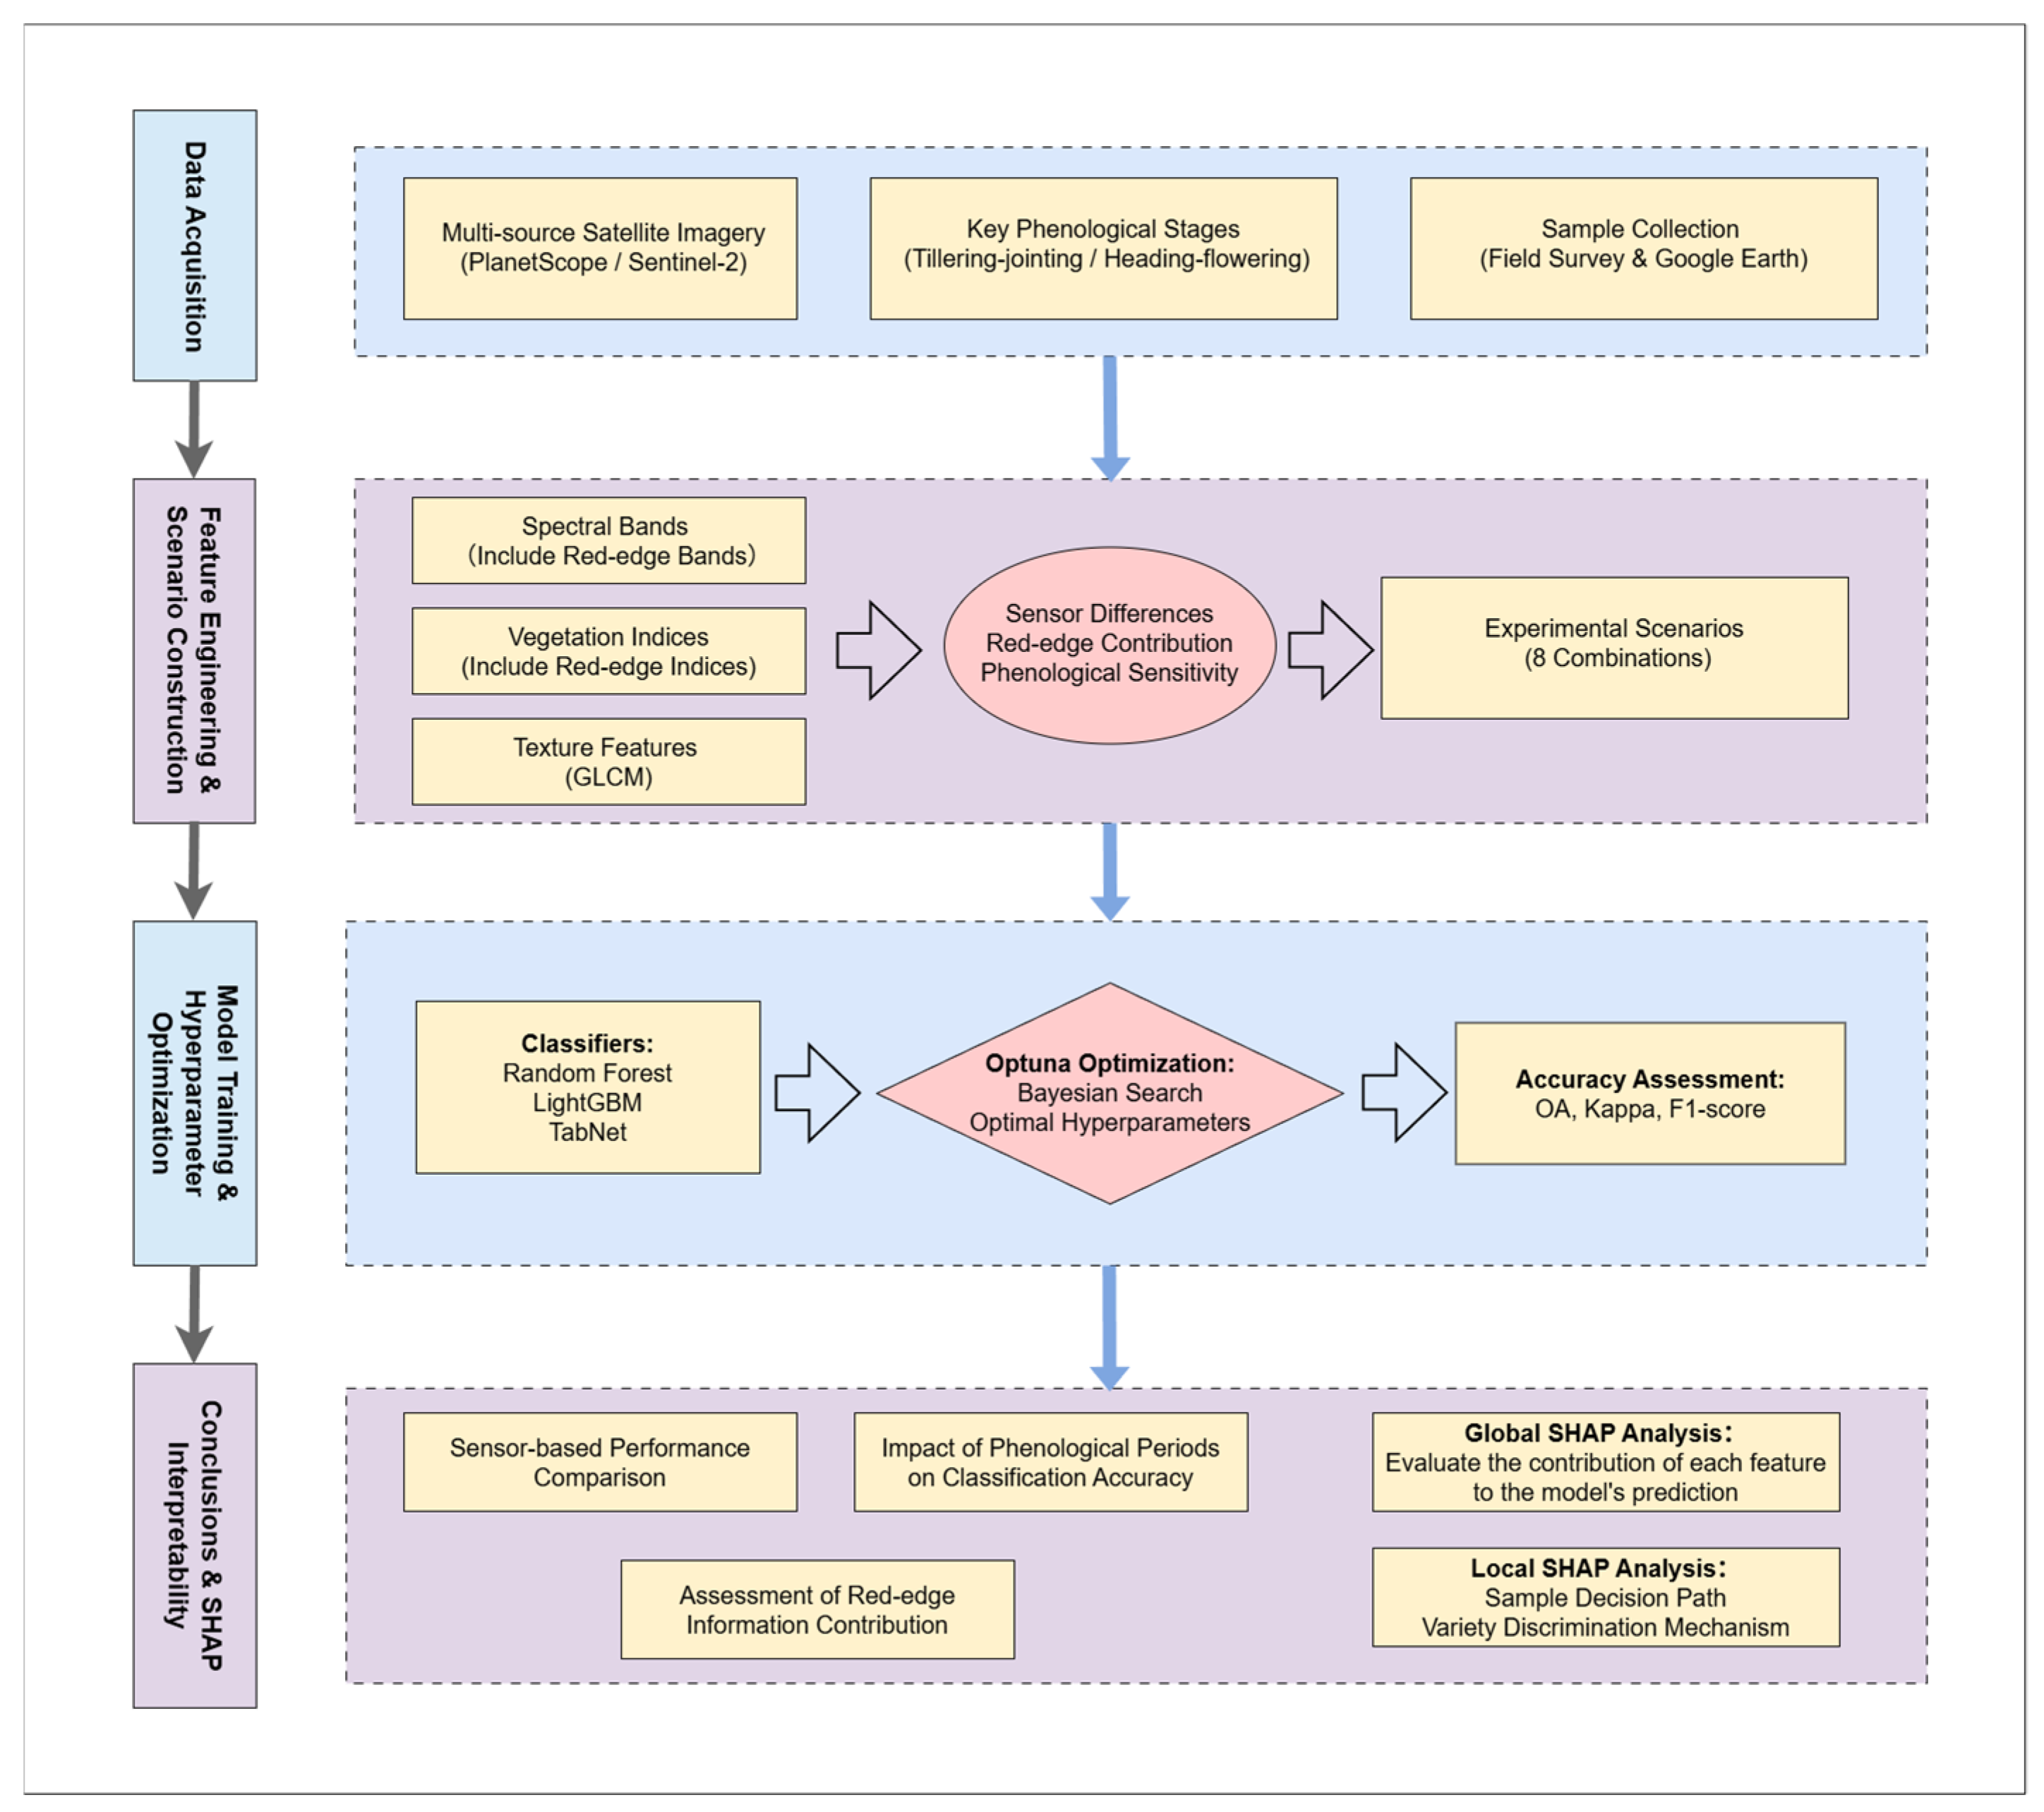
2.3.1. General Technical Workflow
2.3.2. Feature Extraction

| Data Type | Feature Type | Content | Formula |
|---|---|---|---|
| PlanetScope | Spectral bands | B1, B2, B3, B4, B5, B6, B8 | |
| Red-edge spectral band | B7 | ||
| Vegetation indices | NDVI, EVI, GNDVI, NDGI, NDYVI, SAVI, WDRVI [32,33,34] | ||
| Red-edge vegetation indices | MTCI, NDRE, PSRI [24,32] | ||
| Texture features | Mean, Variance, Homogeneity, Contrast, Dissimilarity, Entropy, SecondMoment, Correlation | ||
| Sentinel-2 | Spectral bands | B1, B2, B3, B4, B8, B8A | |
| Red-edge spectral band | B5, B6, B7 | ||
| Vegetation indices | NDVI, EVI, GNDVI, SAVI, WDRVI [32,33,34] | ||
| Red-edge vegetation indices | NDRE, MTCI, Cire, PSRI [24,32], REPI [33,35] | ||
| Texture features | Mean, Variance, Homogeneity, Contrast, Dissimilarity, Entropy, SecondMoment, Correlation |
2.3.3. Experimental Schemes Design
2.3.4. Model Construction Methods
- (1)
- Classification Algorithms
- (2)
- Accuracy Assessment
- (3)
- Hyperparameter Optimization Framework
2.3.5. SHAP-Based Interpretability Analysis
3. Results
3.1. Classification Accuracy Assessment Under Different Feature Schemes and Sensor Conditions
3.1.1. Consistency Analysis of Results Across Different Classifiers
3.1.2. Impact of Red-Edge Features on Identification Accuracy
3.1.3. Comparison of Classification Performance Across Different Phenological Stages
3.2. Quantitative Analysis of Feature Contributions Based on SHAP
3.2.1. Global Feature Contribution Analysis
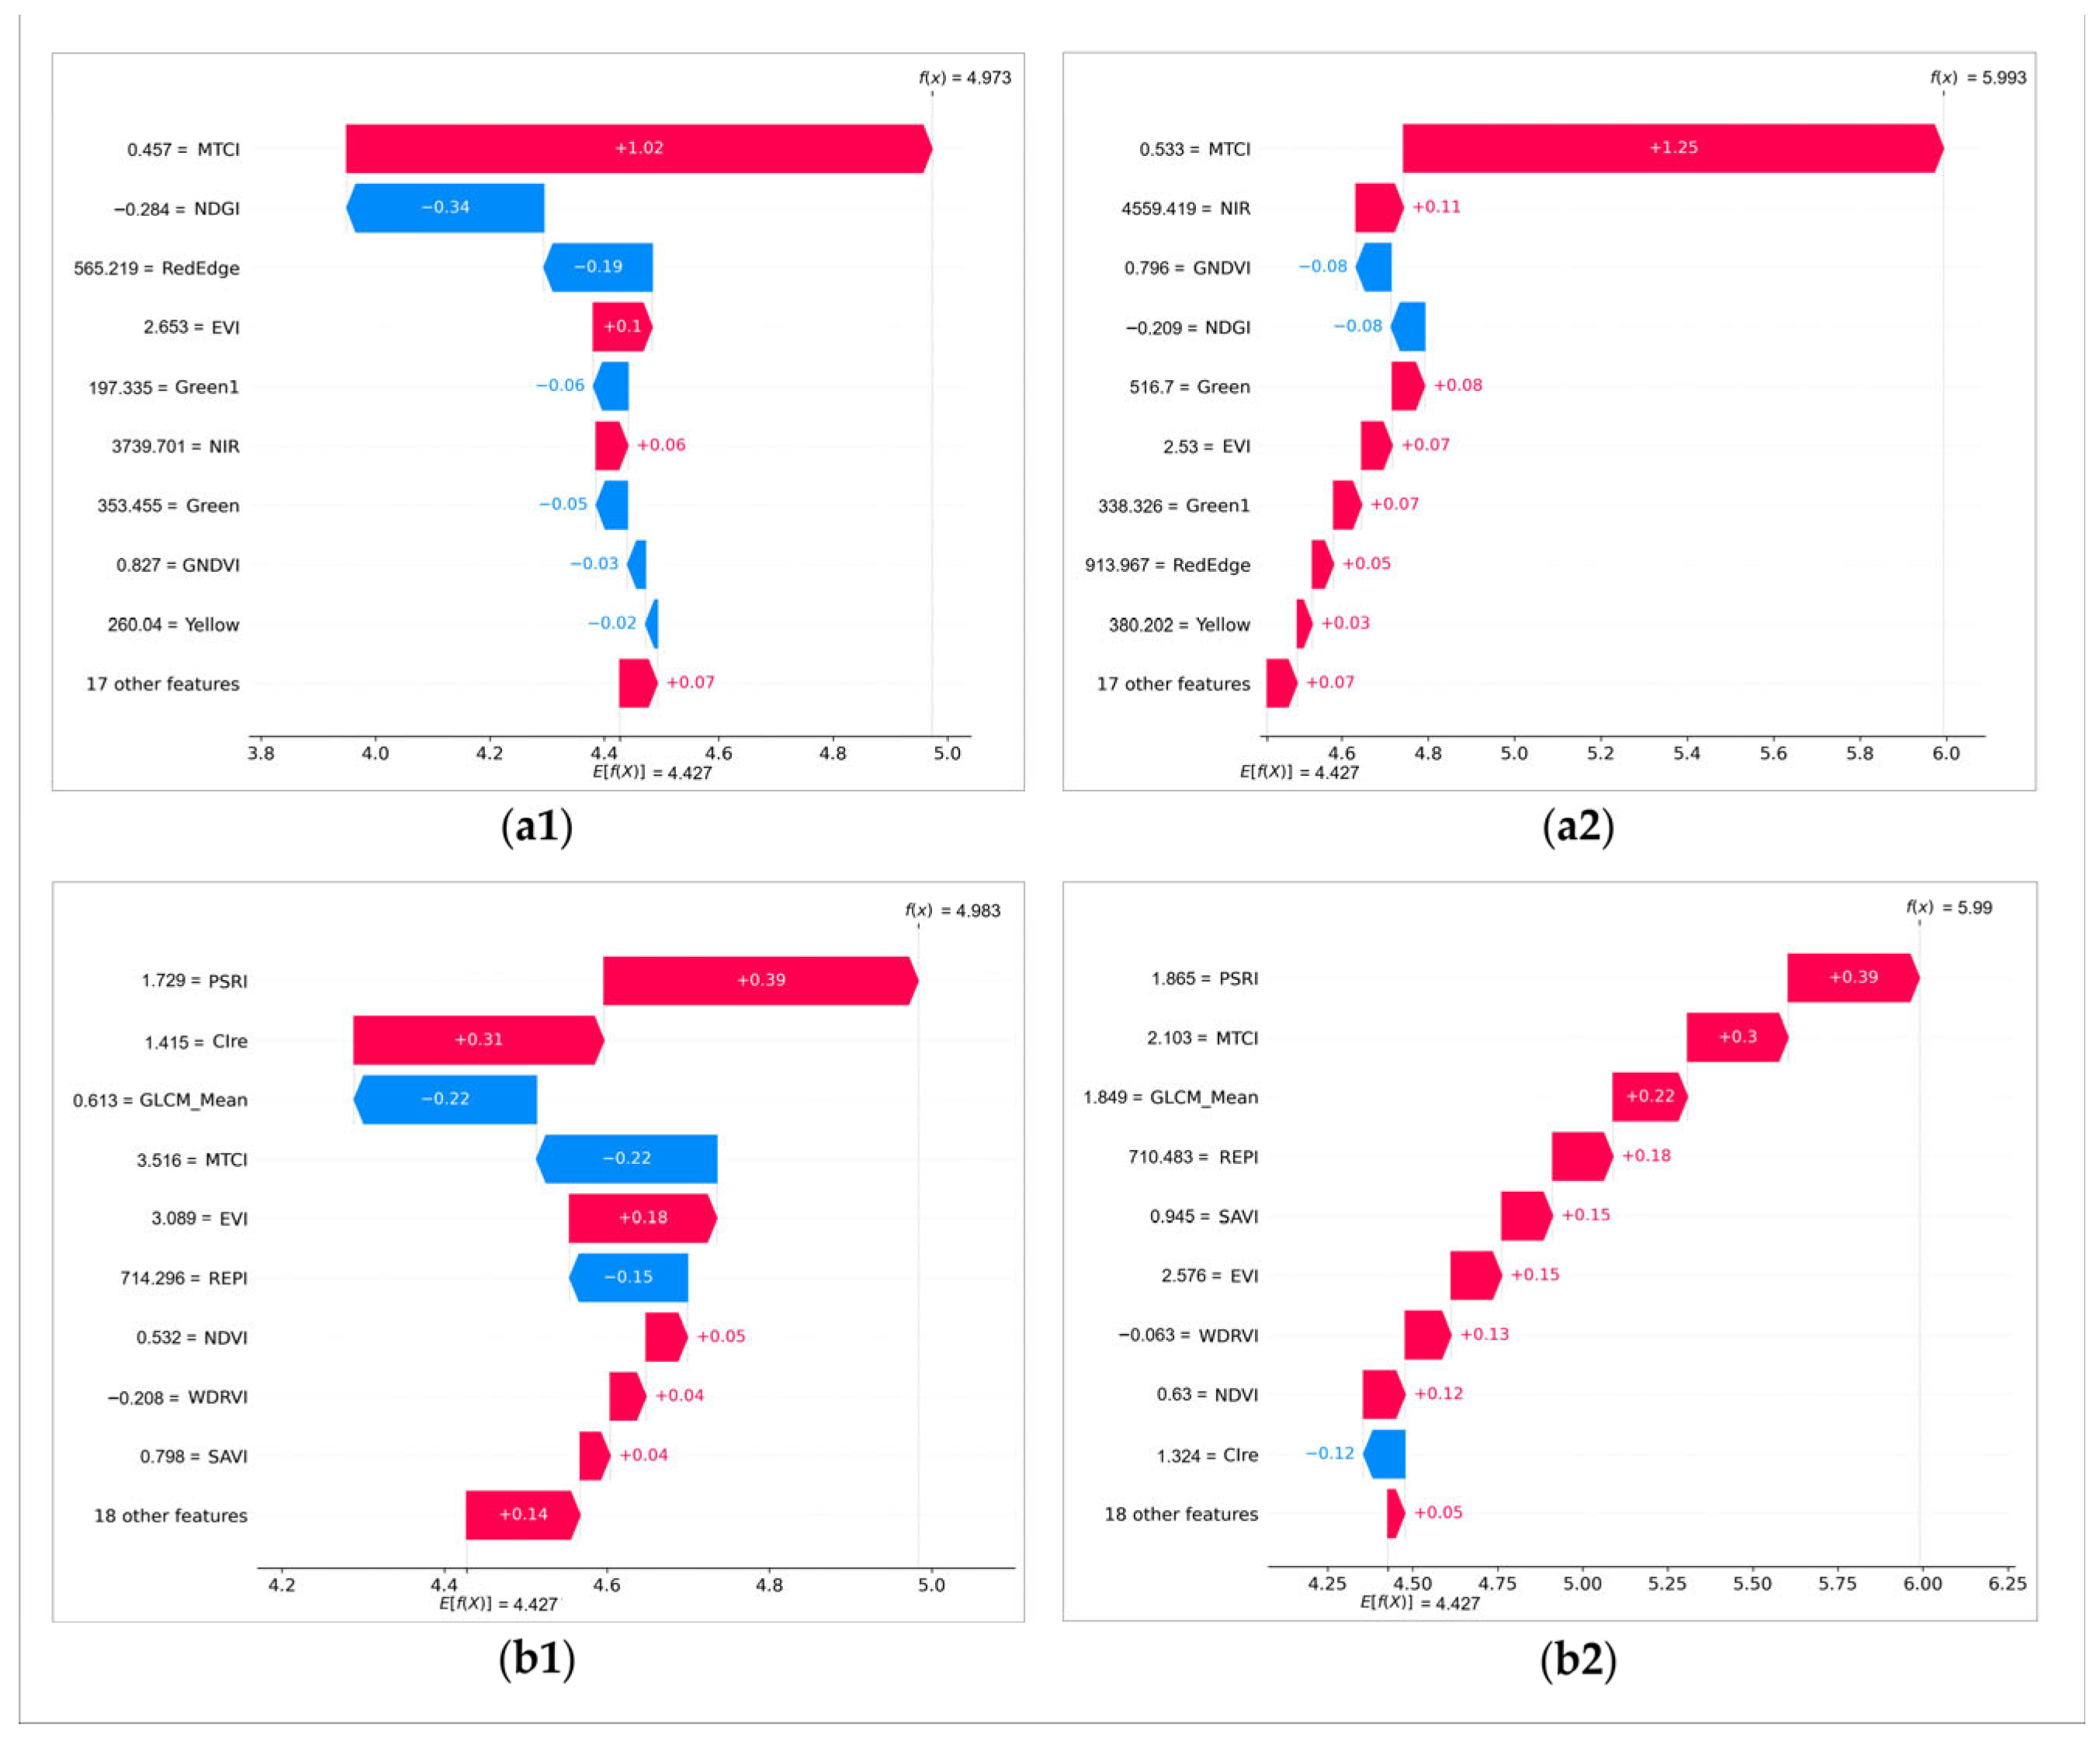
3.2.2. Feature Prediction Paths
3.3. Comparison of Identification Performance Under Different Red-Edge Configurations
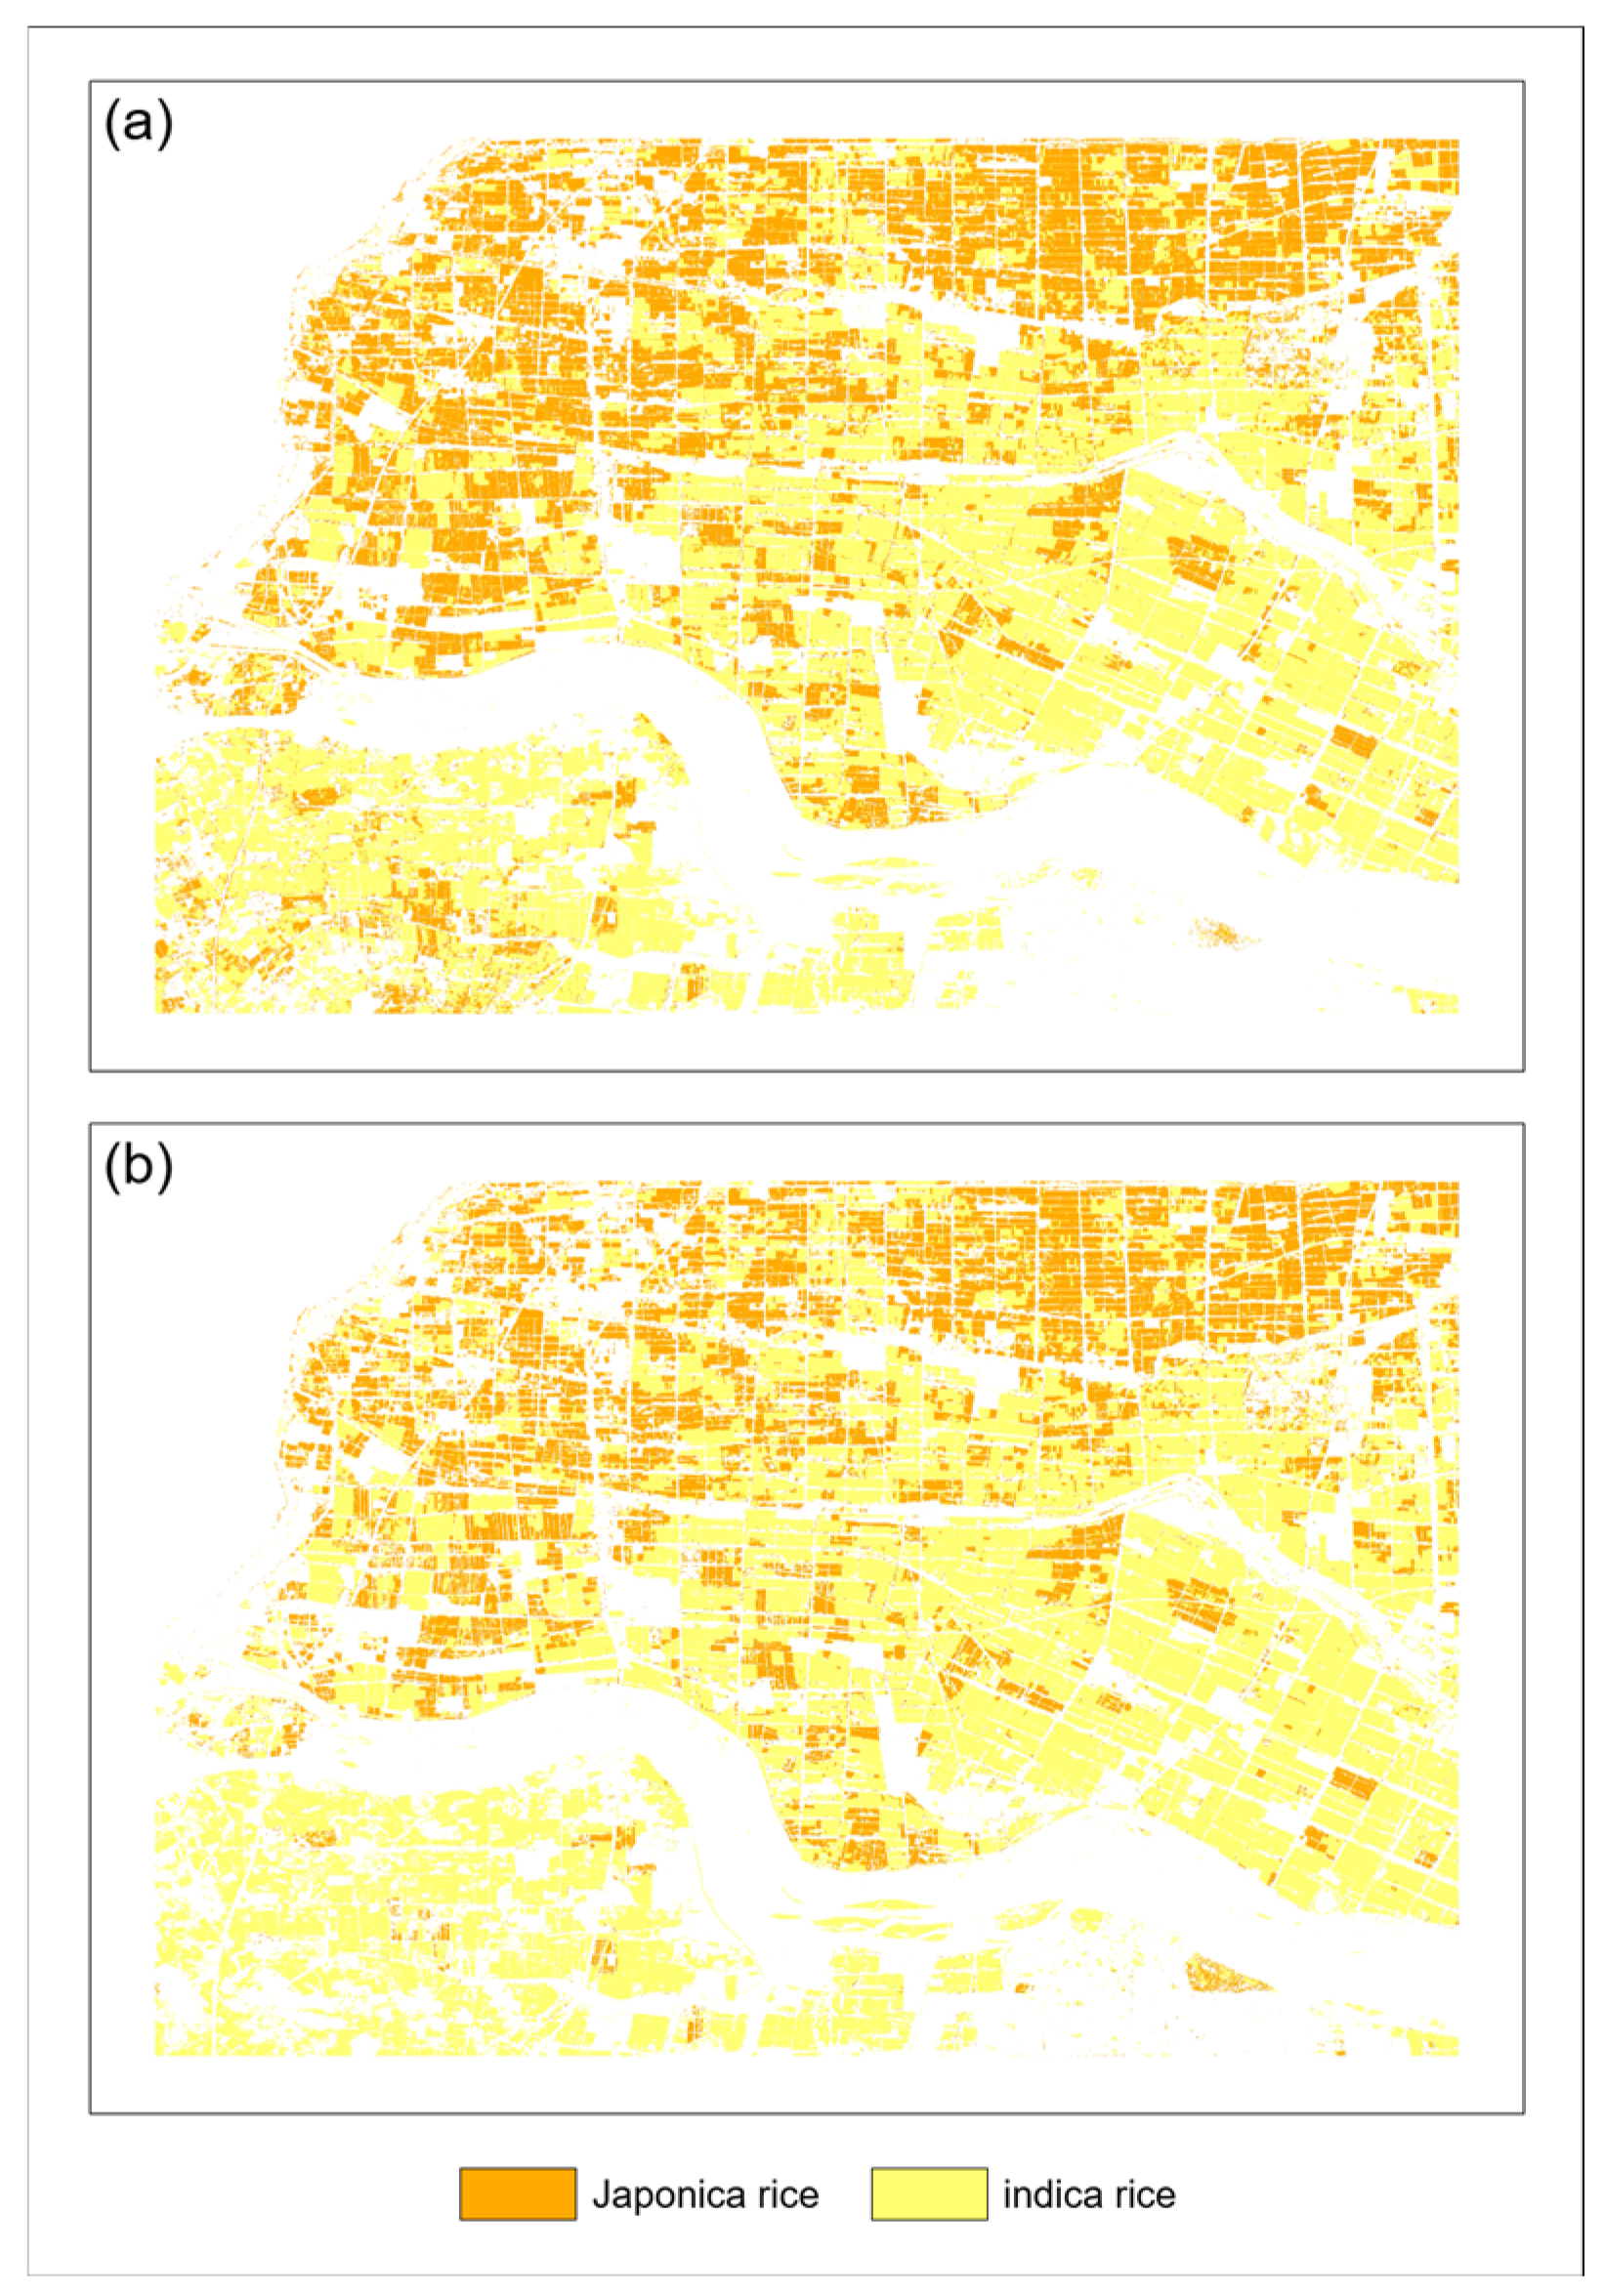
3.4. Comparison of Local Classification Results Under Different Spatial Resolutions
3.5. Comparison with Previous Studies
4. Discussion
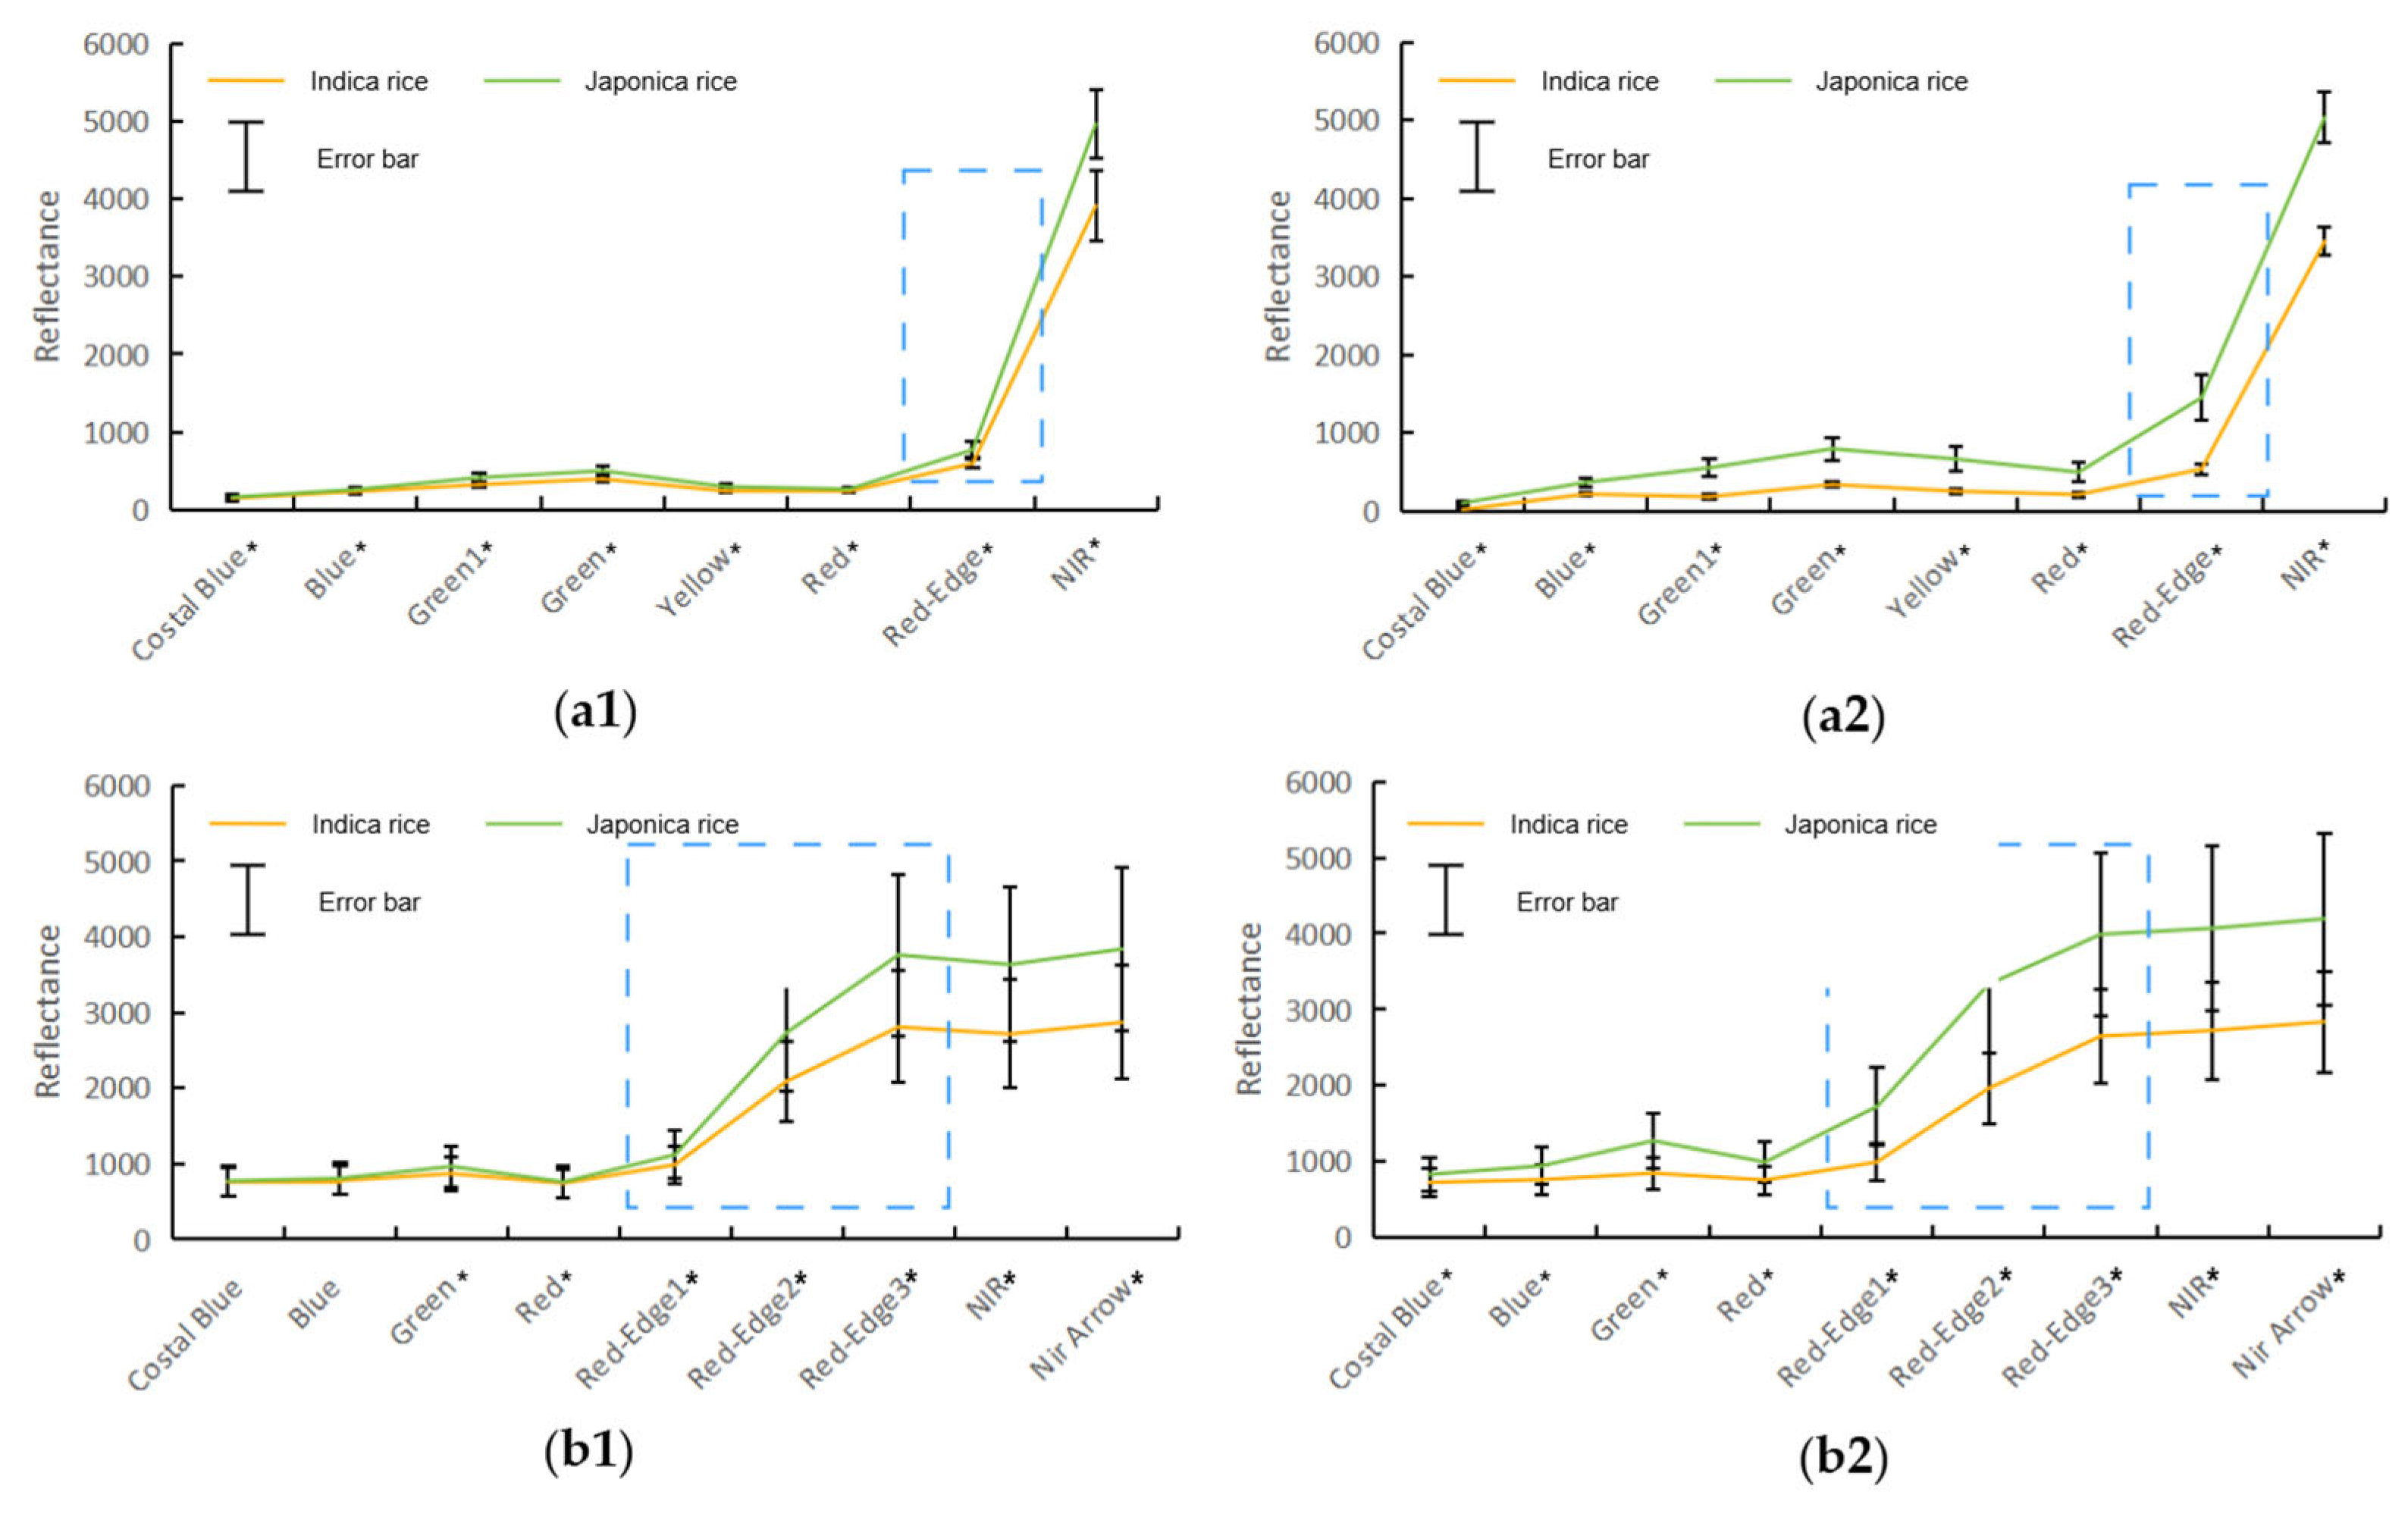
4.1. Identification Advantages of the Heading–Flowering Stage
4.2. Mechanism of Red-Edge Information in Rice Variety Identification
4.3. Insights into Sensor Red-Edge Configurations
4.4. Limitations and Potential for Promotion
5. Conclusions
Author Contributions
Funding
Institutional Review Board Statement
Informed Consent Statement
Data Availability Statement
Acknowledgments
Conflicts of Interest
References
- Fang, H.; Liang, S.; Chen, Y.; Ma, H.; Li, W.; He, T.; Tian, F.; Zhang, F. A comprehensive review of rice mapping from satellite data: Algorithms, product characteristics and consistency assessment. Sci. Remote Sens. 2024, 10, 100172. [Google Scholar] [CrossRef] [Scilit]
- Yuan, S.; Linquist, B.A.; Wilson, L.T.; Cassman, K.G.; Stuart, A.M.; Pede, V.; Miro, B.; Saito, K.; Agustiani, N.; Aristya, V.E.; et al. Sustainable intensification for a larger global rice bowl. Nat. Commun. 2021, 12, 7163. [Google Scholar] [CrossRef] [Scilit]
- Zhao, L.; Luo, Z.; Zhou, K.; Yang, B.; Zhang, Y. Fine classification of rice fields in high-resolution remote sensing images. Sci. Rep. 2024, 14, 20778. [Google Scholar] [CrossRef] [Scilit] [PubMed]
- Islam, M.M.; Himel, G.M.S.; Moazzam, M.G.; Uddin, M.S. Artificial intelligence-based rice variety classification: A state-of-the-art review and future directions. Smart Agric. Technol. 2025, 10, 100788. [Google Scholar] [CrossRef] [Scilit]
- Becker-Reshef, I.; Barker, B.; Whitcraft, A.; Oliva, P.; Mobley, K.; Justice, C.; Sahajpal, R. Crop type maps for operational global agricultural monitoring. Sci. Data 2023, 10, 172. [Google Scholar] [CrossRef] [Scilit] [PubMed]
- Zhou, Y.N.; Zhu, W.W.; Feng, L.; Gao, J.W.; Chen, Y.H.; Zhang, X.; Luo, J.C. Hierarchical classification for improving parcel-scale crop mapping using time-series Sentinel-1 data. J. Environ. Manag. 2024, 369, 122251. [Google Scholar] [CrossRef] [Scilit]
- Kang, Y.; Meng, Q.; Liu, M.; Zou, Y.; Wang, X. Crop classification based on red edge features analysis of GF-6 WFV data. Sensors 2021, 21, 4328. [Google Scholar] [CrossRef] [Scilit]
- Tufail, R.; Tassinari, P.; Torreggiani, D. Deep learning applications for crop mapping using Multi-Temporal sentinel-2 data and Red-Edge vegetation indices: Integrating convolutional and recurrent neural networks. Remote Sens. 2025, 17, 3207. [Google Scholar] [CrossRef] [Scilit]
- Xie, Y.; Zeng, H.; Li, J.; Zhao, H.; Yu, Q.; Qiu, B.; Ahmed, S.; Wu, B. Improving parcel level crop classification by integrating a novel red edge maize-cotton mapping index and machine learning: A case study in the Ebinur Lake Basin. Int. J. Appl. Earth Obs. Geoinf. 2025, 143, 104765. [Google Scholar] [CrossRef] [Scilit]
- Dong, T.; Liu, J.; Shang, J.; Qian, B.; Ma, B.; Kovacs, J.M.; Walters, D.; Jiao, X.; Geng, X.; Shi, Y. Assessment of red-edge vegetation indices for crop leaf area index estimation. Remote Sens. Environ. 2019, 222, 133–143. [Google Scholar] [CrossRef] [Scilit]
- Li, D.; Cheng, T.; Zhou, K.; Zheng, H.; Yao, X.; Tian, Y.; Zhu, Y.; Cao, W. WREP: A wavelet-based technique for extracting the red edge position from reflectance spectra for estimating leaf and canopy chlorophyll contents of cereal crops. ISPRS J. Photogramm. Remote Sens. 2017, 129, 103–117. [Google Scholar] [CrossRef] [Scilit]
- Otunga, C.; Odindi, J.; Mutanga, O.; Adjorlolo, C. Evaluating the potential of the red edge channel for C3 (Festuca spp.) grass discrimination using Sentinel-2 and Rapid Eye satellite image data. Geocarto Int. 2019, 34, 1123–1143. [Google Scholar] [CrossRef] [Scilit]
- Zeng, L.; Wardlow, B.D.; Xiang, D.; Hu, S.; Li, D. A review of vegetation phenological metrics extraction using time-series, multispectral satellite data. Remote Sens. Environ. 2020, 237, 111511. [Google Scholar] [CrossRef] [Scilit]
- Gara, T.W.; Darvishzadeh, R.; Skidmore, A.K.; Wang, T. Impact of Vertical Canopy Position on Leaf Spectral Properties and Traits across Multiple Species. Remote Sens. 2018, 10, 346. [Google Scholar] [CrossRef] [Scilit]
- Rahmati, A.; Zoej, M.J.V.; Dehkordi, A.T. Early identification of crop types using Sentinel-2 satellite images and an incremental multi-feature ensemble method (Case study: Shahriar, Iran). Adv. Space Res. 2022, 70, 907–922. [Google Scholar] [CrossRef] [Scilit]
- Tran, K.H.; Zhang, X.; Ketchpaw, A.R.; Wang, J.; Ye, Y.; Shen, Y. A novel algorithm for the generation of gap-free time series by fusing harmonized Landsat 8 and Sentinel-2 observations with PhenoCam time series for detecting land surface phenology. Remote Sens. Environ. 2022, 282, 113275. [Google Scholar] [CrossRef] [Scilit]
- Ouzemou, J.; Harti, A.E.; Lhissou, R.; Moujahid, A.E.; Bouch, N.; Ouazzani, R.E.; Bachaoui, E.M.; Ghmari, A.E. Crop type mapping from pansharpened Landsat 8 NDVI data: A case of a highly fragmented and intensive agricultural system. Remote Sens. Appl. Soc. Environ. 2018, 11, 94–103. [Google Scholar] [CrossRef] [Scilit]
- Frazier, A.E.; Hemingway, B.L. A technical review of planet smallsat data: Practical considerations for processing and using PlanetScope imagery. Remote Sens. 2021, 13, 3930. [Google Scholar] [CrossRef] [Scilit]
- Drusch, M.; Bello, U.D.; Carlier, S.; Colin, O.; Fernandez, V.; Gascon, F.; Hoersch, B.; Isola, C.; Laberinti, P.; Martimort, P.; et al. Sentinel-2: ESA’s optical High-Resolution mission for GMES operational services. Remote Sens. Environ. 2012, 120, 25–36. [Google Scholar] [CrossRef] [Scilit]
- Zhen, Z.; Quackenbush, L.J.; Stehman, S.V.; Zhang, L. Impact of training and validation sample selection on classification accuracy and accuracy assessment when using reference polygons in object-based classification. Int. J. Remote Sens. 2013, 34, 6914–6930. [Google Scholar] [CrossRef] [Scilit]
- Karasiak, N.; Dejoux, J.F.; Monteil, C.; Sheeren, D. Spatial dependence between training and test sets: Another pitfall of classification accuracy assessment in remote sensing. Mach. Learn. 2022, 111, 2715–2740. [Google Scholar] [CrossRef] [Scilit]
- Li, C.; Teng, X.; Tan, Y.; Zhang, Y.; Zhang, H.; Xiao, D.; Luo, S. Spatio-temporal mapping of leaf area index in rice: Spectral indices and multi-scale texture comparison derived from different sensors. Front. Plant Sci. 2024, 15. [Google Scholar] [CrossRef] [Scilit]
- Boiarskii, B. Comparison of NDVI and NDRE indices to detect differences in vegetation and chlorophyll content. J. Mech. Contin. Math. Sci. 2019, 4, 20–29. [Google Scholar] [CrossRef] [Scilit]
- Dash, J.; Curran, P.J. Evaluation of the MERIS terrestrial chlorophyll index (MTCI). Adv. Space Res. 2007, 39, 100–104. [Google Scholar] [CrossRef] [Scilit]
- Matsushita, B.; Yang, W.; Chen, J.; Onda, Y.; Qiu, G. Sensitivity of the enhanced vegetation index (EVI) and normalized difference vegetation index (NDVI) to topographic effects: A case study in high-density cypress forest. Sensors 2007, 7, 2636–2651. [Google Scholar] [CrossRef] [Scilit]
- Haralick, R.M.; Shanmugam, K.; Dinstein, I. Textural features for image classification. Stud. Media Commun. 1973, SMC-3, 610–621. [Google Scholar] [CrossRef] [Scilit]
- Kanan, C.; Cottrell, G.W. Color-to-grayscale: Does the method matter in image recognition? PLoS ONE 2012, 7, e29740. [Google Scholar] [CrossRef] [Scilit]
- Khatami, R.; Mountrakis, G.; Stehman, S.V. A meta-analysis of remote sensing research on supervised pixel-based land-cover image classification processes: General guidelines for practitioners and future research. Remote Sens. Environ. 2016, 177, 89–100. [Google Scholar] [CrossRef] [Scilit]
- García, M.A.; Puig, D. Supervised texture classification by integration of multiple texture methods and evaluation windows. Image Vis. Comput. 2007, 25, 1091–1106. [Google Scholar] [CrossRef] [Scilit]
- Hall-Beyer, M. Practical guidelines for choosing GLCM textures to use in landscape classification tasks over a range of moderate spatial scales. Int. J. Remote Sens. 2017, 38, 1312–1338. [Google Scholar] [CrossRef] [Scilit]
- Mohammadpour, P.; Viegas, D.X.; Viegas, C. Vegetation mapping with random forest using sentinel 2 and GLCM texture feature—A case study for lousã region, portugal. Remote Sens. 2022, 14, 4585. [Google Scholar] [CrossRef] [Scilit]
- Montero, D.; Aybar, C.; Mahecha, M.D.; Martinuzzi, F.; Söchting, M.; Wieneke, S. A standardized catalogue of spectral indices to advance the use of remote sensing in Earth system research. Sci. Data 2023, 10, 197. [Google Scholar] [CrossRef] [Scilit] [PubMed]
- Andreatta, D.; Gianelle, D.; Scotton, M.; Dalponte, M. Estimating grassland vegetation cover with remote sensing: A comparison between Landsat-8, Sentinel-2 and PlanetScope imagery. Ecol. Indic. 2022, 141, 109102. [Google Scholar] [CrossRef] [Scilit]
- Wei, Y.; Lu, M.; Yu, Q.; Li, W.; Wang, C.; Tang, H.; Wu, W. The normalized difference yellow vegetation index (NDYVI): A new index for crop identification by using GaoFen-6 WFV data. Comput. Electron. Agric. 2024, 226, 109417. [Google Scholar] [CrossRef] [Scilit]
- Gitelson, A.A.; Viña, A.; Ciganda, V.; Rundquist, D.C.; Arkebauer, T.J. Remote estimation of canopy chlorophyll content in crops. Geophys. Res. Lett. 2005, 32, L8403. [Google Scholar] [CrossRef] [Scilit]
- Arik, S.Ö.; Pfister, T. TabNet: Attentive interpretable tabular learning. Proc. AAAI Conf. Artif. Intell. 2021, 35, 6679–6687. [Google Scholar] [CrossRef] [Scilit]
- Rodriguez-Galiano, V.F.; Ghimire, B.; Rogan, J.; Chica-Olmo, M.; Rigol-Sanchez, J.P. An assessment of the effectiveness of a random forest classifier for land-cover classification. ISPRS J. Photogramm. Remote Sens. 2012, 67, 93–104. [Google Scholar] [CrossRef] [Scilit]
- Ke, G.; Meng, Q.; Finley, T.; Wang, T.; Chen, W.; Ma, W.; Ye, Q.; Liu, T. LightGBM: A Highly Efficient Gradient Boosting Decision Tree. In Proceedings of the NIPS’17: Proceedings of the 31st International Conference on Neural Information Processing Systems, Long Beach, CA, USA, 4–9 December 2017; pp. 3149–3157. [Google Scholar]
- Akiba, T.; Sano, S.; Yanase, T.; Ohta, T.; Koyama, M. Optuna: A next-generation hyperparameter optimization framework. In Proceedings of the KDD’19: The 25th ACM SIGKDD Conference on Knowledge Discovery and Data Mining, Anchorage, AK, USA, 4–8 August 2019; pp. 2623–2631. [Google Scholar]
- Lundberg, S.M.; Lee, S. A unified approach to interpreting model predictions. In Proceedings of the NIPS’17: Proceedings of the 31st International Conference on Neural Information Processing Systems, Long Beach, CA, USA, 4–9 December 2017; pp. 4768–4777. [Google Scholar]
- Chen, H.; Lundberg, S.M.; Lee, S. Explaining a series of models by propagating Shapley values. Nat. Commun. 2022, 13, 4512. [Google Scholar] [CrossRef] [Scilit]
- Ghalebikesabi, S.; Ter-Minassian, L.; Diazordaz, K.; Holmes, C.C. On locality of local explanation models. In NIPS ‘21; Curran Associates, Inc.: Red Hook, NY, USA, 2021; p. 13. [Google Scholar]
- Yoshida, A.; Ohmori, Y.; Kitano, H.; Taguchi-Shiobara, F.; Hirano, H. Aberrant spikelet and panicle1, encoding a TOPLESS-related transcriptional co-repressor, is involved in the regulation of meristem fate in rice. Plant J. 2012, 70, 327–339. [Google Scholar] [CrossRef] [Scilit]
- Zhang, H.; Wang, L.; Jin, X.; Bian, L.; Ge, Y. High-throughput phenotyping of plant leaf morphological, physiological, and biochemical traits on multiple scales using optical sensing. Crop J. 2023, 11, 1303–1318. [Google Scholar] [CrossRef] [Scilit]
- Yin, M.; Liu, S.; Zheng, X.; Chu, G.; Xu, C.; Zhang, X.; Wang, D.; Chen, S. Solar radiation-use characteristics of indica/japonica hybrid rice (Oryza sativa L.) in the late season in southeast China. Crop J. 2021, 9, 427–439. [Google Scholar] [CrossRef] [Scilit]
- Manohar Kumar, C.V.S.S.; Jha, S.S.; Nidamanuri, R.R.; Dadhwal, V.K. Precision crop mapping: Within plant canopy discrimination of crop and soil using multi-sensor hyperspectral imagery. Sci. Rep. 2024, 14, 24903. [Google Scholar] [CrossRef] [Scilit] [PubMed]
- Hallik, L.; Kuusk, A.; Lang, M.; Kuusk, J. Reflectance properties of hemiboreal mixed forest canopies with focus on red edge and near infrared spectral regions. Remote Sens. 2019, 11, 1717. [Google Scholar] [CrossRef] [Scilit]
- Zhou, N.; Sun, T.; Zhang, Y.; Shi, Q.; Zhou, Y.; Xiong, Q.; Hu, J.; Wang, S.; Zhu, J. Comparative analysis of yield and Grain-Filling characteristics of conventional rice with different panicle types in response to nitrogen fertilization. Agronomy 2025, 15, 1858. [Google Scholar] [CrossRef] [Scilit]
- Pinheiro, H.S.K.; Barbosa, T.P.R.; Antunes, M.A.H.; Carvalho, D.C.D.; Nummer, A.R.; Carvalho Junior, W.D.; Chagas, C.D.S.; Fernandes-Filho, E.I.; Pereira, M.G. Assessment of phytoecological variability by Red-Edge spectral indices and Soil-Landscape relationships. Remote Sens. 2019, 11, 2448. [Google Scholar] [CrossRef] [Scilit]
- Wang, B.; Jia, K.; Liang, S.; Xie, X.; We, X.; Zhao, X.; Yao, Y.; Zhang, X. Assessment of Sentinel-2 MSI Spectral Band Reflectances for Estimating Fractional Vegetation Cover. Remote Sens. 2018, 10, 1927. [Google Scholar] [CrossRef] [Scilit]
- Chen, K. High-resolution winter cover crop mapping with PlanetScope imagery: Comparative analysis of Random Forest, Convolutional Neural Network, and unsupervised classification. Sci. Remote Sens. 2026, 13, 100351. [Google Scholar] [CrossRef] [Scilit]
- Gurgel, H.C.; Author, N.J.F.C. Annual and interannual variability of NDVI in Brazil and its connections with climate. Int. J. Remote Sens. 2003, 24, 3595–3609. [Google Scholar] [CrossRef] [Scilit]
- Garcia, M.; Ustin, S.L. Detection of interannual vegetation responses to climatic variability using AVIRIS data in a coastal savanna in California. IEEE Trans. Geosci. Remote Sens. 2001, 39, 1480–1490. [Google Scholar] [CrossRef]
- Mutanga, O.; Skidmore, A.K. Red edge shift and biochemical content in grass canopies. ISPRS J. Photogramm. Remote Sens. 2007, 62, 34–42. [Google Scholar] [CrossRef] [Scilit]




| Data Type | Spectral Band | Spatial Resolution |
|---|---|---|
| PlanetScope | Band1: Coastal Blue (431–452 nm) | 3 m |
| Band2: Blue (465–515 nm) | ||
| Band3: Green1 (513–549 nm) | ||
| Band4: Green (547–583 nm) | ||
| Band5: Yellow (600–620 nm) | ||
| Band6: Red (650–680 nm) | ||
| Band7: Red-Edge (697–713 nm) | ||
| Band8: Near infrared (NIR) (845–885 nm) | ||
| Sentinel-2 | Band1: Coastal Blue (433–453 nm) | 60 m |
| Band2: Blue (458–523 nm) | 10 m | |
| Band3: Green (543–578 nm) | ||
| Band4: Red (650–680 nm) | ||
| Band5: Red-Edge1 (698–713 nm) | 20 m | |
| Band6: Red-Edge2 (733–748 nm) | ||
| Band7: Red-Edge3 (773–793 nm) | ||
| Band8: Near infrared (NIR) (785–900 nm) | 10 m | |
| Band9: Near infrared narrow (NIRn) (855–875 nm) | 20 m | |
| Band10: Water vapor (935–955 nm) | 60 m | |
| Band11: Shortwave infrared1(SWIR1) (1565–1655 nm) | 20 m | |
| Band12: Shortwave infrared2(SWIR2) (2100–2280 nm) |
| Scheme Type | Sensor | Phenological Stage | Baseline Features | Red-Edge Features | Design Objective |
|---|---|---|---|---|---|
| Scheme 1 | Sentinel-2 | Tillering–Jointing | √ | × | Baseline (S2-T1) |
| Scheme 2 | Tillering–Jointing | √ | √ | RE impact in S2-T1 | |
| Scheme 3 | Heading–Flowering | √ | × | Baseline (S2-T2) | |
| Scheme 4 | Heading–Flowering | √ | √ | RE impact in S2-T2 | |
| Scheme 5 | PlanetScope | Tillering–Jointing | √ | × | Baseline (PS-T1) |
| Scheme 6 | Tillering–Jointing | √ | √ | RE impact in PS-T1 | |
| Scheme 7 | Heading–Flowering | √ | × | Baseline (PS-T2) | |
| Scheme 8 | Heading–Flowering | √ | √ | RE impact in PS-T2 |
| Scheme Type | Classification Model | |||||
|---|---|---|---|---|---|---|
| RF | LightGBM | TabNet | ||||
| OA (%)/Kappa Coefficient | Japonica F1-Scores (%)/ Indica F1-Scores (%) | OA (%)/Kappa Coefficient | Japonica F1-Scores (%)/ Indica F1-Scores (%) | OA (%)/Kappa Coefficient | Japonica F1-Scores (%)/ Indica F1-Scores (%) | |
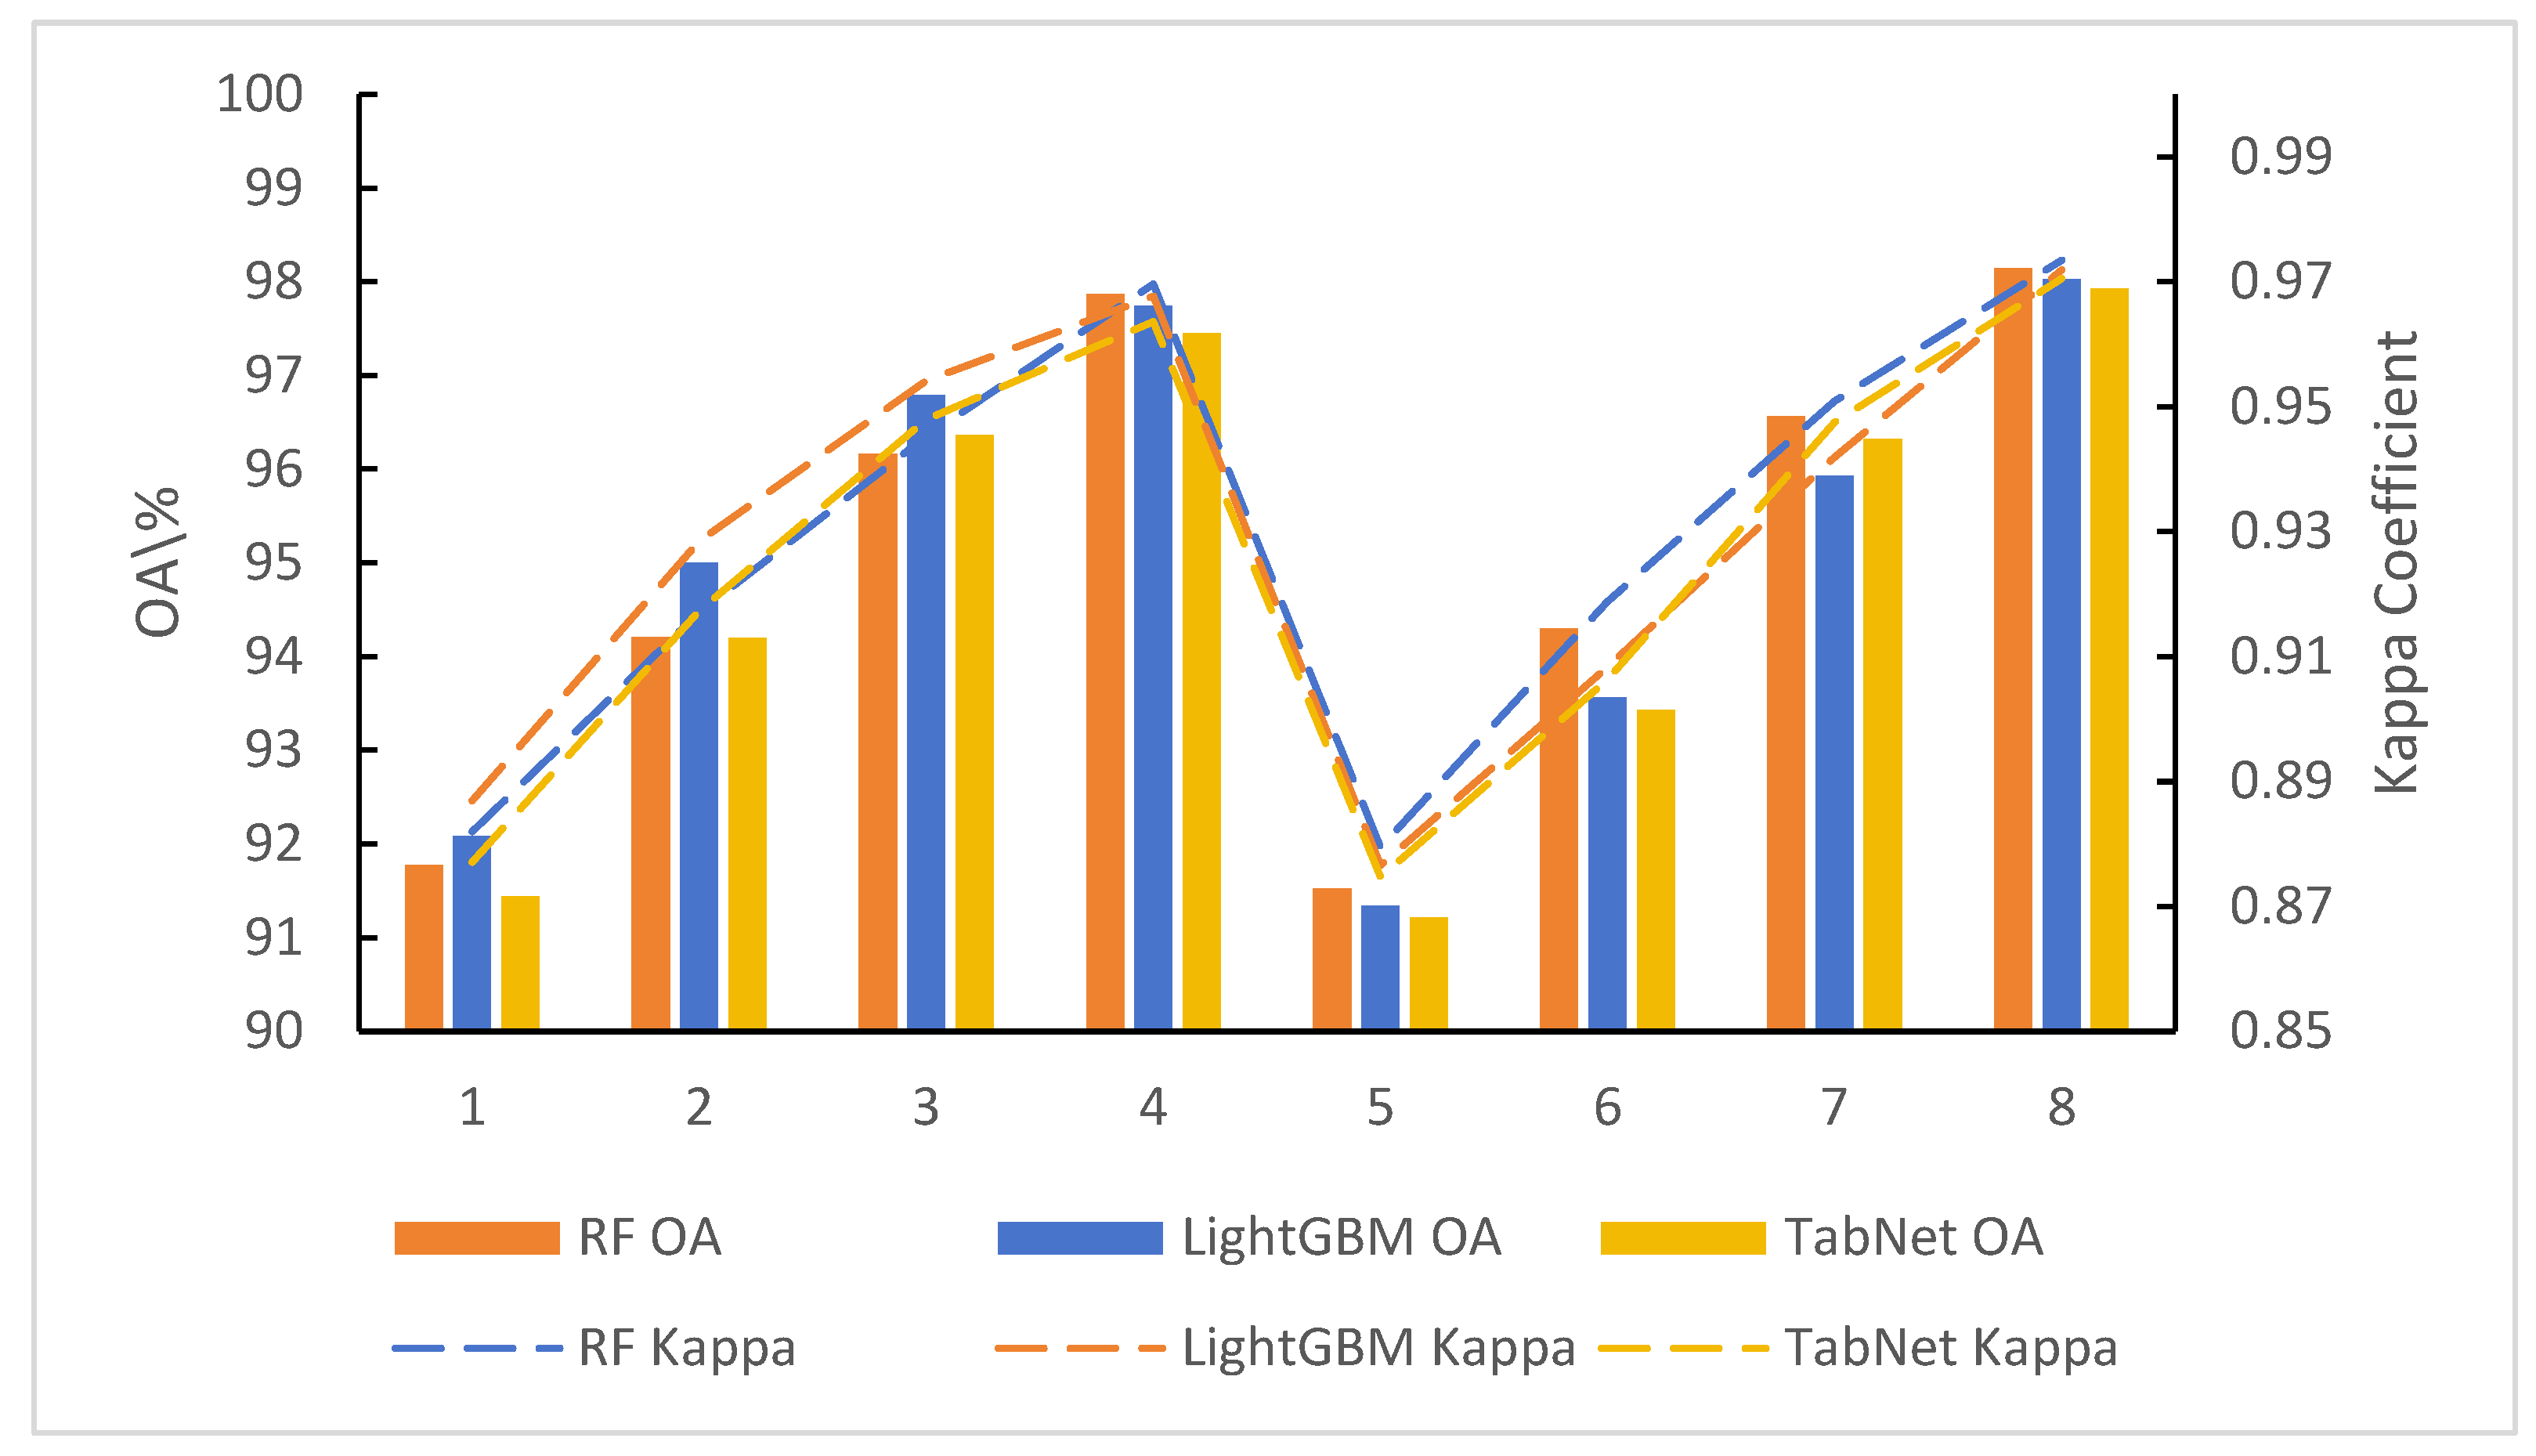
| Scheme 1 | 91.77/0.8820 | 90.23/91.33 | 92.08/0.8869 | 90.73/91.84 | 91.44/0.8771 | 90.33/91.86 |
| Scheme 2 | 94.21/0.9171 | 93.35/94.28 | 95.00/0.9285 | 94.36/94.91 | 94.20/0.9173 | 94.31/94.87 |
| Scheme 3 | 96.16/0.9452 | 96.86/97.21 | 96.79/0.9541 | 97.31/97.73 | 96.36/0.9479 | 97.17/97.53 |
| Scheme 4 | 97.87/0.9696 | 98.62/98.68 | 97.74/0.9677 | 98.31/98.60 | 97.45/0.9636 | 97.79/98.18 |
| Scheme 5 | 91.52/0.8795 | 88.90/91.20 | 91.34/0.8766 | 88.92/90.62 | 91.21/0.8747 | 89.01/90.99 |
| Scheme 6 | 94.30/0.9188 | 92.70/94.17 | 93.56/0.9083 | 91.64/93.06 | 93.43/0.9063 | 92.12/93.68 |
| Scheme 7 | 96.56/0.9509 | 95.44/95.85 | 95.93/0.9419 | 94.73/95.10 | 96.32/0.9475 | 95.46/95.81 |
| Scheme 8 | 98.14/0.9735 | 97.67/98.41 | 98.03/0.9719 | 97.44/98.11 | 97.93/0.9705 | 97.72/97.85 |
| Scheme ID | Sensor | Phenological Stage | Red-Edge Configuration |
|---|---|---|---|
| Scheme 3 | Sentinel-2 | Heading–Flowering | × |
| Scheme 4 | √ | ||
| Scheme 7 | PlanetScope | × | |
| Scheme 8 | √ |
| Comparison Dimension | Representative Studies | Previous Research Key Conclusions | The Results of This Study Demonstrate | Contribution |
|---|---|---|---|---|
| Red-Edge Efficacy | Kang et al. [7], Otunga et al. [12] | Red-edge bands are highly sensitive to vegetation physiology, significantly improving crop classification accuracy. | The introduction of red-edge features increased the F1-score around 1–4% across all schemes. | Confirmed the robust and stable accuracy gains of red-edge information specifically in intra-species cultivar discrimination. |
| Variety Discrimination Accuracy | Islam et al. [4] | Cultivar-level discrimination is highly challenging; conventional accuracies typically plateau between 90% and 95%. | The optimal scheme achieved an overall accuracy of 98.14%. | Broke through existing accuracy bottlenecks for rice variety mapping by synergizing optimal phenology and spectral features. |
| Sensor Comparison (PS vs. S2) | Frazier & Hemingway [18], Andreatta et al. [32] | PS possesses a strong spatial advantage in fragmented landscapes, whereas S2 offers richer spectral dimensions. | PS’s single red-edge scheme performed comparably to S2’s multi-red-edge scheme, with superior boundary delineation. | Revealed that high spatial resolution can effectively compensate for lower spectral dimensionality, indicating potential spectral redundancy in multi-red-edge configurations. |
| Phenological Sensitivity | Rahmati et al. [15] | Crop identification accuracy is significantly higher in mid-to-late growth stages compared to early stages. | Accuracies at the heading–flowering stage were consistently higher than at the tillering–jointing stage across all sensors. | Established the heading–flowering stage as the optimal window for Indica and Japonica rice discrimination. |
Disclaimer/Publisher’s Note: The statements, opinions and data contained in all publications are solely those of the individual author(s) and contributor(s) and not of MDPI and/or the editor(s). MDPI and/or the editor(s) disclaim responsibility for any injury to people or property resulting from any ideas, methods, instructions or products referred to in the content. |
© 2026 by the authors. Licensee MDPI, Basel, Switzerland. This article is an open access article distributed under the terms and conditions of the Creative Commons Attribution (CC BY) license.
Share and Cite
Wang, Y.; Zhan, Y.; Song, K.; Li, Y.; Xu, Z.; Mu, H.; Xu, Y.; Cui, Y.; Hang, L. A Comparative Study on Rice Diversity Mapping with PlanetScope and Sentinel-2 Red Edge Bands Based on Key Phenological Characteristics. AgriEngineering 2026, 8, 187. https://doi.org/10.3390/agriengineering8050187
Wang Y, Zhan Y, Song K, Li Y, Xu Z, Mu H, Xu Y, Cui Y, Hang L. A Comparative Study on Rice Diversity Mapping with PlanetScope and Sentinel-2 Red Edge Bands Based on Key Phenological Characteristics. AgriEngineering. 2026; 8(5):187. https://doi.org/10.3390/agriengineering8050187
Chicago/Turabian StyleWang, Yujun, Yating Zhan, Ke Song, Yin Li, Ziqiao Xu, Hui Mu, Yingshi Xu, Yanmei Cui, and Liang Hang. 2026. "A Comparative Study on Rice Diversity Mapping with PlanetScope and Sentinel-2 Red Edge Bands Based on Key Phenological Characteristics" AgriEngineering 8, no. 5: 187. https://doi.org/10.3390/agriengineering8050187
APA StyleWang, Y., Zhan, Y., Song, K., Li, Y., Xu, Z., Mu, H., Xu, Y., Cui, Y., & Hang, L. (2026). A Comparative Study on Rice Diversity Mapping with PlanetScope and Sentinel-2 Red Edge Bands Based on Key Phenological Characteristics. AgriEngineering, 8(5), 187. https://doi.org/10.3390/agriengineering8050187