1. Introduction
Foliar micronutrient supplementation in soybean (
Glycine max) is increasingly performed in combination with agrochemicals. Rather than being applied in isolation, these nutrients are commonly integrated into complex tank mixtures with phytosanitary products and surfactants to optimize field operations [
1]. Nevertheless, these multi-component spray solutions are highly susceptible to atmospheric drift, which may lead to off-target losses and reduced nutrient delivery to the canopy [
2,
3]. The precise synergy between specific adjuvant chemical classes and reduced application volumes required to maximize the foliar uptake of low-mobility nutrients, such as boron (B), remains poorly understood and unoptimized for large-scale production.
Therefore, ensuring that micronutrients and pesticides reach their intended site of action requires a precise arrangement of application technology. Factors including the spray application rate (SAR) and the use of specialized adjuvants are critical for governing droplet–target interactions, allowing for the adjustment of the droplet spectrum to enhance deposition uniformity across the crop canopy under varying environmental conditions [
4].
Such technical refinements in foliar delivery are imperative given that the bioavailability of boron in the oxisols of the Brazilian Cerrado is frequently limited by low rates of organic matter mineralization and inherent pedological constraints [
5]. As a vital micronutrient for soybean crops, B is integral to a diverse array of metabolic functions, ranging from carbohydrate translocation and membrane integrity to the regulation of protein synthesis and nitrate metabolism [
6,
7]. Furthermore, the critical role of boron in reproductive ontogeny, particularly in pollen viability and fertilization, provides a physiological basis for understanding why efficient canopy deposition of this micronutrient is essential to maintain yield stability in these environments [
8,
9].
While reducing the SAR significantly enhances operational capacity and logistical efficiency, implementing such reductions without a robust technical foundation risks suboptimal target coverage and increased production costs due to the potential necessity of repeated applications [
10]. Despite the critical importance of precise foliar delivery, a comprehensive framework for optimizing the synergy between SAR, specific adjuvant mechanisms, and real-time plant physiological status remains largely underdeveloped. Specifically, the threshold at which reduced SAR compromises boron absorption regardless of adjuvant presence has not been established. This scientific gap is particularly evident regarding the efficient delivery of B in annual crops under Cerrado conditions [
11], and is not yet fully optimized for the specific conditions of high-density canopies.
Recent investigations emphasize that as canopy density increases, as typically characterized by higher vegetation index (VI) values, the SAR must be proportionally adjusted to sustain effective droplet penetration and deposition throughout the middle and lower canopy layers [
12]. Spectral sensors facilitate the indirect assessment of plant leaf surfaces and physiological status, which leverages the selective absorption of radiation by chlorophyll in the visible spectrum and its intense reflection in the near-infrared region [
13]. Contemporary precision agriculture increasingly utilizes unmanned aerial vehicles (UAVs) equipped with multispectral sensors to acquire high-resolution imagery, enabling the calculation of the Normalized Difference Vegetation Index (NDVI) and other advanced indices for high-throughput phenotyping [
14].
By integrating spectral indices such as NDRE and TVDI as proxies for physiological status related to nutrient delivery, this study advances beyond static evaluation protocols toward assessing real-time physiological recovery. Consequently, this study aimed to investigate the interactive effects of different SARs and adjuvant types on B deposition and foliar uptake, while validating the potential of multispectral vegetation indices to optimize spray technology in soybean crops.
2. Materials and Methods
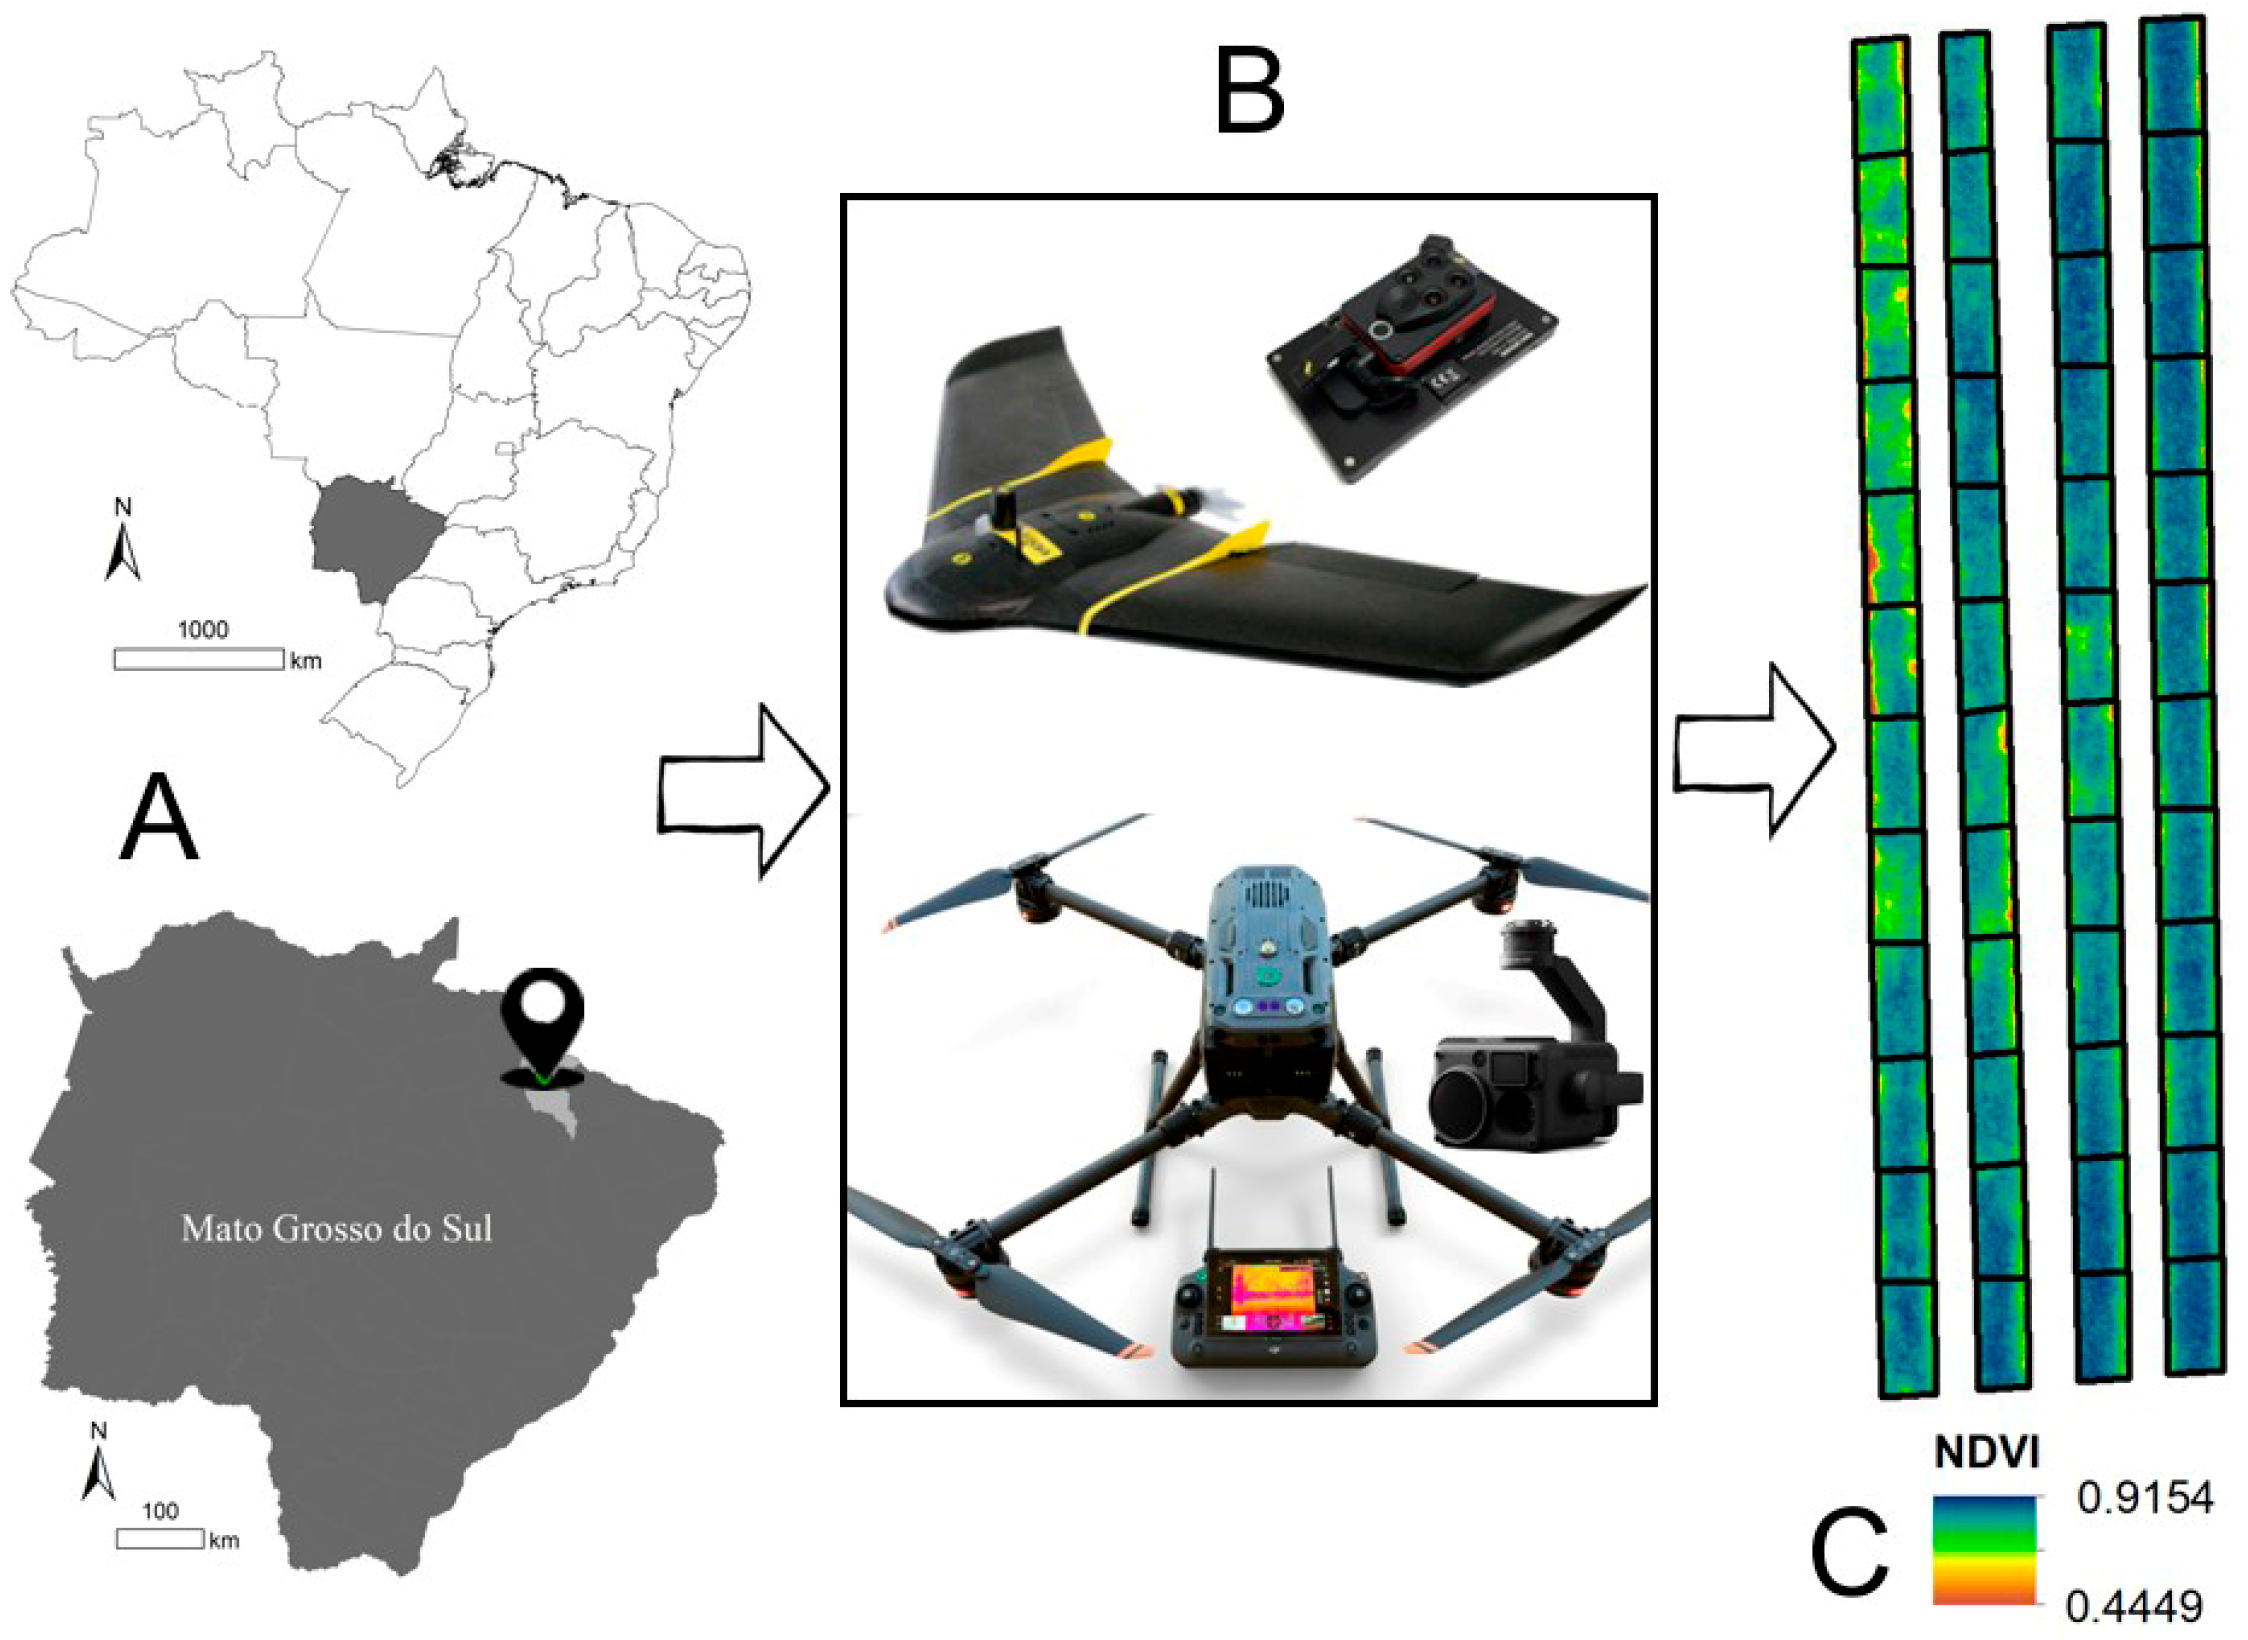
The experiment was carried out on the experimental field at the Federal University of Mato Grosso do Sul, Campus of Chapadão do Sul, Brazil (18°46′26″ S, 52°37′28″ W; altitude 810 m), during the 2022/2023 crop season (
Figure 1). The climate is classified as tropical savanna. The soil chemical analysis showed that pH (CaCl
2) = 5.57; organic matter = 21.89 g dm
−3;
p = 35.44 mg dm
−3; H + Al = 27.00 mmol
c dm
−3; K = 1.58 mmol
c dm
−3; Ca = 41.50 mmol
c dm
−3; Mg = 11.83 mmol
c dm
−3; S = 3.28 mg dm
−3; cation exchange capacity (CEC) = 81.91 mmol
c dm
−3; base saturation (V) = 65.56%; and the micronutrients B = 0.19 mg dm
−3, Cu = 1.23 mg dm
−3, Fe = 40.06 mg dm
−3, Mn = 2.22 mg dm
−3, and Zn = 3.03 mg dm
−3. The clay, sand, and silt proportions were 46, 46, and 8%, respectively. The soil in the experimental area is classified as a red dystrophic oxisol [
15]. For soybean cultivation in Cerrado soils, ideal boron levels range from 0.2 to 0.3 mg dm
−3; values below this range are considered low, which is adequate for an experiment on nutrition involving this micronutrient.
The soybean cultivar Brasmax Tanque i2X, developed and commercialized by Brasmax Genética (Londrina, Brazil), was used in the experiment. It is characterized by an indeterminate growth habit and a full maturity group with an average cycle of 120 days. Sowing was performed in mid-November 2022, using a row spacing of 0.50 m to achieve a target population of 220,000 plants ha
−1. A total of 15 kg ha
−1 N, 81 kg ha
−1 P
2O
5, and 90 kg ha
−1 K
2O were applied at sowing. Cultural practices were carried out as needed and following the recommendations for the region [
16].
The experiment was conducted using a randomized complete block design arranged in a factorial scheme, with four replications. The first factor consisted of the following adjuvant treatments: (i) a surfactant (SUR; organosilicone-based non-ionic surfactant, Figher®, De Sangosse, Ibiporã, Brazil), (ii) an oil (OIL; methylated seed oil-based penetrant, Tatic®, UPL, Campinas, Brazil), and (iii) water (WTR; used as the control). The second factor comprised four spray application rates (SAR): 40, 70, 100, and 130 L ha−1. The dosage of each adjuvant was determined based on the manufacturer’s label recommendations, maintained at a constant concentration relative to the spray solution (0.05% v/v). Foliar boron was applied as boric acid (H3BO3) at a rate of 500 g ha−1. Two spray applications were performed during the V6 and R1 growth stages of soybean, using a CO2 pressurized backpack sprayer (Herbicat, Catanduva, Brazil) calibrated for each target SAR.
The spray application rates were obtained by adjusting operating pressures, and forward speeds. For the 40 and 70 L ha−1 treatments, a TeeJet TT 11001 flat-fan nozzle (TeeJet Technologies, Wheaton, IL, USA) was used at a working pressure of 100 kPa, with forward speeds of 2.33 and 1.33 m s−1, respectively. The 100 and 130 L ha−1 spray application rates were achieved using a TeeJet TT 110015 nozzle (TeeJet Technologies, Wheaton, IL, USA) operating at 210 kPa and forward speeds of 1.67 and 1.28 m s−1, respectively. Under these operating conditions, the spray spectrum was characterized by a volume median diameter (VMD) of 279.3 µm for the lower spray application rate and 236.8 µm for the higher rates. Droplet size distribution was quantified using the SPAN index, which was 1.42 for the 40 and 70 L ha−1 treatments and 1.24 for the 100 and 130 L ha−1 treatments. The proportion of droplets smaller than 100 µm was 8.17% for the lower spray application rate and 3.32% for the higher spray application rate. Although different nozzle models and pressure combinations were used to achieve the target SARs, the resulting variation in VMD was considered minor and within a comparable range. The different SARs were obtained by synchronizing nozzle pressure and velocity models to reflect realistic application technology configurations used in large-scale soybean production. Although these adjustments led to small variations in VMD (from 236.8 to 279.3 µm), the droplet spectrum remained within a comparable range, and the changes were considered secondary to the magnitude of the changes in carrier volume.
The multispectral vegetation indices (VIs) were evaluated at the V6 and R1 phenological stages. UAV flights were synchronized with spray application evaluations to ensure temporal consistency in the physiological data. The multispectral sensor used was acquired with a horizontal field of view (HFOV) of 61.9°, a vertical field of view (VFOV) of 48.5°, and a diagonal field of view (DFOV) of 73.7°. The images were acquired at 09:00 a.m. (local time), with a clear sky free of clouds, at an altitude of 100 m (local altitude) and a spatial resolution of 0.10 m. The aerial survey was conducted using RTK (Real-Time Kinematics) technology, making it possible to estimate the camera’s position at the moment the image was captured with an accuracy of 2.5 cm. The field calibration of the Parrot Sequoia (Parrot SA, Paris, France) drone was performed using e-Motion software version 2.4.13, utilizing reflectance panel images for each spectral band, immediately before takeoff. Since the flight duration was less than 15 min, there was no need to repeat the calibration after landing. The flights were conducted with lateral and frontal overlap of the images at 80% and 85%, respectively, with perpendicular flight lines over the same study area, increasing the quantity and quality of subsequent processing steps. For each spectral band and vegetation index, the average of all pixels in the blocks/quadrants was calculated using the “Extract Point Values” tool in QGIS, version 3.40.9. To avoid the edge effect between the repeating blocks, an internal buffer of one meter was removed from each plot.
VI maps were acquired using a Sensefly eBee RTK fixed-wing UAV (SenseFly SA, Cheseaux-sur-Lausanne, Switzerland), equipped with autonomous flight control and a multispectral sensor. The calculated VIs included the Normalized Difference Vegetation Index (NDVI), the Normalized Difference Red Edge index (NDRE), and the Green Normalized Difference Vegetation Index (GNDVI). The vegetation indices were calculated using the average of the plot.
Image processing, including mosaicking and orthorectification, was performed using Pix4Dmapper (Pix4D, version 4.1.24). Radiometric correction was strictly implemented to convert raw pixel values into reflectance factors, utilizing both the sensor’s sunshine (irradiance) sensor and a calibrated reflectance target for field-specific atmospheric compensation. Additionally, the Temperature Vegetation Dryness Index (TVDI) was derived to assess the water status of the crop. These models were processed based on the high-resolution thermal data, which were acquired using a Zenmuse H20T camera (DJI, Shenzhen, China) integrated into a Matrice 300 RTK UAV platform (DJI, Shenzhen, China). The TVDI estimation followed the conceptual framework relating foliar surface temperature (FST) to vegetation indices, specifically the NDVI. The index was derived by defining the dry and wet edges of the FST/NDVI scatterplot, representing the limits of maximum and minimum water stress, respectively. This procedure allowed for the normalization of temperature variations relative to the vegetation cover, providing a sensitive indicator of crop water availability and evaporative cooling. The images were obtained under controlled flight conditions, with subsequent thermal isolation and processing to generate NDVI and surface temperature (ST) maps. Masking criteria were applied to remove invalid pixels, such as unwanted exposed pixels and noise, followed by quality control procedures to ensure data consistency. For the TVDI calculation, wet and dry edges were defined from the relationship between NDVI and FST, using the evaporative triangle. NDVI values were divided into intervals, and for each interval, the extreme FST values corresponding to 2% (wet limit) and 98% (dry limit) of the distribution were identified. The wet edge was determined by the average value of the pixels associated with the lower FST limit, while the dry edge was obtained by linear regression fitting with the pixels of the upper limit. These limits were used to normalize the model, allowing the TVDI to be estimated on a scale of 0 to 1, representing the water conditions along the vegetation canopy. The calculation and interpretation of the index were based on the methodology described by Schirmbeck et al. [
17].
The tracer dye tartrazine yellow FD&C-5 (tri-sodium salt 5-hydroxy-1-(4-sulfophenyl)-4-[(4-sulfophenyl)azo]-pyrazole-3-carboxylate) was added to the spray tank to assess spray deposition. Spectrophotometric quantification using tartrazine dye has been widely used as a tracer methodology for measuring spray deposition on plant surfaces, providing reliable estimates of deposited spray after extraction from leaf tissues [
18,
19]. To ensure a consistent amount of tracer was applied per hectare across all treatments, the dye concentrations were adjusted to 6200, 3542, 2480, and 1907 mg L
−1 corresponding to the spray application rates of 40, 70, 100, and 130 L ha
−1, respectively. Applications were conducted during the morning period to take advantage of favorable meteorological conditions, maintaining wind speeds under 10 km h
−1 and temperatures below 30 °C, in accordance with recommended agricultural standards for high-quality spraying. Environmental parameters, including air temperature and relative humidity, were recorded using an Instrutemp DT-250-N hygrometer (Instrutemp, São Paulo, Brazil), while an AD-250 anemometer (Instrutemp, São Paulo, Brazil) was used to monitor wind speed at 15 min intervals.
Leaf spray deposition was quantified using the mass balance method [
11]. The reference leaves were sampled after the spray application. Samples consisted of one leaf from each of three representative plants per plot, using disposable gloves to prevent cross-contamination. Considering that spray deposition on soybean plants can vary between different canopy strata [
19], the results should be interpreted as representative of the central region of the canopy under the evaluated conditions. The tracer was extracted from the leaf surfaces using 30 mL of a 1% detergent solution (distilled water and Tween 80). Absorbance was measured at 427 nm using an SP-22 spectrophotometer (Biospectro, Curitiba, Brazil), with final concentrations determined via a standardized calibration curve. To normalize the deposition results, leaf surface areas were measured using a CI-203 portable area meter (CID Bio-Science Inc., Camas, DC, USA), allowing for the expression of dye deposits relative to the specific leaf area. The different application rates were obtained through operational adjustments to the spraying system, which can result in changes in the droplet spectrum produced. Therefore, the treatments evaluated should be interpreted as different application technology configurations, in which the application volume is associated with the characteristics of the generated droplet spectrum. Thus, the observed effects may reflect the interaction between applied application rate, droplet size, and physical processes related to spray deposition, such as evaporation, drift, retention, and canopy penetration.
Separately, for the determination of foliar boron concentration, sampling was carried out 10 days after each application. This interval was adopted to allow sufficient time for the absorption and redistribution of the nutrient in the leaf tissues, making it possible to evaluate the effect of different combinations of adjuvants and SARs on the nutritional status of soybean plants. Thus, the analysis of foliar boron concentration predominantly reflects absorption and assimilation processes of the nutrient over time and is not intended to detect immediate differences in deposition immediately after application. Soybean yield was determined at physiological maturity by harvesting plants from a 2 m2 area located at the center of each experimental plot.
Data were subjected to a preliminary analysis to verify normality (Shapiro–Wilk test) and homogeneity of variances (Levene’s test). A two-way analysis of variance (ANOVA) was performed to evaluate the effects of adjuvant types, spray application rate, and their interactions on all measured variables. To provide a more comprehensive statistical assessment beyond probability values, the effect size (η2) and 95% confidence intervals (CIs) were calculated. To understand the complex relationships between deposition, nutritional status, and spectral response, multivariate statistical techniques were employed. Principal component analysis (PCA) and hierarchical cluster analysis (HCA) were performed using standardized data (Z-score) to reduce dimensionality and visualize treatment clustering based on overall similarity. Finally, 3D response surface methodology (RSM) was implemented to model and visualize the non-linear interactions between spray application rate and deposition on physiological performance. All statistical computations and graphical representations were executed using R software (version 4.5), utilizing the tidyverse, factoextra, pheatmap, and pls packages.
3. Results
The effects of adjuvant type, spray application rate, and their interaction on boron deposition, foliar uptake, and physiological responses of soybean were evaluated. Initial Shapiro–Wilk and Levene’s tests showed normality and homogeneity of variances, respectively, supporting the application of two-way ANOVA. Significant main effects and interactions were observed for several key parameters, as detailed in
Table 1. The spray application rate was the factor with the greatest direct impact. Highly significant differences were observed for spray deposition (
p < 0.0001), the Temperature Vegetation Dryness Index (TVDI), and leaf temperature. The significant interaction observed for yield (
p = 0.0228) and spray deposition (
p = 0.0226) technically justifies the use of response surface modeling (RSM), because the effect of one factor depends on the level of the other. It is therefore necessary to visualize the response surface to identify the optimum point (the ideal combination of adjuvant vs. SARs) that maximizes crop yield, due to increased boron assimilation. Although univariate analysis showed limited effects on individual variables, the multidimensional nature of the crop response required a systemic approach. Therefore, principal component analysis (PCA) and response surface methodology (RSM) were used to identify hidden interaction patterns.
Although univariate significance was not achieved for foliar boron, the main effects of spray application rate (SAR) and adjuvant type accounted for 12.6% (η2 = 0.126) and 10.2% (η2 = 0.102) of the total variance, respectively. For instance, the SUR treatments resulted in the highest numerical mean (89.45 ± 5.85 mg kg−1) compared to the OIL (81.54 ± 6.47 mg kg−1). Given the high residual variance typical of field micronutrient dynamics (η2 = 0.717) and the experimental design, the statistical power was limited to detect these subtle physiological shifts in tissue concentration as main effects, shifting the analytical focus toward system-level metrics like yield and spatial deposition.
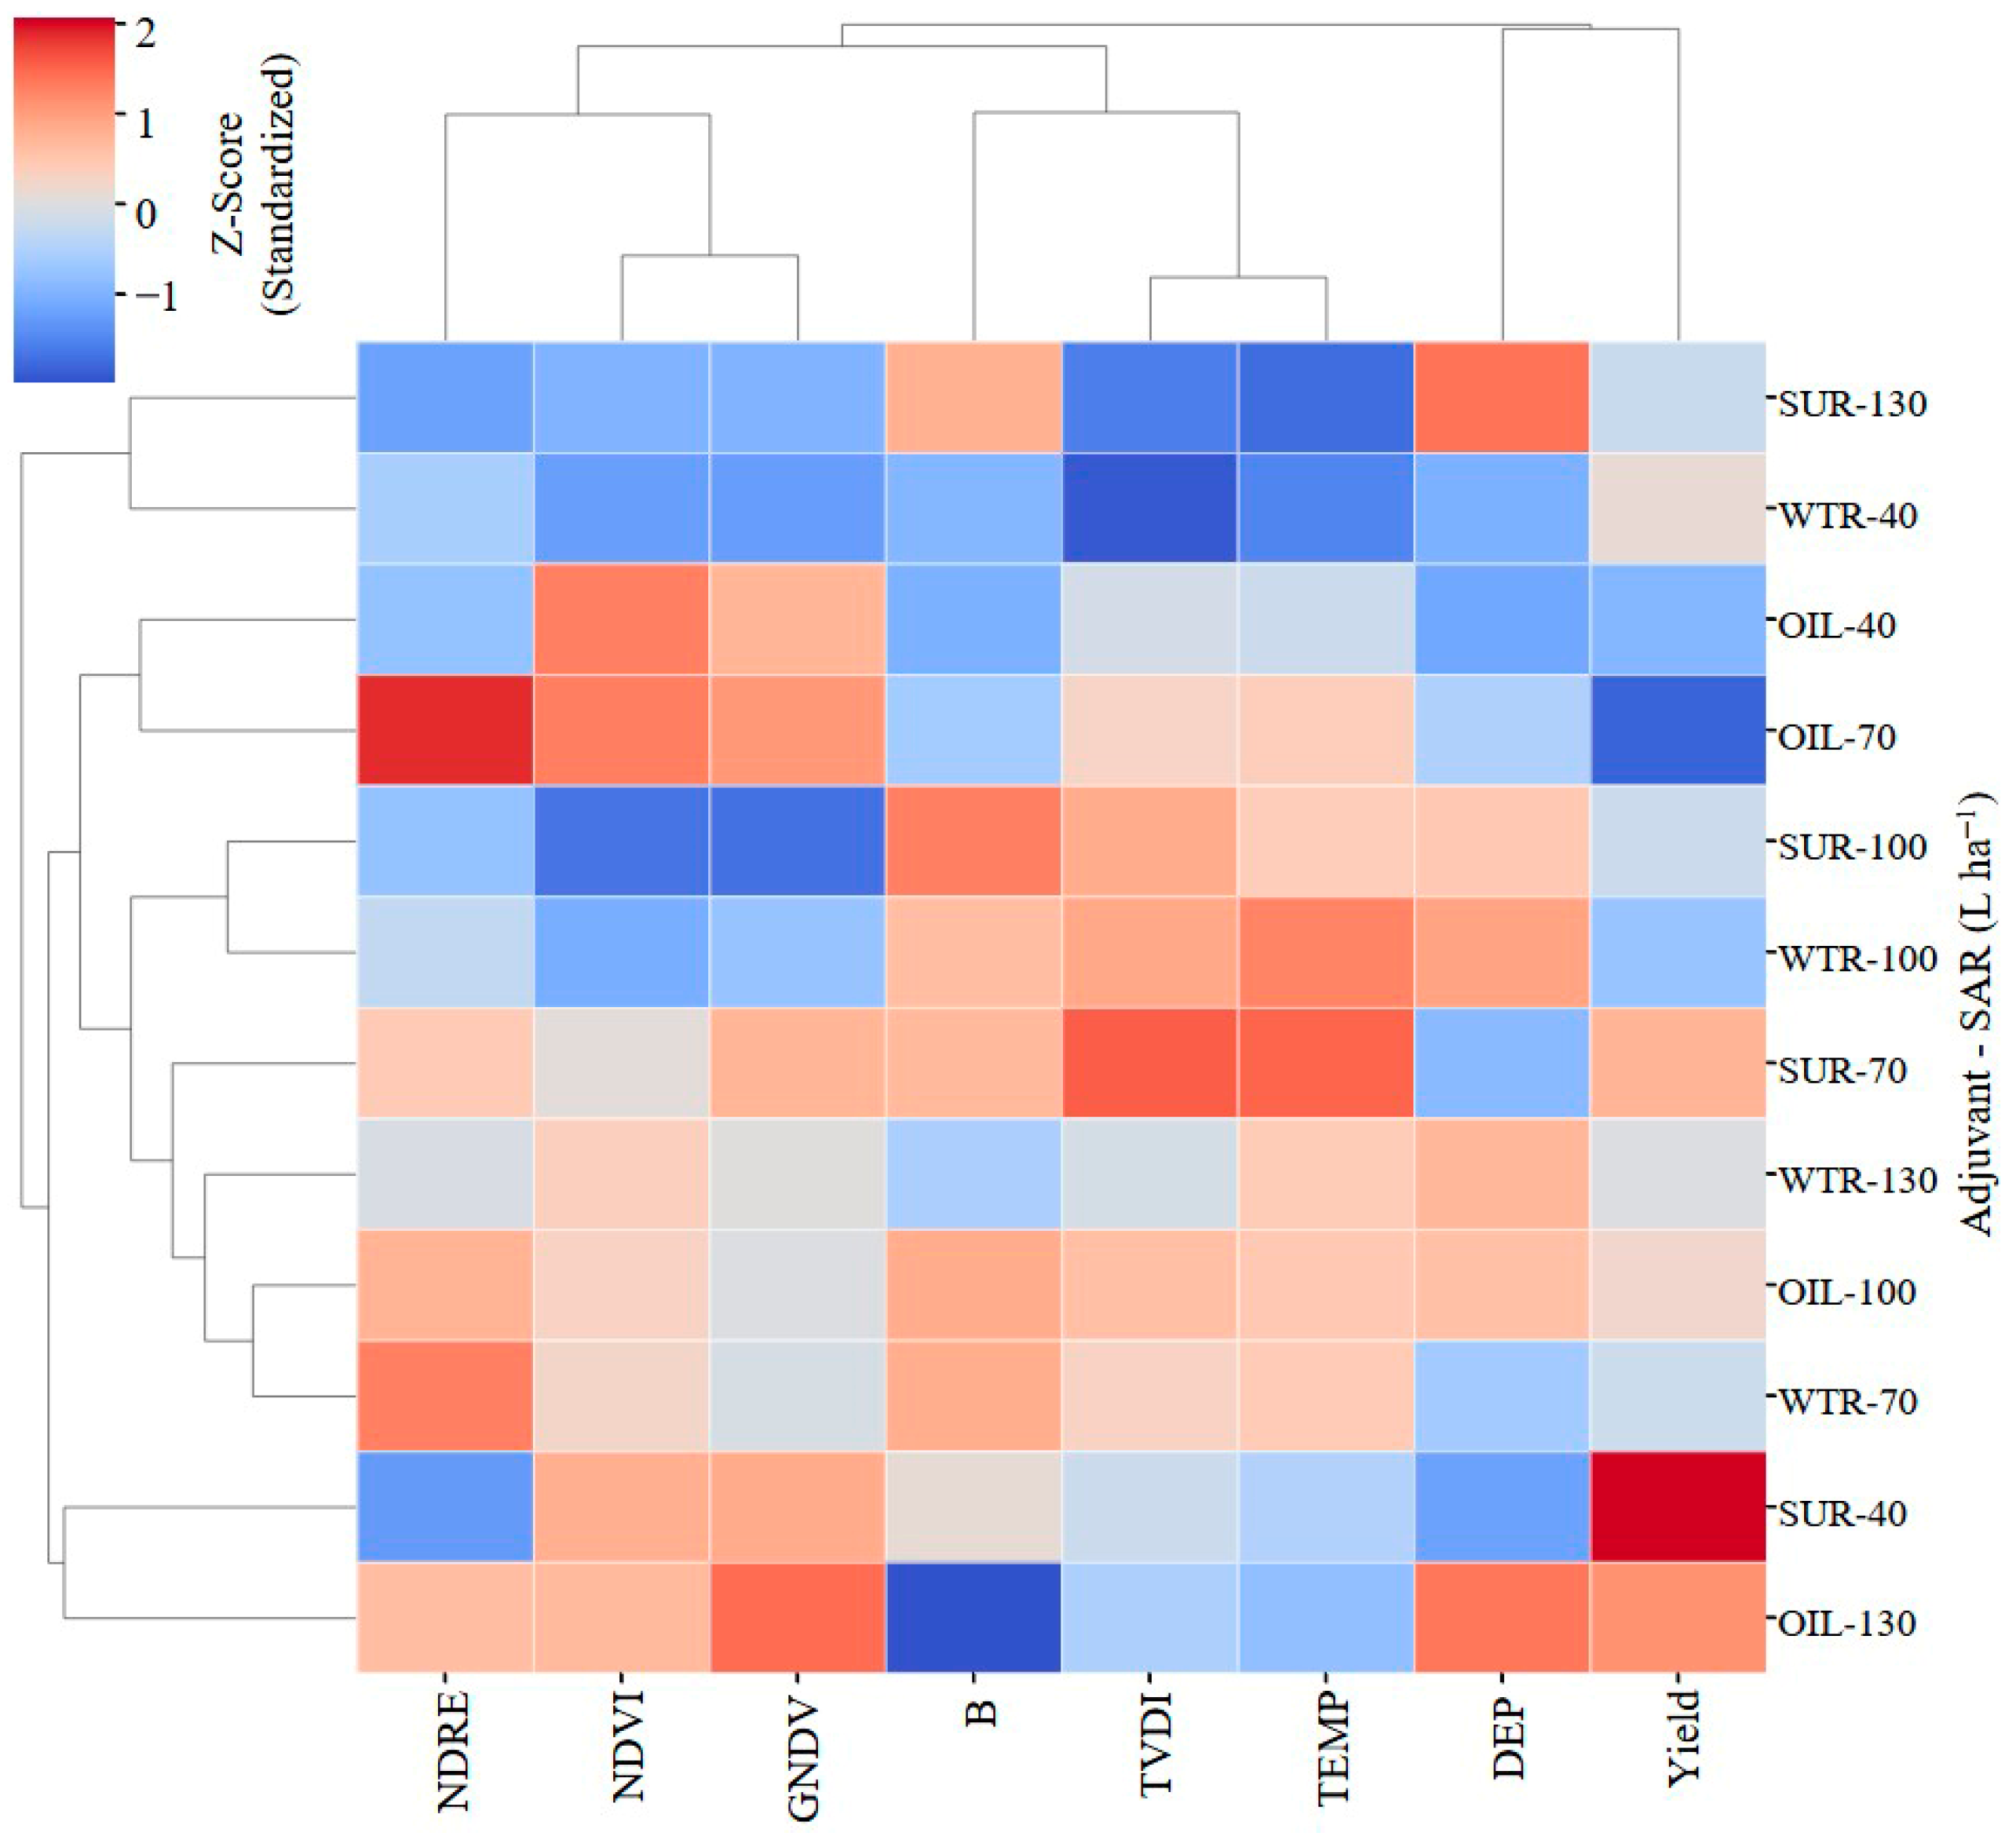
The multivariate heatmap (
Figure 2) reveals that the physiological variables define a distinct response pattern for oil-based (OIL) treatments, capturing biological patterns that traditional mean comparisons mask by disregarding the covariance between parameters. Regarding the adjuvant–SAR interaction, the hierarchical cluster analysis visually confirms that oil-based adjuvants maintain stable physiological and depositional profiles across different rates. In contrast, the surfactant (SUR) shows high volatility, with crop yield peaking at lower SARs (SUR at 40 L ha
−1) and declining significantly at higher rates. The identification of these specific performance peaks demonstrates that soybean productivity is governed by complex synergies between adjuvant uses and spray coverage. This allows for more sustainable management strategies focused on application efficiency and physicochemical compatibility rather than a simple escalation of SARs.
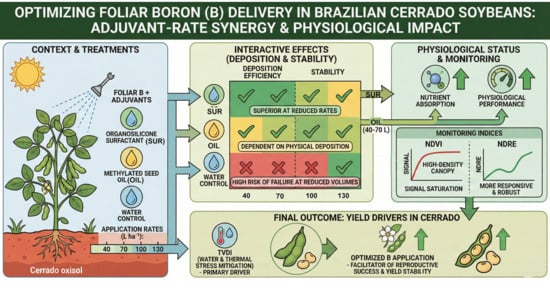
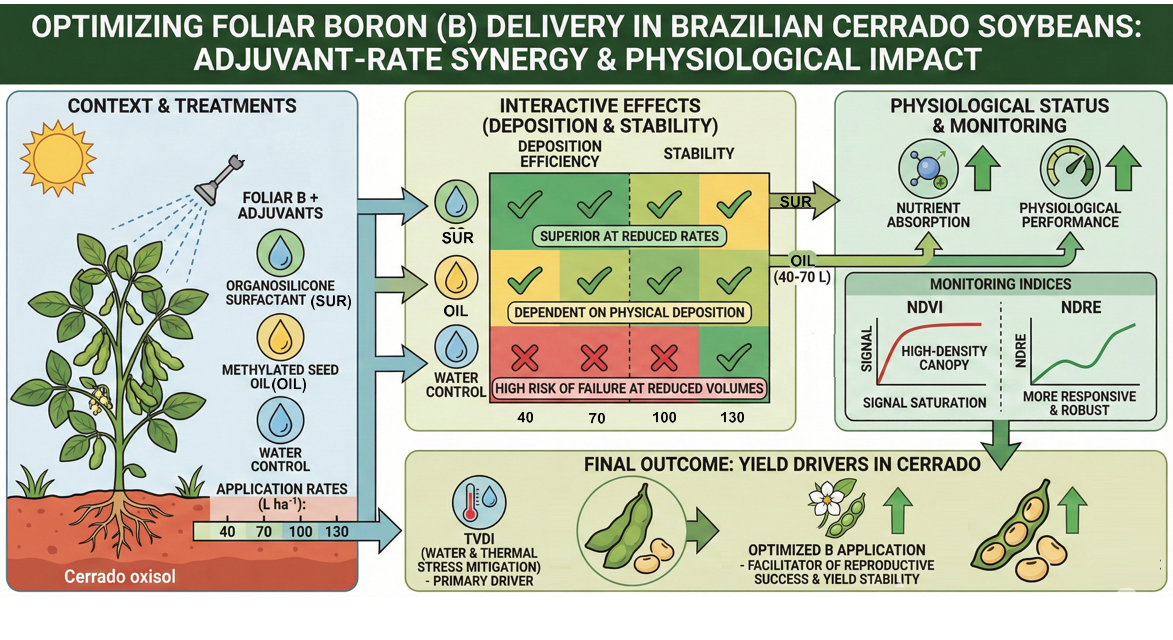
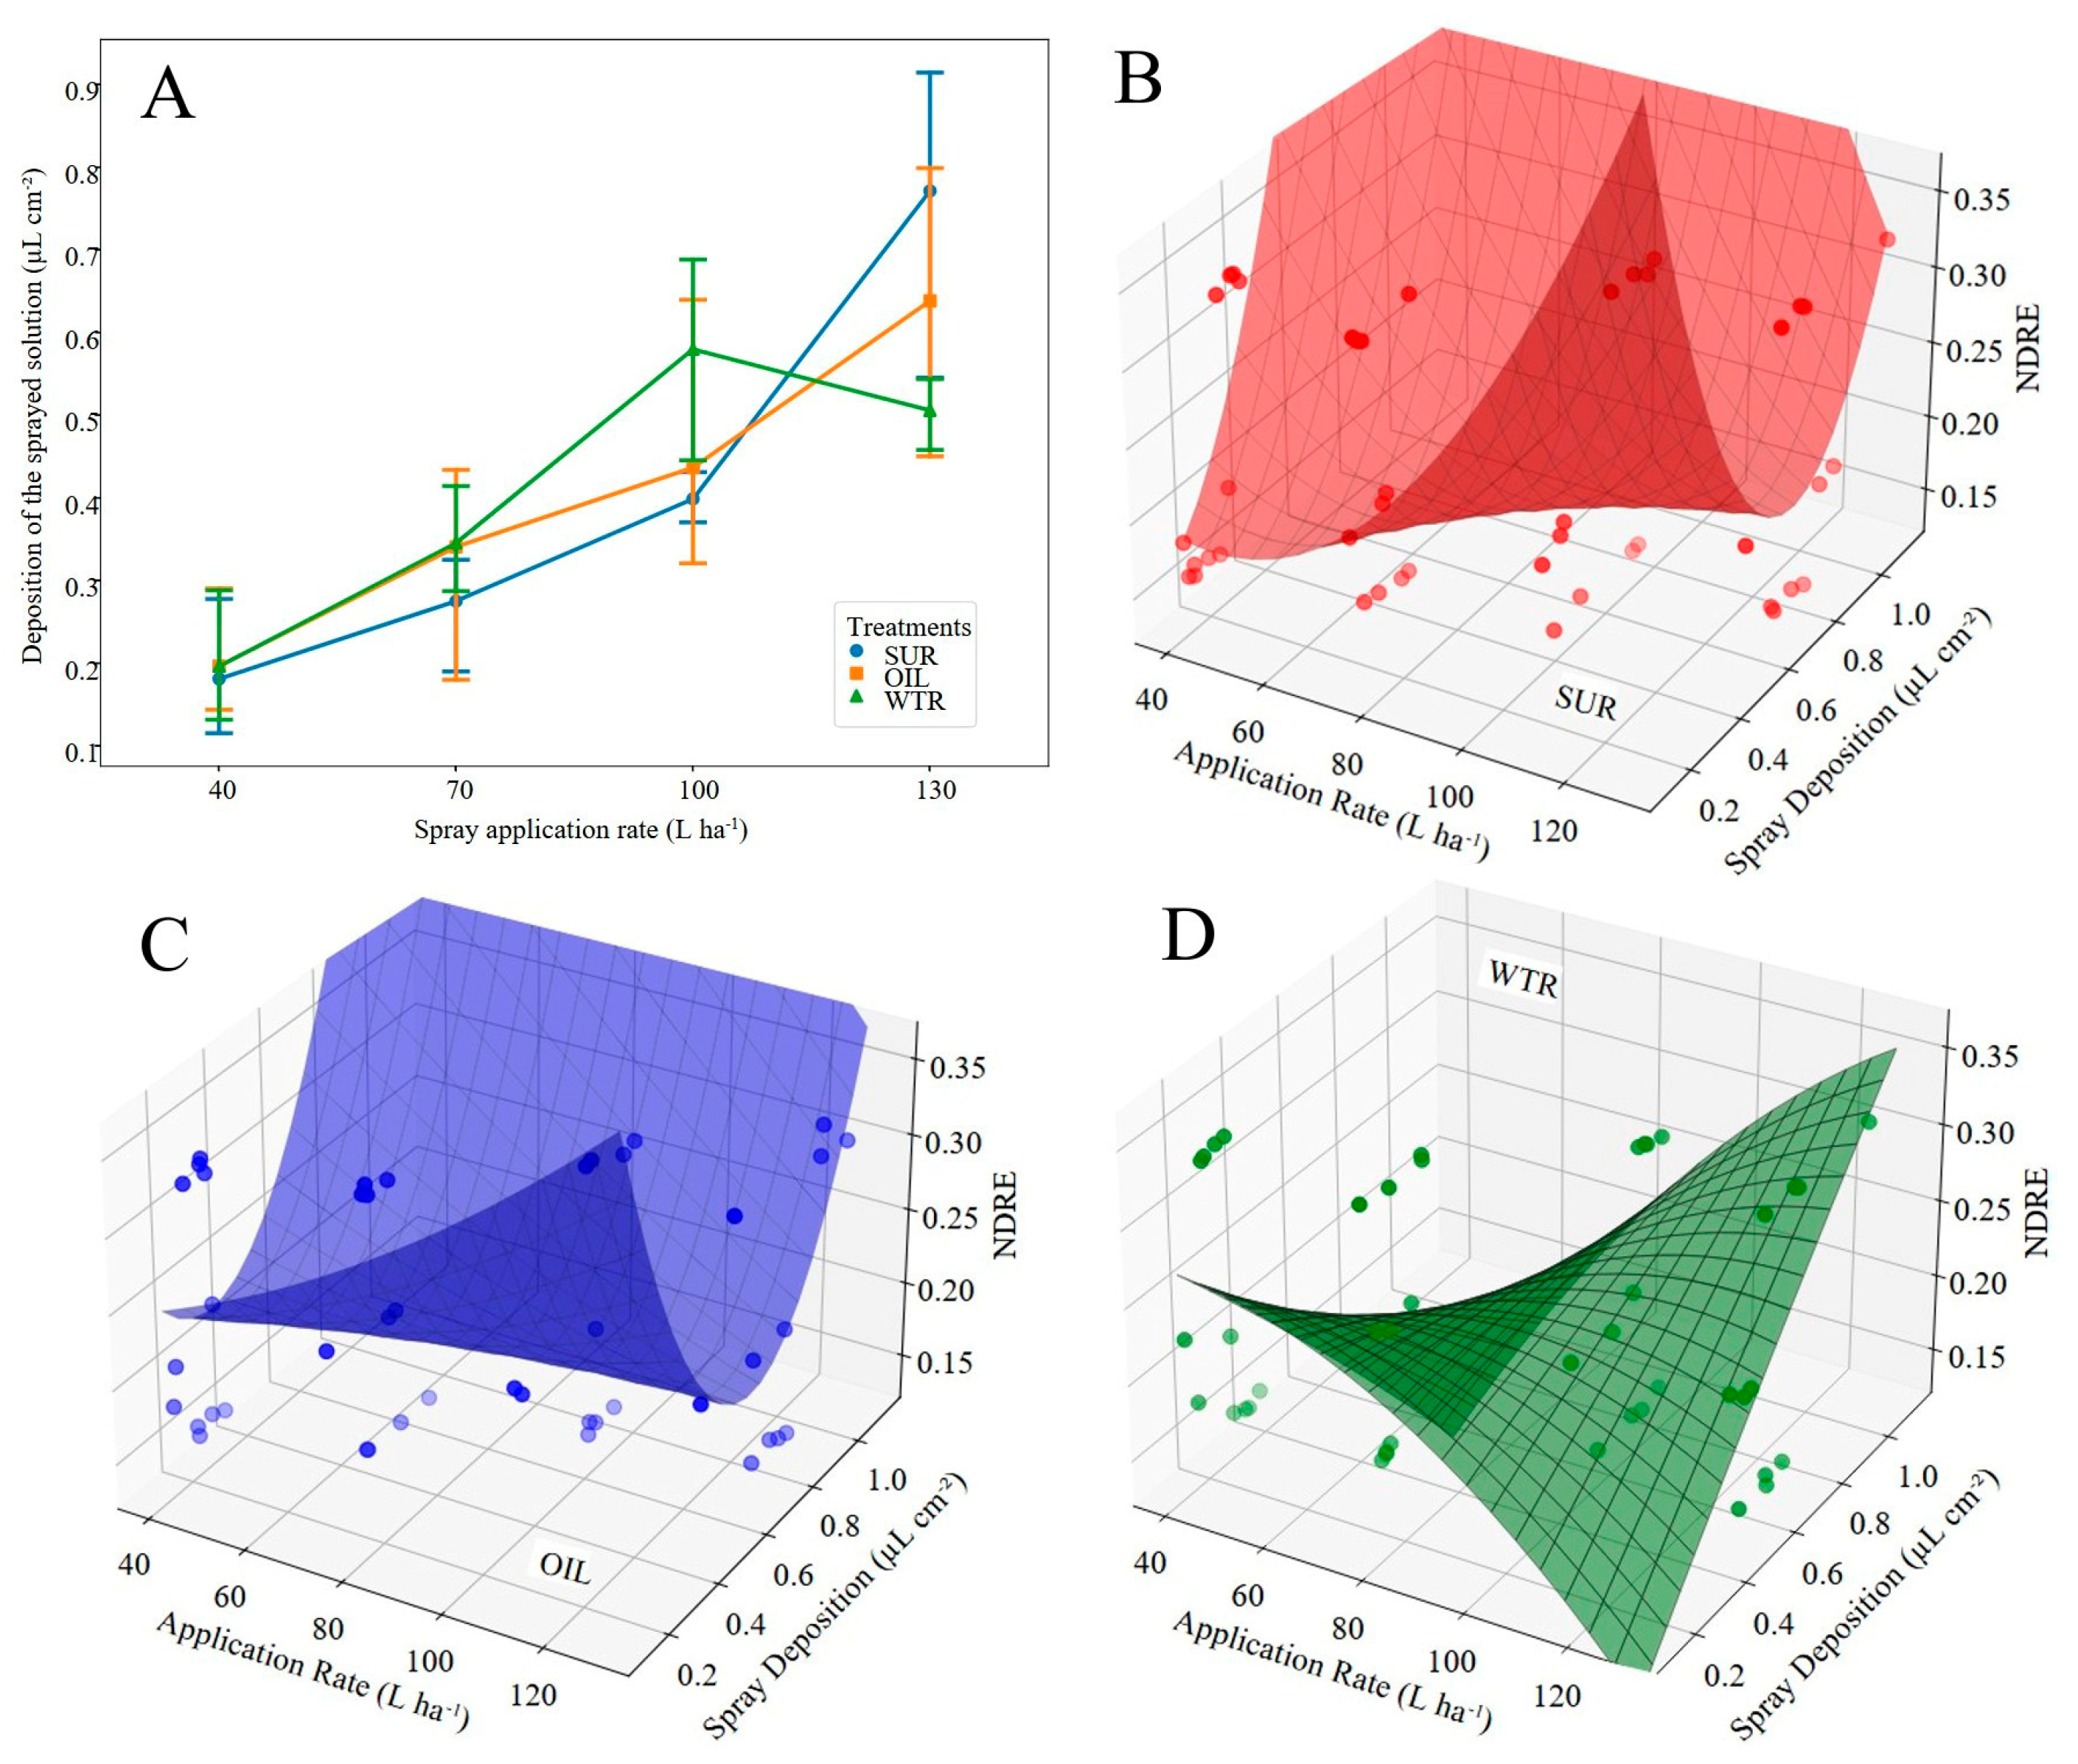
Even when the categorical interaction is not significant, the response surface analysis identifies the slope and the direction of the biological response, in addition to allowing the visualization of non-linear trends that ANOVA ignores. The organosilicone-based surfactant (SUR) stood out by presenting a high-efficiency plateau, with an elevated surface and smooth curvature that indicates superior technical stability (
Figure 3B). At reduced SARs (40–70 L ha
−1), the SUR super-spreading mechanism compensated for the lower carrier volume, making the system less sensitive to operational variations or errors in the spray application rate.
In contrast, the methylated oil (OIL) demonstrated a penetration gradient (
Figure 3C), where the increase in NDRE proved to be strictly dependent on physical deposition. This behavior suggests that OIL benefits from better hydraulic coverage to effectively facilitate the solubilization of epicuticular waxes, remaining most effective at intermediate rates. Conversely, the water control treatment (
Figure 3D) exhibited the highest technical instability, characterized by an abrupt performance drop at a low spray application rate. Without the protection of adjuvants, the pure water solution proved vulnerable to losses from evaporation and drift, reaching satisfactory levels only at the maximum volume of 130 L ha
−1. The surface topology validates the use of surfactants to expand the operational window at low volumes of SARs, while tat reduced volumes due to its inherent instability represents a high risk of technical and nutritional failure [
11]. Although the response surface models showed low coefficients of determination, the results are consistent with the high variability present in field experiments, especially under heterogeneous environmental conditions. In this situation, the use of the models should not be directed towards precise quantitative prediction. Instead, the magnitude and direction of the coefficients should be interpreted as indicative of qualitative trends, allowing the characterization of the response surface topology and the identification of general interaction patterns between the evaluated factors. The generated surfaces (
Figure 3) are particularly useful in this sense, highlighting regions of greater or lesser relative response.
The regression coefficients (
Table 2: b0 to b5) elucidate the mathematical basis for the observed technological performance. The intercept (b_0) represents the theoretical NDRE baseline, where the higher value for WTR (0.30) functions as a mathematical anchor to compensate for its subsequent steep performance decline. Regarding deposition sensitivity (b_2 and b_5), SUR exhibited the highest linear coefficient (0.68), indicating a strong, direct physiological response (by levels of the NDRE) to physical coverage. Both SUR and OIL showed positive quadratic coefficients (0.87 and 0.83), resulting in the ascending ramp topology that signifies accelerated efficiency in the presence of adjuvants. Furthermore, the rate stability coefficient (b_3) for SUR was positive, confirming sustained efficiency at low carrier volumes, whereas the negative value for WTR mathematically validates the loss of performance when moving away from the ideal application rate. The interaction term (b_4) for SUR (−0.015) further demonstrates its capacity to balance reduced water volumes with enhanced coverage quality, providing operational flexibility. Although the R
2 values (0.08–0.16) are relatively low, they are common in field experiments involving remote sensing, due to the high biological and environmental variability to which these experimental conditions are subjected. Even so, the magnitude and direction of the observed coefficients provide relevant information about the biological behavior of the analyzed variables and allow the identification of consistent trends associated with the technical stability of the evaluated spraying technologies.
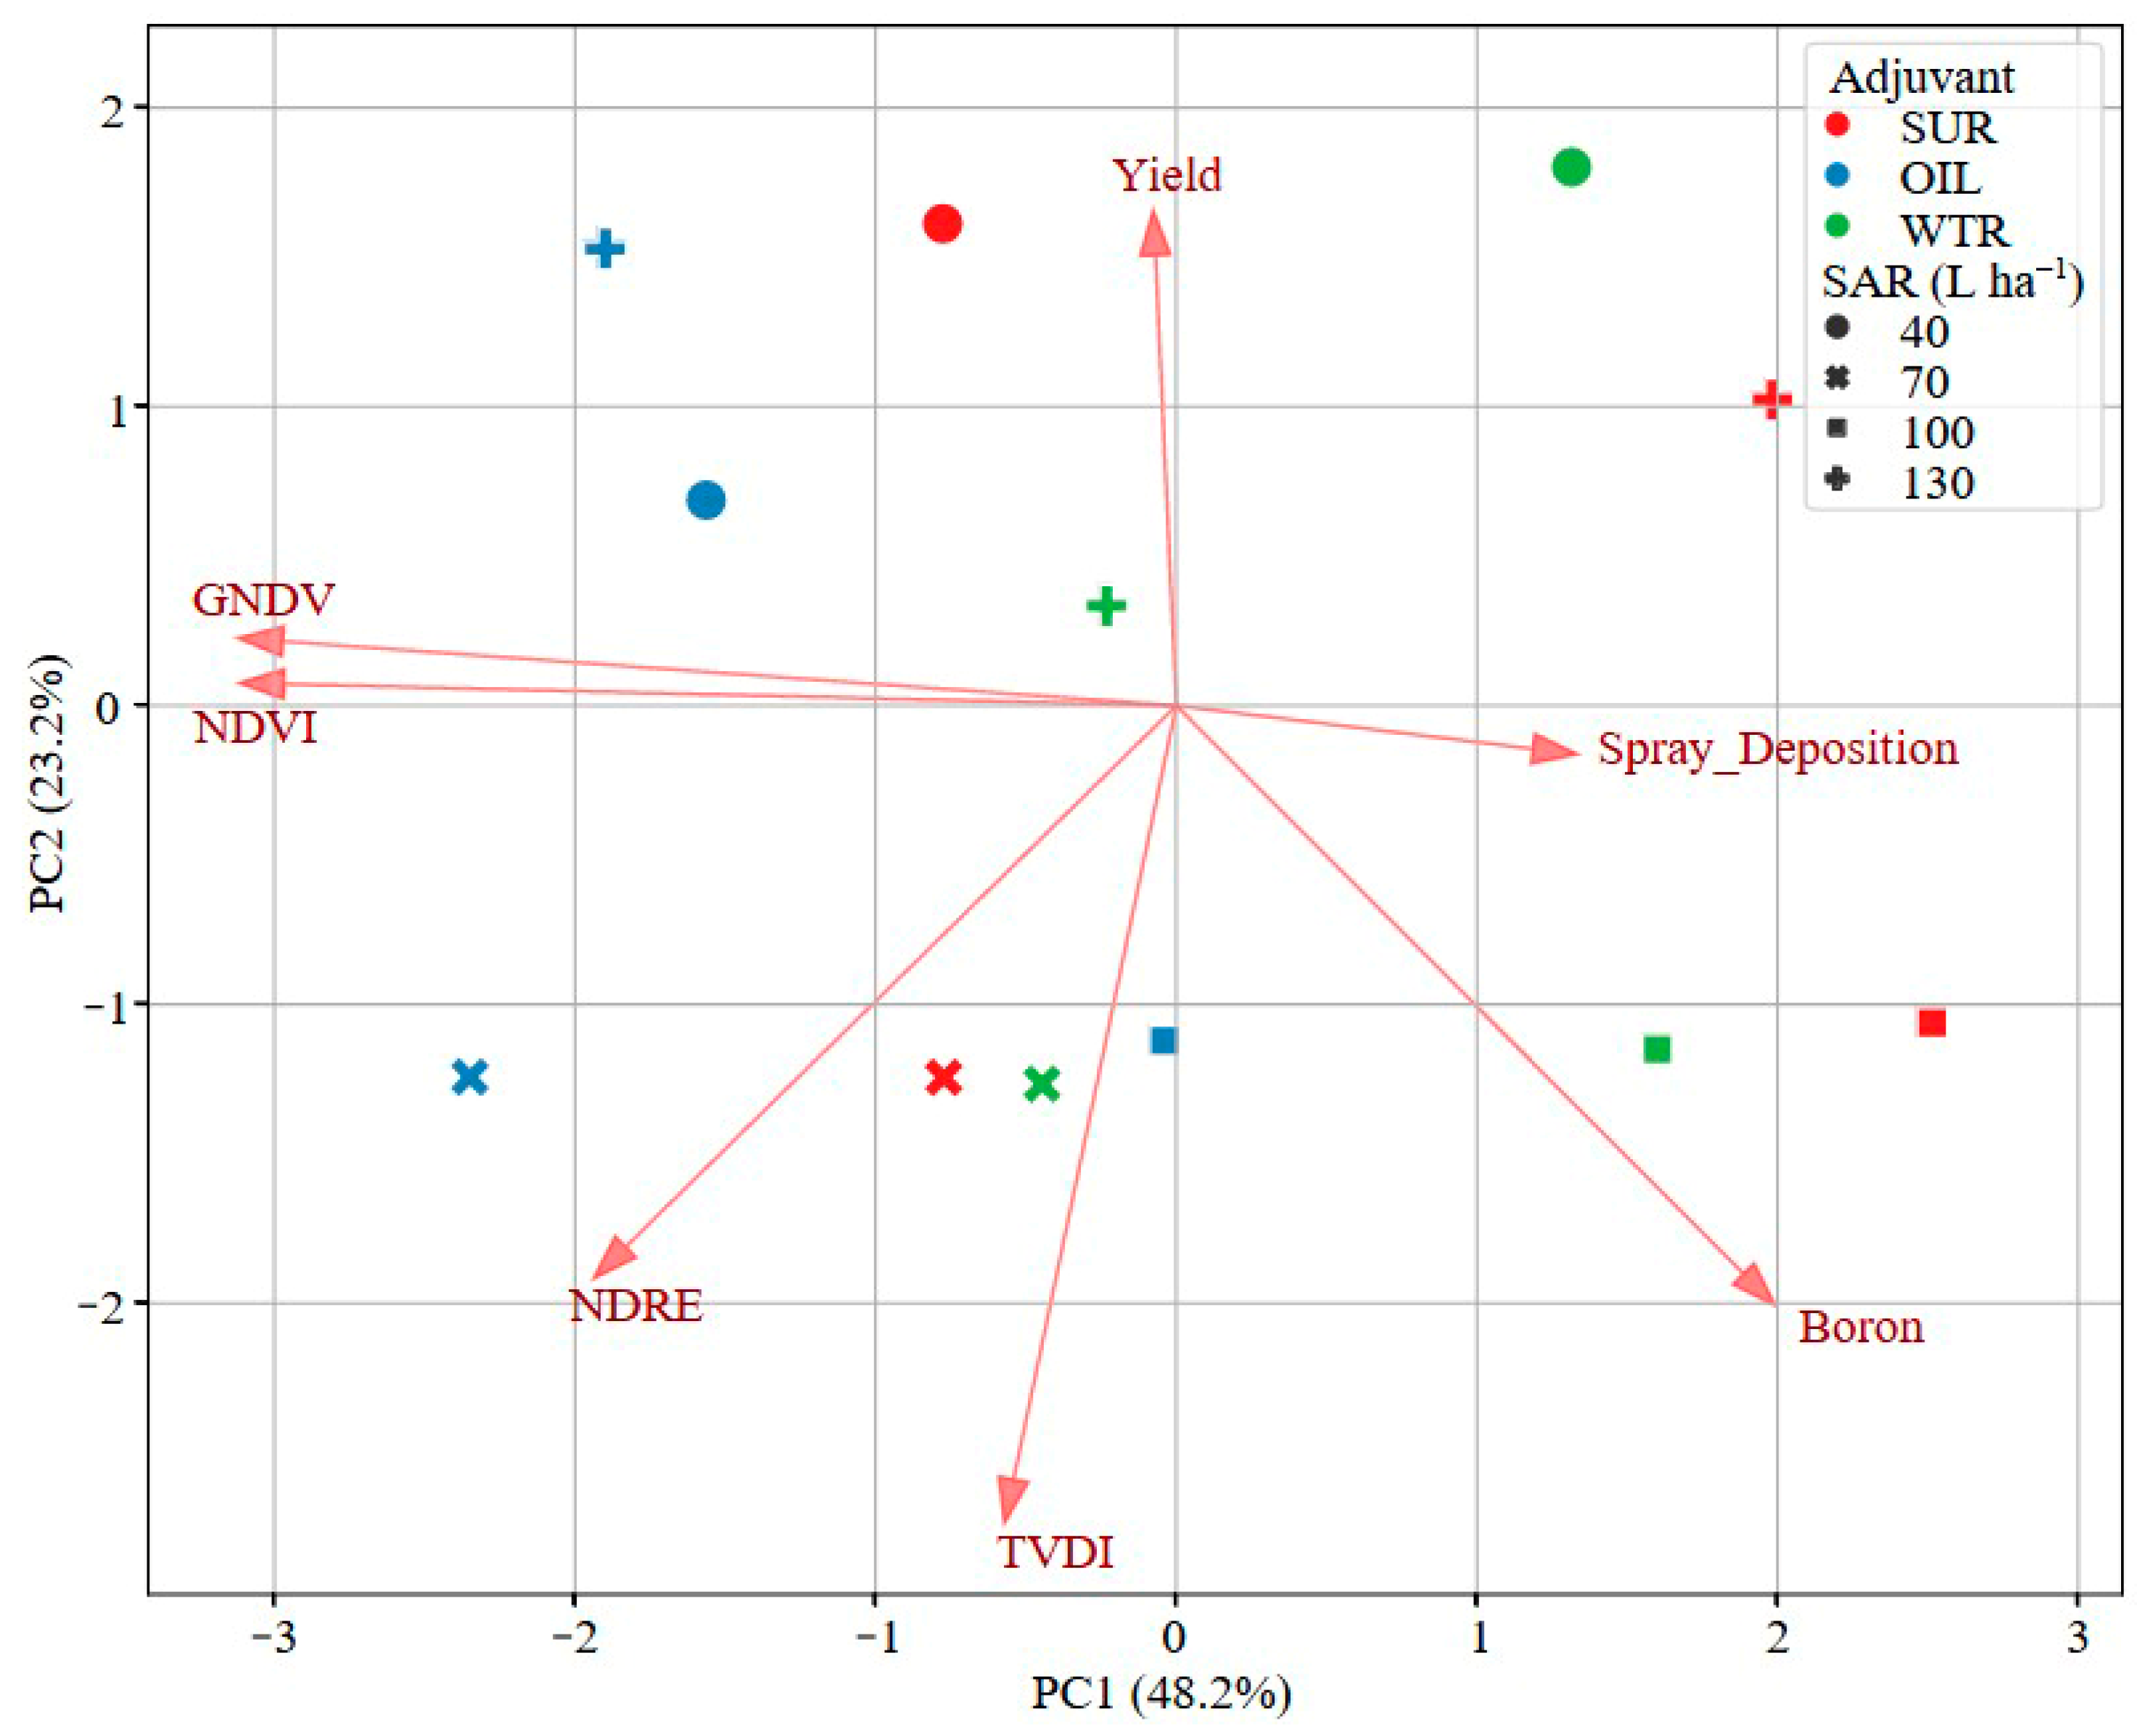
Principal component analysis biplot (
Figure 4) synthesizes the relationships between spray technology, physiological response, and crop yield. The first and second principal components explain (PC1 and PC2) explain a proportion of the total variance (>70%) [
20]. The first two components explain 71.4% of the total variance (PC1 = 48.2; PC2 = 23.2). The first principal component (PC1) is primarily defined by vegetation vigor indices, with NDVI and GNDV accounting for over 66% of the variance contribution in this axis. Conversely, PC2 captures environmental stress dynamics, with TVDI (39.6%) and grain yield (20.4%) acting as the dominant variables. One finding that deserves highlighting is the unique positioning of the NDRE index, which contributes significantly to both components (13.1% in PC1 and 21.6% in PC2). This multidimensional sensitivity suggests that NDRE as a robust alternative for assessing nutritional status in high-density canopies, effectively bypassing the signal saturation issues common in standard vegetation indices. An antagonism is observed along the PC1 axis between vigor indices (NDVI and GNDVI) and application efficiency indicators (boron and spray deposition). This relationship shows the dilution effect, where plants with high biomass accumulation tend to exhibit lower nutrient concentrations per unit of mass. In contrast, the PC2 axis highlights the environmental impact on crop performance, showing an inverse relationship between Yield (pointing toward the top) and the Temperature Vegetation Dryness Index (TVDI, pointing downward).
This may indicate that water and thermal stress were the primary limiting factors for soybean yield in this trial. The NDRE vector is positioned in the lower left quadrant, demonstrating a unique sensitivity that standard indices like NDVI lack. This suggests that the NDRE index is a more responsive alternative for assessing deep-canopy nutritional status and deposition quality, being a promising index for this evaluation. Regarding treatment clusters, high application rates (100 and 130 L ha−1) combined with adjuvants, specifically the SUR (surfactant), shift toward the right and bottom of the biplot, aligning with higher Boron and Deposition vectors. On the other hand, the control group (WTR), with lower application rates, remained isolated in the upper quadrants, reflecting poor performance in terms of nutrient delivery.
A subtle yet critical nuance in the PCA is the orthogonality between the Yield and NDVI vectors, suggesting that grain production was governed more by stress mitigation (as evidenced by the inverse relationship with TVDI) than by mere biomass accumulation. Furthermore, the parallel alignment of the NDRE and Boron vectors confirms the superiority of the red edge band over traditional indices for assessing canopy spectral responses associated with the efficiency of micronutrient delivery.
4. Discussion
The absence of significant differences in foliar boron concentration can be attributed to a combination of physiological factors that may explain the lack of significance. Firstly, the sampling time may not have coincided with the peak absorption of the nutrient, since the dynamics of foliar absorption of micronutrients are strongly influenced by environmental conditions and the physiological state of the plants. Thus, it is plausible that any differences between treatments occurred in periods prior to the evaluation and were not captured at the time of collection. However, the other variables evaluated regarding application and indices showed differences in their results.
Surfactants with low dynamic surface tension have been shown to improve droplet spreading and reduce surface tension significantly, thereby enhancing wetting and retention on hydrophobic leaf surfaces compared with untreated solutions [
21,
22]. This mechanism enables extensive coverage even at restrictive spray volumes by increasing the effective contact area between droplets and the leaf surface, compensating for reduced carrier volumes typical of low-volume applications [
23]. Dynamic surface tension (DST) describes the rapid reduction in surface tension immediately after droplet formation, controlling droplet spreading and wetting on leaf surfaces. Organosilicone surfactants can reduce DST to extremely low values (often <23 mN m
−1), promoting stomatal flooding, where the spray solution penetrates open stomata rather than remaining restricted to the cuticle [
24,
25].
By contrast, oil-based adjuvants facilitate penetration through the epicuticular wax layer by dissolving hydrophobic components and delaying droplet evaporation, which can enhance uptake of active components into leaf tissues [
26]. Studies prove that vegetable and mineral oil adjuvants demonstrate improved deposition and reduced drift when compared to water alone [
22]. These contrasting modes of action, through enhanced horizontal coverage by surfactants versus improved vertical penetration by oil-based penetrants, reflect the importance of tailoring adjuvant selection to deposition goals.
The observed positive correlation between the NDRE index and technical deposition indicates that, under conditions of high vegetative biomass, NDRE-based analyses remain responsive, whereas studies relying on traditional NDVI metrics may suffer from index saturation and consequently fail to capture meaningful relationships with deposition [
27]. While the red band used in NDVI is largely absorbed by the upper leaf layer, red-edge wavelengths penetrate deeper into the canopy [
27], allowing relationships between the index and boron.
Although the main effects of adjuvant type and spray application rate (SAR) were not individually significant for yield or foliar boron concentration, their interaction suggests that boron efficiency depends on how spray formulation and carrier volume influence droplet retention and redistribution on the canopy [
28]. This interaction likely altered the spatial distribution of boron on leaf surfaces, affecting its availability for absorption and subsequent physiological responses. Such behavior reinforces that nutrient delivery through foliar spraying is governed by application physics as much as by plant nutritional demand.
While organosilicone surfactants (SUR) demonstrated peak efficiency at reduced application rates (40 L ha
−1), a relative decline in performance was noted at the highest volume (130 L ha
−1). This phenomenon may be attributed to excessive surface tension reduction; in high-volume applications, the superspreading mechanism likely promotes droplet coalescence and subsequent run-off from the leaf surface [
29], thereby reducing effective nutrient retention. The incorporation of silicon-based surfactants effectively decreases droplet surface tension, thereby expanding the wetted area on the soybean leaf surface. Lower surface tension enhances the dynamics of foliar nutrient uptake [
11]. This process provides a mechanistic explanation for the increased leaf boron concentrations observed in treatments that included the adjuvant, particularly under reduced application rates, where minimizing droplet evaporation losses becomes critical.
The interaction between adjuvants and prevailing environmental conditions also substantially influences droplet persistence on the leaf surface. In the present study, the inclusion of surfactants altered the evaporation behavior of spray droplets on soybean leaves. This observation is consistent with recent findings showing that adding suitable adjuvants reduces surface tension and modifies droplet dynamics, enhancing spreading and prolonging droplet residence time on plant surfaces compared with untreated sprays, thereby potentially increasing foliar uptake [
21,
26,
30]. Strategic selection of adjuvant types and concentrations is therefore critical to balanc improved spreading with droplet lifespan under field environmental conditions. Operational settings directly influenced the droplet spectrum generated during application, reflecting changes in deposition and distribution of the spray solution on the plant canopy. Changes in the droplet spectrum affect droplet size, density, and coverage, which are determining factors for product interception and retention on leaf surfaces.
The positive relationship observed between foliar boron uptake and soybean yield underscores the essential role of this micronutrient in reproductive success. Current evidence indicates that sufficient boron availability during reproductive development supports key processes such as microsporogenesis, pollen tube growth, and post-fertilization embryo development, which can directly influence pod set and seed formation [
9,
31]. Additionally, boron has been shown to aid in the translocation of carbohydrates and other assimilates to developing reproductive organs, contributing to improved yield components [
32]. From a physiological point of view, it is noteworthy that boron has limited mobility in the phloem in crops such as soybeans, which restricts its redistribution to new tissues and makes it difficult to detect spatial variations in the plant based on a single sampling position. Thus, the point foliar concentration may not adequately represent the dynamics of nutrient absorption and utilization. Given these limitations, grain yield and spectral indices are more integrated indicators of crop response, as they reflect the cumulative effect of nutrition throughout the cycle, in contrast to point measurements in time and space. Beyond its role in reproductive development, boron is essential for cell membrane integrity and phloem transport of photoassimilates, particularly under stress conditions [
9]. Adequate boron supply supports stomatal regulation and transpirational cooling, which may contribute to lower leaf temperatures and reduced crop water stress indicators such as TVDI.
To improve crop management, micronutrients are commonly sprayed in conjunction with crop protection products and surfactants, which enhance droplet–leaf interaction [
1]. Despite the logistical benefits of these multi-component mixtures, the resulting spray solution is highly susceptible to drift, leading to environmental losses and non-uniform distribution of the applied nutrients [
3]. It is important to note that the deposition assessments were performed in the middle portion of the canopy, which represents a methodological limitation of the study. Spray deposition can vary significantly along the vertical profile of the plant, depending on the canopy architecture, leaf area index, and droplet characteristics. Therefore, the results presented here should be interpreted as representative of this specific third of the plant. Future studies considering stratification along the canopy may provide a more comprehensive understanding of spray distribution.
Although this study provides relevant insights, its findings should be interpreted considering some limitations. The experiment was conducted during a single growing season and at a single location in the Brazilian Cerrado; the results represent localized climatic conditions. Furthermore, climatic variability throughout the year, particularly in relation to productivity and region-specific temperature regimes, may influence plant development and the observed responses, which should be considered when extrapolating to other environmental conditions. Although foliar B concentration did not vary significantly among treatments, the alignment of the Boron and NDRE vectors in the PCA biplot suggests a consistent underlying relationship between deposition quality and nutritional status. Applications were performed at the V6 and R1 growth stages, when boron demand is high; however, droplet–target interactions may differ at later reproductive stages due to increased canopy complexity and leaf area. The study also focused on only two adjuvant classes, indicating that evaluations including a wider range of surfactants would strengthen technological recommendations.




 ,
,