2. Materials and Methods
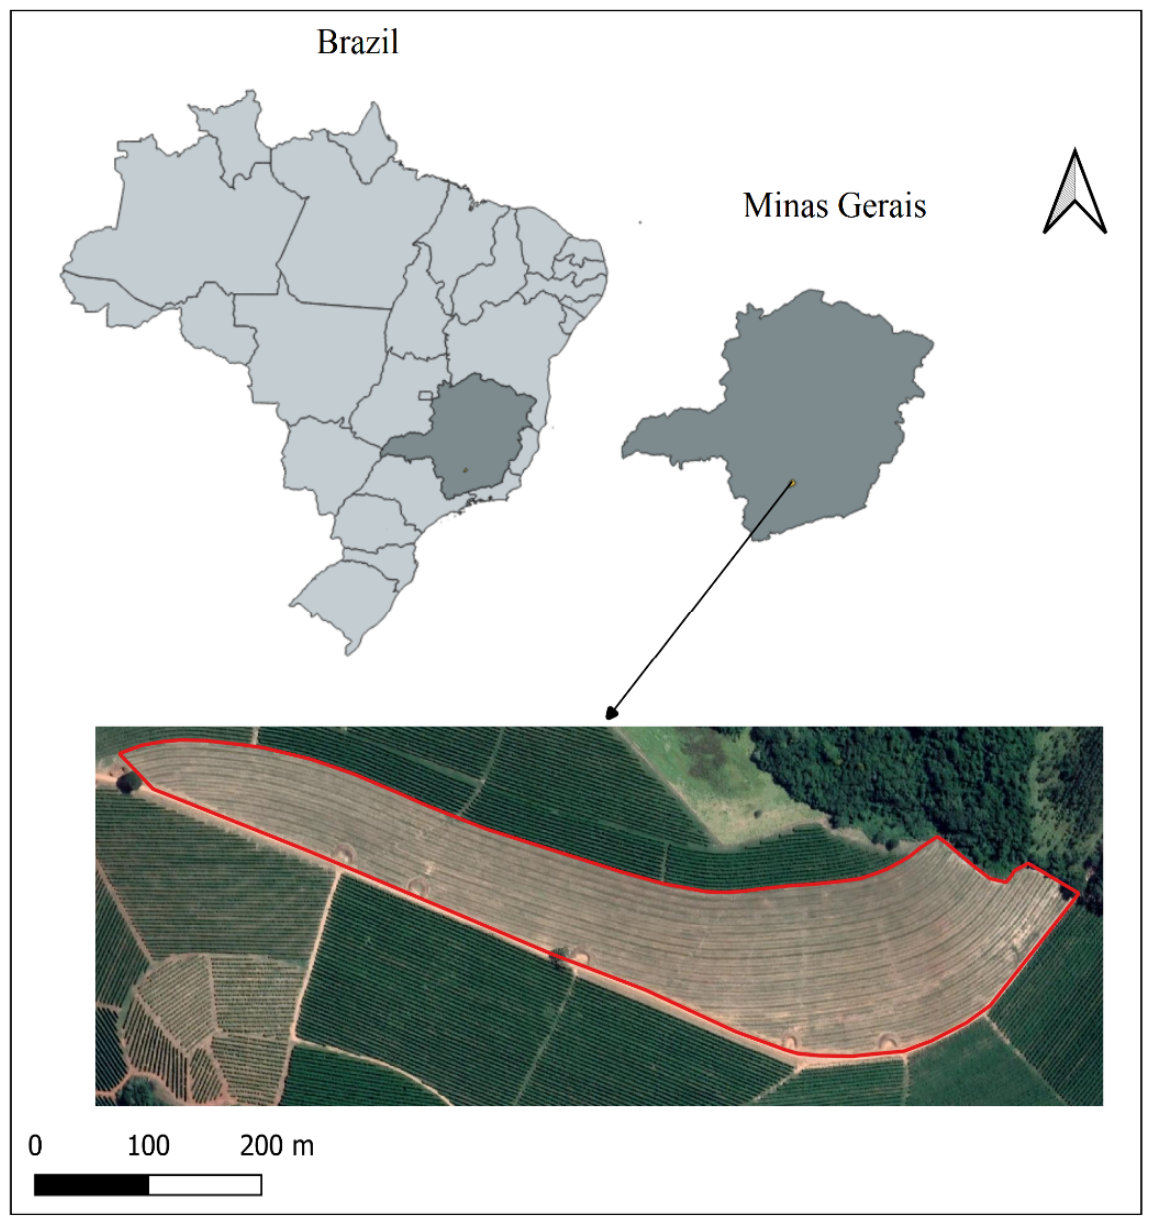
This study was conducted in an eight-hectare area dedicated to coffee cultivation, marked in red as shown in
Figure 1, located at Fazenda Bom Jardim in the municipality of Santo Antônio do Amparo, Minas Gerais state, Brazil, with the coordinates 21°00′55″ S latitude and 44°54′57″ W longitude. According to Köppen, adapted by [
8], the region is characterized as (CWB), with a warm and temperate climate, presenting average annual temperatures of 20 to 22 °C, with higher rainfall in summer than in winter, between 1300 and 1600 mm annually, and an altitude between 800 and 1000 m.
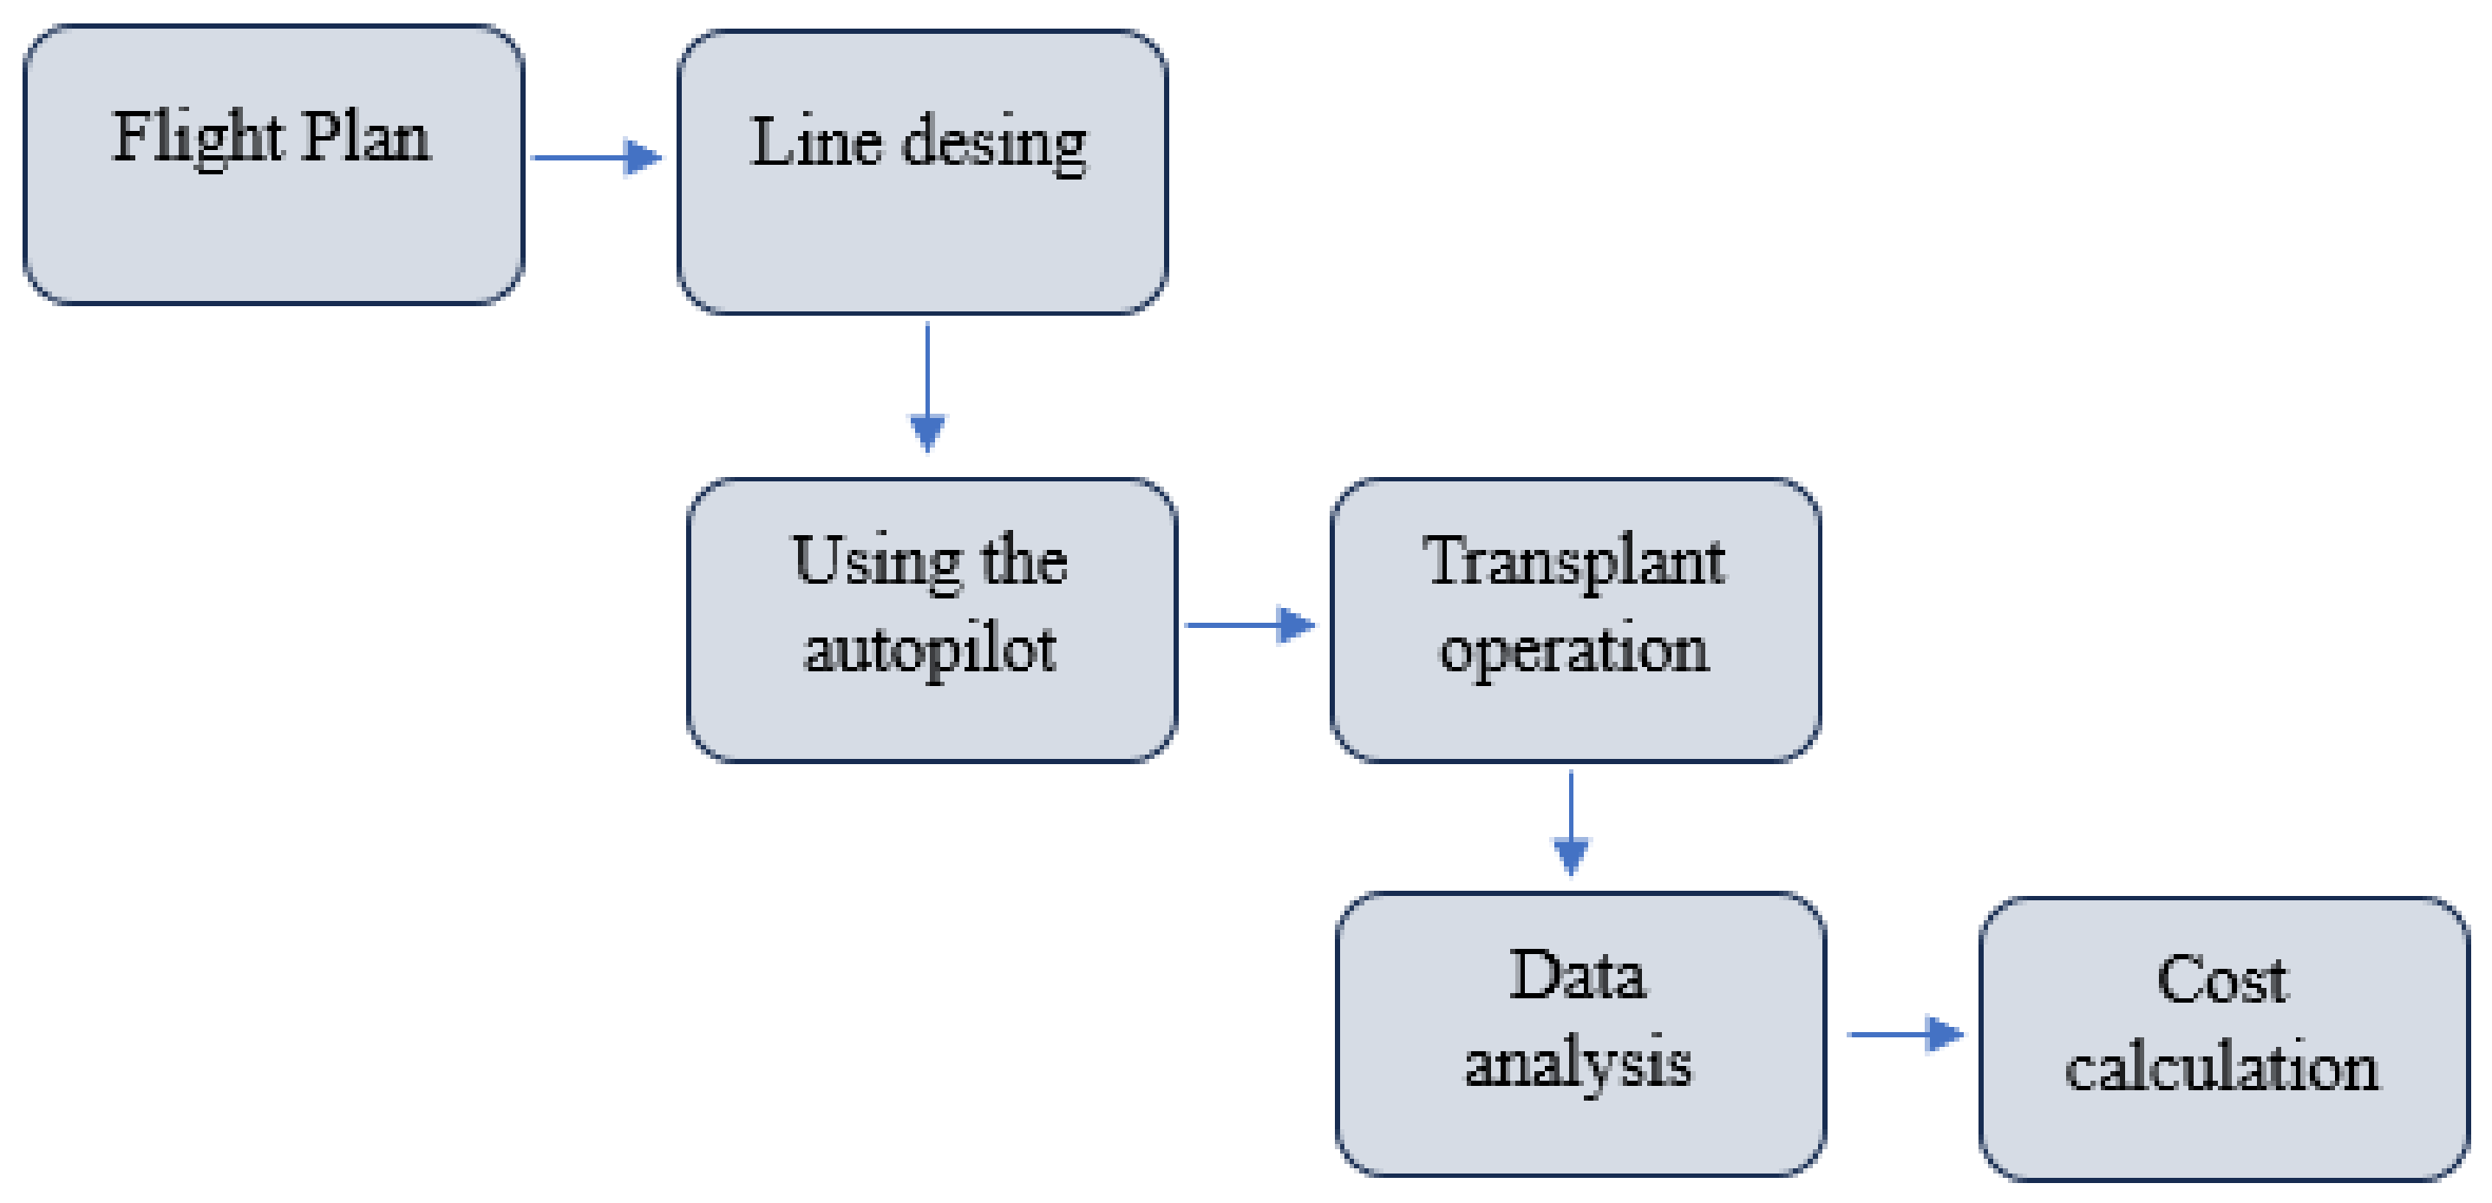
For better understanding,
Figure 2 shows the steps that were carried out in this study.
For the semi-mechanized transplanting operation, a flight plan was developed to delineate the area and define the takeoff points. Before starting the flight, several safety factors were observed, including weather conditions, wind speed, and the presence of objects, poles, trees, and power transmission towers [
9]. Subsequently, the flight mission was planned using Drone Deploy software version v3.2. Aerial images were obtained using a DJI Phantom 4 Advance RPA, manufactured in Shenzhen, China, with an RGB sensor with a 1” focal aperture, capturing photos up to 20 megapixels and a spatial view resolution of 12 mm. The remotely piloted aircraft flight was conducted on 7 November 2020, in the study area, at a height of 120 m above the ground and with a frontal and lateral overlap of 80% × 80%.
The images obtained during this flight were processed using Agisoft PhotoScan software, version 1.4.3, which is based on the SfM algorithm. SfM approaches can be considered superior to other approaches in terms of accuracy when the user intends to generate orthomosaics and Digital Terrain Models (DTMs) [
10]. Through the DTM, a topographic analysis was performed to overestimate variations in terrain slope to allow for adjustments for the mechanization of coffee transplanting.
Given this, the study area was considered suitable for mechanizing the agricultural operation. To continue the process, a planting row design was carried out with a distance of 3.5 m between rows, according to the flight mission previously conducted in the area. These rows were adjusted according to criteria of flight line position and terrain topography, as shown in
Figure 3, to control erosion and, in the future, improve agricultural management.
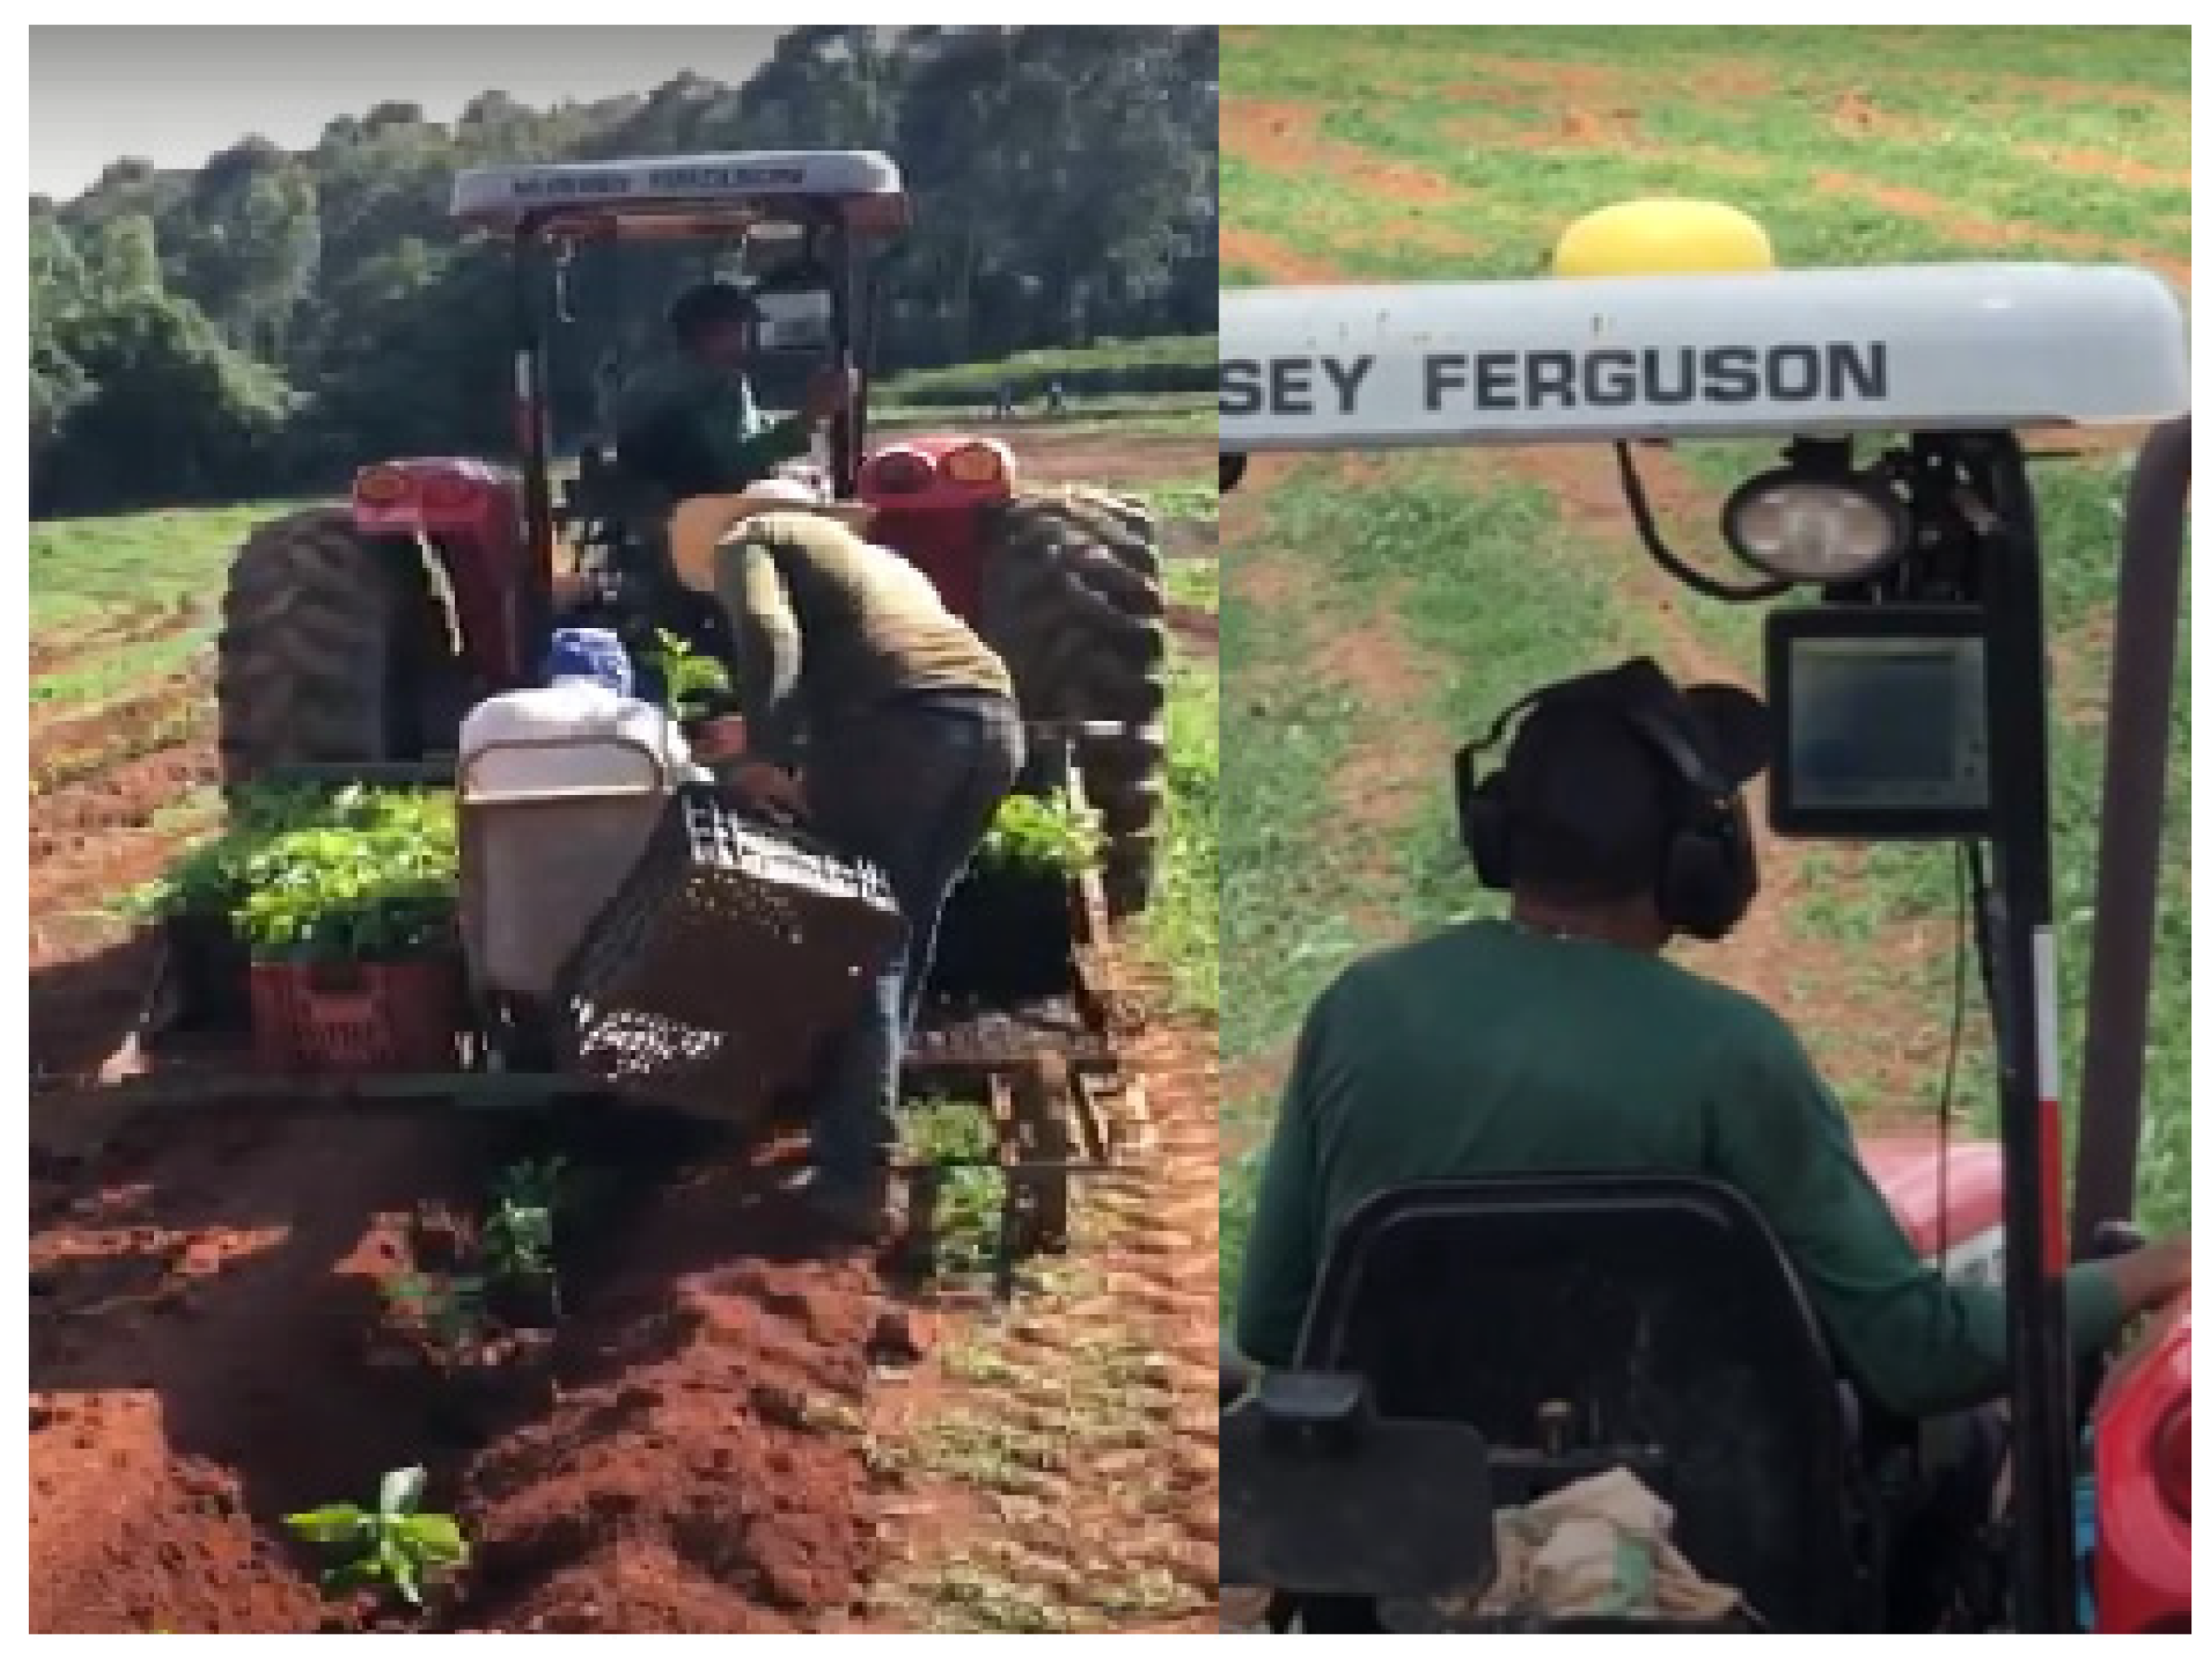
These planting lines were transferred to the autopilot mounted on the agricultural tractor for the development of the activity. The seedlings used for transplanting were grown in bags. The semi-mechanized planting operation was carried out with an MF 4275 “coffee” tractor with 75 hp, 4 × 2, with an auxiliary front-wheel drive, equipped with a manual furrowing/distributing platform. Two assistants were needed to deposit the seedlings in the soil and seventeen more people right behind to bury the seedlings. A total of 7458 seedlings of the Catuaí Vermelho IAC 144 variety were transplanted, distributed in spacings of 3.5 m between rows and 0.5 m between plants, from 30 November 2020 to 3 December 2020, as shown in
Figure 4.
The design cost was considered a one-time investment associated with the development and engineering of the equipment, including the planning, sizing, and testing phases, for the system that used the autopilot. In this study, the design cost was estimated at 10% of the tractor’s acquisition cost. For the conventional system, no design cost was included, since these costs are already embedded in the market price of commercial machines. The equipment used in this study, along with their respective acquisition costs, are presented in
Table 1.
To assist with crop transplanting, an ATU JD autopilot (John Deere, Moline, IL, USA) was used, which provides a mapping on the controller screen, offering visualization with each tractor pass and real-time transplanting information. A JD SF3 GNSS antenna (John Deere, Moline, IL, USA) with correction was also used, which processes signals from global navigation satellite systems (GNSS), providing greater precision and improved equipment performance, in order to guide the operator regarding the planting lines to be followed by the tractor.
As the tractor moved, following the lines displayed on the autopilot monitor, the soil was furrowed and the seedlings transplanted. During the transplanting of the coffee seedlings, the operation performed in the field was recorded and stored by the autopilot controller at a frequency of one data point per second. The stored data included the distance traveled during transplanting, the width of the planting swath, the target depth applied, the elevation of the area relative to sea level, and the time.
For the purposes of this study, the data obtained were separated, organized into spreadsheets, and subsequently used in an economic study of transplanting a coffee plantation, based on a successful investment proposal applying precision agriculture to agricultural mechanization. However, a comparison was made between a semi-mechanized transplanting operation with autopilot and a scenario in which the same transplanting operation was performed, but without the aid of autopilot, i.e., in a conventional manner. Both operations used the same tractor/implement combination, with the same number of people assisting in the activity and the same number of days required to complete the work.
The purpose of this comparison was to observe different capital investment alternatives for coffee transplanting operations. To this end, data quoted in the local currency, reais, were converted to dollars for better understanding in this study. Thus, for the data quoted in 2020, the value of 5.33 reais was considered, equivalent to 1 dollar on 30 November 2020, referring to the first day of the transplanting operation. In the current comparison of the two types of transplanting operations, the value of 1 dollar was 5.34 reais on 7 November 2025, the day this study was written.
Some parameters are essential to assist in the investment decision, such as the costs of manual labor and mechanized operation. The base values for the calculations in this study, referring to the year 2020, are presented in
Table 2.
For comparison purposes between the years 2020 and 2025,
Table 3 presents the base values for comparative calculations, referring to the year 2025.
For the analysis of the hourly cost of the machine used in the planting operation, fixed and variable costs were considered, according to the methodology proposed by [
11]. Therefore,
Table 4 presents the baseline values for the calculations performed in this study.
Fixed costs are long-term costs that do not vary with the intensity of machine use, such as depreciation and interest on invested capital, in addition to insurance and equipment storage costs. Depreciation represents the allocation of the initial cost over the depreciation period, discounting the scrap value, since in coffee farming the operations are not so heavy and, in most cases, the machines do not end up as scrap after depreciation. Theoretically, the minimum scrap value considered is 10% of the initial value [
12]. For the calculation of the hourly depreciation of the equipment used in the operation, the average number of annual working hours was considered. For the agricultural tractor, 1000 h/year was considered, while for the manual furrowing/distributing platform, 200 h/year was adopted, and for the John Deere Autotrack kit, 800 h/year was applied. Depreciation was calculated according to Equation (1).
where D—depreciation (
$/h); Vi—initial acquisition value (
$); S—scrap value (
$); T—total depreciation time (h).
The interest rate is the value for the remuneration of the capital employed in the purchase of the machine. If the acquisition capital is the owner’s own, the interest must follow at least the savings rate; if the capital is financed, it follows the financing rate [
12], calculated according to Equations (2) and (3).
where Vm—average value (
$); J—interest (
$/h); Vi—initial purchase value (
$); t—annual working hours (h); i—interest rate (decimal).
The insurance rate varied from 0.50% to 2.0% of the initial cost per year, depending on the tractor model [
12], and was calculated according to Equation (4).
where TS—insurance rate (
$/h); Vi—initial acquisition value (
$); Y—insurance rate used: 0.02*; t—annual working hours (h).
The equipment accommodation cost is the product of the initial purchase price and the accommodation rate, which varies from 0.5% to 2% per year based on the number of hours worked per year [
12], and was calculated according to Equation (5).
where A—accommodation cost (
$/h); Vi—initial purchase price (
$); ia—accommodation rate (%); n—hours worked per year (h).
Fixed costs are those that must be charged regardless of whether the machine is used or not; hence, they are also called ownership costs. In this regard, it is necessary to consider that, from the moment a tractor or any other agricultural machine is acquired, it becomes a burden on its owner, even if it remains inactive in the machine shed. The way to remove this burden is to use the tractor for the greatest number of hours per year, reducing idle time as much as possible [
12]. Fixed costs were determined according to Equation (6).
Variable costs are short-term costs influenced by machine usage, such as fuel expenses, preventive and corrective maintenance, lubricants, and labor for machine operation.
The fuel cost varies depending on hourly consumption, which in turn depends on the operational power demanded [
19], and was calculated according to Equation (7).
where C—fuel cost (
$/h); 0.13—L/hp·h;
—nominal power (hp); PC—fuel price (
$).
The hourly cost of preventive maintenance refers to the expenses for components replaced at regular intervals, such as air filters, lubricating oil, fuel, belts, hydraulic oil, etc. However, the costs of corrective maintenance are more difficult to quantify, as they depend on the machine’s breakdown history.
According to [
14], proper equipment maintenance can lead to increased work efficiency due to shorter downtimes and fewer interruptions for troubleshooting, and its costs make up a large portion of the operational costs, which can also be attributed to the intensive use of machines, serving as a parameter for their rational use or replacement.
Maintenance costs can vary from 50% of the initial cost for coffee tractors to 80% of the initial value for transplanters and implements used in the semi-mechanized system [
15,
16], and were calculated according to Equation (8).
where M—hourly maintenance cost (
$/h); Vi—initial acquisition cost (
$); t—annual working hours (h).
The costs of lubricants were determined by directly relating them to the cost of fuel; according to [
19], for coffee tractors, this can be considered 8.4%, while for the implements used in the operations that constitute transplanting, a rate of 10% of the fuel cost was considered [
16], according to Equation (9).
where L—cost of lubricants (
$/h);
—price of lubricant (
$); Cc—fuel consumption (L).
The labor costs took into account the salary, as well as other benefits and social charges. For social charges, the values of FGTS (Brazilian severance pay fund), INSS (Brazilian social security), vacation pay, thirteenth salary, vacation bonus, plus an amount related to contract termination, totaling 45.6% of the base salary practiced by producers in the study region [
16], were calculated according to Equation (10).
where Mo—labor (
$/h); n—number of minimum wages; SM—monthly minimum wage (
$); ES—social charges (decimal); d—monthly working days (days); jd—daily working hours (h).
Variable or operational costs are those that depend on the amount of use made of the machine [
12] and were determined according to Equation (11).
where CV—variable cost (
$/h); C—fuel cost (
$/h); M—hourly maintenance cost (
$/h); L—lubricant cost (
$/h); Mo—labor (
$/h).
For the cost allocation procedure, initially, all costs were estimated annually and classified into fixed costs and variable costs. Fixed costs included depreciation, interest, and other property-related expenses, as well as the design cost in the case of the developed system. Variable costs included fuel, lubricants, maintenance, and labor. Total costs are the sum of fixed costs and variable costs [
20], and were calculated according to Equation (12).
where CT—total cost (
$/h); CF—fixed cost (
$/h); CV—variable cost (
$/h).
Finally, costs were allocated in unit values (per hour and per hectare) based on the annual operational time and effective field capacity of each system. The effective field capacity was calculated according to the methodology described by [
21], considering the implement working width, operating speed, and field efficiency. This allocation procedure allows for a consistent comparison between operational modes, as it reports total costs to actual machine usage, according to Equation (13).
where: A—area worked (ha); t—time spent on operation (h).
The effective operational cost per hectare will be calculated, for both operating modes, by adding the fuel costs to the costs of lubricants, labor, maintenance and repairs, and other variable costs [
21]. Note that the calculated cost reflects only the expenses, culminating in the effective work, that is, the cost of executing the operation on the plot, which in this study is called the effective cost [
22], according to Equation (14).
where C—fuel cost (
$/h); M—hourly maintenance cost (
$/h); L—lubricant cost (
$/h); Mo—labor (
$/h); Co—other variable costs (
$/h).
The effective operating cost was initially determined in $/h and subsequently converted to $/ha based on the quotient between the COE and the Effective Field Capacity, expressed in ha/h.
Statistical analyses were conducted to evaluate differences between the evaluated operational scenarios. Student’s t-test was applied to compare the means of the systems, adopting a significance level of 5% (p < 0.05).
To allow for a temporal comparison of costs and to reflect purchasing power in the reference year (2025), the monetary values originally expressed in 2020 currency were adjusted using the Broad National Consumer Price Index (IPCA), calculated by the Brazilian Institute of Geography and Statistics (IBGE) [
17]. The IPCA is the official inflation index in Brazil and is widely adopted in economic analyses of the agricultural sector [
2,
23].
In this context, the use of an economic investment analysis to assist in decision-making by coffee producers is important. Methods based on the accumulation of inflation over the years indicate the variation in the total cost of agricultural operations, as is the case in this study, considering the sum of the inflation variations that occurred in each year. Thus, accumulated inflation is represented according to Equation (15) [
23].
where I = accumulated inflation; (1 +
) (1 +
)…(1 +
) = the annual inflation rates (IPCA) for each year in the period.
Inflation rates for the years 2020 to 2025 are shown in
Table 5.
The cash flow for the investment in this study was developed considering the initial investment, annual operating costs, and revenues generated by mechanization over the useful life of the equipment used. A total of 10 years was considered, corresponding to the estimated useful life of the autopilot.
The economic feasibility analysis was conducted based on the following parameters: an area of eight hectares with an average slope of 19.4%; a 5-year horizon; a Minimum Attractive Rate of Return (MARR) of 12% per year; and a price per sack of coffee fixed at US$425.57. The total number of seedlings was 7458 units, resulting in a density of 932 seedlings per hectare. The additional investment for adopting the autopilot system corresponded to the difference between the total costs of the piloted and conventional systems. A total of 50.2 and 86.3 h of operation was spent for the eight hectares for the autopilot operation and for the conventional system, respectively.
The total annual benefit comprised direct savings such as transplanting, fuel, seedlings, maintenance, and security. Based on these parameters, the Net Present Value (NPV), Internal Rate of Return (IRR), payback period, and return on investment (ROI) were calculated, in addition to a sensitivity analysis for the main risk factors.
The economic viability of investment projects can be assessed using indicators based on discounted cash flow, with Net Present Value (NPV) being one of the most widely used methods in the literature for investment analysis [
18]. NPV corresponds to the sum of future cash flows discounted to present value using a discount rate, allowing for the evaluation of the project’s economic profitability over time, as shown in Equation (16).
where i = is the discount rate; j = is the generic period (j = 0 to j = n), covering the entire cash flow; FCj = is a generic flow for t = (0…n) that can be positive (inflows) or negative (outflows); NPV = (i) is the net present value discounted at a rate I; n = is the number of periods of the flow; i0 = is the initial investment.
The Internal Rate of Return (IRR) corresponds to the interest rate that, at a given point in time, equates the present value of inflows (receipts) with the present value of expected cash outflows (payments) [
24], as per Equation (17).
where FCt = present value of cash inflows; FC0 = initial investment; r = discount rate; t = discount period for each cash inflow; n = discount period for the last cash flow.
Additionally, a sensitivity analysis was used to assess the robustness of economic results in the face of possible variations in the production system. This approach makes it possible to identify which factors exert the greatest influence on economic viability indicators, contributing to a more comprehensive assessment of the risks associated with the investment [
25], as per Equation (18).
where
= percentage change in the analyzed economic indicator;
= percentage change in the variable considered
After carrying out the steps described, the data obtained from both the semi-mechanized transplanting system with autopilot and the conventional semi-mechanized transplanting system were properly organized and subjected to comparative analysis. This approach allowed us to evaluate the costs associated with each system, enabling a consistent technical and economic assessment.
3. Results and Discussion
The analysis of the operational costs of semi-mechanized coffee seedling transplantation, with and without the use of autopilot, allowed us to evaluate the impact of precision agriculture on the total operating expenses.
A comparative analysis of data from 2020 and 2025 reveals significant transformations in the cost structure of coffee transplanting systems. In 2020, the operational cost of the autopilot system averaged $204.36/h with a standard deviation of 21.21, exceeding the conventional system, which averaged $180.99/h with a standard deviation of 18.78. In 2025, the average increased to $406.30/h with a standard deviation of 42.17 for autopilot transplanting, while for conventional transplanting, the average was $310.18 with a standard deviation of 32.21. Both scenarios presented a 95% confidence interval.
In 2020, the factor responsible for this difference was labor, with the pilot system showing a higher cost of $21.35/h (p < 0.001), while depreciation did not differ significantly between the systems (difference of $2.04/h; p > 0.05). However, by 2025, a complete reversal was observed: depreciation became the dominant component (difference of $88.58/h; p < 0.001), while the difference in labor costs decreased to $7.48/h.
The ANOVA confirmed a significant interaction between year and system (p < 0.001), demonstrating that the comparative advantage between the technologies changed substantially during the period. This change likely reflects the real appreciation of the autopilot and efficiency gains in operation that reduced the need for manual labor.
Fixed costs represented the smallest portion of the investment in both systems, while the average cost of autopilot operation and conventional operation was
$38,754.22 and
$26,200.75, respectively, [
26]; this is mainly due to the initial, or acquisition, cost of the equipment used. This difference reflected the higher cost of autopilot operation, showing that the investment in technology was the main component that increased the cost of operation. The interest and insurance rates are 9.29% and 8.20% for the autopilot system and 6.28% and 5.17% for the conventional system, respectively. Interest rates and insurance followed the depreciation trend, increasing the value of fixed costs due to the investment made.
The high depreciation and interest costs may stem from the initial values used in the calculation, which considered the price of new equipment [
22]. For the system with autopilot, the fixed costs were higher than those of the conventional transplanting system, due to the 10% design fee included in the initial price of the tractor. The difference between the interest rates and insurance values of the equipment used highlights that the use of autopilot in agricultural operations increased the costs of coffee transplanting compared to conventional operations. This resulted in higher expenses, considering the acquisition cost of the new equipment [
27]. However, for both types of operation, the accommodation costs remained stable, as there were no variations in construction costs with the same structure for both scenarios.
According to [
28], this equipment can be used at various stages of cultivation; however, hiring a specialist significantly increases the operational costs of agricultural activity.
Variable costs showed significant variations between operations, representing a larger percentage of the system’s hourly cost, at 83.99% for autopilot operation and 57.39% for conventional transplanting. Labor costs for machine operators and farmhands re-sponsible for planting coffee seedlings were based on employment records, where the machine operator received $294.09 per month and the other assistants $196.06 per month. For the labor calculations in this study, machine operators received $2.43/h and the other assistants $1.62/h. Only the labor cost for the autopilot operation showed a higher rate compared to the conventional operation, due to the professional hired to design the planting lines. The contract price for this professional was $382.53/h.
It is worth highlighting that the high hourly labor cost of the system with the aid of autopilot stems from hiring a professional specialized in precision agriculture for planning the planting lines. Although this cost is significant in the first year of technology implementation, it represents a non-recurring initial investment, since the design of this study can be reused in subsequent harvests or in areas with similar topographical characteristics.
Table 6 presents a detailed breakdown of the labor costs for each system for the year 2020.
The remaining variable costs remained stable when compared between the two operations. Fuel costs were calculated based on the price of diesel fuel in 2020, which was $0.72 per liter. For maintenance costs, the agricultural tractor and the manual furrowing/transplanting platform were considered, totaling $28.14 per hour. In that year, the lubricant price used as the basis for this study’s calculations was $2.28 per liter.
However, despite the stability shown in the other costs, maintenance and lubricants accounted for a large share in the composition of variable costs, corroborating the results found by [
20,
29].
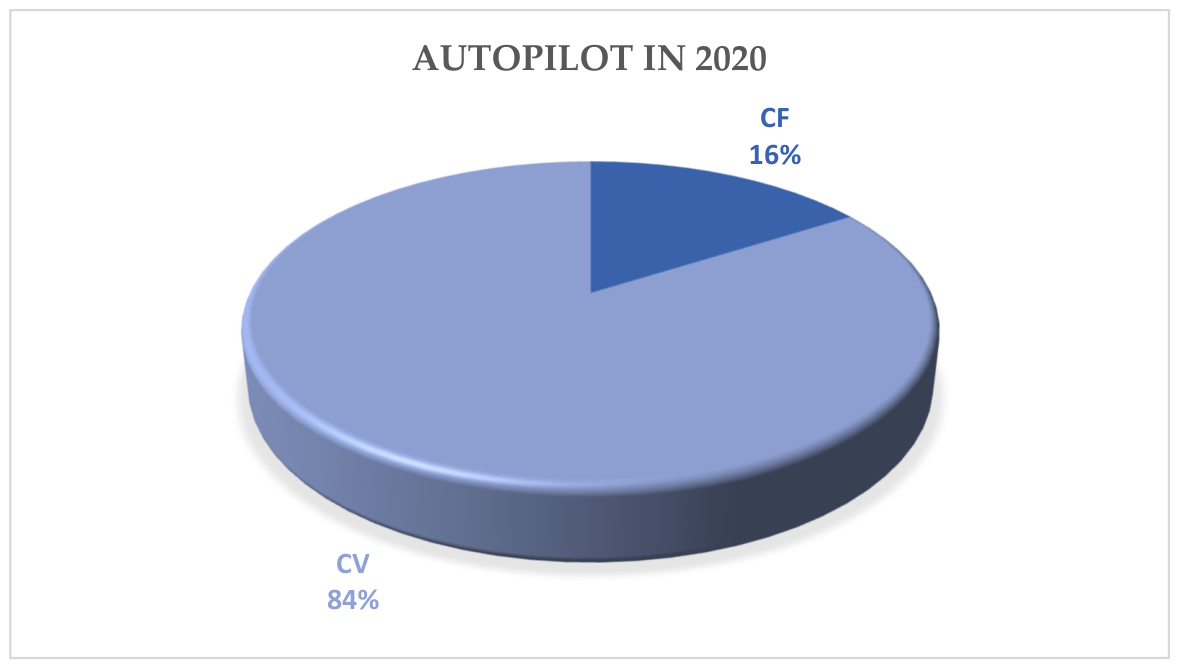
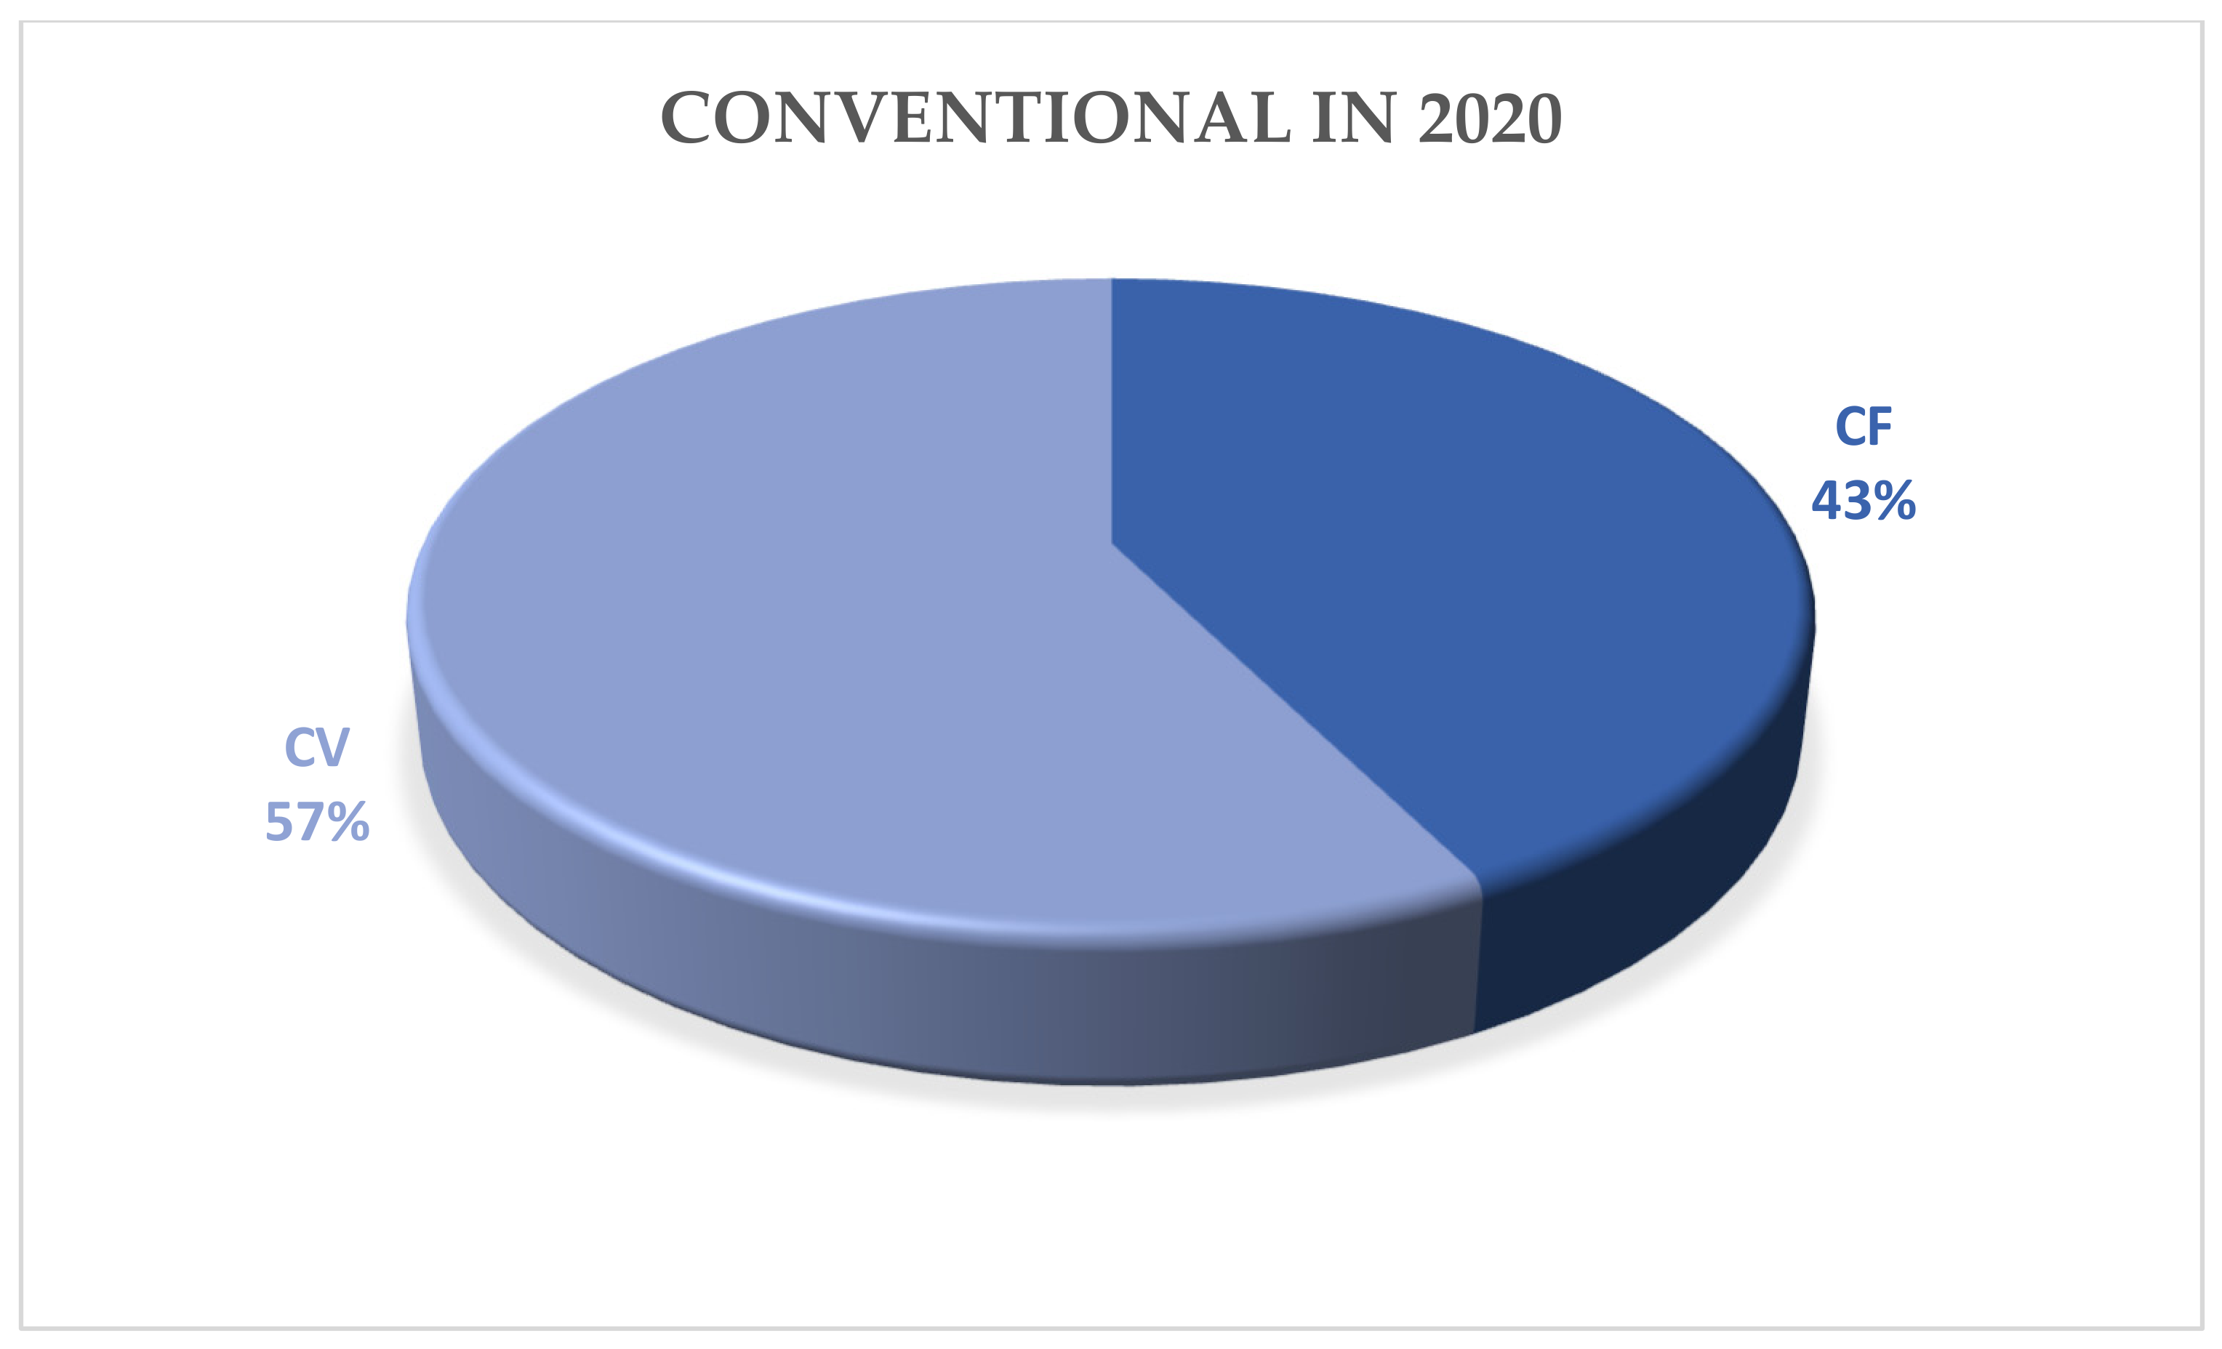
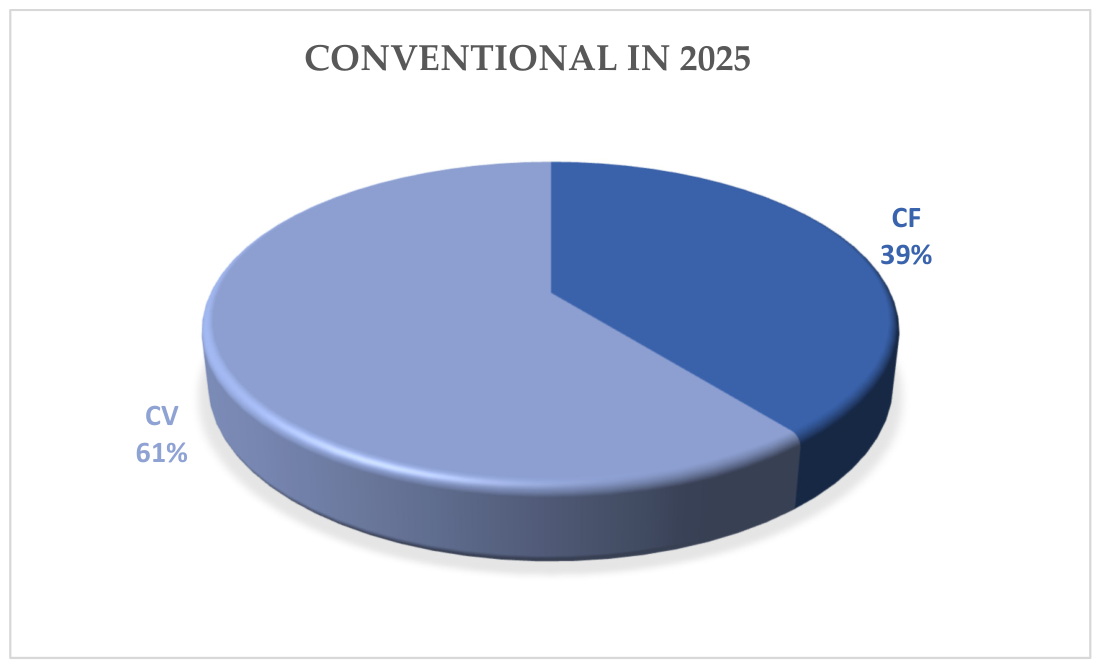
The proportion of fixed costs relative to total hourly cost differs substantially between the systems due to the magnitude of variable costs. In the autopilot system, the high cost of skilled labor increases total variable costs, thus reducing the relative weight of fixed costs (15.97% in 2020 and 26.92% in 2025). On the other hand, in the conventional system, lower variable costs result in a greater contribution of fixed costs to the total (42.57% in 2020 and 39.24% in 2025). This relationship is expressed mathematically as
Therefore, the percentage difference between the tables reflects the distinct cost structures of the two transplant systems. In terms of total costs, transplanting with autopilot was superior to transplanting with a conventional system, due to the greater investment in equipment and skilled labor required to design the planting lines. The comparative analysis between the two conditions highlighted the impact of technology on the economic viability of the operation, as shown in
Table 7 and
Table 8.
Thus, the percentages of total costs for the autopilot-assisted system are presented in
Figure 5, and the total costs for the conventional semi-mechanized system are presented in
Figure 6.
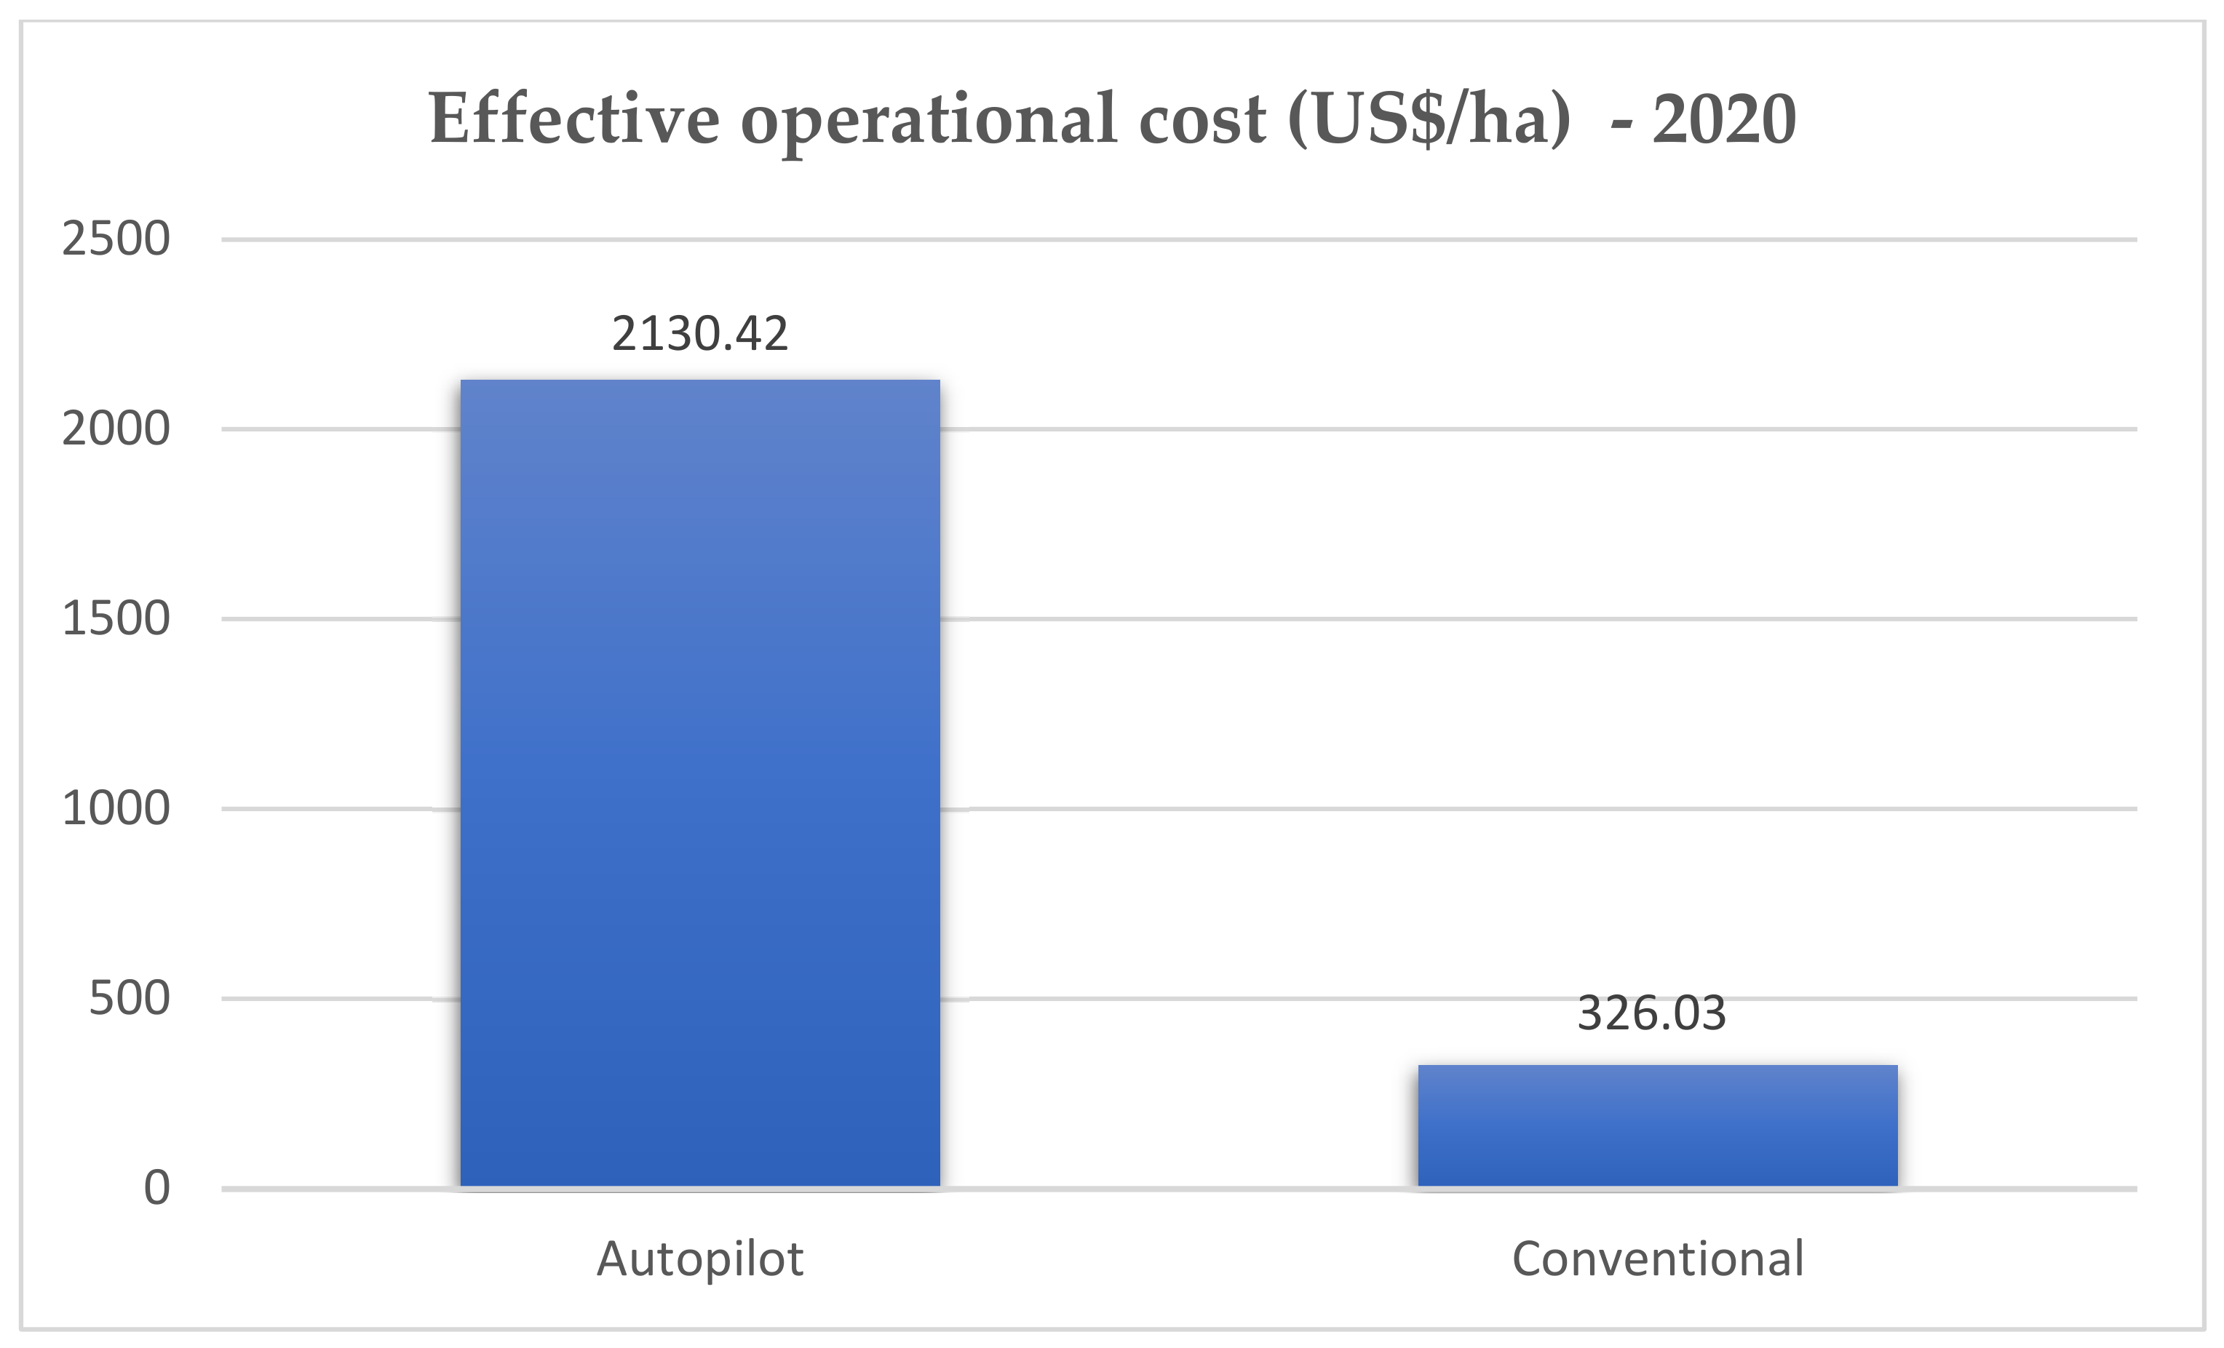
The effective operational cost of transplanting using autopilot was calculated by adding the costs of fuel, lubricant, labor, and maintenance, and dividing by the effective field capacity of the operation, of 0.212 ha/h. The result was US
$2130.42 per hectare transplanted, while for the conventional semi-mechanized transplanting operation, the effective operational cost was US
$326.03 per hectare transplanted when using the same requirements as the previous operation, as shown in
Figure 7. According to [
30], operational cost expresses the relationship between cost and work capacity or productivity.
According to [
14], proper equipment maintenance can lead to increased work efficiency due to shorter downtimes and reduced interruptions for troubleshooting, and its costs make up a large portion of operational costs, which can also be attributed to the intensive use of machines, serving as a parameter for their rational use or replacement.
These calculated data refer to the transplanting costs incurred in 2020; however, this data, when adjusted to current year values, shows a slight increase due to the high inflation in the country over the years. It is noted that there was an increase in costs for all equipment used, except for the cost of the autopilot, which, in the previous scenario in which the operation was performed, alone increased the costs of the semi-mechanized transplanting operation.
In this case, the same equipment was used, which, over the years, has lost some of its initial acquisition value due to the launch of more advanced technologies applied to autopilot, including greater precision in current equipment. Investing in embedded technology in the field, in the long term, brings a greater financial return to the producer; however, the use of older technology for agricultural work can be an alternative for small producers seeking more viable options for applying precision agriculture on their properties.
In the previously conducted simulation, which introduced a conventional semi-mechanized transplanting operation scenario for comparison with autopilot-assisted transplanting, lower values were obtained than those calculated for the autopilot-assisted agricultural operation. The trend in the share of variable costs followed the trend of the previous analysis, being 73.04% for the autopilot transplanting operation and 60.72% for the conventional operation.
Table 9 presents a detailed breakdown of the labor costs for each system for the year 2025.
In this particular case, when values were updated to the current year, the costs of conventional transplanting increased, as expected, due to the rise in the prices of the machinery and implements used. Average values of
$46,186.32 were obtained for the operation with the aid of autopilot and
$30,160.11 for the conventional semi-mechanized transplanting operation.
Table 10 and
Table 11 show updated values for the transplanting operations if they were carried out in the current year.
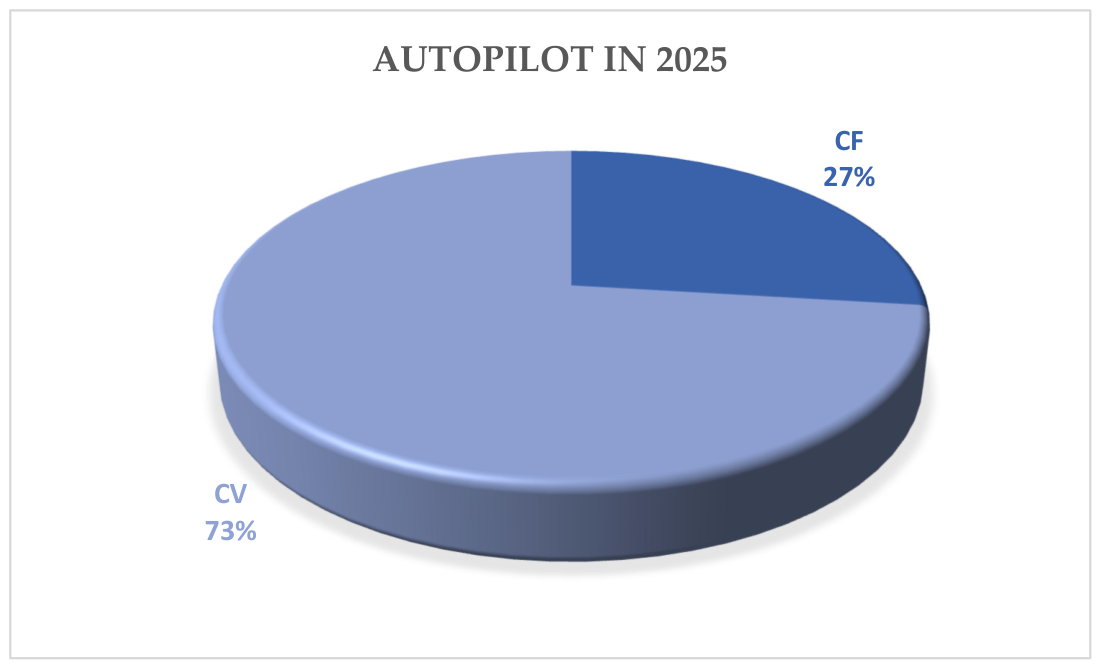
Thus, the updated total cost percentages for the autopilot-assisted system are shown in
Figure 8, and the updated total costs for the conventional semi-mechanized system are shown in
Figure 9.
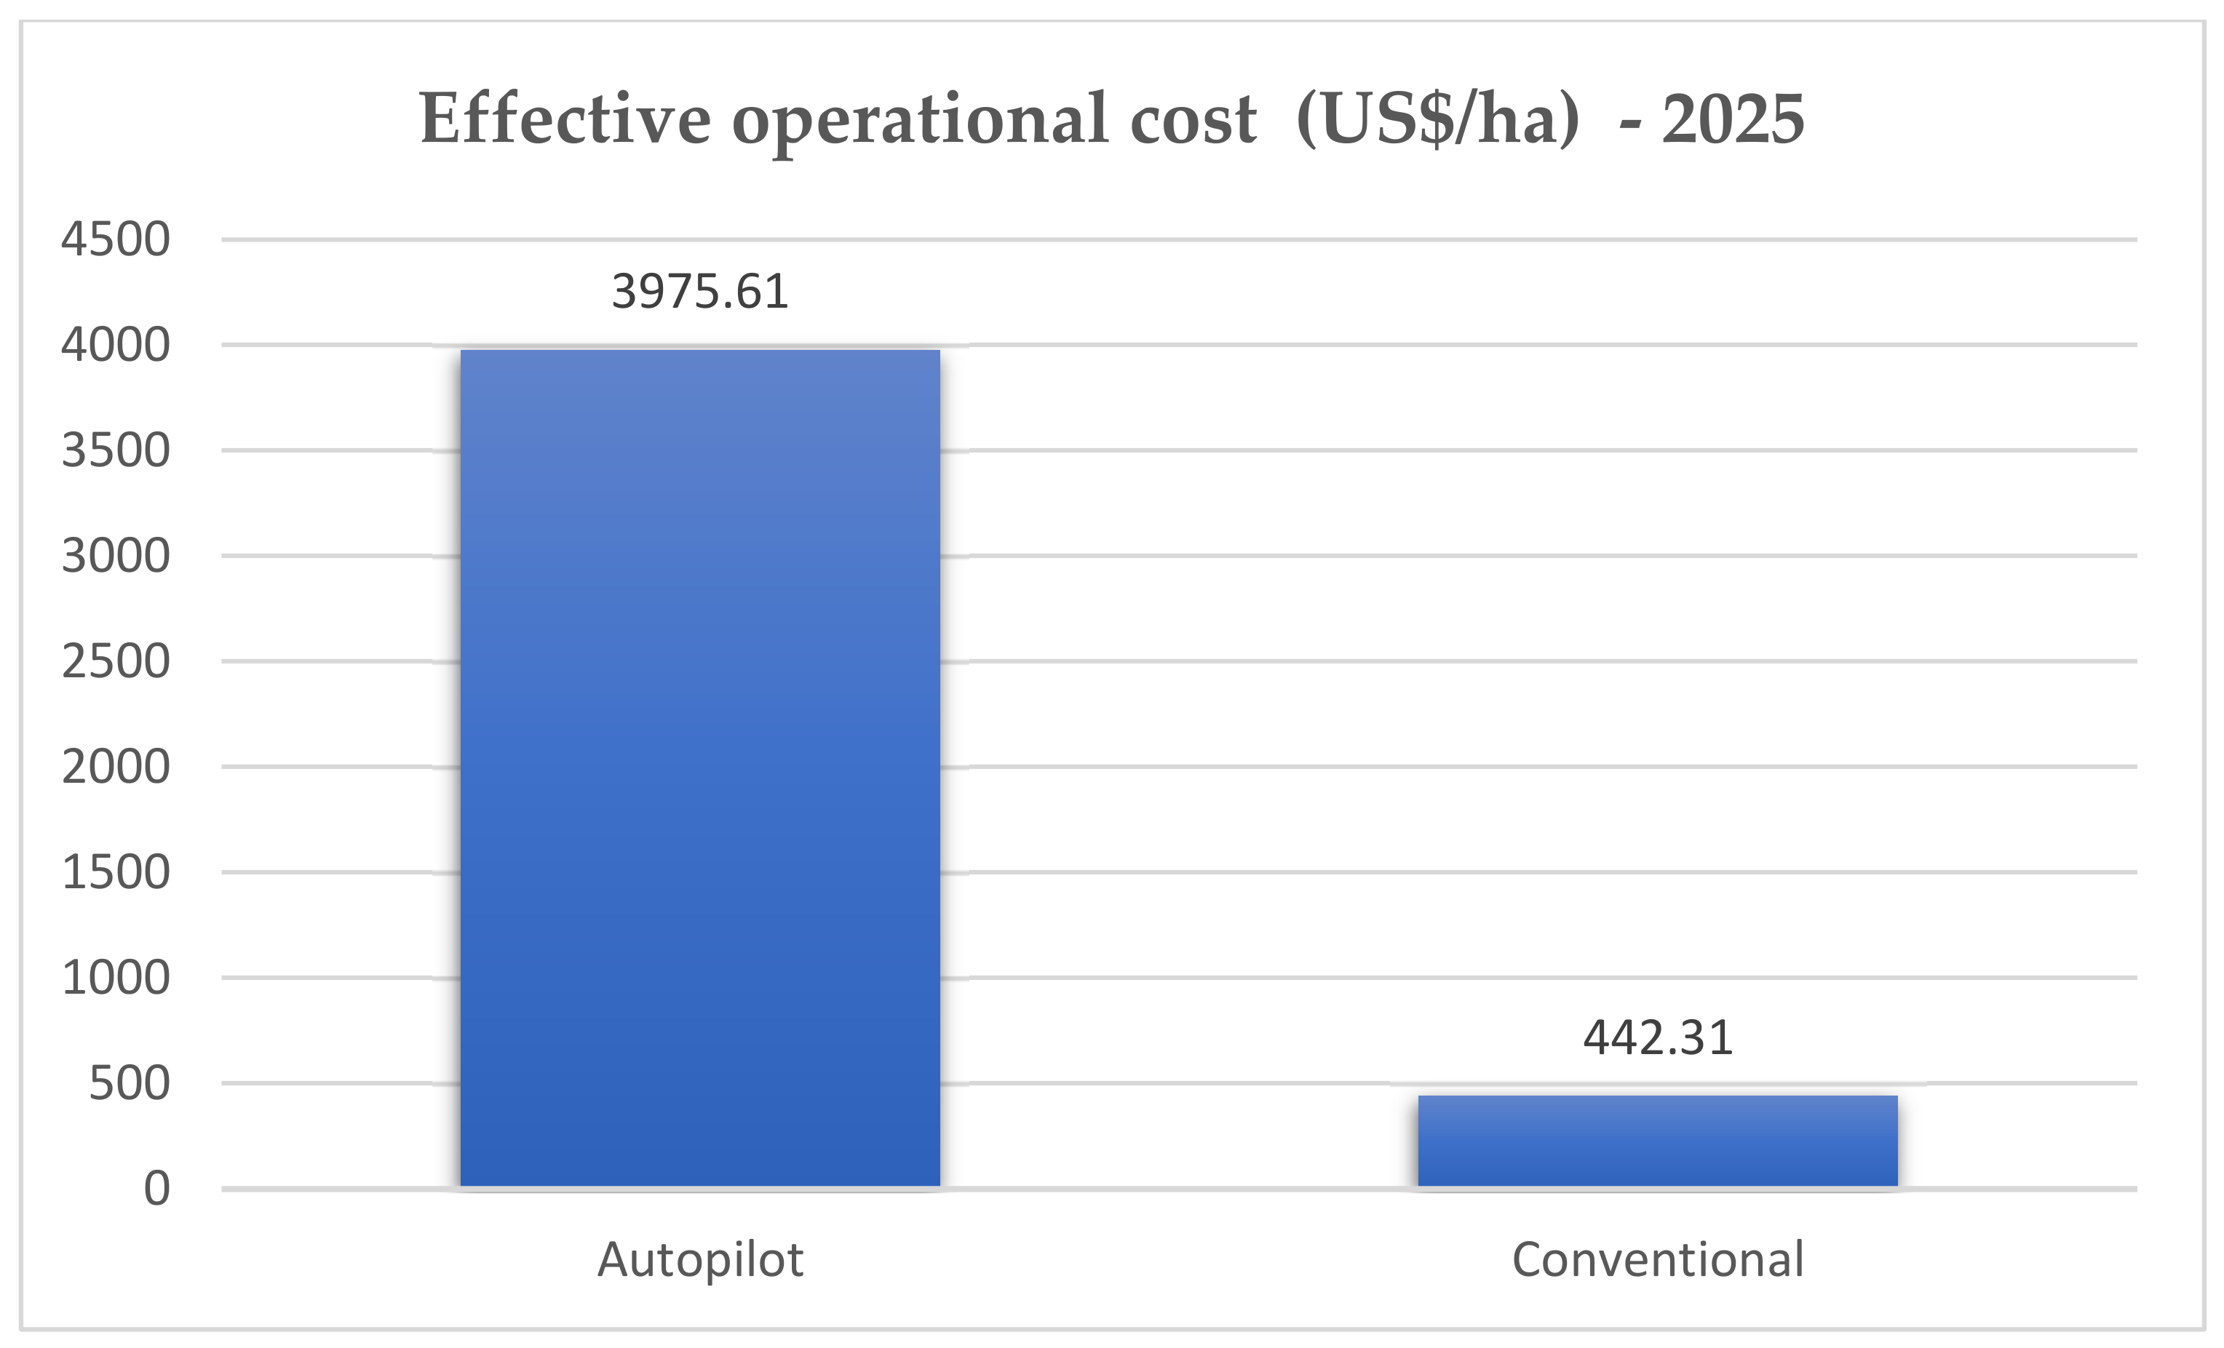
The effective operational cost of transplanting using autopilot, with the updated value, was
$3975.61 per hectare, while for conventional transplanting it was
$442.31 per hectare, as shown in
Figure 10. These values corroborate the trend from the previous analysis that, with the application of precision agriculture, there is a tendency for increased operational costs in a coffee transplanting operation.
Subsequently, after applying the impact of inflation, it was noted that the semi-mechanized transplanting system with autopilot assistance showed an increase of 20.47% in relation to the years 2020 to 2025. Meanwhile, the conventional semi-mechanized transplanting system showed an increase of 16.55% from 2020 to 2025.
Analyzing the net present value, it was noted that for the autopilot transplanting system to be superior to the conventional transplanting system, it generated an annual cash increase of over $6,728,632. Therefore, the use of autopilot in transplanting provided rural management with assistance in decision-making regarding the application of technology in other areas intended for coffee transplanting and sustainability in its operations, ensuring that new projects bring the same profit.
The price of a sack of coffee was a key variable in determining the economic viability of the automated system compared to conventional semi-mechanized planting. This is because the productivity gain is directly converted into revenue. The price of coffee and the Net Present Value of the investment for the eight-hectare area analyzed showed a positive linear relationship, with a slope of approximately $79,588.01 for every $187.26 increase in the price per sack.
In comparison with the study conducted by [
31], the results of the present study revealed substantial differences in the impact of automatic steering technology on agriculture. According to [
32], the cost and reliability of this equipment are well defined, making it possible to estimate the cost of equipment for field application.
According to Oliveira et al. [
28], the transition from a traditional farming system to precision agriculture should take into account the range of existing opportunities and the different levels of technological sophistication available on the market. Therefore, farmers wishing to migrate to this system should consider several relevant aspects, such as acquiring machinery and implements with this technology and integrating them into their farm, adapting existing machinery on the property, and should consider the quantity and models of available machinery and implements, as well as the size of the enterprise itself (considering the productive area, the production system, the crop) and the quality of the existing workforce.
Break-even point analysis, payback period, or return on investment should also be considered. For a return on investment in 1 year, the minimum area required is 5.7 hectares. This result is particularly relevant for small producers, as it demonstrates that even properties with reduced area can benefit from the technology. The return on investment period is extremely favorable: 8.6 months in the simple calculation and 9.6 months when discounted at a rate of 12% per year.
This result places autopilot among the fastest-returning investments in coffee farming. Even in a conservative scenario, considering only direct benefits and excluding productivity gains, the payback period remains attractive, at 35.6 months.
The cumulative Return on Investment (ROI) over 5 years reaches 599%, meaning that each dollar invested returns approximately US$1.31 at the end of the period. In annualized terms, the ROI is 47.5% per year, a substantially higher value than the investment alternatives available in the financial market. The calculated Internal Rate of Return (IRR) of 139.6% per year confirms the excellent profitability of the project, being more than 11 times higher than the adopted Minimum Attractive Rate of Return (MARR) of 12%.
For this study, the Internal Rate of Return was 89.7%, meaning there was a growth in the capital invested in the project. Therefore, the use of autopilot drastically reduces operational costs, with a return on investment of thirteen months, providing the security of minimal risk for the technology investment. From a practical standpoint, the results suggest that adopting autopilot is more justifiable on medium and large farms, where the scale of production maximizes the benefits of its use. According to [
33], the appropriate use of precision agriculture technology should be based on economic analyses that demonstrate its benefits.
In small areas, the additional cost of depreciation may not be offset, making the conventional system more viable. Therefore, the decision to use technology should consider not only the direct cost, but also the prospect of gains in precision, stand quality, and the sustainability of coffee production.
According to [
28], the adoption of precision agriculture is not restricted to highly sophisticated equipment and expensive investments; any property (small, medium, and large) can implement precision agriculture in all stages of agricultural production or in parts of it.
Precision agriculture develops with the support of technological and management advancements [
34]. Therefore, there is a promising trend in agriculture to benefit from advances based on economic analysis, which has great potential to transform the economics of coffee production.
The advantage of using autonomous equipment would be greater for crops and production systems that require more field operations and more labor [
13]. In this case, the application of autopilot to semi-mechanized coffee transplanting is viable due to the number of people involved in the operation. Considering future applications of the equipment in transplanting in other areas within the same rural area in which this study was conducted, the operation may become more profitable due to the depreciation of the equipment over the years. However, its initial implementation in coffee farming is a high cost–benefit operation.



 ,
,