Skip to Content
AgriEngineeringAgriEngineering
  • Article
  • Open Access

5 April 2026

Assessing the Viability of Chitosan-Based Films Reinforced with Cellulose Nanofibers from Salicornia ramosissima Agro-Industrial By-Product for Food Packaging


,
,
,
,
,
,
and
1
MED—Mediterranean Institute for Agriculture, Environment and Development & CHANGE—Global Change and Sustainability Institute, Faculty of Sciences and Technology, Universidade do Algarve, Campus de Gambelas, 8005-139 Faro, Portugal
2
LAQV–REQUIMTE—Associated Laboratory for Green Chemistry of the Network of Chemistry and Technology, Department of Chemistry, Universidade de Aveiro, 3810-193 Aveiro, Portugal
3
GreenCoLab—Associação Oceano Verde, Universidade do Algarve, Campus de Gambelas, 8005-139 Faro, Portugal
4
ESIROI—Ecole Supérieure d’Ingénieurs Réunion Océan Indien, Université de La Réunion, Campus du Moufia, 40 Ave De Soweto, 97410 Saint Pierre, La Réunion, France

Abstract

This study investigates the valorisation of Salicornia ramosissima agro-industrial by-product by using cellulose nanofibers (CNFs) extracted from this halophyte to reinforce chitosan-based films. The physical, mechanical, and thermal properties of chitosan films containing 0% (control), 1%, and 2% (w/w) CNF were evaluated. Films were produced by solvent casting with glycerol as a plasticiser. At the 2% CNF concentration, films exhibited a reduced moisture content and increased solubility in aqueous solutions. The water vapour transmission rate (WVTR) decreased as CNF content increased under constant humidity but increased at higher temperature and humidity. Control films were more transparent, yet CNF-reinforced films had higher tensile strength and Young’s modulus, reflecting greater stiffness. Maximum elongation at break decreased markedly with the addition of CNFs. SEM revealed that reinforced films had more heterogeneous, rougher surfaces, particularly at 2% CNF. Thermogravimetric analysis showed that 2% CNF adversely affected the thermal stability of the chitosan film. ATR-FTIR spectra indicated that CNF reinforcement protected against UV-induced degradation. Degradability tests in soil and seawater confirmed that the chitosan–CNF mixture preserved degradability, especially at 1% CNF. These findings demonstrate that reinforcing chitosan-based films with CNFs from S. ramosissima can improve functional properties and suggest the potential of this approach for biomaterials development in food packaging applications.

1. Introduction

Environmental concerns and resource depletion have intensified the search for sustainable alternatives to conventional plastics, particularly in food packaging, where single-use petroleum-based materials still dominate despite increasing regulation and circular economy initiatives [1,2]. Bio-based and biodegradable polymers such as chitosan have emerged as promising candidates to reduce reliance on fossil resources while mitigating plastic pollution and end-of-life impacts [3,4,5,6,7].
Chitosan is a renewable polysaccharide obtained by deacetylation of chitin and is attractive for packaging applications owing to its film-forming ability, biocompatibility, biodegradability and inherent antimicrobial activity, although its use is limited by poor water resistance, suboptimal mechanical performance and challenging processing compared with conventional plastics [3,8]. To overcome these drawbacks, the incorporation of cellulose nanofibers (CNFs) has been widely explored, as CNFs can reinforce chitosan-based matrices and improve mechanical and barrier properties while maintaining a fully bio-based and biodegradable profile [7,9,10,11].
In parallel, recent research has highlighted the potential of combining chitosan and nanocellulose not only to enhance strength and barrier performance but also to introduce multifunctional attributes, such as antioxidant and antibacterial activity, that can extend food shelf life and improve safety [9,10,12,13,14]. These advances illustrate that the design of next-generation food packaging must integrate mechanical, barrier and active functions with environmental criteria, including bio-based feedstocks and controlled biodegradability in relevant disposal scenarios.
The circular bioeconomy has taken on a central role in the current landscape, driving growing interest in strategies that promote the recovery and valorisation of organic residues and by-products for the development of sustainable packaging materials. Numerous studies have explored residues from the fruit and vegetable industry (peel, pulp, seeds and pomace) to obtain biopolymers and biodegradable films, often with active (antioxidant and antimicrobial) properties suitable for food preservation [15,16,17,18]. Examples include films and edible coatings produced from fruit and vegetable residues for fresh-food packaging, biopolymers derived from agro-industrial by-products applied in functional and active packaging, and materials based on polysaccharides and proteins extracted from agricultural co-products designed to partially or fully replace conventional active pack plastics in packaging systems [19,20,21,22].
Following this approach, agro-industrial residues have gained attention as alternative lignocellulosic feedstocks for nanocellulose production [23,24,25,26,27,28]. Salicornia ramosissima by-products (stems and roots) generated during greenhouse cultivation for human consumption have been proposed as a promising cellulose source for CNF isolation, with enzymatic pretreatments offering milder, more environmentally compatible processing routes than conventional acid-based methods [29]. A previous study demonstrated that CNFs produced from S. ramosissima residues via an enzymatic route exhibited improved structural features and surface charge, making them suitable for use as reinforcing agents in polymeric matrices [30].
Building on this background, the present work investigates chitosan-based films reinforced with CNFs previously obtained enzymatically from S. ramosissima agro-industrial by-products [29], with the dual objective of valorising an underused residue stream and enhancing the functional properties of packaging materials. Specifically, we evaluate the influence of CNF loading on the physicochemical, mechanical, barrier, optical and morphological properties of the films, as well as their degradability in soil and seawater under controlled conditions, to assess the viability of these bio-based composites for sustainable food packaging applications.

2. Materials and Methods

2.1. Chemicals

Chitosan with high molecular weight (310,000–375,000 g mol−1) and a deacetylation degree of >75 g kg−1, was provided by Sigma Aldrich (Darmstadt, Germany). Glycerol (MW = 92.10 g mol−1) was obtained from PanReac AppliChem (Barcelona, Spain). Acetic acid glacial was obtained from Fisher Scientific (Hampton, NH, USA).

2.2. Cellulose Nanofibers from S. ramosissima By-Product

Cellulose nanofibers (CNFs) from the agro-industrial by-product of S. ramosissima (parts of stems and roots) were produced at laboratory scale via the enzymatic isolation route previously proposed and optimised for this feedstock [29]. Briefly, the by-product generated during greenhouse cultivation was collected, washed, dried and milled to obtain a lignocellulosic powder, which was subsequently subjected to ethanol extraction to remove low-molecular-weight extractives, followed by alkaline treatment and bleaching to solubilise hemicelluloses, delignify the material and enrich the cellulose fraction. The resulting cellulose-rich pulp was then hydrolysed using a two-step enzymatic process involving xylanase and cellulase under controlled pH, temperature and residence time, after which the suspension was washed, concentrated and dried to obtain CNFs with nanoscale diameters and a high aspect ratio. Full methodological details, including reagent concentrations, temperatures, reaction times, enzyme dosages and the morphological, structural and physicochemical characterisation of the CNFs produced by both acid and enzymatic routes, are reported by Lima et al. [29] in the previous publication.

2.3. Production of Chitosan-Based Films

Chitosan-based films reinforced with nanofibers were prepared using the solvent casting technique. The CNF loadings of 1 and 2% (w/v) were selected based on a preliminary experimental design in which a wider range of nanofiber concentrations had been screened for their effects on the physical and mechanical properties of chitosan films. Nanofibers derived from S. ramosissima by-product were added to a 1% acetic acid aqueous solution (v/v) at 1% and 2% (w/v), calculated as gram of CNFs per 100 mL of acetic acid solution. This pre-dispersion step in the less viscous acetic acid solution was used to promote deagglomeration and uniform wetting of the nanofibers before chitosan dissolution, thereby facilitating a more homogeneous distribution of CNF in the final film-forming solution. The mixture was homogenised using an Ultra-Turrax (T25—Janke & Kunkel, IKA-Labortechnik, Staufen, Germany) at 10,000 rpm for 5 min. Subsequently, 2% chitosan (w/v), also expressed as gram of chitosan per 100 mL of acetic acid solution, was added to the mixture and immediately homogenised with an Ultra-Turrax at 20.000 rpm for 5 min. The mixture was then filtered through cheesecloth (non-woven) to remove insoluble particles. The solution was kept at room temperature for 60 min.
The chitosan film-forming solution was pre-warmed on a hot plate magnetic stirrer (ARE, VELP Scientifica, Usmate Velate, MB, Italy) at 45 °C, and glycerol 99.5% (PanReac AppliChem, Barcelona, Spain) was added as a plasticizer at a level of 0.5 mL g−1 to the chitosan solution. The mixture was stirred for 30 min. After cooling to room temperature, the solution was degassed in an ultrasonic bath (Sonorex Super—RK510, Bandelin Electronic, Berlin, Germany) for 10 min to remove the bubbles formed during the process. Then, 25 mL of the solution was cast onto plastic Petri dishes (Ø = 90 mm) and dried for 48 h in an oven at 25 °C. The dried films were stored in a dark desiccator under controlled relative humidity (~55%) at room temperature (±25 °C) until further analysis.
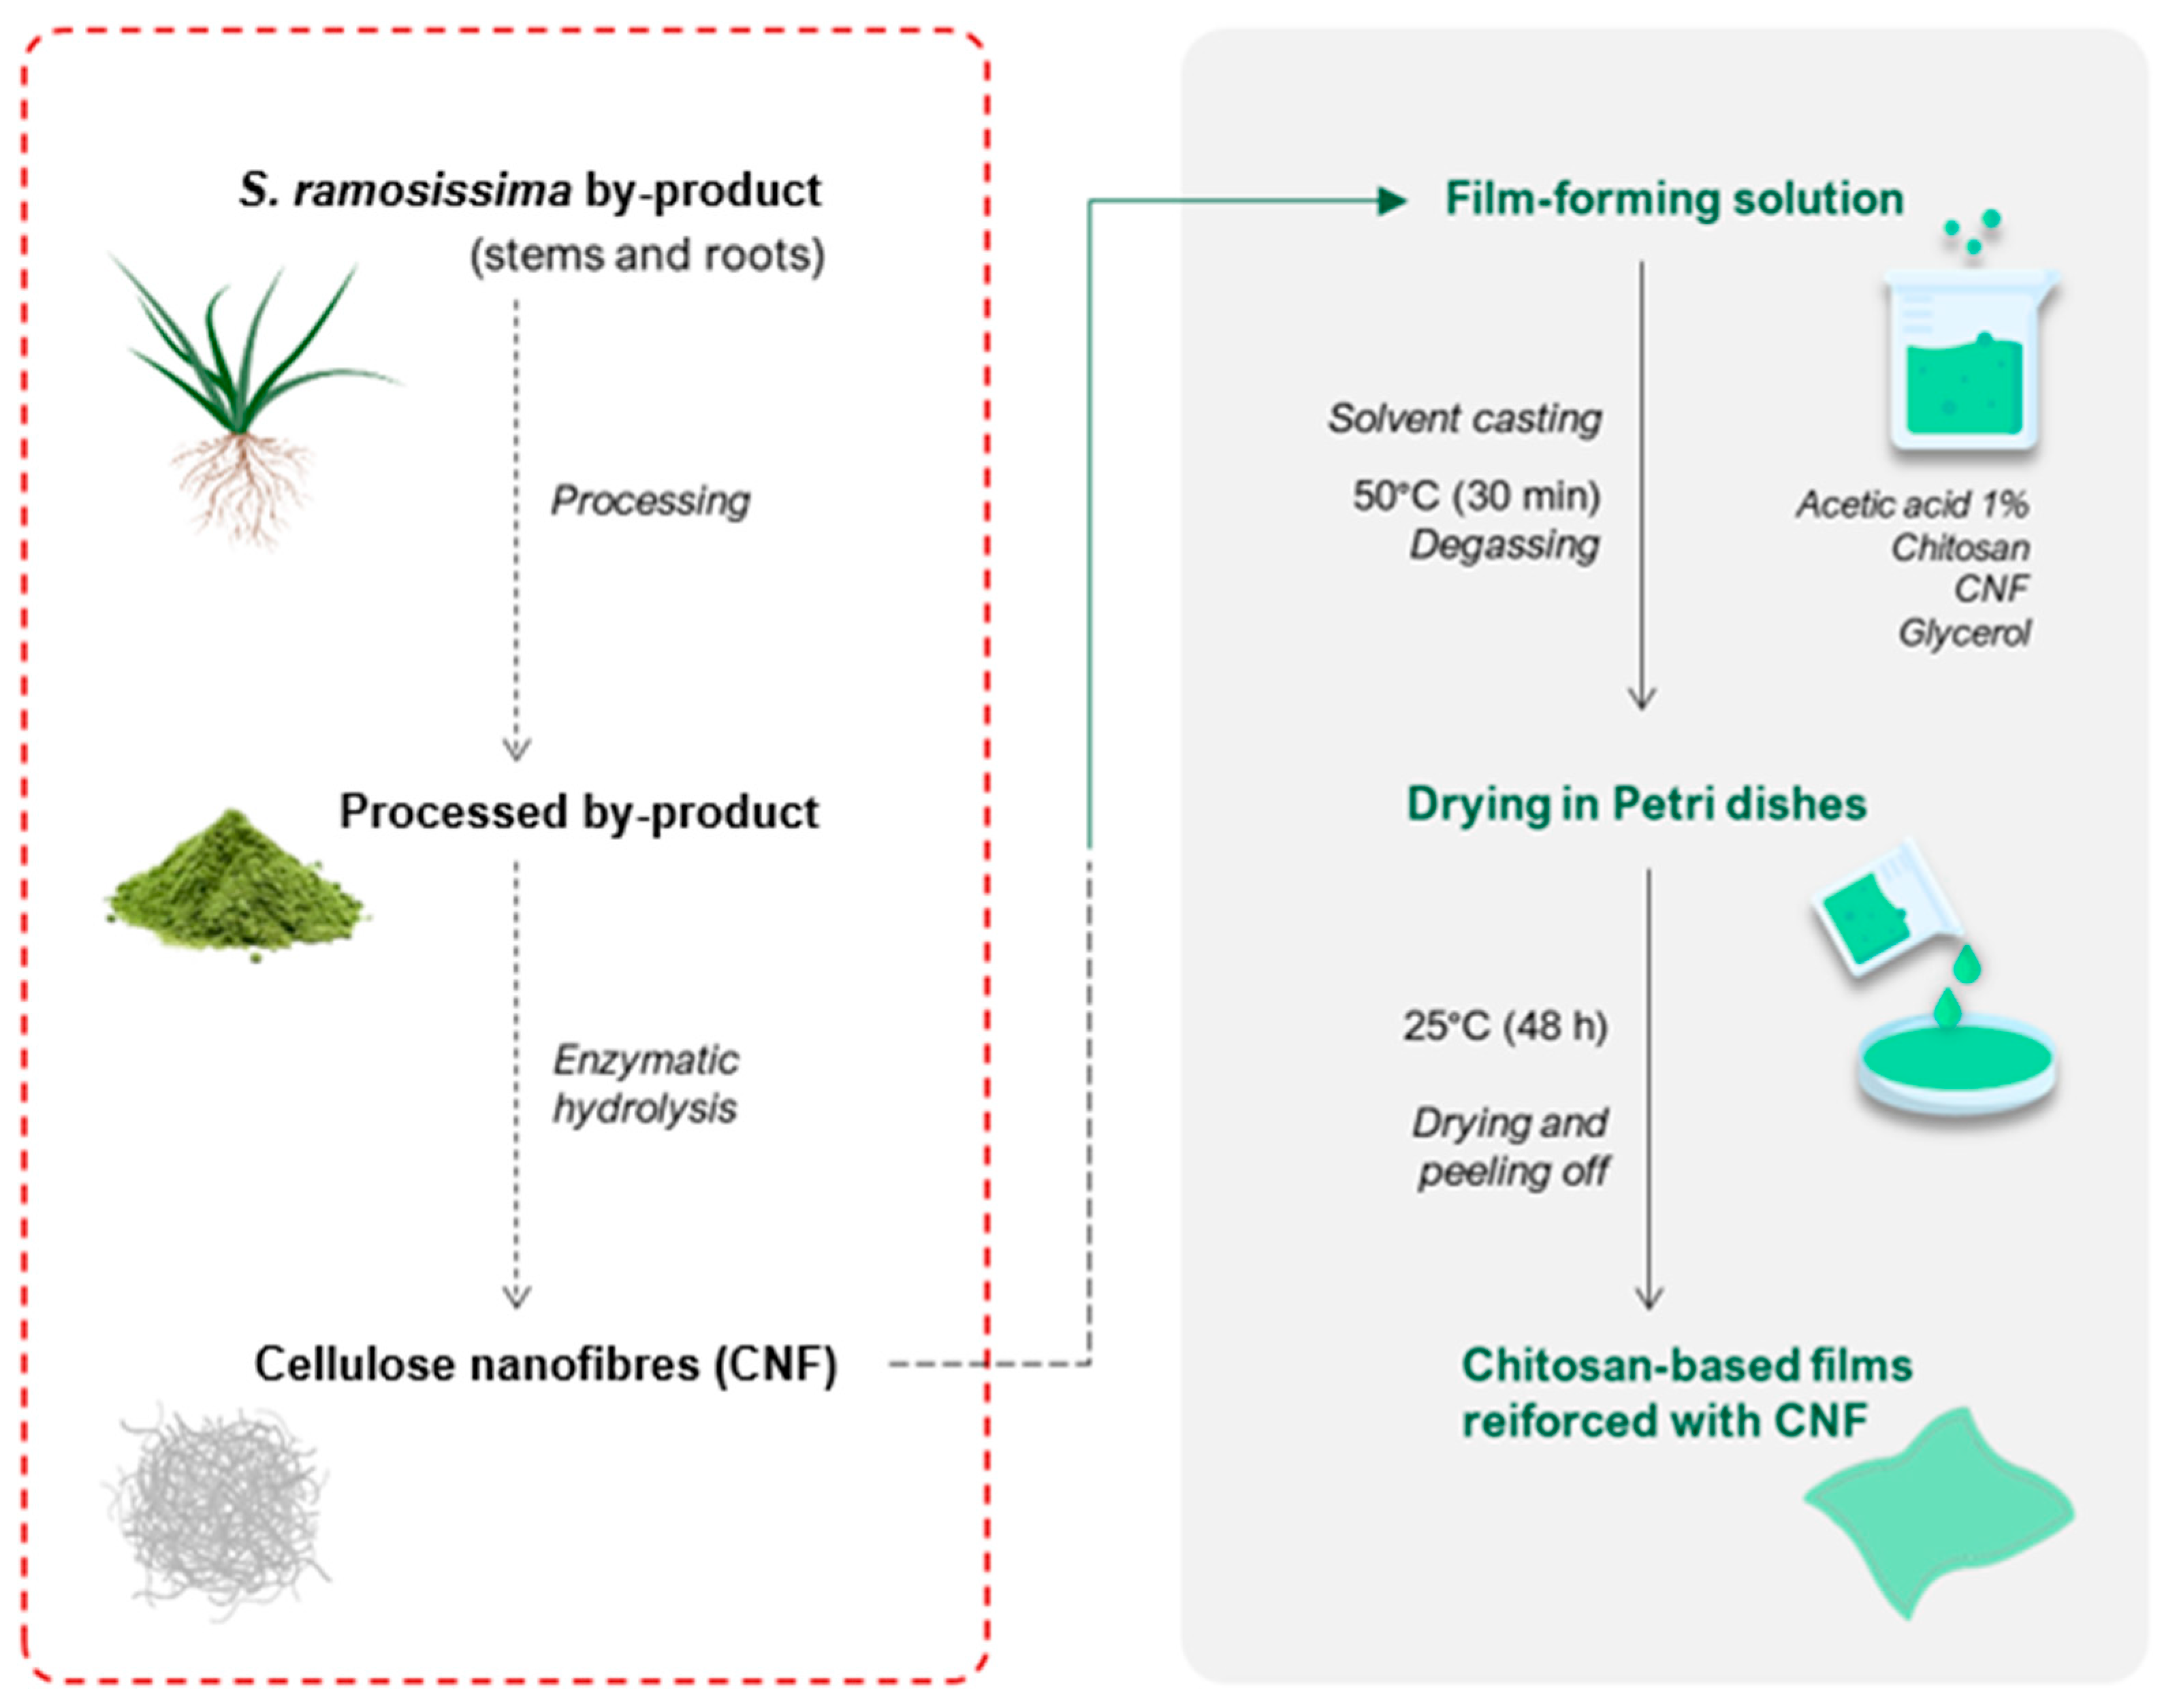
As a control, chitosan-based films were prepared without the addition of the nanofibers, following the same steps described above. The procedures used to produce chitosan-based films reinforced with CNFs are represented in Figure 1.
Figure 1. Solvent casting method for manufacturing chitosan-based films.

2.4. Chitosan-Based Films Characterisation

2.4.1. Optical Properties

A spectrophotometer (PCE-CSM10, PCE Instruments, Stretford, England) was used to measure the CIELab colour parameters and opacity. For calibration and as the background before measuring luminosity (L*), a standard white tile (EU certified; L* = 84.67, a* = −0.55, b* = −0.68) was employed. The luminosity values ranged from 0 (black) to 100 (white), while the chromatic coordinate (a*) indicated green for negative values and red for positive values, and the chromatic coordinate (b*) indicated blue for negative values and yellow for positive values. For each film three different points were analysed. These colour parameters were used to calculate the total colour difference (ΔE) using Equation (1):
E   =   L * 2 + a * 2 + b * 2

2.4.2. Moisture Content

The film samples were cut into square pieces (4 cm2), weighed and dried at 105 °C for 24 h. The weight loss of the sample was determined, and moisture content was calculated using the following Equation (2):
Moisture   content   %   =   ( M i M f ) M i · 100
where Mi and Mf are, respectively, the initial and final mass of the samples. All samples were evaluated in triplicate.

2.4.3. Solubility in Aqueous Medium

To determine the solubility in the aqueous medium, the same dried samples previously obtained for the moisture determination were immersed in 50 mL of water previously deionized and gently shaken at room temperature (±25 °C) for 24 h. Then, the insoluble films were filtered and dried in a drying oven (105 °C, 24 h) and weighed after 30 min in a desiccator for cooling. The film’s solubility was determined as weight loss percentage using Equation (2). Three replicates were performed for each film condition.

2.4.4. Films Thickness

Six thickness measurements were randomly taken for each sample at different points with a bench micrometre (MTS Adamel Lhomargy—model MI2, Saint-Baldoph, Savoie, France). Mean values were subsequently used to calculate water vapour transmission rate (WVTR).

2.4.5. Water Vapour Transmission Rate (WVTR)

The WVTR of chitosan-based films reinforced with CNFs (1 and 2%) and control film was determined gravimetrically, using the ASTM E96/E96M-15 [31] standard method, with some modifications. The permeation cells were filled with 50 g of dried silica gel and sealed with films on the top of the cells with silicone glue. The cells were weighed using an analytical scale (ACS 200-4, Kern & Sohn, Balingen, Germany) and placed in desiccators with three saturated aqueous solutions of potassium carbonate, sodium chloride and potassium sulphate, establishing environments with relative humidities of approximately 45, 75 and 95%RH, respectively. Subsequently, the cells and their respective replicates were placed in six temperature-controlled chambers set at 5, 10, 15, 25, 30 and 40 °C.
The tests were conducted in triplicate, and moisture loss was recorded over time until reaching steady state. Through linear regression of the linear part of the water absorbed vs. time interval curve WVTR was estimated by divided the obtained slope by the respective area (m2).
Each slope obtained was divided. The Arrhenius equation (Equation (3)) was applied to the experimental data for each condition (%fibre and %RH) to check if the dependence of WVTR on temperature followed this model, based on the correlation coefficients obtained.
WVTR =   WVTR 0 · exp E α r 8.314   · 1 T 1 T ref  
where term r is the activation energy for diffusion, T is the absolute temperature, Tref, is a reference temperature and the constant 8.314 is the ideal gas constant in J K−1 mol−1 [32].
The software STATA version 18.0 (StataCorp LCC, College Station, TX, USA) was used in the data mathematical modelling process.

2.4.6. Diffusion Coefficient D

The most well-known method for diffusion estimation is the time-lag (tlag) method Daynes [33], which is often used because of its simplicity. The film is placed to separate two different environments with known volumes, the upstream and the downstream chambers being the exchanges of gases only occurring through the film. It is based on the partial pressure difference (Dp) with time in the downstream chamber, caused by the gas that diffused through the film from the upstream chamber during that time. Through the film, the gas movement toward the downstream interface is governed by Fick’s first law. Both volumes are initially evacuated to remove any present species; the experiment starts by applying a step pressure increase in the upstream chamber and the resulting pressure rise in the downstream chamber is then monitored as a function of time. As the permeation rate reaches a steady state, an extrapolation of the linear portion of the pressure rise curve to the time coordinate yields tlag, which is a function of the membrane thickness (l) and gas diffusivity in the membrane, therefore measuring the downstream tlag experimentally and knowing l allows for evaluating the diffusion coefficient D in the membrane. As the slope of the linear part of the pressure rise curve is directly proportional to the permeability coefficient (P), this parameter can also be evaluated. Therefore, knowing P and D, the solubility (S) can be obtained from the ratio of P and D (Equation (4)).
S   = P / D
The time-lag method is derived using Fick’s second law of diffusion (Equation (5)) The moisture uptake in a flat sample can be described with the one-dimensional diffusion equation with diffusivity, D (in mm2 s−1) and concentration C (in mg mm−3).
δ C δ t = D δ 2 C δ x 2
The moisture uptake in a flat sample can be described with the one-dimensional diffusion equation with diffusivity D (in mm2 s−1) and concentration C (in mg mm−3); when samples are submitted to an environment with a relative humidity level RH, the moisture will first saturate the surface layers, resulting in a surface concentration Csat. During a diffusion experiment at constant humidity, the moisture slowly penetrates in the sample, but the surface layer concentration remains stable at Csat. With these as the boundary conditions and a uniform concentration C0 as the initial condition, C (x, 0) = C0, and C (0, t) = C1, and C (l, t) = C2, the general solution for the diffusion equation is given by Equation (6) [34,35].
Q t = D C 1 C 2 t l + 2 l π 2 n = 1 C 1 cos n π C 2 n 2 1   exp   ( D n 2 π 2 t l 2 ) + 4 C 0 L π 2 m = 0 1 2 m + 1 2 1   exp   ( D 2 m + 1 2 π 2 t l 2 )
This equation defines how moisture penetrates a sample until it is fully saturated and has a uniform concentration Csat. Though concentration profiles are difficult to obtain, the overall concentration change can be easily obtained by monitoring the samples’ weight differences. Solving Equation (6) the relationship between sample weight and overall concentration (Equation (7)) follows over the sample volume:
m t   =   W L 0 h C x , t d x
The mass change is usually reported relative to the mass at steady state (Equation (8)):
M ( t )   =   m ( t ) m final   =   mass   of   absorbed   water   at   time   t   ( mg / mm 3 ) mass   of   absorbed   at   steady   state   ( m ( ) m ( 0 ) ) mg / mm 3
When steady state is about to be reached, t → ∞, the exponential terms become very small and maybe neglected, allowing for plotting Qt versus t (Equation (9)):
t lag d   =   l 2   6 D d
Based on the plots of the mass change in the absorbent agent (in our case silica gel) as a function of time, it is possible to determine the upstream and downstream time lags, respectively. The time lag (tlag) is directly proportional to the squared thickness (l2) and to the reciprocal of the membrane diffusion coefficient D [33]. Equation (10) and Equation (11) give, respectively, the relationships existing between the upstream (tlagu) and downstream (tlagd) time lags (estimated by the x-intercept of the linear portion of the curves with the time axis).
Q t = D C 1   l t l 2 6 D
t lag u = l 2   3 D u
where l is the membrane thickness, tlagu,d, and Du,d are the upstream and downstream time lags and diffusion coefficients, respectively.

2.4.7. Mechanical Properties

Mechanical properties were evaluated in a texture analyser (CTX AMETEK Brookfield, Middleborough, MA, USA) equipped with tensile grips and a 15 N load cell, according to the ASTM D882-18 standard method [36]. The software Texture Pro V 1.0 Build 19 (AMETEK Brookfield, Middleborough, MA, USA) was used for data processing. All films were cut in strips (80 mm length × 10 mm width), and thickness (±0.001 mm accuracy) was determined using an electronic digital micrometre calliper (Powerfix–Profi+, Wuppertal, Germany) and measuring at least three points along the length of each film strip immediately before the tests. Each strip was placed between the grips, leaving 5 cm2 as the exposed area. The crosshead speed was set at a constant rate of 0.5 mms−1. Tensile strength and elongation at break were determined from stress–strain curves. Young’s modulus was calculated as the slope of the initial linear portion of this curve Equation (12). Six measurements were taken of each sample.
E   = σ / ε
where E represents Young’s modulus, σ is the tensile stress (force per unit area), and ε is the axial strain (deformation).

2.4.8. Morphology Analysis

The microstructure of the films was analysed by scanning electron microscopy (Hitachi, model TM4000, Ibaraki, Japan). The samples were placed on a double-sided carbon adhesive tape previously fixed on aluminium sample holder. SEM micrographs were taken at an acceleration voltage of 5 kV.

2.4.9. Thermal Properties

The thermogravimetric analysis (TGA) was performed according to ASTM E2550-21 standard method [37] to evaluate the thermal stability of the chitosan-based films reinforced with CNF. The measurements were carried out using a simultaneous thermogravimetric analyser (NETZSCH STA 449 F3 Jupiter®, Selb, Germany) using 10–45 mg samples. The samples were placed in an aluminium pan (Al2O3) and heated from 30 to 700 °C at 10 °C min−1 under an inert synthetic air atmosphere. The protective gas used was argon with a flow rate of 20 mL min−1, while the purge gas was nitrogen with a flow rate of 50 mL min−1. The initial and final temperatures of film degradation were determined by extrapolating the beginning of the mass variation and the lowest temperature indicating the completion of the process responsible for the mass variation, respectively.

2.4.10. Infrared Spectroscopy

The attenuated total reflectance–Fourier transform infrared (ATR-FTIR) spectra of films were recorded using a micro-FTIR spectrophotometer (Nicolet iN10, Thermo Scientific, Waltham, MA, USA). For each spectrum, a 16-scan interferogram was collected with a reference frequency of 15,798.67 cm−1, a resolution of 8000 cm−1, and a collection time of 3.12 s. The results used the OMNIC Spectra Software, version 2.2 (Thermo Scientific, Waltham, MA, USA). The mass loss of the films was obtained from the difference in film weights before and after irradiation and kept in the dark until analysis. The extent of oxidation was determined by evaluating the difference between the absorbance spectra of the main identified chemical groups.

2.5. Degradation Tests

2.5.1. Degradation in Soil

Degradation tests were performed according to the ASTM D5988-12 standard method [38] with some adaptations based on the proposed methodology by Altaee et al. [39]. The films were cut into rectangles (30 mm × 20 mm) and placed inside a perforated polyethylene net (50 mm × 40 mm; mesh opening 4 mm). The soil burial test was performed in a rectangular resin vase (60 cm × 18 cm × 15 cm) by burying the chitosan-based films reinforced with CNFs and control films at a depth of 10 cm beneath the surface.
The soil (Siro® Plant, Mira, Portugal) with the following physical–chemical composition was used: grain size = 0–15 mm; soil moisture: 57.7%; pH = 5.5–6.5; conductivity = 50–100 µS cm−1; mineral fertiliser (NPK) = 380 mg L−1 nitrogen; 200 mg L−1 phosphorus; 200 mg L−1 potassium; and organic matter > 70%. The soil was watered with 400 mL of water every 7 days and kept at room temperature (±25 °C) throughout the study. The degradability of the films was photographed, and the degradation area was measured in percentage. This test was carried out in triplicate per evaluation point and sample.

2.5.2. Degradation in Seawater

The seawater degradation methodology was based on the protocols reported by Accinelli et al. [40] and Pereira et al. [41]. It should be emphasised that this was a preliminary assay carried out under simplified laboratory conditions, in which reproducing the dynamic complexity of natural marine ecosystems was limited, including continuous water renewal, microbial community variability and the presence of dissolved and particulate organic matter. The results should therefore be interpreted as comparative indicators of the relative behaviour of the materials tested in filtered, agitated seawater, rather than as an exhaustive representation of their degradability in real marine environments.
Seawater was collected from Ria Formosa de Faro, Portugal (37°00′16.9″ N 7°58′04.1″ W) by the Ramalhete Marine Station (CCMAR−UAlg), where it was previously filtered to remove insoluble particles and other dirtiness and stored in tanks. The water had the following physicochemical characteristics: collection temperature = 18.5 °C; pH = 8.03; electrical conductivity = 55.0 mS cm−1; oxygen content (% saturation) = 93%; oxygen content = 6.7 ppm; salt content = 37.1 ppt; and ORP—Oxidation–Reduction Potential (ORP) = 364 mV.
Each film was cut into rectangles (30 mm × 20 mm) and immersed into Erlenmeyer flasks (600 mL) containing 350 mL of seawater kept in a darkened room. This test was carried out in triplicate for each sample. The agitation that simulated tidal flow was carried out with an air pump for aquariums (air 550R plus, Sera Precision, Heinsberg, Germany) with a flow of ≅ 9.2 l min−1 and generated pressure ≥ 140 mbar. The experiment took place at room temperature (±25 °C), and the degradation of the films was recorded by photos every 3 days during the entire experiment time.

2.6. Statistical Analysis

The results were expressed as the mean ± standard deviation of at least three replicates. The experimental data were submitted to analysis of variance (ANOVA) and Tukey HSD (honestly significant differences) test, to detect significant differences between the films for each parameter, both at 5% significance (p < 0.05) using the statistical software Statistica 7.0 (Statsoft Inc., Tulsa, OK, USA).

3. Results and Discussion

3.1. Physicochemical Properties

Adding cellulose nanofibers (CNF)s to chitosan-based films significantly affected their thicknesses, opacity and colour (Table 1). Cellulose nanofiber reinforcement (1 and 2% wt.%) of the chitosan-based films significantly increases the thickness compared with control films. This result corroborates with Costa et al. [27] and Mujtaba et al. [28], who verified an increase in thickness in chitosan films incorporated with different CNC concentrations. This increase can be attributed to the accumulation of nano-cellulose in the polymeric matrix resulting in greater dry matter content in the films [28,42].
Table 1. Optical properties, moisture content, and solubility values of the chitosan-based films reinforced with different CNF concentrations (0, 1 and 2 wt.%).
The incorporation of 1% and 2% CNFs into chitosan films resulted in an increase in thickness compared to the control, attributed to the hygroscopic nature of cellulose nanofibers, which retained water during drying and reduced evaporation rates [43]. Opacity increased significantly from 9.50 ± 0.40% (control) to 17.4 ± 1.91% (2% CNF), consistent with the findings of Shih et al. [44], who reported increased opacity in starch-based biocomposites films reinforced with CNFs. These changes in opacity correlated with a visible colour shift toward a yellowish–green hue, likely due to nanofibers aggregation and light refraction. Despite these chromatic changes, all films maintained adequate transparency for food packaging purpose. The visual appearance of the films is shown in Figure S1 in the Supplementary Materials.
Mujtaba et al. [28], also found that increasing CNC concentrations in chitosan-based films increased chroma (yellowing) values. Additionally, previous researchers have stated that CNF addition to chitosan-based films makes the films yellowish due to increased lignin presence [45]. This is because lignin is a highly opaque natural polymer responsible for the cellulose yellow to brown colour. When CNFs were added to the films the total colour variation (∆E) increased significantly. ∆E values for films reinforced with 1% and 2% CNFs were 2.14 ± 0.94 and 9.80 ± 1.37, respectively (Table 1). This confirms previous findings from opacity and colour data, which showed that increasing nanofiber concentration significantly impacts the optical properties of chitosan-based films.
The control film exhibited a higher moisture content (46.5 ± 1.10%). The incorporation of CNFs significantly reduced the films’ moisture content, with a reduction of around 10% for the CNF2% sample relative to the control sample (Table 1). This trend is consistent with observations by Shih et al. [44], who reported a decrease in moisture content of tapioca starch and potato starch films reinforced with 5% and 10% CNF. Although CNFs are intrinsically hydrophilic, these findings indicate that, under certain formulations, nanocellulose can contribute to a denser polymer network that limits the uptake of loosely bound water rather than simply increasing overall water content. Another factor that may have contributed to the lower moisture content of the CNF-reinforced films is the ability of the nanofibers to restrict the mobility of the chitosan molecular chains, forming an interpenetrating network with the polymeric matrix. Talebi et al. [46], attribute this to the strong hydrogen bonds and electrostatic interactions between the CNFs and chitosan molecules in the composite films. As a result, CNFs reduce the water penetration capacity of chitosan-based films.
This behaviour can therefore be ascribed to the combined effect of CNF hydrophilicity and network densification, although nanocellulose may increase water sorption in some systems, its incorporation at low volume fraction and with good dispersion can promote strong hydrogen bonding and electrostatic interactions with chitosan, leading to a more compact network with reduced free volume. In such a structure, CNFs predominantly act as a reinforcing phase that restricts chain mobility and limits the amount of loosely bound or free water that can be accommodated, which explains the slightly lower moisture content measured for the film containing 2% CNF and is in line with observations in other chitosan–nanocellulose materials.
The addition of CNFs significantly reduced the water solubility of chitosan-based films, from 20.4 ± 0.85% for the control film to 19.2 ± 0.07% and 18.6 ± 0.16% for the films reinforced with 1% and 2% CNFs, respectively. Similar behaviour was reported by Yadav et al. [47], who found that the solubility of chitosan-based films decreased with increasing CNF concentration. This reduction is attributed to the abundant presence of oxygen functional groups on the surface of nanocellulose and the formation of a three-dimensional (3D) network structure by the interconnected nanofibers, which maintains the chitosan structure and makes films with a higher CNF concentration less soluble in water.
Overall, the decrease in moisture and solubility of chitosan-based films is a desirable feature for food packaging applications. Films with low humidity are more resistant to degradation and bacterial growth, while films with low solubility are more resistant to tearing.

3.2. Water Vapour Transmission Rate (WVTR)

3.2.1. Dependence of WVTR on Temperature

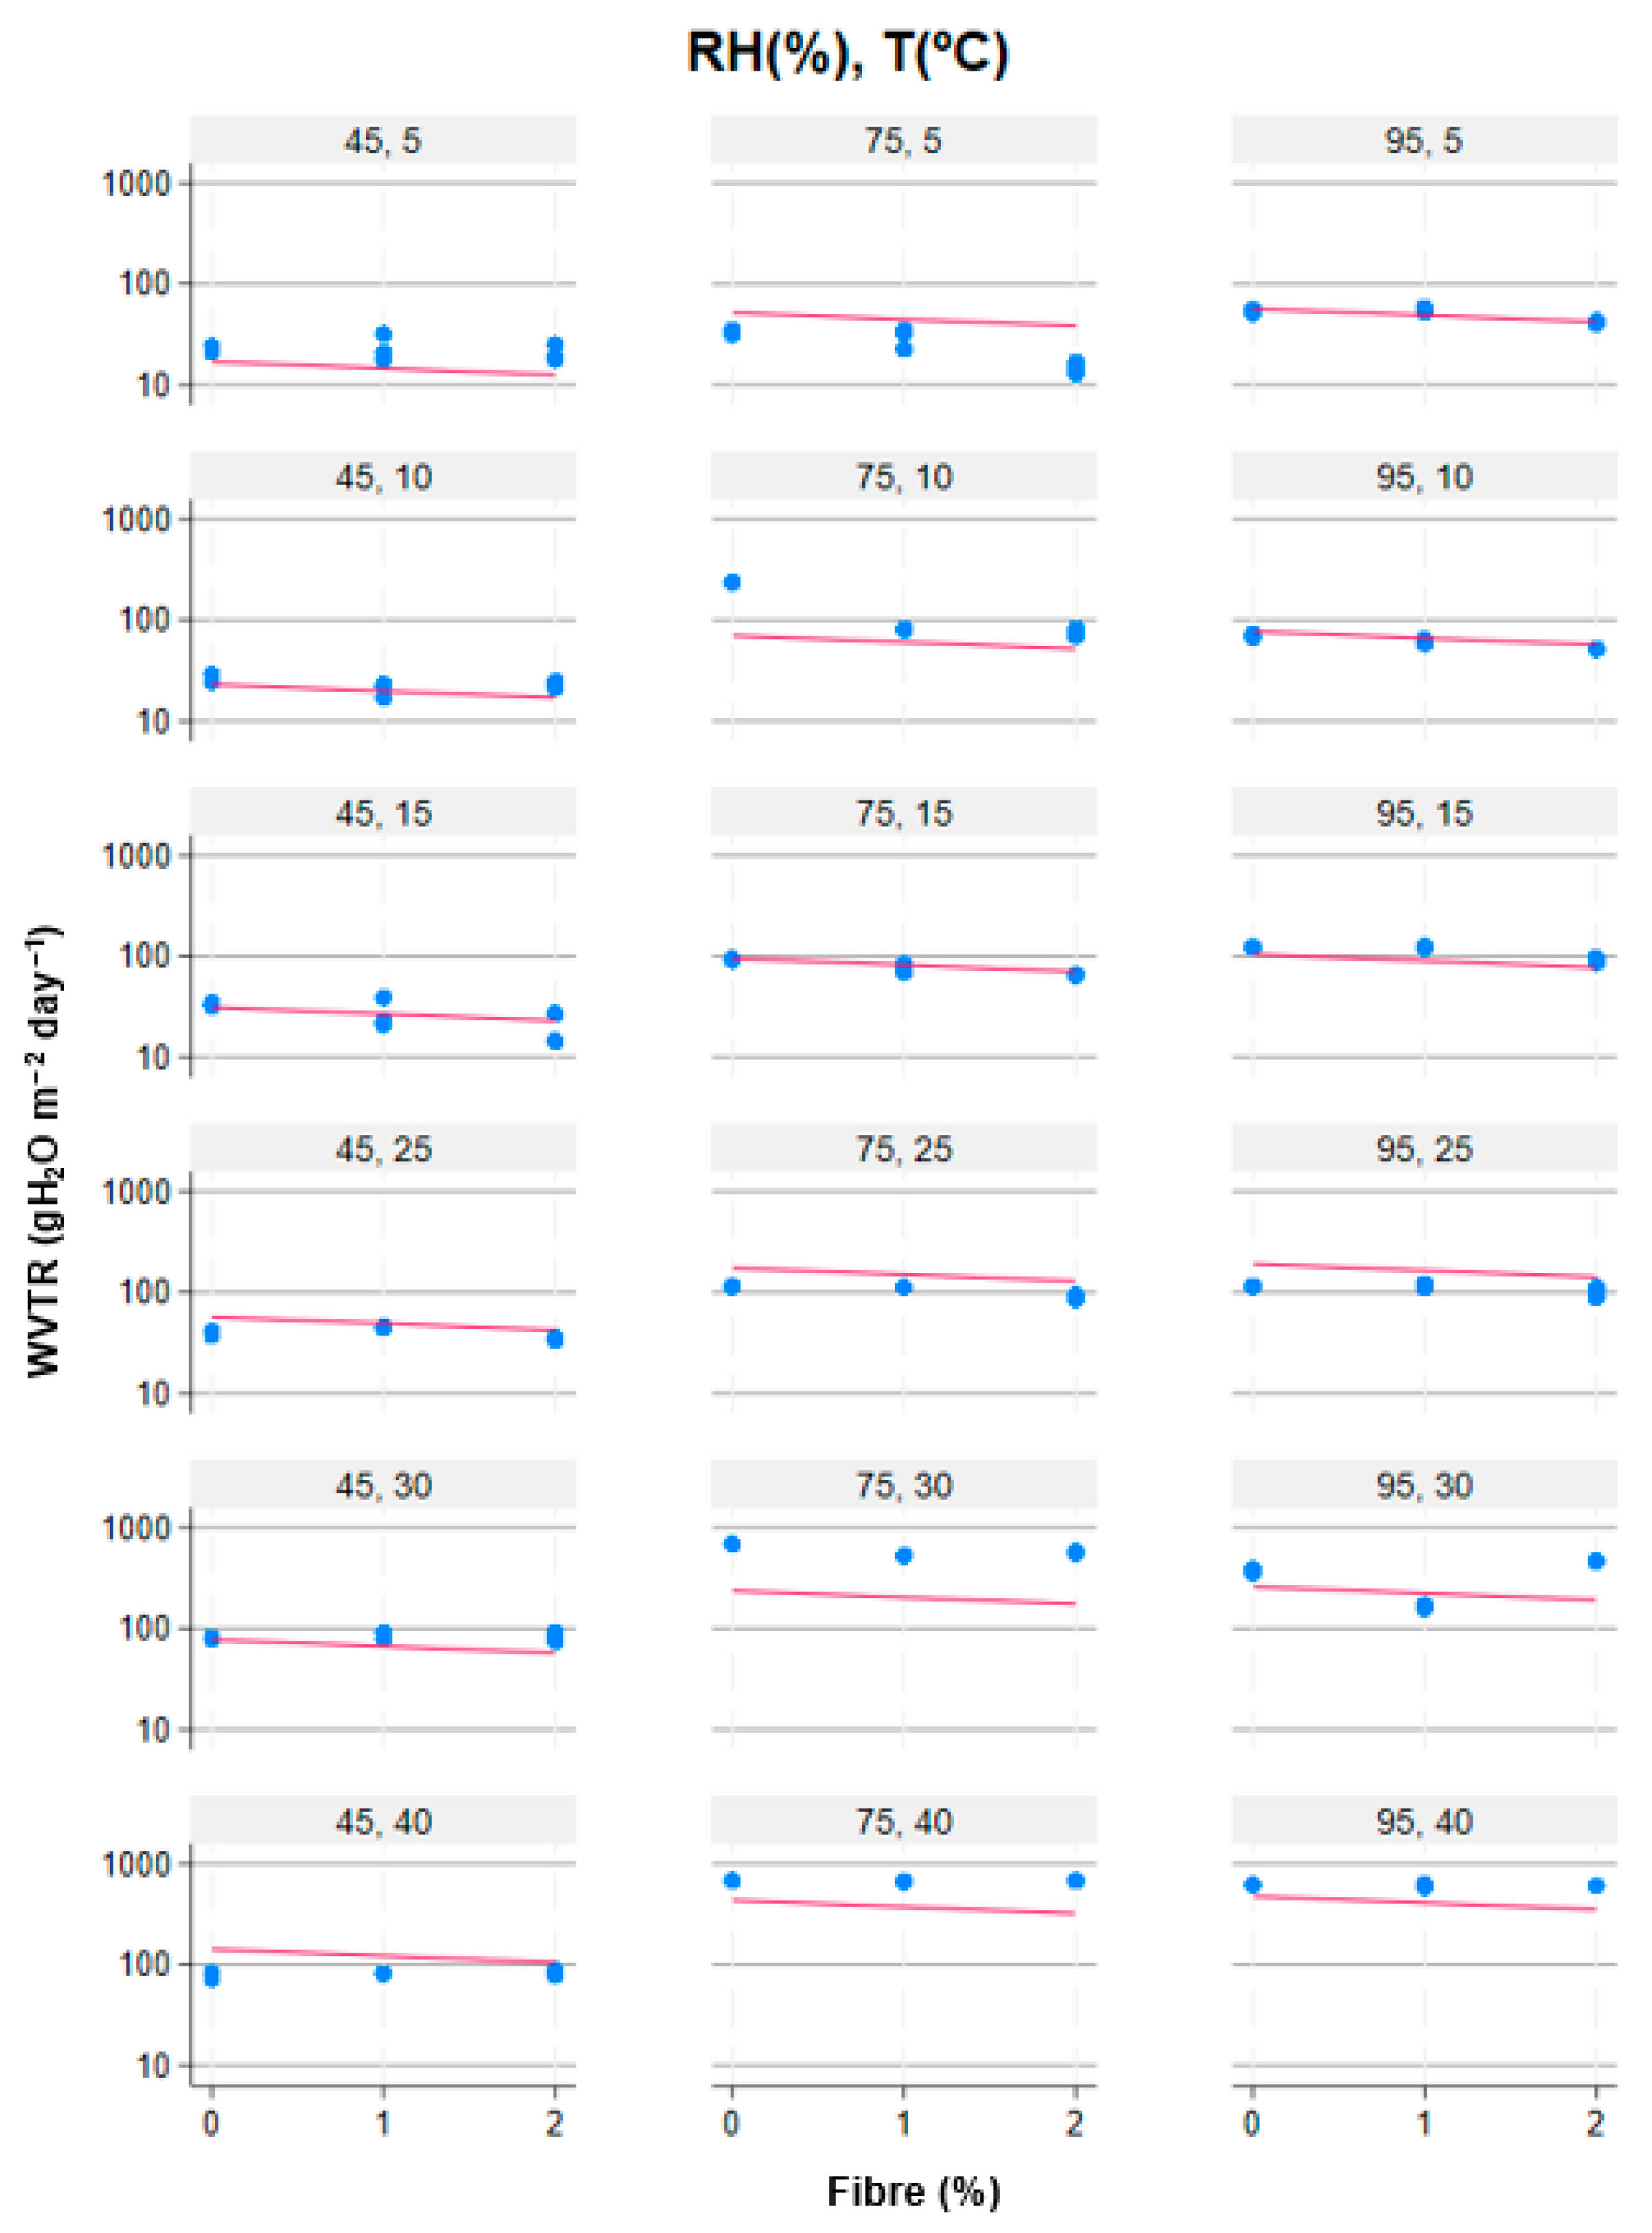
From the observation in Figure 2, the WVTR experimental values had a very low standard deviation and increased with temperature and %RH, with a slight decrease when CNFs were added. The Arrhenius equation (Equation (3)) was applied to check if the dependence of WVTR on temperature followed this model, which was confirmed by the results obtained and presented in Table 2. Eαr is the activation energy for diffusion, T is the absolute temperature, and Tref is a reference temperature. The constant 8.314 is the ideal gas constant in J K−1 mol−1 [32].
Figure 2. WVTR modelling as a function of CNF (%) for different temperatures and %RH.
Table 2. Kinetic parameters of the dependence of WVTR on temperature for each condition.
However, for 45% RH the addition of CNF, though significantly different, only slightly affected these parameters. For 75% RH, the differences were much more noticeable, reaching a maximum for WVTR0 and a minimum for Ea for CNF 1%. For 95% RH, WVTR0 decreased and Ea increased significantly when 1% of CNF was added, indicating that the system became more sensitive to temperature; when 2% of CNF was added, the opposite occurred, WVTR0 decreased significantly below the control value and Ea became much higher, therefore less sensitive to temperature changes.
To find a single regression model with several outcome variables based on T, %RH, and %CNF that would best fit the experimental WVTR data, a multivariate regression was next performed (Equation (13)) using the software STATA 18. The parameters of the multivariate model are presented in Table S1 in the Supplementary Materials.
ln WVTRp = 8.19     0.02   ×   % RH     211.97   ×   1 % RH     0.06   ×   T st   0.15   ×   % CNF
Figure 2 presents the data from the WVTR modelling as a function of temperature (T °C), relative humidity (%RH), and CNF (%).
The increase in temperature generally results in a higher water vapour transmission rate (WVTR) of films, which in this study is much more noticeable for 75% RH and 95% RH. This phenomenon occurs due to the relaxation of chemical bonds within the film material, which allows a higher water vapour transmission. However, %RH strongly influences this transmission. On one side, the salts used in this study created a certain environment which, according to the Clausius–Clapeyron equation, states that vapour pressure decreases with temperature, causing a slight decrease in the %RH imposed by the saturated salt [32,48]. On the other side, from Figure 2 it is noticeable that the WVTR values increase with increasing %RH, with a slight decrease when CNFs are added. This behaviour is explained by hydrogen bonding between the hydroxyl groups of the films and CNFs, which contain more hydrophilic chain segments and interact with water. Water acts as a plasticizer in the films, causing their swelling, which also explains the increase in thickness from 0.01 mm to 0.018 mm and 0.021 mm when adding 1 and 2% CNF, respectively.

3.2.2. Dependence of D on Temperature, CNF and %RH Influence

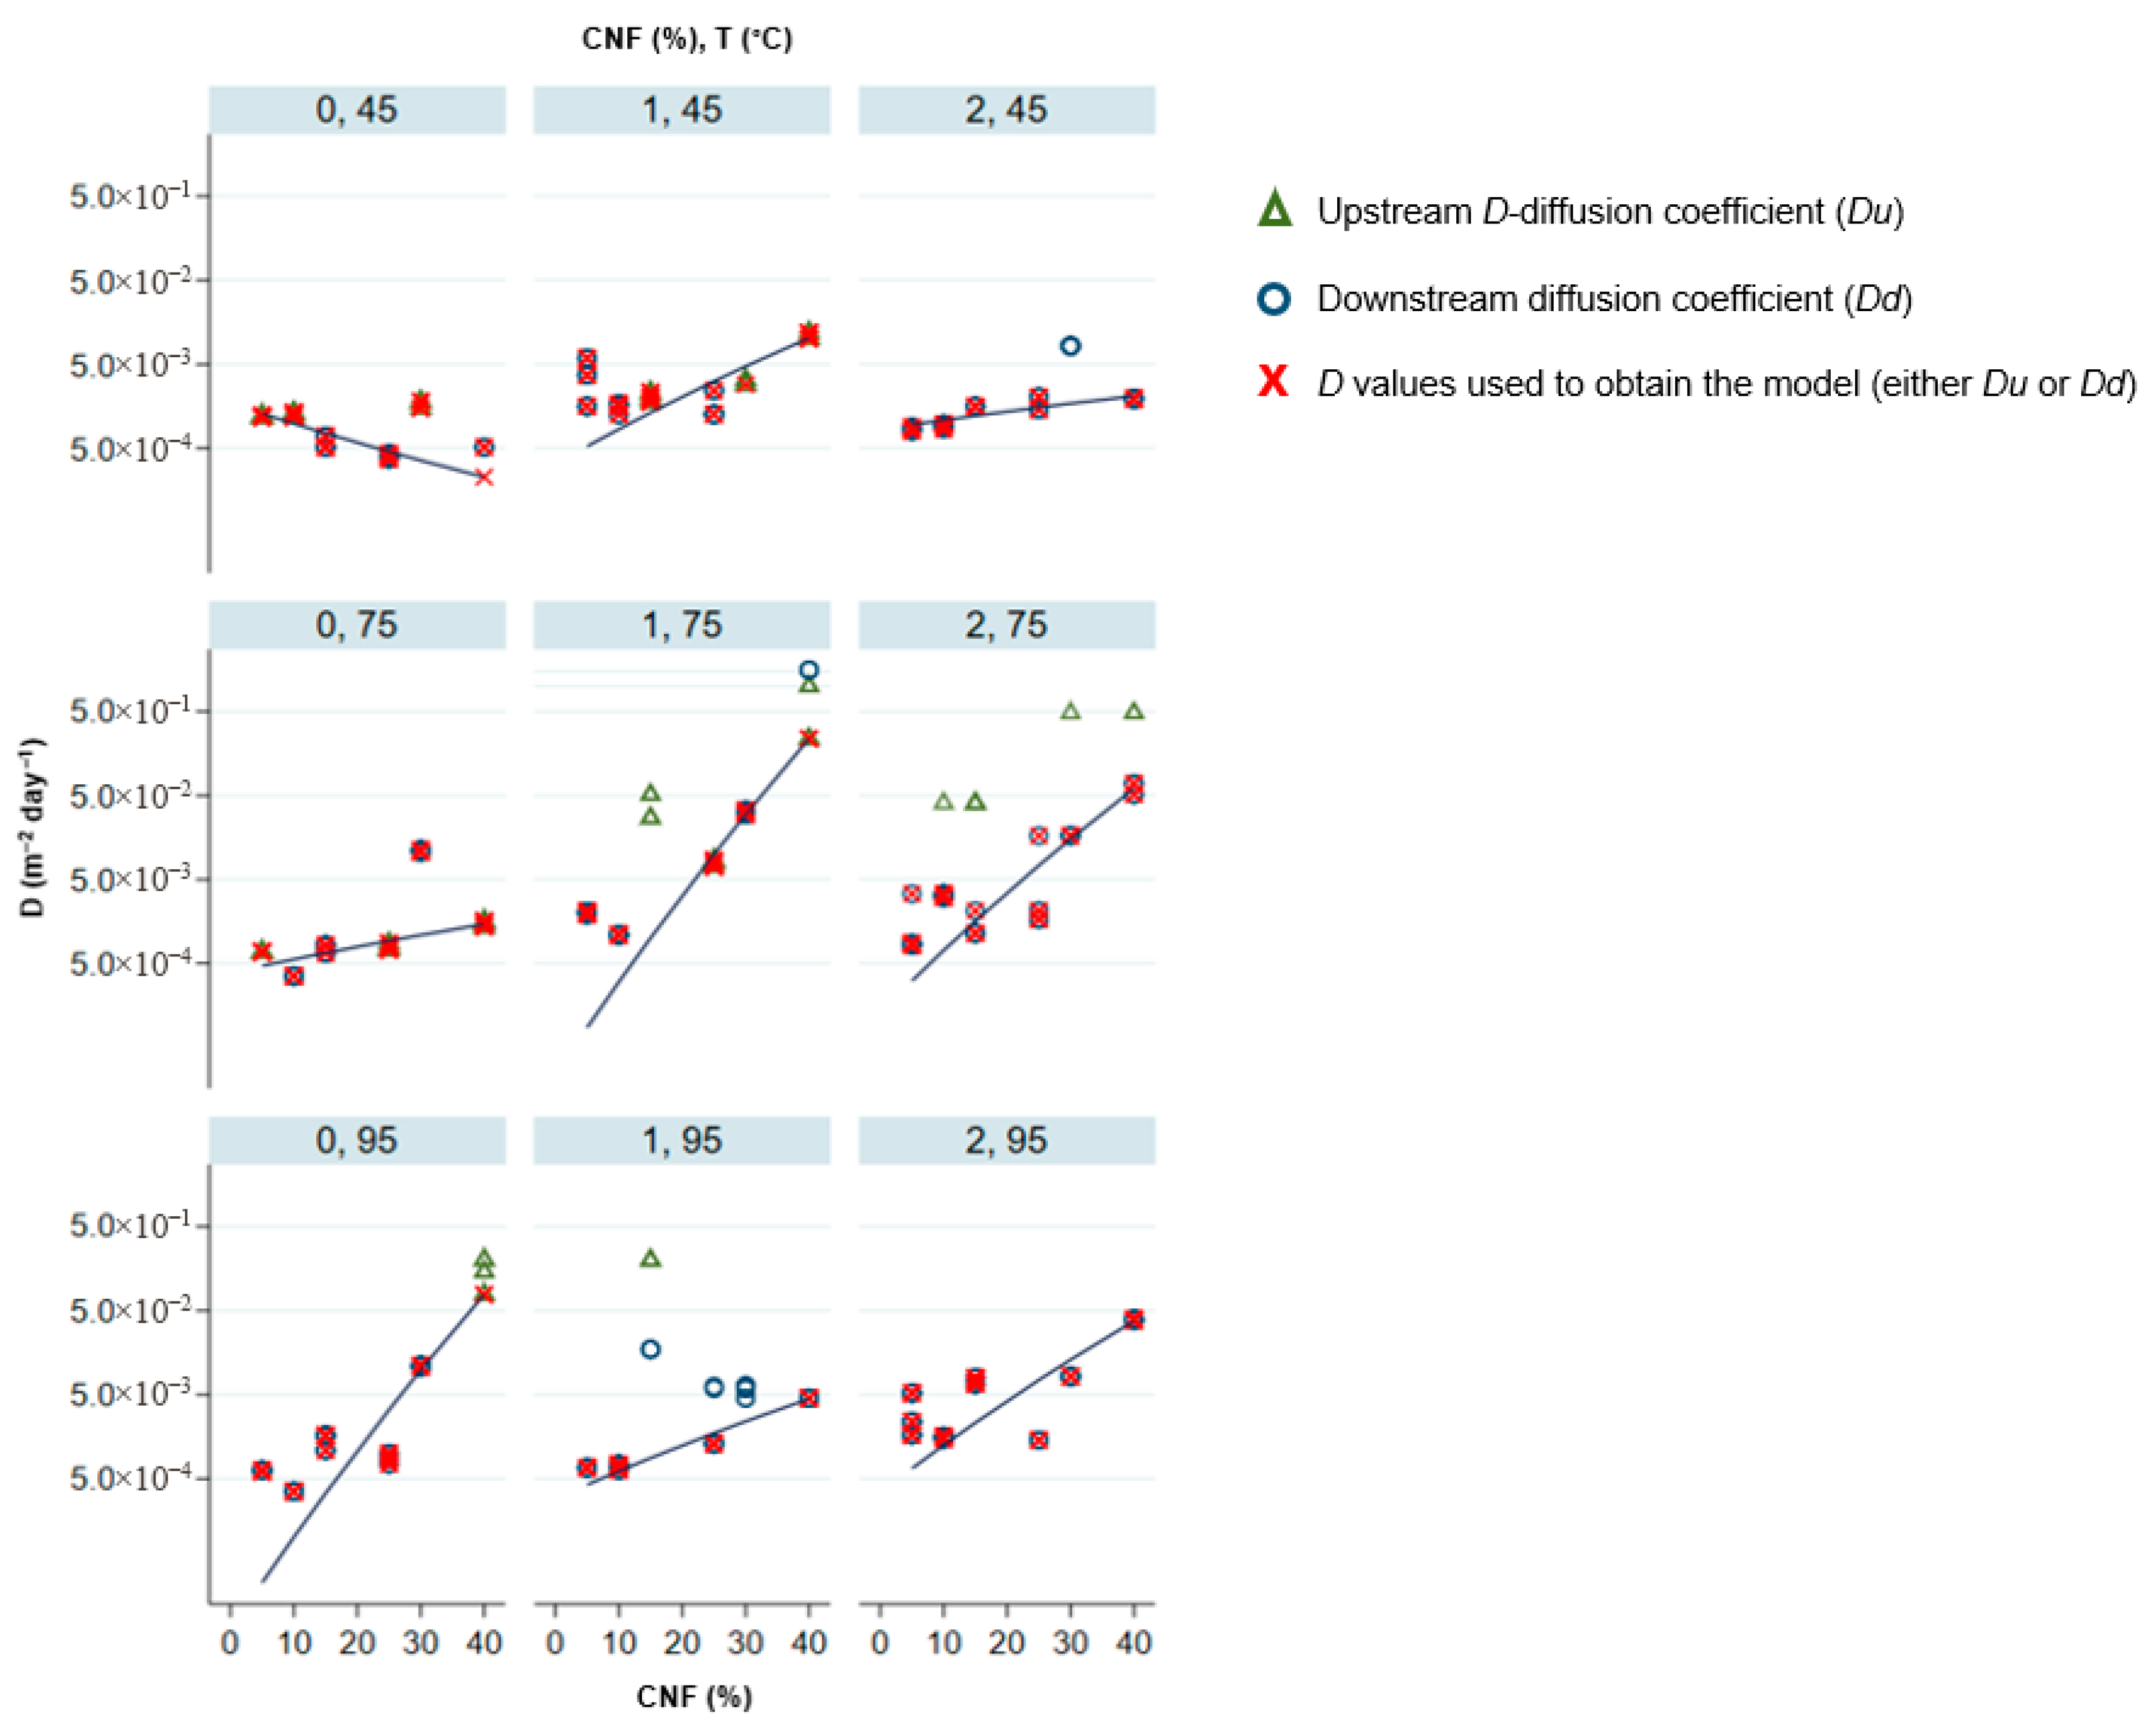
The data presented in Table 3 show the kinetic parameters obtained from the Arrhenius model, confirming that D dependence on temperature follows this model as well as WVTR. There were, however, differences in behaviour depending on CNF and RH percentages. At 45% RH and 0% CNF (control), the increase in temperature caused a decrease in D, probably due to water evaporation drying the film so much that diffusion became more difficult as temperature increased. Considering that our diffusing molecule is water, besides depending on its size, shape, and polarity, diffusion of this molecule through the three kinds of films also depends on their crystallinity, degree of cross-linking, segmental motion of the existing groups in the polymer matrix, and on the environment [49]. The addition of CNFs seems to have reduced this evaporation, and D increased more for CNF 1% than for CNF 2%, as the activation energy was much higher in the first case, meaning it was more responsive to a change in temperature than when 2% was added. Regarding the environment with 75% RH, though Dref increased with CNF%, the least resistant to change (higher Ea) was also with CNF 1%, with the control being the least responsive.
Table 3. Kinetic parameters of the dependence of D on temperature for each condition.
Figure 3 shows similar behaviour of D for 45 and 75% RH, where, with increasing temperature, D increases when CNFs are added, being more prominent for CNF 1% and 75% RH. Regarding the most humid environment, 95%, D also increases with temperature for both the control and CNF%, but at higher temperatures (from 25 °C on) a decrease in the D values is noticed for CNF 1%, under the control value, suggesting that two processes were occurring and competing at the same time: the strengthening of bonding interactions between molecules caused by the temperature increase and the nanofibers swelling due to water absorption. For 45 and 75% RH, relaxation seems to dominate for 2% CNF, whereas for the higher RH, at 1% CNF, swelling had more effect than bonding interactions. However, for 2%, some alignment of the swelled nanofibers might have occurred, which is in favour of letting water vapour slide along the nanofibers [43,50].
Figure 3. Influence of CNFs on the dependence of D (m2 day−1) on temperature for each %RH.
To apply this method most accurately, the measurements should follow several rules. One of the most important conditions is that the gas solubility and the diffusion coefficient should be constant over the experimental pressure range [51,52]. For the linear model to be accurate, it is necessary that the film does not contain any permeant at the beginning of the experiment and that, on the permeate side of the experiment, only a negligible concentration of the permeant exists during the experiment, a condition that cannot be fully achieved when a finite increase in pressure is required to measure permeability, even though it should be quite low [49,53]. Changing boundary conditions at the feed and/or the permeate side requires a significantly more complex combined experimental and numerical approach [54].
Overall, the incorporation of CNFs affected the films’ barrier properties in a humidity-dependent manner. At 45% RH, CNFs mainly increased the activation energy of water transport without markedly changing WVTR, whereas at 95% RH the addition of 1% CNF clearly reduced WVTR, indicating a more tortuous diffusion pathway in the hydrated matrix. In contrast, 2% CNF did not consistently improve WVTR and reduced thermal stability, suggesting that a CNF loading of around 1% under high-humidity conditions is the most suitable option for obtaining films with enhanced barrier performance.

3.3. Scanning Electron Microscopy (SEM)

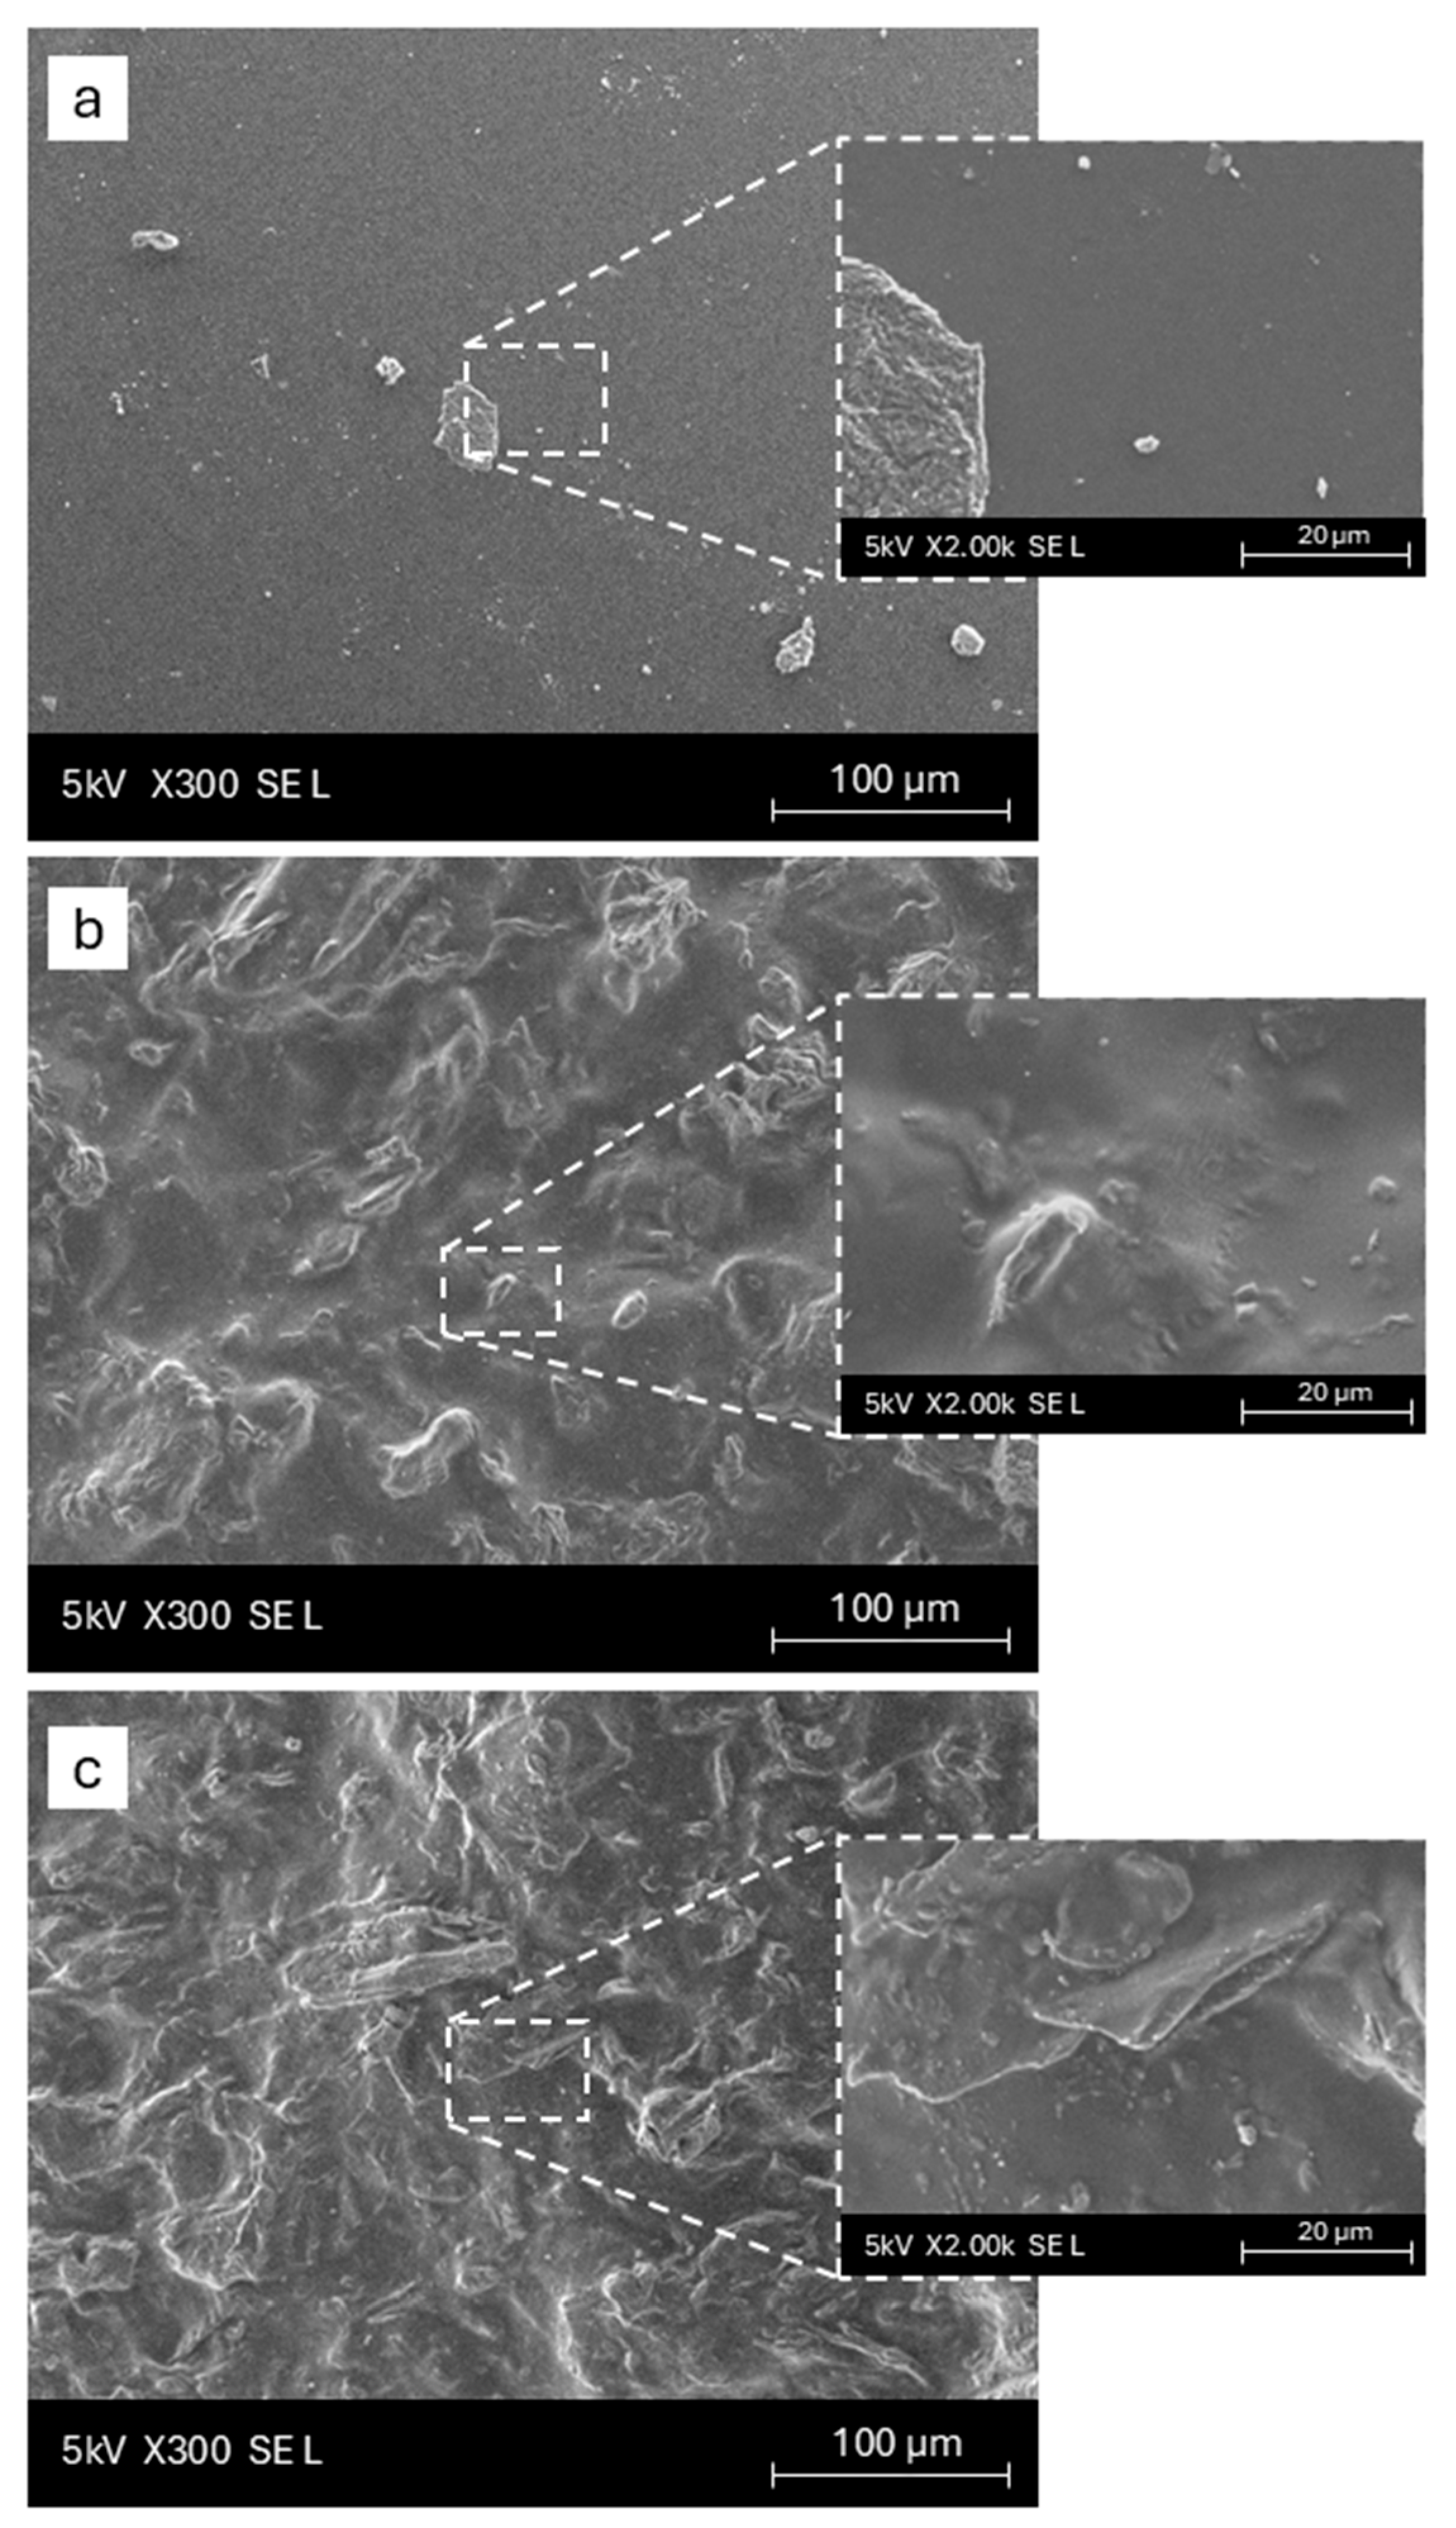
SEM analysis was performed to qualitatively evaluate the morphology of the chitosan and chitosan-based films reinforced with CNFs. SEM micrographs of the samples’ surfaces are shown in Figure 4. The control chitosan-based film presented a relatively homogeneous surface. However, in some sections of the surface, it was possible to identify the presence of microparticles, which can be attributed to undissolved chitosan microparticles or to impurities present in the reagents which were not prevented during the filtration step. On the other hand, CNF-reinforced chitosan-based films showed a heterogeneous and rough appearance that became more pronounced with increased CNF concentration. Figure 4b,c also demonstrated the strong adhesion of nanofibers in the polymeric matrix, corroborating with other studies with CNFs and CNC as reinforcement agents in chitosan-based or starch-based polymeric matrix [28,44,47,55].
Figure 4. SEM micrographs of chitosan-based film surface: (a) control. Reinforced with cellulose nanofibers: (b) CNF1%, and (c) CNF2%. Magnification: ×300; scale bar: 100 µm.

3.4. Mechanical Properties

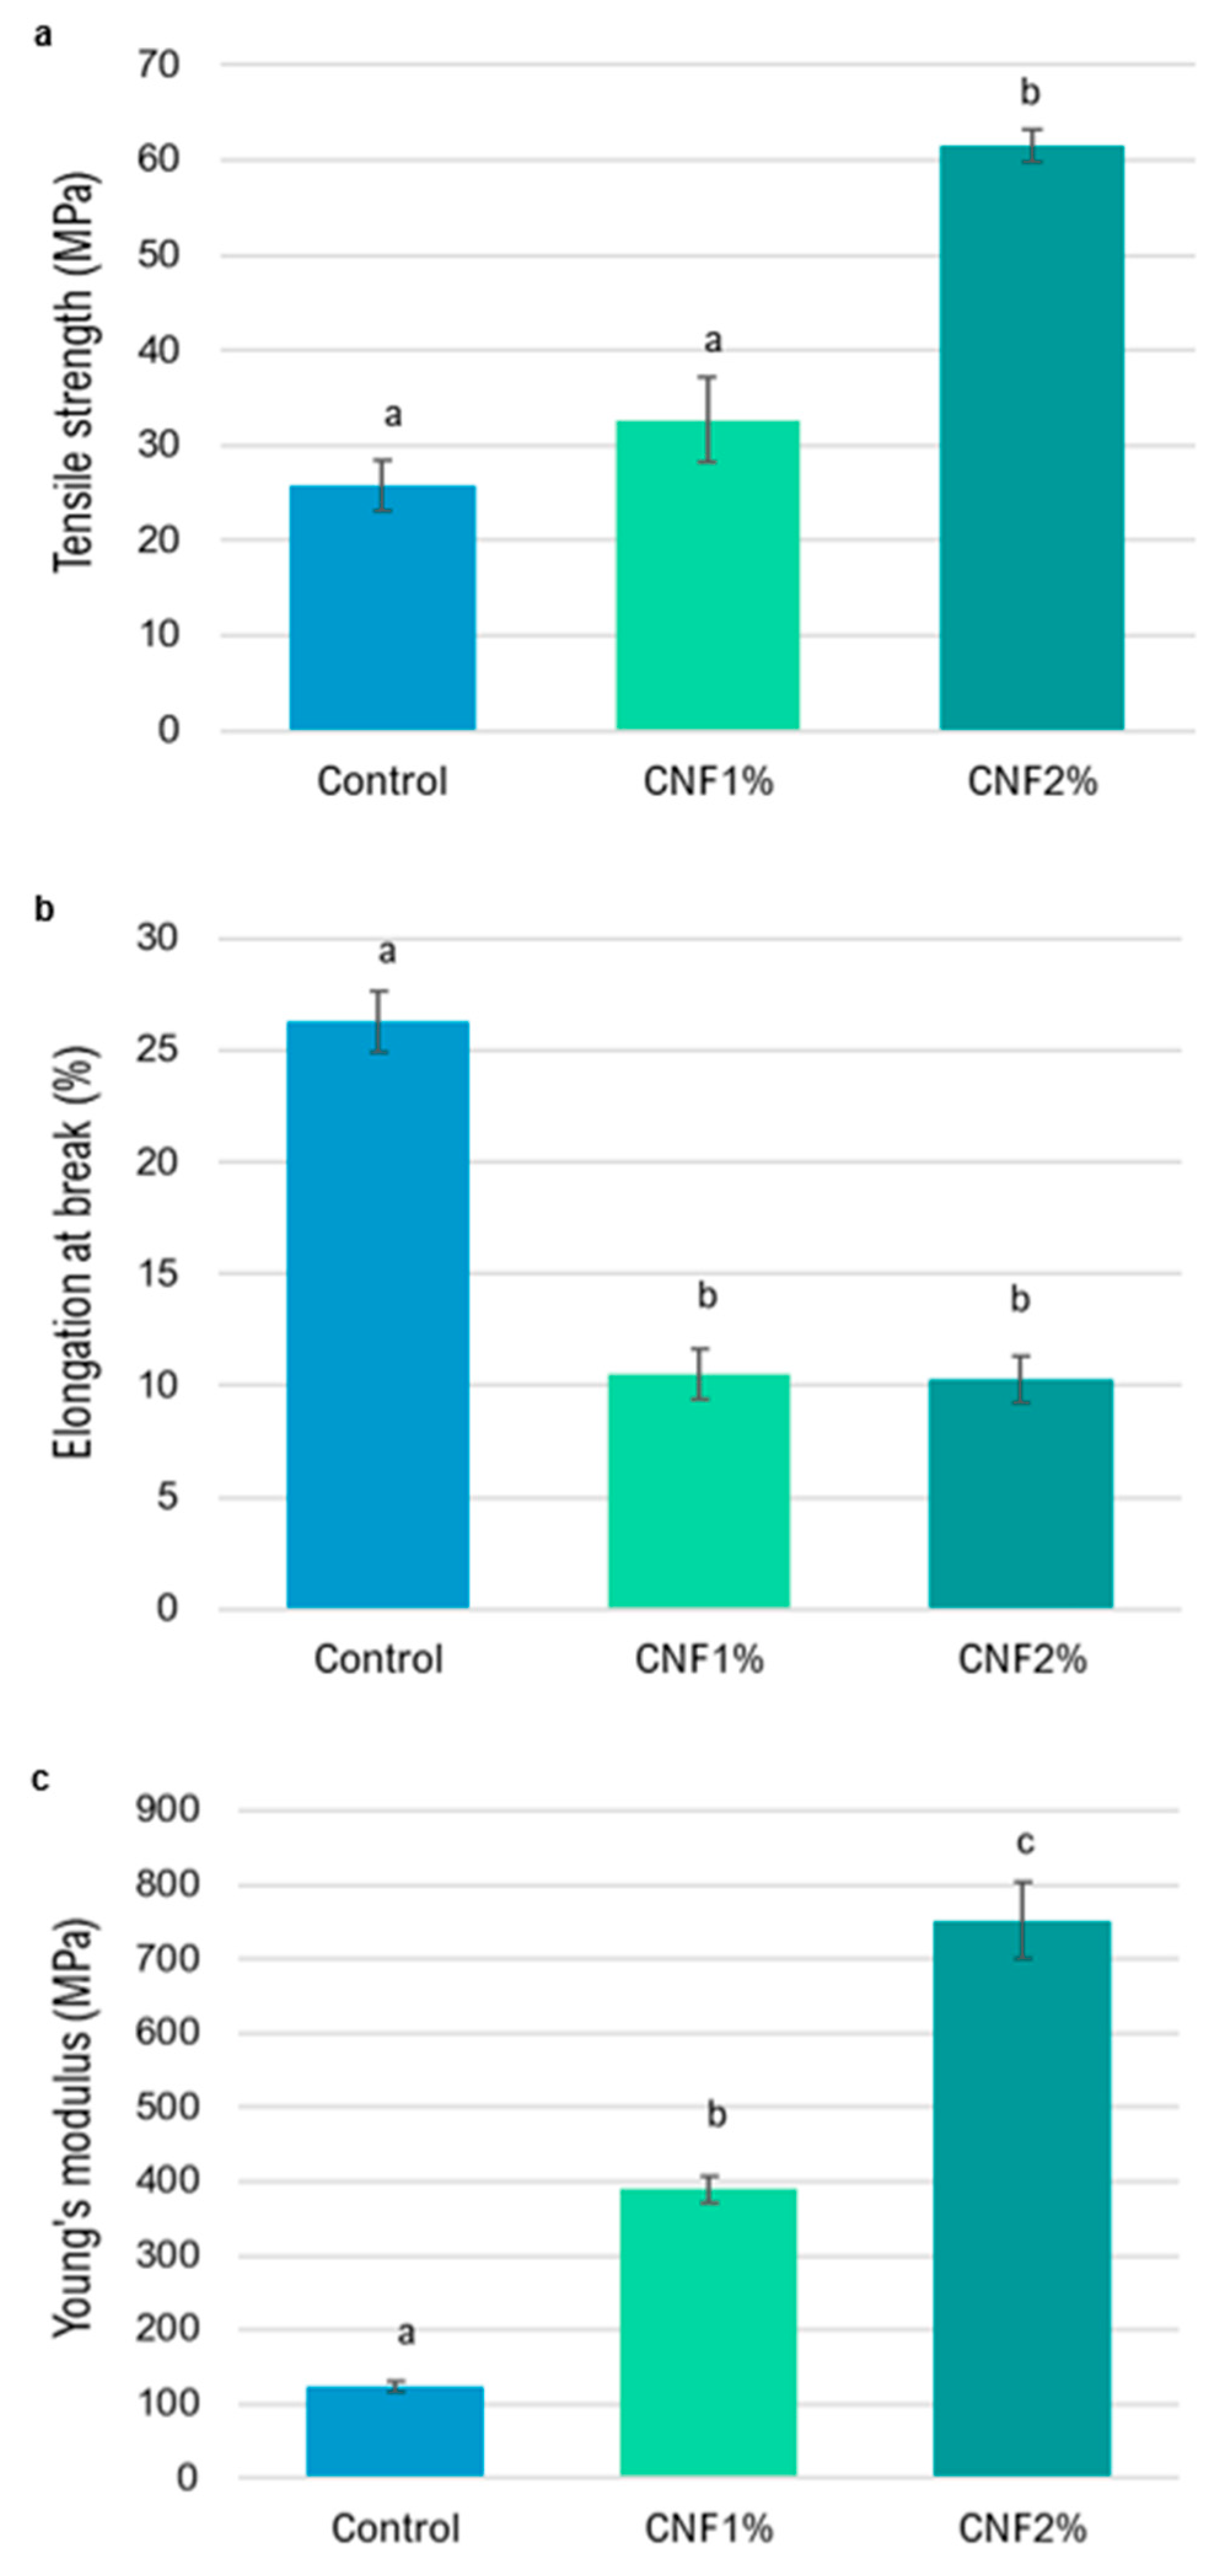
Figure 5a–c show the mechanical properties of the control, CNF1%, and CNF2% films. The 2% CNF-reinforced film exhibited a significant increase in tensile strength (TS) and Young’s modulus (YM) compared to the control and 1% CNF films. In contrast, the control film had a greater elongation capacity, with significantly higher elongation at break (EB) results than both reinforced films, whose EB decreased with increasing nanofiber concentration.
Figure 5. Mechanical properties: tensile strength (a), elongation at break (b), and Young’s Modulus (c) of chitosan-based films reinforced with different CNF concentrations (0,1 and 2 wt.%). Different letters in the same graph indicate significant differences between samples.
The mechanical resistance capacity of nanocellulose (CNF) to improve the tensile strength (TS) property in films based on different biopolymers, such as starch, chitosan, and polylactic acid (PLA), has been reported by several authors [28,44,47,55,56,57]. This discovery may be related to the strong interaction between the nanofillers and the matrix through hydrogen bonds. However, the incorporation of low concentrations, such as 1 wt.%, did not significantly increase the strength and stress resistance of chitosan-based films.
The addition of CNFs reduced the elongation capacity of the CNF1% and CNF2% films concerning the control film, with EB values of 10.5, 10.3, and 26.3%, respectively. This behaviour is according to results reported by Yadav et al. [47], who found that chitosan-based films reinforced with cellulose nanocrystals (CNC) (2, 4, 6, and 8 wt.%) had a reduction in EB (16.8%, 9.9%, 9.2%, and 8.9%, respectively) compared to the control sample, which presented an EB of 21.8%. However, it was possible to observe that the changes in elongation at break were not significant under higher CNC concentrations, which means that to a certain extent, the increase in nanofillers did not significantly influence the gradual reduction in the elasticity of the films. Niu et al. [57], also observed that the incorporation of 8% CNF in PLA/chitosan composite films reduced EB by up to 50% concerning samples without the addition of reinforcement.
Another important mechanical property studied was Young’s modulus, which evaluated the stiffness of the films through the relationship between tension and deformation. It was observed that incorporating CNF nanofillers improved Young’s modulus values (Figure 5c). The chitosan-based films (control) presented Young’s modulus of 122.5 MPa, which increased to 390.0 and 751.4 MPa for 1 and 2 wt.% of CNF added, respectively. This increase characterises an improvement in the stiffness of the films reinforced with CNFs, which may be related to the interconnection of the nanofibers promoting the formation of a 3D network and to the blocking of molecular movement of the chitosan facilitated by the incorporation of CNFs [58,59].
The mechanical behaviour is therefore consistent with the structural and morphological changes induced by CNFs. The higher tensile strength and Young’s modulus, combined with lower elongation at break, reflect a more rigid and strongly interconnected CNF–chitosan network, which is also visible in the SEM micrographs as a less uniform, rougher surface for CNF-reinforced films. This stiffer network helps to explain the reduced mobility of water at high %RH and the corresponding improvement in barrier properties for the 1% CNF formulation. Overall, these results showed that CNFs are a promising additive for chitosan-based films and can act as a film-reinforcing agent to improve strength, stiffness, and barrier properties.

3.5. Thermogravimetry Analysis

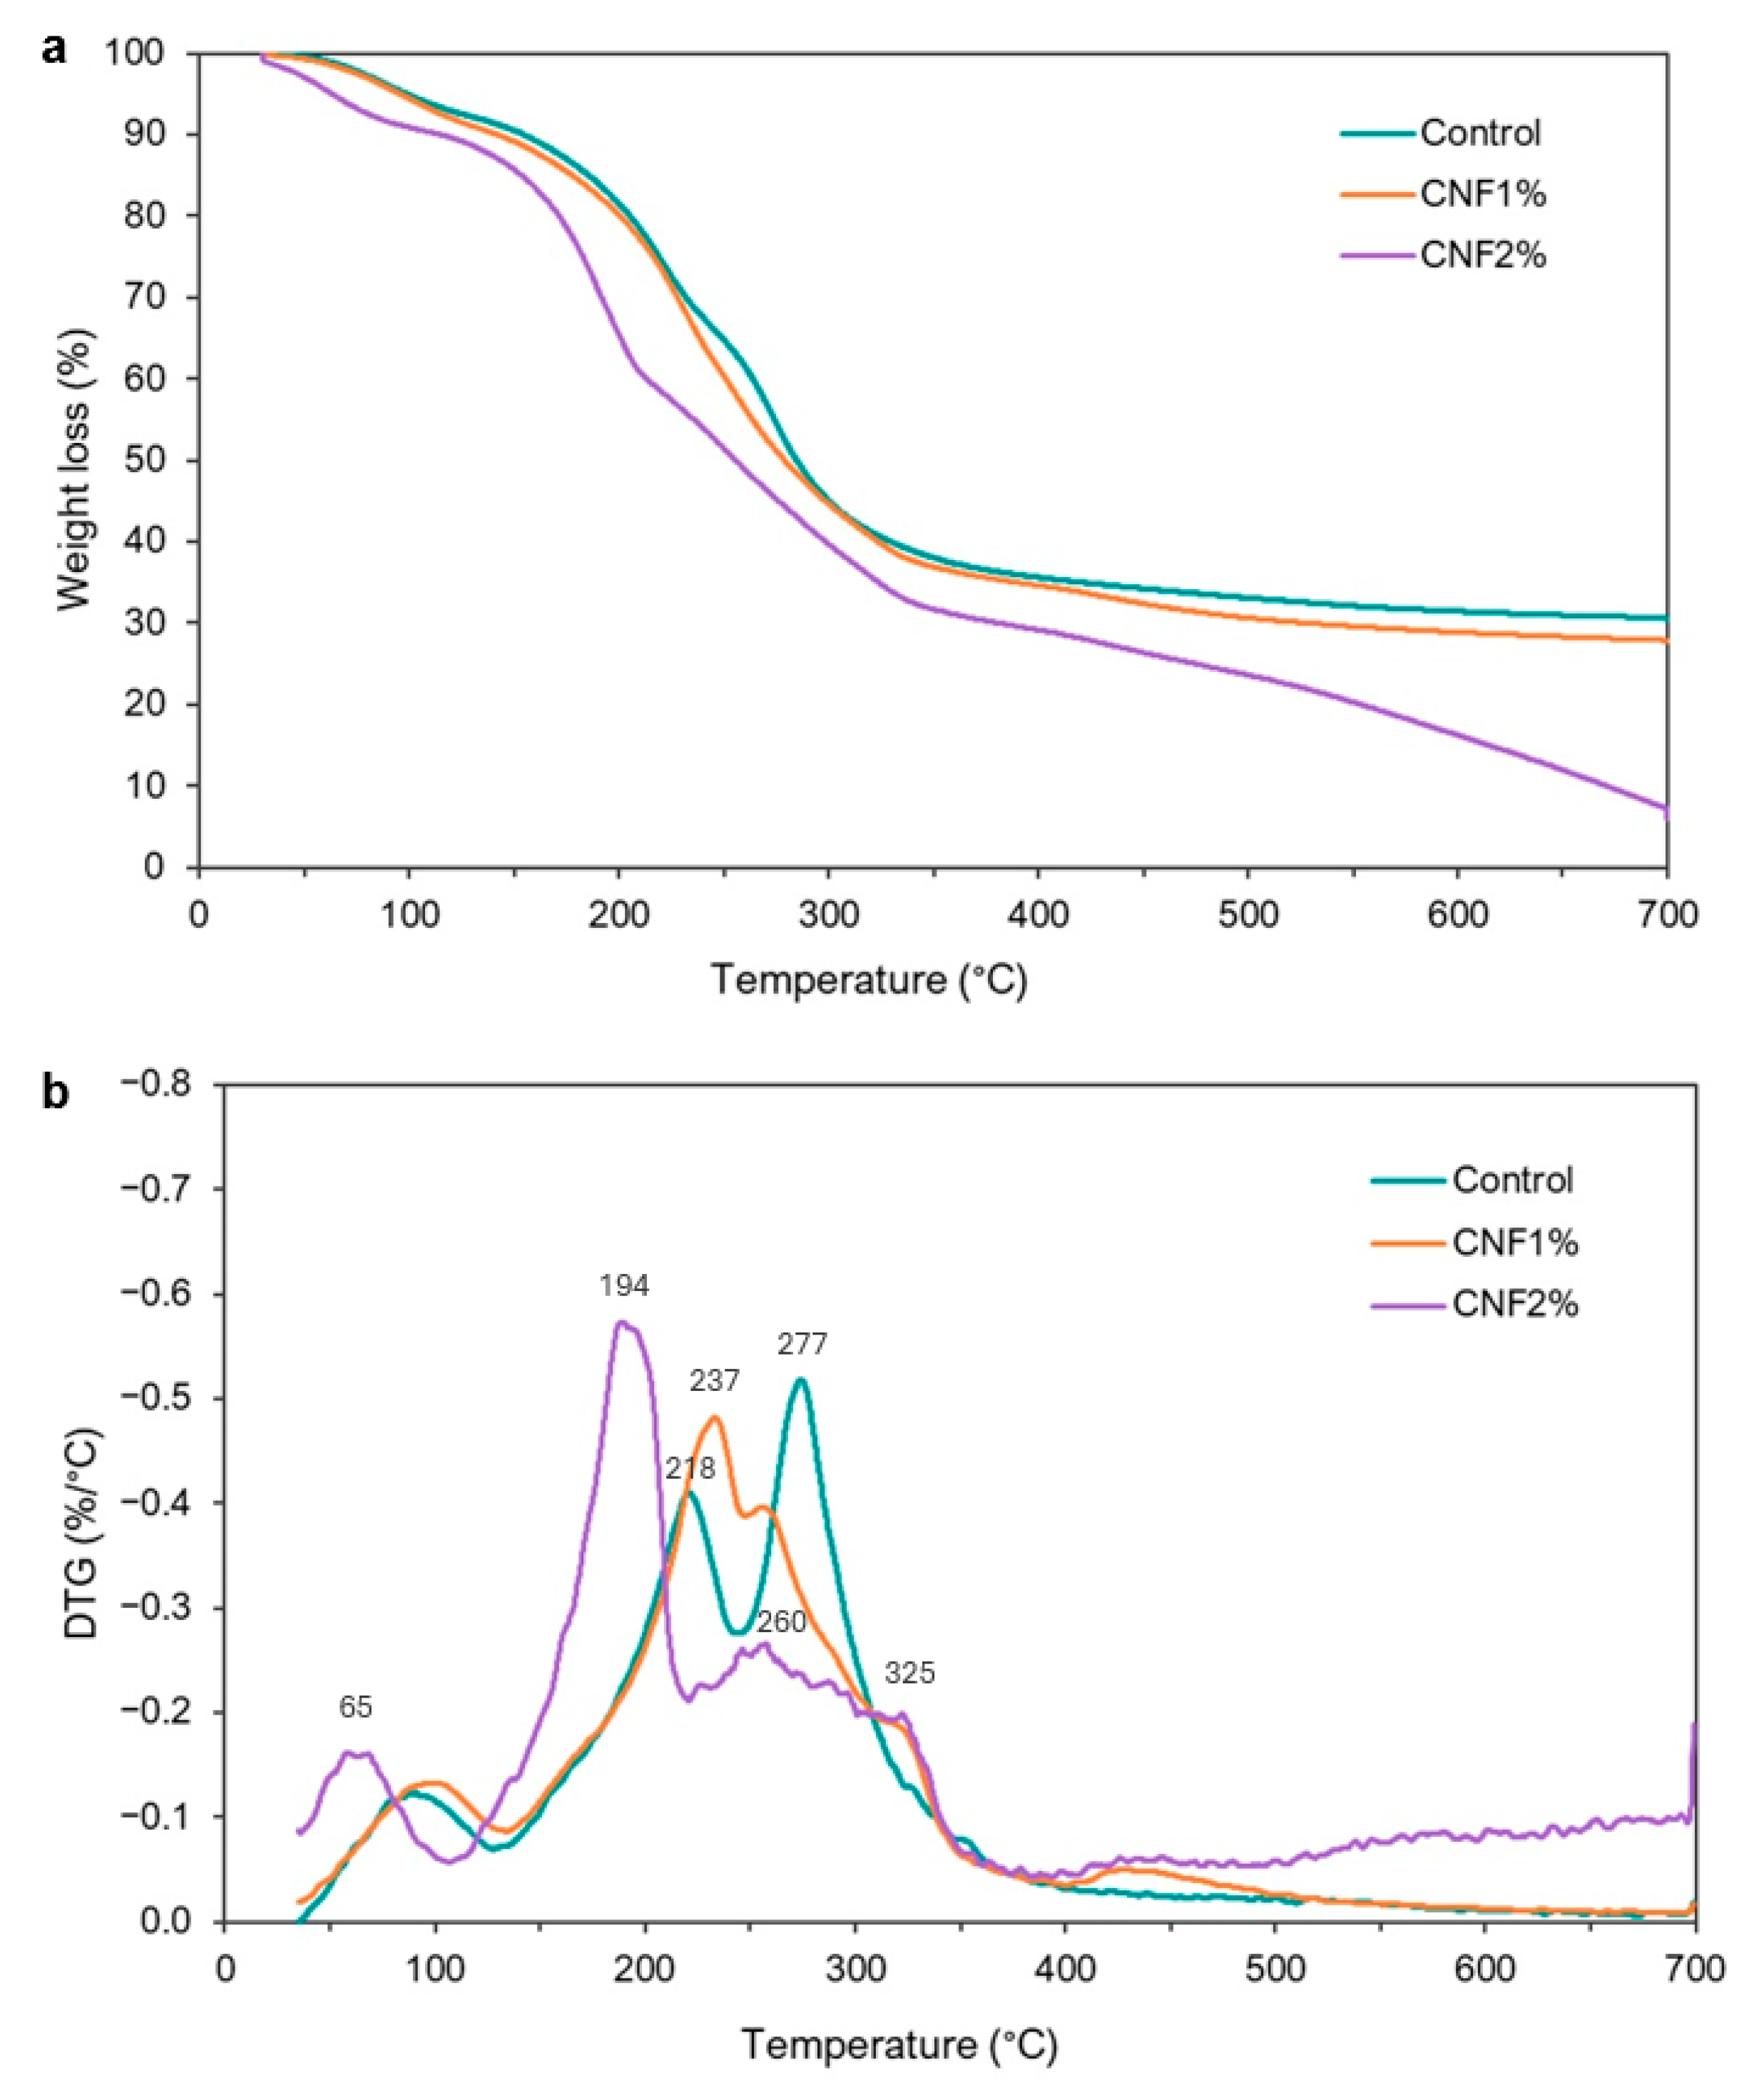
Figure 6a,b present the TGA thermograms and the corresponding first-order DTG derivative curves. From the data analysis, it was possible to evaluate the behaviour of the films in terms of the degradation profile of the mixture components and the thermal stability of the control films and films reinforced with 1% and 2% CNF under conditions of constant temperature variation rate (30 to 700 °C). For each film, the initial temperature of the main degradation stage (Tonset), determined from the TGA curve, the final temperature of this stage (Tfinal), corresponding to the end of the main mass-loss event, and the associated mass loss are reported in the Supplementary Materials (Table S2).
Figure 6. TGA (a) and DTG (b) curves from 30 to 700 °C of chitosan-based films reinforced with different CNF concentrations (0, 1 and 2 wt.%).
Initially, between 30 and 110 °C, a slow weight loss (8% and 10%) in both samples is possible. This event is related to the weight loss of the samples due to the evaporation of water present in the films [27,60]. A second mass-loss event occurs between 180 and 200 °C, giving rise to DTG peaks at around 194–200 °C for all formulations; in this region, the control and CNF1% films lose about 15% of their mass, whereas the CNF2% sample loses about 25%. This event is commonly associated with the degradation and partial volatilisation of glycerol, used as plasticiser, together with the decomposition of less stable chitosan domains, as described for plasticised chitosan-based films [28].
The main range region extends from about 230 to 380 °C and is reflected in the intense DTG peaks centred at approximately 260–280 °C. In this third stage, the weight loss is around 65% for the control and CNF1% films and about 70% for the CNF2% film, which is attributed to the depolymerisation and thermal decomposition of the chitosan backbone [24,27,47]. The effect of incorporating CNF into the polymeric matrix of chitosan-based films was a reduction in the maximum decomposition temperature, indicating a small reduction in thermal stability, especially in the CNF2% sample. This behaviour is contrary to that reported by Corsello et al. [26] for chitosan-cellulose nanocrystal biocomposites films, which increased their thermal stability with increasing nanocellulose fillers. However, this loss of thermal stability with higher CNF concentration is consistent with the less favourable barrier response and confirms that only a limited amount of reinforcement can be beneficial before structural defects outweigh the advantages of adding nanofibers.
The CNF1% and CNF2% thermograms showed a fourth event between 400 and 500 °C, peaking at 430 °C. This event may be related to the decomposition of residual lignocellulose present in CNFs [61]. In the CNF-reinforced films, the additional shoulders or peaks observed in the DTG curves at higher temperatures are therefore attributed to the multicomponent nature of the system, including the degradation of minor lignocellulosic constituents present in the CNFs, such as residual hemicelluloses and lignin [27,60,61]. The occurrence of several degradation stages in TGA/DTG is thus not taken as evidence of phase immiscibility between chitosan and CNFs, but rather as a typical feature of plasticised chitosan-based composites and natural fibre–polymer materials. This interpretation is consistent with the SEM micrographs, which do not reveal obvious phase separation or large CNF aggregates, suggesting that chitosan and CNFs form a compatible system whose thermal degradation proceeds through multiple overlapping steps.
Finally, we can confirm that the addition of low CNF loads (CNF1%) to chitosan-based films did not interfere with significant changes in the thermal stability of the films; however, the addition of higher loads (CNF2%) resulted in films with lower thermal stability.

3.6. ATR-FTIR

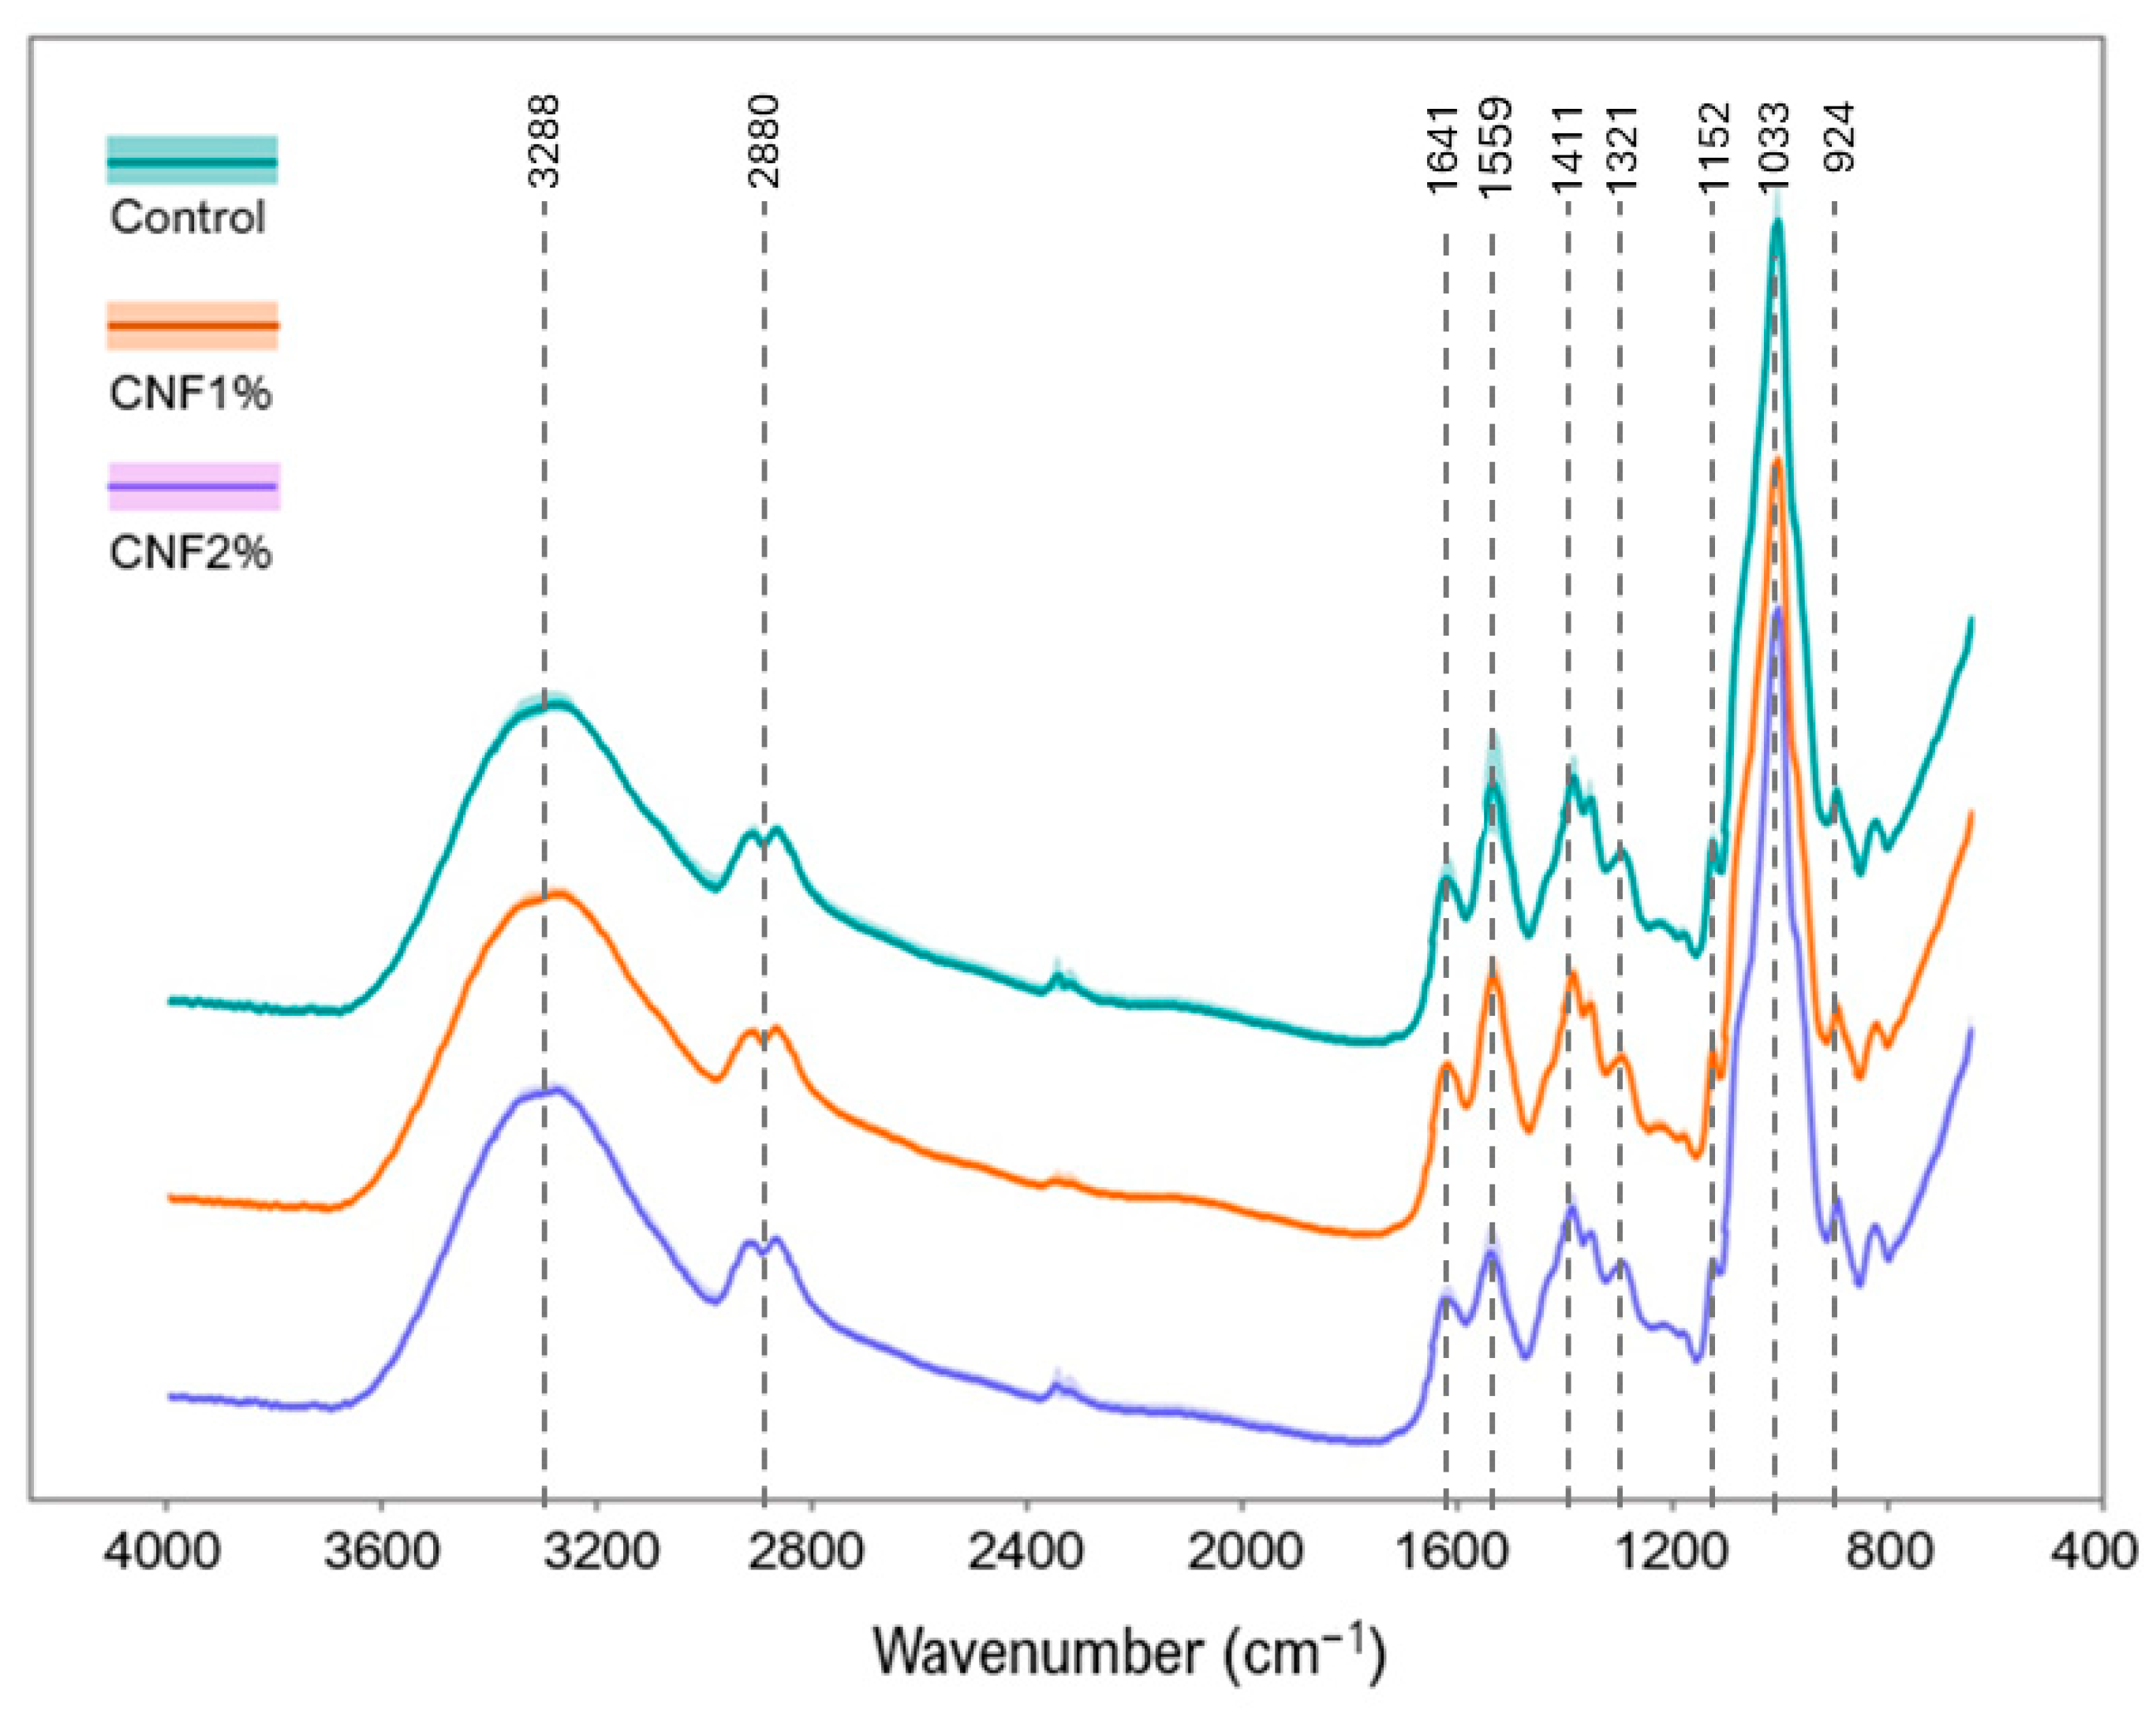
Attenuated total reflectance–Fourier transform infrared (ATR-FTIR) spectra of all the films were obtained and are shown in Figure 7. ATR-FTIR evaluated the potential chemical and structural interactions between chitosan and cellulose nanofibrils (CNF) incorporated into the chitosan-based films as a reinforcement agent. The FTIR spectrum of the CNFs themselves, isolated from S. ramosissima by-products, has been reported and discussed in detail in a previous study by Lima et al. [29], where the characteristic cellulose bands of these nanofibrils were assigned; therefore, the present work focuses on the changes observed in the film spectra upon CNF incorporation.
Figure 7. Attenuated total reflectance–Fourier transform infrared (ATR-FTIR) spectra of chitosan-based films reinforced with different CNF concentrations (0, 1 and 2 wt.%). ATR-FTIR spectra, for each film, are shown as absorbance values (in arbitrary units (A.U.)) of 4 averaged spectra (solid line) ± standard deviation (shaded ribbon).
The ATR-FTIR spectra exhibited similar patterns for the control, CNF1%, and CNF2% films. However, a flattening of certain bands was observed in the control film, whereas a subtle increase in the intensity of other bands was detected in the films reinforced with CNFs. This behaviour has been described by previous studies that have utilised nanocellulose in chitosan-based films [26,27].
The bands observed in the region of 3200–3400 cm−1 correspond to the N–H stretching vibrations of primary amino groups and the O–H stretching of polysaccharides. These bands, along with the bands 2850–2990 cm−1 corresponding to CH2 and CH3 stretching, are indicative of the presence of cellulose [27,62,63]. The bands 1641–1642 cm−1 can be ascribed to the C–O stretching of amides (amides I) and the O–H bending of absorbed water, the bands 1558–1562 cm−1 correspond to N–H bending and C–N stretching of amides (amide II), while the bands 1411 cm−1 are associated with the stretching of the C–H group [27,63,64,65,66,67].
Bourtoom & Chinnan [68] linked the bands 1321 cm−1 to the O–H of water molecules. The bands 1152 cm−1 can be associated with the symmetric C–O–C stretching, while the bands 1033 cm−1 with the C–O stretching of glycogen [27,65,66,67]. Finally, the 924 cm−1 bands suggest C–O–H out-of-plane bending and CH2 twisting [69].
The incorporation of low nanofillers (1 and 2%) led to only subtle changes in the stretching bands characteristic of cellulose compared to the typical spectra of chitosan. However, the higher intensity of the broad band at around 3288 cm−1 bands in the CNF2% film, relative to the CNF1% and control films, is consistent with an increased density of hydrogen bonding involving O-H and N-H groups in the chitosan–CNF network [27,28,60]. In line with previous studies on chitosan films reinforced with cellulose nanofibrils, these spectral features support the presence of strong intermolecular interactions rather than the formation of new functional groups [27,70].

3.7. Degradability Tests

3.7.1. Biodegradation in Soil

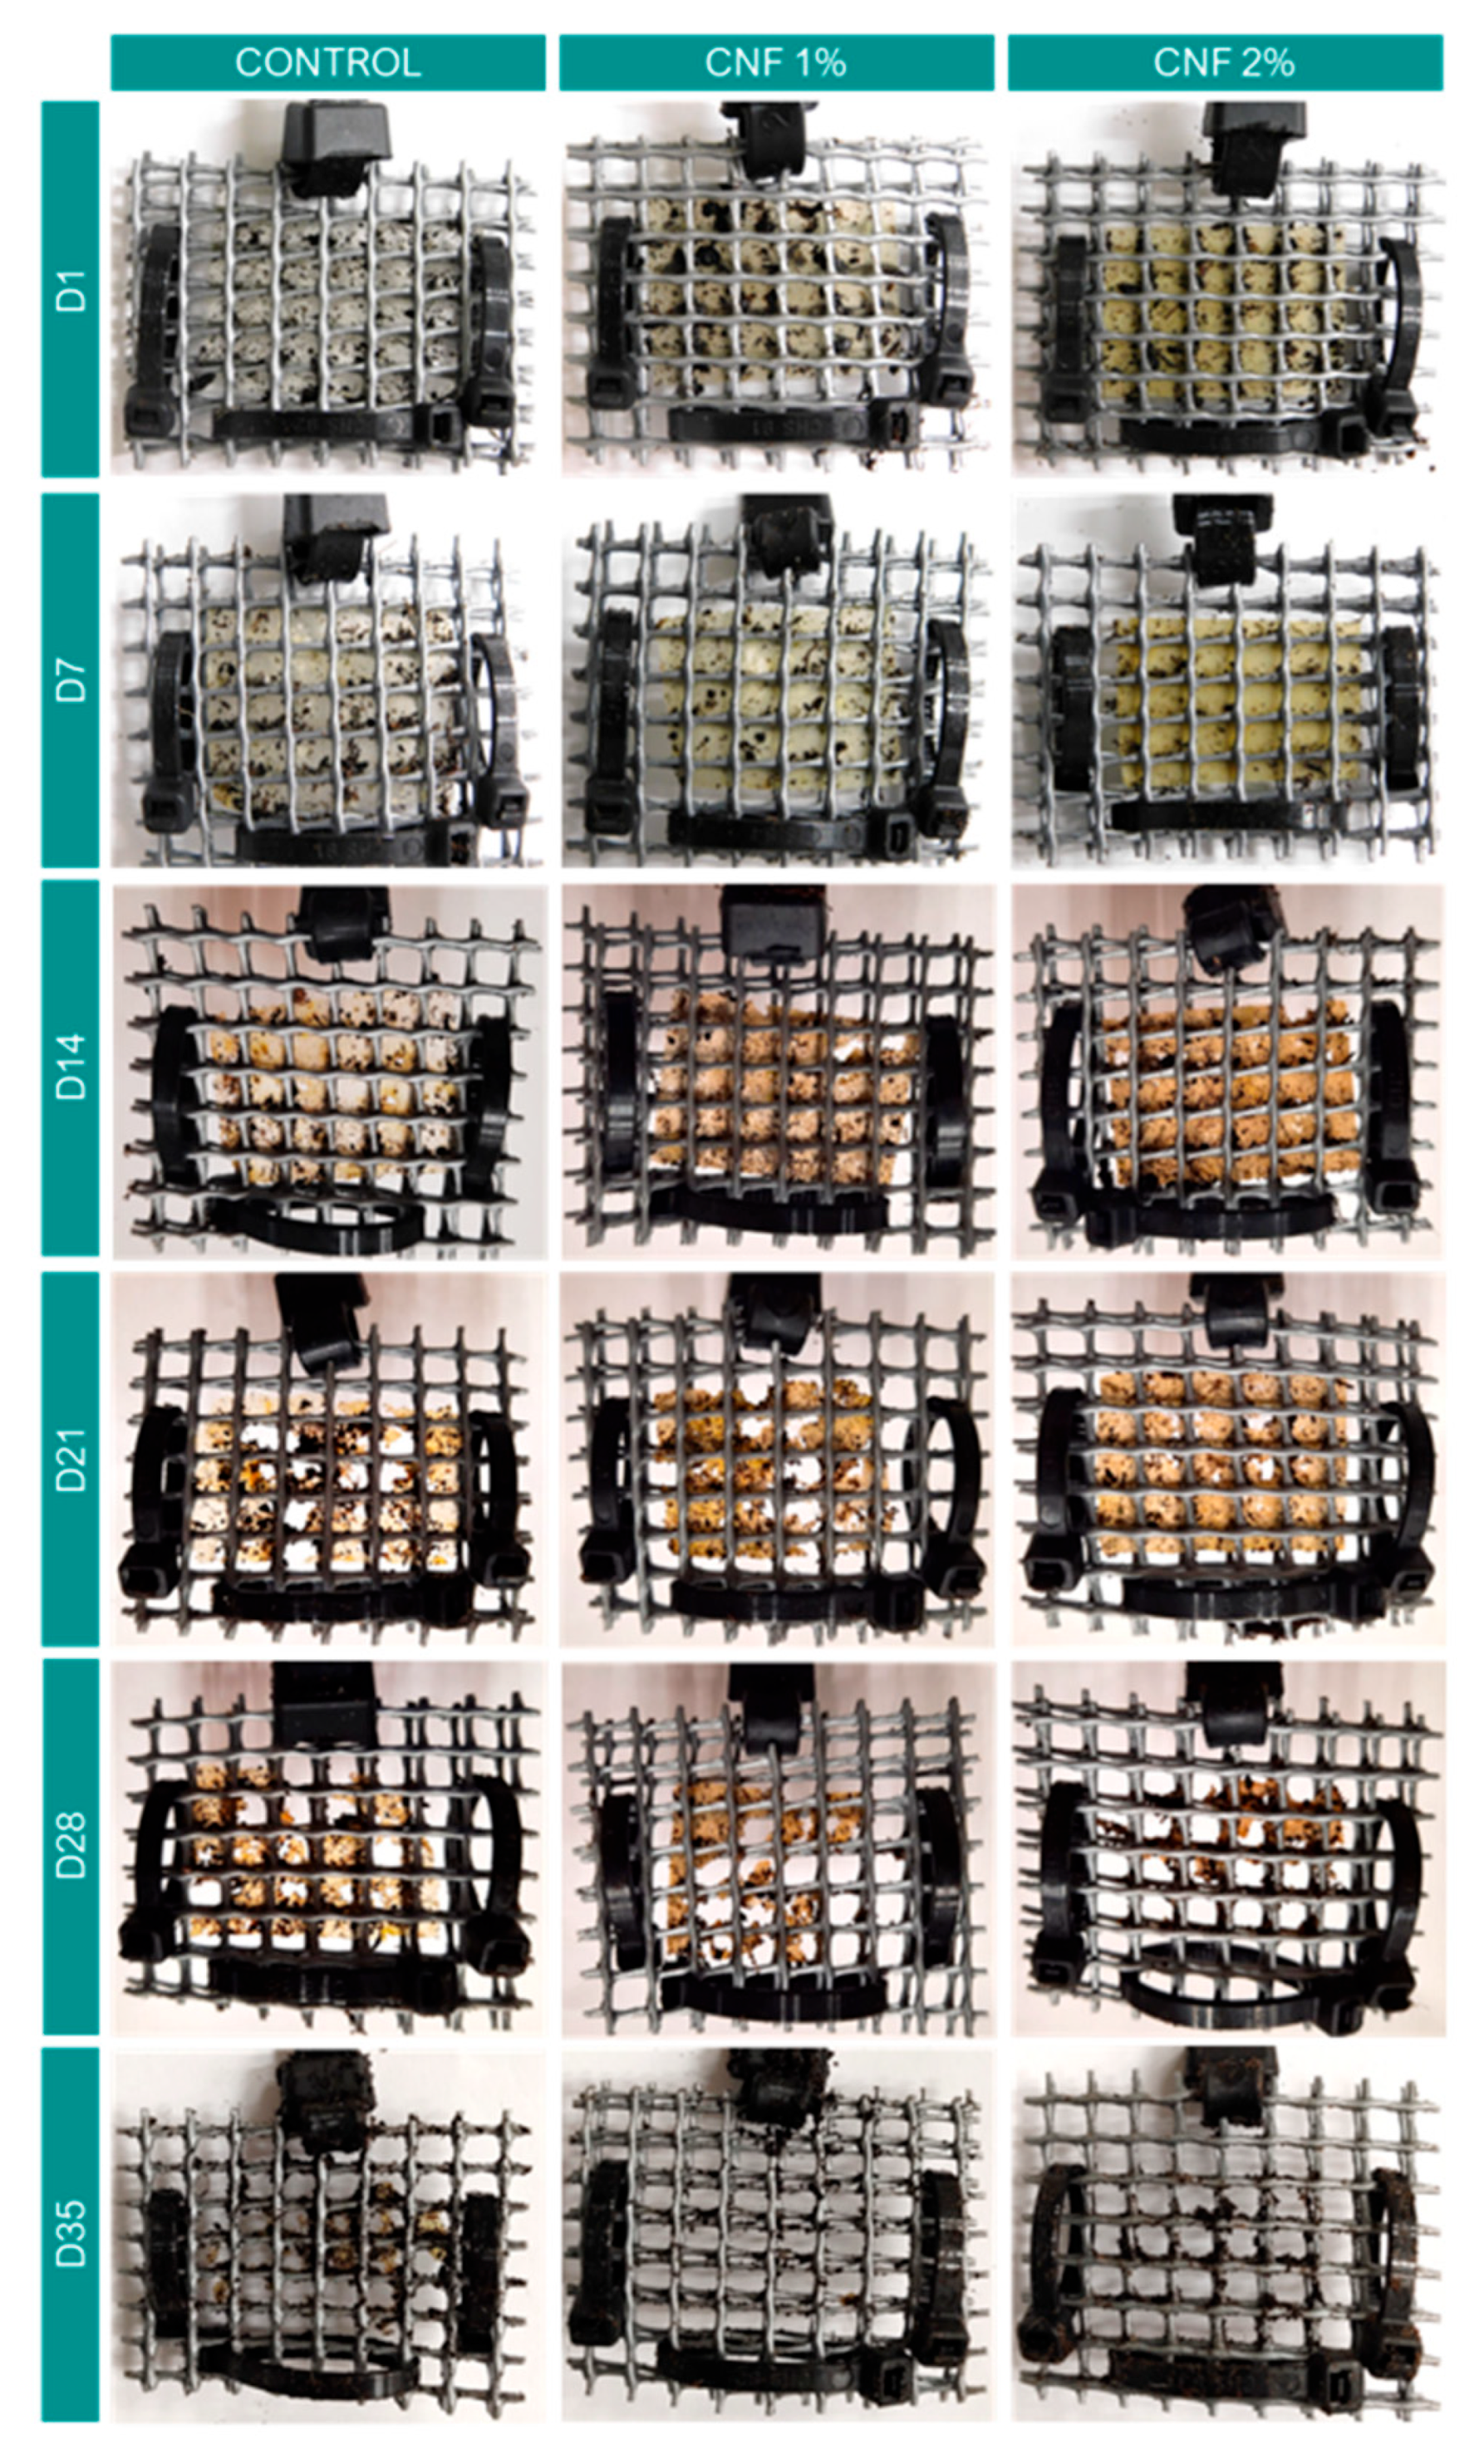
Chitosan-based films (control and CNF-reinforced) were subjected to degradation tests in soil under controlled conditions of temperature, humidity, and time. Figure 8 shows the films’ structural changes over 35 days. All films showed the first structural changes and signs of water absorption on day 7. Overall, the chitosan-based films are degradable in soil because microorganisms can break them down. In this sense, the literature reports that several microorganisms can promote polymer degradation in soil, including Pseudomonas aeruginosa, Bacillus megaterium, Aspergillus Fumigatus, Beauveria bassiana, Rhodococcus ruber, Serratia marcescens, and filamentous fungi [71,72,73]. According to Wrońska et al. [3], a diverse microbial community in the soil accelerates degradation by using chitosan as a carbon and nitrogen source. Additionally, hot, humid soil conditions with slightly acidic pH can accelerate degradation [74].
Figure 8. Evolution of the biodegradability in the soil of the chitosan-based films reinforced with different CNF concentrations (0, 1 and 2 wt.%).
After 7 days, the control film had a degradation of 7%, while the CNF1% and CNF2% films showed degradation of only 2%. From day 21 onwards, the degradation of the nanofibers-reinforced films increased by more than 20% per week. By day 28, all films had degradation between 60% and 90%. After 35 days, all samples had degraded by more than 95% (with CNF-reinforced films completely degraded). The degradation rates (%) of the films over time are presented in Figure S2 in the Supplementary Materials. This result meets the European Committee for Standardization’s definition (EN 13432:2000) [75] for degradability due to biological action, which is a degradation rate of 90% within 6 months. Oberlintner et al. [76] and Wrońska et al. [3] reported that chitosan-based films completely degrade in soil within 1 to 8 weeks under controlled conditions of humidity, temperature, and microbial presence. These values are consistent with the 4 weeks reported in this study. Therefore, chitosan-based films reinforced with CNF are a promising biodegradable, renewable, and non-toxic alternative to non-degradable synthetic plastics. Nevertheless, these findings should be viewed as preliminary, as the degradation behaviour of such materials is strongly influenced by the microbiocenosis of a given soil, and a detailed characterisation of the soil microbial community represents an important next step to better understand and predict their environmental performance.

3.7.2. Degradation in Seawater

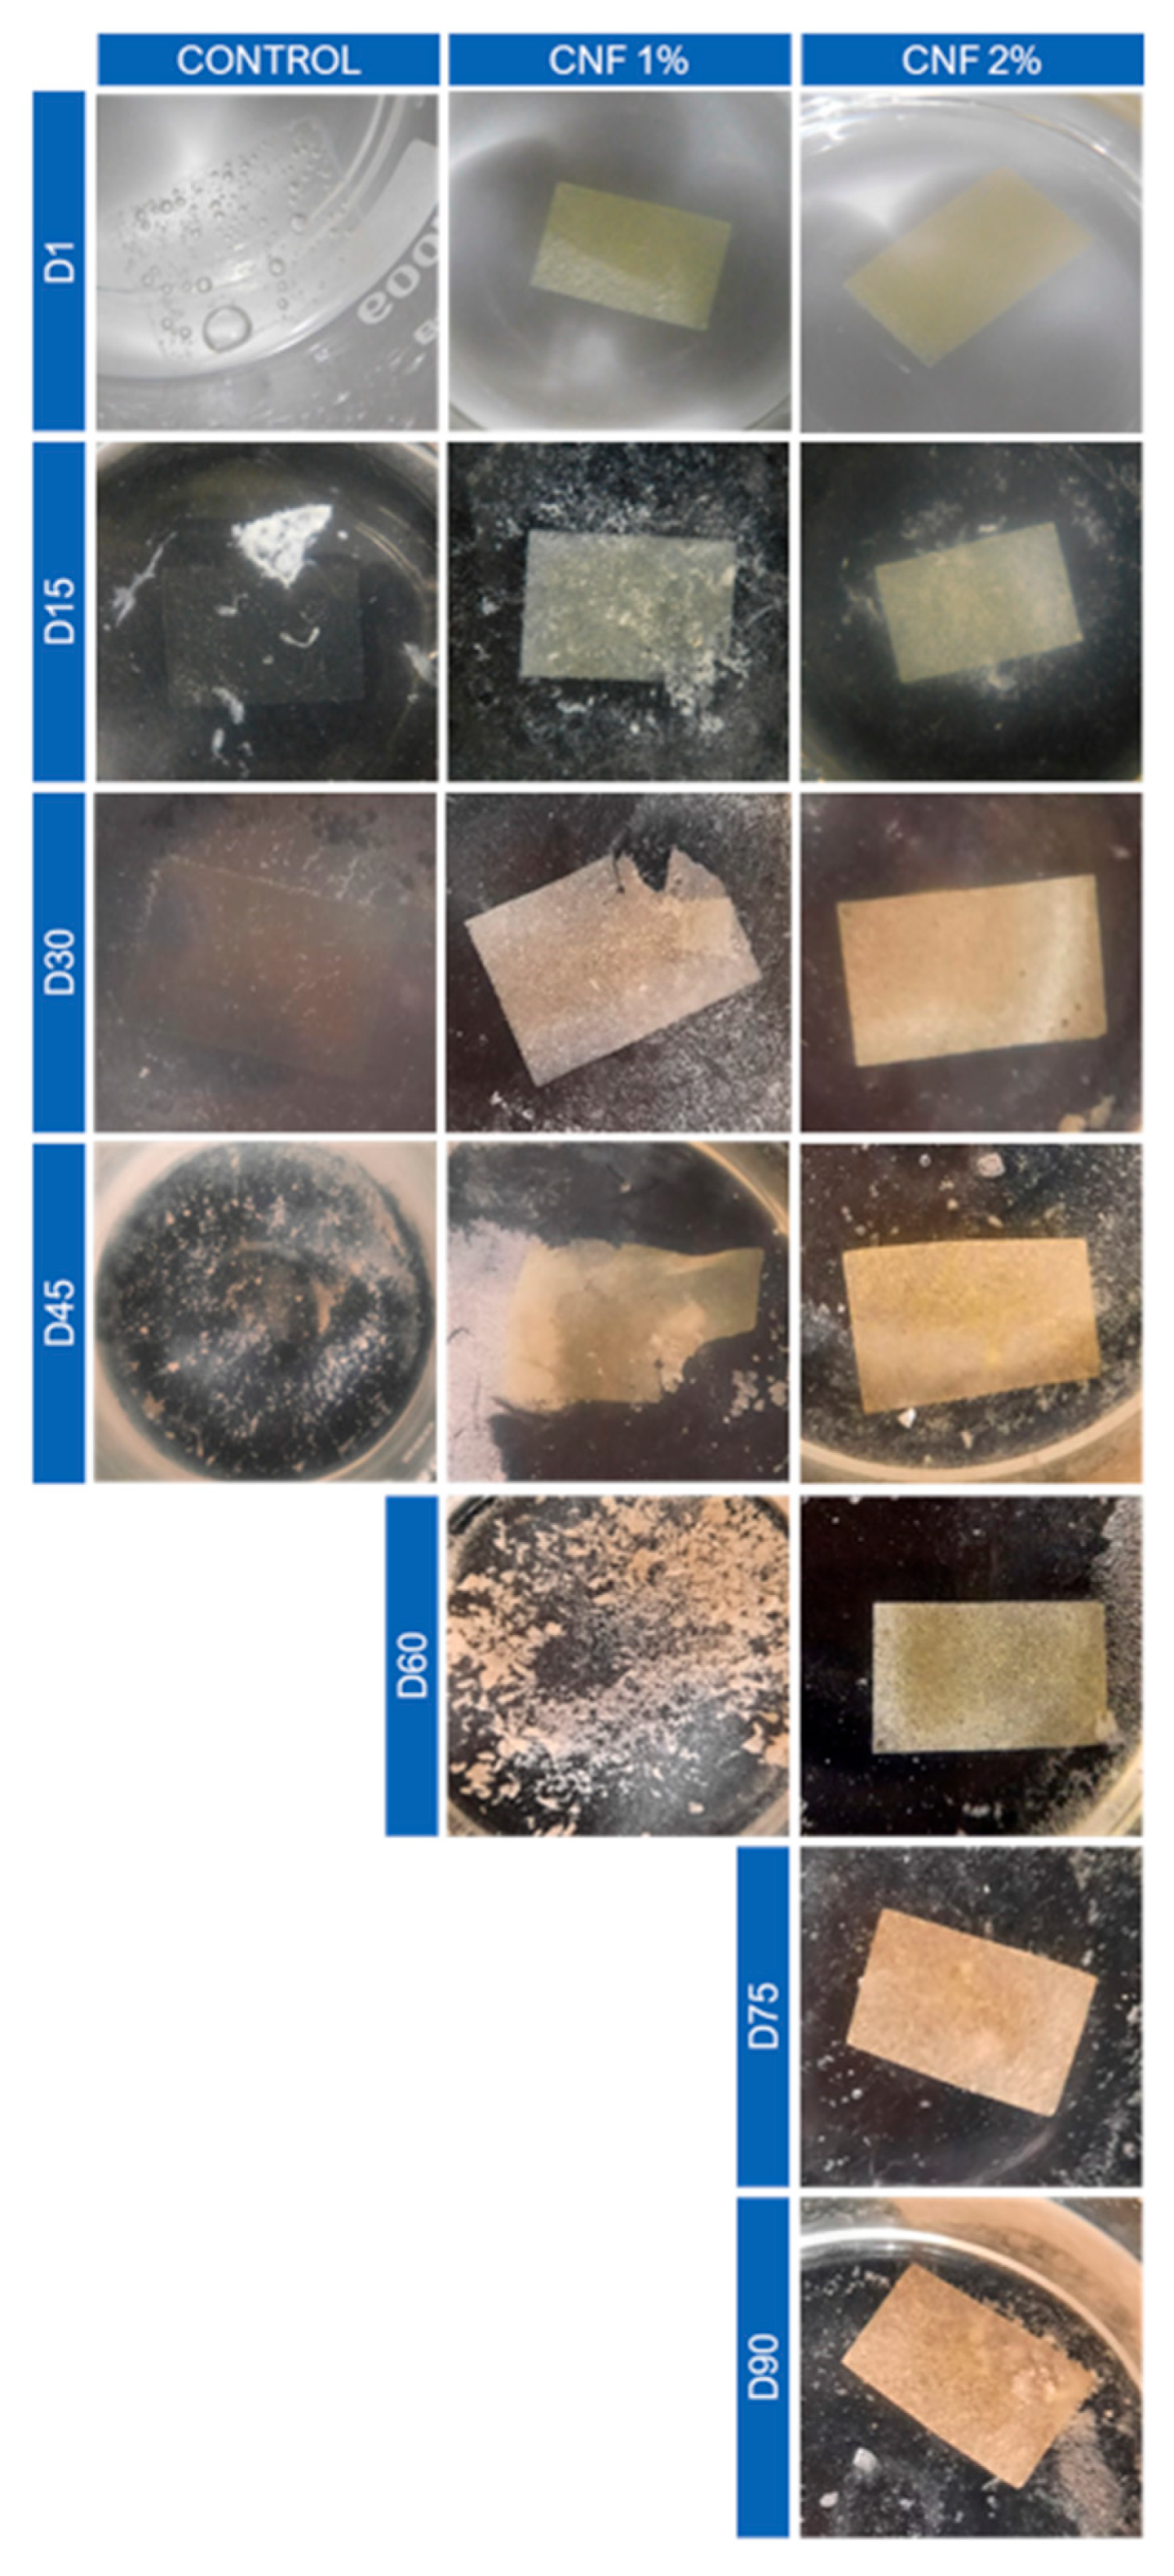
In this study, we analysed the degradation capacity and time of control chitosan-based films and those reinforced with CNF 1 and 2% (Figure 9). Chitosan-based films are considered bioplastics that are potentially degradable in seawater. In general, this degradation is caused by microorganisms, including algae and bacteria. However, aquatic ecosystems are variable and have unique characteristics, which makes it difficult to standardise degradation studies in this environment [77,78].
Figure 9. Evolution of the degradability in the seawater of the chitosan-based films reinforced with different CNF concentrations (0, 1 and 2 wt.%).
On the 15th day, it was observed that both the control film and the films reinforced with CNF showed an increase in turbidity and the presence of microparticles dispersed in the seawater. Additionally, the CNF1% film displayed some signs of fragmentation at one end. This result is according to Pereira et al. [41], who found that pectin films with S. ramosissima demonstrated an increase in turbidity from the eighth day of degradability testing due to the transfer of salts and pigments from the films to the seawater. From the 30th day onwards, the water in the control film exhibited high turbidity. Furthermore, the control sample was reduced to a thin layer at the bottom of the seawater container. The CNF1% film appeared significantly fragmented, while the CNF2% film remained visually intact, with only a few microparticles dispersed in the seawater.
On the 45th day, the control film had completely fragmented. Meanwhile, the CNF1% film showed evidence of advanced fragmentation, and the CNF2% film displayed slower fragmentation but with a noticeable increase in the number of microparticles dispersed in the seawater. This difference in fragmentation capacity between the films may be attributed to the varying compositions of the films. The presence of other components, such as additives and polymers (CNFs as a reinforcing agent in this case), can have influenced the degradation time.
At the end of the 60th day, the CNF1% film was completely fragmented, whereas the CNF2% film remained intact until the 90th day, the deadline of the experiment. The 90-day experiment duration was based on ISO 14853:2016 standard method [79], which stipulates up to 90 days for plastic degradation in aquatic ecosystems under controlled conditions. Nonetheless, this timespan was established for comparison purposes only, as the methods and variables employed in this study differ from those outlined in ISO standards for plastic degradation in aquatic systems.
In general, the hydrophilic characteristic of chitosan and the relatively weak chemical bonds between its linear polymer chains render chitosan soluble and susceptible to breakdown by microorganisms present in seawater. Degradation of the control film within 45 days supports this conclusion. On the other hand, the addition of CNFs acted as a bridge between the chitosan molecules, reinforcing the chemical bonds. This structural reinforcement not only improved the films’ thermal and mechanical stability (consistent with prior findings) but also increased their degradation resistance.

4. Conclusions

The study successfully developed chitosan films reinforced with cellulose nanofibers (CNFs) derived from the stems and roots, a by-product of greenhouse-cultivated S. ramosissima. Incorporation of CNFs improved the mechanical performance of the films, increasing tensile strength and Young’s modulus while reducing elongation at break, with a CNF content of 1% providing the best compromise between mechanical reinforcement and flexibility. CNF markedly modulated the moisture barrier behaviour: at 45% RH it increased the activation energy of permeation without substantially affecting WVTR; at 75% RH, 1% CNF maximised WVTR with lower Ea; and at 95% RH, 1% CNF reduced WVTR whereas 2% CNF increased Ea, suggesting the formation of more structured, humidity dependent diffusion pathways. From a thermal perspective, addition of 1% CNF maintained or slightly improved film stability, whereas 2% CNF reduced thermal stability, indicating that higher reinforcement loadings are not recommended for applications requiring enhanced thermal resistance. SEM and ATR FTIR analyses showed that CNF reinforcement makes the film surface more heterogeneous. Degradation tests confirmed that all films remained degradable in soil, with complete disintegration within 30 days, while in seawater, the presence of CNFs increased resistance to degradation, with the 1% CNF formulation offering the best balance between functional performance and controlled degradation. Overall, chitosan-based films are intrinsically limited as matrix materials by their relatively low mechanical strength and thermal stability, together with limited moisture barrier performance and high sensitivity to humidity, if compared with other biopolymers. These characteristics may restrict their suitability for specific packaging applications. Consequently, further studies are required to optimise film properties through new formulations, the incorporation of other polymers or, depending on the targeted performance, the development of multilayer films, as well as to evaluate the technical and economic feasibility of scaling up the process to pilot scale.

Supplementary Materials

The following supporting information can be downloaded at https://www.mdpi.com/article/10.3390/agriengineering8040141/s1, Table S1: Parameters of the multivariate model; Table S2: Thermogravimetric parameters of chitosan-based films reinforced with CNF; Figure S1: Visual aspect of chitosan-based films (A) control, (B) CNF1%, and (C) CNF2%; Figure S2: Soil degradation rate of chitosan-based films reinforced with CNF (0, 1 and 2 wt.%).

Author Contributions

Conceptualization, A.R.L. and M.C.V.; methodology, A.R.L., N.L.C. and M.C.V.; validation, A.R.L. and M.C.V.; formal analysis A.R.L., L.S., A.K., N.L.C., A.C.Q. and R.A.A.; investigation, A.R.L., N.L.C., J.A.S. and M.C.V.; data curation, A.R.L., N.L.C. and M.C.V.; writing—original draft preparation, A.R.L. and M.C.V.; writing—review and editing, A.R.L., N.L.C., J.A.S. and M.C.V.; supervision, J.A.S. and M.C.V. All authors have read and agreed to the published version of the manuscript.

Funding

The authors further acknowledge the R&D unit MED—Mediterranean Institute for Agriculture, Environment and Development (https://doi.org/10.54499/UIDB/05183/2020; https://doi.org/10.54499/UIDP/05183/2020) (accessed on 10 January 2026) and the Associate Laboratory CHANGE—Global Change and Sustainability Institute (https://doi.org/10.54499/LA/P/0121/2020) (accessed on 10 January 2026) and project UIDB/50006/2020 and UIDP/50006/2020—Laboratório Associado para a Química Verde—66 e Processos Limpos. The scholarships of the first second and fourth authors, A.R.L., N.L.C., A.C.Q. and R.A.A., were funded by the Portuguese Foundation for Science and Technology (FCT) through FCT PhD grants https://doi.org/10.54499/SFRH/BD/149398/2019; https://doi.org/10.54499/SFRH/BD/149395/2019 (accessed on 10 January 2026); 2024.04673.BD and SFRH/BD/146009/2019, respectively.

Institutional Review Board Statement

Not applicable.

Data Availability Statement

The original contributions presented in the study are included in the article. Further inquiries can be directed to the corresponding author.

Acknowledgments

The authors acknowledge Miguel Salazar and Carla Nunes from RiaFresh® (Faro, Portugal) for their support in this project, kindly providing the Salicornia ramosissima agro-industrial by-products.

Conflicts of Interest

The authors declare no conflicts of interest.

Abbreviations

The following abbreviations are used in this manuscript:
CNFCellulose nanofibers
WVTRWater vapour transmission rate
SEMScanning electron microscopy
MWMass weight
EUEuropean Union
RHRelative humidity
DDiffusion coefficient
CConcentration
Al2O3Aluminium oxide
TGAThermogravimetry analysis
MPaMegapascal
ATR-FTIRAttenuated total reflectance–Fourier transform infrared
ORPOxidation–reduction potential
ANOVAAnalysis of variance
CNCCellulose nanocrystals
ETotal colour variance
TSTensile strength
YMYoung’s modulus
EBElongation at break
PLAPolylactic acid
DTGDerivative thermogravimetry

References

  1. Kiessling, T.; Hinzmann, M.; Mederake, L.; Dittmann, S.; Brennecke, D. What Potential Does the EU Single-Use Plastics Directive Have for Reducing Plastic Pollution at Coastlines and Riversides ? An Evaluation Based on Citizen Science Data. Waste Manag. 2023, 164, 106–118. [Google Scholar] [CrossRef] [Scilit]
  2. Wang, C.; Zhao, L.; Lim, M.K.; Chen, W.; Sutherland, J.W. Structure of the Global Plastic Waste Trade Network and the Impact of China’s Import Ban. Resour. Conserv. Recycl. 2020, 153, 104591. [Google Scholar] [CrossRef] [Scilit]
  3. Wrońska, N.; Katir, N.; Nowak-Lange, M.; El Kadid, A.; Lisowska, K. Biodegradable Chitosan-Based Films as an Alternative to Plastic Packaging. Foods 2023, 12, 3519. [Google Scholar] [CrossRef] [Scilit] [PubMed]
  4. Cristofoli, N.L.; Lima, A.R.; Tchonkouang, R.D.N.; Quintino, A.C.; Vieira, M.C. Advances in the Food Packaging Production from Agri-Food Waste and By-Products: Market Trends for a Sustainable Development. Sustainability 2023, 15, 6153. [Google Scholar] [CrossRef] [Scilit]
  5. Orcutt, K.; McCaffrey, Z.; Klamczynski, A.P.; Blount, J.; Cheng, Y.; Raliya, R.; Kim, J.H.; Orts, W.J.; Hart-Cooper, W.M. Environmental Influence on Degradation of Chitosan Bioplastics. ACS Omega 2025, 10, 45220–45231. [Google Scholar] [CrossRef] [Scilit]
  6. Kumar, A.; Kumar, A.; Wei, S.; Chopra, S.; Rudra, S.G.; Rabbani, A. Biodegradable and Smart Packaging Films for Food Quality and Safety: A Review. Appl. Food Res. 2025, 5, 101491. [Google Scholar] [CrossRef] [Scilit]
  7. Mohammadi Sadati, S.M.; Shahgholian-Ghahfarrokhi, N.; Shahrousvand, E.; Mohammadi-Rovshandeh, J.; Shahrousvand, M. Edible Chitosan/Cellulose Nanofiber Nanocomposite Films for Potential Use as Food Packaging. Mater. Technol. 2022, 37, 1276–1288. [Google Scholar] [CrossRef] [Scilit]
  8. Jiang, A.; Patel, R.; Padhan, B.; Palimkar, S.; Galgali, P.; Adhikari, A.; Varga, I.; Patel, M. Chitosan Based Biodegradable Composite for Antibacterial Food Packaging Application. Polymers 2023, 15, 2235. [Google Scholar] [CrossRef] [Scilit]
  9. Van Hai, L.; Zhai, L.; Kim, H.C.; Panicker, P.S.; Pham, D.H.; Kim, J. Chitosan Nanofiber and Cellulose Nanofiber Blended Composite Applicable for Active Food Packaging. Nanomaterials 2020, 10, 1752. [Google Scholar] [CrossRef] [Scilit]
  10. Qu, T.; Wang, X.; Zhang, F. Antibacterial Food Packaging with Chitosan and Cellulose Blends for Food Preservation. Polymers 2025, 17, 1850. [Google Scholar] [CrossRef] [Scilit]
  11. Abral, H.; Pratama, A.B.; Handayani, D.; Mahardika, M.; Aminah, I.; Sandrawati, N.; Sugiarti, E.; Muslimin, A.N.; Sapuan, S.M.; Ilyas, R.A. Antimicrobial Edible Film Prepared from Bacterial Cellulose Nanofibers/Starch/Chitosan for a Food Packaging Alternative. Int. J. Polym. Sci. 2021, 2021, 6641284. [Google Scholar] [CrossRef] [Scilit]
  12. Hulkko, L.S.S.; Rocha, R.M.; Trentin, R.; Fredsgaard, M.; Chaturvedi, T.; Custódio, L.; Thomsen, M.H. Bioactive Extracts from Salicornia Ramosissima, J. Woods Biorefinery as a Source of Ingredients for High-Value Industries. Plants 2023, 12, 1251. [Google Scholar] [CrossRef] [Scilit] [PubMed]
  13. Swiontek Brzezinska, M.; Shinde, A.H.; Kaczmarek-Szczepańska, B.; Jankiewicz, U.; Urbaniak, J.; Boczkowski, S.; Zasada, L.; Ciesielska, M.; Dembińska, K.; Pałubicka, K.; et al. Biodegradability Study of Modified Chitosan Films with Cinnamic Acid and Ellagic Acid in Soil. Polymers 2024, 16, 574. [Google Scholar] [CrossRef] [Scilit] [PubMed]
  14. Yazdi, J.S.; Salari, M.; Ehrampoush, M.H.; Bakouei, M. Development of Active Chitosan Film Containing Bacterial Cellulose Nanofibers and Silver Nanoparticles for Bread Packaging. Food Sci. Nutr. 2024, 12, 8186–8199. [Google Scholar] [CrossRef] [Scilit] [PubMed]
  15. Marotta, A.; Borriello, A.; Khan, M.R.; Cavella, S.; Ambrogi, V.; Torrieri, E. Boosting Food Packaging Sustainability Through the Valorization of Agri-Food Waste and By-Products. Polymers 2025, 17, 735. [Google Scholar] [CrossRef] [Scilit]
  16. Kumar Gupta, R.; AE Ali, E.; Abd El Gawad, F.; Mecheal Daood, V.; Sabry, H.; Karunanithi, S.; Prakash Srivastav, P. Valorization of Fruits and Vegetables Waste Byproducts for Development of Sustainable Food Packaging Applications. Waste Manag. Bull. 2024, 2, 21–40. [Google Scholar] [CrossRef] [Scilit]
  17. Karimi Sani, I.; Masoudpour-Behabadi, M.; Alizadeh Sani, M.; Motalebinejad, H.; Juma, A.S.M.; Asdagh, A.; Eghbaljoo, H.; Khodaei, S.M.; Rhim, J.W.; Mohammadi, F. Value-Added Utilization of Fruit and Vegetable Processing by-Products for the Manufacture of Biodegradable Food Packaging Films. Food Chem. 2023, 405, 134964. [Google Scholar] [CrossRef] [Scilit]
  18. Paudel, S.; Regmi, S.; Bhattarai, S.; Fennell, A.; Janaswamy, S. Valorization of Grapevine Agricultural Waste into Transparent and High-Strength Biodegradable Films for Sustainable Packaging. Sustain. Food Technol. 2025, 3, 1218–1231. [Google Scholar] [CrossRef] [Scilit]
  19. Ali, M.Q.; Ahmad, N.; Azhar, M.A.; Munaim, M.S.A.; Ruslan, N.F. Fruit and Vegetable By-Products: Extraction of Bioactive Compounds and Utilization in Food Biodegradable Material and Packaging. Food Mater. Res. 2025, 5, e004. [Google Scholar] [CrossRef] [Scilit]
  20. Cristofoli, N.L.; Lima, A.R.; Costa, S.; Silva, C.M.; Varela, J.; Vieira, M.C. Exopolysaccharides from Porphyridium Cruentum as a Reinforcing Agent for Chitosan Biopolymer-Based Film. Int. J. Biol. Macromol. 2025, 314, 144310. [Google Scholar] [CrossRef] [Scilit]
  21. Adilah, A.N.; Jamilah, B.; Noranizan, M.A.; Hanani, Z.A.N. Utilization of Mango Peel Extracts on the Biodegradable Films for Active Packaging. Food Packag. Shelf Life 2018, 16, 1–7. [Google Scholar] [CrossRef] [Scilit]
  22. Manrich, A.; Moreira, F.K.V.; Otoni, C.G.; Lorevice, M.V.; Martins, M.A.; Mattoso, L.H.C. Hydrophobic Edible Films Made up of Tomato Cutin and Pectin. Carbohydr. Polym. 2017, 164, 83–91. [Google Scholar] [CrossRef] [Scilit] [PubMed]
  23. Braga, D.G.; Bezerra, P.G.F.; Lima, A.B.F.D.; Pinheiro, H.A.; Gomes, L.G.; Fonseca, A.S.; Bufalino, L. Chitosan-Based Films Reinforced with Cellulose Nanofibrils Isolated from Euterpe Oleraceae MART. Polym. Renew. Resour. 2021, 12, 46–59. [Google Scholar] [CrossRef] [Scilit]
  24. Celebi, H.; Kurt, A. Effects of Processing on the Properties of Chitosan/Cellulose Nanocrystal Films. Carbohydr. Polym. 2015, 133, 284–293. [Google Scholar] [CrossRef] [Scilit] [PubMed]
  25. Visco, A.; Scolaro, C.; Facchin, M.; Brahimi, S.; Belhamdi, H.; Gatto, V.; Beghetto, V. Agri-Food Wastes for Bioplastics: European Prospective on Possible Applications in Their Second Life for a Circular Economy. Polymers 2022, 14, 2752. [Google Scholar] [CrossRef] [Scilit]
  26. Corsello, F.A.; Bolla, P.A.; Anbinder, P.S.; Serradell, M.A.; Amalvy, J.I.; Peruzzo, P.J. Morphology and Properties of Neutralized Chitosan-Cellulose Nanocrystals Biocomposite Films. Carbohydr. Polym. 2017, 156, 452–459. [Google Scholar] [CrossRef] [Scilit]
  27. Costa, S.M.; Ferreira, D.P.; Teixeira, P.; Ballesteros, L.F.; Teixeira, J.A.; Fangueiro, R. Active Natural-Based Films for Food Packaging Applications: The Combined Effect of Chitosan and Nanocellulose. Int. J. Biol. Macromol. 2021, 177, 241–251. [Google Scholar] [CrossRef] [Scilit]
  28. Mujtaba, M.; Salaberria, A.M.; Andres, M.A.; Kaya, M.; Gunyakti, A.; Labidi, J. Utilization of Flax Linum Usitatissimum Cellulose Nanocrystals as Reinforcing Material for Chitosan Films. Int. J. Biol. Macromol. 2017, 104, 944–952. [Google Scholar] [CrossRef] [Scilit]
  29. Lima, A.R.; Cristofoli, N.L.; Rosa da Costa, A.M.; Saraiva, J.A.; Vieira, M.C. Comparative Study of the Production of Cellulose Nanofibers from Agro-Industrial Waste Streams of Salicornia Ramosissima by Acid and Enzymatic Treatment. Food Bioprod. Process. 2023, 137, 214–225. [Google Scholar] [CrossRef] [Scilit]
  30. Lima, A.R.; Cristofoli, N.L.; Delahousse, I.; Amaral, R.A.; Saraiva, J.A.; Vieira, M.C. PLA-Based Films Reinforced with Cellulose Nanofibres from Salicornia Ramosissima By-Product with Proof of Concept in High-Pressure Processing. Appl. Sci. 2025, 15, 13247. [Google Scholar] [CrossRef] [Scilit]
  31. ASTM E96/E96M-15; Standard Test Methods for Water Vapor Transmission of Materials. ASTM International: West Conshohocken, PA, USA, 2016.
  32. Robertson, G.L. Food Packaging: Principles and Practice, 3rd ed.; CRC Press (Taylor & Francis Group): Boca Raton, FL, USA, 2012; ISBN 9781439862421. [Google Scholar]
  33. Daynes, H.A. The Process of Diffusion through a Rubber Membrane. R. Soc. Publ. 1920, 97, 286. [Google Scholar] [CrossRef] [Scilit]
  34. Crank, J.; Park, G.S. Diffusion in Polymers; Academic Press: London, UK; New York, NY, USA, 1968; Volume 14, ISBN 0121970507. [Google Scholar]
  35. Crank, J. The Mathematics of Diffusion; Oxford University Press: London, UK, 1975; ISBN 0198533446. [Google Scholar]
  36. ASTM D882-18; Standard Test Method for Tensile Properties of Thin Plastic Sheeting. ASTM International: West Conshohocken, PA, USA, 2018.
  37. ASTM E2550-21; Standard Test Method for Thermal Stability by Thermogravimetry. ASTM International: West Conshohocken, PA, USA, 2021.
  38. ASTM D5988-12; Standard Test Method for Determining Aerobic Biodegradation of Plastic Materials in Soil. ASTM International: West Conshohocken, PA, USA, 2012.
  39. Altaee, N.; El-Hiti, G.A.; Fahdil, A.; Sudesh, K.; Yousif, E. Biodegradation of Different Formulations of Polyhydroxybutyrate Films in Soil. Springerplus 2016, 5, 1–12. [Google Scholar] [CrossRef] [Scilit] [PubMed]
  40. Accinelli, C.; Saccà, M.L.; Mencarelli, M.; Vicari, A. Deterioration of Bioplastic Carrier Bags in the Environment and Assessment of a New Recycling Alternative. Chemosphere 2012, 89, 136–143. [Google Scholar] [CrossRef] [Scilit] [PubMed]
  41. Pereira, D.G.M.; Vieira, J.M.; Vicente, A. Development and Characterization of Pectin Films with Salicornia Ramosissima: Biodegradation in Soil and Seawater. Polymers. 2021, 13, 2632. [Google Scholar] [CrossRef] [Scilit]
  42. Hosseini, S.; Rezaei, M.; Zandi, M.; Farahmandghavi, F. Food Hydrocolloids Fabrication of Bio-Nanocomposite Films Based on Fish Gelatin Reinforced with Chitosan Nanoparticles. Food Hydrocoll. 2015, 44, 172–182. [Google Scholar] [CrossRef] [Scilit]
  43. Pinem, M.P.; Wardhono, E.Y.; Nadaud, F.; Clausse, D.; Saleh, K.; Guénin, E. Nanofluid to Nanocomposite Film: Chitosan and Cellulose-Based Edible Packaging. Nanomaterials 2020, 10, 660. [Google Scholar] [CrossRef] [Scilit]
  44. Shih, Y.; Zhao, Y. Development, Characterization and Validation of Starch Based Biocomposite Films Reinforced by Cellulose Nanofiber as Edible Muffin Liner. Food Packag. Shelf Life 2021, 28, 100655. [Google Scholar] [CrossRef] [Scilit]
  45. Yang, W.; Owczarek, J.S.; Fortunati, E.; Kozanecki, M.; Mazzaglia, A.; Balestra, G.M.; Kenny, J.M.; Torre, L.; Puglia, D. Antioxidant and Antibacterial Lignin Nanoparticles in Polyvinyl Alcohol/Chitosan Films for Active Packaging. Ind. Crops Prod. 2016, 94, 800–811. [Google Scholar] [CrossRef] [Scilit]
  46. Talebi, H.; Ghasemi, F.A.; Ashori, A. The Effect of Nanocellulose on Mechanical and Physical Properties of Chitosan-Based Biocomposites. J. Elastomers Plast. 2022, 54, 1–20. [Google Scholar] [CrossRef] [Scilit]
  47. Yadav, M.; Behera, K.; Chang, Y.; Chiu, F. Cellulose Nanocrystal Reinforced Chitosan Based UV Barrier Composite Films for Sustainable Packaging. Polymers 2020, 12, 202. [Google Scholar] [CrossRef] [Scilit]
  48. Wexler, A.; Hasegawa, S. Relative Humidity-Temperature Relationships of Some Saturated Salt Solutions in the Temperature Range 0 Degree to 50 Degrees C. J. Res. Natl. Bur. Stand. 1954, 53, 19. [Google Scholar] [CrossRef] [Scilit]
  49. Siracusa, V. Food Packaging Permeability Behaviour: A Report. Int. J. Polym. Sci. 2012, 2012, 302029. [Google Scholar] [CrossRef] [Scilit]
  50. Mujtaba, M.; Fernández-Marín, R.; Robles, E.; Labidi, J.; Yilmaz, B.A.; Nefzi, H. Understanding the Effects of Copolymerized Cellulose Nanofibers and Diatomite Nanocomposite on Blend Chitosan Films. Carbohydr. Polym. 2021, 271, 118424. [Google Scholar] [CrossRef] [Scilit] [PubMed]
  51. Duncan, B.; Urquhart, J.; Roberts, S. Review of Measurement and Modelling of Permeation and Diffusion in Polymers; National Physical Laboratory: Teddington, UK, 2005. [Google Scholar]
  52. Klopffer, M.H.; Flaconneche, B. Transport Properties of Gases in Polymers: Bibliographic Review. Oil Gas Sci. Technol. 2001, 56, 223–244. [Google Scholar] [CrossRef] [Scilit]
  53. Monteleone, M.; Esposito, E.; Fuoco, A.; Lanč, M.; Pilnáček, K.; Friess, K.; Bezzu, C.G.; Carta, M.; McKeown, N.B.; Jansen, J.C. A Novel Time Lag Method for the Analysis of Mixed Gas Diffusion in Polymeric Membranes by On-Line Mass Spectrometry: Pressure Dependence of Transport Parameters. Membranes 2018, 8, 73. [Google Scholar] [CrossRef] [Scilit]
  54. Rutherford, S.W.; Do, D.D. Review of Time Lag Permeation Technique as a Method for Characterisation of Porous Media and Membranes. Adsorption 1997, 3, 283–312. [Google Scholar] [CrossRef] [Scilit]
  55. Soni, R.; Asoh, T.; Hsu, Y.; Shimamura, M.; Uyama, H. Effect of Starch Retrogradation on Wet Strength and Durability of Cellulose Nanofiber Reinforced Starch Film. Polym. Degrad. Stab. 2020, 177, 109165. [Google Scholar] [CrossRef] [Scilit]
  56. Abdulkhani, A.; Hosseinzadeh, J.; Ashori, A.; Dadashi, S. Preparation and Characterization of Modi Fi Ed Cellulose Nano Fi Bers Reinforced Polylactic Acid Nanocomposite. Polym. Test. 2014, 35, 73–79. [Google Scholar] [CrossRef] [Scilit]
  57. Niu, X.; Liu, Y.; Song, Y.; Han, J.; Pan, H. Rosin Modified Cellulose Nanofiber as a Reinforcing and Co-Antimicrobial Agents in Polylactic Acid/Chitosan Composite Film for Food Packaging. Carbohydr. Polym. 2018, 183, 102–109. [Google Scholar] [CrossRef] [Scilit]
  58. Ibrahim, M.A.; Alhalafi, M.H.; Eman, E.; Ibrahim, H.; Mosaad, R.M. A Review of Chitosan and Chitosan Nanofiber: Preparation, Characterization, and Its Potential Applications. Polymers 2023, 15, 2820. [Google Scholar] [CrossRef] [Scilit]
  59. Marquez-bravo, S.; Doench, I.; Molina, P.; Bentley, F.E.; Tamo, A.K.; Passieux, R.; Lossada, F.; David, L.; Osorio-madrazo, A. Functional Bionanocomposite Fibers of Chitosan Filled with Cellulose Nanofibers Obtained by Gel Spinning. Polymers 2021, 13, 1563. [Google Scholar] [CrossRef] [Scilit]
  60. Tang, Y.; Zhang, X.; Zhao, R.; Guo, D.; Zhang, J. Preparation and Properties of Chitosan/Guar Gum/Nanocrystalline Cellulose Nanocomposite Films. Carbohydr. Polym. 2018, 197, 128–136. [Google Scholar] [CrossRef] [Scilit] [PubMed]
  61. Baumberger, S.; Lapierre, C.; Monties, B.; Valleb, G. Della Use of Kraft Lignin as Filler for Starch Films. Polym. Degrad. Stab. 1998, 3910, 273–277. [Google Scholar] [CrossRef] [Scilit]
  62. Mendes, J.F.; Norcino, L.B.; Manrich, A.; Pinheiro, A.C.M.; Oliveira, J.E.; Mattoso, L.H.C. Development, Physical-Chemical Properties, and Photodegradation of Pectin Film Reinforced with Malt Bagasse Fibers by Continuous Casting. J. Appl. Polym. Sci. 2020, 137, 1–13. [Google Scholar] [CrossRef] [Scilit]
  63. Nokhasteh, S.; Molavi, A.M.; Khorsand-Ghayeni, M.; Sadeghi-Avalshahr, A. Preparation of PVA/Chitosan Samples by Electrospinning and Film Casting Methods and Evaluating the Effect of Surface Morphology on Their Antibacterial Behavior. Mater. Res. Express 2019, 7, 015401. [Google Scholar] [CrossRef] [Scilit]
  64. Ngo, T.M.P.; Nguyen, T.H.; Dang, T.M.Q.; Tran, T.X.; Rachtanapun, P. Characteristics and Antimicrobial Properties of Active Edible Films Based on Pectin and Nanochitosan. Int. J. Mol. Sci. 2020, 21, 2224. [Google Scholar] [CrossRef] [Scilit]
  65. Rubilar, J.F.; Cruz, R.M.S.; Khmeliskii, I.; Vieira, M.C. Effect of Antioxidant and Optimal Antimicrobial Mixtures of Carvacrol, Grape Seed Extract and Chitosan on Different Spoilage Microorganisms and Their Application as Coatings on Different Food Matrices. Int. J. Food Stud. 2013, 2, 22–38. [Google Scholar] [CrossRef]
  66. Song, X.; Liu, L.; Wu, X.; Liu, Y.; Yuan, J. Chitosan-Based Functional Films Integrated with Magnolol: Characterization, Antioxidant and Antimicrobial Activity and Pork Preservation. Int. J. Mol. Sci. 2021, 22, 7769. [Google Scholar] [CrossRef] [Scilit]
  67. Sun, L.; Sun, J.; Chen, L.; Niu, P.; Yang, X.; Guo, Y. Preparation and Characterization of Chitosan Film Incorporated with Thinned Young Apple Polyphenols as an Active Packaging Material. Carbohydr. Polym. 2017, 163, 81–91. [Google Scholar] [CrossRef] [Scilit]
  68. Bourtoom, T.; Chinnan, M.S. Preparation and Properties of Rice Starch-Chitosan Blend Biodegradable Film. LWT—Food Sci. Technol. 2008, 41, 1633–1641. [Google Scholar] [CrossRef] [Scilit]
  69. Silva, C.L.; Pereira, J.C.; Ramalho, A.; Pais, A.A.C.C.; Sousa, J.J.S. Films Based on Chitosan Polyelectrolyte Complexes for Skin Drug Delivery: Development and Characterization. J. Memb. Sci. 2008, 320, 268–279. [Google Scholar] [CrossRef] [Scilit]
  70. Abdul Khalil, H.P.S.; Saurabh, C.K.; Adnan, A.S.; Nurul Fazita, M.R.; Syakir, M.I.; Davoudpour, Y.; Rafatullah, M.; Abdullah, C.K.; Haafiz, M.K.M.; Dungani, R. A Review on Chitosan-Cellulose Blends and Nanocellulose Reinforced Chitosan Biocomposites: Properties and Their Applications. Carbohydr. Polym. 2016, 150, 216–226. [Google Scholar] [CrossRef] [Scilit]
  71. Makarios-Laham, I.; Lee, T. Biodegradability of Chitin- and Chitosan-Containing Films in Soil Environment. J. Environ. Polym. Degrad. 1995, 3, 31–36. [Google Scholar] [CrossRef] [Scilit]
  72. Paul, M.; Santosh, D. An Approach to Low-Density Polyethylene Biodegradation by Bacillus Amyloliquefaciens. 3 Biotech 2015, 5, 81–86. [Google Scholar] [CrossRef] [Scilit]
  73. Shah, A.A.; Hasan, F.; Hameed, A.; Ahmed, S. Biological Degradation of Plastics: A Comprehensive Review. Biotechnol. Adv. 2008, 26, 246–265. [Google Scholar] [CrossRef] [Scilit] [PubMed]
  74. Sun, Y.; Yang, W.; Shi, H.; Tanveer, S.K.; Hai, J. Past, Present, and Future Perspectives of Biodegradable Films for Soil: A 30-Year Systematic Review. Front. Bioeng. Biotechnol. 2022, 10, 1–20. [Google Scholar] [CrossRef] [Scilit]
  75. EN 13432:2000; Packaging—Requirements for Packaging Recoverable Through Composting and Biodegradation—Test. Scheme and Evaluation Criteria for the Final Acceptance of Packaging. European Committee for Standardization (CEN): Brussels, Belgium, 2000.
  76. Oberlintner, A.; Bajić, M.; Kalčíková, G.; Likozar, B. Biodegradability Study of Active Chitosan Biopolymer Films Enriched with Quercus Polyphenol Extract in Different Soil Types. Environ. Technol. Innov. 2021, 21, 101318. [Google Scholar] [CrossRef] [Scilit]
  77. Beltrán-Sanahuja, A.; Casado-Coy, N.; Simó-Cabrera, L.; Sanz-Lázaro, C. Monitoring Polymer Degradation under Different Conditions in the Marine Environment. Environ. Pollut. 2020, 259, 113836. [Google Scholar] [CrossRef] [Scilit]
  78. Pires, J.R.A.; Souza, V.G.L.; Fuciños, P.; Pastrana, L.; Fernando, A.L. Methodologies to Assess the Biodegradability of Bio-Based Polymers—Current Knowledge and Existing Gaps. Polymers 2022, 14, 1359. [Google Scholar] [CrossRef] [Scilit]
  79. ISO 14853:2016; Plastics–Determination of the Ultimate Anaerobic Biodegradation of Plastic Materials in an Aqueous System–Method by Measurement of Biogas Production. International Organization for Standardization: Geneva, Switzerland, 2016; p. 28.
Disclaimer/Publisher’s Note: The statements, opinions and data contained in all publications are solely those of the individual author(s) and contributor(s) and not of MDPI and/or the editor(s). MDPI and/or the editor(s) disclaim responsibility for any injury to people or property resulting from any ideas, methods, instructions or products referred to in the content.

Article Metrics

Citations

Article Access Statistics

Multiple requests from the same IP address are counted as one view.