Article

Nitrogen Dynamics and Environmental Sustainability in Rice–Crab Co-Culture System: Optimal Fertilization for Sustainable Productivity


1
State Key Laboratory of Efficient Utilization of Arable Land in China, Key Laboratory of Non-Point Source Pollution Control, Ministry of Agriculture and Rural Affairs, Institute of Agricultural Resources and Regional Planning, Chinese Academy of Agricultural Sciences, Beijing 100081, China
2
Liaoning Institute of Saline-Alkali Land Utilization, Liaoning Academy of Agricultural Sciences, Panjin 124010, China
3
Key Laboratory of Low-Carbon Green Agriculture in Tropical Region of China, Hainan Key Laboratory of Tropical Eco-Circular Agriculture, Environmental and Plant Protection Institute, Chinese Academy of Tropical Agricultural Sciences, Haikou 571101, China
4
China Association of Rural Energy Industry, Beijing 100125, China
5
Institute of Plant Nutrition and Environmental Resources, Liaoning Academy of Agricultural Sciences, Shenyang 110161, China
*
Authors to whom correspondence should be addressed.
AgriEngineering 2026, 8(1), 34; https://doi.org/10.3390/agriengineering8010034
Submission received: 24 October 2025 / Revised: 9 January 2026 / Accepted: 11 January 2026 / Published: 16 January 2026
(This article belongs to the Section Sustainable Bioresource and Bioprocess Engineering)

Abstract

Rice–crab co-culture systems (RC) represent promising sustainable intensification approaches, yet their nitrogen (N) cycling and optimal fertilization strategies remain poorly characterized. In this study, we compared RC with rice monoculture system (RM) across four N gradients (0, 150, 210, and 270 kg N·hm−2), assessing N dynamics in field water and N distribution in soil. The results showed that field water ammonium nitrogen (NH4+-N) concentrations increased nonlinearly, showing sharp increases beyond 210 kg N·hm−2. Notably, crab activity in the RC altered the N transformation and transport processes, leading to a prolonged presence of nitrate nitrogen (NO3-N) in field water for two additional days after tillering fertilization compared to RM. This indicates a critical window for potential nitrogen loss risk, rather than enhanced retention, 15 days after basal fertilizer application. Compared to RM, RC exhibited enhanced nitrogen retention capacity, with NO3-N concentrations remaining elevated for an additional two days following tillering fertilization, suggesting a potential critical period for nitrogen loss risk. Post-harvest soil analysis revealed contrasting nitrogen distribution patterns: RC showed enhanced NH4+-N accumulation in surface layers (0–2 cm) with minimal vertical NO3-N redistribution, while RM exhibited progressive NO3-N increases in subsurface layers (2–10 cm) with increasing fertilizer rates. The 210 kg N·hm−2 rate proved optimal for the RC, producing a rice yield 12.08% higher than that of RM and sustaining high crab yields, while avoiding the excessive aqueous N levels seen at higher rates. It is important to note that these findings are based on a single-site, single-growing season field experiment conducted in Panjin, Liaoning Province, and thus the general applicability of the optimal nitrogen rate may require further validation across diverse environments. We conclude that a fertilization rate of 210 kg N·hm−2 is the optimal strategy for RC, effectively balancing productivity and environmental sustainability. This finding provides a clear, quantitative guideline for precise N management in integrated aquaculture systems.

1. Introduction

Nitrogen (N) is a critical limiting nutrient for crop production, yet its application often far exceeds crop demand, creating a profound environmental challenge [1,2]. Global analysis demonstrates that N use efficiency in rice systems averages only 42%, with most of the applied fertilizer lost to the environment [3]. Large-scale surveys across South Asia’s rice regions confirm this inefficiency, showing that 55% of farmers apply excess N, with potential reductions of 18 kg N hm−2 possible without compromising yields [4]. The surplus N readily escapes paddy fields through surface runoff, leaching, and gaseous emissions, thereby increasing the risks of greenhouse gas emissions and water eutrophication. Therefore, the development of efficient and ecological planting patterns to improve N use efficiency and mitigate environmental risks has become a critical priority in modern agriculture.
Integrated rice–aquatic co-culture (IRAC) systems have emerged as a promising solution to address these N challenges through ecological intensification. A meta-analysis demonstrates that IRAC systems achieve a 12.3% improvement in N fertilizer partial factor productivity systems compared to conventional rice cultivation, with RC showing superior performance [5]. These benefits stem from the ecological mechanisms underlying crab bioturbation activities, which fundamentally alter soil–water nitrogen cycling through enhanced sediment mixing, modified redox conditions, and accelerated organic matter decomposition [6,7]. Reflecting its economic and ecological promise, the RC has expanded rapidly in China, reaching 176.7 thousand hectares by 2023 [8]. However, crab bioturbation creates non-linear relationships between nitrogen inputs and ecosystem responses. This necessitates system-specific fertilization strategies that differ fundamentally from rice monoculture approaches. It is also important to recognize that these benefits vary significantly and depend on local climatic conditions, soil properties, and management practices.
However, most previous studies have focused on a single nitrogen application rate or specific fertilizer types [9]. Consequently, comprehensive dose–response relationships—specifically, how different nitrogen rates systematically affect the dynamics of various nitrogen forms (NH4+-N, NO3-N, TN) in both field water and stratified soil profiles—remain unquantified for rice–crab co-culture systems. This gap prevents the identification of critical thresholds where productivity gains are maximized against environmental risks, which is essential for developing precise fertilization strategies. We therefore hypothesized that crab bioturbation creates a non-linear response to nitrogen inputs in RC, resulting in an optimal nitrogen application rate that maximizes the synergy between rice and crab production while minimizing environmental nitrogen losses. In Liaoning province, a major region for RC, nitrogen fertilizer application rates average 289.06 kg N·hm−2 [8], exceeding recommended levels by 28.47–92.71% [10]. Such overapplication not only reduces economic efficiency but also exacerbates environmental risks in aquatic–terrestrial interface systems where nitrogen mobility is enhanced by bioturbation activities.
Understanding these risks requires the systematic characterization of nitrogen dynamics across fertilization gradients, yet critical knowledge gaps persist. Temporal nitrogen dynamics in field water determine both aquaculture productivity and environmental risk, with stringent water quality thresholds requiring NH4+-N concentrations below 0.69 mg·L−1 for optimal aquatic organism growth (GB 11607-1989) [11]. Previous research has identified critical vulnerability periods, typically 7–15 days post-fertilization, when nitrogen concentrations peak and environmental loss risks are maximized [12]. During these periods, surface runoff events contribute disproportionately to total nitrogen losses, with 60–80% of seasonal nitrogen pollution occurring within these brief temporal windows, driven primarily by the rapid hydrolysis of urea fertilizers and subsequent ammonia volatilization under flooded conditions [13]. However, systematic monitoring of N species transformation (NH4+-N, NO3-N, and TN) across different fertilization rates in RC remains limited.
During these periods, environmental factors such as dissolved oxygen (DO) and pH play pivotal roles in regulating nitrogen transformation processes [14]. It has been observed that crabs’ activities and their feed input can regulate water pH and DO, potentially extending or modifying periods of peak nitrogen vulnerability [15]. Soil nitrogen stratification becomes particularly complex due to crab-induced architectural changes, with surface layers (0–2 cm) exhibiting rapid nitrogen turnover while deeper layers accumulate nitrate under enhanced drainage conditions created by burrow networks [16]. Despite the recognized importance of these depth-specific processes, systematic investigations of the fertilization rate’s effects on soil nitrogen distribution in RC are notably absent.
While RC is increasingly promoted as a sustainable alternative to conventional rice cultivation, rigorous comparative assessments of nitrogen cycling characteristics between RC and RM under equivalent management conditions are scarce. Such comparisons are essential for quantifying the ecological benefits and identifying management trade-offs between productivity gains and environmental risks. The objectives of this study were as follows: (1) to systematically examine the effects of nitrogen gradients on nitrogen dynamics in field water and N distribution in soil across different depths; (2) to identify critical periods for nitrogen loss risk and determine the optimal nitrogen application rate for maximizing productivity while minimizing environmental risks; and (3) to elucidate the comparative nitrogen transformation characteristics between RC and RM. This single-site, single-season trial cannot and does not aim to establish universal optimal nitrogen rates applicable across all regions. Instead, its strength lies in providing a highly detailed, mechanistic characterization of nitrogen dynamics (in both water and soil) under a gradient of fertilization within the specific agroclimatic context of the Liaohe River Delta. By establishing complete dose–response curves for various nitrogen forms, this study aims to identify critical thresholds and non-linear responses that may be generalizable as ecological principles, while acknowledging that the precise numerical optimal rate must be validated and calibrated for other regions. The outcomes of this research will provide a scientific basis for optimizing strategies for managing nitrogen inputs, and aid in formulating more sustainable agricultural production practices in integrated rice–aquatic farming systems.

2. Materials and Methods

2.1. Site Description and Materials

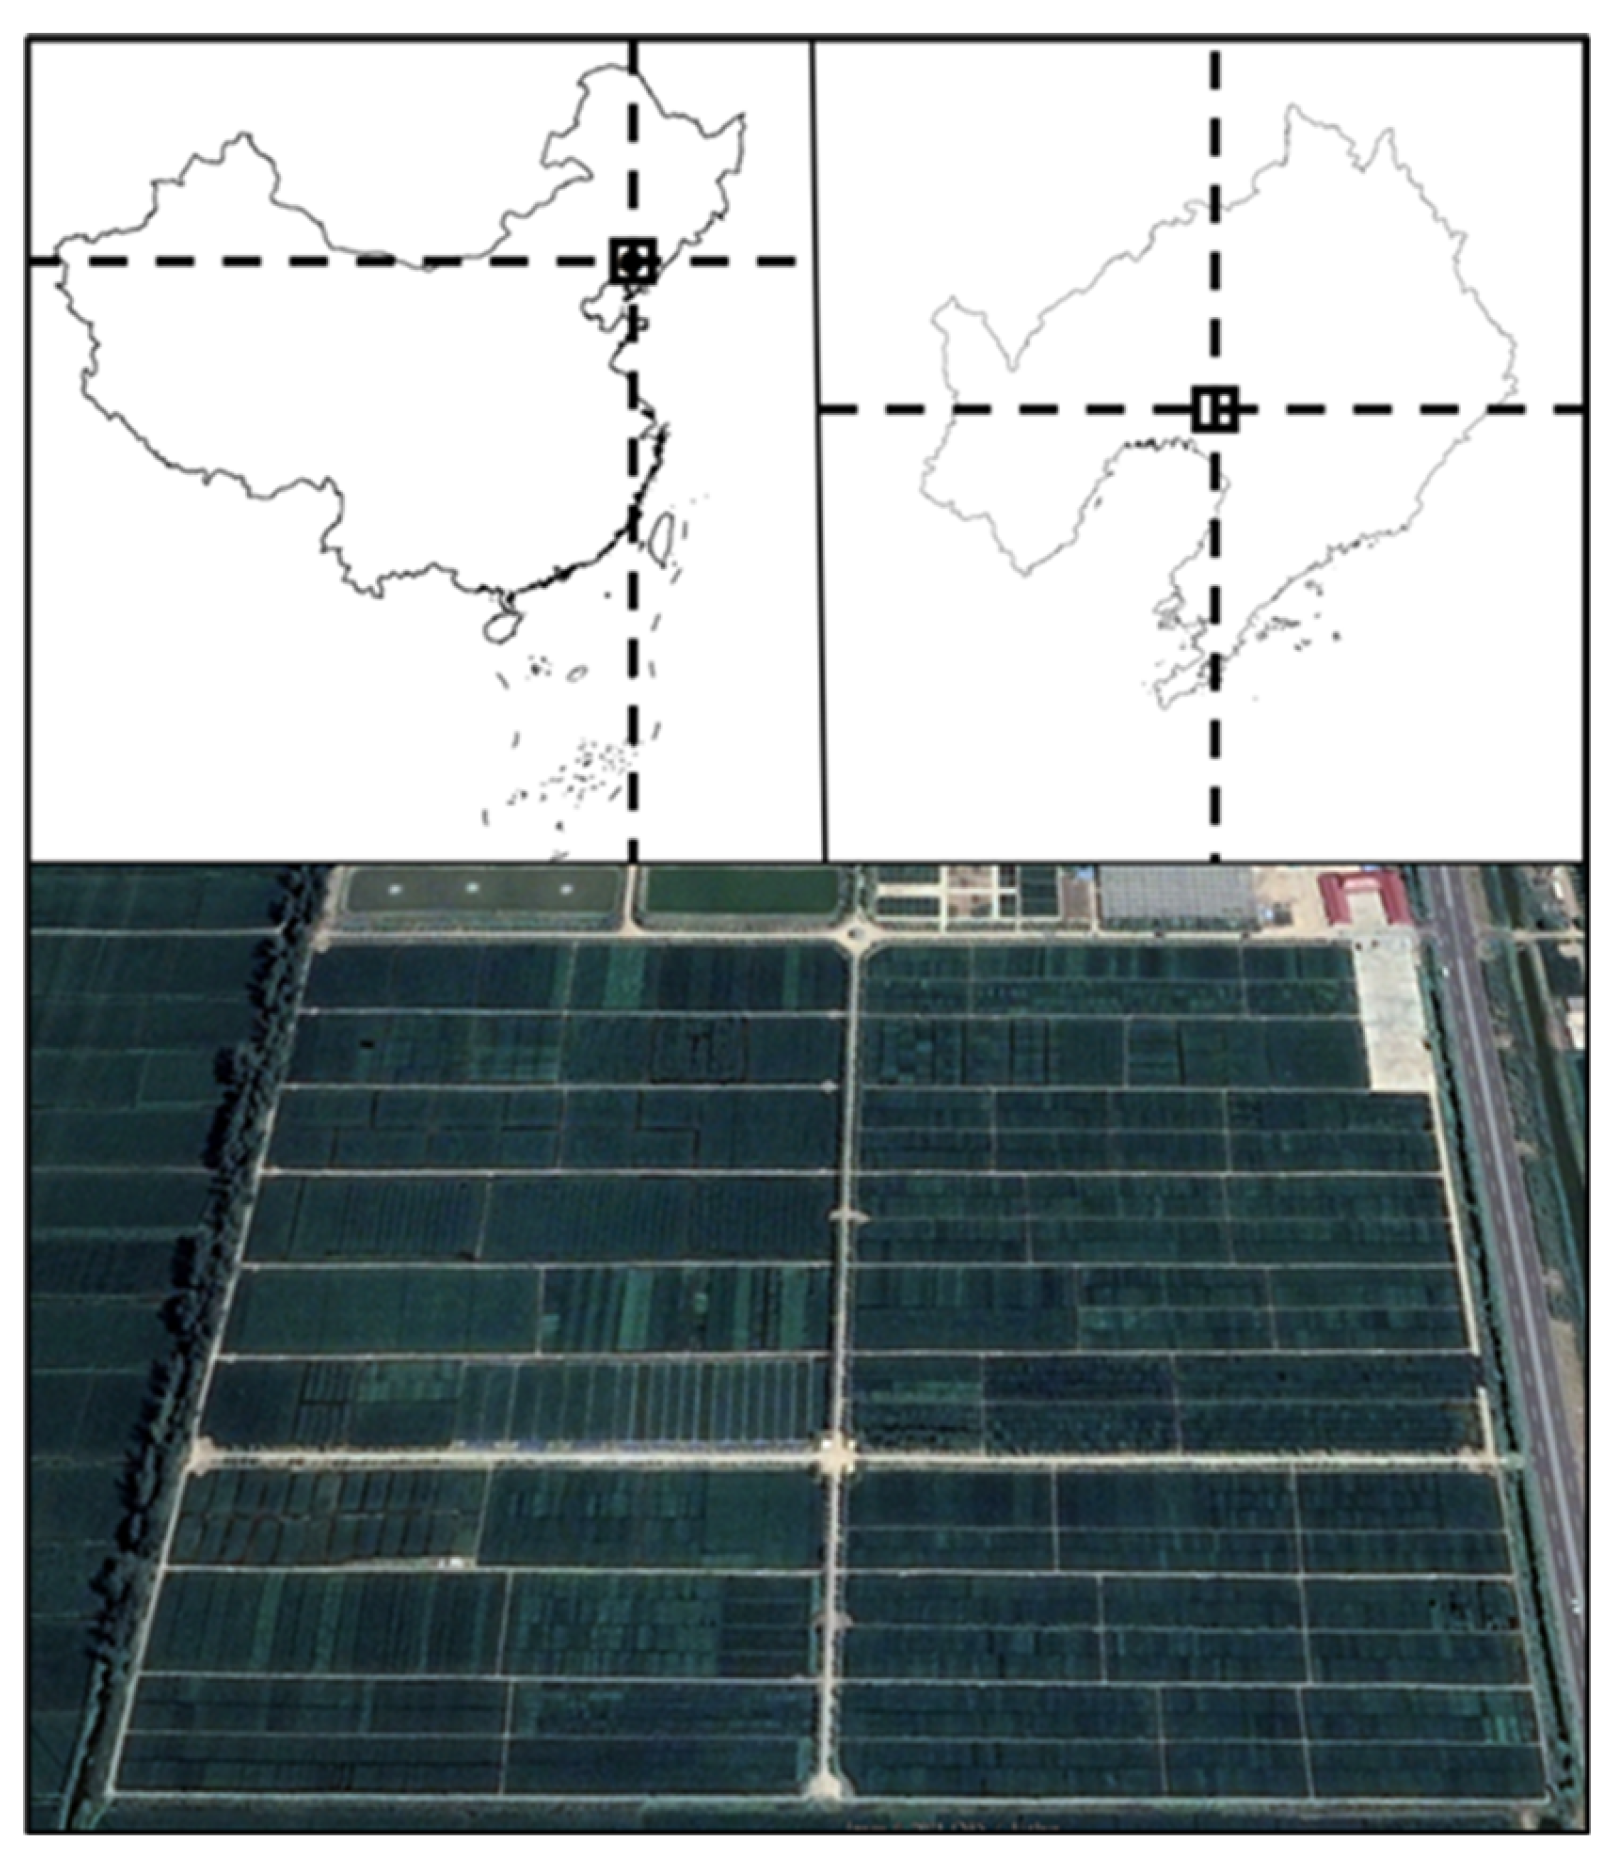
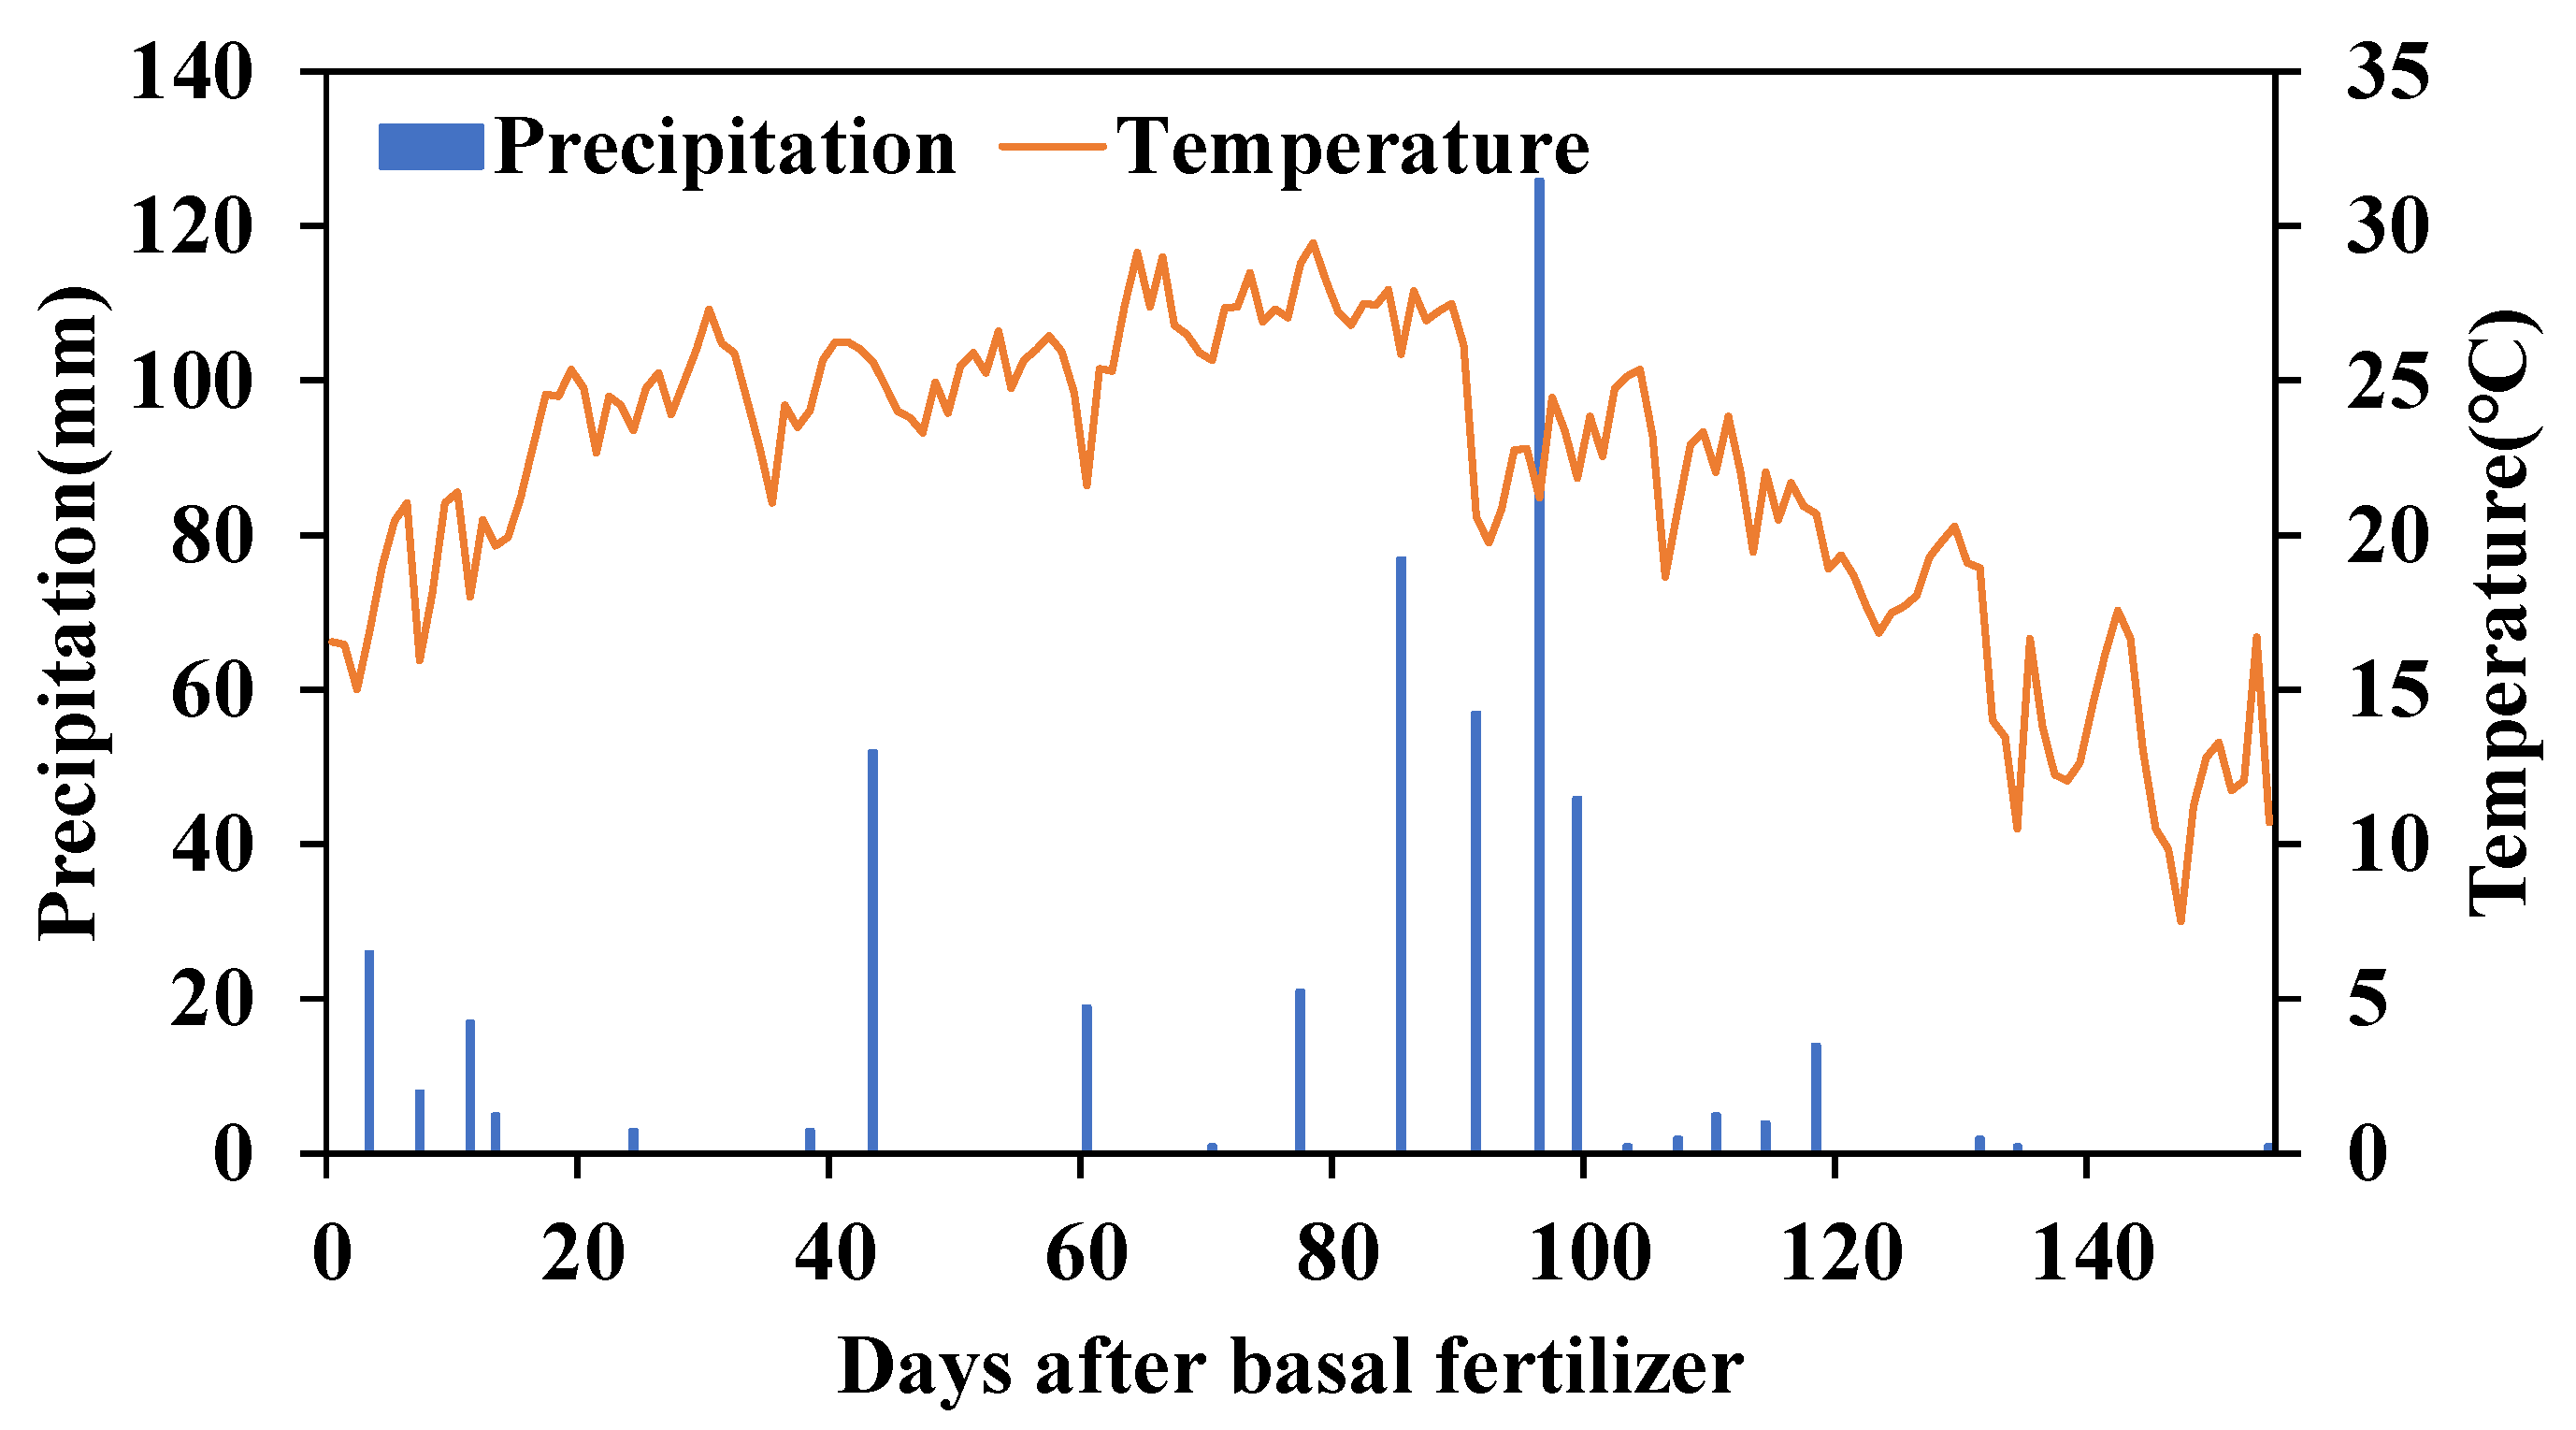
A field experiment was conducted at the experimental base of Liaoning Saline-Alkali Land Research Institute (41°02′ N, 122°10′ E) in Dawa District, Panjin City, Liaoning Province, China, in 2020 (Figure 1). The site is located in the Liaohe River Delta, a region within a temperate sub-humid monsoon climate zone. Total precipitation during the rice growing season was 491 mm. The region is supported by comprehensive irrigation and drainage systems. The average daily temperature during the rice growing season is 22 °C (Figure 2), while the frost-free period spans approximately 170 days. The soil type is Solonchaks, with topsoil (0–15 cm) properties as follows: organic matter concentration of 28.15 g·kg−1, total salt concentration of 2.19 g·kg−1, pH of 7.13, alkali-hydrolytic nitrogen concentration of 108.3 mg·kg−1, available phosphorus concentration of 47.1 mg·kg−1, and available potassium concentration of 266.6 mg·kg−1.
The experiment used the rice variety ‘Yanfeng-47’, which was developed by the Liaoning Institute of Saline-Alkaline Land Utilization with a growth period of 163 days. Chinese mitten crabs (Eriocheir sinensis) used in the study were sourced from the Panshan Mitten Technology Research Institute.

2.2. Experimental Design

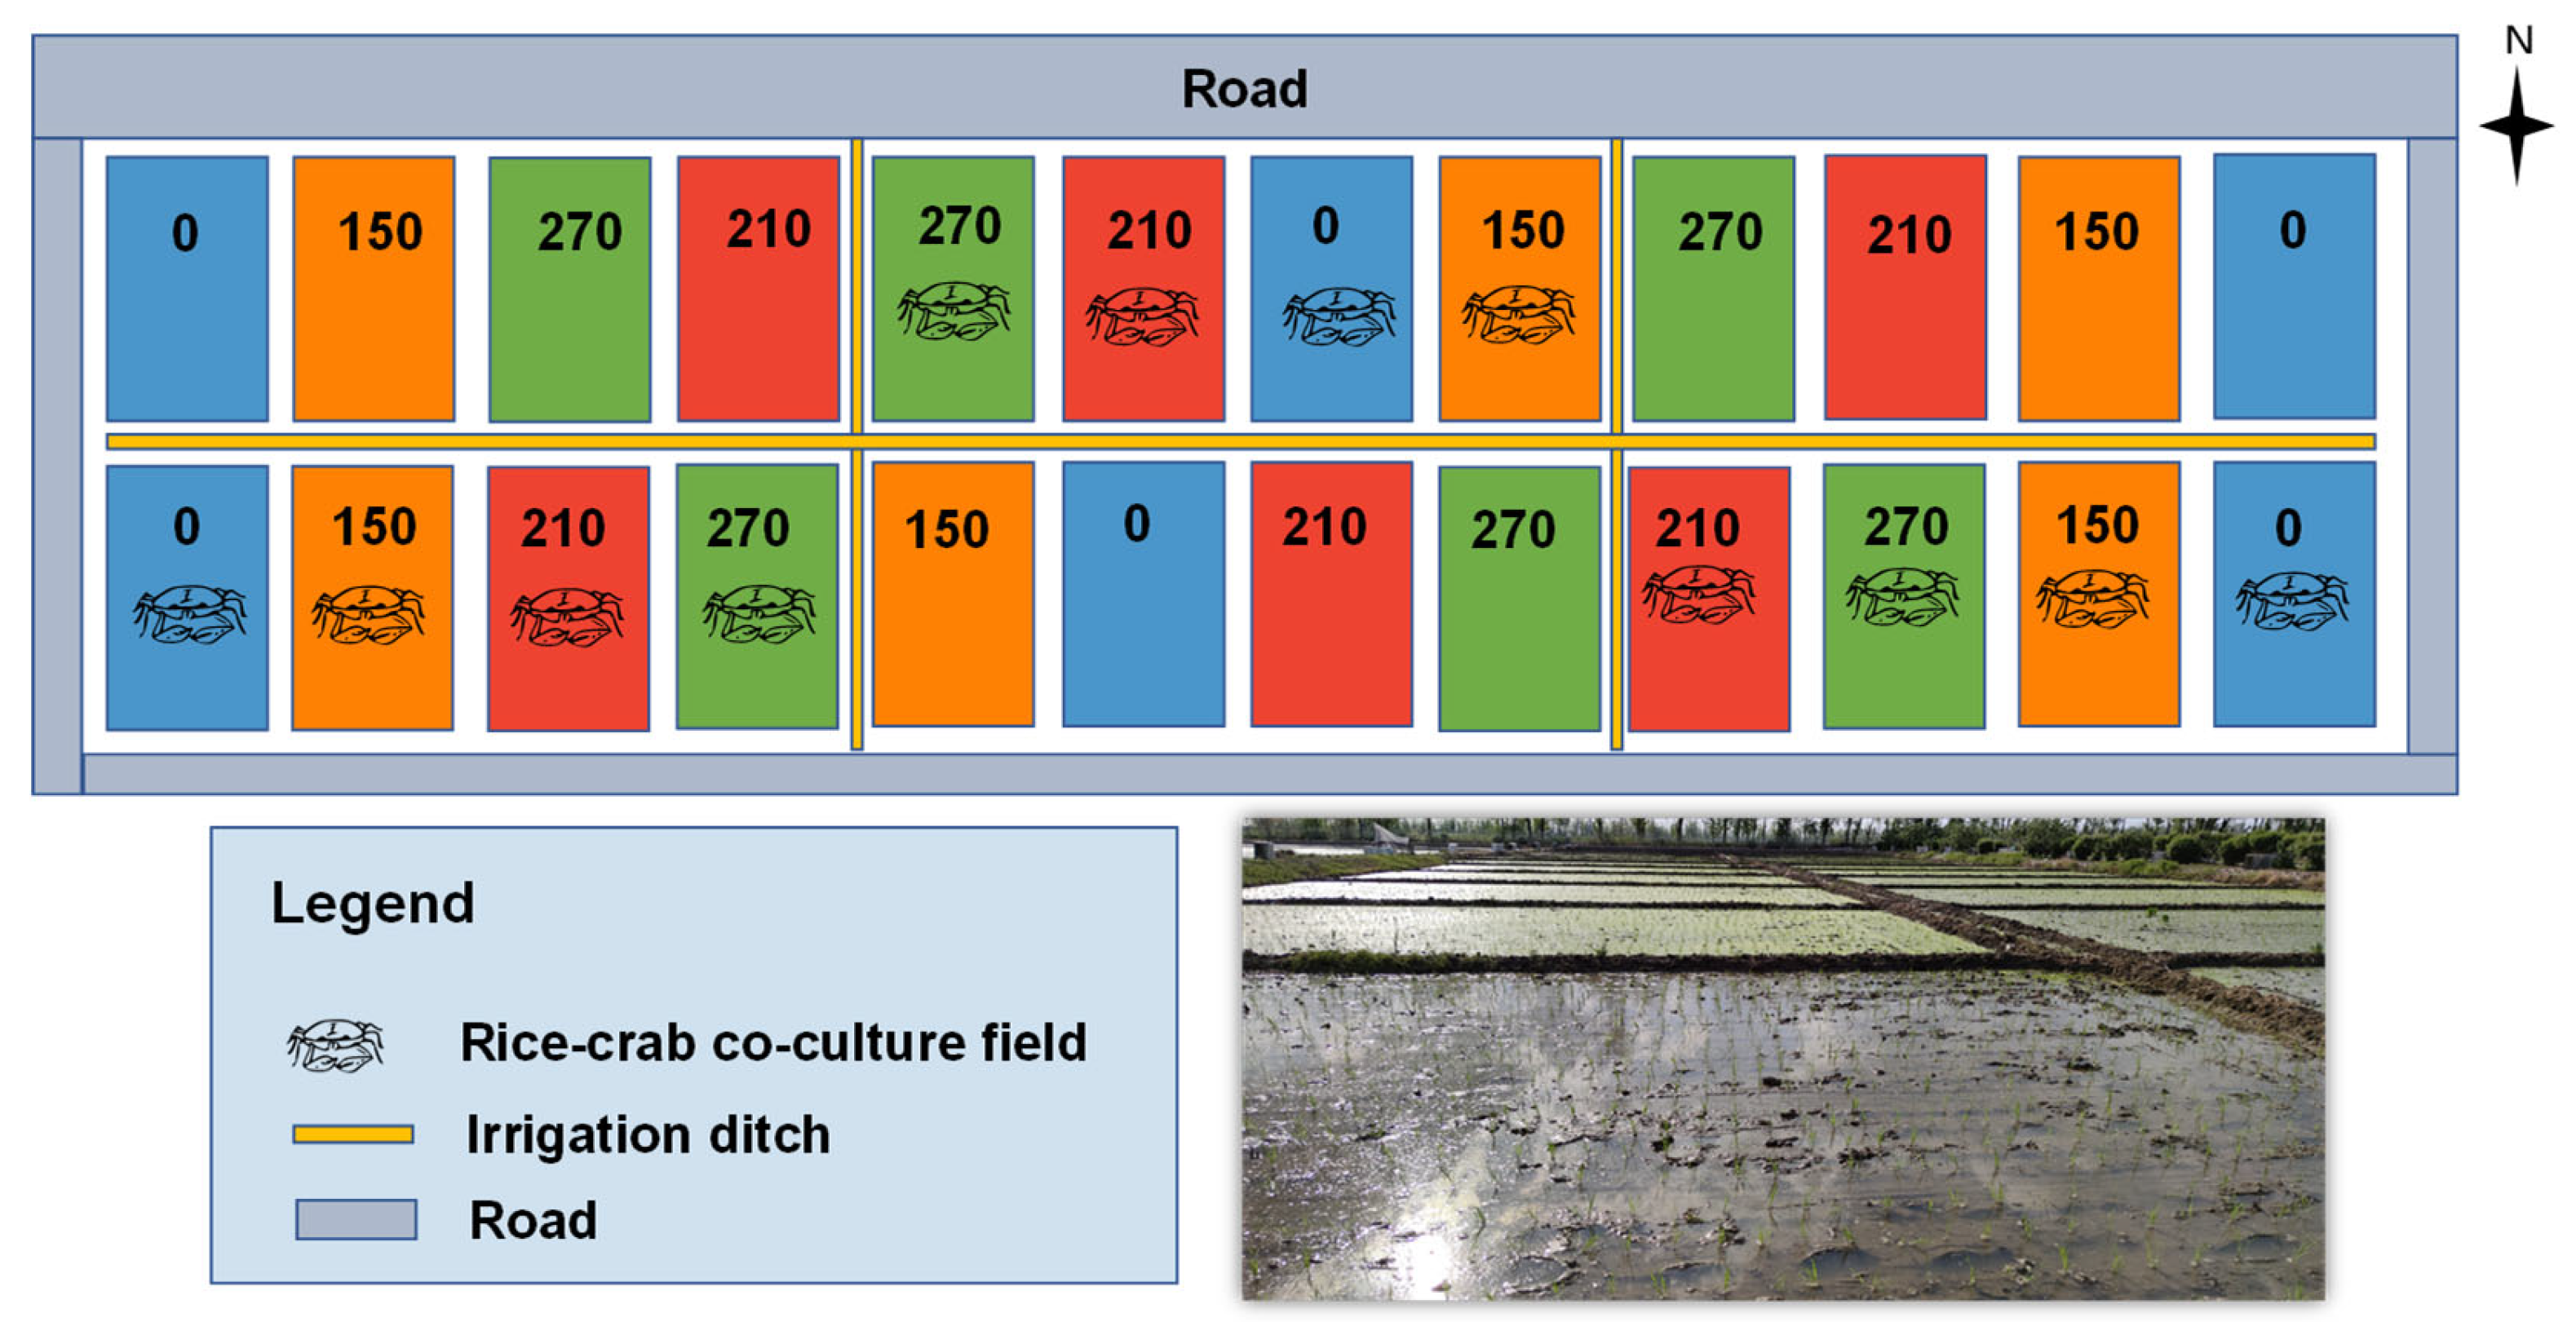
A two-factor split plot experimental design was implemented. The main factor comprised two cultivation system (RM and RC), and the sub-factor consisted of four different nitrogen rates (0, 150, 210, and 270 kg N·hm−2) (Table 1). These nitrogen application rates were chosen to represent the local recommended rate (150 kg N·hm−2), a high-input rate reflecting common farmer practices (270 kg N·hm−2), and an intermediate level (210 kg N·hm−2) to identify an optimal threshold. A total of eight treatments were established, each with three replicates, resulting in 24 experimental plots. All plots were assigned using a randomized complete block design. Each plot is 120 m2, with 60 cm wide ridges separating all plots (Figure 3). The sample size (n) is defined as follows: water quality parameters were measured from one composite water sample per plot per sampling time (n = 3 plots per treatment); soil parameters at harvest were analyzed from one composite soil sample per depth layer per plot (n = 3 plots × 3 depths = 9 samples per treatment for each depth); rice yields were determined from three 1 m2 sub-samples per plot (n = 9 sub-samples per treatment). Nitrogen fertilizers were applied in two stages: 30 kg N·hm−2 as topdressing at tillering stage and the remainder applied as base fertilizer. The quantities of phosphorus and potassium fertilizers were consistent for all treatments at 96.4 kg·P2O5 hm−2 and 77.1 kg·K2O hm−2, respectively. Fertilizers applied included compound fertilizer (N 28%, P2O5 11%, K2O 14%), urea (N 46%), diammonium phosphate (N 18%, P2O5 46%), superphosphate (P2O5 16%), and potassium sulfate (K2O 50%).
Rice seedlings were transplanted on 25 May, with a spacing × row spacing density of 30 cm× 18 cm. Crabs were released into the RC plot on 24 May at a density of 11,250 individuals hm−2; crabs were stocked at 11,250 individuals hm−2, a rate that (1) complies with the national standard NY/T 3822-2020 [17] (7500–15,000 individuals hm−2) and (2) mirrors the dominant commercial practice in Liaoning (9000–12,000 individuals hm−2) [8]. All other field management practices, including water, pest, and weed control, remained consistent across all treatments. Maintain a consistent water depth in both RC and RM fields before releasing crab larvae. Five to seven days after transplanting rice, maintain a water level of 5 to 10 cm in the RC field without draining it before releasing the larvae. During the tillering stage of rice growth, adjust the water level in the field to between 15 and 20 cm as the water temperature rises. Typically, RC fields have water that is 5 to 10 cm deeper than RM fields. During the yellowing and ripening stage of rice growth, reduce irrigation and maintain a water level of between 5 and 10 cm. After harvesting the river crabs, stop irrigating and allow the field to dry naturally. Drainage should not occur during the rice–crab coexistence period. RC does not dry out the fields.
To prevent crab escape between adjacent plots, each RC plot was enclosed with poly-ethylene escape-prevention nets (mesh size 1 cm, height 50 cm) before crab release; nets were buried 10 cm into the soil and inspected daily for damage. To ensure adequate nutrition for the crabs, a supplemental feeding regime was implemented exclusively in the RC plots. Commercial pellet feed for crabs (with a crude protein content of approximately 38%) was applied regularly. Feeding was conducted once daily during the evening, at a rate of 3–5% of the estimated total crab body weight in each plot.

2.3. Sampling and Measurements

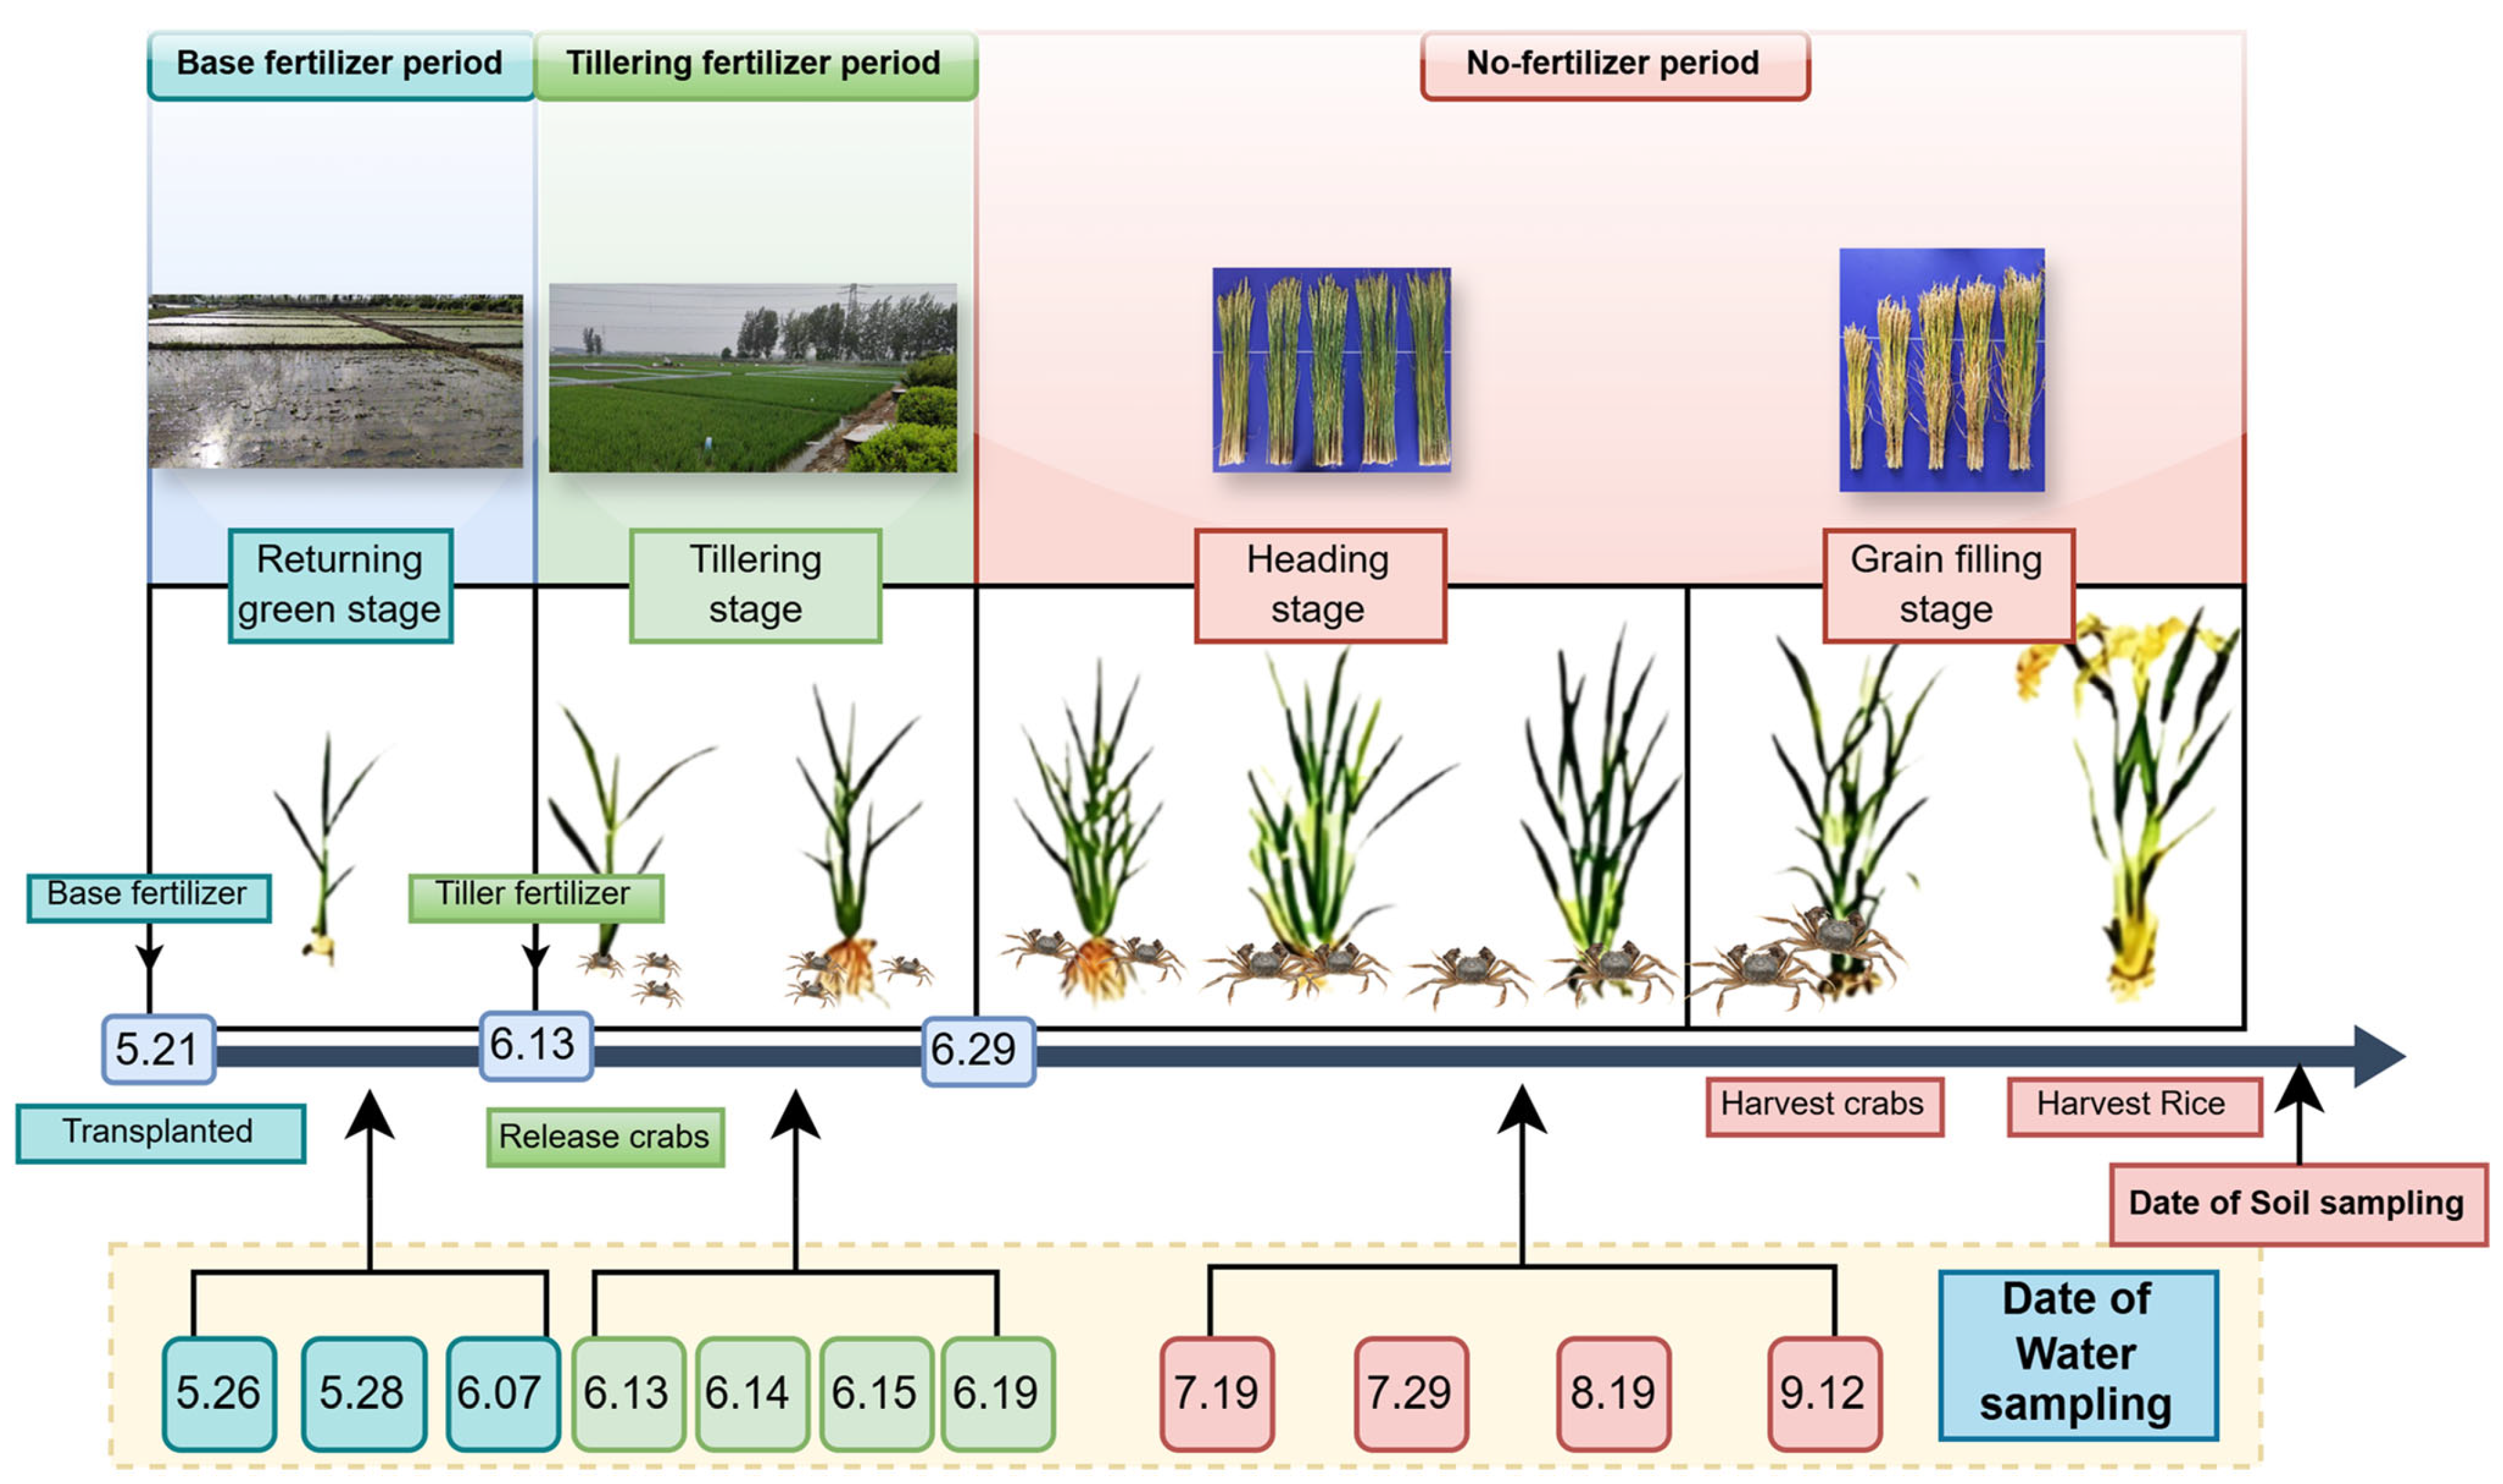
Based on the fertilization events and dynamics in NH4+-N and NO3-N concentration in field water following fertilization, the rice growing season was divided into three periods: (1) Base fertilizer period (BFP, from 21 May to 12 June), which corresponds to the returning green stage in rice growth; this period started with base fertilizer application and lasted until before tillering fertilization. (2) Tillering fertilizer period (TFP, from 13 June to 29 June), which corresponds to the tillering stage in the rice growth. Beginning with tillering fertilizer application, this period captured the second peak of nitrogen concentration and its subsequent transformation in the field water. (3) No-fertilizer period (NFP, from 30 June to harvest), an extended period without additional nitrogen input which allowed us to monitor residual effects of fertilization and natural nitrogen cycling processes. This period covered the heading and grain-filling stage of rice growth. The sampling schedule is presented in Figure 4.
Field surface water sampling was conducted according to the fertilization schedule. Intensive sampling was performed during the basal and tillering fertilizer application periods to facilitate comparison and observation of water quality changes under different fertilization patterns. Previous research has demonstrated that the nitrogen concentration from the reduction rate of TN concentration reached more than 79% on the 7th day after fertilization [18]. Therefore, following the peak fertilizer influence periods, long-term dynamic sampling was implemented to monitor changes in field surface water during the fertilizer-free phase of rice growth.
Water samples from the field surface are collected daily at 9:00 a.m. using the five-point sampling method. To ensure that the sampling process did not disturb the field water, a custom-made sampler consisting of a plastic bottle attached to a bamboo pole approximately 2 m long was utilized. Five-point samples were collected and combined into a 500 mL plastic bottle, with the date of each sampling meticulously recorded. The pH and DO of the field water were simultaneously determined using a YSI multifunctional water quality analyzer (Professional Plus, YSI, Yellow Springs, OH, USA). Upon returning to the laboratory, the samples were filtered through qualitative filter paper, transferred into 50 mL sample bottles, and subjected to analysis for NH4+-N and NO3-N concentrations using a continuous flow analyzer (Auto-Analyzer 3, Norderstedt, Seal, Germany); the method was determined according to ISO14256-2 standard [19]. Total nitrogen (TN) concentration was measured using a total organic carbon (TOC) analyzer (Vario TOC select, Element, Germany).
Quality control procedures for all analytical measurements were as follows. For the Auto-Analyzer 3, detection limits were 0.01 mg·L−1 for NH4+-N and 0.005 mg·L−1 for NO3-N. Calibration was performed at the beginning of each analytical run using five-point standard curves (r2 > 0.999), with mid-range check standards analyzed every 20 samples; samples were re-analyzed if check standards deviated >5% from expected values. For the TOC analyzer, detection limit for TN was 0.1 mg·L−1, with daily calibration using certified reference standards. Reagent blanks and duplicate samples (10% of total) were included in each batch; analytical precision (coefficient of variation) was <3% for all parameters. Samples exceeding instrument range were diluted and re-analyzed.
Soil samples were collected at rice harvest (October 22) using a stainless-steel auger (5 cm diameter). In each plot, five sampling points were selected following a diagonal pattern. The cores were immediately stratified into three depth layers: 0–2 cm, 2–10 cm, and 10–20 cm. This sampling strategy was chosen to focus on the primary zone of crab bioturbation, which is predominantly confined to the top 20 cm of soil [7,20]. The specific stratification of the 0–2 cm layer was critical for analyzing the soil–water interface, a known hotspot for carbon–nitrogen transformations in paddy soils [21,22]. For each plot, the sub-samples from the same depth layer were combined to form a single composite sample. After removing crop residues, stones, and other debris, the samples were thoroughly mixed using plastic rods. The concentrations of NH4+-N and NO3-N in the soil were determined by extracting with a CaCl2 solution, followed by analysis with a continuous flow analyzer (Auto-Analyzer 3, Norderstedt, Seal, Germany). Soil was sampled once at harvest (0–2, 2–10, 10–20 cm) using established protocols consistent with rice fertilization studies [23,24] to quantify residual inorganic N. This single-time strategy avoids disturbing crab burrows.
Crabs used in the study were sourced from the Panshan Mitten Technology Research Institute, with documented disease-free status confirmed by visual inspection and absence of clinical signs (shell discoloration, lethargy, or abnormal feeding behavior). At release, crabs corresponded to developmental stage II juveniles. Crabs were fed with commercial crab feed (crude protein ≥ 38%). Feed was broadcast uniformly across each RC plot once daily (18:00). Total feed representing an additional nitrogen input of approximately 9.99 kg N·hm−2 (the laboratory-determined nitrogen content is 5.46%). This feed-derived nitrogen was consistent across all RC treatments and thus did not confound the nitrogen rate treatment effects.
Crabs in all RC plots were captured between 25 September and 1 October, and the total weight, survival rate, yield per unit area, and average individual weight of crabs in each plot was recorded. On 20 October, five 1 m2 plots were selected from each experimental field for harvesting, threshing, and manual weighing to determine the rice yield. Set traps or manually capture mature crabs at locations within the farming unit that facilitate operations and transportation.

2.4. Statistical Analysis

Data processing and visualization were performed using Microsoft Excel 2019 (Microsoft Corporation, Redmond, VA, USA) and OriginPro 2024 (OriginLab Corporation, Northampton, MA, USA). Statistical analyses were conducted using R software (version 4.3.1; R Core Team, Vienna, Austria). For time series data (field water nitrogen concentrations, pH, and DO), linear mixed-effects models (LMMs) were fitted using the lme4 package to account for repeated measures and temporal autocorrelation. The models included the cultivation system, nitrogen application rate, and sampling date as fixed effects. The experimental plot was included as a random intercept to control for the non-independence of repeated observations within the same plot. The significance of fixed effects was evaluated using Type III analysis of variance (ANOVA) with Satterthwaite’s method for approximating degrees of freedom via the lmerTest package. For non-time series data (soil nitrogen content, rice and crab yields, and crab morphometric traits), a two-way ANOVA (Type III sum of squares) was employed to assess the main effects of the cultivation system, nitrogen rate, and interaction. For crab yields and morphological traits (present only in RC), a one-way ANOVA was conducted to evaluate the effect of nitrogen rate.
Prior to analysis, model assumptions were verified: normality of residuals was assessed using the Shapiro–Wilk test, and homogeneity of variance was checked using Levene’s test (Table S6). When main effects or interactions were significant (p < 0.05), pairwise comparisons were performed using Tukey’s Honest Significant Difference (HSD) test using the emmeans and multcomp packages. Pearson correlation matrices were generated to examine relationships among yield, soil, and water parameters.
Pearson correlation analysis was performed to elucidate the relationships between key system components. The analysis was strategically conducted on three distinct variable groupings to address specific research questions.
Water–Soil System Linkages: This group included all nitrogen forms in field water (TN, NH4+-N, NO3-N) and stratified soil (NH4+-N and NO3-N at 0–2 cm, 2–10 cm, and 10–20 cm depths). The aim was to decipher the vertical coupling and potential exchange of nitrogen between the aquatic and terrestrial phases of the paddy system.
Driver–Response Relationships: This group correlated the primary driving factors (nitrogen application rate, field water pH, field water DO) with the key response variables (rice yield, crab yield, and water nitrogen concentrations). This was intended to quantify the direct effects of management and environmental conditions on productivity and immediate environmental indicators.
Inter-parameter Dependencies within Matrices: Correlations within the soil nitrogen profile and within water quality parameters were also analyzed to understand internal system dynamics.

3. Results

3.1. Field Water Nitrogen Dynamics

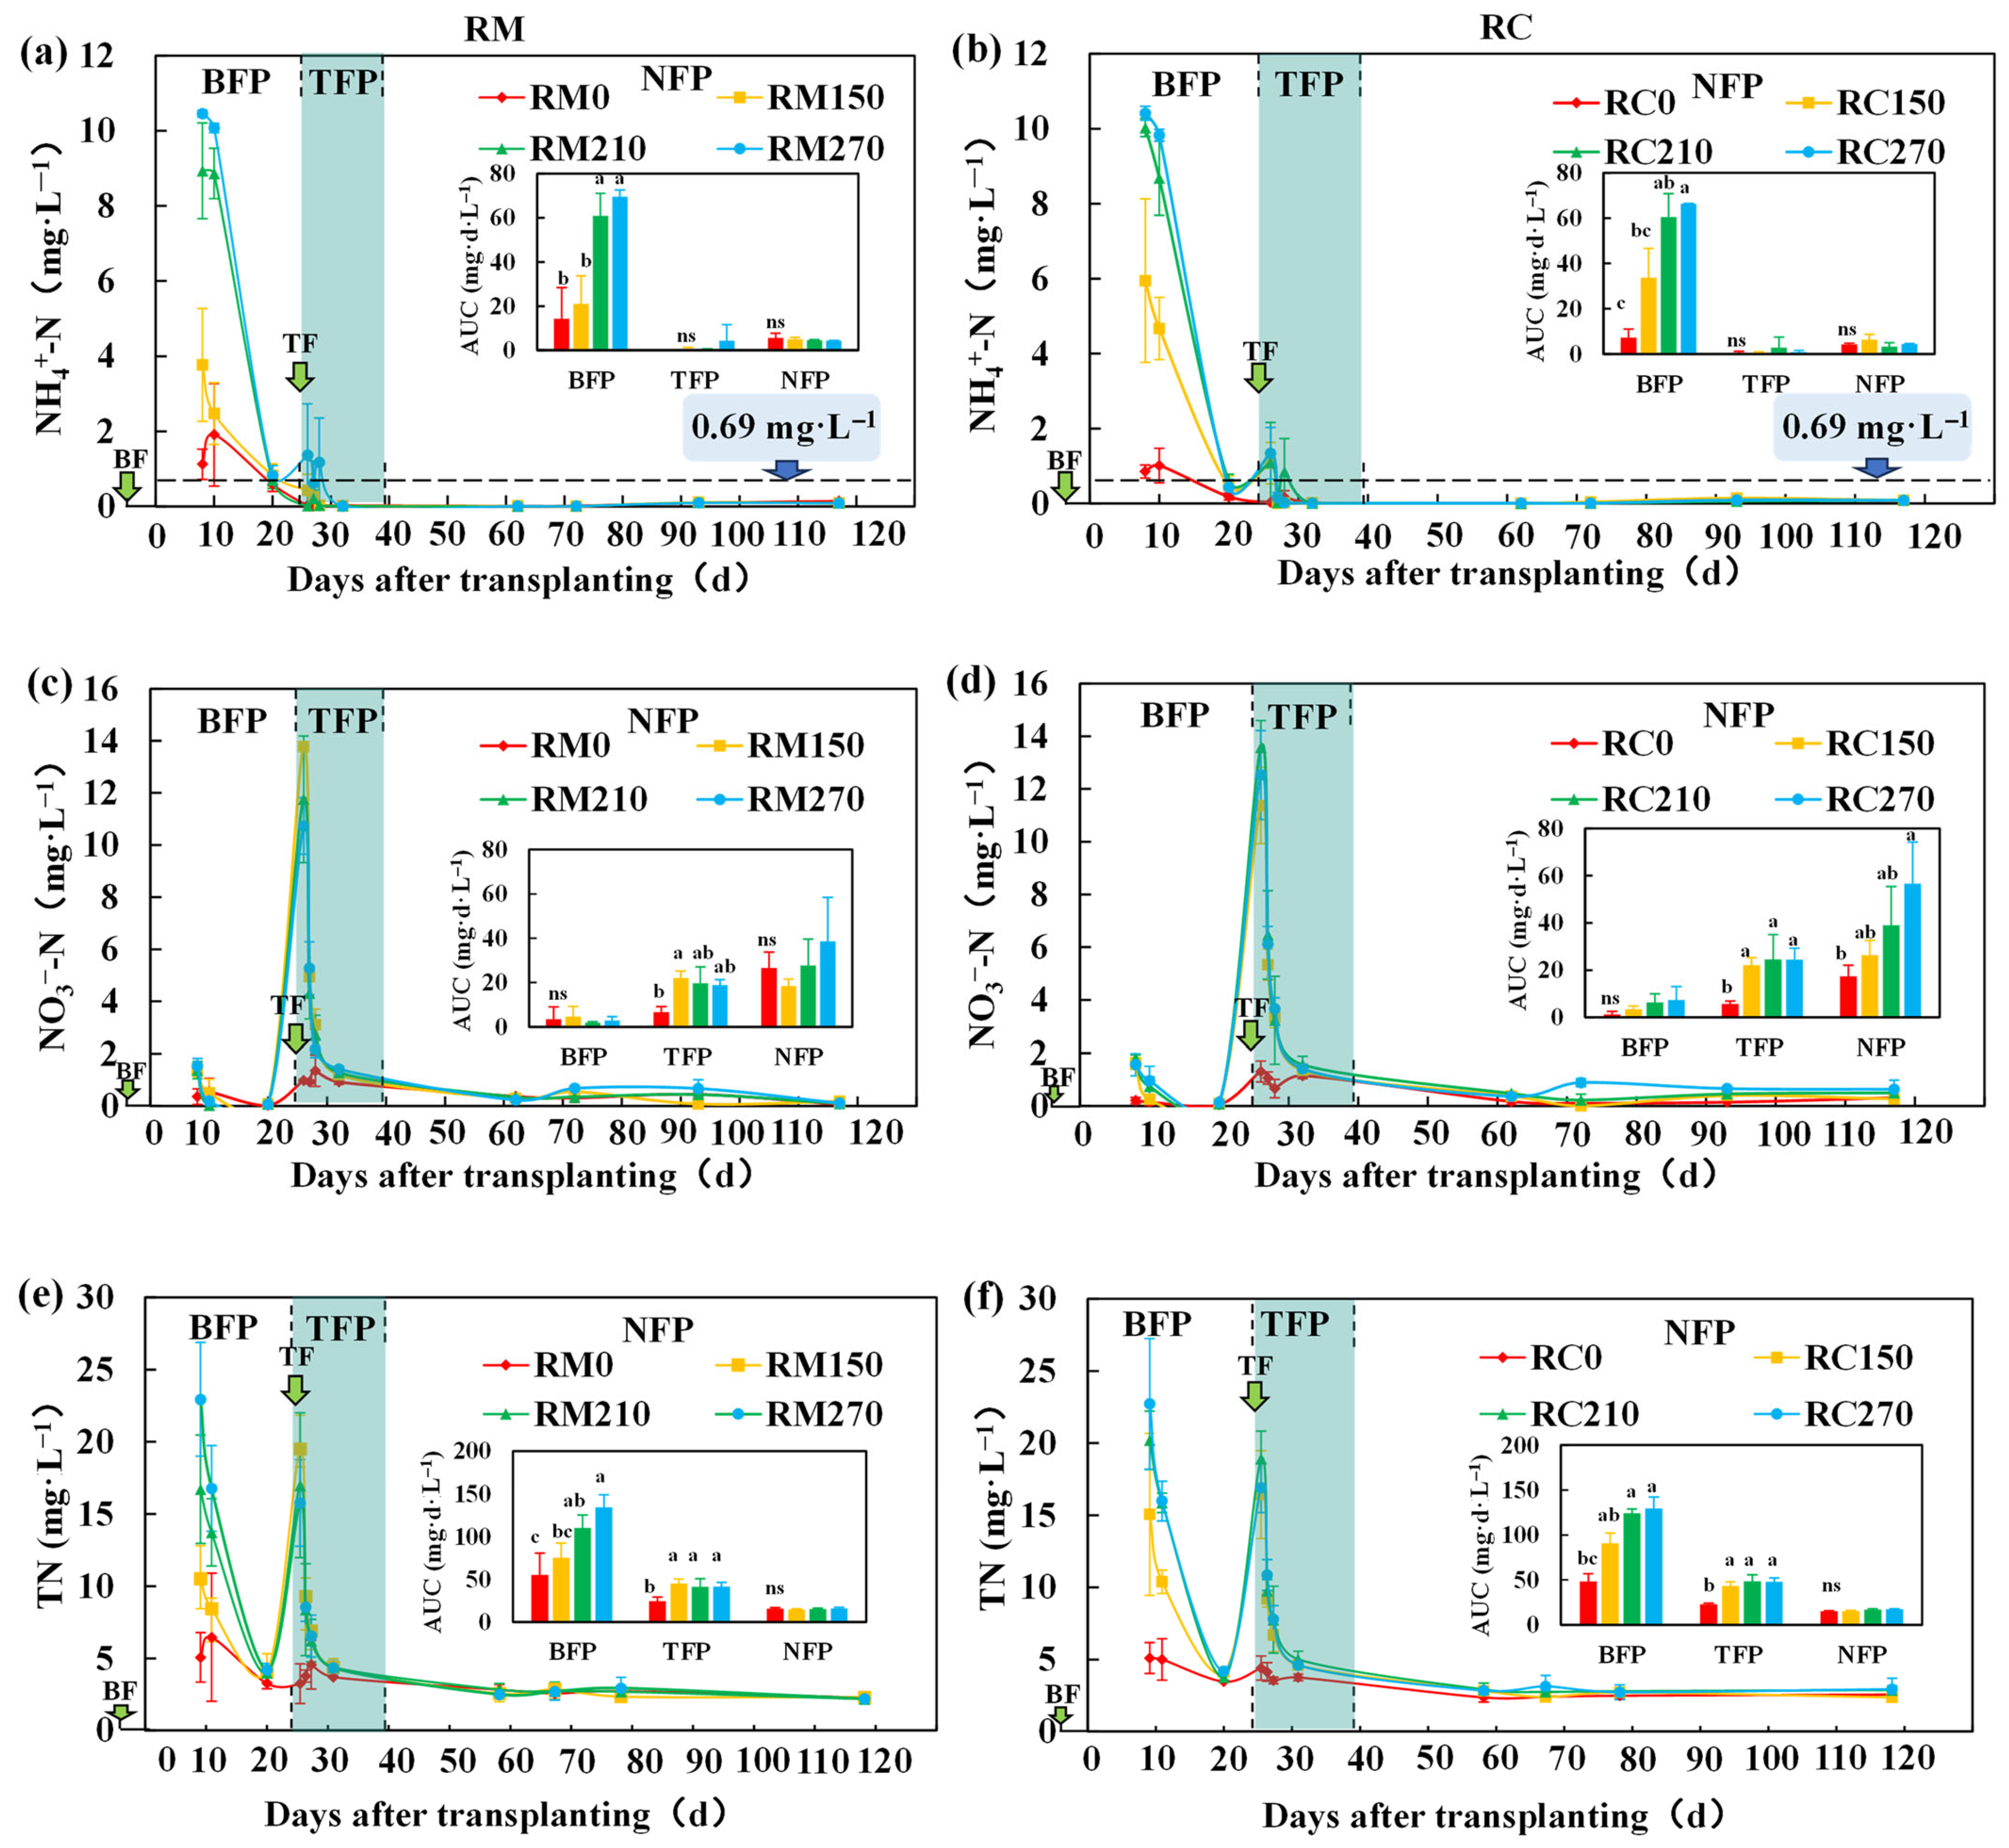
Nitrogen dynamics in field water under fertilization treatments exhibited a similar pattern, characterized by a rapid increase immediately after fertilization and subsequent declines to baseline levels (Figure 5). In unfertilized treatments, nitrogen levels remained stable and consistently low throughout the rice growth period (Figure 5). NH4+-N concentrations showed two distinct peaks corresponding to fertilizer applications (Figure 5a,b). During the BFP, NH4+-N concentrations reached their peak ranging from 0.71 to 10.45 mg·L−1 on the fifth day after fertilization (the first day of monitoring) and subsequently decreased to baseline levels by day 17 (Figure 5a,b). Critically, all fertilized treatments (150–270 kg N·hm−2) exhibited peak NH4+-N concentrations that substantially exceeded the 0.69 mg·L−1 safety threshold for aquatic organisms (GB 11607-1989). The unfertilized control (0 kg N·hm−2) remained below this threshold. The duration of exceedance lasted for approximately 15 days post-basal fertilization, indicating a prolonged period of potential stress for crabs. The second peak occurred during the TFP, with the highest value observed at a 270 kg·N hm−2 treatment, ranging from 2.03 to 2.06 mg·L−1 (Figure 5a,b). Notably, during the BFP, NH4+-N levels in medium and high nitrogen treatment groups (210–270 kg N·hm−2) in RM were significantly higher than those in low nitrogen treatment groups (0–150 kg N·hm−2) (p < 0.05, Table 2). In RC, NH4+-N levels in all fertilized treatments were significantly higher than in the unfertilized treatments (p < 0.05), with RC showing significantly higher NH4+-N concentrations than RM at a rate of 150 kg N·hm−2.
NO3-N peak concentrations in field water coincided with fertilizer applications, with the highest value occurring on the day of tillering fertilizer application, ranging from 0.98 to 13.78 mg·L−1 (Figure 5c,d). During the BFP, RC under the 270 kg N·hm−2 treatment exhibited the highest NO3-N concentration (2.10 mg·L−1), which was significantly higher than that of all other treatments (p < 0.05, Table 2). There were no significant differences among nitrogen application treatments for RM (p ≥ 0.05). During the TFP, all fertilized treatments in both RC and RM showed significantly higher NO3-N concentrations compared to the unfertilized controls (p < 0.05, Table 2). However, there were no significant differences between RM and RC at the same level of nitrogen application rates. During NFP, NO3-N concentration in RM showed no significant changes across different nitrogen application rates (p ≥ 0.05). However, for RC, the treatment of 270 kg N·hm−2 had the highest NO3-N concentration, reaching 0.57 mg·L−1, which was significantly higher than that of 0 kg N·hm−2 treatments (p < 0.05, Table 2). There were no significant differences between RC and RM at the same nitrogen (p ≥ 0.05).
TN peaks in field water coincide with fertilizer applications, with the highest value occurring on the BFP, ranging from 5.06 to 22.94 mg·L−1 (Figure 5). During the BFP, RM under the 270 kg N·hm−2 treatment exhibited the highest TN concentration (22.94 mg·L−1). At TFP, the peaks of RM and RC were observed under treatment 150 and treatment 270, respectively, which was consistent with the variation pattern of NO3-N. The TN concentration in field water increased proportionally with nitrogen application rates (Table 2). At the BFP, the higher nitrogen treatments in RM and RC (210–270 N kg·hm−2) exhibited significantly higher TN levels compared to the unfertilized controls (p < 0.05, Table 2). No significant difference was observed between the RM and RC treatments at the same nitrogen application rate. During the TFP, all nitrogen treatments demonstrated significantly higher TN levels than those without nitrogen treatments (p < 0.05, Table 2), while there was no significant difference between RM and RC treatments (p ≥ 0.05).
Two-way ANOVA showed that fertilizer rate exerted significant main effects on NH4+-N in BFP (p < 0.01), NO3-N in BFP (p < 0.05), TFP (p < 0.01), NFP (p < 0.05), and TN in BFP and TFP (p < 0.01). The cultivation system showed no significant impact on any period, and the S × N interaction effects were not significant for all periods (p ≥ 0.05).
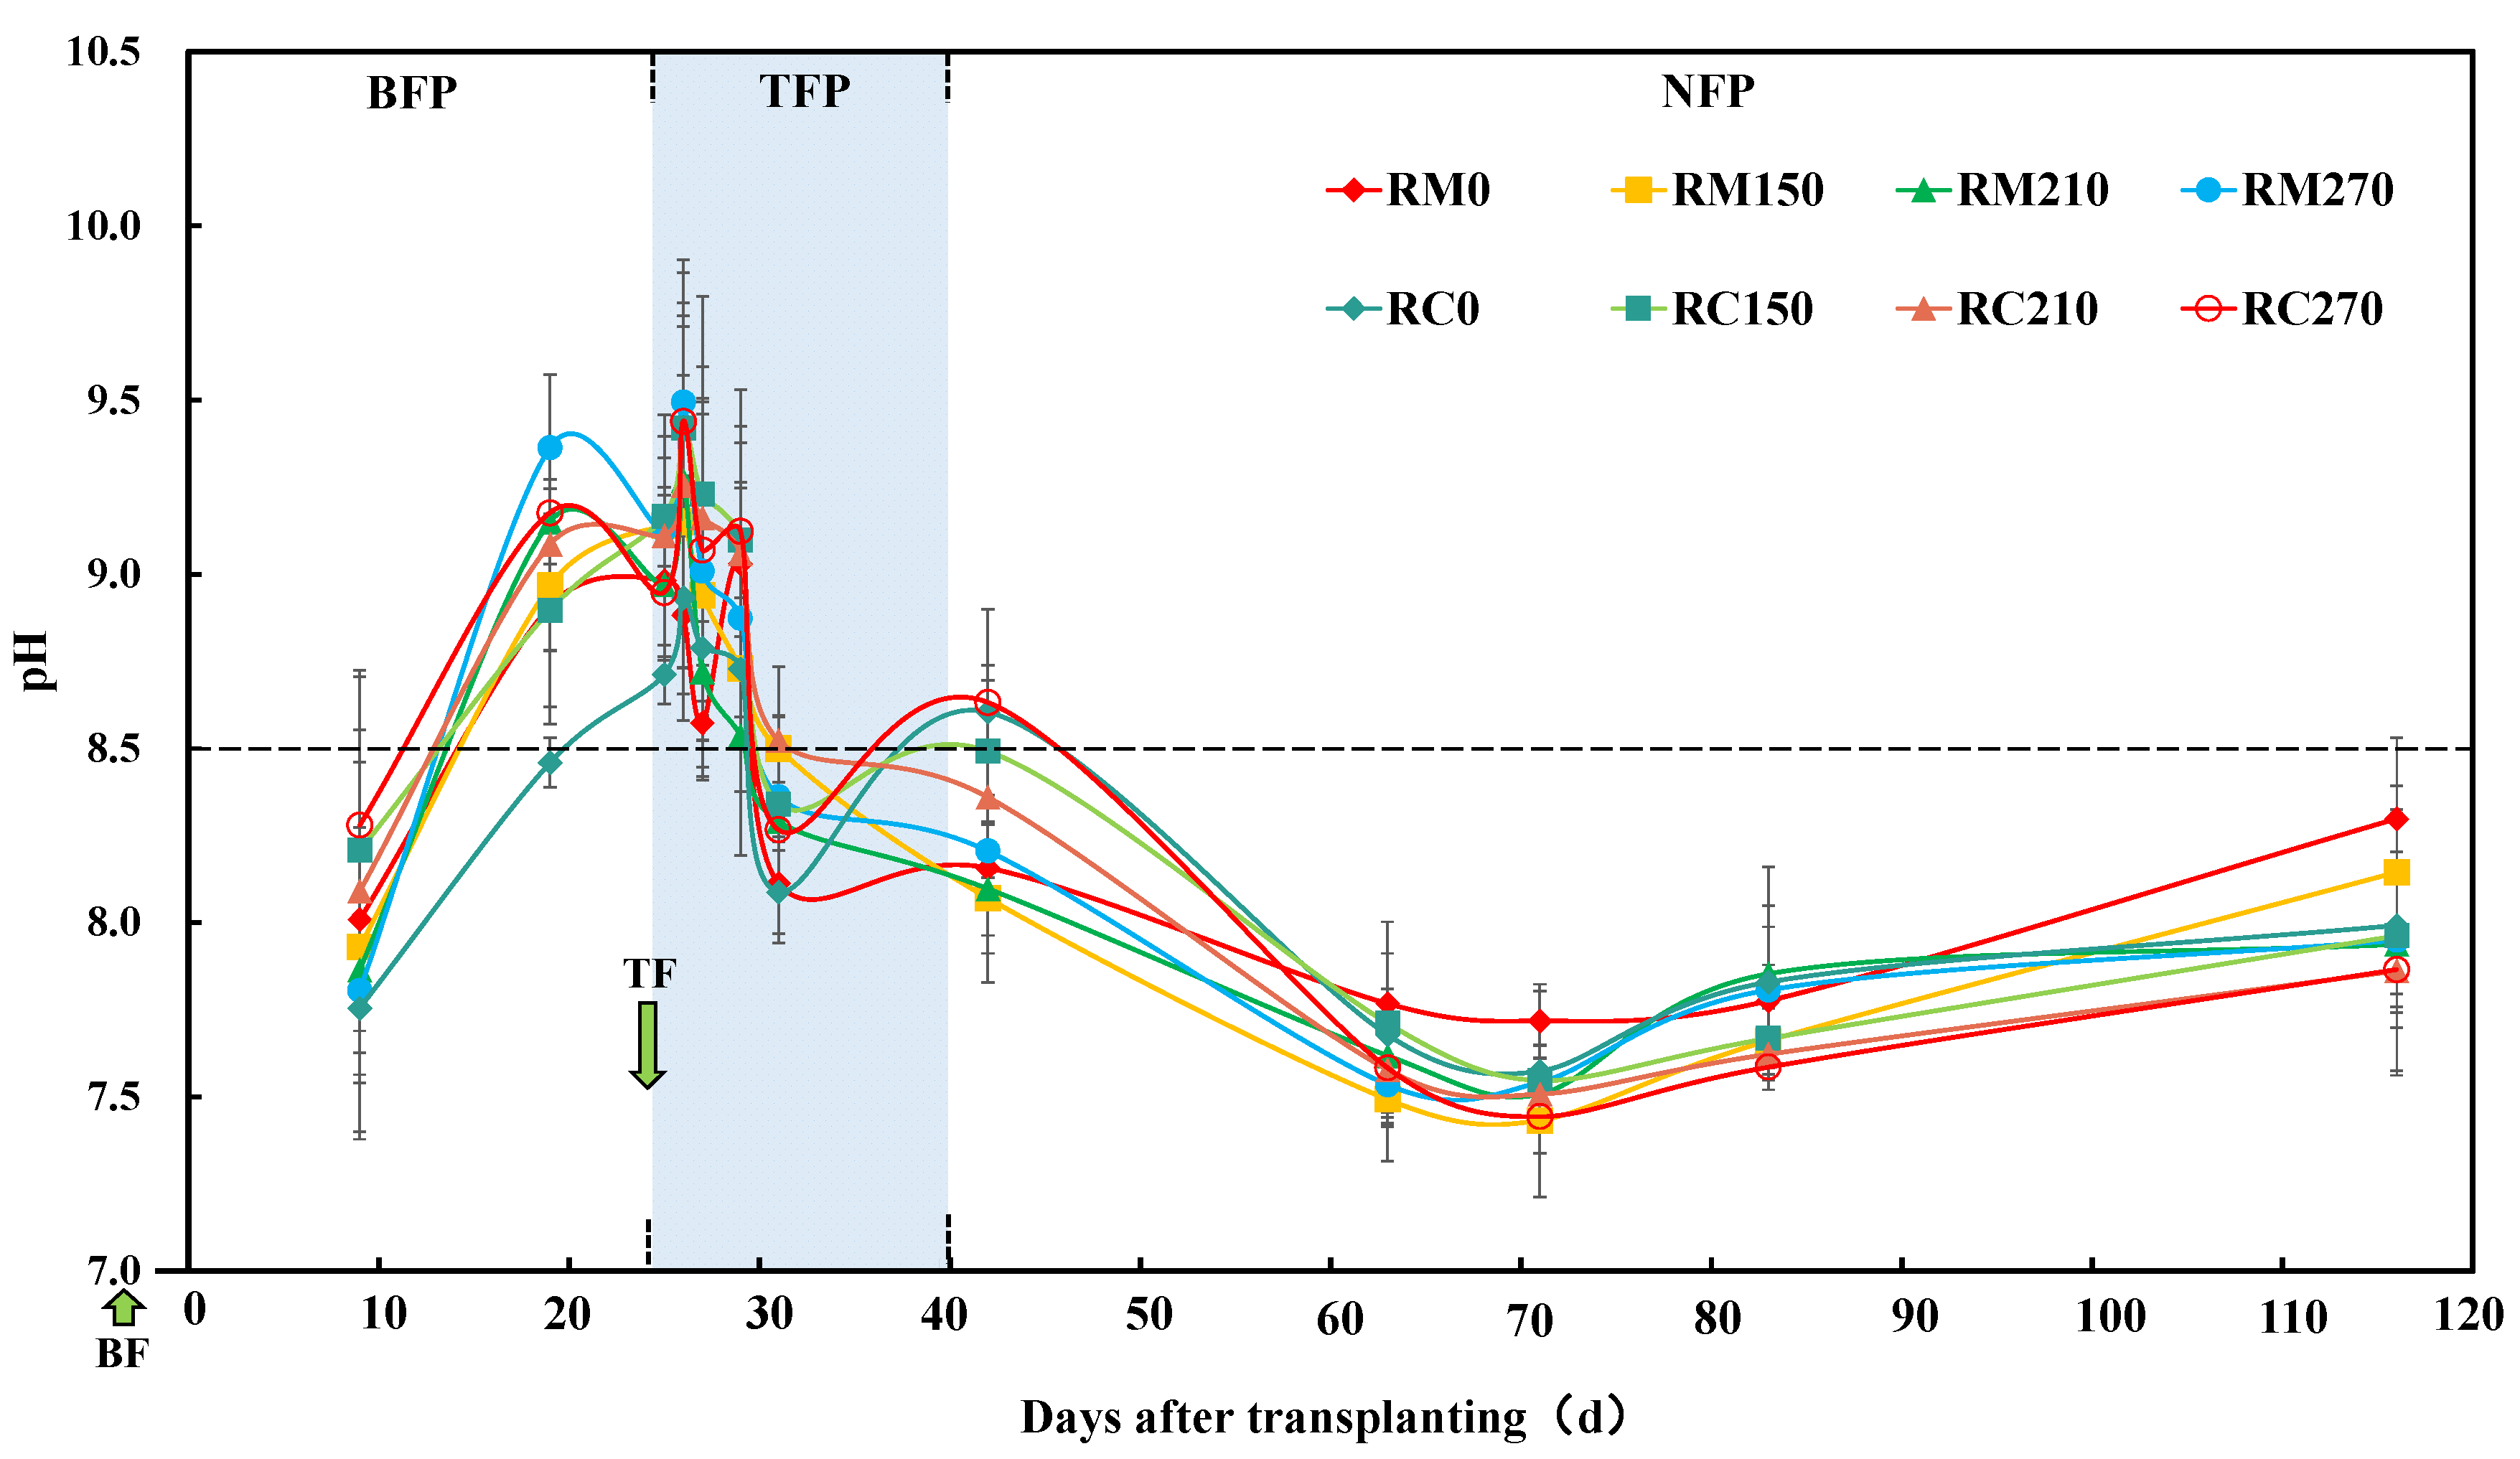
Field water pH ranged from 7.43 to 9.49 across all treatments (Figure 6). During the BFP, the pH values initially increased and subsequently decreased. The pH value increased from 7.81–8.01 to 8.91–9.36 in RM and from 7.75–8.28 to 8.46–9.18 in RC (Figure 6). No significant difference in mean pH was observed between the two cultivation systems (Table 3). From the end of the BFP until the first day of TFP, different nitrogen application rates exhibited distinct trends: low nitrogen treatments (0 and 150 kg N·hm−2) continued to show an increasing trend in pH value, whereas high nitrogen treatments (210 and 270 kg N·hm−2) started to display a decreasing trend. During the TFP, there was still no significant difference in mean pH values between the two cultivation systems (Table 3), with maximum RM values ranging from 8.98 to 9.49 and maximum RC values ranging from 8.71 to 9.44 (Figure 6). In the NFP, pH declined to minimum values of 7.43–7.71 in RM and 7.44–7.57 in RC on July 29, then gradually increased. High nitrogen treatments (210 kg N hm−2 in RC and 270 kg N hm−2 in RM) showed significantly lower mean pH during NFP compared to low nitrogen treatments (p < 0.05). Two-way ANOVA showed that the cultivation system significantly influenced the pH during the NFP period (p < 0.05, Table 3).
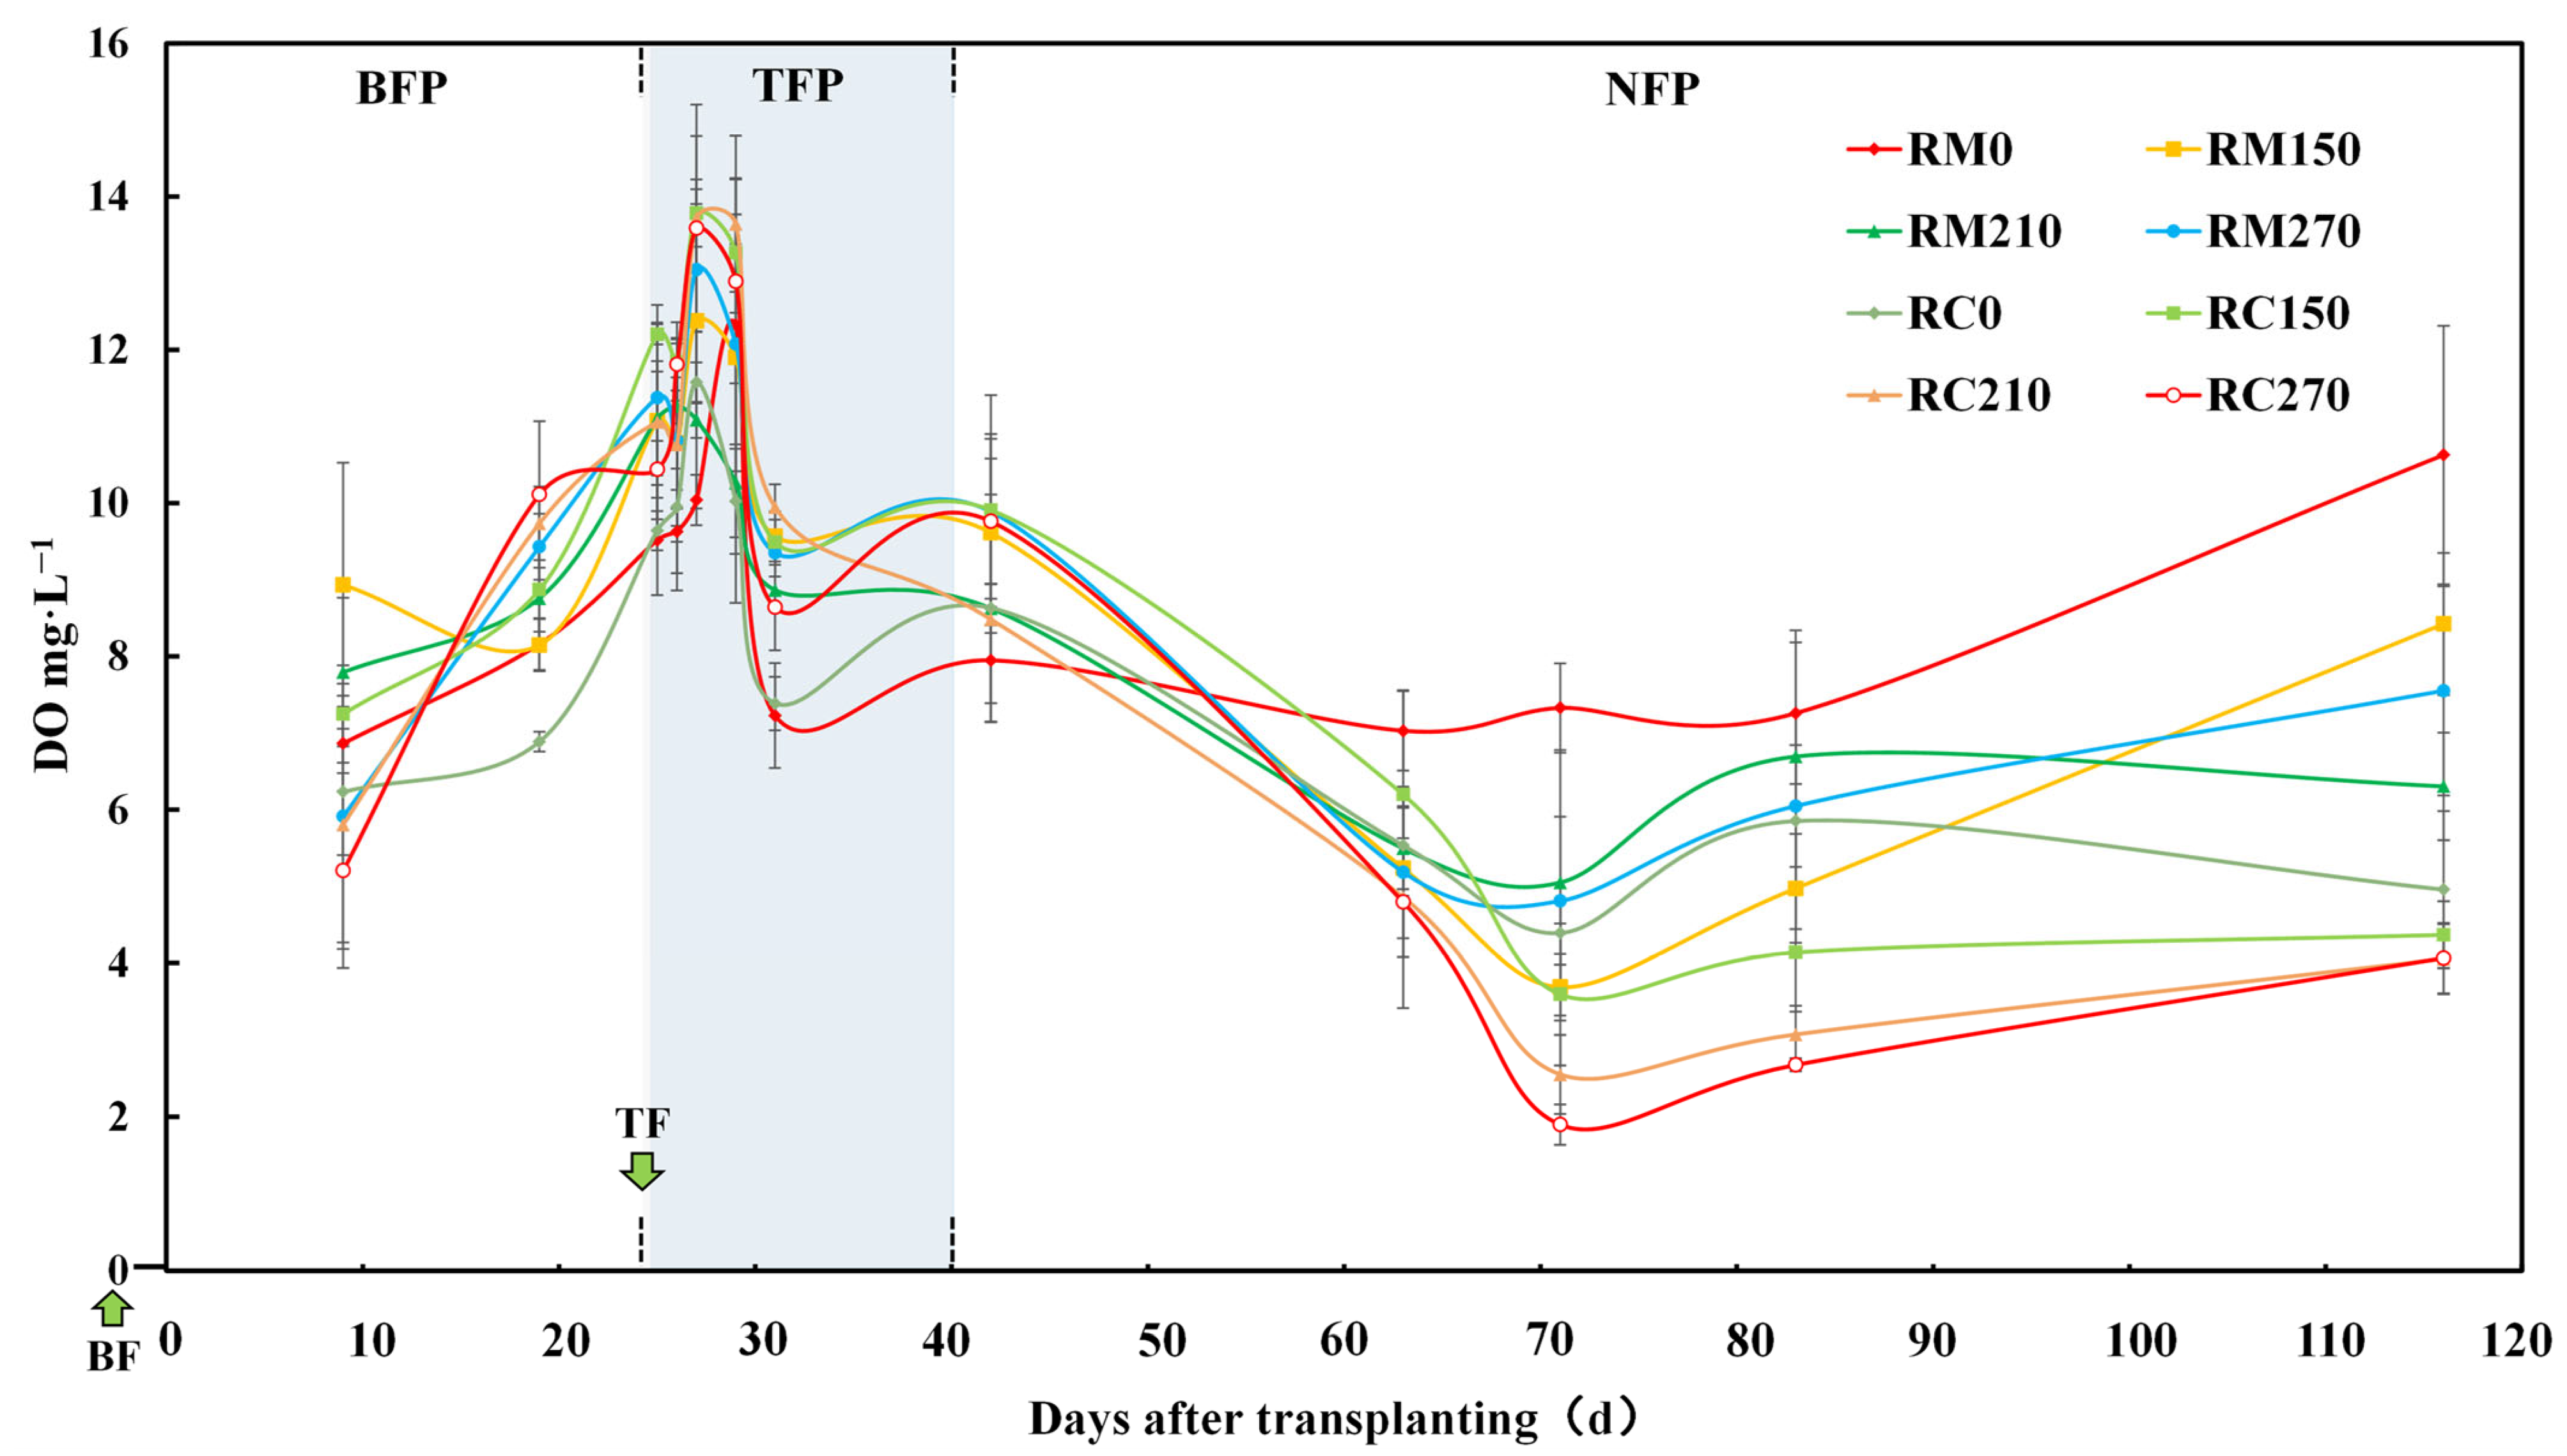
The DO concentrations in the field water ranged from 1.90 to 13.72 mg·L−1 across all treatments (Figure 7). During the BFP, DO in all treatments showed an increasing trend (Figure 7). Specifically, DO increased from 5.91 to 8.93 mg·L−1 in RM and from 5.20 to 7.25 mg·L−1 in RC, with no significant difference between systems (Table 4). DO reached peak values during TFP, ranging from 11.26 to 13.04 mg·L−1 in RM and 11.57 to 13.78 mg·L−1 in RC (Figure 7). RC showed significantly higher DO than RM at 150 and 210 kg N hm−2 during TFP (p < 0.05, Table 4). During NFP, DO declined to 3.68–7.02 mg·L−1 in RM and 1.90–4.39 mg·L−1 in RC. Nitrogen rates (150, 210, and 270 kg N hm−2) significantly decreased DO in RC during NFP (p < 0.05). Two-way ANOVA revealed significant effects of cultivation systems on DO during NFP (p < 0.01), and significant effects of nitrogen rate on DO during TFP (p < 0.01) and NFP (p < 0.05, Table 4).

3.2. Soil Nitrogen Dynamics

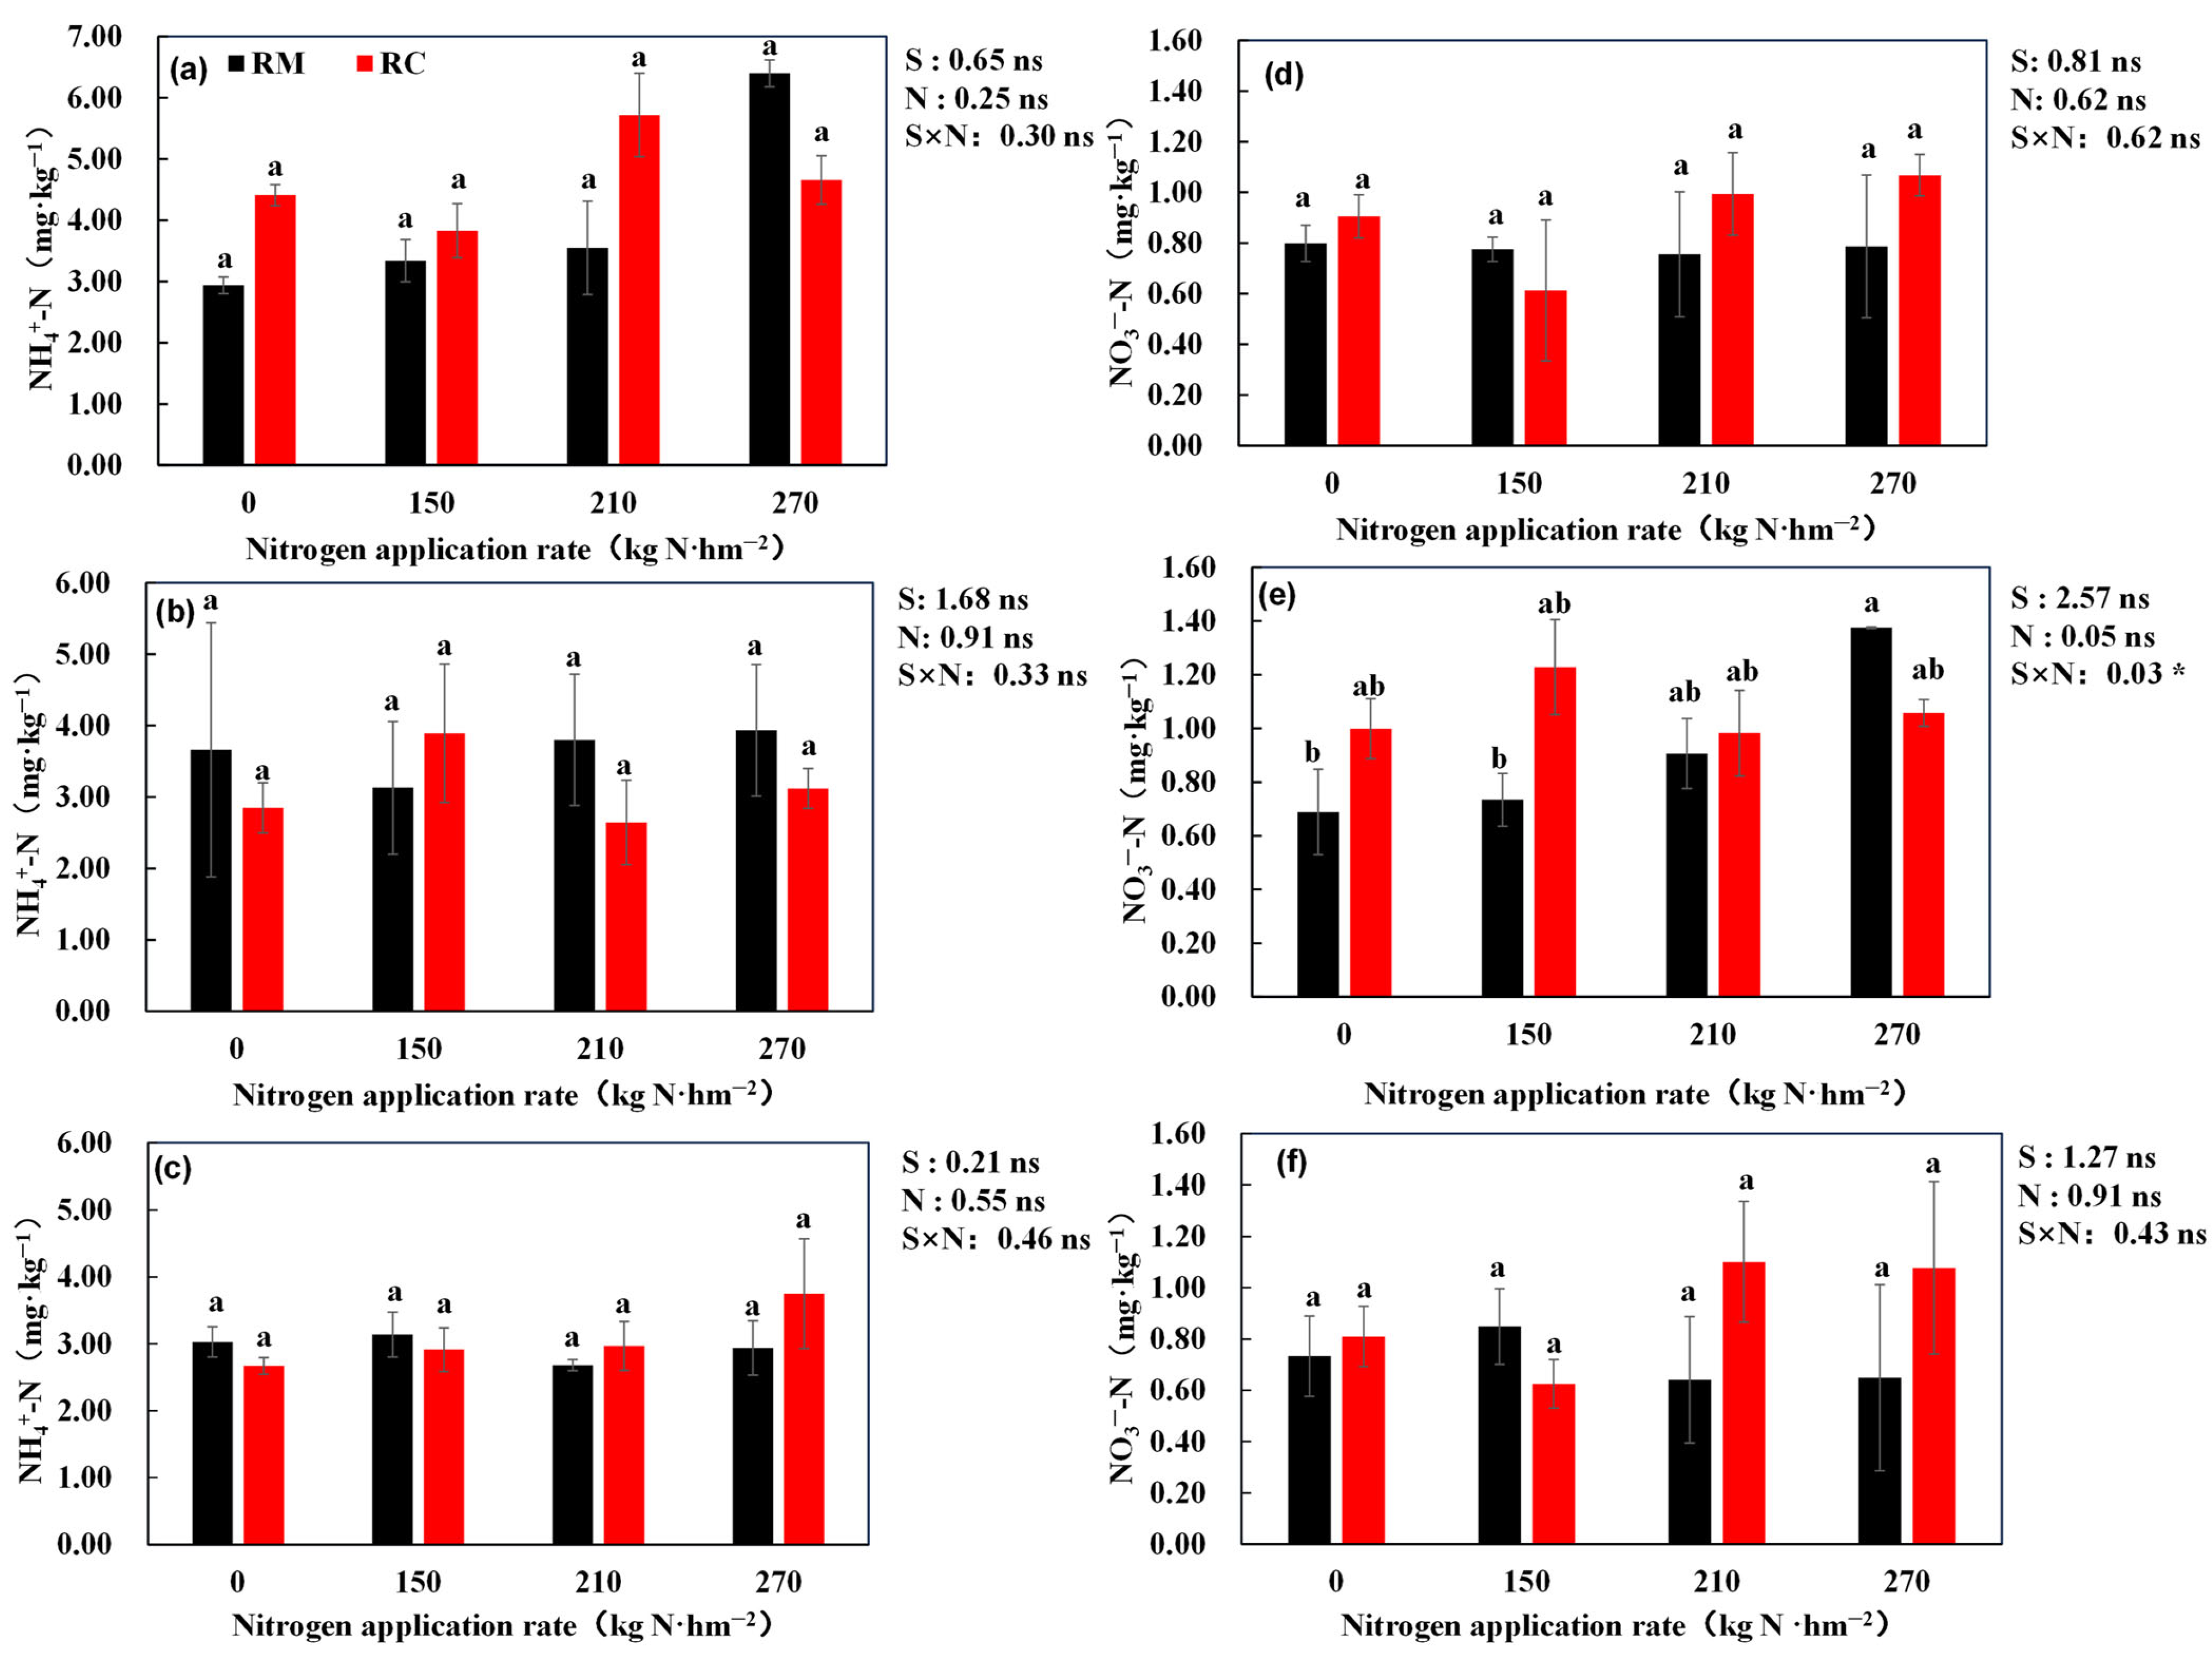
In all the soil layers, NH4+-N concentrations remained stable across all treatments with no significant effects of the cultivation system, nitrogen rate, or their interaction (Figure 8a–c).
NO3-N concentrations exhibited layer-specific responses to cultivation systems and nitrogen applications. In the 0–2 cm soil layer, two-way ANOVA showed no significant effects of the cultivation system, nitrogen rate, or their interaction on NO3-N concentrations (p ≥ 0.05) (Figure 8d). However, the response of NO3-N concentration to nitrogen application rates varied across different systems in the 2–10 cm soil layer. In RC, there was no significant difference in NO3-N concentration among all nitrogen application levels. Conversely, in RM, an increase in the nitrogen application rate resulted in a corresponding increase in NO3-N concentration, with the treatment of 270 kg N·hm−2 significantly higher than other levels of nitrogen application (Figure 8e). At other nitrogen application levels, there were no significant differences between the two systems (Figure 8e). In the 10–20 cm soil layer, no significant effects of the cultivation system, nitrogen rate, or their interaction were observed (p ≥ 0.05) (Figure 8f). However, RC treatments tended to maintain higher levels of NO3-N at medium and high nitrogen application rates (210 and 270 kg N·hm−2). Under high N application (270 kg N·hm−2), NO3-N concentration in the 10–20 cm layer of RC is 65.92% higher than RM, and 71.78% in 210 kg N·hm−2.

3.3. Yields of Rice and Crab

The nitrogen application rate had a significant impact on rice yield. The yields of all nitrogen treatments were significantly higher than those of their no-nitrogen counterparts in RC (p < 0.05). In RM, the yield of rice in 150 and 210 kg N·hm−2 treatment was significantly higher than no-nitrogen. Within the RC, there was no significant difference in yield among different nitrogen treatments (150, 210, and 270 kg N·hm−2) (p < 0.05, Table 5). There was no significant difference between the two systems at other levels of nitrogen application. Two-way ANOVA revealed a highly significant effect of fertilizer rate on rice yield (F = 22.68, p < 0.01), while cultivation systems showed no significant effects (Table 5).
Crab yields ranged from 193.3 ± 22.5 to 378.7 ± 28.3 kg·hm−2 across nitrogen treatments. No significant difference was observed between 0 and 150 kg N·hm−2 treatments (p ≥ 0.05). However, 210 kg N·hm−2 nitrogen rates produced significantly higher crab yields compared to low nitrogen rates (0 and 150 kg N·hm−2) (p < 0.05, Table 5).
Different nitrogen application rates significantly influenced the size and weight of river crabs. Regarding average individual weight, all nitrogen-treated groups exhibited an upward trend compared to the control group (RC0, 72.18 g) that received no nitrogen fertilizer. Specifically, the RC210 (80.64 g) and RC270 (80.43 g) treatments yielded crabs heavier than the control, with increases of approximately 11.8% and 11.5%, respectively. The RC150 treatment (71.82 g) showed no significant difference from the control (p ≥ 0.05). This indicates that moderate nitrogen fertilization (RC210 and RC270) promotes growth and weight gain in river crabs. Regarding morphological specifications, no statistically significant differences in body length or width were observed among treatment groups, though slight increases were noted with increasing nitrogen application rates. The RC270 treatment group exhibited the maximum values for both body length (5.29 cm) and body width (5.00 cm). Nitrogen application significantly improved crab survival rates. Survival rates increased markedly with rising nitrogen application levels, peaking at 0.42% in the RC210 group compared to 0.17% in the RC0 group. The RC270 group also maintained a high survival rate of 0.4%. This indicates that under the study conditions, increased nitrogen fertilization not only benefits individual crab growth but also exerts a significant positive impact on their survival.

3.4. Correlation Analysis

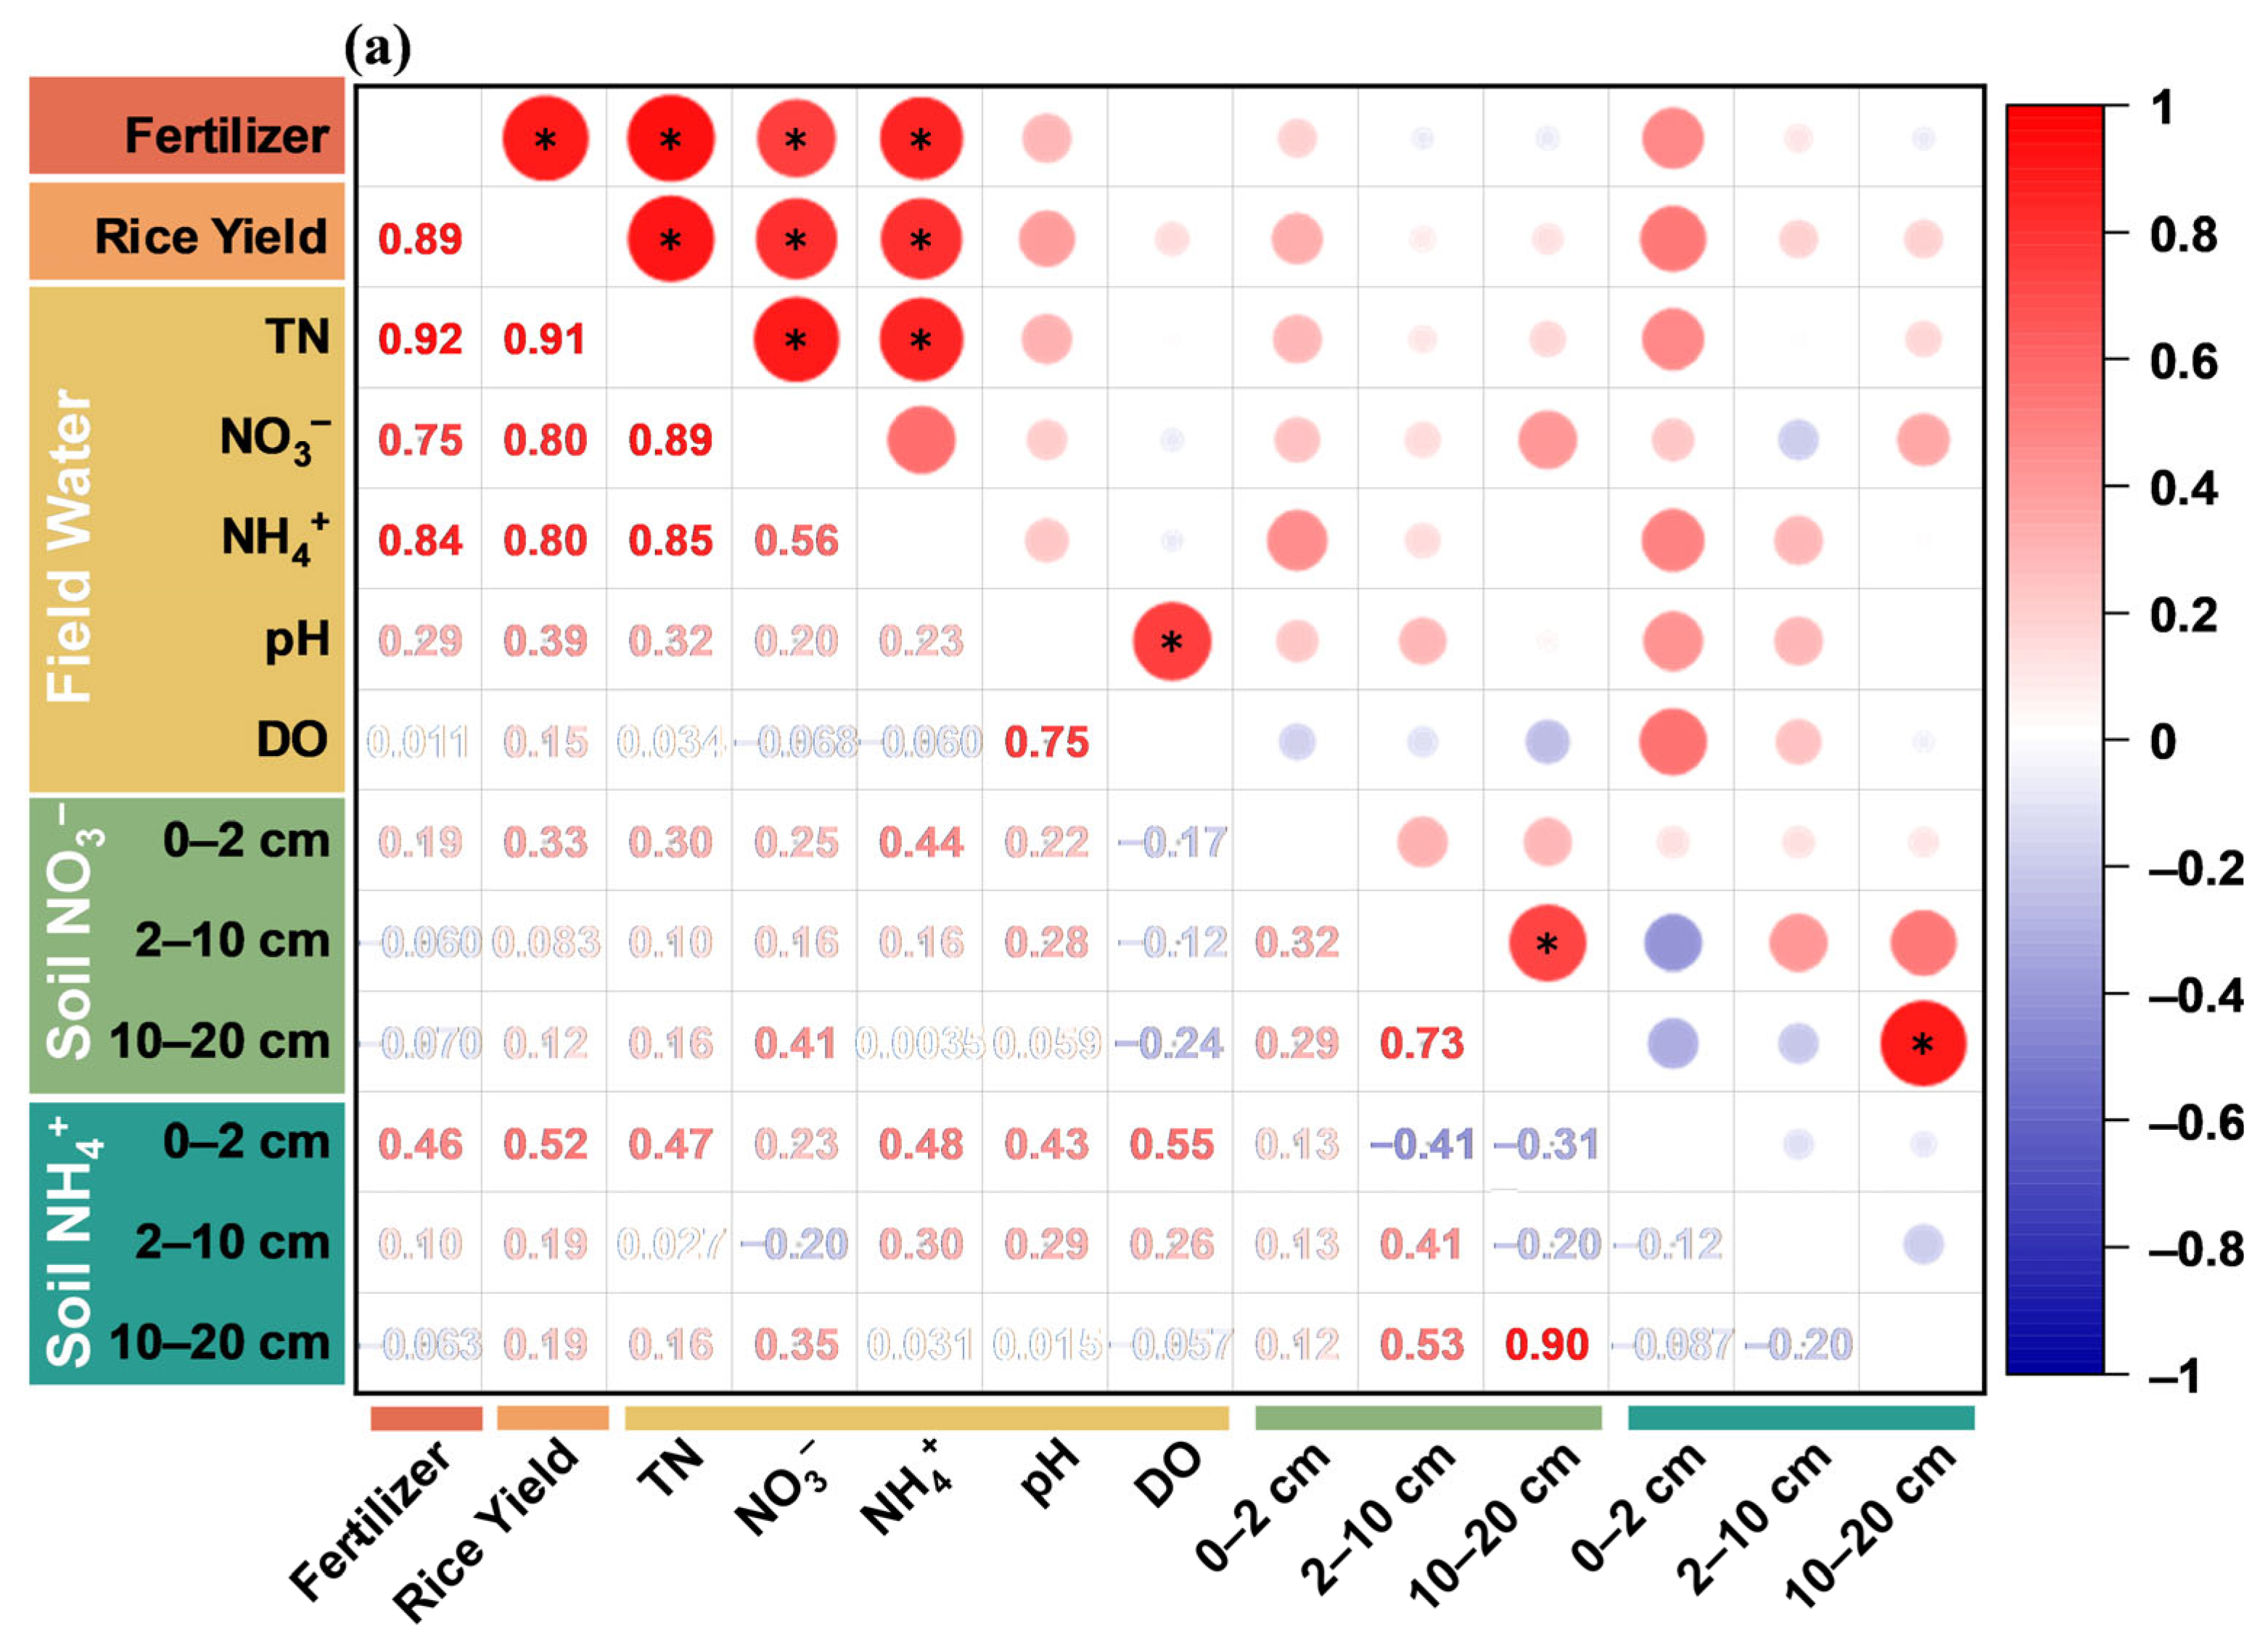
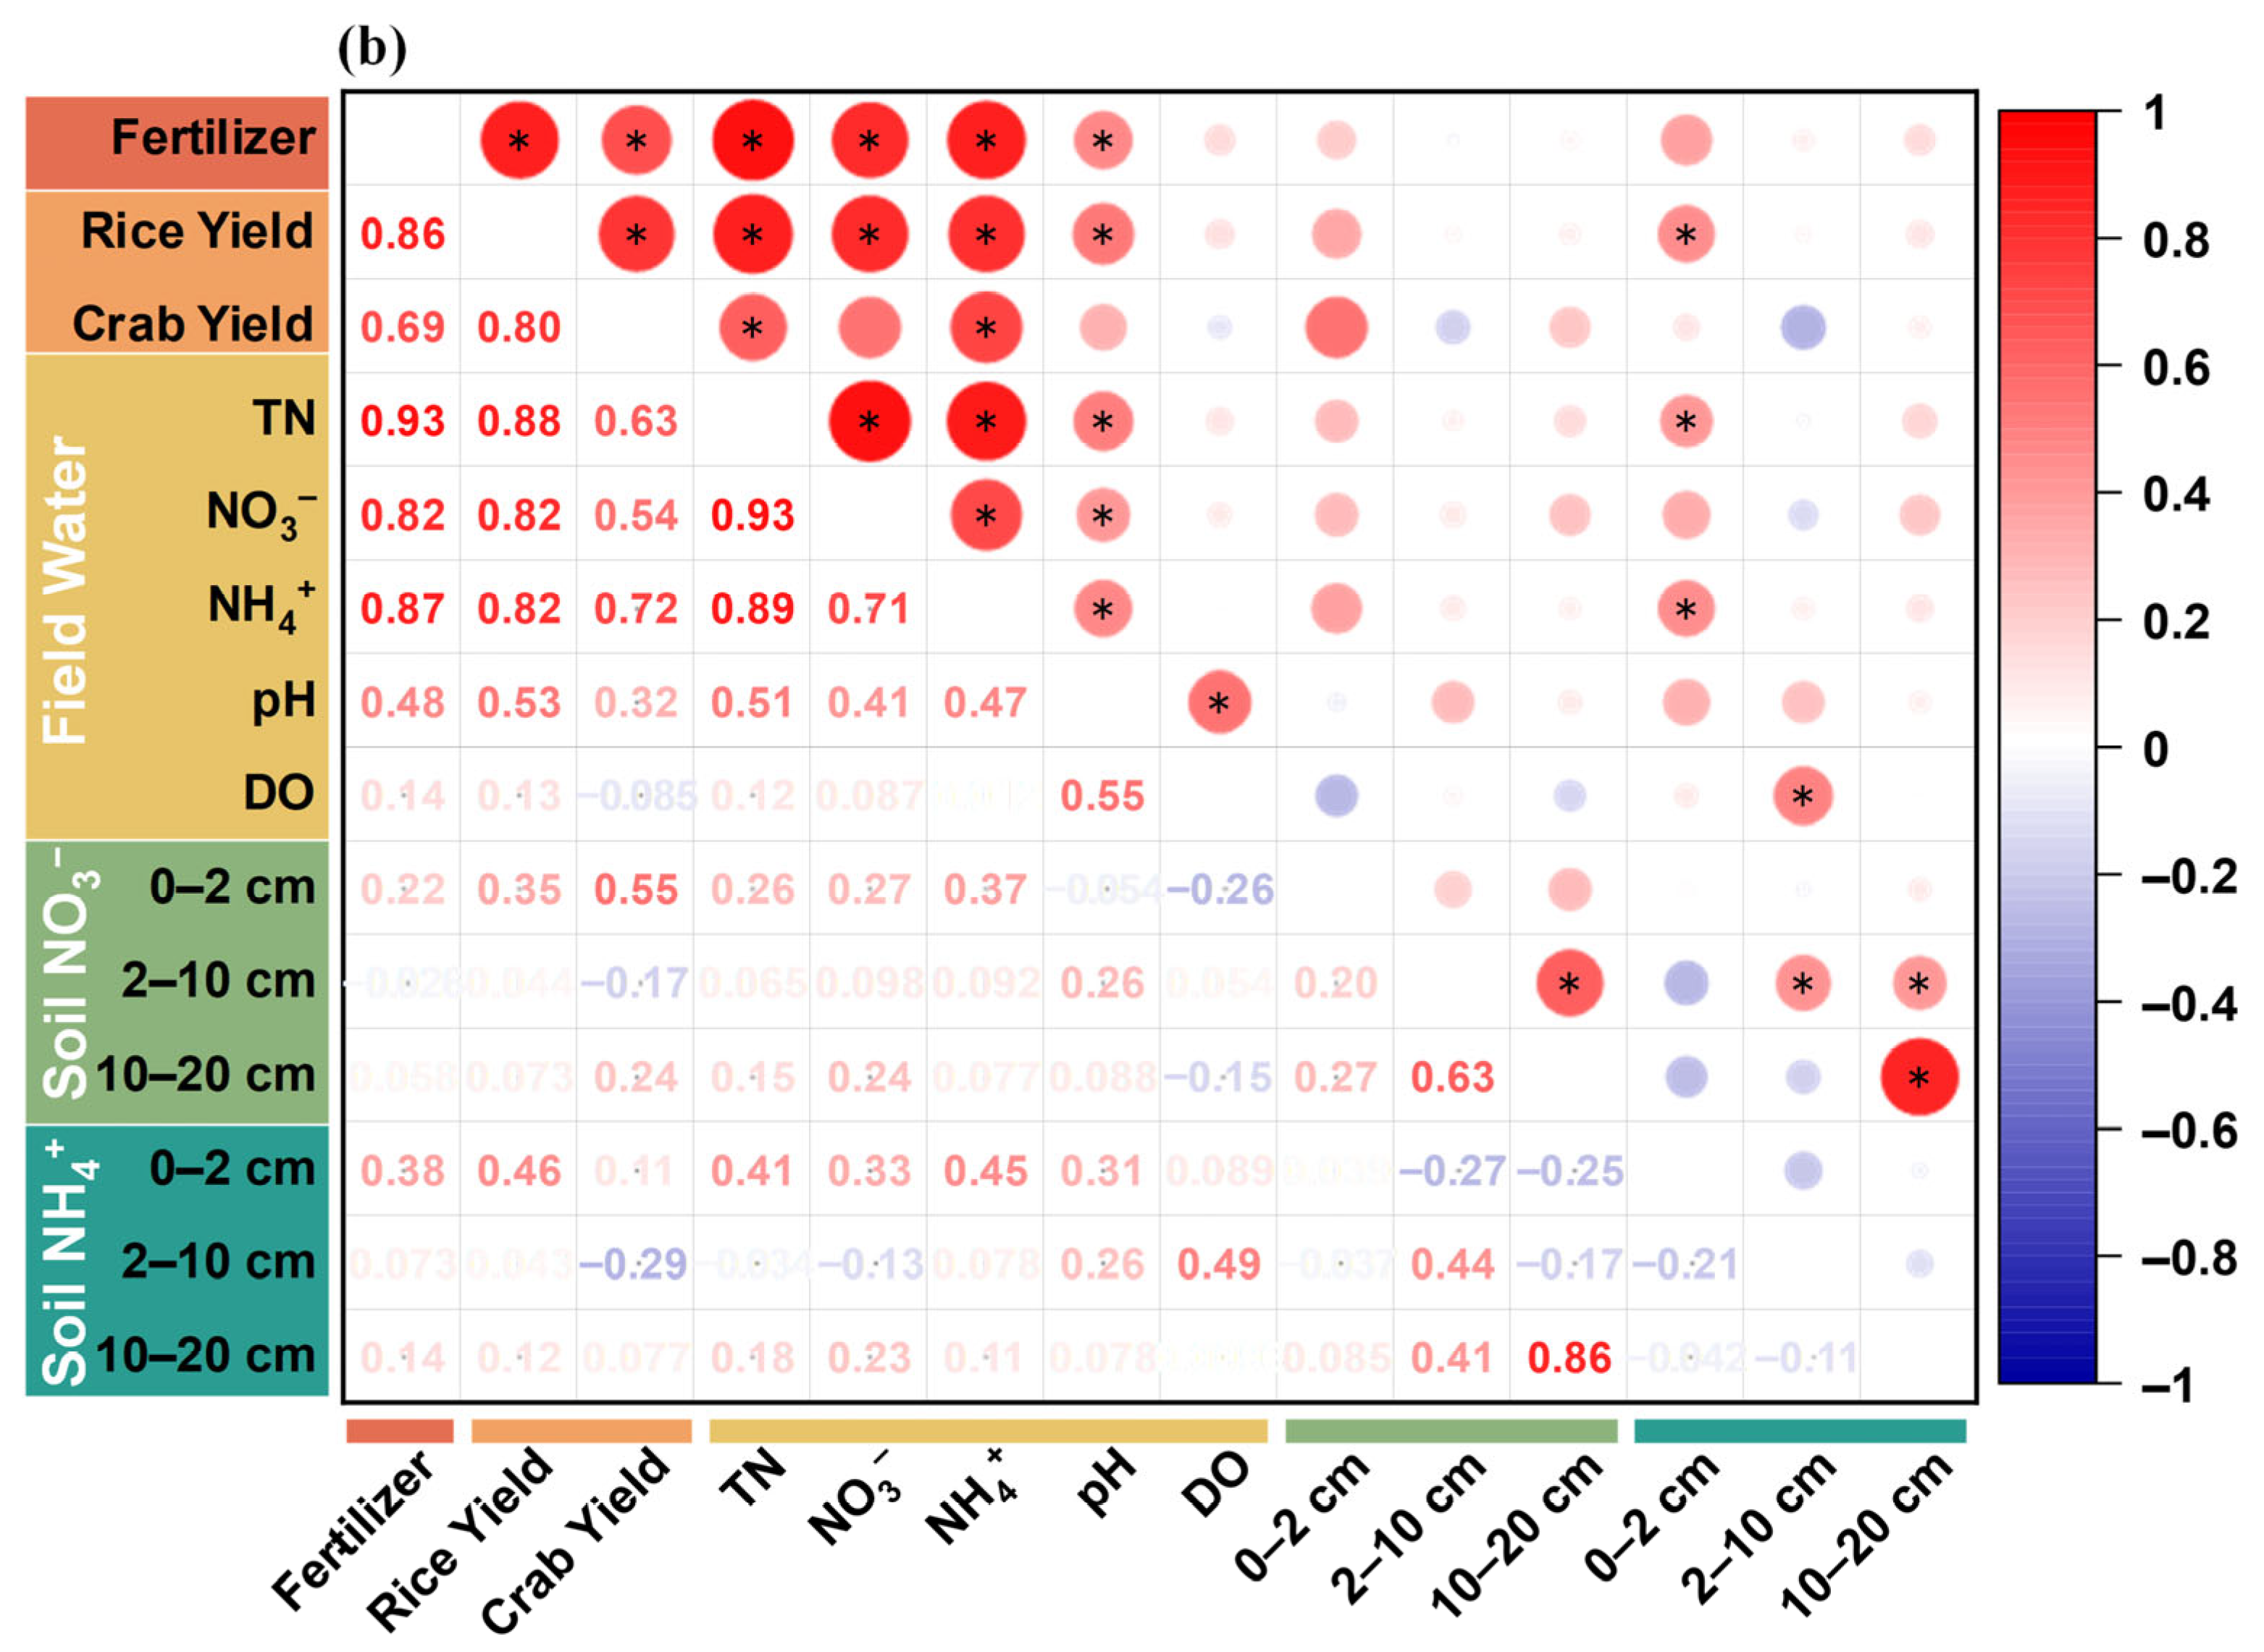
Nitrogen application exhibited a highly significant positive correlation with rice yield in both RM and RC (p < 0.05, Figure 9a,b). In RC, nitrogen application was positively correlated with crab yield (r = 0.75, p < 0.05), and rice and crab yields showed a strong positive correlation (p < 0.05, Figure 9b). Nitrogen application and rice yield were positively correlated with water TN, NO3-N, and NH4+-N concentrations in both systems (p < 0.05, Figure 9a,b). The positive correlation between nitrogen application and water pH only occurred in RC (Figure 9b). Water pH and DO showed significant positive correlations in both systems (p < 0.05, Figure 9a,b).
Water–soil nitrogen interactions differed markedly between systems. In RM, no significant correlations were observed between water nitrogen (TN, NH4+-N, NO3-N) and soil nitrogen at any depth (Figure 9a). In RC, water TN and NH4+-N were significantly positively correlated with NH4+-N in the 0–2 cm soil layer (Figure 9b), and water DO positively correlated with NH4+-N in the 2–10 cm soil layer (p < 0.05, Figure 9b).
Within soil profiles, both systems showed similar patterns: NO3-N in the 10–20 cm layer positively correlated with NO3-N in the 2–10 cm layer and with NH4+-N in the 10–20 cm layer (p < 0.05). However, NO3-N in the 2–10 cm soil showed system-specific correlations: in RM, it positively correlated only with NO3-N in the 10–20 cm soil, while in RC it additionally positively correlated with NH4+-N in the 2–10 cm soil (p < 0.05).

4. Discussion

4.1. Effects of Different Nitrogen Application Rates on Nitrogen Dynamics of RC

This study identified 210 kg N·hm−2 as the optimal nitrogen application rate for the Liaohe Delta region, balancing high rice yields (12.08% higher than RM), maximum crab production, and environmental sustainability. Field water nitrogen concentrations during critical growth stages were effectively controlled within safe thresholds at this rate.
Nitrogen application significantly influenced nitrogen dynamics in RC, with crab farming further modifying transformation processes. Field water nitrogen concentrations (NH4+-N, NO3-N, and TN), crab yields, and system differences between RC and RM exhibited non-linear responses with distinct inflection points at 210 kg N·hm−2. Applications above this threshold induced substantial increases in NH4+-N concentrations, while rates exceeding 270 kg N·hm−2 triggered marked elevations in both NO3-N and TN (Table 2). In RC, crab bioturbation—including burrowing, crawling, and sediment disturbance—accelerates nitrogen release from soil into field water by disrupting the soil structure. Crab excretion contributes directly to dissolved nitrogen pools, as crustacean excreta contain ammonia and readily mineralizable organic nitrogen. Burrow networks alter the redox conditions at the sediment–water interface, enhancing nitrification and nitrate mobility. These crab-mediated processes, combined with soil adsorption saturation [25], explain the heightened sensitivity of RC to nitrogen application rates.
Ammonia volatilization was closely linked to NH4+-N concentrations and pH levels in field water [26,27]. Nitrogen application enhanced NH3 volatilization by 4.33–4.65 times compared to control conditions [28,29], a process intensified by elevated pH levels, particularly above 7.0 [30]. Field water pH in both RC and RM remained consistently above 7.5, with RC showing increases from 7.8 to 8.6 after fertilization, indicating high ammonia volatilization potential. The strong positive correlation between pH and DO (Figure 7) supports this mechanistic linkage. Crab presence promotes plankton proliferation and increases CO2 release through respiration, forming carbonic acid and lowering the pH—a key environmental characteristic distinguishing RC from RM.
This study identified that the initial 15 days following base fertilizer application represent a critical period of risk for NH4+-N concentration in field water, with levels gradually decreasing from their peak to levels comparable to those observed in the control group. This decline is likely attributed to a combination of plant uptake, microbial transformation, gaseous loss, and leaching [31]. During TFP, the peak of NH4+-N concentration was significantly lower compared to the BFP, attributed to reduced nitrogen application and increased nitrogen absorption capacity of rice plants at this stage [32].
Area under the concentration–time curve (AUC) analysis revealed that during the base fertilization period (BFP), cumulative NH4+-N exposure increased significantly with nitrogen rate in RC (from approximately 20 to 80 mg·d·L−1 between RC0 and RC270), while NO3-N AUC showed the strongest treatment differentiation during TFP (Figure 5). During BFP, precipitation totaled approximately 50 mm across 5–6 rainfall events; during TFP, precipitation was minimal (<30 mm), reducing the runoff-mediated nitrogen export probability. The temperature during critical periods (20–30 °C) promoted rapid nitrification and ammonia volatilization (Figure 2).
The dynamic fluctuations of NH4+-N and NO3-N reflect the complex nitrogen transformation within RC. NO3-N peaks during TFP due to the delayed conversion from NH4+-N through nitrification [33], enhanced by higher temperatures promoting microbial activity [34] and with maximum DO concentrations accelerating this process. During BFP, the cultivation system significantly influenced NH4+-N levels (p < 0.05), as crab activities enhance nitrogen release through sediment resuspension and modification of the microbial community structure [35].
NH4+-N and nitrite levels significantly influence crustacean growth, survival, and physiology [36,37]. According to the technical specification for non-point source pollution control rice–crab co-culture (NY/T 3822-2020) [17], field water NH4+-N should be maintained below 1 mg·L−1 with pH between 7 and 8.5. However, all nitrogen treatments in this study exceeded 1 mg·L−1 during BFP, only dropping below this threshold 15 days post-application. The post-fertilization pH consistently exceeded 8.5, potentially impacting crab survival and growth.
Therefore, fertilization strategies should be optimized to balance production efficiency and environmental protection in RC. Recommendations include reducing fertilizer application rates and frequency, adjusting the overlap between fertilization and crab cultivation periods, applying fertilizer at least one week before crab release, or establishing temporary holding ponds during fertilization.
This study revealed that no significant effect was observed on NO3-N in the 0–20 cm soil layer. These findings differ from Wang’s study [28], highlighting the variability and complexity of nitrogen dynamics in RC and emphasizing the need for comprehensive consideration of the short-term and long-term effects, environmental conditions, and management practices.

4.2. Comparison of Nitrogen Dynamics Between RC and RM

RC and RM exhibited significant disparities in nitrogen dynamics, primarily attributable to crab activities affecting soil structure, nitrogen cycling, and environmental conditions. During BFP, RC showed heightened sensitivity to nitrogen application in field water NH4+-N, NO3-N, and TN concentrations, particularly at low nitrogen rates. This increased sensitivity results from crab-enhanced urease, protease, and dehydrogenase activities in the 0–20 cm soil layer [28], accelerating fertilizer hydrolysis and nitrogen release. Crab excreta decomposition further elevates NH4+-N levels while enhancing material exchange at the water–soil interface.
However, efficient nitrogen utilization in RC is associated with potential environmental risks. Despite identical nitrogen application, RC may pose a higher non-point source pollution risk than RM. Elevated field water nitrogen concentrations increase the runoff likelihood and subsequent eutrophication. Increased NH4+-N concentrations under high pH conditions heighten the ammonia volatilization risk. Furthermore, NO3-N persists longer in RC (up to 7 days) compared to RM (returning to control levels within 2 days), suggesting an extended vulnerability period requiring enhanced water and fertilizer management. Elevated NO3-N also increases the nitrogen leaching risk and exacerbates N2O emissions contributing to greenhouse gas effects.
Significant differences in soil nitrogen distribution were observed between RC and RM. NO3-N concentration in the 2–10 cm soil layer remained stable under different nitrogen rates in RC but increased with nitrogen rates in RM. In the 10–20 cm layer, high NO3-N was found in RC under high nitrogen application, consistent with Wang’s findings. This distribution pattern results from two interacting processes: crab bioturbation enhances vertical NO3-N transport through burrow formation [38,39], while burrow structures increase the oxygen penetration depth [16,40], weakening the anaerobic conditions required for denitrification and contributing to NO3-N accumulation in deeper layers. The effects of nitrogen application exhibited distinct characteristics between systems. Under low nitrogen application (150 kg N·hm−2), RC demonstrated a higher NO3-N concentration; however, under high nitrogen application (210–270 kg N·hm−2), both systems performed similarly. RC exhibited enhanced nitrogen transformation dynamics with greater responsiveness to fertilizer inputs (Table 2), reflecting accelerated mineralization and providing more plant-available nitrogen early in the growing season. At rates up to 210 kg N·hm−2, RC translated this enhanced availability into significantly higher yields (Table 5). At 270 kg N·hm−2, the advantage diminished as nitrogen exceeded the system’s assimilative capacity.
The integration of rice and crabs provides mechanistic advantages for nitrogen utilization. Crab feeding reduces ineffective rice tillering and controls aquatic plants and plankton, reducing nitrogen competition. Crab excretion and molting contribute to organic matter recycling. At 210 kg N·hm−2, RC achieved maximum rice yield (7.74 t·hm−2, 12.08% higher than RM) and peak crab yield (378.7 kg·hm−2), significantly exceeding yields at lower nitrogen rates (Table 5). Further increases to 270 kg N·hm−2 provided no additional yield benefits while significantly increasing environmental risks (Table 2).
Nitrogen fertilizer impacts crabs mainly within approximately one week after application, after which NH4+-N concentration decreases to levels suitable for crab growth (Figure 5). Increased nitrogen application enhances plankton biomass, increasing energy flow to crabs and boosting yields. However, excessive nitrogen is toxic during fertilization periods, raising crab mortality. This explains why crab yield first increases then decreases with nitrogen application, reaching a maximum at 210 kg N·hm−2.

4.3. Production and Environmental Responses

The correlation analysis revealed that fertilizer application serves as a critical driver influencing both productivity and environmental dynamics in RC. A significant positive correlation between fertilizer input and rice yield was observed in both RM and RC (Figure 7) [41]. In RC, fertilizer application also showed a significant positive correlation with crab yield (p < 0.05), suggesting that fertilizers not only directly promote rice growth but also indirectly enhance feed resources by stimulating plankton and benthic algae proliferation [42,43,44]. However, this relationship is not linear—beyond 210 kg N·hm−2, the positive correlation is attenuated by NH4+-N toxicity risks (Table 2), explaining the yield plateau between 210 and 270 kg N·hm−2 (Table 5).
A strong positive correlation between rice and crab yields (Figure 9) provides direct evidence for the ecological rationality of RC. Rice offers shade, habitat, and stable water quality for crabs, while crab activities improve soil permeability, influence soil carbohydrate composition [45,46], and aid in weed and pest control, partially substituting for pesticide use [47,48]. This biological synergy constitutes the foundation for achieving dual harvests.
Fertilizer application dominated the nitrogen response in the water bodies, showing a highly significant positive correlation with NO3-N in both systems (Figure 9), indicating nitrogen susceptibility to leaching or surface runoff. During BFP, NH4+-N was predominant in surface water; during TFP, nitrate became primary, reflecting nitrogen loss and the corresponding environmental response. Correlations between fertilizer and soil NH4+-N at various depths (0–2 cm, 2–10 cm, 10–20 cm) were weak or not insignificant (p ≥ 0.05), explained by the temporal mismatch between fertilizer application and soil sampling—fertilizer-derived nitrogen is rapidly transformed within 15 days post-application (Figure 5). This indicates that field water monitoring during critical periods provides more actionable information than soil nitrogen at harvest [49,50].
We acknowledge that single-time soil sampling at harvest represents a methodological limitation. Multiple sampling throughout the growing season would enable the direct quantification of soil nitrogen pool dynamics. However, this approach minimized disturbance to the crab burrow networks essential for crab survival. Future studies employing non-destructive soil monitoring techniques (e.g., porewater samplers, ion-exchange resins) could address this limitation while preserving crab habitat integrity.
The correlation between fertilizer and rice yield decreased in RC, while the correlation between NH4+-N and fertilizer shifted from not significant to significant (Figure 9), suggesting that crab activities enhance NH4+-N release from sediments through sediment resuspension and modification of the microbial community structure [35]. DO showed a significant positive correlation with pH in both systems (p < 0.05) (Figure 9), reflecting coupled photosynthesis dynamics where algae simultaneously consume CO2 (raising pH) and produce O2 (raising DO)—conditions required for optimal nitrification.
The correlation analysis reveals a fundamental trade-off in RC: fertilizer application is simultaneously positively correlated with both productivity and environmental risk. The non-linear nature of these relationships provides an optimization opportunity. The positive correlation between fertilizer and crab yield weakens beyond 210 kg N·hm−2 due to NH4+-N toxicity (Table 2), while the correlation with water nitrogen concentration continues to strengthen (Figure 9). This divergence identifies 210 kg N·hm−2 as the rate where production benefits no longer offset environmental costs—nitrogen rates above this threshold represent pure environmental cost with no yield benefit.

4.4. Suggestions for Optimal Water and Fertilizer Management of RC

Optimal fertilization for RC requires dynamic management based on real-time nitrogen monitoring during critical risk windows, rather than fixed uniform rates. The guiding principle is to synchronize nitrogen availability with crop demand while avoiding concentrations toxic to crabs. This is operationalized through (a) splitting applications to coincide with rice growth stages (basal and tillering), and (b) intensifying water quality monitoring for NH4+-N and NO3-N during the identified 15-day and 7-day risk windows. Fertilizer top-dressing should be adjusted if concentrations exceed the 0.69 mg·L−1 safety threshold (GB 11607-1989) [11].
Our analysis revealed that 210 kg N·hm−2 represents a site- and season-specific threshold for RC, balancing yield performance with environmental sustainability. This is evidenced by the significant yield improvements compared to 150 kg N·hm−2 treatments, while increases to 270 kg N·hm−2 showed no additional benefits (Table 5), aligning with previous findings where applications above 200 kg N·hm−2 showed diminishing returns [5]. Exceeding 210 kg N·hm−2 led to significant increases in field water NH4+-N during BFP and sustained NO3-N elevation during TFP (Table 2), suggesting enhanced nitrogen loss risks. Excessive application may also increase NO3-N accumulation in rice tissues [51,52], potentially affecting grain quality.
Based on our findings, we propose three key principles for sustainable RC management. First, nitrogen applications should follow a split strategy aligned with crop demand, with particular attention during the 15 days post-base fertilization and 7 days post-tillering fertilization [53]. Second, water management should integrate chemical and hydrological controls, maintaining appropriate water levels to reduce nitrogen losses [54] while controlling pH within 7.0–8.5 for nitrogen retention and crab survival (NY/T 3822-2020). Third, systematic monitoring of NH4+-N, NO3-N, and pH enables timely management adjustments, improving nitrogen use efficiency [55].
Future research should focus on the following: (1) developing real-time monitoring systems for precise nitrogen management; (2) quantifying nitrogen accumulation in rice grains under different rates; (3) investigating the long-term impacts of crab bioturbation on soil nitrogen cycling; and (4) optimizing water–nitrogen coupling strategies.
In synthesis, RC fundamentally differs from conventional rice monoculture in nitrogen cycling dynamics. Crab bioturbation enhances enzyme-mediated nitrogen mineralization (urease, protease, dehydrogenase), accelerating fertilizer conversion to plant-available forms. This creates a dual-edged outcome: improved nitrogen use efficiency at moderate rates but heightened environmental risks through prolonged NO3-N persistence, ammonia volatilization, and increased leaching through burrow networks. The central finding is that 210 kg N·hm−2 represents the optimal rate, simultaneously maximizing dual productivity (rice: 7.74 t·hm−2; crab: 378.7 kg·hm−2) and minimizing environmental degradation—a clear guideline for the sustainable intensification of integrated rice–aquaculture systems.

5. Conclusions

This study identified an optimal nitrogen application rate of 210 kg N∙hm−2 for RC that balances productivity with environmental protection. Critical nitrogen loss periods occur within 15 days after base fertilizer and 7 days after tillering fertilizer application. Compared to RM, RC showed elevated subsurface NO3-N concentrations, indicating distinct nitrogen transformation dynamics requiring system-specific management strategies.
The current 38% nitrogen overapplication in Liaoning province represents a substantial opportunity for pollution reduction. Adoption of the 210 kg N∙hm−2 threshold, combined with enhanced water management during critical loss periods, can maintain productivity while significantly reducing environmental risks.
We acknowledge that single time-point soil sampling constrains the conclusions regarding nitrogen loss pathways; future studies incorporating in-season soil N time series, gaseous flux measurements, and porewater profiles would strengthen the mechanistic understanding. Ultimately, this study demonstrates that sustainable intensification is achievable when management decisions are guided by the quantitative understanding of system-specific nitrogen thresholds and transformation dynamics.

Supplementary Materials

The following supporting information can be downloaded at https://www.mdpi.com/article/10.3390/agriengineering8010034/s1, Figure S1: Diagnostic Plots; Table S1: Soil bulk density and moisture content; Table S2: Water quality parameters during BFP period; Table S3: Water quality parameters during NFP period; Table S4: Water quality parameters during TFP period; Table S5: Soil NH4+-N and NO3—-N content; Table S6: Shapiro-Wilk test and Levene’s test; Table S7: Correlation Analysis Table in RM; Table S8 Correlation Analysis Table in RC.

Author Contributions

Conceptualization, H.L. (Hao Li) and Y.X.; validation, H.L. (Hongbin Liu); formal analysis, H.L. (Hao Li); investigation, Y.X., W.L., S.M., X.Z., Q.L., and B.F.; resources, W.L., X.Z., S.M., W.S., Q.L., and B.L.; writing—original draft preparation, H.L. (Hao Li); writing—review and editing, S.W. and B.F.; supervision, S.W. and W.S.; funding acquisition, H.L. (Hongbin Liu) and B.L. All authors have read and agreed to the published version of the manuscript.

Funding

The authors declare that financial support was received for the research, authorship, and/or publication of this article. This work was supported by the National Key Research and Development Program of China (2024YFD1500700), the National Key Research and Development Program of China (2022YFD1700700), the Basic Scientific Research Business Expenses Project of Liaoning Academy of Agricultural Sciences (2025HQ1313), and the China Agriculture Research System (CARS-01).

Institutional Review Board Statement

Not applicable.

Informed Consent Statement

Not applicable.

Data Availability Statement

The original contributions presented in the study are included in the article/Supplementary Materials; further inquiries can be directed to the corresponding authors.

Acknowledgments

The authors gratefully acknowledge the valuable feedback, coding support, and research assistance received during this research.

Conflicts of Interest

The authors declare no conflicts of interest.

Abbreviations

The following abbreviations are used in this manuscript:
RCRice–crab co-culture system
NNitrogen
RMRice monoculture system
NO3-NNitrate nitrogen
NH4+-NAmmonium nitrogen
BFPBase fertilizer period
TFPTillering fertilizer period
NFPNo-fertilizer period
DODissolved oxygen
TNTotal nitrogen
TOCTotal organic carbon
ANOVAAnalysis of variance
AUCArea under the concentration–time curve

References

  1. Chen, B.; Zhang, X.; Gu, B. Managing nitrogen to achieve sustainable food-energy-water nexus in China. Nat. Commun. 2025, 16, 4804. [Google Scholar] [CrossRef]
  2. Fagodiya, R.K.; Kumar, A.; Kumari, S.; Medhi, K.; Shabnam, A.A. Role of nitrogen and its agricultural management in a changing environment. In Contaminants in Agriculture: Sources, Impacts and Management; Naeem, M., Ansari, A.A., Gill, S.S., Eds.; Springer Nature: Cham, Switzerland, 2020; pp. 247–270. [Google Scholar] [CrossRef]
  3. Yu, X.; Keitel, C.; Zhang, Y.; Wangeci, A.; Dijkstra, F. Global meta-analysis of nitrogen fertilizer use efficiency in rice, wheat and maize. Agric. Ecosyst. Environ. 2022, 338, 108106. [Google Scholar] [CrossRef]
  4. Coggins, S.; McDonald, A.J.; Silva, J.V.; Urfels, A.; Nayak, H.S.; Sherpa, S.R.; Jat, M.L.; Jat, H.S.; Krupnik, T.; Kumar, V.; et al. Data-driven strategies to improve nitrogen use efficiency of rice farming in South Asia. Nat. Sustain. 2025, 8, 22–33. [Google Scholar] [CrossRef]
  5. Chen, B.; Guo, L.; Tang, J.; Li, Y.; Li, C. Comprehensive impacts of different integrated rice-animal co-culture systems on rice yield, nitrogen fertilizer partial factor productivity and nitrogen losses: A global meta-analysis. Sci. Total Environ. 2024, 915, 169994. [Google Scholar] [CrossRef]
  6. Liu, C.; Xia, J.; Cui, Q.; Zhang, D.; Liu, M.; Hou, L.; Gao, D. Crab bioturbation affects competition between microbial nitrogen removal and retention in estuarine and coastal wetlands. Environ. Res. 2022, 215, 114280. [Google Scholar] [CrossRef]
  7. Xie, W.; Jiang, J.; Liu, H.; Liang, L.; Chen, X. Crab bioturbation alters nitrogen cycling and promotes N2O emission in rice–crab paddies. Sci. Total Environ. 2020, 706, 135716. [Google Scholar] [CrossRef]
  8. National Fisheries Technology Extension Center. Report on the Development of the Comprehensive Planting and Breeding Industry of Rice Fishery in China. China Fish. 2024, 8, 12–17. [Google Scholar]
  9. Yu, Y.; Wan, J.; Liang, X.; Wang, Y.; Liu, X.; Mei, J.; Sun, N.; Li, X. Effects of protein level on the production and growth performance of juvenile Chinese mitten crab (Eriocheir sinensis) and environmental parameters in paddy fields. Water 2022, 14, 1941. [Google Scholar] [CrossRef]
  10. National Bureau of Statistics of China. Effective Irrigation Area, Agricultural Fertilizer Application Amount, Rural Hydropower Stations and Electricity Consumption in Liaoning Province in 2020. 2020. Available online: https://data.stats.gov.cn/english/index.htm (accessed on 1 October 2025).
  11. GB 11607-1989; Fisheries Water Quality Standard. China Standards Press: Beijing, China, 1989.
  12. Ma, X.; Ding, Z.; Hu, R.; Wang, X.; Hou, J.; Zou, G.; Cao, B. Increasing rice yield with low ammonia volatilization by combined application of controlled-release blended fertilizer and densification. PLoS ONE 2025, 20, e0318177. [Google Scholar] [CrossRef] [PubMed]
  13. Karolina, F.; Agnieszka, W. The impact of extreme weather events as a consequence of climate change on the soil moisture and on the quality of the soil environment and agriculture—A review. CATENA 2023, 231, 107378. [Google Scholar] [CrossRef]
  14. Banerjee, A.; Chakrabarty, M.; Rakshit, N.; Bhowmick, A.R.; Ray, S. Environmental factors as indicators of dissolved oxygen concentration and zooplankton abundance: Deep learning versus traditional regression approach. Ecol. Indic. 2019, 100, 99–117. [Google Scholar] [CrossRef]
  15. Luo, W.; Wang, D.; Xu, Z.; Liao, G.; Chen, D.; Huang, X.; Wang, Y.; Yang, S.; Zhao, L.; Huang, H.; et al. Effects of cadmium pollution on the safety of rice and fish in a rice-fish coculture system. Environ. Int. 2020, 143, 105898. [Google Scholar] [CrossRef] [PubMed]
  16. An, Z.; Zheng, Y.; Hou, L.; Gao, D.; Chen, F.; Zhou, J.; Liu, B.; Wu, L.; Qi, L.; Yin, G.; et al. Aggravation of nitrous oxide emissions driven by burrowing crab activities in intertidal marsh soils: Mechanisms and environmental implications. Soil Biol. Biochem. 2022, 171, 108732. [Google Scholar] [CrossRef]
  17. NY/T 3822-2020; Technical Specification for Nonpoint Source Pollution Control in Rice–Crab Co-Culture. Ministry of Agriculture and Rural Affairs of the People’s Republic of China: Beijing, China, 2021.
  18. Ruan, S.; Zhuang, Y.; Zhang, L.; Li, S.; Chen, J.; Wen, W.; Zhai, L.; Liu, H.; Du, Y. Improved estimation of nitrogen dynamics in paddy surface water in China. J. Environ. Manag. 2022, 312, 114932. [Google Scholar] [CrossRef]
  19. ISO 14256-2:2005; Soil Quality—Determination of Nitrate, Nitrite and Ammonium in Field-Moist Soils by Extraction with Potassium Chloride Solution—Part 2: Automated Method with Segmented Flow Analysis. International Organization for Standardization: Geneva, Switzerland, 2005.
  20. Hu, L.; Guo, L.; Zhao, L.; Shi, X.; Ren, W.; Zhang, J.; Tang, J.; Chen, X. Productivity and the complementary use of nitrogen in the coupled rice-crab system. Agric. Syst. 2020, 178, 102742. [Google Scholar] [CrossRef]
  21. Tang, H.; Shi, L.; Wen, L.; Chen, K.; Li, C.; Li, W.; Xiao, X. Effects of tillage management on soil organic carbon mineralization under double cropping rice system of southern China. Sci. Rep. 2024, 14, 2114. [Google Scholar] [CrossRef]
  22. Mao, W.; Xia, Y.; Ma, C.; Zhu, G.; Wang, Z.; Tu, Q.; Chen, X.; Wu, J.; Su, Y. Response of Organic Carbon Mineralization to Nitrogen Addition in Micro-aerobic and Anaerobic Layers of Paddy Soil. Huan Jing Ke Xue 2023, 11, 6248–6256. [Google Scholar] [CrossRef] [PubMed]
  23. He, T.; Liu, D.; Yuan, J.; Ni, K.; Zaman, M.; Luo, J.; Lindsey, S.; Ding, W. A two years study on the combined effects of biochar and inhibitors on ammonia volatilization in an intensively managed rice field. Agric. Ecosyst. Environ. 2018, 264, 44–53. [Google Scholar] [CrossRef]
  24. Jiang, X.; Ma, H.; Zhao, Q.; Yang, J.; Xin, C.; Chen, B. Bacterial communities in paddy soil and ditch sediment under rice-crab co-culture system. AMB Expr. 2021, 11, 163. [Google Scholar] [CrossRef] [PubMed]
  25. Zhang, F.; Wu, M.; Xia, Y.; Zhai, L.; Duan, X.; Fan, X.; Xiong, G.; Liu, D.; Gao, L. Changes in nitrogen and phosphorus in surface water of paddy field in Jiangshan plain. Acta Pedol. Sin. 2019, 56, 1190–1200. [Google Scholar] [CrossRef]
  26. Lee, Y.J.; Im, E.C.; Lee, G.; Hong, S.C.; Lee, C.-G.; Park, S.J. Comparison of ammonia volatilization in paddy and field soils fertilized with urea and ammonium sulfate during rice, potato, and Chinese cabbage cultivation. Atmos. Pollut. Res. 2024, 15, 102049. [Google Scholar] [CrossRef]
  27. Islam, S.M.M.; Gaihre, Y.K.; Biswas, J.C.; Jahan, M.S.; Singh, U.; Adhikary, S.K.; Satter, M.A.; Saleque, M.A. Different nitrogen rates and methods of application for dry season rice cultivation with alternate wetting and drying irrigation: Fate of nitrogen and grain yield. Agric. Water Manag. 2018, 196, 144–153. [Google Scholar] [CrossRef]
  28. Wang, A.; Dai, D.; Ma, X.; Mou, Q.; Yu, Y.; Lv, W. Effects of rice-crab culture system on soil microbial biomass nitrogen and soil enzymes activities. Jiangsu J. Agric. Sci. 2019, 1, 76–84. [Google Scholar] [CrossRef]
  29. Khoshnevisan, B.; Bashir, M.A.; Sun, Q.; Pan, J.; Wang, H.; Xu, Y.; Duan, N.; Liu, H. Optimal rice-crab co-culture system as a new paradigm to air-water-food nexus sustainability. J. Clean. Prod. 2021, 291, 125936. [Google Scholar] [CrossRef]
  30. Yu, S.; Xue, L.; Feng, Y.; Liu, Y.; Song, Z.; Mandal, S.; Yang, L.; Sun, Q.; Xing, B. Hydrochar reduced NH3 volatilization from rice paddy soil: Microbial-aging rather than water-washing is recommended before application. J. Clean. Prod. 2020, 268, 122233. [Google Scholar] [CrossRef]
  31. Wei, Q.; Wei, Q.; Xu, J.; Liu, Y.; Wang, D.; Chen, S.; Qian, W.; He, M.; Chen, P.; Zhou, X.; et al. Nitrogen losses from soil as affected by water and fertilizer management under drip irrigation: Development, hotspots and future perspectives. Agric. Water Manag. 2024, 296, 108791. [Google Scholar] [CrossRef]
  32. Li, M.; Liu, Y.; Luo, L.; Ying, S.; Jiang, P. Effects of different biogas slurry application patterns on nitrogen and phosphorus losses in a paddy field. Paddy Water Environ. 2024, 22, 521–533. [Google Scholar] [CrossRef]
  33. Liu, X.; Wu, Y.; Sun, R.; Hu, S.; Qiao, Z.; Wang, S.; Mi, X. NH4+-N/NO3-N ratio controlling nitrogen transformation accompanied with NO2-N accumulation in the oxic-anoxic transition zone. Environ. Res. 2020, 189, 109962. [Google Scholar] [CrossRef]
  34. Séneca, J.; Söllinger, A.; Herbold, C.W.; Pjevac, P.; Prommer, J.; Verbruggen, E.; Sigurdsson, B.D.; Peñuelas, J.; Janssens, I.A.; Urich, T.; et al. Increased microbial expression of organic nitrogen cycling genes in long-term warmed grassland soils. ISME Commun. 2021, 1, 69. [Google Scholar] [CrossRef]
  35. Wu, C.; Wu, H.; Liu, D.; Han, G.; Zhao, P.; Kang, Y. Crab bioturbation significantly alters sediment microbial composition and function in an intertidal marsh. Estuar. Coast. Shelf Sci. 2021, 249, 107116. [Google Scholar] [CrossRef]
  36. Edwards, T.M.; Puglis, H.J.; Kent, D.B.; Durán, J.L.; Bradshaw, L.M.; Farag, A.M. Ammonia and aquatic ecosystems—A review of global sources, biogeochemical cycling, and effects on fish. Sci. Total Environ. 2024, 907, 167911. [Google Scholar] [CrossRef]
  37. Sun, W.T.; Sun, F.Y.; Gong, L. Effect of single basal application of fertilizers on the yield of rice and crab in rice-crab symbiosis system. Chin. J. Soil Sci. 2012, 43, 429–434. [Google Scholar]
  38. Diaz de Astarloa, C.; Giorgini, M.; Miguez, A.; Iribarne, O.; Escapa, M. Effect of increased inundation time on intertidal ecosystem functions of South West Atlantic soft-bottom environments. Mar. Ecol. Prog. Ser. 2023, 711, 1–16. [Google Scholar] [CrossRef]
  39. Magri, M.; Benelli, S.; Bondavalli, C.; Bartoli, M.; Christian, R.; Bodini, A. Benthic n pathways in illuminated and bioturbated sediments studied with network analysis. Limnol. Oceanogr. 2018, 63, S68–S84. [Google Scholar] [CrossRef]
  40. Xie, L.; Liu, J.; Zha, W.; Li, Y.; Hipsey, M.; Ning, Z.; Zhang, M.; Zhang, Z. Crab burrow morphology modulates vertical soil hydrological connectivity in saltmarshes: A field experimental study. Geoderma 2025, 462, 117506. [Google Scholar] [CrossRef]
  41. Chen, Z.; Li, X.; Liu, T.; Fu, H.; Yuan, X.; Cheng, Q.; Liao, Q.; Zhang, Y.; Li, W.; Sun, Y.; et al. Strategies for fertilizer management to achieve higher yields and environmental and fertilizer benefits of rice production in China. Sci. Total Environ. 2023, 904, 166325. [Google Scholar] [CrossRef]
  42. Nong, X.; Guan, X.; Chen, L.; Wei, J.; Li, R. Identifying environmental impacts on planktonic algal proliferation and associated risks: A five-year observation study in Danjiangkou Reservoir, China. Sci. Rep. 2024, 14, 21568. [Google Scholar] [CrossRef]
  43. Kaitlin, L.R.; Ted, D.; Elfferich, I.; Coker, A.; Zhan, Q.; Domis, L.N.D.S.; Morales-Williams, A.M.; Bhattacharya, R.; Grossart, H.-P.; North, R.L.; et al. The role of organic nutrients in structuring freshwater phytoplankton communities in a rapidly changing world. Water Res. 2022, 219, 118573. [Google Scholar] [CrossRef]
  44. Hussian, A.E.M.; Goher, M.E.S. Evaluating the effect of chemical and organic fertilizers on water quality and phytoplankton growth: An experimental study. Sustain. Water Resour. Manag. 2023, 9, 103. [Google Scholar] [CrossRef]
  45. Xiao, K.; Wu, Y.; Pan, F.; Huang, Y.; Peng, H.; Lu, M.; Zhang, Y.; Li, H.; Zheng, Y.; Zheng, C.; et al. Widespread crab burrows enhance greenhouse gas emissions from coastal blue carbon ecosystems. Commun. Earth Environ. 2024, 5, 437. [Google Scholar] [CrossRef]
  46. Qiu, D.; Cui, B.; Yan, J.; Ma, X.; Ning, Z.; Wang, F.; Sui, H.; Bai, J. Effect of burrowing crabs on retention and accumulation of soil carbon and nitrogen in an intertidal salt marsh. J. Sea Res. 2019, 154, 101808. [Google Scholar] [CrossRef]
  47. Luo, X.; Li, C.; Chen, C.; He, M. Research Status of Ecological Effect under the Co-Production Mode of Rice and Crabs. Crop Res. 2019, 33, 352–355. (In Chinese) [Google Scholar] [CrossRef]
  48. Bashir, M.A.; Wang, H.; Sun, W.; Zhai, L.; Zhang, X.; Wang, N.; Rehim, A.; Raza, Q.-U.; Liu, H. The implementation of rice-crab co-culture system to ensure cleaner rice and farm production. J. Clean. Prod. 2021, 316, 128284. [Google Scholar] [CrossRef]
  49. Mosley, O.; Gios, E.; Close, M.; Weaver, L.; Daughney, C.; Handley, K. Nitrogen cycling and microbial cooperation in the terrestrial subsurface. ISME J. 2022, 16, 2561–2573. [Google Scholar] [CrossRef]
  50. Netthisinghe, A.; Galloway, H.; Agga, G.; Gunter, P.; Sistani, K. Effects of Cropping Systems on Soil Physicochemical Properties and Abundances and Spatial Distributions of Nitrogen-Cycling Bacteria. Agronomy 2023, 13, 1461. [Google Scholar] [CrossRef]
  51. Zhang, Y.; Ye, C.; Su, Y.; Peng, W.; Lu, R.; Liu, Y.; Huang, H.; He, X.; Yang, M.; Zhu, S. Soil Acidification caused by excessive application of nitrogen fertilizer aggravates soil-borne diseases: Evidence from literature review and field trials. Agric. Ecosyst. Environ. 2022, 340, 108176. [Google Scholar] [CrossRef]
  52. Zhang, L.; Zhao, Z.; Jiang, B.; Baoyin, B.; Cui, Z.; Wang, H.; Li, Q.; Cui, J. Effects of Long-Term Application of Nitrogen Fertilizer on Soil Acidification and Biological Properties in China: A Meta-Analysis. Microorganisms 2024, 12, 1683. [Google Scholar] [CrossRef]
  53. Sajjad, M.; Hussain, K.; Wajid, S.A.; Saqib, Z.A. The Impact of Split Nitrogen Fertilizer Applications on the Productivity and Nitrogen Use Efficiency of Rice. Nitrogen 2025, 6, 1. [Google Scholar] [CrossRef]
  54. Liu, L.; Ouyang, W.; Wang, Y.; Lian, Z.; Pan, J.; Liu, H.; Chen, J.; Niu, S. Paddy water managements for diffuse nitrogen and phosphorus pollution control in China: A comprehensive review and emerging prospects. Agric. Water Manag. 2023, 277, 108102. [Google Scholar] [CrossRef]
  55. Swathy, R.; Geethalakshmi, V.; Pazhanivelan, S.; Pandian, K.; Annamalai, S.; Hwang, S. Real-time nitrogen monitoring and management to augment n use efficiency and ecosystem sustainability—A review. J. Hazard. Mater. Adv. 2024, 16, 100466. [Google Scholar] [CrossRef]
Figure 1. Study area. The dash line is a location indicator of the study area.
Agriengineering 08 00034 g001
Figure 2. The daily temperature and precipitation of rice growing season.
Agriengineering 08 00034 g002
Figure 3. Experimental plot design. Different colors indicate the locations of plots with different nitrogen application rates. Blue, orange, red and green correspond to 0, 150, 210 and 270 kg N·hm−2 respectively.
Agriengineering 08 00034 g003
Figure 4. The growth cycle of rice and the corresponding sample collection period.
Agriengineering 08 00034 g004
Figure 5. Temporal variations in NH4+-N (a,b), NO3-N (c,d), and total N (e,f) content in field water under rice monoculture (RM; a,c,e) and rice–crab co-culture (RC; b,d,f) systems. Error bars indicate standard deviations. BFP, base fertilizer period; TFP, tillering fertilizer period; NFP, no-fertilizer period; BF, base fertilizer; TF, tillering fertilizer; AUC, area under the concentration–time curve. The horizontal dashed line in panels (a,b) indicates the ammonium nitrogen safety threshold (0.69 mg·L−1) for aquatic organisms according to the Chinese Fishery Water Quality Standard GB 11607-1989. Different lowercase letters within a column indicate significant differences among treatments based on Tukey’s HSD test (p < 0.05); within same period each treatment had a sample size of n = 3. “ns” = not significant (p ≥ 0.05).
Agriengineering 08 00034 g005
Figure 6. Dynamic changes in pH levels of field water across different fertilization periods. BFP: base fertilizer period; TFP: tillering fertilizer period; NFP: no-fertilizer period, BF, base fertilizer; TF, tillering fertilizer. Each treatment had a sample size of n = 3. The dashed line indicates the maximum pH value(pH = 8.5) for aquaculture water in the standard NY/T 3822-2020 [17].
Agriengineering 08 00034 g006
Figure 7. Temporal variations in dissolved oxygen (DO) concentrations in field water across different fertilization periods. BFP: base fertilizer period; TFP: tillering fertilizer period; NFP: no-fertilizer period, BF, base fertilizer; TF, tillering fertilizer. Each treatment had a sample size of n = 3.
Agriengineering 08 00034 g007
Figure 8. Soil NH4+-N (ac) and NO3-N (df) concentrations at different depths under rice monoculture (RM) and rice–crab co-culture (RC) systems with varying nitrogen application rates. Soil depths include soil 0–2 cm (a,d), 2–10 cm (b,e), and 10–20 cm (c,f). Each treatment had a sample size of n = 3. Error bars represent standard deviations. Different letters above bars indicate significant differences among treatments at p < 0.05 (Tukey’s HSD test). ANOVA F-values are presented for main effects and interactions. “ns” = not significant (p ≥ 0.05). Asterisks in the ANOVA rows denote factor significance (* p < 0.05). Inter-system comparison among different nitrogen fertilizer treatments. See Supplementary Table S5 for complete statistical outputs.
Agriengineering 08 00034 g008
Figure 9. Pearson correlation matrix interactions between fertilizer rate, rice and crab yields, nitrogen dynamics (TN, NO3-N, NH4+-N), physicochemical factors (pH, DO), and stratified soil nitrogen concentration (0–2 cm, 2–10 cm, 10–20 cm) in RC (a) and RM (b). n = 12 per system, comprising 4 nitrogen treatments × 3 replicates. Positive correlations (red circles) and negative correlations (blue circles) are displayed, with circle size and color intensity scaled to correlation strength. *: p < 0.05. The color gradient (right scale) indicates coefficient values ranging from −1 (strong inverse) to +1 (strong direct). See Supplementary Tables S7 and S8 for complete statistical outputs.
Agriengineering 08 00034 g009aAgriengineering 08 00034 g009b
Table 1. Experiment treatments and fertilizer application.
Cultivation SystemTreatmentNitrogen Application Rate
(kg N·hm−2)
Compound Fertilizer
(kg·hm−2)
Diammonium Phosphate
(kg·hm−2)
Urea
(kg·hm−2)
Superphosphate
(kg·hm−2)
Potassium Sulfate
(kg·hm−2)
RMRM00000192.8154.20
RM150150300137.8389.55070.20
RM210210300137.83219.98070.20
RM270270300137.83350.42070.20
RCRC00000192.80154.20
RC150150300137.8389.55070.20
RC210210300137.83219.98070.20
RC270270300137.83350.42070.20
RC, rice–crab co-culture system; RM, rice monoculture system. Fertilizer nutrient concentration: compound fertilizer (N 28%, P2O5 11%, K2O 14%), urea (N 46%), diammonium phosphate (N 18%, P2O5 46%), superphosphate (P2O5 16%), and potassium sulfate (K2O 50%).
Table 2. NH4+-N, NO3N, and TN concentrations (mg·L−1) in field water during different fertilization periods under RC and RM.
TreatmentNH4+-NNO3-NTN
BFPTFPNFPBFPTFPNFPBFPTFPNFP
RM01.21 ± 0.46 b0.02 ± 0.01 a0.07 ± 0.02 a0.31 ± 0.19 a1.04 ± 0.14 b0.3 ± 0.06 b4.93 ± 0.92 c3.82 ± 0.31 b2.6 ± 0.09 a
RM1502.36 ± 0.66 b0.19 ± 0.12 a0.06 ± 0.01 a0.67 ± 0.24 a5.76 ± 1.47 a0.28 ± 0.06 ab7.67 ± 1.09 bc10.03 ± 1.77 a2.52 ± 0.13 a
RM2106.17 ± 1.43 a0.08 ± 0.05 a0.05 ± 0.01 a0.49 ± 0.24 a5.02 ± 1.35 a0.31 ± 0.08 ab11.47 ± 2.06 ab9.00 ± 1.64 a2.62 ± 0.13 a
RM2707.12 ± 1.58 a0.80 ± 0.43 a0.05 ± 0.01 a0.60 ± 0.25 a4.9 ± 1.15 a0.37 ± 0.11 a14.64 ± 2.88 a8.80 ± 1.36 a2.58 ± 0.15 a
RC00.68 ± 0.19 b0.06 ± 0.04 a0.05 ± 0.01 a0.13 ± 0.05 a1.04 ± 0.14 b0.18 ± 0.04 ab4.52 ± 0.40 c3.96 ± 0.17 b2.47 ± 0.106 a
RC1503.70 ± 1.07 ab0.29 ± 0.18 a0.07 ± 0.02 a0.65 ± 0.25 a5.35 ± 1.18 a0.27 ± 0.05 ab9.86 ± 1.85 abc9.23 ± 1.41 a2.58 ± 0.07 a
RC2106.44 ± 1.50 a0.51 ± 0.33 a0.04 ± 0.01 a0.88 ± 0.28 a6.21 ± 1.49 a0.41 ± 0.07 ab13.28 ± 2.48 ab10.36 ± 1.62 a2.84 ± 0.07 a
RC2706.89 ± 1.62 a0.39 ± 0.22 a0.05 ± 0.01 a0.880 ± 0.29 a5.93 ± 1.32 a0.57 ± 0.11 ab14.30 ± 2.82 a10.04 ± 1.40 a2.91 ± 0.16 a
Linear mixed-effects model
Cultivation system (S)0.17 ns0.03 ns0.34 ns0.87 ns0.89 ns0.59 ns0.90 ns0.76 ns2.11 ns
Fertilizer rate (N)29.79 **0.91 ns1.18 ns3.52 *21.87 **3.69 *25.09 **25.99 **1.93 ns
S × N0.62 ns0.51 ns1.18 ns1.06 ns0.66 ns1.60 ns0.65 ns0.83 ns1.58 ns
BFP: base fertilizer period; TFP: tillering fertilizer period; NFP: no-fertilizer period; NH4+-N: ammonium nitrogen; NO3-N: nitrate nitrogen; TN: total nitrogen. Values are presented as least squares means ± standard error (SE) from linear mixed-effects model (LMM). Different lowercase letters (a, b, ab, etc.) within a column indicate significant differences among treatments based on Tukey’s HSD test (p < 0.05). F-values represent Type III tests of fixed effects. Detailed ANOVA results, including numerator and denominator degrees of freedom, mean squares, and residuals diagnostics, are provided in Supplementary Tables S2–S4. “ns” indicates not significant (p ≥ 0.05); asterisks denote statistical significance (* p < 0.05; ** p < 0.01).
Table 3. Mean values of pH in field water during different fertilization periods under RM and RC.
TreatmentBFPTFPNFP
RM08.44 ± 0.24 a8.58 ± 0.09 a7.86 ± 0.09 a
RM1508.63 ± 0.16 a8.59 ± 0.09 a7.85 ± 0.08 a
RM2108.60 ± 0.42 a8.75 ± 0.11 a7.72 ± 0.06 a
RM2708.63 ± 0.32 a8.62 ± 0.12 a7.74 ± 0.07 a
RC08.54 ± 0.42 a8.65 ± 0.13 a7.73 ± 0.07 a
RC1508.73 ± 0.36 a9.05 ± 0.32 a7.75 ± 0.07 a
RC2108.66 ± 0.39 a9.02 ± 0.45 a7.74 ± 0.07 a
RC2708.77 ± 0.35 a8.97 ± 0.29 a7.74 ± 0.07 a
Linear mixed-effects model
Cultivation system (S)0.48 ns2.37 ns0.97 *
Fertilizer rate (N)0.40 ns0.28 ns0.45 ns
S × N0.02 ns0.57 ns0.51 ns
BFP: base fertilizer period; TFP: tillering fertilizer period; NFP: no-fertilizer period. Values are presented as least squares means ± standard error (SE) from linear mixed-effects model (LMM). Different lowercase letters within a column indicate significant differences among treatments based on Tukey’s HSD test (p < 0.05). F-values represent Type III tests of fixed effects. Detailed ANOVA results, including numerator and denominator degrees of freedom, mean squares, and residuals diagnostics, are provided in Supplementary Tables S2–S4. “ns” indicates not significant (p ≥ 0.05); asterisks denote statistical significance (* p < 0.05).
Table 4. Dissolved oxygen (DO) (mg·L−1) in field water during different fertilization periods under RM and RC systems.
TreatmentBFPTFPNFP
RM07.51 ± 0.43 a8.87 ± 0.38 c8.06 ± 0.63 a
RM1508.54 ± 0.75 a10.68 ± 0.49 ab5.58 ± 0.60 ab
RM2108.28 ± 0.57 a10.29 ± 0.44 abc5.88 ± 0.58 ab
RM2707.67 ± 1.12 a10.85 ± 0.54 ab5.90 ± 0.55 ab
RC06.56 ± 0.40 a9.44 ± 0.49 bc5.18 ± 0.44 ab
RC1508.06 ± 0.52 a11.45 ± 0.51 a4.57 ± 0.50 b
RC2107.77 ± 1.14 a10.79 ± 0.64 ab3.63 ± 0.44 b
RC2707.66 ± 1.31 a10.85 ± 0.51 ab3.36 ± 0.39 b
Linear mixed-effects model
Cultivation system (S)0.90 ns3.26 ns18.57 **
Fertilizer rate (N)1.12 ns10.87 **3.34 *
S × N0.14 ns0.47 ns0.66 ns
BFP: base fertilizer period; TFP: tillering fertilizer period; NFP: no-fertilizer period; Values are presented as least squares means ± standard error (SE) from linear mixed-effects model (LMM). Different lowercase letters within a column indicate significant differences among treatments based on Tukey’s HSD test (p < 0.05). F-values represent Type III tests of fixed effects. Detailed ANOVA results, including numerator and denominator degrees of freedom, mean squares, and residuals diagnostics, are provided in Supplementary Tables S2–S4. “ns” indicates not significant (p ≥ 0.05); asterisks denote statistical significance (* p < 0.05; ** p < 0.01).
Table 5. Rice and crab yields and crab growth parameters under different nitrogen application rates.
TreatmentYield of Rice
(t·hm−2)
Yield of Crab
(kg·hm−2)
Average Individual Weight
(g)
Length
(cm)
Width
(cm)
Survival Rate
(%)
RM05.68 ± 0.37 a
RM1507.12 ± 0.40 b
RM2106.91 ± 0.18 ab
RM2707.77 ± 0.37 b
RC05.87 ± 0.39 a195.8 ± 81.40 a72.18 ± 2.86 a5.13 ± 0.09 a4.82 ± 0.09 a17.28 ± 16.90 a
RC1507.14 ± 0.40 b193.3 ± 39.00 a71.82 ± 7.53 a5.20 ± 0.10 a4.83 ± 0.07 a23.95 ± 4.08 a
RC2107.74 ±0.51 b378.7 ± 49.00 b80.64 ± 9.26 a5.26 ± 0.23 a4.92 ± 0.21 a42.0 ± 5.60 a
RC2707.72 ± 0.70 b360.0 ± 77.20 ab80.43 ± 2.68 a5.29 ± 0.11 a5.00 ± 0.08 a40.0 ± 9.70 a
Two-way ANOVA
Cultivation system (S)1.96 ns
Fertilizer rate (N)22.68 **7.45 *1.85 ns0.70 ns1.34 ns4.11 *
S × N1.27 ns
Values are presented as mean ± standard deviation (SD). Within each column, the means followed by different lowercase letters differ significantly at p < 0.05 according to Tukey’s HSD test performed across all eight treatments. F-values represent Type III tests of fixed effects. “ns” = not significant (p ≥ 0.05). *: p < 0.05; **: p < 0.01.
Disclaimer/Publisher’s Note: The statements, opinions and data contained in all publications are solely those of the individual author(s) and contributor(s) and not of MDPI and/or the editor(s). MDPI and/or the editor(s) disclaim responsibility for any injury to people or property resulting from any ideas, methods, instructions or products referred to in the content.