Abstract
Armillaria root rot (ARR) is a fungal disease caused by Desarmillaria caespitosa and the leading cause of peach tree decline in the Southeastern U.S. It affects the roots and lower stems of trees, leading to the decay of the tree’s root system. Planting peach trees shallow on berms and excavating soil around the root collar after two years can extend the economic life of infected trees. However, berms pose operational challenges, including elevation changes, soil erosion from water flow, and herbicide and fertilizer runoff, thereby reducing orchard management efficiency. This study aimed to develop a tractor-mounted rotary tillage method to flatten the area between peach trees planted on berms, improving safety and reducing runoff. A custom paddle wheel attachment (20.3 cm height, 30.5 cm length) was retrofitted to an existing mechanical orchard weed management implement equipped with a hydraulic rotary head. A hydraulic flow meter, two pressure transducers, and an RTK-GPS receiver were integrated with a wireless data acquisition system to monitor the paddle wheel rotational speed and tractor ground speed during field trials. The effects of three paddle wheel speeds (132, 177, and 204 RPM) and three tractor ground speeds (1.65, 2.255, and 3.08 km/h) were evaluated in two orchards with Cecil sandy loam soil (bulk density: 1.93 g/cm3; slope: 2–6%). The paddle wheel speed had a greater influence on the torque and power requirements than the tractor ground speed. The combination of a 177 RPM paddle speed and 3 km/h tractor speed resulted in the smoothest soil surface with minimum torque demand, indicating this setting as optimal for flattening berms in similar soil conditions. Future research will include optimizing the paddle wheel structure and equipping the berm leveling machine with tree detection sensors to control the rotary head position.
1. Introduction
Armillaria root rot (ARR) or oak root rot is a lethal disease to Prunus species and is primarily caused by the soil-borne fungus Desarmillaria caespitosa (syn. D. tabescens and Armillaria tabescens) in peach (Prunus persica) orchards in the Southeastern United States [1,2]. ARR is responsible for premature tree decline in orchards in South Carolina, Georgia, and in other Southeastern states [2,3]. The fungus resides in root fragments remaining in the soil from previous peach crops or other trees such as oaks. Underground, it infects the roots of peach trees and moves to the root collar, where it girdles the lower trunk of the trees, causing death under standard management practices. D. caespitosa can persist in buried, detached roots for years, making the management of the disease even more difficult. Armillaria and Desarmillaria spp. have a large host range, including a variety of fruit and nut crops, ornamentals, and native oaks [4]. There are no known sufficiently effective biological or chemical control options for ARR, although many fungicides have been tested [3,5,6,7,8,9]. With a wide host range and a multitude of lands that have been planted with peach trees for generations, planting on unaffected land with little to no disease pressure has become more and more difficult.
A common cultural practice to reduce inoculums in the soil is to remove the roots after tree removal through deep plowing and raking. Still, small root pieces remain, and with repeated orchard removal, the fungal presence steadily accumulates, especially in peach monocultures. Another cultural practice to extend the productive life of trees planted in sites known to host the fungal pathogen was developed by Schnabel et al. [10]. In a proof-of-concept study, Schnabel et al. [10] conducted experiments on peach trees planted in Smart Pots (High Caliper Growing, Oklahoma City, OK, USA.), which kept the peach tree roots above ground. The study found that exposing the root collar through root collar excavation (RCE) reduced tree decline due to ARR. These findings were later confirmed in larger-scale field studies where trees were planted shallow on berms and later excavated [3]. “Shallow” planting is characterized by the first roots initiating no more than 5 cm below the berm top and the graft union typically being above ground. A similar study was performed on grapevines; exposed root collars led to less infection by A. mellea, perhaps due to higher temperatures and a drier local environment generated around the root collar [11].
Currently, many peach producers in South Carolina plant trees shallow on raised berms. Some leave the trees on berms, but many remove the soil around the root collar two years after establishment. Berms are created in various ways by growers, but the most efficient way is with a berm plow used to make levees in rice production. A modified AMCO Manufacturing LF6 (Yazoo City, MS, USA) levee plow together with a roller/packer wheel to compact the top of the berm can produce berms of ideal height and width in two passes. The ideal height and width of berms, according to Miller et al. [3], is 45 cm and 90 cm, respectively. Other options used to prepare berms include rear-mounted “scrape blades” at an angle pulling soil up into a row or pushing soil with a front-mounted “scrape blade” using the same methodology.
Planting trees on berms facilitates the process of RCE after tree establishment and reduces the likelihood of filling in the excavated root collar, as Baumgartner experienced in grapevines [3,11]. Leaving the trees on the berms for two years before RCE allows the roots to establish and mature, making trees less susceptible to dislodging (leaning due to wind or other natural events) or damage from herbicide application [3]. Planting on berms also eliminates “deep planting”, a common problem for growers that can lead to tree stress. Shallow planting of trees on berms can lead to more vigorous tree growth and faster orchard establishment, likely due to an increase in oxygen availability to the roots and higher soil temperatures.
While berms can provide many benefits, the slope of the berms has a negative impact on several orchard operations, including fertilizer and herbicide applications, worker comfort and safety during pruning, thinning, and picking operations, as well as faster soil erosion along the furrows on both sides of the berm. Some studies evaluated the effects of hill shape on water infiltration and runoff [12,13,14,15]. Donohue [14] measured furrow water infiltration to be three to four times greater than hill infiltration, and Chow and Rees [13] measured runoff to double in hilled plots compared to unhilled plots [12,13,14]. Robinson [16] and Cooley et al. [17] found that less infiltration in hilled plantings of potatoes can bring about dry conditions in the hills, which could lead to water stress, but Saffigna et al. [15] noted that this would lead to a reduction in the loss of soluble nutrients within the hill [12,15,16,17].
Although peach tree roots have been detected as deep as 114 cm, most roots are found in the top 50 cm of the soil, with a few roots found below 60 cm [18,19,20]. Although there is no published research on the distribution of peach tree roots when planted in berms, roots tend to follow the berms up and down the row but remain below the bottom of the berm (Scroggs, Schnabel, and Koc; personal observation).
There is no published work on the decline in worker comfort and safety in orchards with berms, but personal observations and testimonials from field workers have confirmed that orchard operations are more strenuous and less safe. Repeated ascending and descending of the berms cause fatigue in workers more quickly and raise the risk of worker injury.
An efficient method for berm removal between trees within rows to facilitate the RCE process and to eliminate the above-mentioned drawbacks of leaving the berms in place is needed. In this study, a “Debermer” similar in design to a rotary tiller was developed. However, in contrast to a rotary tiller, which tills vertically, the modified machine tilled the soil horizontally. In rotary tiller design, some experiments have been conducted in the field, while some have been conducted in specialized testing facilities [21,22,23,24,25]. The design of rotary tillers differs slightly from the design of a Debermer in that rotary tillers are pulled behind a tractor, dig into the soil vertically, and have the goal of pulverizing the soil to a fine tilth ideal for seed planting. However, with the Debermer design, the goal is to move soil horizontally away from the berms between peach trees into the row middle. Although there are differences, there are similarities as well, including a rotational force acting on resistance in the soil and the forward speed of the tractor playing a role in the torque and power requirements.
Objectives
The goal of this research was to develop a tool that would flatten the area between peach trees planted on berms in rows to provide a safer working environment and reduce the likelihood of runoff. The specific objectives to accomplish this goal were as follows:
- To design a paddle wheel that could be retrofitted on a commercially available organic weed removal machine;
- To integrate sensors that allow for monitoring the rotational speed of the paddle wheel and tractor ground speed wirelessly through a data acquisition system;
- To test the machine in the field and evaluate the surface evenness after one pass on each side of the row.
2. Materials and Methods
Equipment design: A Weed Badger 2030 (Weed Badger, Marion, ND, USA) was used as the frame for the tool design. A similar design was developed at Michigan State University with a Weed Badger [26]. The Weed Badger 2030 is a three-point hitch-mounted implement originally designed for organic weed removal. The machine is powered by a hydraulic pump mounted and driven by the tractor’s power take-off (PTO) shaft. The original hydraulic pump was replaced with an identical Prince Manufacturing Corporation (North Sioux City, SD, USA) HC-PTO-1AC gear pump capable of providing a 79.49 L/min flow rate on a standard 6-spline 540 RPM PTO shaft. The hydraulic pump provides hydraulic power to a Torqmotor ME (Model # ME180208AAAA, TRW Ross—Parker Hannifin Co., Cleveland, OH, USA) hydraulic motor attached at the end of an arm to the right side of the tractor. The Torqmotor ME used on the Weed Badger is no longer a product available through Parker Hannifin, but a suitable replacement from Parker Hannifin would be model #TG0280US080AAAA. Both hydraulic motors have a displacement of 280 cm³ per revolution and can have 334 RPM. They provide 76 L/min constant and 95 L/min intermittent flows, with a constant pressure of 207 bar and intermittent pressure of 276 bar. The motors have a maximum supply pressure of 300 bar, a maximum torque of 796 Nm constant and 1073 Nm intermittent, a maximum power of 31 kW, and a minimum starting torque of 675 Nm constant and 870 Nm intermittent. The Weed Badger came with an analog flow control valve (Model # RD-175-30, Prince Manufacturing Co., North Sioux City, SD, USA) and a mechanical pressure control valve (Model #RV-2H, Prince Manufacturing Co., North Sioux City, SD, USA). The analog flow control/relief valve can adjust the flow rate from 0.00 to 113.56 L/min at a maximum pressure of 206.84 bar. The mechanical pressure control/relief valve can be adjusted to allow 103.42 bar to 206.84 bar, with a standard relief valve setting of 137.89 bar at 37.85 L/min. The hydraulic motor, flow control valve, and pressure control/relief valve were left in place and used with the final design.
Modifications on the Weed Badger 2030: The Weed Badger initially had a hydraulic directional control valve that ran in conjunction with the machine hydraulics to control the movement in and out of the implement head, but the controls were cumbersome and weakened the hydraulic power capabilities, so changes were made [26]. The original design involved four hydraulic lines on a mechanical directional control valve. Conversions were made so that the hydraulic cylinder could utilize the tractor’s hydraulic system. This conversion cut down on the bulk of the four-line actuator that went into the back of the tractor’s cab and hydraulic power consumption. This also allowed for a controlled retraction and extension rate of the hydraulic cylinder, which was determined to be a crucial component of operating this machine. Another important outcome of utilizing the tractor’s hydraulic system was that the Weed Badger’s hydraulic system would only have to use power to operate the hydraulic motor running the paddle wheel, leading to less stress and power consumption. Figure 1 shows the hydraulic diagram for the Weed Badger. The tractor used with the Weed Badger was a John Deere 5101EN with 61.1 kW at the PTO [27].
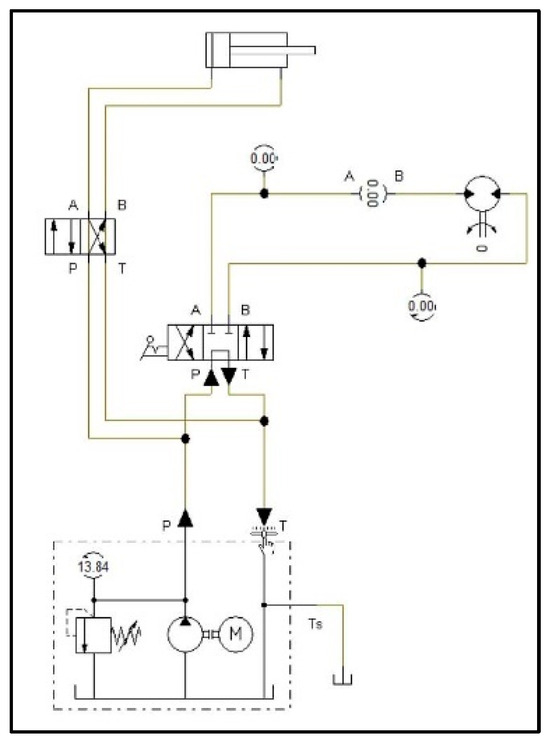
Figure 1.
Hydraulic circuit diagram for Weed Badger 3020.
Upon purchase, the Weed Badger 3020 was equipped with a tillage implement that was designed to remove weeds through cultivation with a weeding head attached to the Torqmotor ME hydraulic motor. The head was swapped for a paddle wheel (Figure 2). The initial structural parameters of the paddle wheel design were replicated from a previously published study on removing soil from hilled-up grapevines [26]. This paddle wheel had a 49.5 cm overall diameter, 10.2 cm of paddle height, 20.3 cm of paddle length, and 8 paddles with a thickness of 9.5 mm.
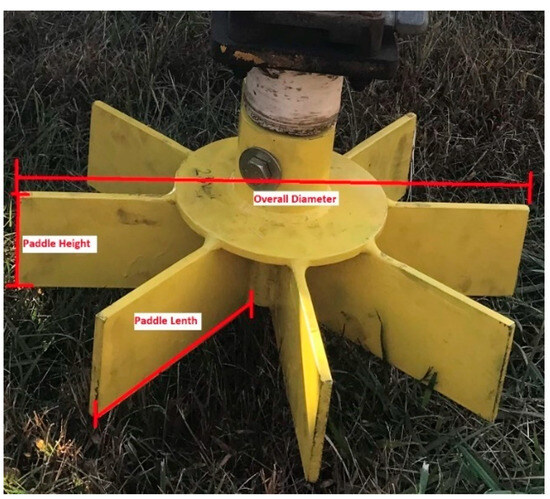
Figure 2.
Original paddle wheel design.
The material used in production of the paddle wheels was ASTM A36 steel, which has a Poisson’s Ratio of 0.29 and tensile strength of 374–590 MPa [28]. This material is used in a plethora of steel designs, as it has good machinability and workability. The fabricated paddle wheel was mounted on the Weed Badger 2030 as described by Zabadal et al. (2004) [26] and tested for berm removal between peach trees. Early testing under field conditions indicated that the above dimensions of the paddle wheel were not sufficient to level the raised berms between peach trees in two passes. Therefore, the paddle wheel was incrementally scaled up by developing two subsequent designs. The major reasons for the requirement for a larger paddle wheel was because of the inconsistencies in the sizes of the berms with larger widths and heights created for peach orchards.
The two subsequent designs involved an increase in the paddle height and paddle length by 5 cm each, each time. Design number 2 in Figure 3 had a paddle height of 15.2 cm and paddle width of 25.3 cm. This design was used in field trials at Clemson University’s Musser Fruit Research Center and at field trials at a peach producer’s farm in South Carolina. The berms at the producer’s orchard were not made with the same berm plow, and the berms were slightly wider and taller. Therefore, a third design was made by increasing the size of the paddles by an additional 5 cm in both height and length. Therefore, design 3 had a paddle height of 20.2 cm and paddle length of 30.3 cm. The third design was supported with an extra 9.5 mm of steel. The three fabricated paddle wheels are shown in Figure 3.
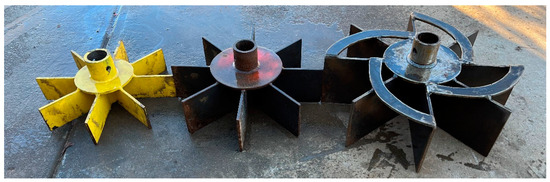
Figure 3.
Paddle wheel designs 1, 2, and 3, from left to right.
Experimental design: Initial testing was completed at Clemson’s Musser Fruit Research Center in Seneca, SC, USA. The first orchard tested was PF23 peaches planted 6.7 m apart in rows with 7.3 m row spacing. The second orchard tested was Guardian seed peaches planted 4.57 m apart in rows with 6.7 m row spacing. The PF23 trees were planted in Pacolet sandy loam on a 15–25% slope, and the Guardians were planted on Cecil sandy loam soil with a 2–6% slope. The first two trials were part of proof-of-concept testing. After installation, the technology was tested on berms specifically made for testing to ensure it worked as intended. Both field trials with data collection were performed at Hyder’s Farm in Campobello, SC, on fields that had a 2–6% slope with Cecil sandy loam soil according to the NRCS Web Soil Survey. The orchards had an average soil bulk density of 1.93 g/cm3. Trees were planted 6.1 m apart in rows with 6.1 m row spacing in both orchards.
Sensor integration: Sensors were mounted on the machine, and data were collected during the field trials at Hyder Farms (Campobello, SC, USA). The sensors included an Emlid Reach M2 RTK-GPS receiver and RS2 base station, 2 KAR-TECH 225-200-3007 pressure transducers, a Macnaught MX19F-2SE 3/4″ flowmeter, an Arduino Uno REV3 data acquisition system, 2 Xbee 2 mW series 2C antennas, Gikfun Bluetooth Xbee shield V03 wireless control attached to the data acquisition system on the machine, and a Waveshare Xbee USB Adapter USB Communication Board attached to a laptop computer to wirelessly retrieve data from the Arduino Mega microcontroller. Figure 4 shows the locations of sensors on the machine. The RTK-GPS receiver allowed for accurate tracking of the tractor ground speed and the known location of each data line acquired for later evaluation. The pressure transducers allowed for the calculation of hydraulic power requirements at the paddle wheel when combined with the in-line flow meter. The flow meter, along with pressure helping to calculate the hydraulic power requirement, allowed for controlling the paddle wheel rotational speed (RPM) in conjunction with a flow control unit that came with the original Weed Badger. The real-time data acquisition system allowed for the collection of data with the Xbee radios.
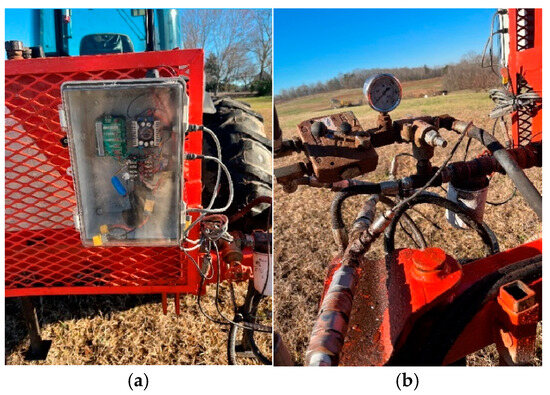
Figure 4.
Locations of sensors (a) and pressure transducers (b) on the machine.
Preliminary testing: Initial testing of the machine, referred to as a “Debermer,” was performed at Clemson University’s Musser Fruit Research Center (Seneca, SC, USA). The initial design was used to remove the soil between trees planted on berms in two different orchards to determine whether planting trees on berms alone or the subsequent RCE protected the trees from ARR. The trees were Guardians being grown for seed and a pathology trial orchard of PF23 peaches. Both orchards were planted in 2017, and the berm removal and RCE were performed in 2019. Berms were created in the PF23 peaches with a motor grader that pushed the soil into berms, and in the Guardian peaches, they were created with the LF6 levee plow before modifications to add a roller/packer wheel. Two passes on each side of the row completely flattened the area between the trees, and RCE was performed immediately after with an AirSpade 2000.
A second design was developed, having a paddle wheel that was 5 cm taller in depth and 5 cm longer in “paddle” length. Another experiment was carried out to assess the second paddle wheel. There were no orchards at the Musser Fruit Research Center available for field trials, so berms were made strictly for testing the Debermer.
2.1. Experimental Design for the First Field Trial
The experimental design for the first field trial (35.116011 N, −82.196841 W) at Hyder Farms in Campobello, SC, was a full factorial design with two variables being tested: the tractor ground speed and the rotational speed of the paddle wheel. The response variables evaluated were the torque requirement of the paddle wheel and smoothness of the field after treatment (soil finish rating). Each control variable had three different settings and three replications of each of the nine combinations of the two variables. Therefore, there were 27 “zones” of testing throughout the field, where each “zone” contained 4 trees or 3 tree middles (Figure 5). A zone begins at the base of the first tree where the next tree middle was the first “area of operation” followed by two more “areas of operation” ending at the base of the final tree in the zone. Initially, zones 1 and 2 were on the first row, but due to technical difficulties, they were moved to the row following the last zone. Each dot within the zones represents the location of a data line recorded with the data acquisition system. As shown in Figure 5, there were gaps in data recording where the satellite signal was lost momentarily.
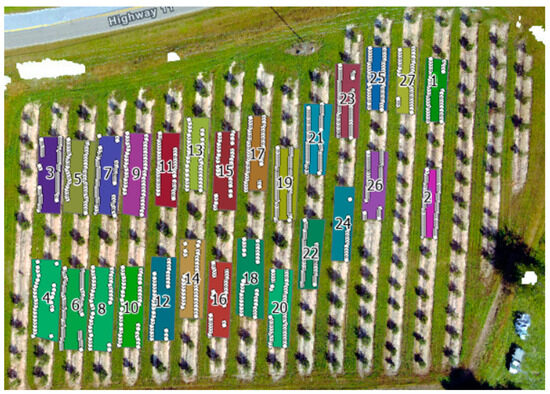
Figure 5.
Layout of the first field trial orchard with each zone labeled 1–27.
Each zone was randomly assigned one of nine combinations of ground speed and rotational speed of the paddle wheel using Excel and random number generation. The nine possible combinations were listed and replicated three times, with an adjacent column in Excel assigned a random number using “=RAND()”. Then, the random number column was sorted from the smallest to largest value to randomize the location of each replication, and then the random number column was replaced with the zone labels 1–27. The settings and average calculated ground speed, rotational speed, torque, and soil finish rating (measured with a visual scale from 1 to 3) for each zone can be seen in Table 1.

Table 1.
Average tractor speed, paddle wheel rotational speed, torque, and soil finish rating for each zone during first field trial.
2.2. Field Testing to Determine Ideal Operating Conditions and Horsepower Requirements
The three ground speeds were set by changing gears in the tractor to maintain a constant speed of the tractor’s PTO of 540 RPM. The tractor speed data collected with RTK-GPS receivers during the two field trials had different values, although the actual speeds were the same. To correct this issue and ensure the data were consistent, correction factors were developed for each ground speed on each field trial day using the estimated tractor speeds in each gear provided in the tractor owner’s manual. The original measured speed averages estimated the tractor speed from the manual, correction factors were used, and new speed averages are shown in Table 2. With the correction factor applied, average operating ground speeds of approximately 1.66 km/h, 2.24 km/h, and 3.07 km/h for gears A1, A2, and A3, respectively, were obtained.
Table 2.
Ground speed using a correction factor based on the owner’s manual’s estimated speed.
The rotational speed of the paddle wheel (RPM) was changed with an analog flow control valve that came installed on the original Weed Badger. The three flow rate settings (low, medium, and high) read by the installed electronic flowmeter provided average flow rates of 37.1, 49.6, and 57.2 L/min, respectively. The paddle wheel speed was adjusted by the flow rate. Calculations were made to determine the rotational speed of the paddle wheel with the known hydraulic motor (Torqmotor ME) displacement of 280 cm3/rev and the measured hydraulic flow rate in L/min. So, with 37.1, 49.6, and 57.2 L/min flow rates, the three rotational speed settings were approximately 132.35 RPM, 177.46 RPM, and 205.13 RPM, respectively.
2.3. Experimental Design for the Second Field Trial
The orchard used in the second trial (35.114875 N, −82.200665 W) was nearly identical to the first trial, with the same Cecil sandy loam soil with a 2–6% slope and trees planted 6.1 m apart in rows with 6.1 m row spacing. The second field trial with data collection performed at Hyder Farms in Campobello, SC, involved operating the machine in one setting for most of the data collection, with each of the other combinations of settings tested to evaluate the difference between the second paddle wheel design and the third design that was used in this field trial. The ideal operation settings from the initial field trial at Hyder’s Farm were determined to be ground speed setting 3, or an average speed of 3.07 km/h, and rotational speed setting 2, or approximately 177.46 RPM. The settings mentioned above were used for 6 of the 11 rows, with the other 8 combinations divided between the remaining 5 rows, as seen in Table 3. Figure 6 shows the layout for the second field trial. Although the analog setting of the hydraulic flow meter was set to what was determined to be 177.46 RPM in the first field trial, the average rotational speed in the second field trial at the same setting was approximately 157.45 RPM. This shows that the analog hydraulic flowmeter may not be as precise as desired, or the draft of the larger paddle wheel slows the rotational speed.
Table 3.
Average tractor speed (km/h), paddle wheel rotational speed (RPM), torque (Nm), and soil finish rating for each zone during second field trial.
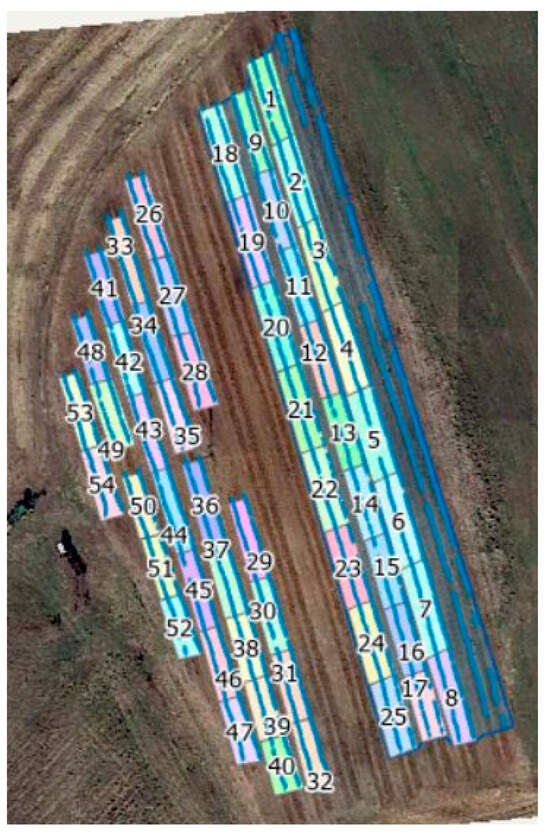
Figure 6.
Layout of the second field trial; zones 1–25 were the predetermined best settings of ground speed 3 and rotational speed 2.
There were some challenges during this field trial that hindered the performance of the machine to an extent. There were numerous weeds on the berms (Figure 7), which made the machine stall at times. Also, the moisture content of the soil was slightly higher than in the initial field trial, which, in turn, increased the weight of the soil the paddle wheel was pushing against. The increased weight of the soil increased the force needed to overcome the soil resistance by the paddle wheel. However, the larger (third design) paddle wheel performed better than the previous designs.
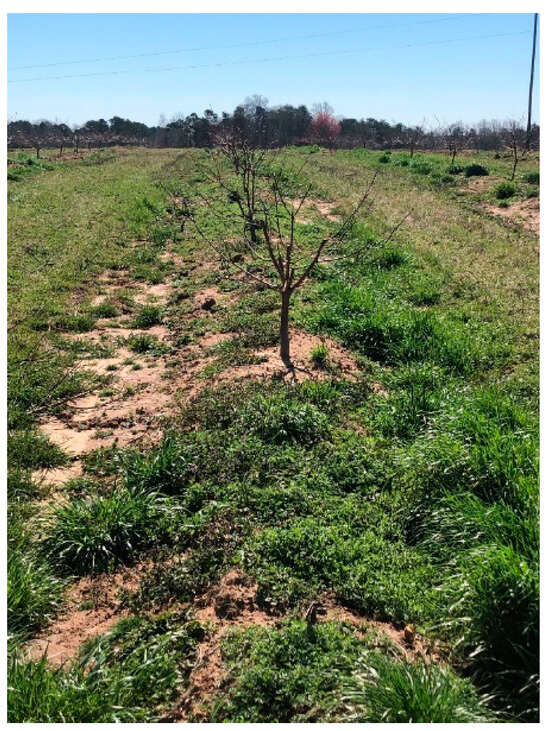
Figure 7.
Weeds covering the berms in the second field trial.
Data analysis: The data collected via the data acquisition system had outputs for the ground speed, rotational speed of the paddle wheel, longitude and latitude, tractor speed in kilometers per hour, pressure transducer signals from the pressure line and return line of the hydraulic motor, measured flow rate, and calculated hydraulic power. In addition, the soil bulk density, which had an average of 1930 kg/m3 from ten soil samples, was added to the data. The soil bulk density was measured at Clemson University’s Agricultural Service Lab. Further calculations were made, with the end goal of determining the torque and power requirements for the paddle wheel during operation.
Next, real-time rotational speeds of the paddle wheel were calculated with the known flow rate in liters per minute and known displacement of the Torqmotor ME hydraulic motor using Equation (1). Next, revolutions per minute were converted to revolutions per second by dividing the rotational speed by 60 for further calculations:
where the following hold true:
Nmin = rotational speed of the paddle wheel (RPM);
Q = flow rate (L/min);
D = displacement of the hydraulic motor (cm3/rev).
The soil removal rate was calculated by multiplying the tractor speed in meters per second by the area of each paddle of the paddle wheel, which, for design 2, was 0.03871 m2, and for design 3, the area was 0.06194 m2 using Equation (2). The soil removal rate equations assume that the paddle surface is 100% full for calculation purposes. However, this is not always the case, as most tillage operations have variability.
here, we define the following:
Qs = soil removal rate (m3/s);
v = tractor ground speed (m/s);
A = area of the paddle (m2).
Next, the soil removal rate in terms of kilograms per second was calculated by multiplying the soil removal rate in m3/s by the soil bulk density in kg/m3 using Equation (3):
where the following hold true:
Ms = soil mass removal rate (kg/s);
= soil bulk density (kg/m3).
The soil removal rate in terms of kilograms per revolution was then calculated by dividing the removal rate in kilograms per second by the calculated rotational speed (rev/s) using Equation (4):
where the following hold true:
Mrev = soil mass removal per revolution (kg/rev);
Ns = rotational speed of the paddle wheel (rev/s).
The torque (Nm) was calculated by multiplying the kilograms per revolution by the hydraulic radius (Equations (5) and (6)) of the paddle wheel by 9.81 m/s2 or the acceleration due to gravity to represent the weight of the soil. The hydraulic radius was calculated by dividing the area of each paddle of the paddle wheel by the wetted perimeter (Equation (7)). The wetted perimeter formula was taken from Tevata and Inprasit’s calculations for a water wheel used to generate power and the determined effect of the number of paddles on the power generated [29]. Finally, the power was calculated using Equation (8).
where the terms are as follows:
rh = hydraulic radius (m);
H = height of each paddle (m);
T = torque (Nm), g = acceleration due to gravity, (9.81 m/s2);
Pw = wetted perimeter (m);
L = length of each paddle (m);
n = number of paddles (8);
P = power required (W).
3. Results
The data tables showing the field measurements were analyzed using Response Surface Methodology. Specifically, the measurement data were imported into JMP® Version 16, (SAS Institute Inc., Cary, NC, USA, 1989–2022). Data analysis was conducted to determine the tractor ground speed and paddle wheel speed that reduce the torque requirement while optimizing the soil evenness rating.
Results from the first field trial at Hyder Farms led to the determination that a larger paddle wheel was needed to completely remove the soil between the peach trees in one pass on each side of the row. In some cases, the row would be completely leveled, but oftentimes there would be a small 5–10 cm ridge left behind, as seen in the digital elevation model (DEM) images in Figure 8. The DEMs were developed from the aerial images of the orchards captured before and after removing the berms, and we processed the images using Agisoft Metashape Pro 1.8.3 (Agisoft LLC, St. Petersburg, Russia) photogrammetry.
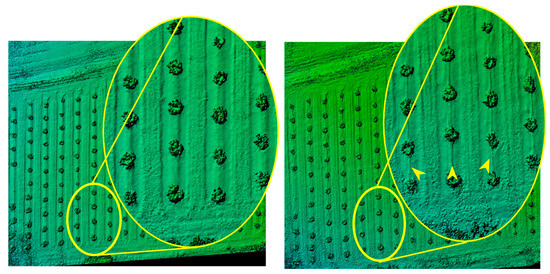
Figure 8.
Digital elevation model (DEM) before (left) and after (right) berm removal.
The image on the right has arrows pointing to the small ridge left behind. Figure 9 shows the flattening of the row after one pass (a) and two passes (b).
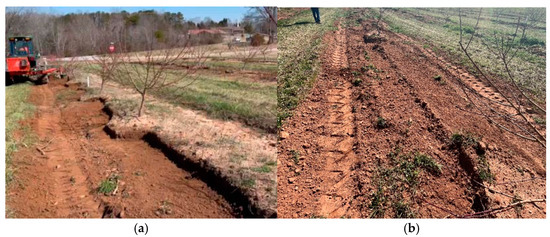
Figure 9.
Soil between trees after one pass (a) and two passes (b).
In collecting data, the determination of the ideal operating ground speed and rotational speeds of the paddle wheel from the settings tested was possible. Contour plots were used to display the results of data analysis, as the contours can be more clearly seen than in a response surface model. The contour plot in Figure 10a shows that an increase in tractor ground speed increased the soil rating with higher rotational speeds, giving even better soil finish ratings. Figure 10b shows that higher revolutions per minute decreased the torque requirement on the paddle wheel. Looking at the two contour plots together, it was determined that minimization of the torque requirement and maximization of the soil rating can be accomplished at a higher ground speed of over 4 km/h and a rotational speed of 175–200 RPM. Figure 10c shows that to decrease the torque while retaining a high soil rating, rotational speed should be increased.
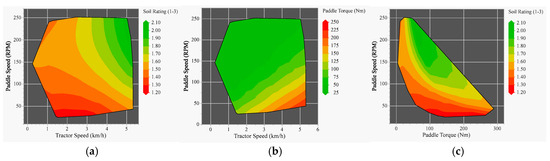
Figure 10.
Tractor ground speed and paddle wheel speed in relation to the soil rating on a scale of 1 to 3 (a) and in relation to the torque requirement (b); the paddle wheel torque requirement and paddle wheel speed show that a higher paddle wheel speed decreased the torque and increased the soil rating (c).
The second field trial at Hyder Farms allowed for testing the predetermined ideal operating tractor speed obtained from the first field trial and rotational speed of the paddle wheel and the third and final paddle wheel design. The final paddle wheel design completely removed the berm in one pass on each side of the row in most cases. In some cases, the berms were much wider than most. Figure 11 shows the ground speed and paddle wheel speed in relation to the soil rating (a), ground speed and rotational speed of the paddle wheel in relation to the torque requirement (b), and required torque and rotational speed in relation to the soil rating (c).
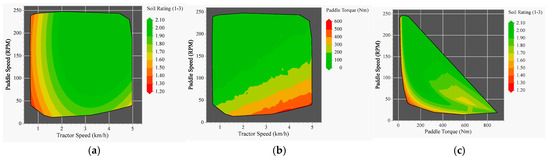
Figure 11.
Ground speed and paddle wheel rotational speed in relation to the soil rating (1–3) (a) and in relation to the torque requirement (b); torque requirement and rotational speed in relation to the soil rating shows that an increase in the rotational speed led to a lower torque requirement and better soil rating (c).
Most of the issues causing the soil not to be smooth were the result of a stall in the machine, where the paddle wheel would not rotate at the speed setting it should be rotating in. Analysis was conducted to determine the number of stalls in data collection. A data line was determined to have a stall if the rotational speed dropped below 50 RPM, a slight stall designation was given if the rotational speed was between 50 and 100 RPM, and a designation of no stall was given if the rotational speed was above 100 RPM. In the first field trial, there were 1254 data points, and 0.8%, 3.19%, and 96.01% were given stall, slight-stall, and no-stall designations, respectively. The mean torque for each designation was 153.28 Nm, 75.26 Nm, and 29.86 Nm, respectively. With 5245 data points for the second field trial, 3.39% received a stall designation, 5.89% received a slight-stall designation, and 90.71% received a no-stall designation. The torque increased drastically when there was an incidence of stalling. Under a stall designation, the average torque was 396.42 Nm. Slight-stall designations had an average torque of 210.83 Nm, and no-stall designations had an average torque of 77.94 Nm. These values are shown in Table 4.
Table 4.
Impact of machine stall on paddle wheel torque.
There was a larger increase in the torque between the first field trial and second field trial due to the increase in the paddle wheel size. Paddle wheel design 3, being larger in length and width than paddle wheel design 2, had higher torque requirements. Table 5 below shows the distribution of the torque requirements for the two different paddle wheel designs. As shown, there was an over 300% increase in the torque requirement throughout the range and an over 380% increase in the standard deviation between the two designs. While the third paddle wheel design worked well, the increase in torque may be a cause of concern for long-term use, as wear on the hydraulic motor and other components will occur more rapidly under higher torque.
Table 5.
Increase in torque (Nm) between paddle wheel designs 2 and 3.
Regardless of the problems with weeds hindering the operation, the paddle wheel design effectively removed the soil between trees planted on berms. The rotational speed of the paddle wheel played a greater role in reducing the torque and power requirement and increasing the soil’s smoothness than the tractor speed. The soil was left more level at higher rotational speeds of the paddle wheel, and the torque and power requirements were reduced. The final paddle wheel design determined that the machine should be operated at rotational speeds from 160 RPM to 200 RPM and at a tractor speed that is comfortable for the operator, depending on the field conditions.
4. Discussion
Several methods can be used to level the berms or ridges in agricultural fields. Conventional methods such as land planes, scrapers, chisel plows, and rotary tillers are commonly used to level berms in open-field agriculture. However, these techniques present significant challenges in orchard systems due to the presence of permanent tree rows and root sensitivity.
Due to the drawbacks of the methods mentioned above in orchard settings, we focused on designing a gentler mechanized approach for removing soil between peach trees planted on berms. The implement design successfully removed the soil, and the ideal tractor speed and paddle wheel rotational speed among the three tested settings were determined. Increasing the paddle wheel’s rotational speed decreased the torque requirement, since the paddle wheel encountered less resistance with each revolution because it moved less soil per revolution. The rotational speed played a more prominent role both in reducing the torque requirement and increasing the soil rating than did the tractor ground speed. This removal method is more effective than all other methods available to growers currently in that the Debermer was optimized so that only one pass on each side of the row is required to flatten the soil. The Debermer only requires one laborer and leaves less damage behind than the other options of berm removal available to growers.
While there were high soil ratings at high tractor speeds, there is a learning curve to operating this machine, as with most agricultural machinery, and a smooth soil surface may not be accomplished at higher speeds in all scenarios. Soil variability may lead to slower tractor speeds being more desirable. Orchards that are free of weeds and sudden dips or inclines would be conducive to higher tractor speeds, while weed-covered berms and rough terrain would be better suited for slower tractor speeds. For instance, if an orchard has several holes and/or rocks that could cause one side of the tractor to lower or raise, it is difficult to retract the hydraulic cylinder away from the trees and adjust the height of the implement while moving at a higher speed. An improvement that could be made on the paddle wheel would be adding a self-leveling or draft control element near the paddle wheel so minor inconsistencies in the soil levelness or obstructions like rocks can be overcome. One of the biggest issues in the field trials was the sudden dip of the right side of the tractor that would lead to the paddle wheel digging into the berm abruptly. This led to brief stalls in the rotation of the paddle wheel that drastically affected the performance of the paddle wheel. A wheel mounted on a spring that could raise the paddle wheel up when a dip occurs but not keep the paddle up too much during uninhibited operation would be beneficial. There were also cases of sudden raising of the paddle wheel, such as a tractor tire going over a rock or a rise in the ground level, that could be addressed. The feature on the other Weed Badger models (i.e., 4000 series) that allows for moving the entire arm up and down would help with this issue, and the installation of a draft feature that could sense the need to raise upon impact of an obstacle would be ideal.
The design of the paddle wheel itself could be improved as well. The three paddle wheel designs in this study were all perpendicular to the ground, and all had eight paddles spaced evenly. Fewer or more paddles could be more efficient. There is also potential that angling the paddles could lead to cleaner throwing of the soil or cleaner entry into the berm upon extension of the hydraulic cylinder.
Cost of Debermer implementation: The Weed Badger 2030 used in this study was purchased and shipped from Colorado to South Carolina. The total cost of the machine was USD 2900. Weed Badger is no longer in business, but used Weed Badgers can be found throughout the United States for purchase. Prices for used Weed Badgers range from USD 900 to 6000. The Weed Badger 4000 series models come with a hydraulic lift and tilt feature that moves the entire arm of the machine, which would work well for removing soil between peach trees planted on berms. If a Weed Badger or other similar machine cannot be found, the construction of a Debermer is possible with the work carried out in this study. A 60 kW tractor is found on most peach farms already and is more than suitable for this operation. Specifications given on torque and rotational speed requirements allow for construction with alternative components. The paddle wheel design can be created at most fabrication businesses. The cost of the final paddle wheel design was USD 736 at a local fabrication shop. Overall, with a working Weed Badger and having a paddle wheel built, a Debermer can be built for around USD 4000. Singerman et al. [30] estimated that the total investment in machinery and irrigation for a newly established 40.7 ha (100 acre) peach operation is USD 15,865 per ha (USD 6457 per acre). Therefore, a USD 4000 investment in equipment that would save labor costs for berm removal, decrease the likelihood of worker injury, and increase the efficiency of fertilizer and herbicide applications is an inconsequential investment.
Although the cost of the Debermer is presented herein, a direct comparison with other methods is challenging due to the lack of specific cost data for these methods. Future studies will focus on gathering and comparing the cost data for the alternative methods for leveling the area between peach trees planted on berms and more detailed cost analysis of the Debermer machine.
5. Conclusions
The theoretical significance of this work lies in its contribution to repurposing an existing tractor-mounted orchard machine and field testing it for flattening raised berms between peach trees. By testing the machine under field conditions on a certain soil type, we identified the optimal tractor ground speed and tillage tool rotational speed for most desirable berm leveling operations in an orchard. We also identified the critical wear points on the machine requiring the need for replaceable components to enhance its durability and reduce maintenance costs. In addition, developing a data acquisition system for monitoring the torque requirements of the machine in varying field conditions lays the groundwork for further research in designing efficient tools for flattening raised berms and root collar excavation.
Despite the promising results, the study’s limitations include the machine’s performance in other soil types and field conditions. Future research will include using finite element analysis to model and optimize the paddle wheel’s design. This will allow us to evaluate the stress distribution, identify critical load areas, and refine the structure for durability and design of replaceable paddles. In the current machine, the tractor operator controls the paddle wheel’s position manually while driving the tractor. Adding an auto-retracting hydraulic cylinder for the paddle wheel using a mechanical feeler or remote sensors for tree detection would reduce fatigue and improve Debermber control. Supplementing the system with an oil cooler to prevent hydraulic fluid overheating and using a digital flow control valve for more precise speed adjustments would further improve the efficiency of the machine.
Author Contributions
Conceptualization, A.B.K. and G.S.; Data curation, C.S.; Formal analysis, C.S.; Funding acquisition, A.B.K., G.S., and M.V.; Methodology, C.S., A.B.K., G.S., and M.V.; Project administration, A.B.K.; Resources, A.B.K.; Software, C.S.; Supervision, A.B.K.; Validation, A.B.K.; Visualization, C.S.; Writing—original draft, C.S.; Writing—review and editing, A.B.K., G.S., and M.V. All authors have read and agreed to the published version of the manuscript.
Funding
This work is funded by the NIFA-USDA Specialty Crop Research Initiative project #2020-51181-32142. The funders had no role in study design; data collection and analysis; decision to publish; or preparation of the manuscript.
Data Availability Statement
The original contributions of this study are included in the article. For further inquiries, please contact the corresponding authors.
Acknowledgments
The authors would like to thank David and Wayne Hyder for allowing us to perform our field trials on their farm in Campobello, SC, and Jeffrey Hopkins, the manager of Musser Fruit Research Center, for providing a location for the preliminary trials. We would like to thank Andy Rollins, an extension agent with Clemson University, for connecting us with growers willing to collaborate. We would also like to thank Brendan Macinnis for his help with data acquisition setup.
Conflicts of Interest
The authors declare no conflicts of interest.
References
- Antonín, V.; Stewart, J.E.; Ortiz, R.M.; Kim, M.-S.; Bonello, P.; Tomšovský, M.; Klopfenstein, N.B. Desarmillaria caespitosa, a North American vicariant of D. tabescens. Mycologia 2021, 113, 776–790. [Google Scholar] [CrossRef] [PubMed]
- Schnabel, G.; Ash, J.S.; Bryson, P.K. Identification and characterization of Armillaria tabescens from the southeastern United States. Mycol. Res. 2005, 109, 1208–1222. [Google Scholar] [CrossRef]
- Miller, S.B.; Gasic, K.; Reighard, G.L.; Henderson, W.G.; Rollins, P.A.; Vassalos, M.; Schnabel, G. Preventative root-collar excavation reduces peach tree mortality caused by Armillaria root rot on replant sites. Plant Dis. 2020, 104, 1274–1279. [Google Scholar] [CrossRef] [PubMed]
- McLaughlin, J.A. Distribution, hosts, and site relationships of Armillaria spp. in central and southern Ontario. Can. J. For. Res. 2001, 31, 1481–1490. [Google Scholar] [CrossRef]
- Devkota, P.; Iezzoni, A.; Gasic, K.; Reighard, G.; Hammerschmidt, R. Evaluation of the susceptibility of Prunus rootstock genotypes to Armillaria and Desarmillaria species. Eur. J. Plant Pathol. 2020, 158, 177–193. [Google Scholar] [CrossRef]
- Kedves, O.; Shahab, D.; Champramary, S.; Chen, L.; Indic, B.; Bóka, B.; Nagy, V.D.; Vágvölgyi, C.; Kredics, L.; Sipos, G. Epidemiology, biotic interactions and biological control of armillarioids in the northern Hemisphere. Pathogens 2021, 10, 26. [Google Scholar] [CrossRef]
- Schnabel, G.; Rollins, A.P.; Henderson, G.W. Field Evaluation of Trichoderma spp. for Control of Armillaria Root Rot of Peach. Plant Health Prog. 2011, 12, 3. [Google Scholar] [CrossRef]
- Amiri, A.; Bussey, K.E.; Riley, M.B.; Schnabel, G. Propiconazole inhibits Armillaria tabescens in vitro and translocates into peach roots following trunk infusion. Plant Dis. 2008, 92, 1293–1298. [Google Scholar] [CrossRef]
- Adaskaveg, J.E.; Förster, H. Efficacy of Sodium Tetrathiocarbonate and Propiconazole in Managing Armillaria Root Rot of Almond on Peach Rootstock. Plant Dis. 1999, 83, 240–246. [Google Scholar] [CrossRef]
- Schnabel, G.; Agudelo, P.; Henderson, G.W.; Rollins, P.A. Aboveground root collar excavation of peach trees for Armillaria root rot management. Plant Dis. 2012, 96, 681–686. [Google Scholar] [CrossRef]
- Baumgartner, K. Root Collar Excavation for Postinfection Control of Armillaria Root Disease of Grapevine. Plant Dis. 2004, 88, 1235–1240. [Google Scholar] [CrossRef] [PubMed]
- Jordan, M.O.; Kelling, K.A.; Lowery, B.; Arriaga, F.J.; Speth, P.E. Hill Shape Influences on Potato Yield, Quality, and Nitrogen Use Efficiency. Am. J. Potato Res. 2013, 90, 217–228. [Google Scholar] [CrossRef]
- Chow, T.L.; Rees, H.W. Effects of potato hilling on water runoff and soil erosion under simulated rainfall. Can. J. Soil Sci. 1994, 74, 453–460. [Google Scholar] [CrossRef]
- Donohue, S.V. Microrelief and Preferential Flow: Factors Affecting Solute Leaching and Vadose Zone Monitoring; University of Wisconsin–Madison: Madison, WI, USA, 1990. [Google Scholar]
- Saffigna, P.G.; Tanner, C.B.; Keeney, D.R. Non-Uniform Infiltration Under Potato Canopies Caused by Interception, Stemflow, and Hilling1. Agron. J. 1976, 68, 337–342. [Google Scholar] [CrossRef]
- Robinson, D. A comparison of soil-water distribution under ridge and bed cultivated potatoes. Agric. Water Manag. 1999, 42, 189–204. [Google Scholar] [CrossRef]
- Cooley, E.T.; Lowery, B.; Kelling, K.A.; Wilner, S. Water dynamics in drip and overhead sprinkler irrigated potato hills and development of dry zones. Hydrol. Process. 2007, 21, 2390–2399. [Google Scholar] [CrossRef]
- Glenn, D.M.; Welker, W.V. Root Development Patterns in Field Grown Peach Trees. J. Am. Soc. Hortic. Sci. 1993, 118, 362–365. [Google Scholar] [CrossRef]
- Godara, A.; Chitkara, S.; Ahlawat, D. Root distribution pattern in peach cv. Sharbarti. Haryana J. Hortic. Sci. 2000, 29, 161–163. [Google Scholar]
- Cox, K.D.; Scherm, H.; Serman, N. Ground-penetrating Radar to Detect and Quantify Residual Root Fragments Following Peach Orchard Clearing. HortTechnology 2005, 15, 600–607. [Google Scholar] [CrossRef]
- Salokhe, V.M.; Ramalingam, N. Effect of rotation direction of a rotary tiller on draft and power requirements in a Bangkok clay soil. J. Terramech. 2002, 39, 195–205. [Google Scholar] [CrossRef]
- Matin, M.A.; Fielke, J.M.; Desbiolles, J.M.A. Torque and energy characteristics for strip-tillage cultivation when cutting furrows using three designs of rotary blade. Biosyst. Eng. 2015, 129, 329–340. [Google Scholar] [CrossRef]
- Matin, M.A.; Hossain, M.I.; Gathala, M.K.; Timsina, J.; Krupnik, T.J. Optimal design and setting of rotary strip-tiller blades to intensify dry season cropping in Asian wet clay soil conditions. Soil Tillage Res. 2021, 207, 104854. [Google Scholar] [CrossRef] [PubMed]
- Ahmadi, I. An Estimator for Torque and Draft Force Requirements of a New Up-cut Rotary Tiller. J. Agric. Mach. 2020. [Google Scholar] [CrossRef]
- Zareiforoush, H.; Komarizadeh, M.H.; Alizadeh, M.R. Rotary Tiller Design Proportional to a Power Tiller using Specific Work Method (SWM). Nat Sci. 2010, 8, 39–45. [Google Scholar]
- Zabadal, T.; VanEe, G.; Brunke, G.; Ledebuhr, R.; Hauch, B.; Francis, D. The Construction of Equipment for Hilling-up and Taking-out Soil around Grafted Grapevines. 2004. Available online: https://www.canr.msu.edu/uploads/files/Research_Center/SWMREC/special_reports/hilling_sr23.pdf (accessed on 21 October 2021).
- Easterlund, P. John Deere 5101EN. Available online: https://www.tractordata.com/farm-tractors/007/7/5/7751-john-deere-5101en.html (accessed on 3 July 2021).
- Sastry, C.C.; Hariharan, P.; Pradeep Kumar, M.; Muthu Manickam, M.A. Experimental investigation on boring of HSLA ASTM A36 steel under dry, wet, and cryogenic environments. Mater. Manuf. Process. 2019, 34, 1352–1379. [Google Scholar] [CrossRef]
- Tevata, A.; Inprasit, C. The Effect of Paddle Number and Immersed Radius Ratio on Water Wheel Performance. Energy Procedia 2011, 9, 359–365. [Google Scholar] [CrossRef]
- Singerman, A.; Arouca, M.; Olmstead, M. Establishment and Production Costs for Peach Orchards in Florida: Enterprise Budget and Profitability Analysis. EDIS 2017, 2017. [Google Scholar] [CrossRef]


Disclaimer/Publisher’s Note: The statements, opinions and data contained in all publications are solely those of the individual author(s) and contributor(s) and not of MDPI and/or the editor(s). MDPI and/or the editor(s) disclaim responsibility for any injury to people or property resulting from any ideas, methods, instructions or products referred to in the content. |
© 2025 by the authors. Licensee MDPI, Basel, Switzerland. This article is an open access article distributed under the terms and conditions of the Creative Commons Attribution (CC BY) license (https://creativecommons.org/licenses/by/4.0/).