Article

Physical–Mechanical Properties of Tomato Seedlings for the Design and Optimization of Automatic Transplanters

by
Gaudencio Grande
1,
Martín Hidalgo-Reyes
2,*,
Pedro Cruz
2 and
Noé Velázquez-López
3
1
Posgrado en Ingeniería Agrícola y Uso Integral del Agua, Universidad Autónoma Chapingo, Texcoco 56230, Estado de México, Mexico
2
Departamento de Ingeniería Mecánica Agrícola, Universidad Autónoma Chapingo, Texcoco 56230, Estado de México, Mexico
3
Departamento de Irrigación, Universidad Autónoma Chapingo, Texcoco 56230, Estado de México, Mexico
*
Author to whom correspondence should be addressed.
AgriEngineering 2025, 7(5), 138; https://doi.org/10.3390/agriengineering7050138
Submission received: 27 March 2025 / Revised: 16 April 2025 / Accepted: 22 April 2025 / Published: 6 May 2025
(This article belongs to the Section Agricultural Mechanization and Machinery)

Abstract

:
This study was based on the hypothesis that the hybrid type and its physical–mechanical properties significantly influence the operational efficiency of transplanting systems. Understanding these properties is essential for optimizing the performance of semi-automatic and automatic transplanters. To test this hypothesis, a completely randomized design was implemented to evaluate the physical–mechanical properties of tomato seedlings. A total of 1350 seedlings from three F1 hybrids—Natalie (H1), CID (H2), and Gavilán (H3)—cultivated in central Mexico, were analyzed. The statistical analyses included mean comparisons using Tukey’s test and multiple linear regression to estimate the center of mass (CM). The results indicate that H2 was notable for its total height ( h t = 311.76 mm), canopy development in X, Y, and Z axes (170.24 mm, 106.84 mm, and 98.14 mm, respectively), stem diameter ( d s = 3.65 mm), total weight ( w t = 11.92 g), d e (78.36 mm) and d p (233.40 mm) distances, and oscillation period (T = 0.88 s). H1 had the highest stem height ( h s = 53.18 mm), w t = 11.76 g, and root ball (RB) moisture content (MC) (77.36%). H3 had the largest d s = 3.70 mm, as well as the highest MC in the stem (94.51%) and the remaining foliage (92.92%). Regarding mechanical properties, the average adhesion force (AF) was 4.606 N (H1), 7.470 N (H2), and 3.815 N (H3). The average root ball punching force (RBPF) was 0.36, 0.48, and 0.25 N, respectively. The lowest static friction coefficient (SFC) on a galvanized steel sheet was 0.936. The drop test (DT) revealed an average residual substrate mass of 0.148 g at a height of 500 mm. It can be concluded that the interaction between hybrid type, transplanting age, and MC plays a critical role in the efficient design of semi-automatic and automatic transplanting equipment. This interaction enables process optimization, ensures operational quality, reduces seedling damage, and ultimately enhances and increases the long-term profitability and sustainability of the equipment.

Graphical Abstract

1. Introduction

Tomato (Solanum lycopersicum) is one of the most important vegetables worldwide in terms of production and consumption, with a global volume of 182 million tons, accounting for 17% of the total vegetable production in 2017. By 2022, this figure increased to 186.11 million tons [1,2,3,4]. In 2023, Mexico’s total tomato production reached 3.64 million tons, accounting for 21.1% of the country’s total vegetable production. Furthermore, tomatoes played a significant role in Mexico’s agricultural exports, comprising 25.7% of the 7.1 million tons exported [5].
The Importance and economic Impact of this crop makes It essential to study and improve production techniques. Among the different stages of cultivation, seedling transplantation stands out for its significant effect on yield. Compared to direct seeding, semi-automatic and automatic transplantation increases yields by enabling additional harvest cycles [6]. Seedling transplantation can be performed manually, semi-automatically, or fully automatically [7]. The transition toward these transplantation systems requires a comprehensive understanding of the physical and mechanical properties of seedlings, as these properties influence the design of machinery capable of handling them without causing damage during the process [8,9,10].
Several studies explored the physical and mechanical properties of seedlings from different agricultural crops, including onion [9,11], chili pepper [12], bell pepper [13], as well as eggplant and cabbage [14]. For tomato seedlings, research has been carried out on varieties such as Abhilash [12], Roma VF [15], Ansal Hybrid and Seminis Company [14], and Himsona [16]. These studies examined various physical properties, including overall dimensions, canopy development, and total weight ( w t ), as well as mechanical characteristics such as the static friction coefficient (SFC), stem compression, and root ball (RB) resistance, among others.
Additionally, there are specific studies focused on the mechanical properties of different agricultural products. Han et al. [17] conducted a study on the mechanical properties of cucumber seedling root balls. Similarly, Tian et al. [18] studied the mechanical properties of bell pepper seedlings at different growth stages, combining the data with neural networks. Furthermore, there are studies that analyze drop tests (DT) on sunflower seedlings by simulating their interaction with the soil [19,20], as well as mechanical damage to the RB, applying Hertzian contact theory to model the collision process [10,21].
However, there is limited information on certain physical properties, such as stem height ( h s ) and diameter ( d s ), center of mass (CM), distance d e , distance d p , and oscillation period (T). Furthermore, information is scarce on variable mechanical properties such as the adhesion force (AF) of seedlings and root ball punching force (RBPF). Additionally, there is little information on these properties, especially for F1 hybrid varieties adapted to the central region of Mexico. This study provides novel and previously undocumented data of the significant relevance for the mechanical design and performance optimization of agricultural machinery used in seedling transplanting. The physical and mechanical properties characterized herein are critical design parameters that contribute to improving both operational efficiency and overall productivity. In contrast to previous studies, which typically rely on the mechanical properties of seedling varieties not representative of those cultivated in Mexico, the present research offers specific data on F1 hybrid seedlings commonly used in central Mexico—varieties for which no prior values have been reported in the available scientific literature. Therefore, this study aims to evaluate the physical and mechanical properties of three F1 hybrid varieties to generate data that can be used as a foundation for the design of automatic transplanters adapted to the specific conditions of these varieties.

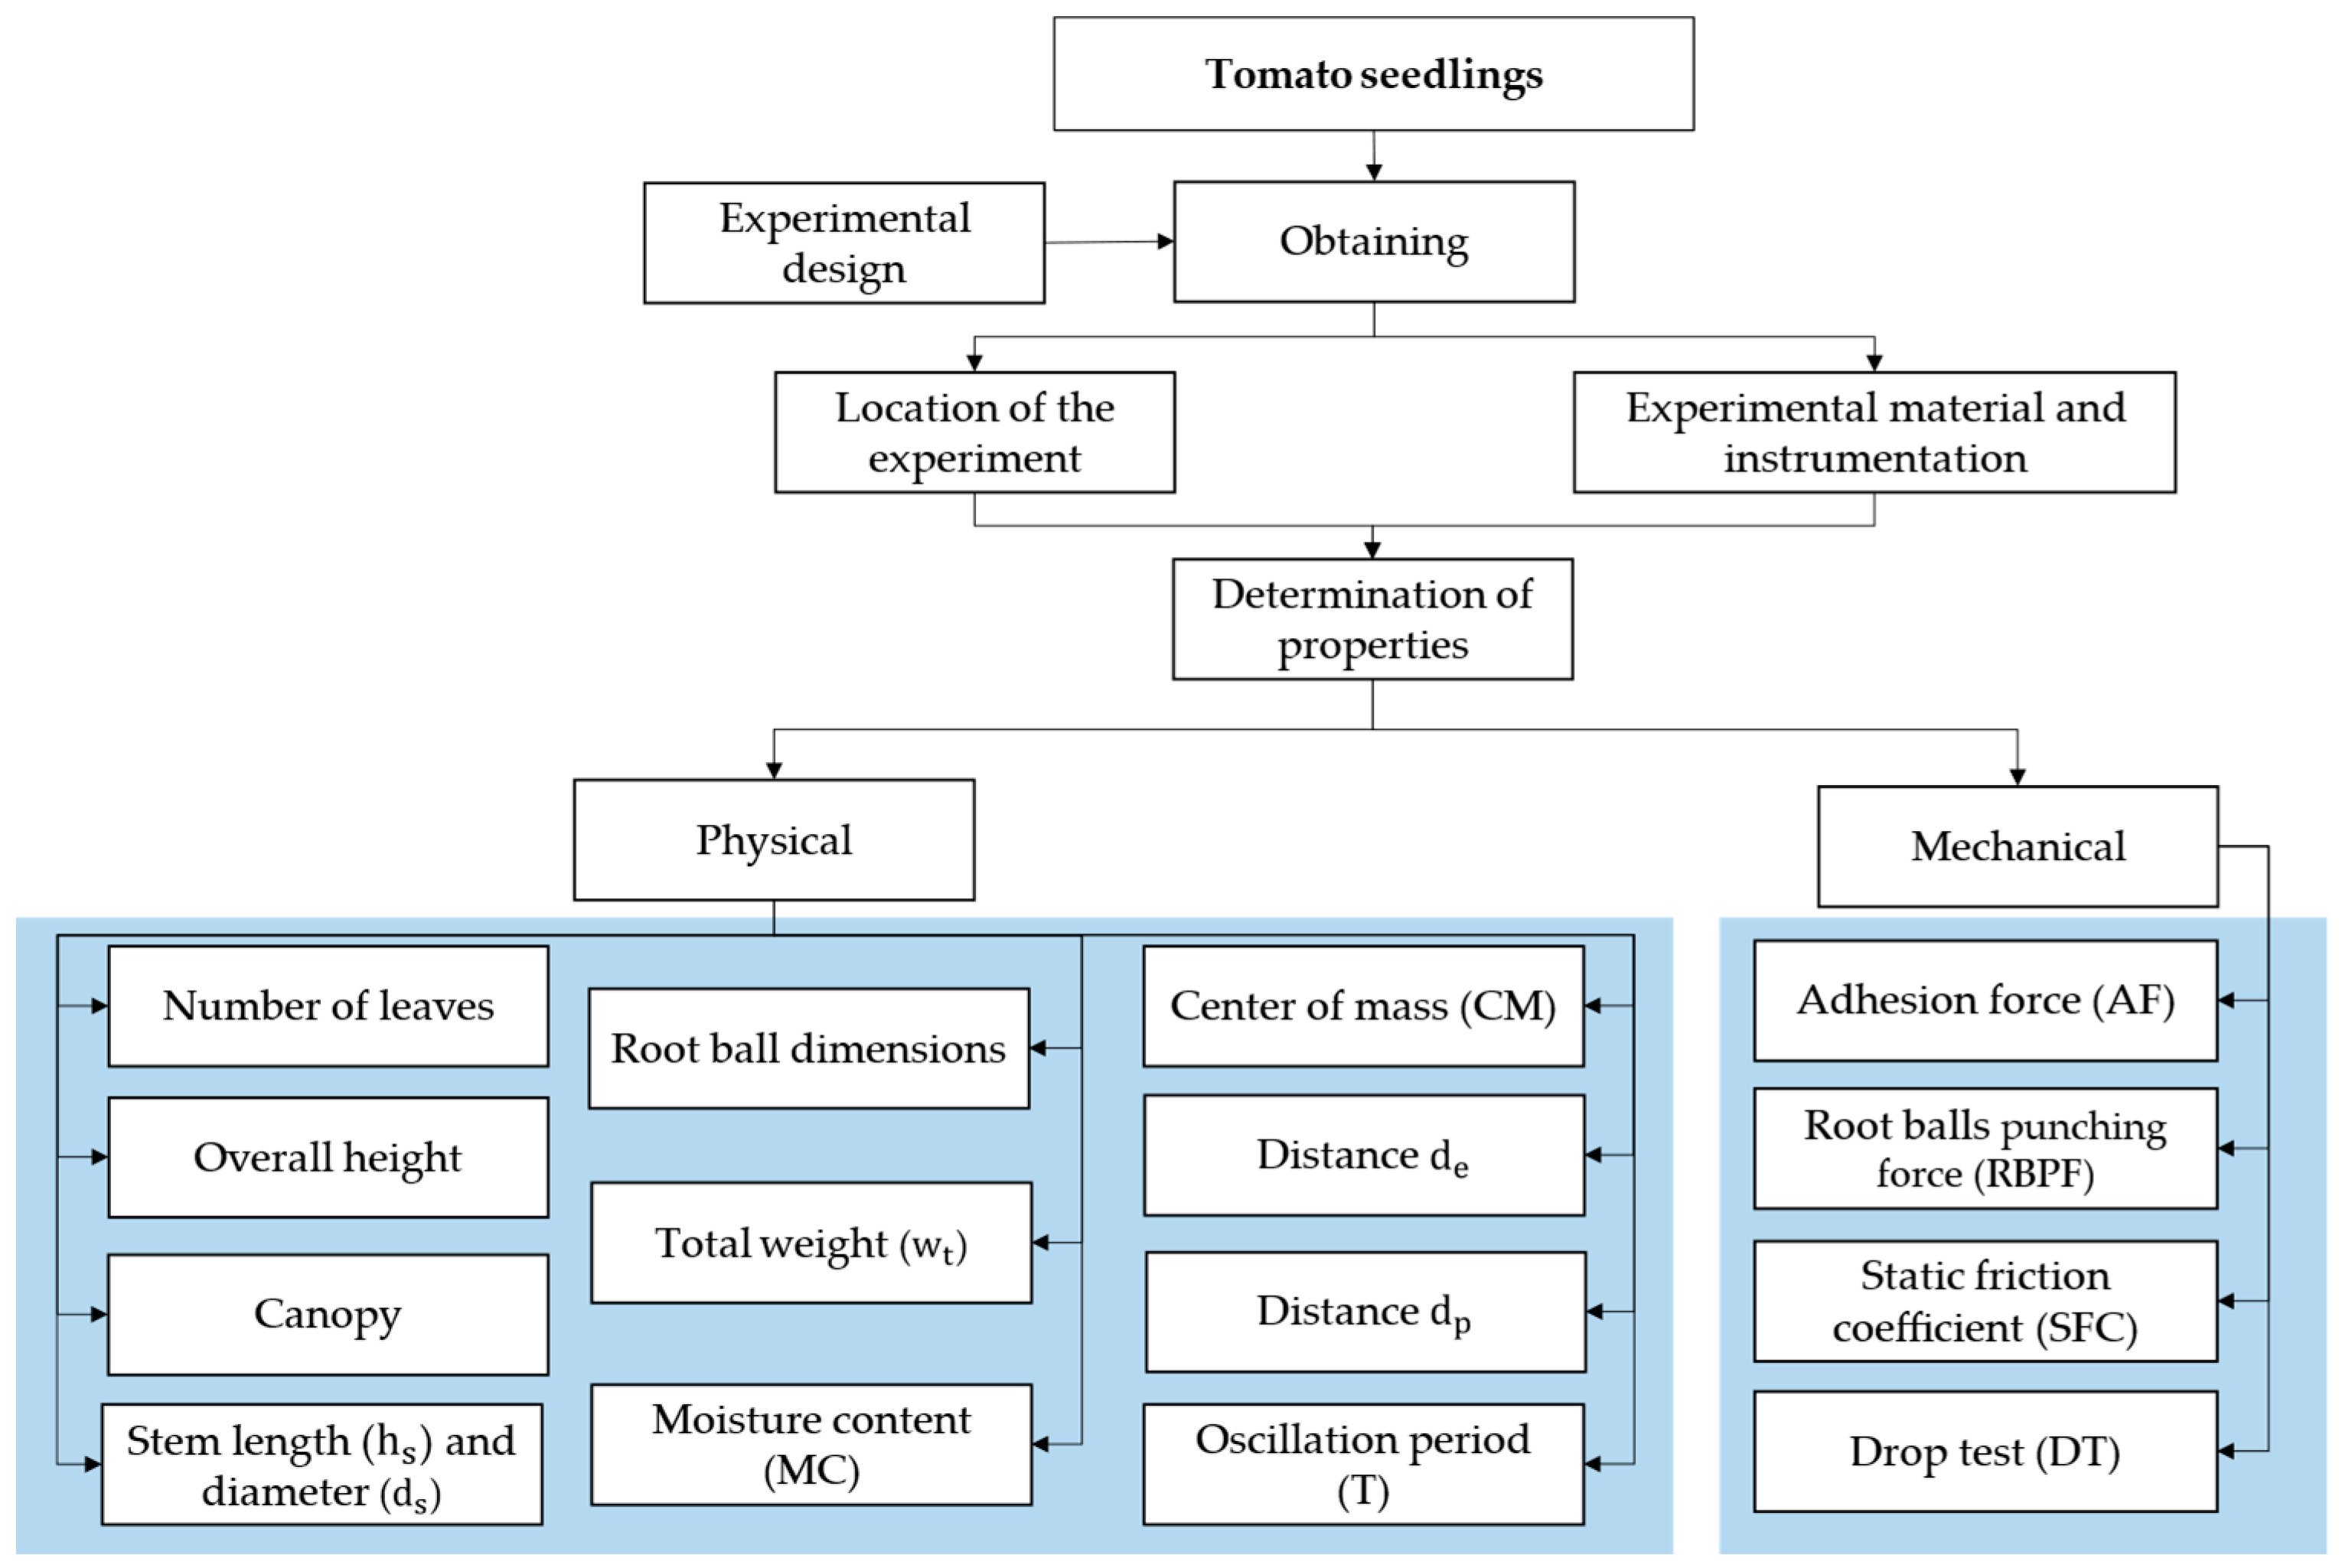
2. Materials and Methods

The methodology used to determine physical and mechanical properties in this research is shown in Figure 1.

2.1. Location and Experimental Material

Tomato seeds were sown during the summer of 2024, between July and August, in Texcoco de Mora, Estado de México (19.5060° N, 98.8832° W). In the experimental phase, 2100 tomato seedlings, 30 days old, were obtained, with 700 seedlings from each of the three F1 hybrid varieties: Natalie (H1), CID (H2), and Gavilán (H3). Of these, 450 seedlings were randomly selected for each variety. The tomato seeds were sown at a depth of 10 mm in the substrate. A total of 12 Frigocel germination trays, made of white polystyrene, measuring 664 mm × 335 mm × 67 mm with 200 conical cavities of 31 × 31 mm and 5 mm drainage, were used. The substrate was composed of 80% Peat Moss Sunshine, 10% agrolite, and 10% medium-grade vermiculite. The seedlings were kept under temperature and relative humidity conditions of 25 °C and 90%, respectively.

2.2. Determination of Physical Characteristics

To determine the physical properties, 50 seedlings were randomly selected from each hybrid. These seedlings served as replicates for each physical test.

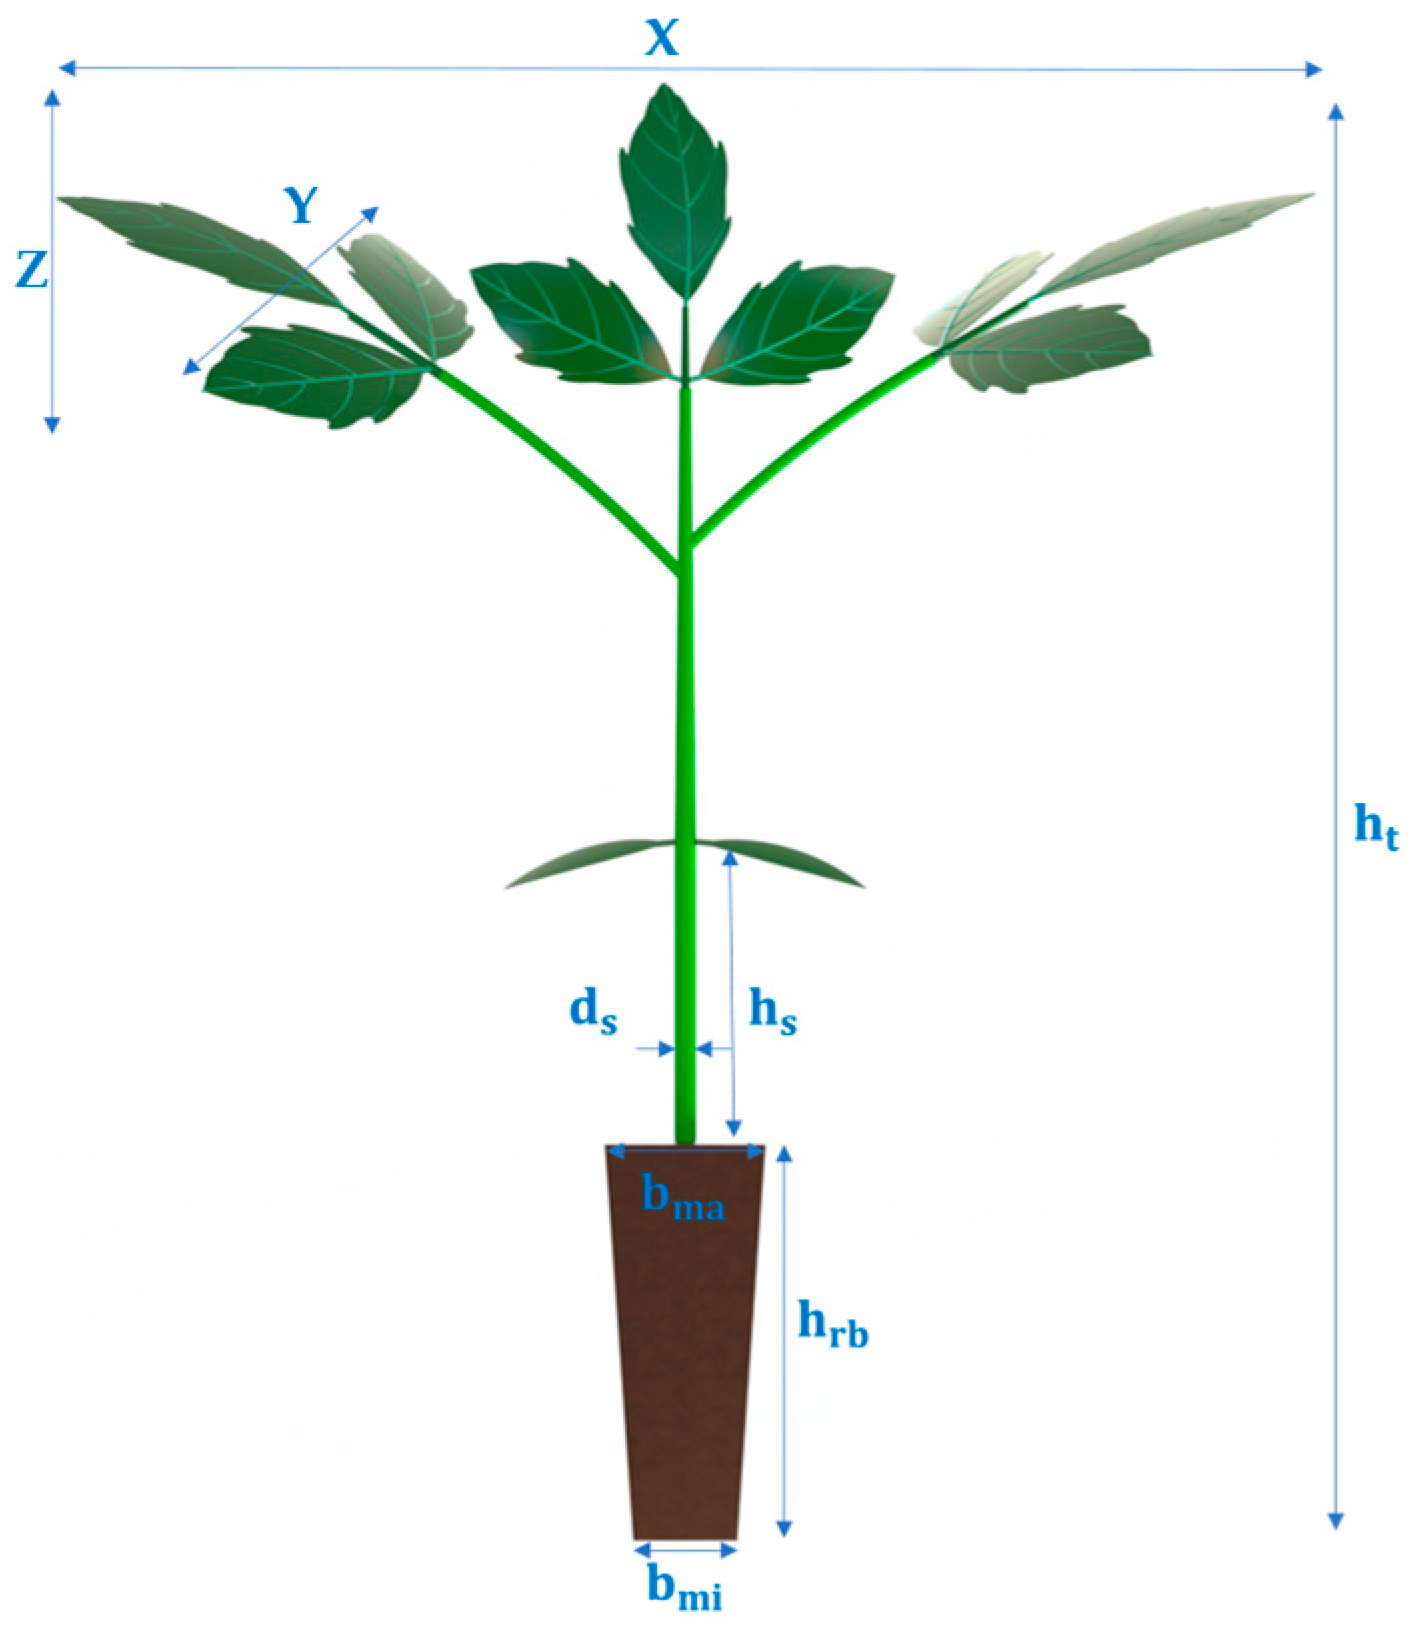
2.2.1. Number of Leaves, Total Height, and Canopy

A visual count was performed to determine the number of compound leaves (with 3 petiolate leaflets) on each seedling. This parameter acts as an indicator of the seedlings’ age, helping to plan and ensure effective transplantation.
Total height of seedlings ( h t ) was measured from the base of the root ball (RB) to the tip of the seedling, following the method described by ASNS [22]. For the measurements, a digital vernier caliper Insize (0–300 mm, Model 1108–300) with a precision of 0.01 mm was used. In cases where the seedling height exceeded 300 mm, a Stanley FatMax tape measure (3 m) was utilized. Additionally, the canopy dimensions of the seedlings were determined along the X, Y, and Z axes (Figure 2).

2.2.2. Root Ball and Stem Dimensions

General dimensions of the seedling’s RB were measured (Figure 2): RB height ( h r b ), major base ( b m a ), and minor base ( b m i ).
The stem was measured from the surface of the b m a to the first leaves of the seedling [13]. The stem height ( h s ) and diameter ( d s ) were measured at a distance ( d s e ) of 10 mm from the RB surface, as shown in Figure 2.

2.2.3. Weight and Moisture Content

Total weight of seedlings ( w t ), RB weight along with roots ( w r c ), stem weight ( w s ), and remaining foliage weight ( w f ) were determined using an electronic balance Rhino Precision (0–100 g, Model Babol-100) with a graduation of 0.01 g. The moisture content (MC) of seedlings was determined following the ASAE [23]. The seedlings were placed in a RIOSSA convection oven (Model H-33, México City, Mexico) at 103 °C for 24 h. The root balls were placed on trays (lined with aluminum foil) inside the oven, and the foliage of each seedling was placed in a Kraft paper bag. The MC of seedlings was determined using Equation (1):
M C = w i w f w i × 100 ,
where w I is the initial weight of seedlings in g and w f is final weight of the seedlings in g after drying.

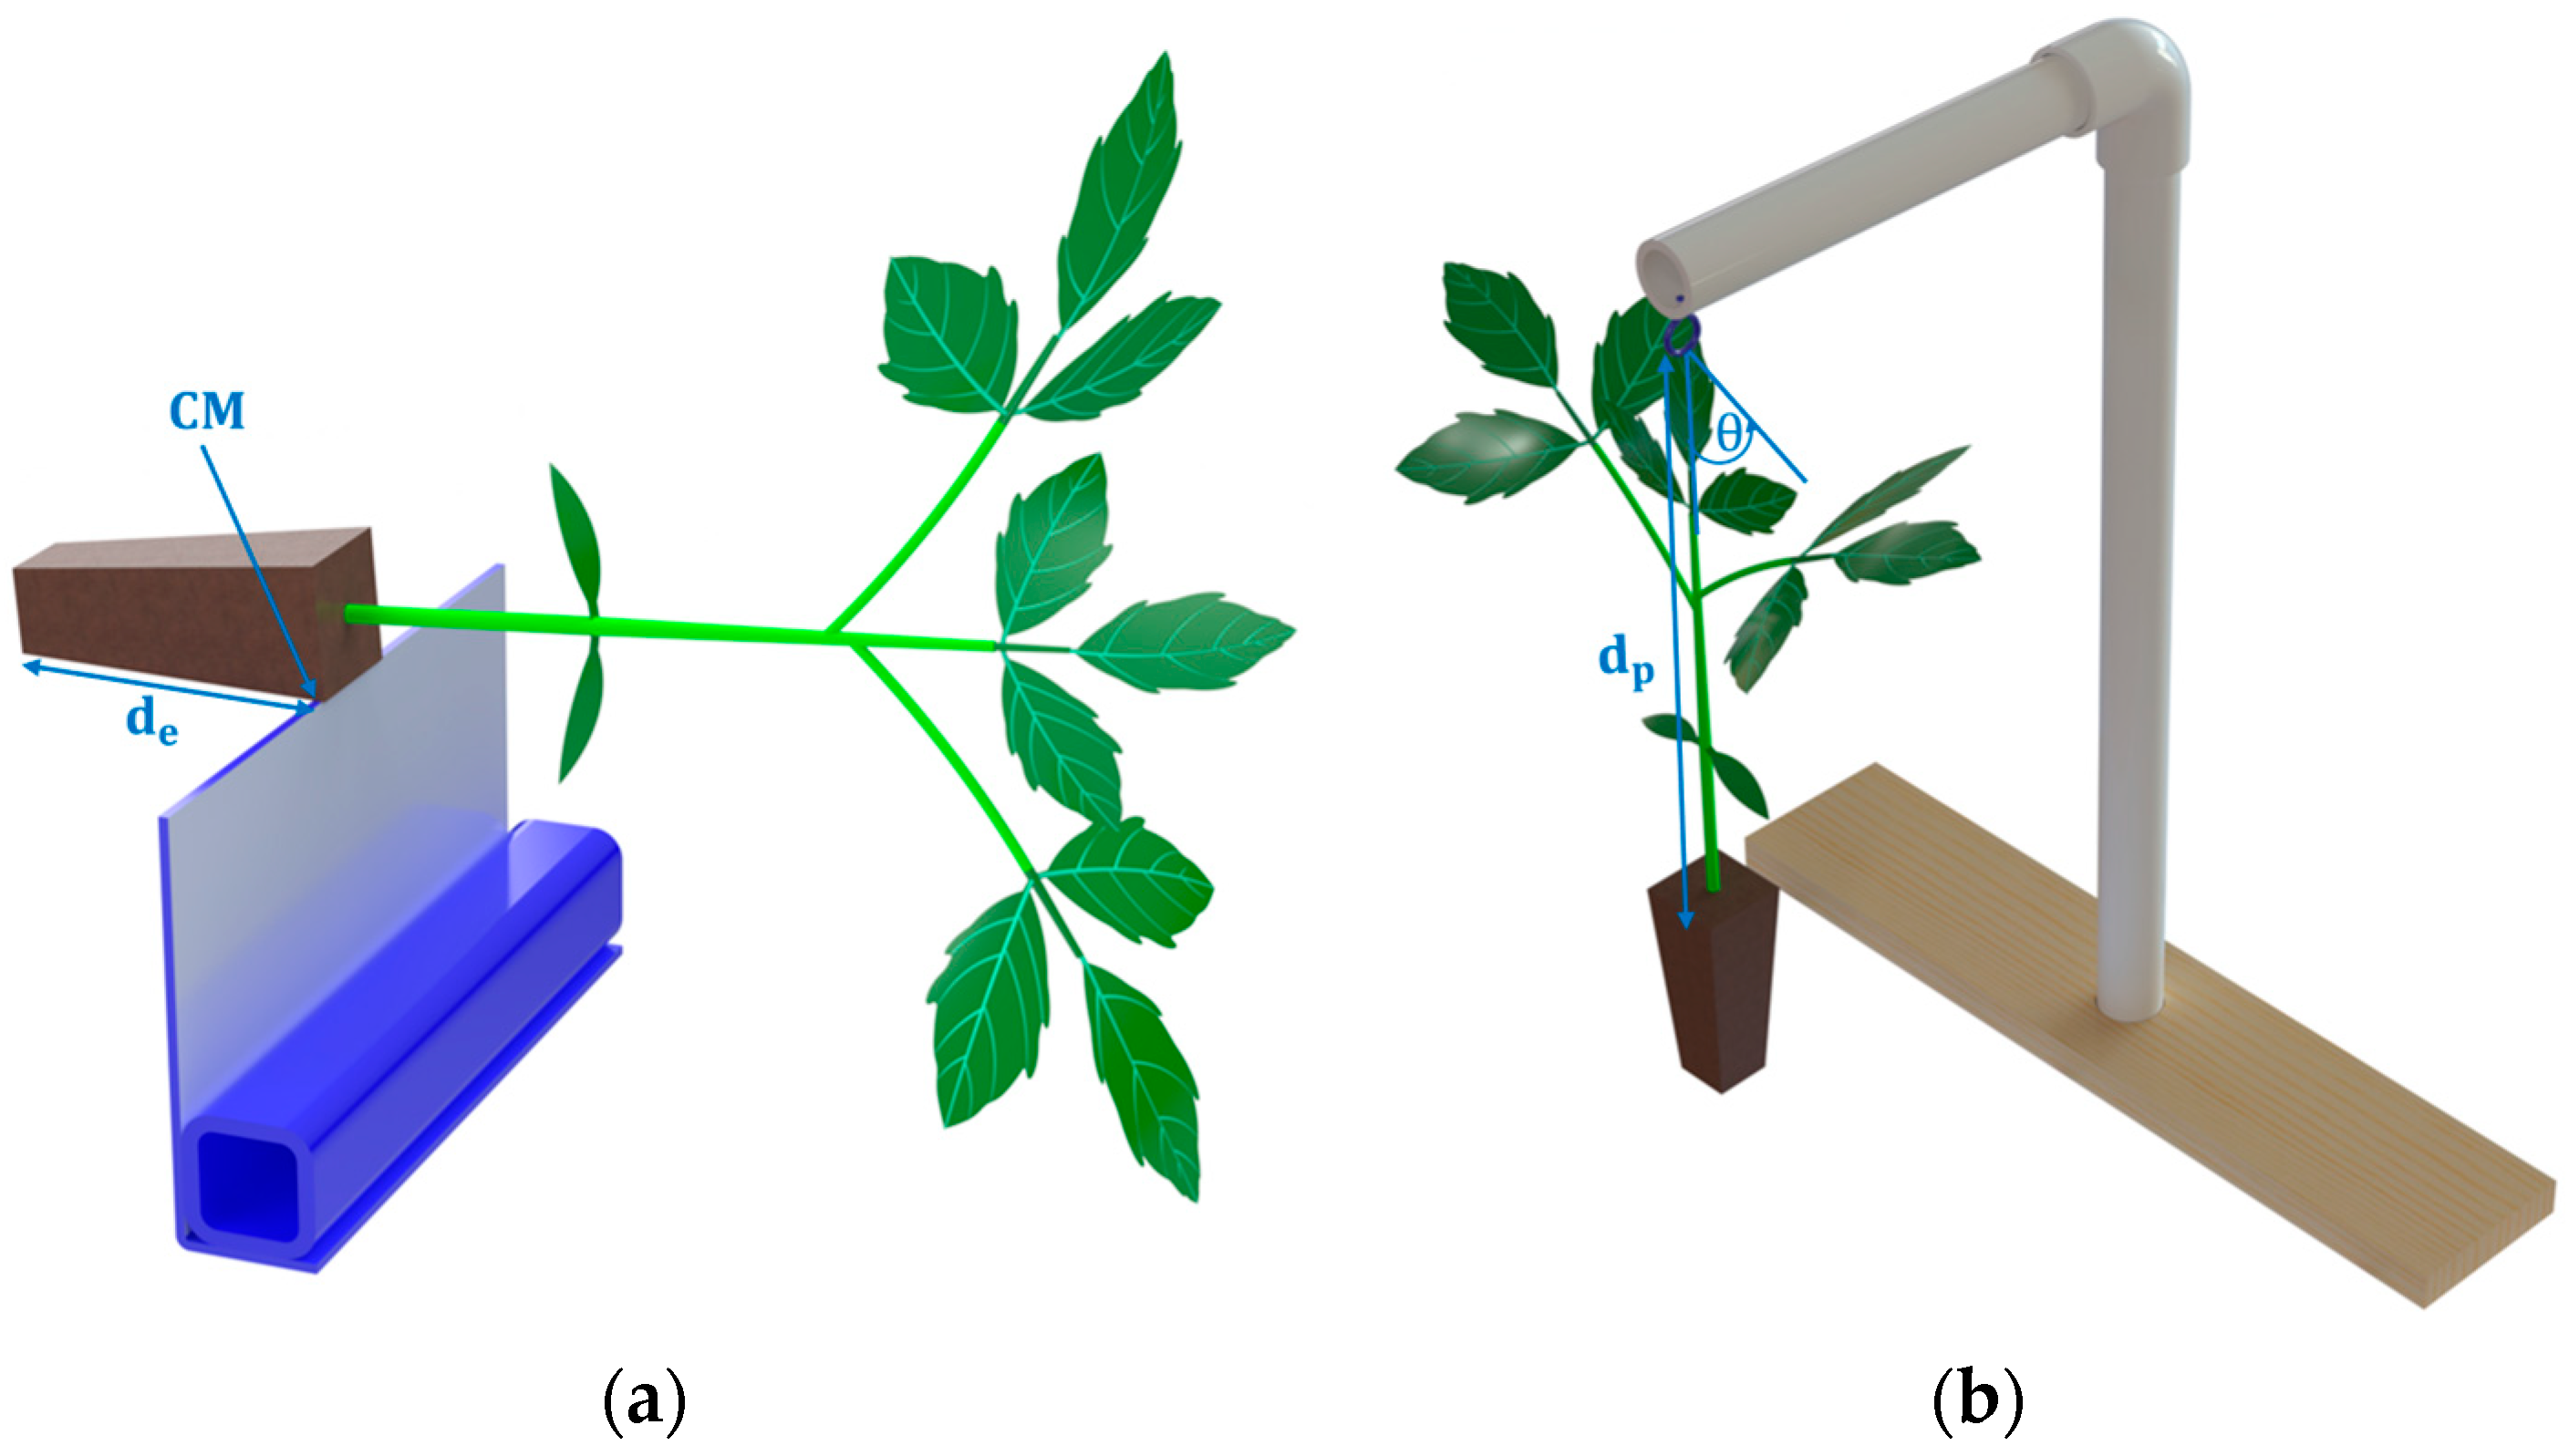
2.2.4. Center of Mass and Oscillation Period

Following the methodology outlined by Paneque et al. [24], the location of the center of mass (CM) of the seedling was determined through its equilibrium point, and the distance d e corresponding to the magnitude from the minor base of the RB ( b m i ) to the seedling’s equilibrium point was measured (Figure 3a).
CM is primarily influenced by h t and the weight of the root balls. Therefore, a multiple linear regression model was developed to estimate the location of the seedlings CM based on the values of distance d e . The multiple linear regression model is presented in Equation (2) as follows:
Y i = β 0 + β 1 X i 1 + β 2 X i 2 + + β n X i n
where Y i is the distance d e in m m , β 0 is the intercept, β 1 β n are the coefficients of the estimators, and X i 1 X i n are the regressor variables used to estimate the center of mass (CM) of the seedling, and i = 1 , ,   150 is the number of seedling samples (all hybrids) and n number of variables involved in estimating the center of mass (CM) of the seedling.
Distance d p was determined based on CM, which is located from the equilibrium point to the pivot point of the simple pendulum (Figure 3a). The oscillation period (T) of the seedling was determined using a simple pendulum. The device was constructed with a treated wood base (500 mm × 300 mm × 12 mm) and a rigid PVC vertical support (Ø = 12 mm, height = 500 mm) secured with high-strength structural adhesive. A 300 mm horizontal extension supports a metal eyelet, from which a lightweight hemp rope with a low oscillating mass was suspended to minimize energy transfer. The seedling was held by the first compound leave. The upper seedling part was aligned at the same height as the pendulum’s pivot point, which also coincided with the upper part of h t . Angular calibration was performed using a wooden template with a fixed θ = 5° inclination, which was used in each test to standardize the initial position. The time required to complete ten oscillations was recorded, with three replicates conducted for each seedling [25] (Figure 3b).

2.3. Mechanical Test

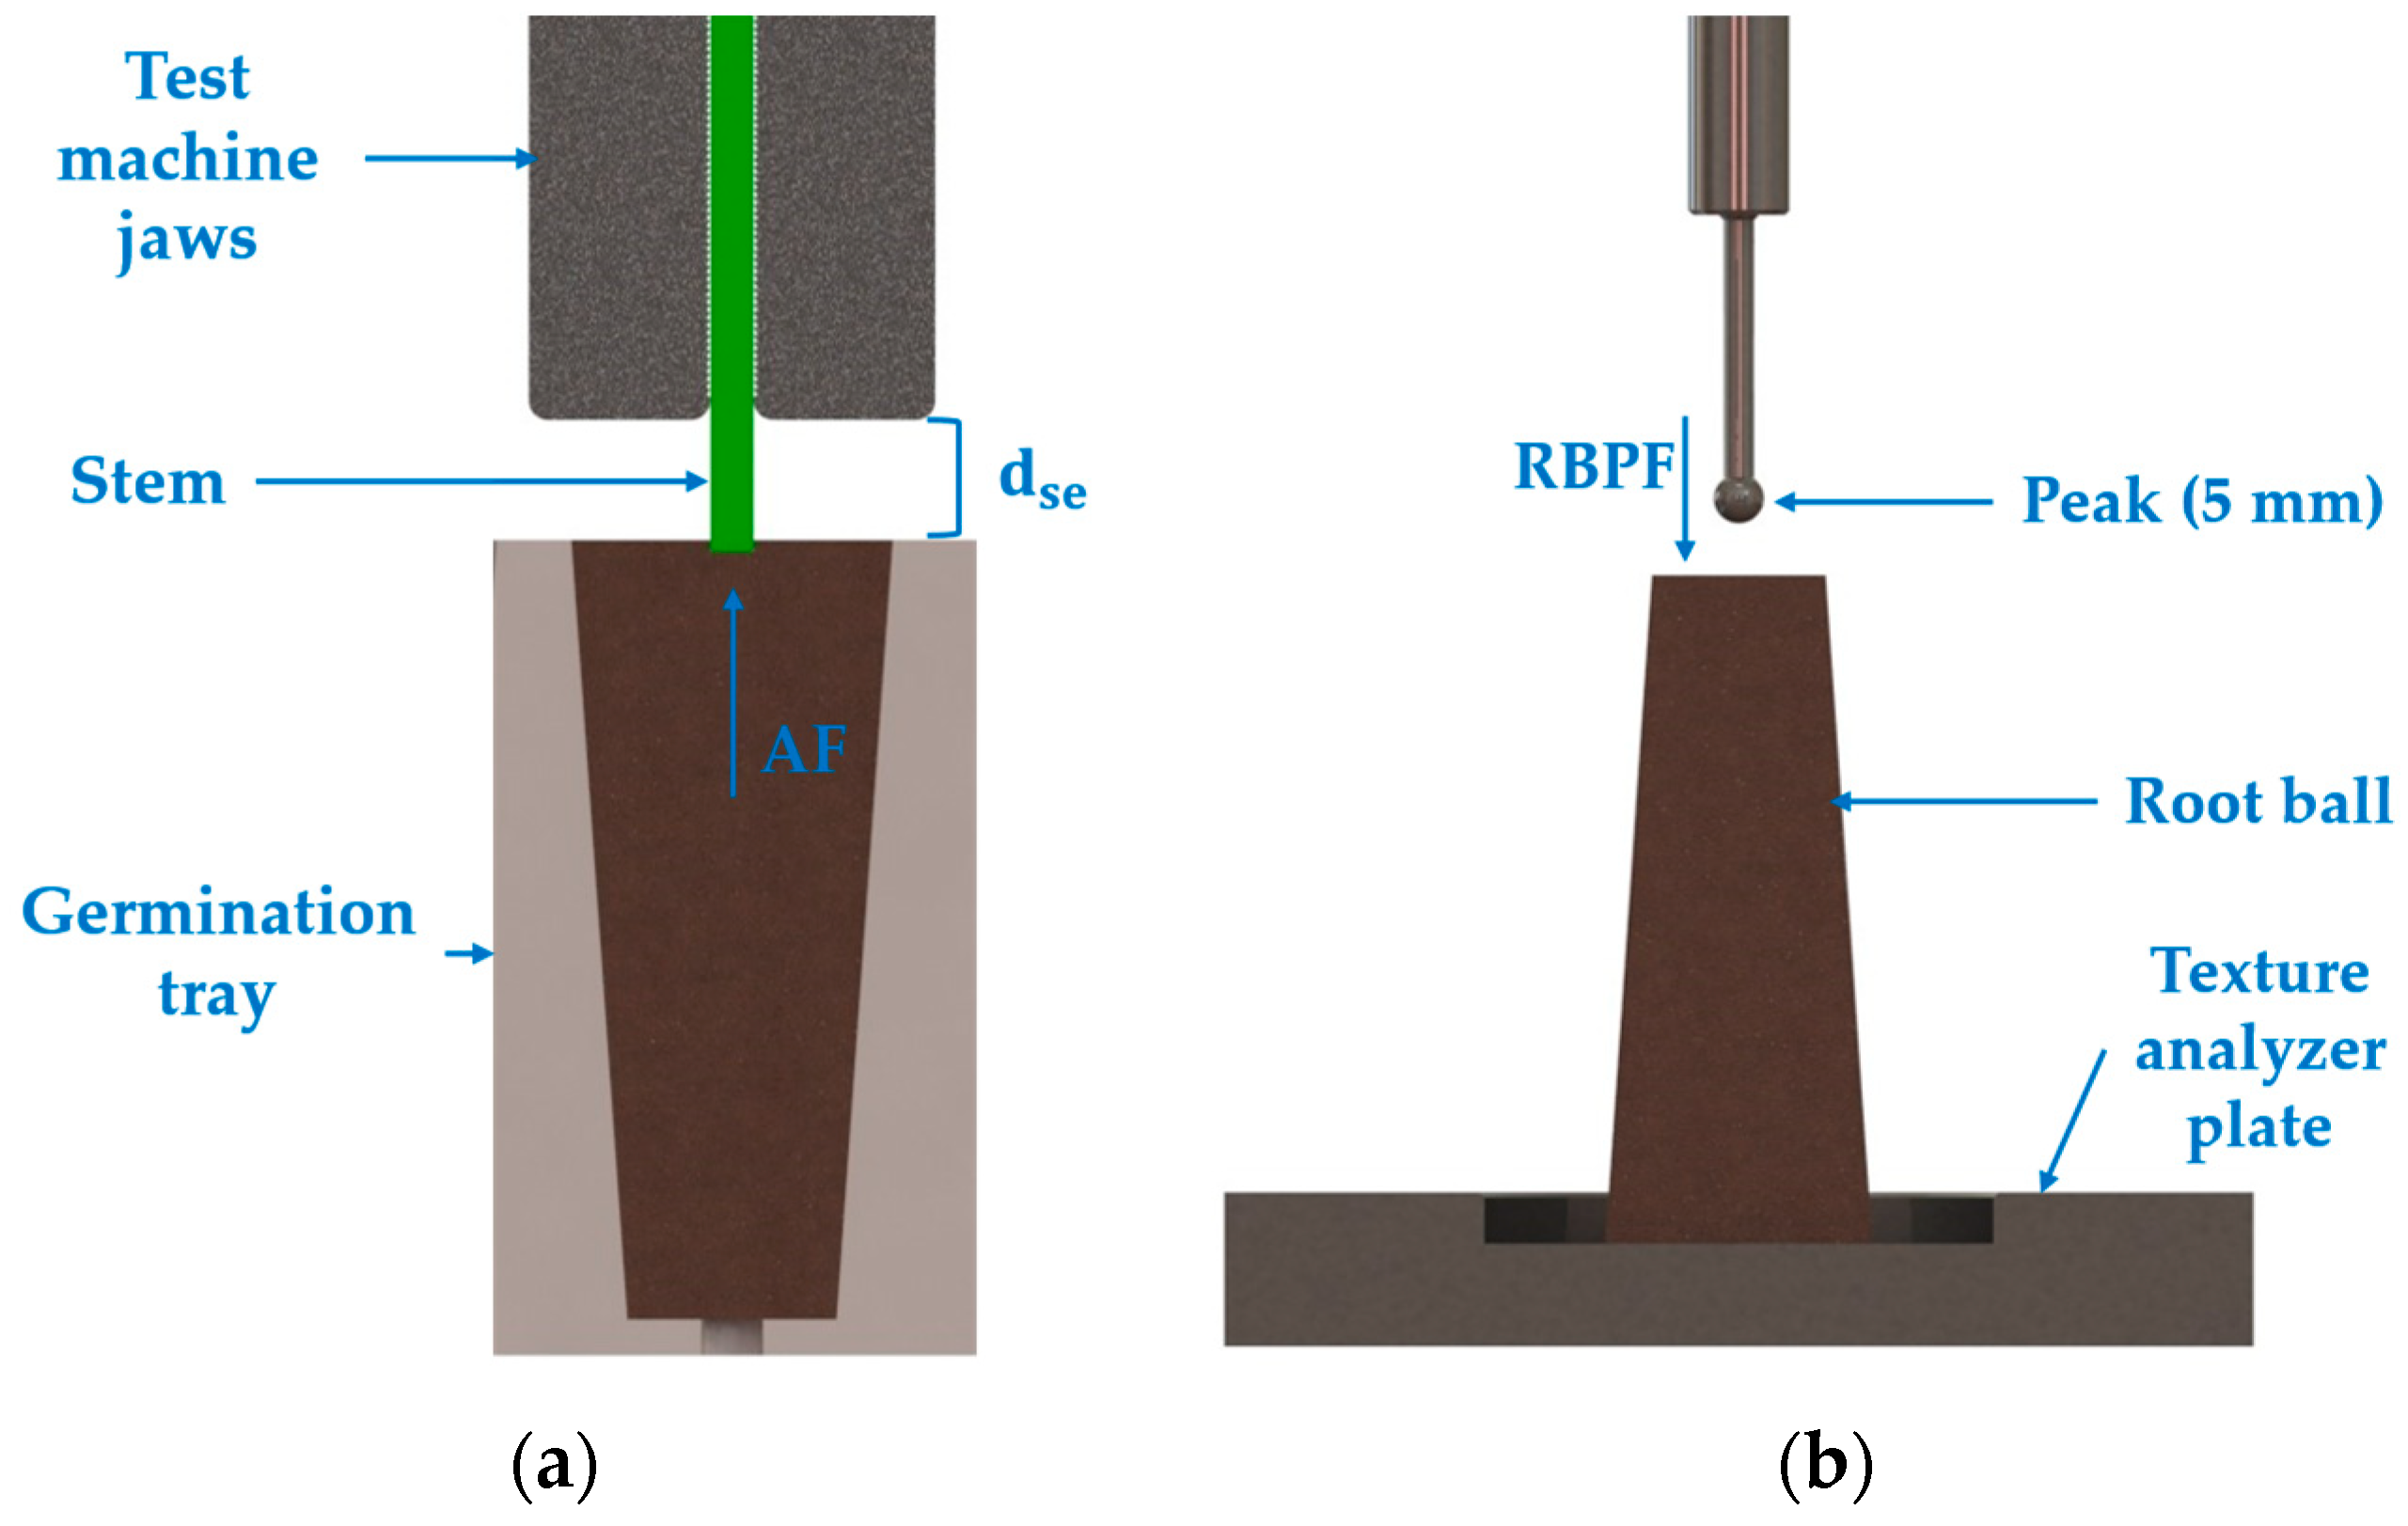
2.3.1. Adhesion Force

The methodology described by the authors of ref. [14] was used as a starting point for testing seedling adhesion force (AF). Seedlings were extracted from germination trays and tested using an Instron machine (Model 3382, Norwood, MA, USA). The tests were conducted at a loading speed of 100 m m   m i n 1 with a sensitivity of 40%. The seedlings were held by their stems at d s e = 10   m m from the b m a of the RB (Figure 4a). Prior to this test, samples of cavities with seedlings and substrates from germination trays were randomly cut using a 9 mm-wide cutter. The cavities were then secured with 12 mm JANEL masking tape to fully fix them and prevent the use of other devices, which could introduce noise in the force detection data (sensing) of the testing machine.

2.3.2. Root Ball Punching Force

Root ball punching force (RBPF) was performed using an AMETEK Brookfield CT3 texture analyzer at a speed of 1.4 m m   s 1 . The foliage of each seedling was cut from the b m a , leaving only the root ball. The samples were then placed on the b m a (Figure 4b).

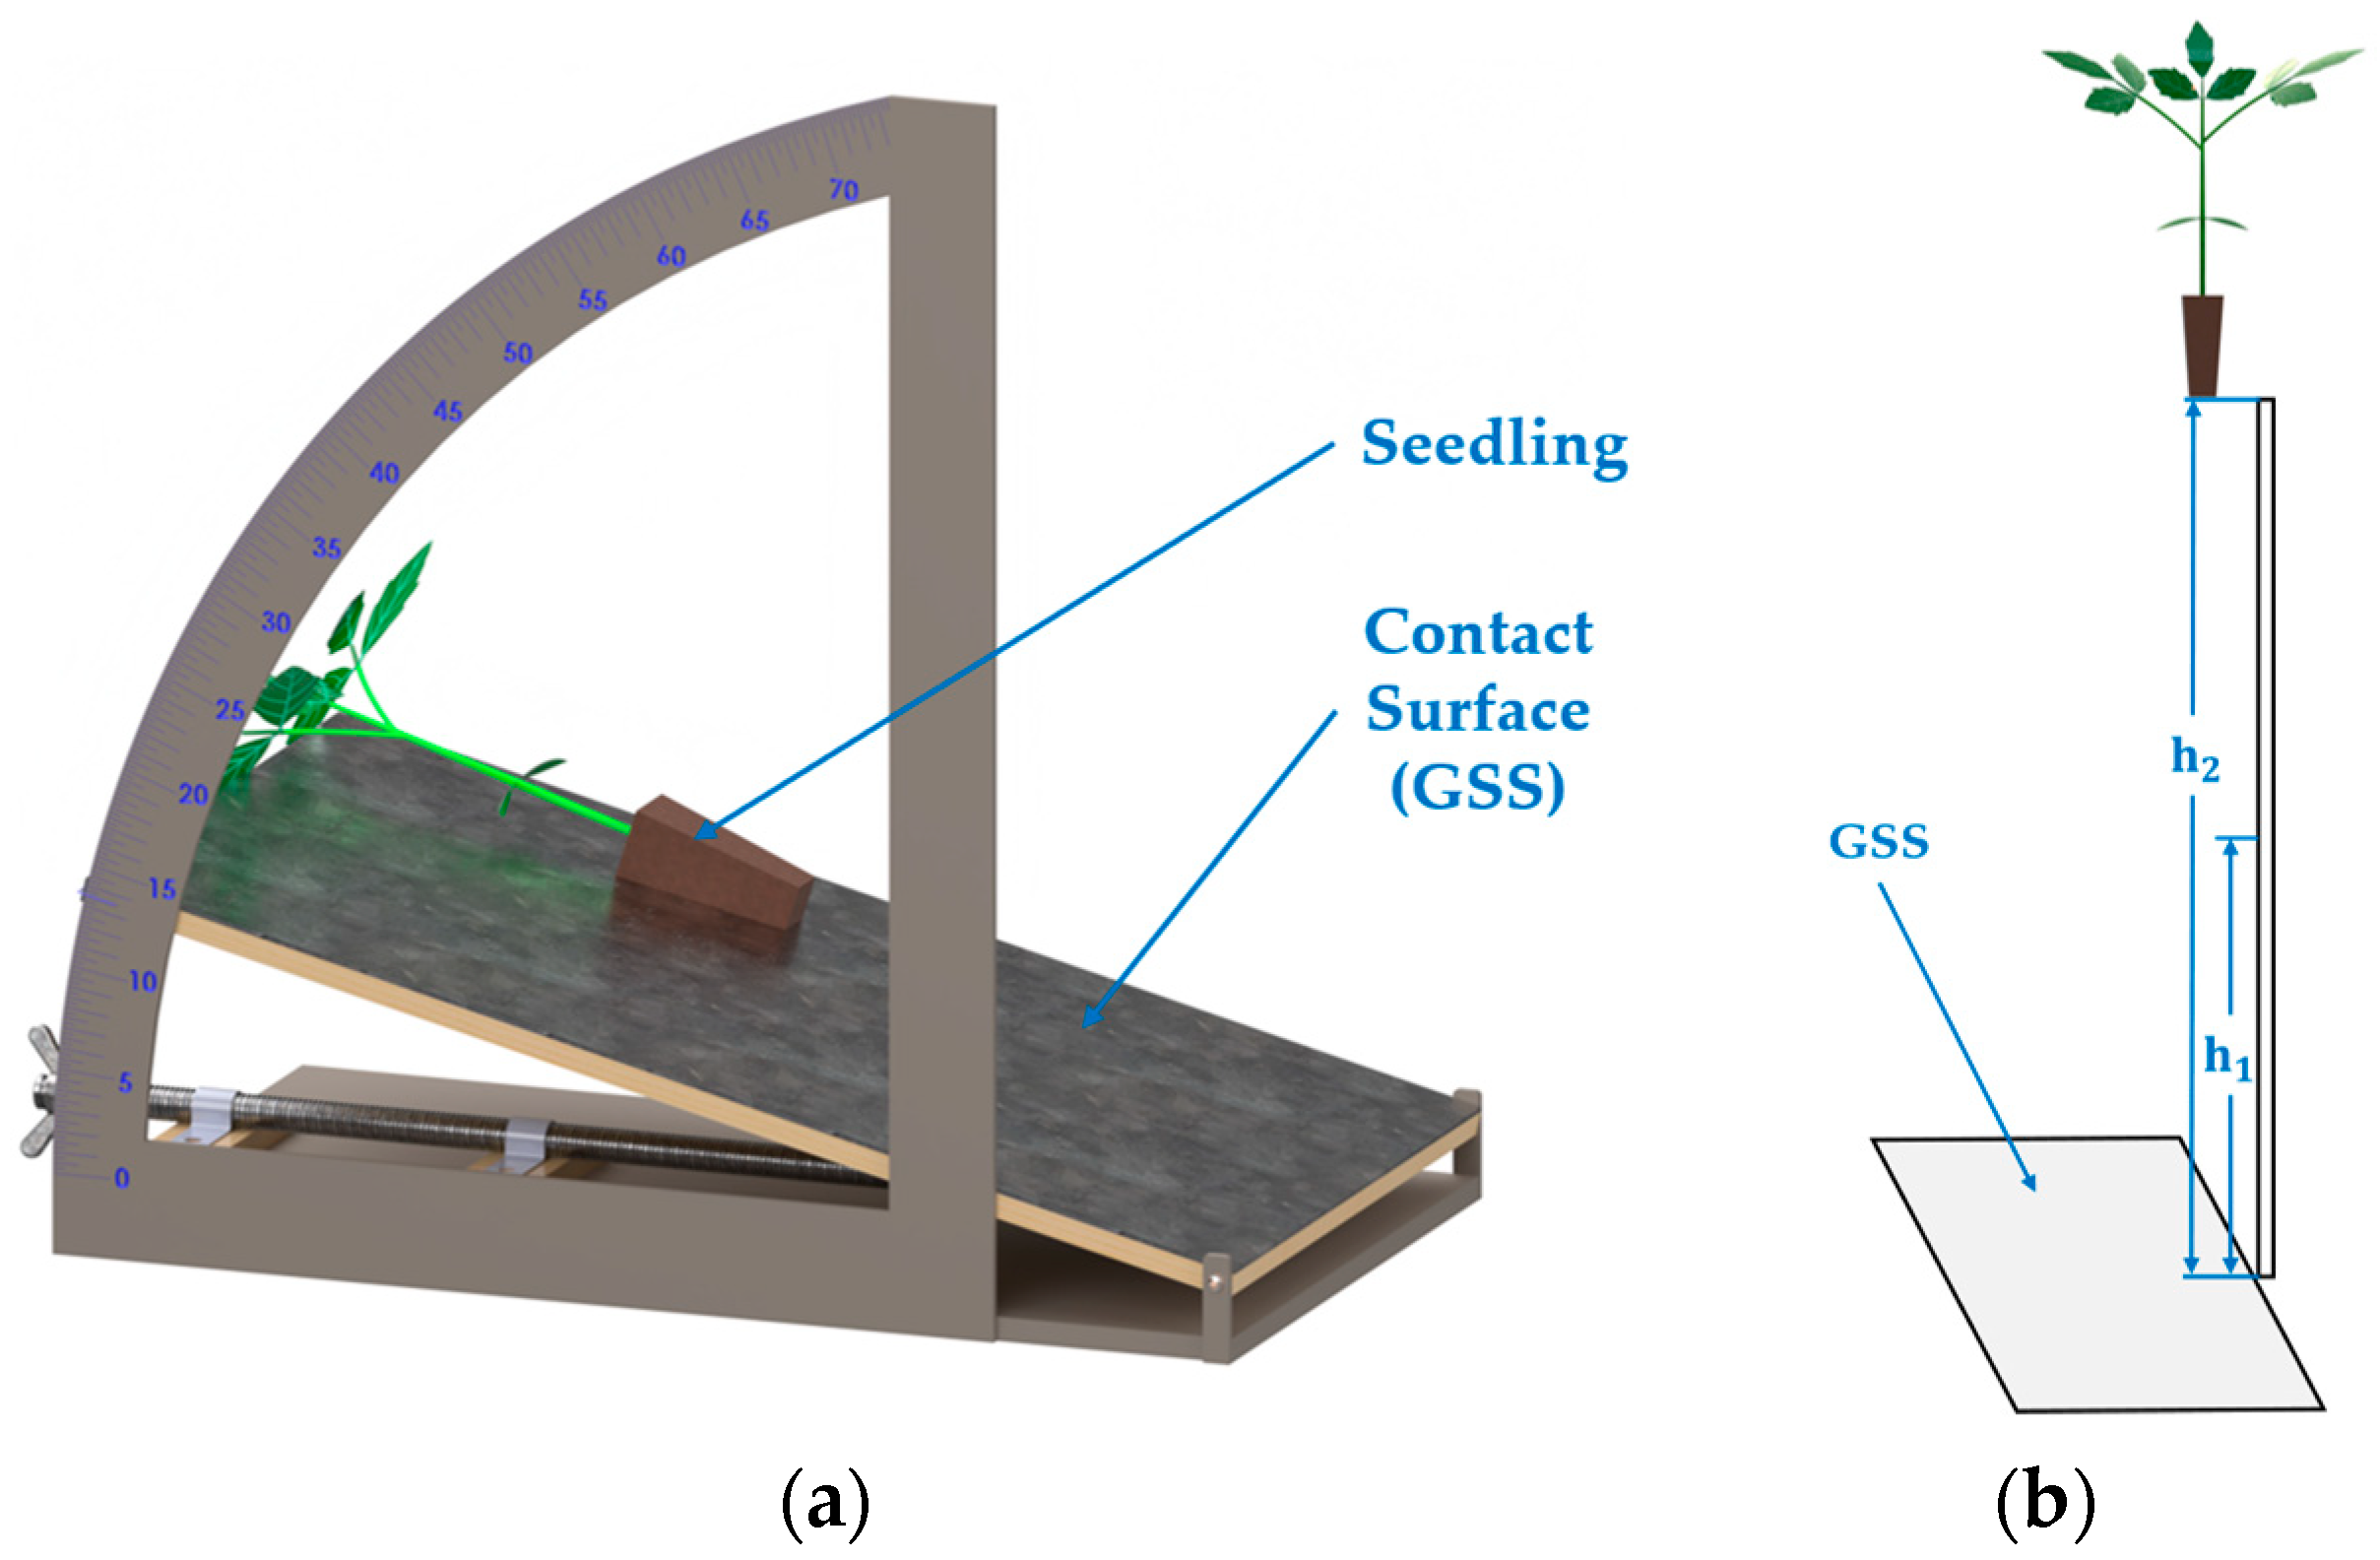
2.3.3. Static Friction Coefficient
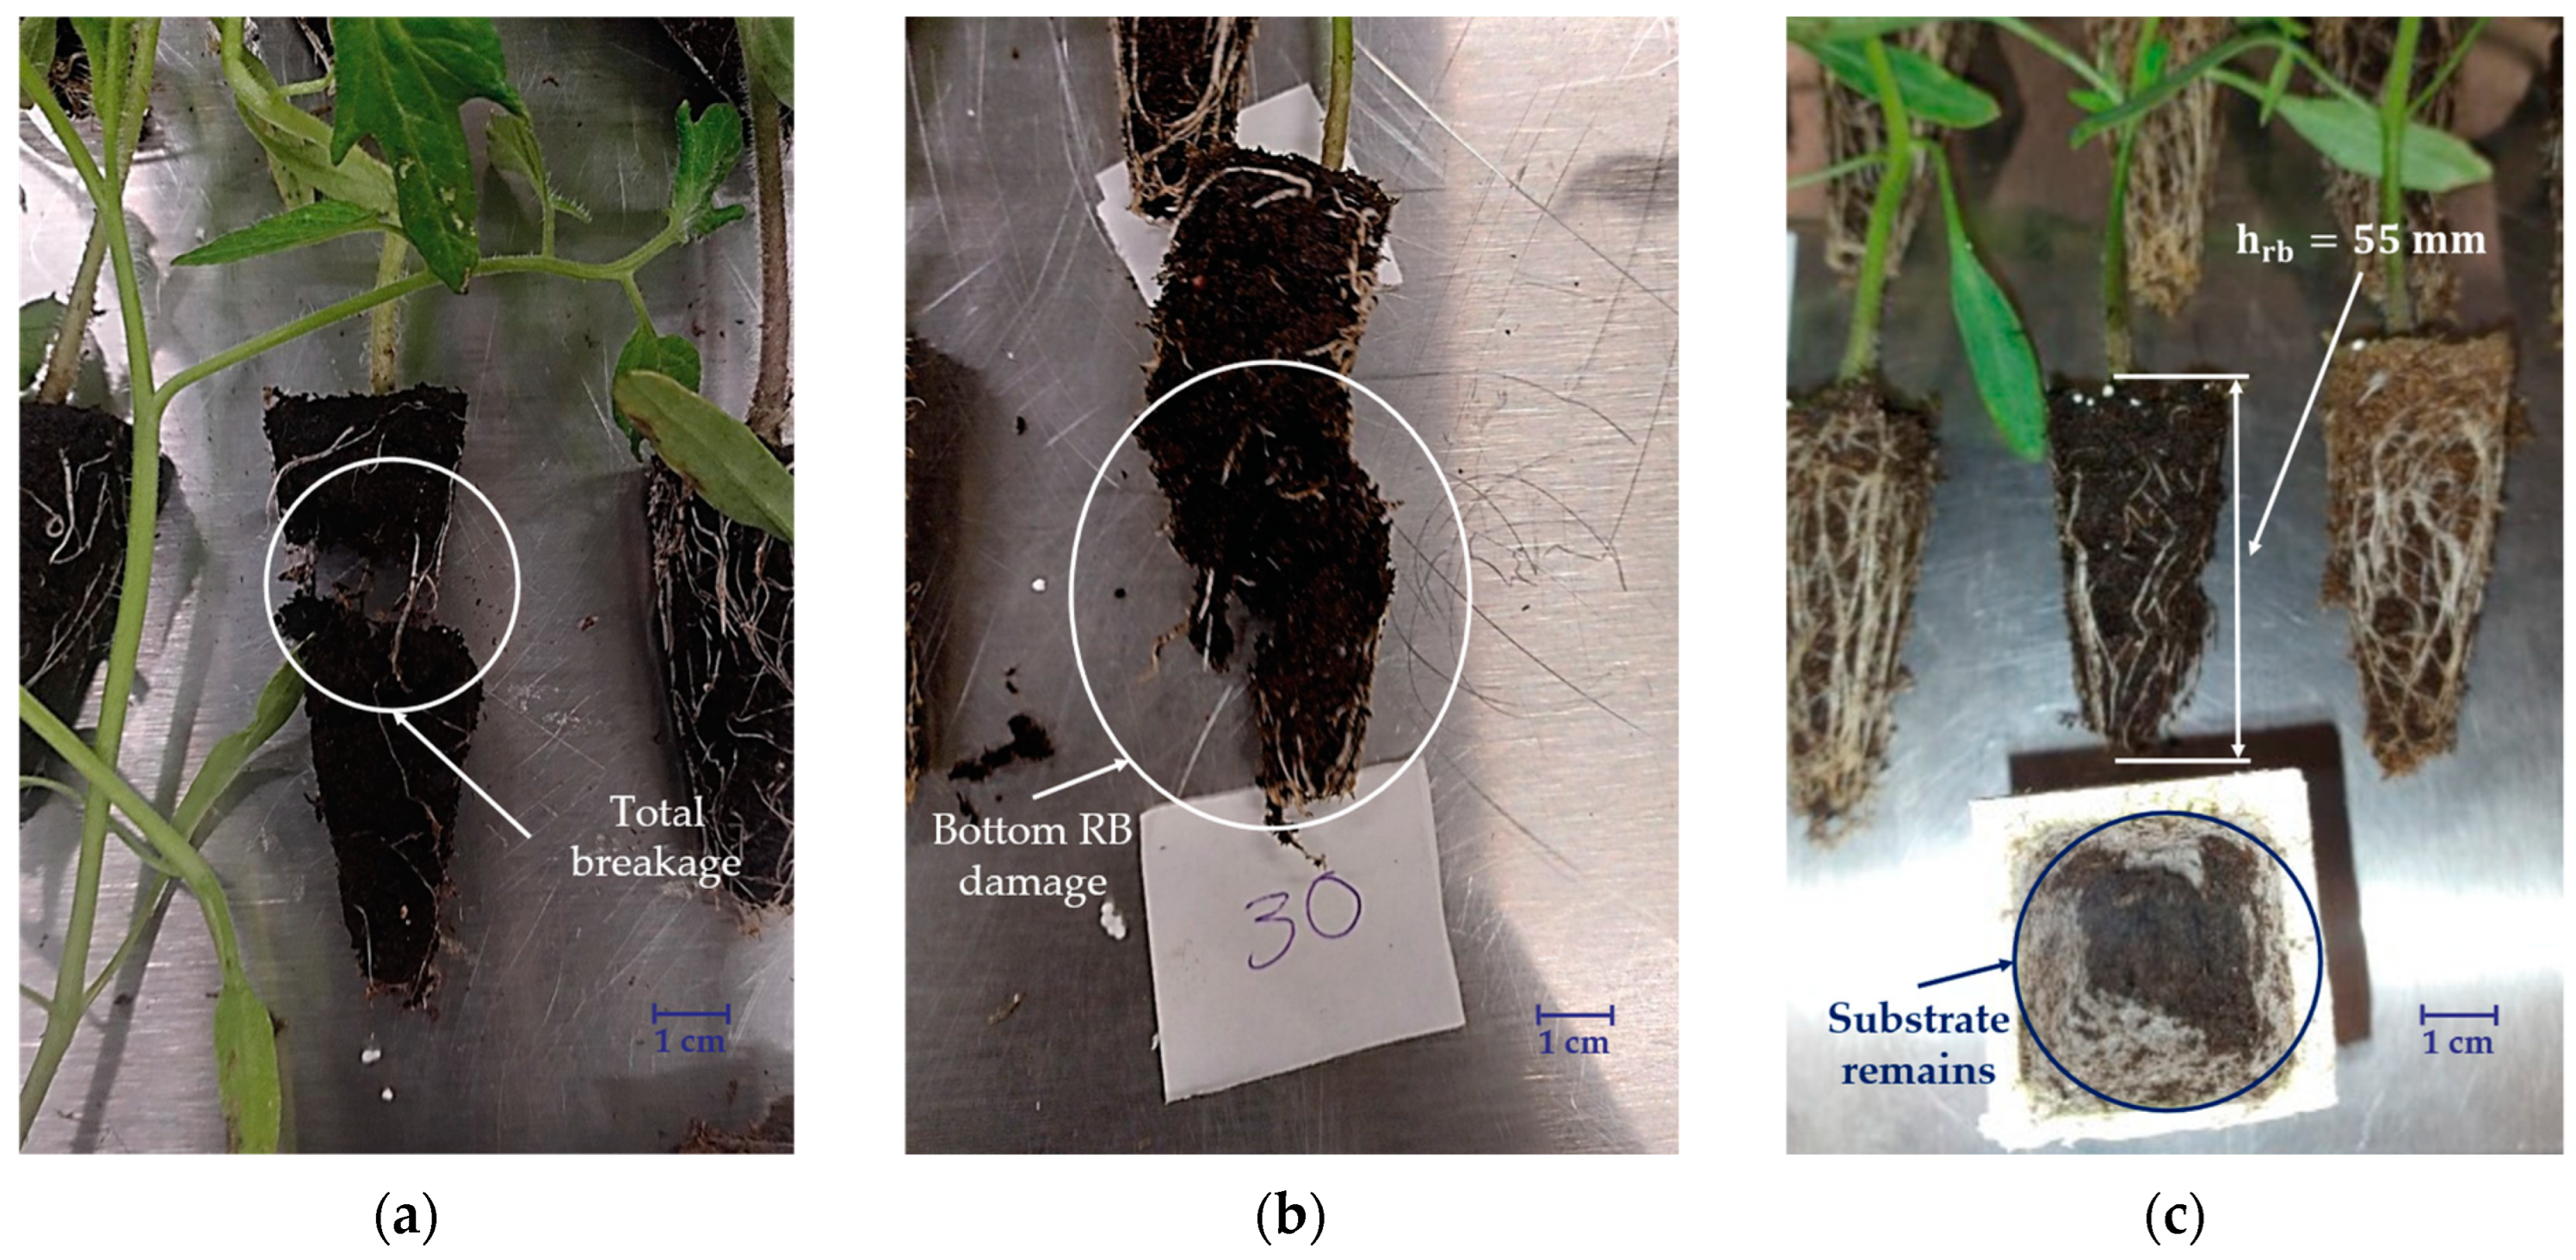
A device was designed and manufactured to determine the static friction coefficient (SFC) (Figure 5a) based on the designs proposed by authors of refs [26,27]. The device has a resolution of 0.25°. For SFC determination, a total of 600 seedlings were randomly selected, with 200 of each hybrid. Fifty repetitions were performed for each of the interchangeable surfaces, which showed different roughness values ( R a ), measured using a Mitutoyo SJ-201 roughness tester (Mitutoyo, Tacoma, DC, USA): plywood ( R a P = 3.11 ± 0.34   μ m ), plastic ( R a P l = 3.06 ± 0.23   μ m ), commercial neoprene (SBR) ( R a S B R = 1.66 ± 0.33   μ m ), and a galvanized steel sheet (GSS) ( R a G S S = 0.35 ± 0.13   μ m ). Equation (3) was used to calculate SFC [28].
S F C = t a n θ s
where θ s is the inclination angle when seedlings begin to slide over the material ° .

2.3.4. Drop Test

Drop tests (DT) were conducted by dropping tomato seedlings from heights of h 1 = 250 and h2 = 500 mm (Figure 5b) to assess potential mechanical damage during handling in the transplanting process on GSS. After each test, the residual substrate remaining on the surface was weighed. A total of 300 seedlings were randomly selected, 100 of each hybrid. Fifty repetitions were performed for each height.

2.4. Statistical Analysis

A completely randomized design was employed in the experiment. For each test conducted (except for SFC and DT), 50 experimental units (seedlings) were randomly selected per hybrid. The sample size of 50 seedlings per hybrid was determined through a priori power analysis, assuming an effect size (Cohen’s f = 0.26), a statistical power of 81%, and a significance level of 0.05. An analysis of variance (ANOVA) was conducted, followed by a mean comparison using the Tukey test to determine the statistical significance of the results. The selection of the best multiple linear regression model was based on the Bayesian Information Criterion (BIC) and the adjusted coefficient of determination ( R a 2 ). Additionally, the results of the sum of squares error, p-value, and variance inflation factors (VIF) were considered as complementary criteria. Data analysis and presentation were carried out using RStudio 2024.09.1 statistical software.

3. Results

3.1. Physical Characteristics

3.1.1. Number of Leaves, Total Height, and Canopy

The average number of compound leaves per seedling was 4.26, 4.08, and 3.96 for H1, H2, and H3, respectively. The minimum and maximum number of compound leaves were the same for all three hybrids, ranging between 3 and 5.
The seedling h t is shown in Table 1. It was observed that the foliage accounted for the majority of this height, representing 77.13%, 81.22%, and 74.67% of the total for H1, H2, and H3, respectively. Notably, H2 had an average h t 16.42% greater than H1 and 29.09% greater than H3, despite all hybrids being of the same age.
The dimensions of the seedling canopy are also presented in Table 1. No significant differences were observed between H1 and H3, whereas H2 had a significantly larger canopy in all three axes. Compared to the other two hybrids, the canopy of H2 was 16.58% wider along the X-axis, 12.82% in the Y-axis, and 14.6% in the Z-axis.

3.1.2. Stem and Root Ball Dimensions

The general RB dimensions are shown in Table 2. H r b showed no significant differences among the three hybrids, as the cavities used for growing were identical, and irrigation and seedling management were carefully controlled to prevent RB deterioration. However, two distinct groups were observed regarding b m a and b m i dimensions: Group 1 (H2) had the highest values for both b m a and b m i , while Group 2 (H1 and H3) had lower values.
Table 2 also shows h s and d s of the seedling stem. H1 stood out among the three hybrids, although H2 had a higher h t . However, h s of H2 showed no significant statistical differences compared to H3. Regarding d s , H2 and H3 had statistically similar values, while H1 had smaller d s values.

3.1.3. Mass and Moisture Content

Table 3 shows the average w t of the seedlings and MC of the evaluated hybrids. Although H1 and H2 differ in h t , with H2 being taller, statistical analyses indicate that their w t values are similar. This is because H1 has a higher average MC in RB. In fact, the MC in the RB accounted for more than 70% of w t of the seedlings, with H1 exhibiting the highest percentage, reaching 82.75% of w t .
The average MC in the total foliage of the seedlings ranged from 91.59% to 93.39%, while in the entirety of the seedlings, it varied between 79.34% and 80.21% across the three hybrids. H3 exhibited the highest MC percentage in stems. In contrast, the MC in the remaining foliage was statistically similar to that of H2.

3.1.4. Center of Mass and Oscillation Period

The results for d e , d p , and T of seedlings for the three hybrids are shown in Table 4. H2 had the highest values for d e , d p , and T, compared to the other hybrids, these differences were statistically significant. In contrast, H3 showed the lowest values for these variables, which can be attributed to the fact that their seedlings had lower h t and w t .
The multiple linear regression model constructed to estimate the center of mass (CM) of tomato seedlings is presented in Equation (4).
Y i = β 0 + β 1 X i 1 + β 2 X i 2 + β 3 X i 3 + β 4 X i 4 + β 5 X i 5 + β 6 X i 6 + β 7 X i 7 + β 8 X i 8 + β 9 X i 9 + β 10 X i 10 + β 11 X i 11
where Y i is the distance d e in m m , β 0 is the intercept, β 1 β 11 are the coefficients of the estimators, X i 1 is the total height of the seedlings ( h t ) in m m , X i 2 is the stem height ( h s ) in m m , X i 3 is the stem diameter ( d s ) in m m , X i 4 is the RB height ( h r b ) in m m , X i 5 is the RB major base ( b m a ) in m m , X i 6 is the RB minor base ( b m i ) in m m , X i 7 is the RB weight in g , X i 8 is the seedling canopy in the X-axis in mm, X i 9 is the seedling canopy in the Y-axis in m m , X i 10 is the seedling canopy in the Z-axis in m m , and X i 11 is the percentage of moisture content (MC) in total foliage.
The selection of the optimal multiple linear regression model, based on Equation (4), was carried out using the BIC criterion and R a 2 . The results of this analysis are shown in Figure 6. The details from the ANOVA and VIF analysis for the best-fitting model are presented in Table 5. The selected multiple linear regression model was the one that achieved R a 2 = 0.83 , with all estimators being statistically significant (p-value < 0.0375 – 2.2 × 10⁻¹⁶), RMSE = 4.73 and diagnostics are presented in Figure 7 The Equation (5) corresponds to the best model obtained.
Y i = 84.6128 + 0.1497 X 1 + 9.9924 X 3 + 0.2512 X 4 2.5576 X 7 + 0.0541 X 8 0.9789 X 11
where Y i is the distance d e in m m , X 1 is the total height of the seedlings ( h t ) in m m , X 3 is the stem diameter ( d s ) in m m , X 4 is the RB height ( h r b ) in m m , X 7 is the RB weight in g , X 8 is the seedling canopy in the X-axis in m m , and X i 11 is the percentage of moisture content (MC) in total foliage.
Based on the results obtained from the BIC and R a 2 , the variables included in Equation (5) were identified as the most representative for estimating seedling CM. This selection simplifies the multiple linear regression model, making it more interpretable and improving the understanding of how these variables affect CM. In addition to improving interpretability and reducing multicollinearity (by ensuring that the included variables are linearly independent) the selection process also helps prevent potential overfitting. By limiting the number of predictors to those that significantly contribute to the model’s explanatory power, we reduce the risk of tailoring the model too closely to the sample data, thereby enhancing its generalizability to new observations. This balance between complexity and predictive performance was a key consideration in finalizing the model.

3.2. Mechanical Tests

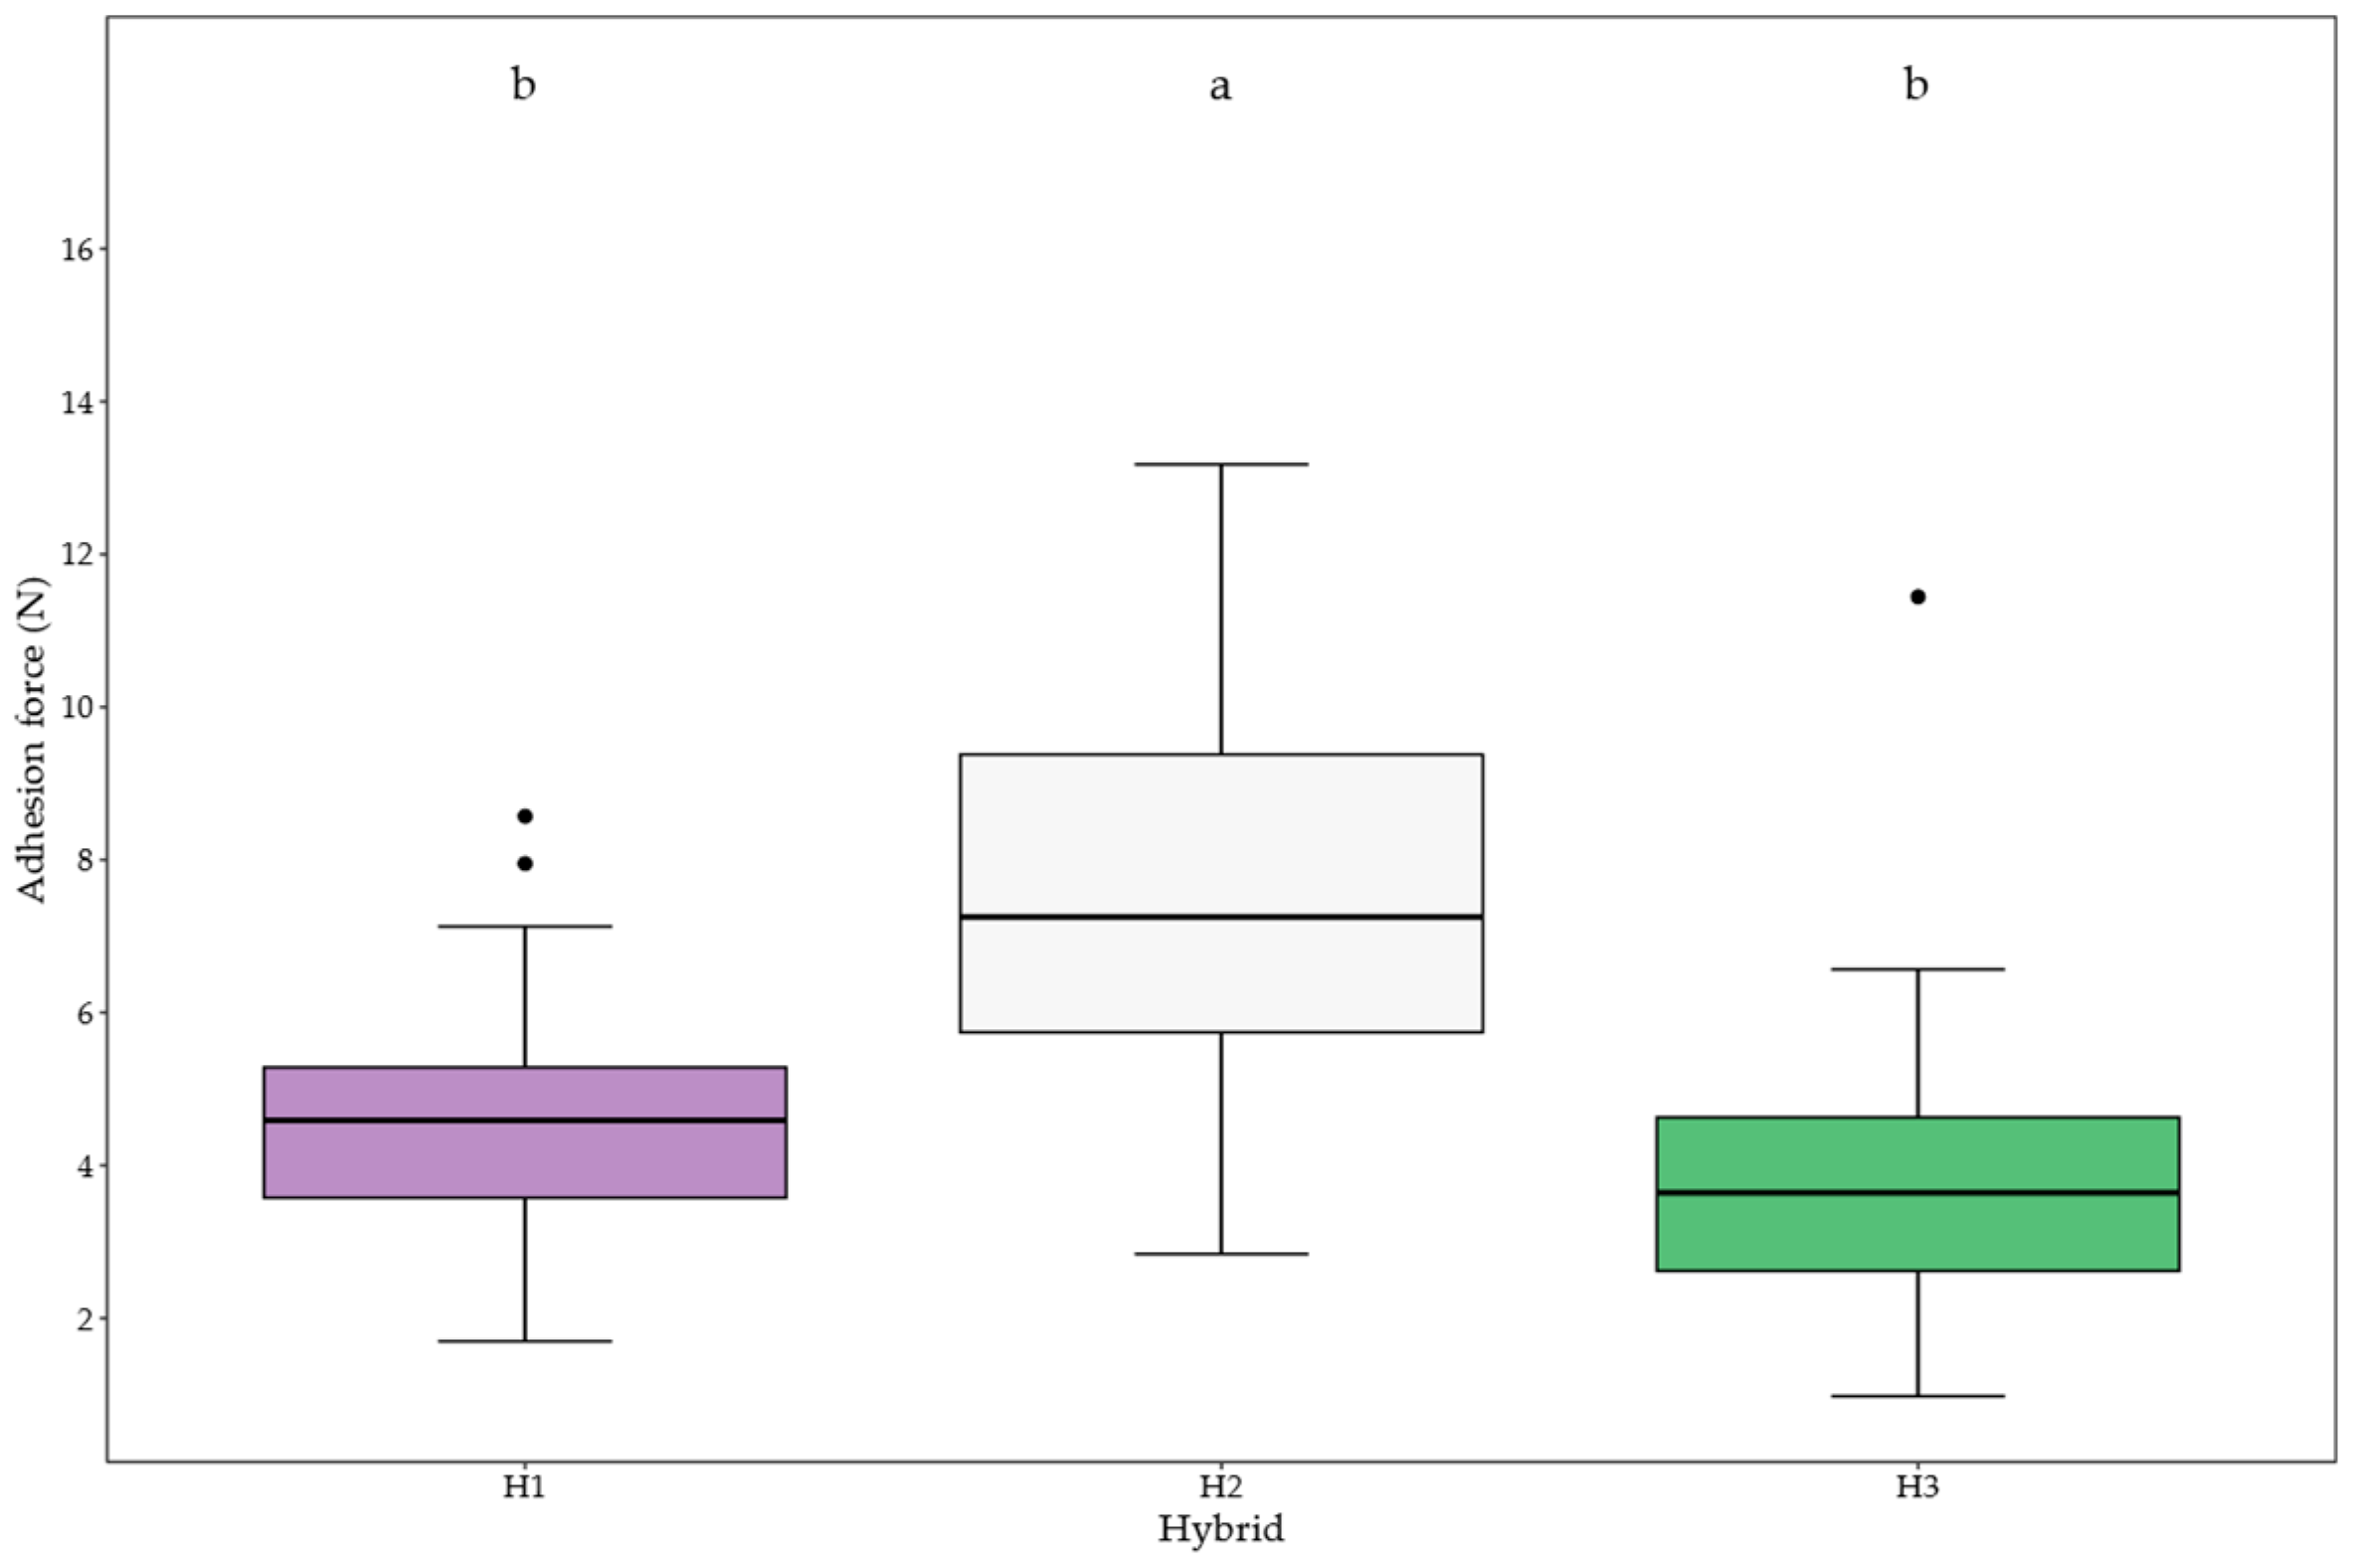
3.2.1. Adhesion Force

Figure 8 presents the mean AF required to extract the seedlings from the germination trays for the three tomato hybrids evaluated. The lowest AF values recorded were 1.698 N for H1, 2.841 N for H2, and 0.978 N for H3. Conversely, the highest values reached 8.571 N, 13.178 N, and 11.443 N for H1, H2, and H3, respectively.
Figure 9 illustrates the types of damage observed during the AF test. Out of the 150 seedlings evaluated, 2% exhibited some form of damage across all three hybrids. Figure 9a shows damage caused by the RB breaking in half. Figure 9b displays damage resulting from an inadequate distribution of the substrate within the RB cavity, which adversely affected proper seedling development. Lastly, Figure 9c depicts a seedling that, despite being the same chronological age as the others, exhibited below-average dimensions and an underdeveloped root system, which failed to fully occupy and stabilize the substrate within the cavity.

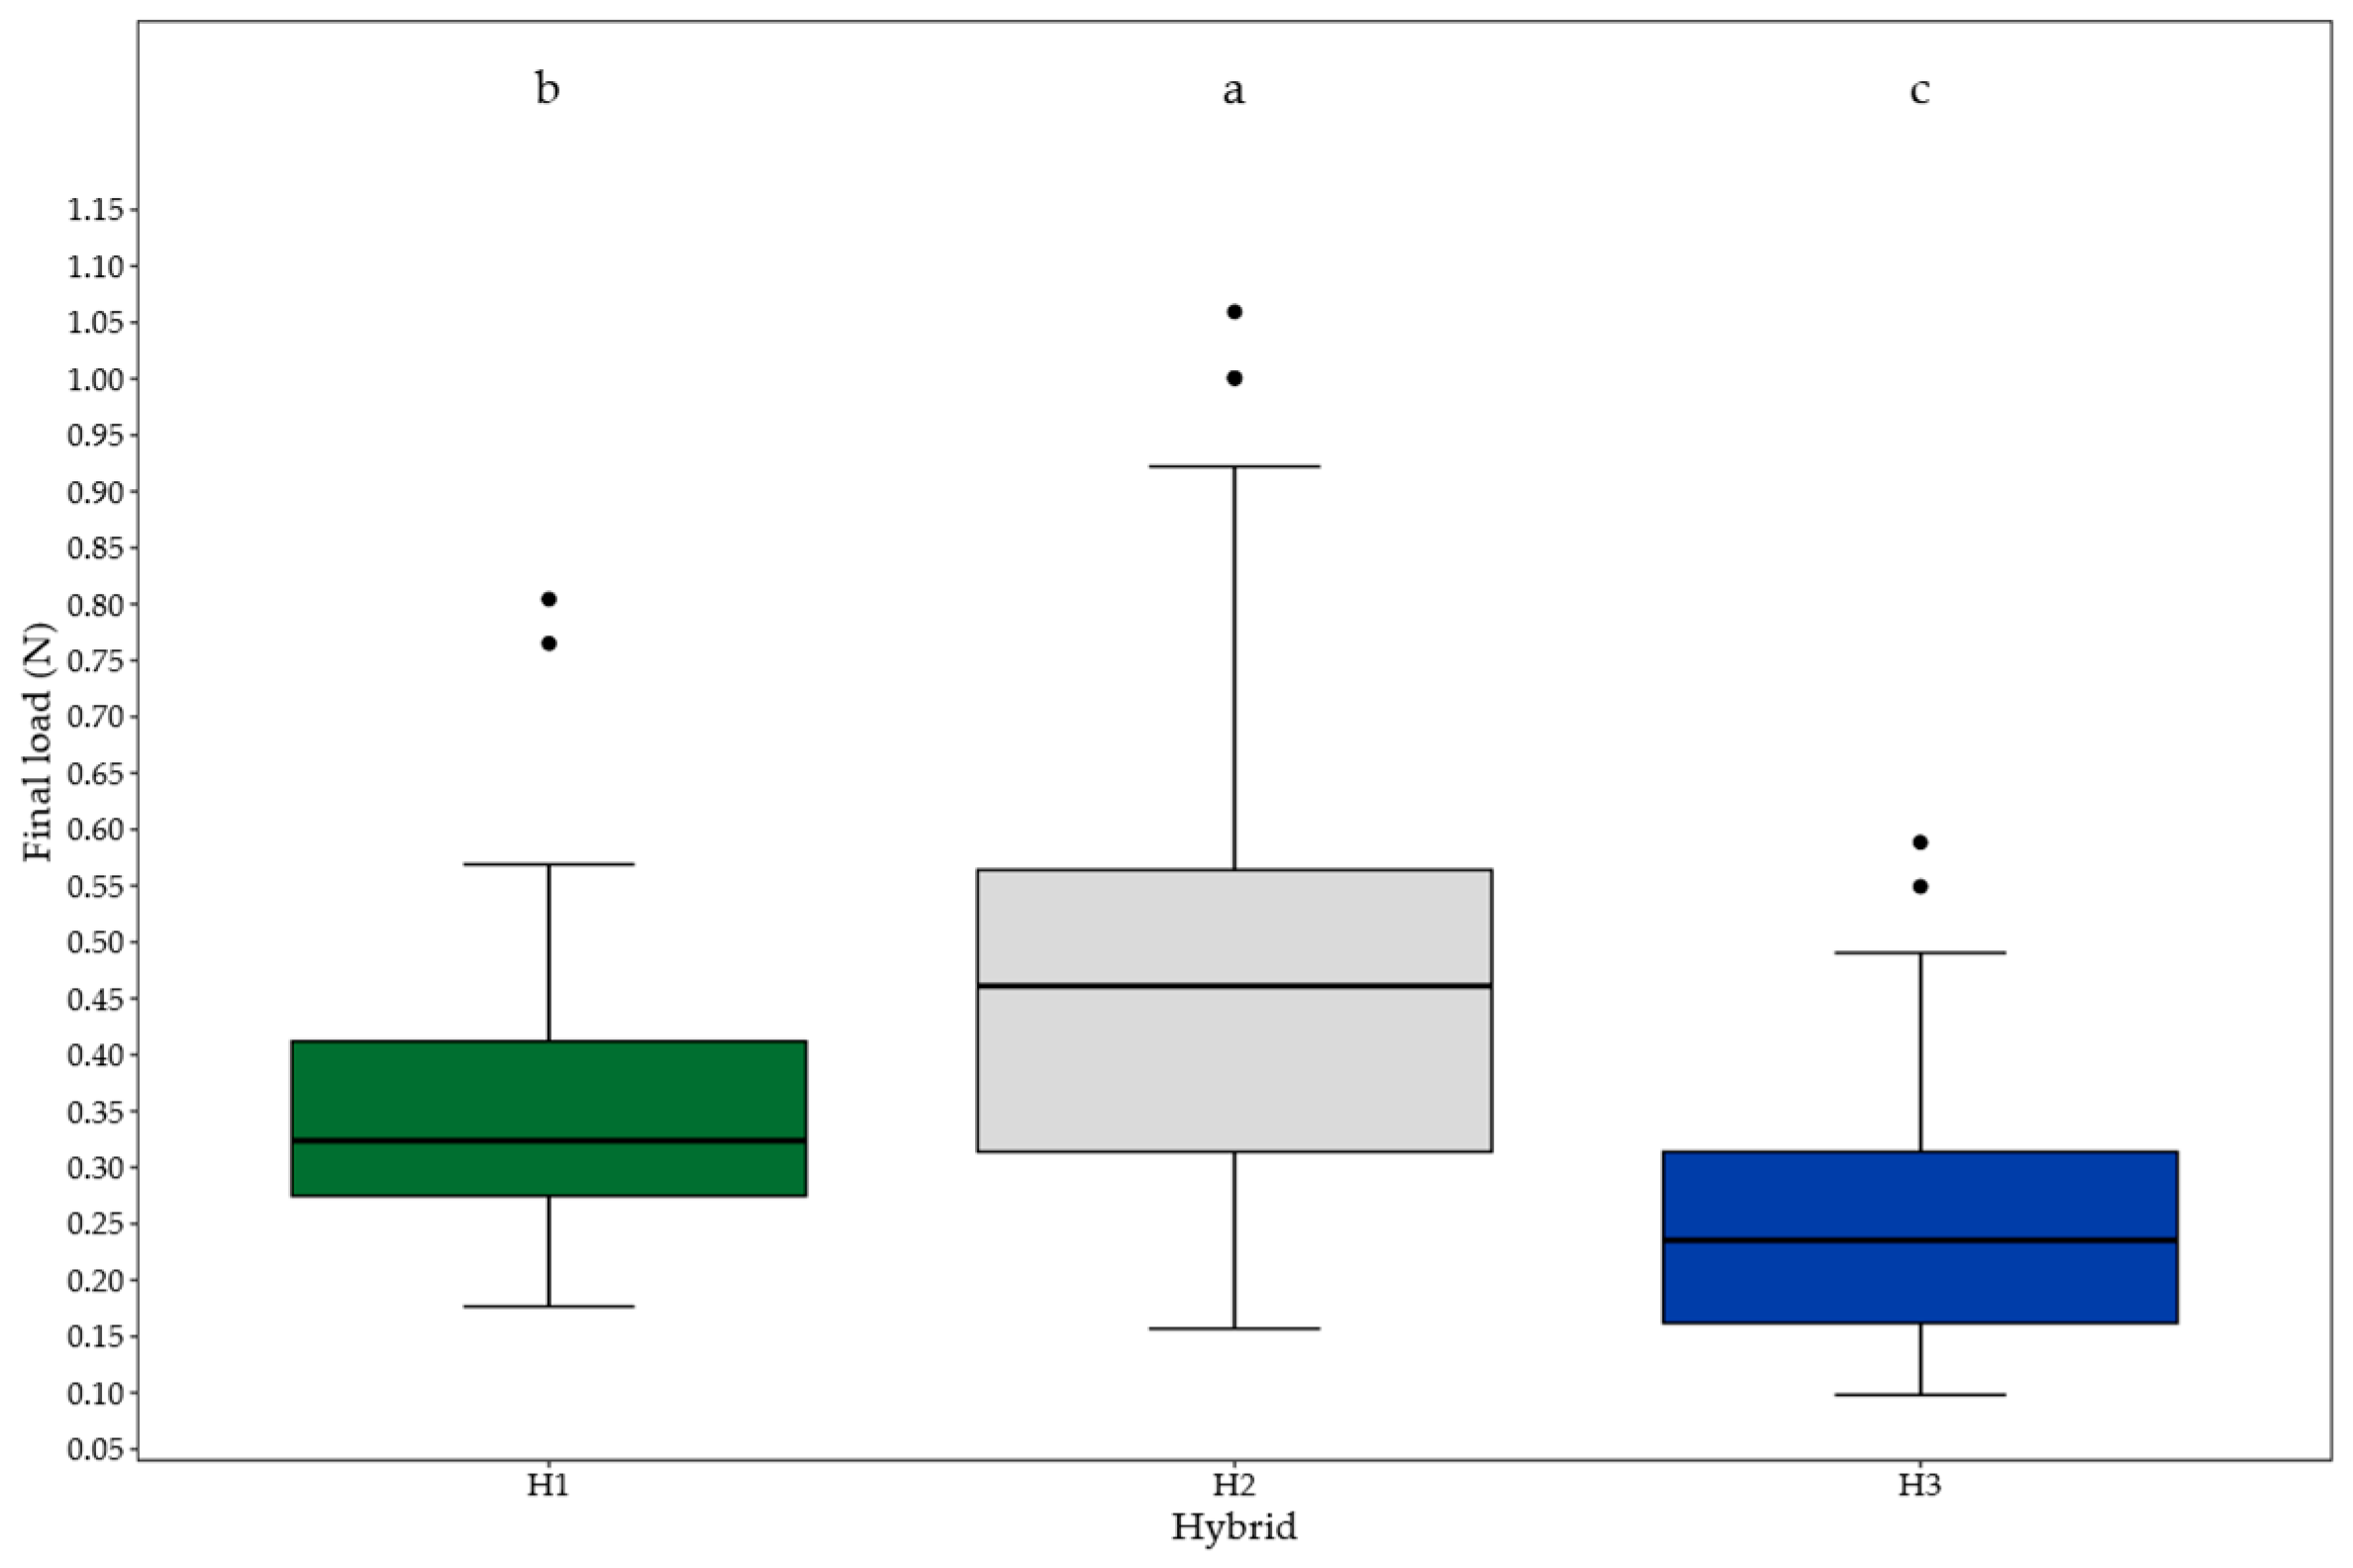
3.2.2. Root Ball Punching Force

The results of the RBPF test are shown in Figure 10. Regarding the minimum final load values, the following results were obtained: 0.18 N for H1, 0.16 N for H2, and 0.10 N for H3. On the other hand, atypical maximum values were recorded: 0.80 N for H1, 1.06 N for H2, and 0.59 N for H3.

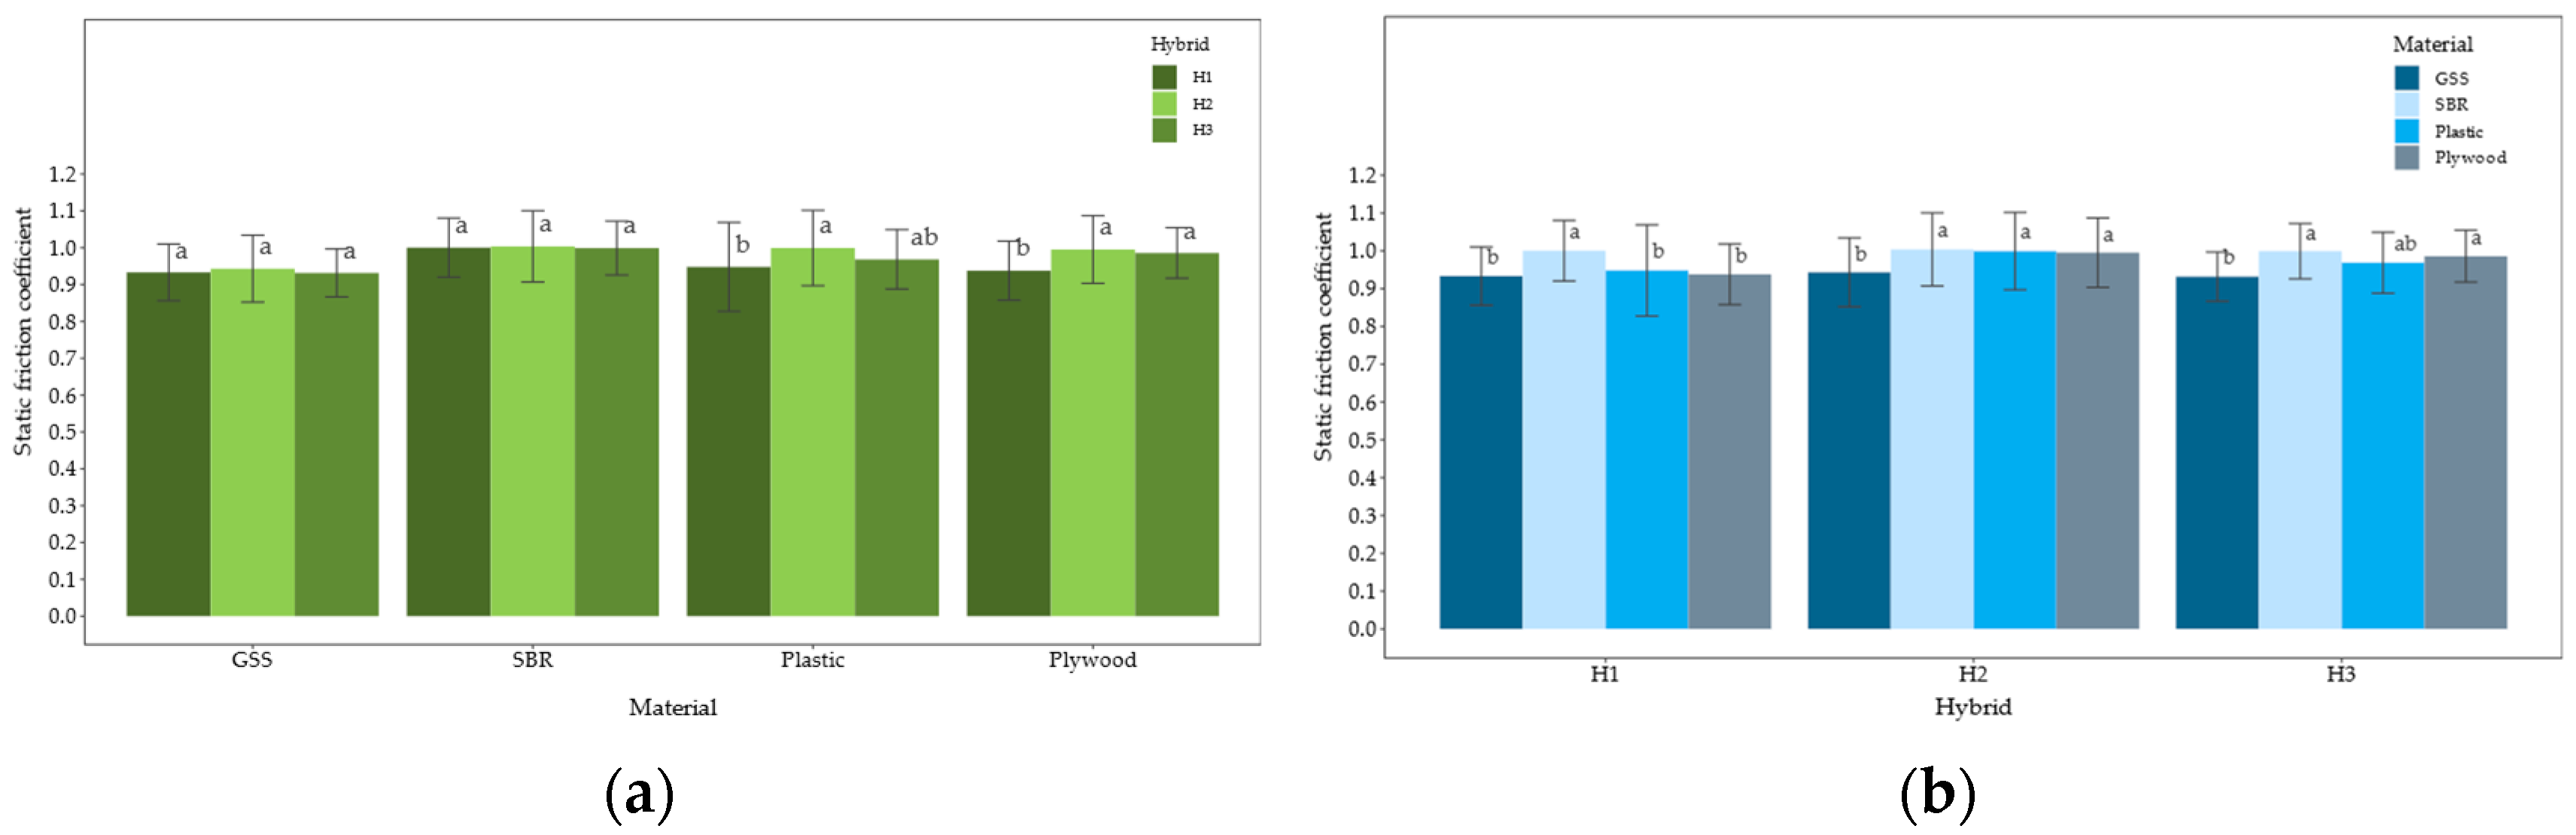
3.2.3. Static Friction Coefficient
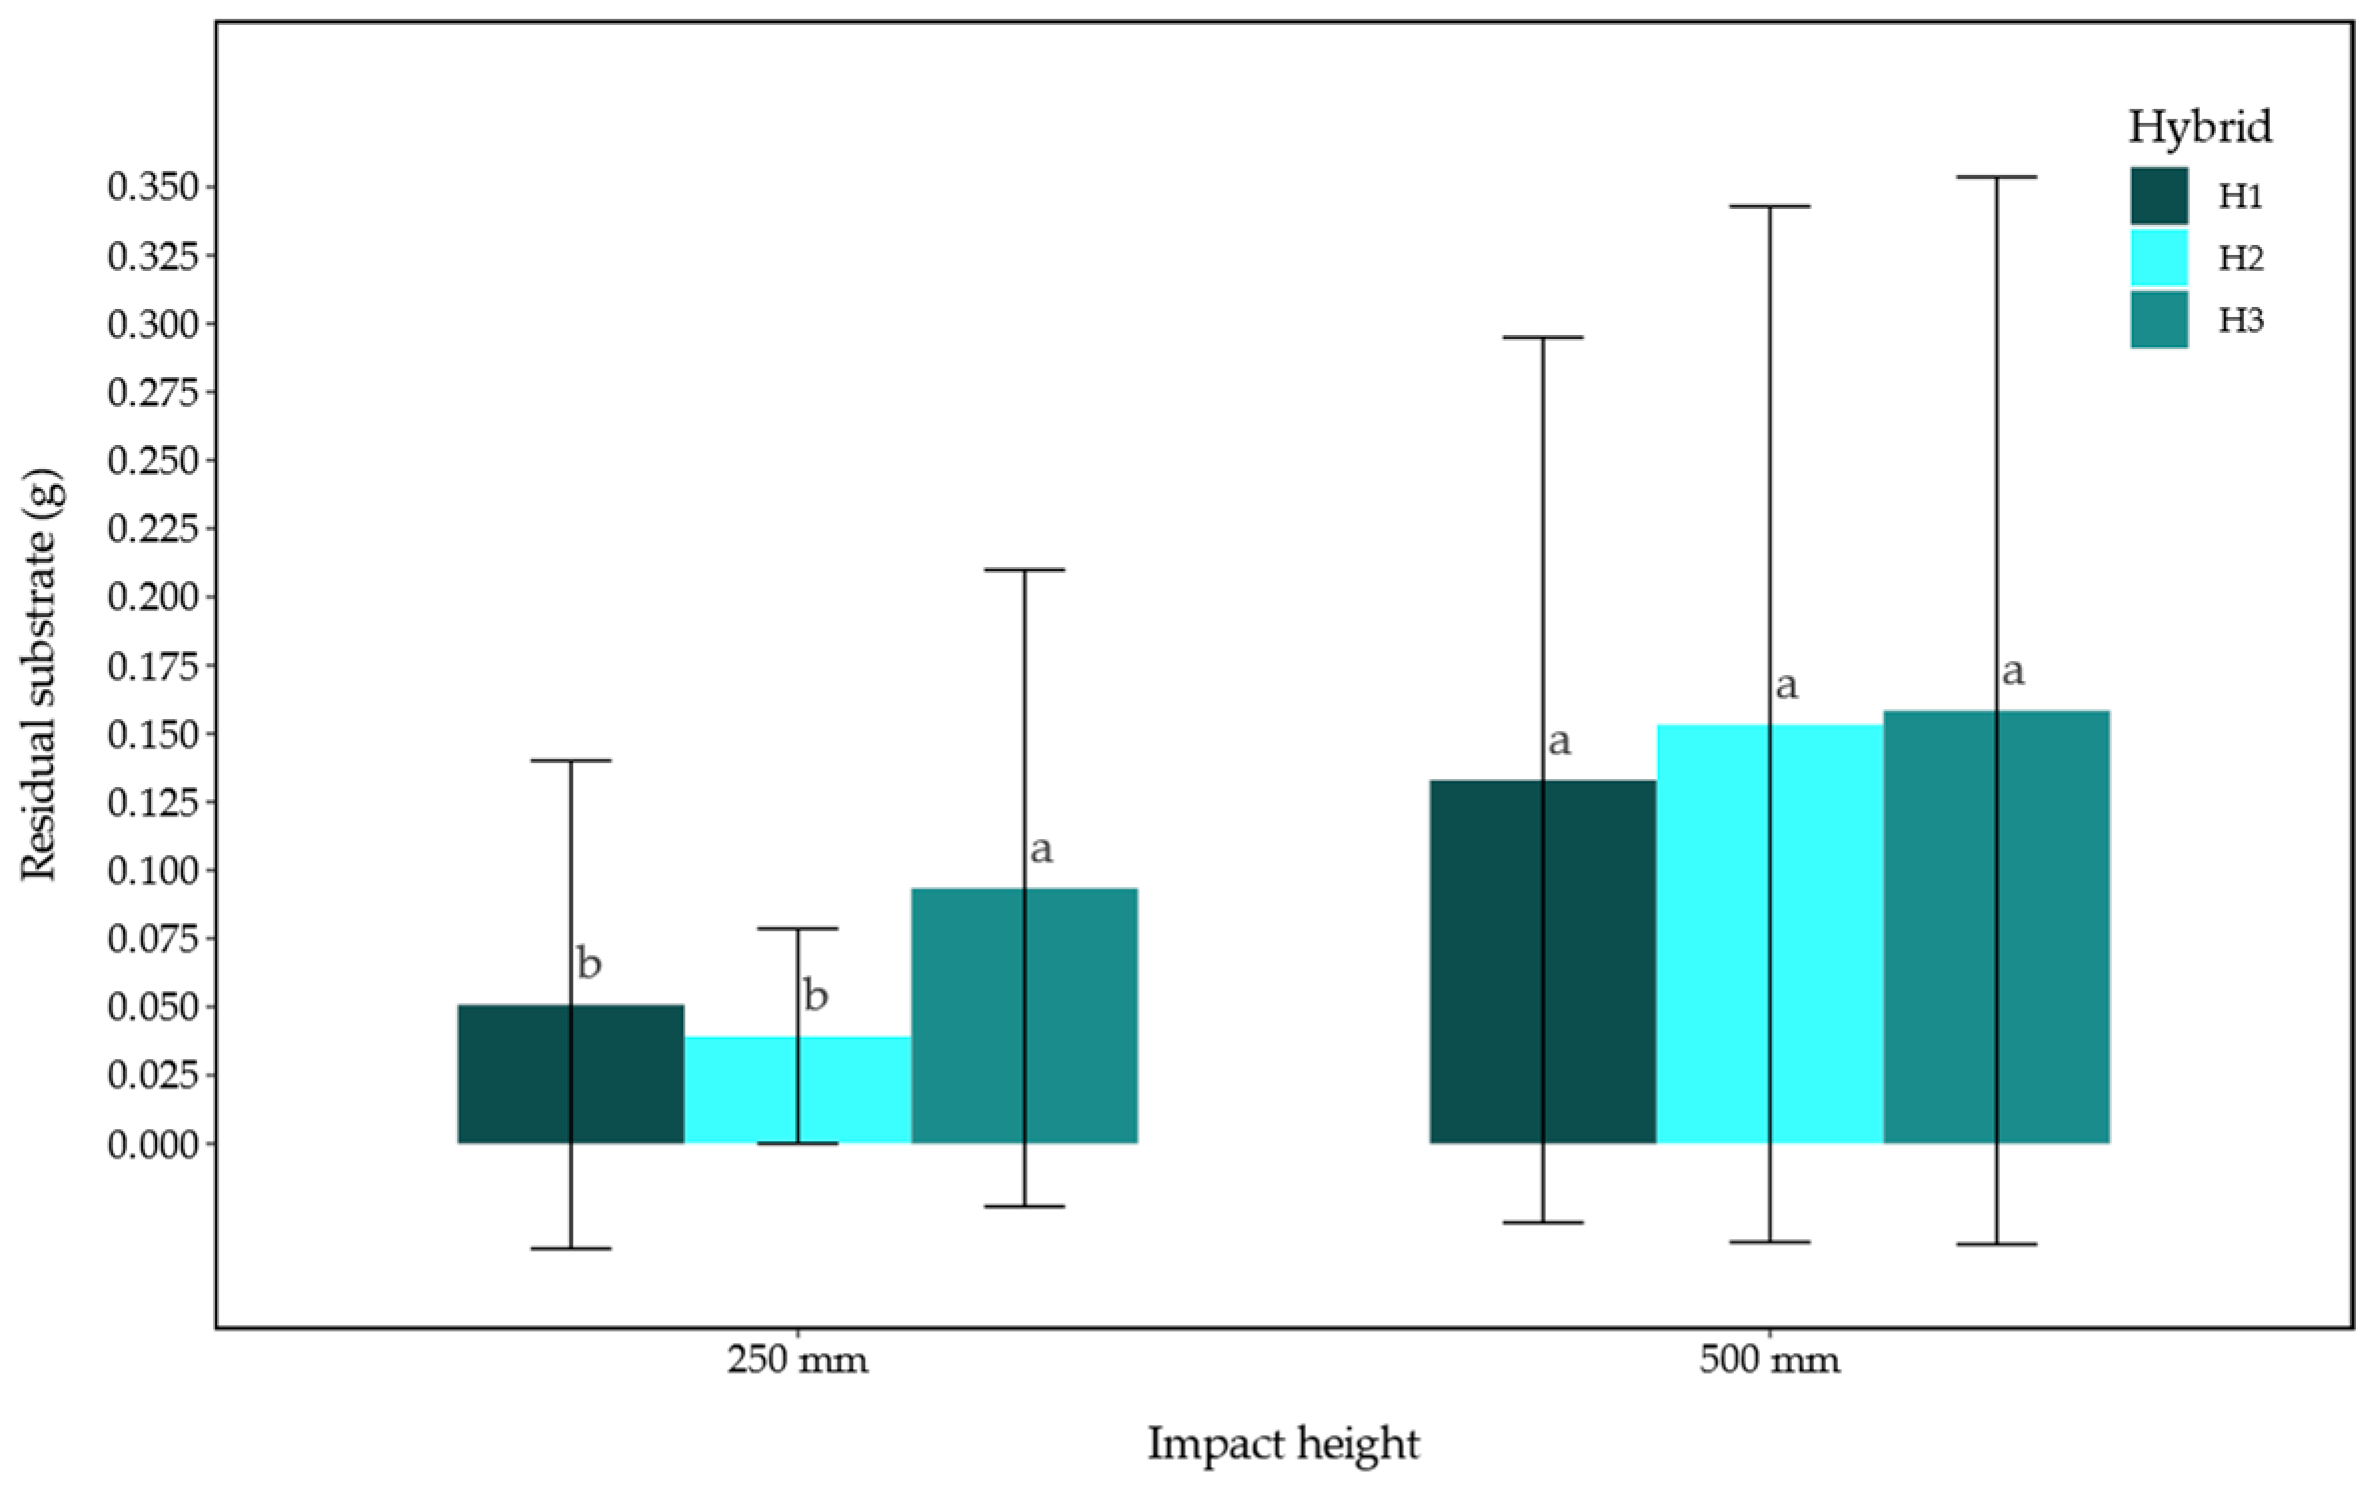
Figure 11 shows the static friction coefficient (SFC) results for seedlings of the three hybrids on four different materials. No significant difference (p < 0.725 and p < 0.959) was observed in the SFC among the three hybrids on GSS and SBR. However, a significant difference (p-value < 0.0455 * y p-value < 0.000964 ***), was recorded in the SFC between H1 and H2 on the plastic surface and plywood (Figure 11a).
On the other hand, Figure 11b shows the SFC results for each material and each hybrid. In the case of SBR, the highest static friction coefficients were recorded, with values ranging from 1.25 to 1.27 for the three hybrids.

3.2.4. Drop Test

Figure 12 shows the results of the residual substrate remaining on the GSS during the seedling DT. In this test, conducted from a height of 250 mm, the minimum residual substrate values were 0.0, 0.01, and 0.01 g for H1, H2, and H3, respectively. In contrast, the maximum residual substrate values were 0.45, 0.21, and 0.56 g for H1, H2, and H3, respectively.
When the test was conducted from a height of 500 mm, the minimum residual substrate values were 0.01, 0.02, and 0.01 g for H1, H2, and H3, respectively, while the maximum residual substrate values were 0.80, 0.75, and 0.98 g for H1, H2, and H3, respectively. The maximum residual substrate values at 500 mm accounted for 8.22%, 8.60%, and 11.96% of the average RB weight for H1, H2, and H3, respectively.
On the other hand, mechanical damage was considered when the RB of the seedling was deformed by more than 50% of its h r b and when there was detachment of the substrate from the root system. At a height of 250 mm, no significant damage was observed in the seedlings. However, at a height of 500 mm, damage was recorded in the seedlings of all three evaluated hybrids: seven from H1, nine from H2, and nine from H3.

4. Discussion

4.1. Physical Characteristics

4.1.1. Number of Leaves, Total Height and Canopy

It was observed that h t and the canopy dimension along the X-axis of the seedling varied depending on the location of its cavity in the germination tray. Seedlings located on the edges had a larger canopy in relation to h t , while seedlings in the center showed a higher h t with a smaller canopy. This phenomenon showed the edge effect among the seedlings, indicating competition for space. Gallegos-Cedillo et al. [29] and Xu et al. [30] documented the occurrence of edge effects in multicell tray propagation systems, attributing growth variability to the distinct microenvironment experienced by seedlings in peripheral cavities—characterized by increased light exposure, enhanced aeration, and reduced lateral competition. Notably, seedlings located at the edges tend to develop a broader canopy with relatively shorter height, whereas those positioned centrally often exhibit greater stem elongation, possibly as an adaptive response to shading and higher competition for light [31,32,33]. Although statistical stratification based on cavity position was not conducted in the present work, the growth patterns observed are aligned with those reported in the literature, thereby providing a solid theoretical foundation to acknowledge edge effects as a relevant factor influencing early seedling morphology.
Given this variability, it is essential to know the minimum and maximum canopy dimensions when designing a transplanter. This information is crucial for developing the holding mechanisms and other prototype components needed to handle the seedlings during transplantation without compromising their physical integrity. Special attention must be given to the leaves, as they extend around the main body of the seedling, and sufficient clearance is required to prevent damage. Injuring the leaves can increase post-transplant stress, delaying the seedling’s adaptation and growth.

4.1.2. Stem and Root Ball Dimensions

The root balls of the seedlings showed a tendency to crumble when extracted from germination trays. This behavior is influenced by several factors, including the percentage and properties of the substrate components, the degree of compaction of the substrate, the development of the root system, and the MC. The composition of the substrate primarily influences the mechanical properties of the RB during seedling extraction, handling, and transplanting. The specific components and their proportions in RB vary depending on the substrate selected, for instance, in the substrate formulation of 80% peat moss, 10% agrolite, and 10% vermiculite. Peat moss contributes to the substrate’s water retention capacity. Agrolite improves aeration and drainage, which can reduce compaction and enhance root development. Vermiculite is known for its moisture retention properties. Together, these components interact to influence the RB’s integrity, affecting its performance during transplanting. Therefore, the different substrates can alter water retention, aeration, and root growth dynamics.
On the other hand, the average diameter obtained for H2 and H3 is similar to that reported by Abubakar et al. [15] for the Roma VF variety. In contrast, the authors of refs [16] and [14] reported significantly lower average diameters of 2.65 mm for the Hinsona variety and 2.64 mm for the Ansal hybrid, respectively.

4.1.3. Weight and Moisture Content

Several studies reported w t values higher than those found in this study. For example, Khadatkar et al. [12] and Magar et al. [14] reported average w t values of 13.1 g and 14.41 g for the Abhilash tomato variety and the Ansal hybrid, respectively. In contrast, other authors, such as Abubakar et al. [15] and Sharma et al. [16], reported lower w t values, with 6.28 g and 10.47 g, respectively.
Regarding MC, Magar et al. [14] found that the root balls and complete seedlings studied had a higher average MC, with values of 83.89% and 84.26%, respectively. This higher MC in the root balls could be related to the time and volume of water used for irrigation before the experiment. To optimize irrigation and ensure uniform water distribution in each cavity, the implementation of an irrigator is suggested to guarantee that the substrates are fully moist, as recommended by Maynard et al. [34].

4.1.4. Center of Mass and Oscillation Period

In this study, a significant difference was observed in the center of mass (CM) location among hybrids, determined through d e . This difference is closely related to two main factors: h t of the seedling and RB weight. The RB weight, in turn, directly depends on its MC: the higher the MC, the greater the RB weight, which affects the location of the seedling’s CM. However, the multiple linear regression model used in this study also considered other important variables to estimate the CM.
Oscillation tests on seedlings have been conducted, with Muñoz et al. [25] reporting results similar to those of this study, with a T of 0.86 s for purple cabbage and 0.94 s for Physalis philadelphica. It was found that d p and T of the seedlings are strongly correlated: the greater the d p , the longer the T. This period is also influenced by the w t and h t of the seedlings, highlighting the interrelationship between these variables in the dynamic behavior of seedlings.

4.2. Mechanical Tests

4.2.1. Adhesion Force

AF obtained in this study was higher than that reported by other authors in previous research. For example, Han et al. [35] had an AF of 2.19 N for 38-day-old tomato seedlings; the author of ref. [14] reported an AF of 1.43 N for 30-day-old tomato seedlings; Jin et al. [36] recorded an AF of 2.7 N for 40-day-old tomato seedlings; and Han et al. [37] evaluated seedlings of other species, with AF values of 1.89 N for cucumber, 2.06 N for bell pepper, and 1.87 N for cauliflower seedlings. The higher AF values observed in this study, compared to those reported by previous authors, may be attributed to differences in substrate composition, the physical properties of the seedlings, and the tray materials used. While previous studies employed plastic germination trays, this investigation utilized polystyrene trays, which exhibit distinct physical–mechanical characteristics such as density, surface roughness, and thermal conductivity—factors that can significantly influence fermentation dynamics and microbial development. Additionally, the physical attributes of the root plug—including its moisture content, age, root system architecture, and substrate composition—can alter its internal structure and mechanical resistance, thereby directly impacting AF outcomes. A thorough characterization of these factors is essential to elucidate the mechanisms underlying the differences in AF values across studies.
However, some studies report results similar to those in this study. For instance, Ji et al. [38] reported an average AF of 5.724 N for 30-day-old tomato seedlings. According to Jiang et al. [39], AF involves variables such as MC of the substrate, components of substrate used for RB, and root system development of seedlings. Additionally, the material of the germination tray could also influence the AF. In this study, Styrofoam germination trays were used, with cavities that are not completely smooth, unlike plastic germination tray cavities. With these types of trays, seedlings with more developed root systems had higher AF values than the average.
The damage to the root balls was minimal, affecting only three seedlings, even though no prior treatment had been applied. It is important to highlight that, as a common practice, trays are usually tapped at the bottom to facilitate seedling extraction; however, in this case, it was not necessary to loosen them.

4.2.2. Root Ball Punching Force

H2 stood out in the study, followed by H1, and in third place, H3. This could be attributed to the fact that H2 seedlings showed greater h t compared to the other hybrids, which promoted a more robust development of the root system. This root system requires a higher RBPF to penetrate the RB during these tests.
A key factor influencing the variation in RBPF is the MC and the extent of root system development within the RB of each hybrid’s seedlings, as these parameters significantly affect RBPF values. Surpassing the RBPF thresholds illustrated in Figure 10 may lead to seedling damage, particularly to the root structure. This risk is notably affected by the drainage hole diameter (5 mm) in the germination tray cavities; consequently, the ejector’s diameter must not exceed this size, as doing so could impair the tray’s drainage system. It is recommended that the ejector be constructed from a deformable material capable of absorbing part of the impact force, thereby preserving RB integrity and minimizing mechanical damage to the seedlings.
The ejector rod’s design plays a critical role in mitigating RB damage. As emphasized by Chen et al. [40], an effective ejector rod design incorporates a rounded geometry, appropriate diameter, and controlled movement speed to reduce injury during seedling extraction. These design considerations contribute to higher post-transplant survival rates and enhance seedling development by maintaining the integrity of the root system.
From a practical perspective, this study provides valuable insights into the design of transplanting machinery. Understanding the relationship between RBPF and RB characteristics supports the development of adjustable ejector systems tailored to varying seedling conditions. Such innovations have the potential to enhance the efficiency of transplanting operations and reduce seedling damage.
Future research should focus on the development of advanced extraction systems, considering the variables analyzed in this section. Such efforts will facilitate the creation of more efficient, reliable, and sustainable transplanting solutions, ultimately contributing to advancements in agricultural mechanization.

4.2.3. Static Friction Coefficient

Based on the results in Figure 11a, no significant differences in SFC were found between GSS and SBR materials, primarily due to the homogeneity of MC in the seedlings’ root balls and the surface properties of the evaluated materials. However, the variability of SFC in plastic and plywood (Figure 11a) can be attributed to the lack of uniformity in the MC of the root balls, which leads to uneven interaction with the surfaces. Additionally, the plywood surface showed irregularities, contrasting with the uniformity observed in GSS and SBR. On the other hand, as shown in Figure 11b, the higher SFC values in SBR material can be explained by the interaction of MC in the root balls, which enhances adhesion between the RB and the SBR surface. Meanwhile, GSS exhibited the lowest SFC among the four materials evaluated, which is advantageous for seedling sliding during mechanized handling and transplantation. A lower SFC reduces the resistance between the root plug and the contact surface, allowing seedlings to slide more readily under the influence of gravity or minimal external force. This, in turn, decreases the angle or mechanical input required to initiate movement, thereby improving operational efficiency, minimizing mechanical stress on the seedlings, and enabling more reliable and gentle transplantation procedures.
There are previous studies that reported SFC values with certain similarities and differences compared to those obtained in this research. For example, Khadatkar et al. [12] and Magar et al. [14] reported average SFC values of 0.79 and 0.73, respectively, for GSS. In contrast, the average SFC for GSS in this study was 0.94 for the three hybrids, showing consistency with the findings of Abubakar et al. [15], who reported an average SFC of 0.96 for GSS.

4.2.4. Drop Test

The results shown in Figure 12 reveal significant variability, which can be attributed to multiple factors. One of the main factors is the MC of root balls, which affects the consistency of the substrate as well as the development of the seedlings’ root systems. These factors contribute to the heterogeneity of the seedlings, both in their distribution within germination trays and in their natural variations. Moreover, the position of the seedlings within the tray also plays a role. Regarding the influence of drop height, it was observed that as the height increased, seedlings became more susceptible to mechanical damage to root balls. This damage was primarily caused by increased deformation of the RB upon impact with the collision surface, resulting in a larger impact area. This phenomenon aligns with the findings of Bai et al. [41], who reported that greater drop heights intensify contact with the collision surface, increasing the likelihood of damage. A total of 16.66% of the seedlings subjected to the drop test from height h2 exhibited measurable deformation in the dimensions of the RB. In this study, mechanical damage was classified as unacceptable when deformation exceeded 50% of the RB’s original height ( h r b ), as such structural compromise prevents successful transplanting. Excessive deformation exposes the root system, leading to transplant shock and physiological stress in the seedling—effects comparable to those observed when the substrate becomes dislodged or fragmented.
In this study, which focused exclusively on the physical and mechanical properties of seedlings at 30 days of age from sowing, germination time was not specifically monitored or analyzed. However, we recognize that the germination phase plays a critical role in determining seedling vigor and subsequent uniformity. Therefore, it is necessary to conduct a complementary study to evaluate germination dynamics, including metrics such as germination rate, mean germination time, and synchronization, to better understand their influence on early morphological development and transplant performance. Variability in germination time affects the seedlings’ initial growth and is closely related to the sowing date, which is a critical factor due to Mexico’s marked seasonality.
Additionally, the location of the cavities in germination trays should be considered, as their physical properties may vary depending on their position, thereby influencing their mechanical properties. These differences can impact root development and affect the mechanical properties of the seedlings, highlighting the importance of proper management during the initial growth phase. Another key aspect is irrigation management. It is crucial to regulate the applied water layer and ensure uniform moisture distribution in the RB, regardless of the cavity’s position in the germination tray. These measures are essential for ensuring uniform seedling growth, promoting successful transplant adaptation, and optimizing agronomic performance in later stages.

5. Conclusions

Tomato seedlings are susceptible to mechanical damage during automatic transplanting, which can lead to economic losses. Therefore, analyzing and understanding their physical–mechanical properties is essential, as these properties determine their behavior under the forces applied during handling. Not only do these properties help predict the seedlings’ response to mechanical stress, but they also serve as key parameters for the design, construction, and evaluation of semi-automatic and automatic transplanters.
Physical properties of seedlings play a crucial role in the different developmental phases of an automatic transplanter. Among these, the overall dimensions of the seedling are essential for prototype design. The most relevant variables include h t , canopy dimensions, and stem dimensions, which vary depending on their position within the germination tray. In this study, H2 seedlings had the largest dimensions, followed by H1, and lastly, H3. Additionally, seedling’s w t showed a direct correlation with MC: as the MC of root balls decreased, w t of seedlings also decreased, because the foliage accounts for only 30% of w t . Furthermore, MC significantly influences the determination of RB weight, CM, stem diameter, distance d e , and the oscillation period (T) of seedlings, regardless of the hybrid analyzed.
Regarding mechanical properties, they were primarily influenced by MC, h t , the interaction between the seedling and the material type, and the seedling’s position within the germination tray. The AF required to extract seedlings from the tray was directly related to the MC and root system development, the latter being associated with the seedling’s h t . H2 seedlings had the highest AF values, followed by H1, and finally H3. As for SFC, no significant differences were found between GSS and SBR materials. However, in plywood, H2 and H3 showed higher values, while GSS recorded the lowest SFC values among the four materials evaluated, with no significant differences between hybrids. Moreover, in the DT from height h2, mechanical damage to root balls was influenced by MC, root development, and w t of seedlings, which are key factors in evaluating seedling resistance during handling and adaptation to automatic transplanting.
Knowledge of these variables is critical for the design and engineering of the prototype, including the definition of its dimensions, selection of suitable materials, and execution of the calculations required for the seedling extraction and gripping mechanism, the feeding system, the power transmission unit, the speed control module, and the positioning and placement mechanism at the transplanting site. Accurate knowledge of these parameters enhances mechanical design, equipment efficiency, and contributes to reducing both operational complexity and production costs.
This study provides a solid foundation for future research on the automatic transplanting of tomato seedlings in Central Mexico. Its approach contributes to the development of new prototypes aimed at enhancing efficiency and productivity, particularly for small- and medium-sized producers, driving technological innovation in the agricultural sector.

Author Contributions

Conceptualization, G.G., M.H.-R., P.C. and N.V.-L.; methodology, G.G., M.H.-R. and P.C.; software, G.G.; validation, M.H.-R., P.C. and N.V.-L.; formal analysis, G.G., M.H.-R. and P.C.; investigation, G.G., M.H.-R., P.C. and N.V.-L.; resources, G.G., M.H.-R., P.C. and N.V.-L.; data curation, G.G. and M.H.-R.; writing—original draft preparation, G.G. and M.H.-R.; writing—review and editing, G.G., M.H.-R., P.C. and N.V.-L.; visualization, G.G.; supervision, M.H.-R., P.C. and N.V.-L.; project administration, M.H.-R., P.C. and N.V.-L.; funding acquisition, M.H.-R. All authors have read and agreed to the published version of the manuscript.

Funding

This research received no external funding. The first author received from the Secretaría de Ciencia, Humanidades, Tecnología e Innovación (SECIHTI) the grant number 83853. The APC was funded for the Dirección General de Investigación y Posgrado (DGIP) at Universidad Autónoma Chapingo.

Data Availability Statement

The datasets used and analyzed during this research study are available upon request from the corresponding author.

Acknowledgments

The authors would like to thank the Secretaría de Ciencia, Humanidades, Tecnología e Innovación (SECIHTI) for the doctoral scholarship granted with support number 83853. They also thank the Universidad Autónoma Chapingo and the Posgrado en Ingeniería Agrícola y Uso Integral del Agua for the facilities provided for this research article. They also thank the Departamento de Ingeniería Mecánica Agrícola, as well as the people in charge of the Biological Materials Laboratory, Carlos Alberto Villaseñor and Ma. del Rosario Venegas for the facilities and access they provided for the experimental tests of this study.

Conflicts of Interest

The authors declare no conflicts of interest. The funders had no role in the design of the study; in the collection, analyses, or interpretation of data; in the writing of the manuscript; or in the decision to publish the results.

Abbreviations

The following abbreviations are used in this manuscript:
AFAdhesion force
ANOVAAnalysis of variance
ASNSAmerican Standard for Nursery Stock
ASAEAmerican Society of Association Executives
BICBayesian Information Criterion
CMCenter of mass
SECIHTISecretaría de Ciencia, Humanidades, Tecnología e Innovación
CVCoefficient of variation
DTDrop test
GSSGalvanized steel sheet
H1Natalie F1 hybrid
H2CID F1 hybrid
H3Gavilán F1 hybrid
MAMassachusetts
MCMoisture content
R a 2 Adjusted coefficient of determination
RBRoot ball
RBPFRoot ball punching force
SBRCommercial neoprene
SDStandard Deviation
SFCStatic friction coefficient
TOscillation period
USAUnited States American
VIFVariance inflation factors
x ¯ Mean

References

  1. Global Alliance for Improved Nutrition (GAIN). Tomatoes: The World’s Most Popular Vegetable. Available online: https://www.gainhealth.org/resources/reports-and-publications/tomatoes-worlds-most-popular-vegetable (accessed on 3 October 2024).
  2. Akotowanou, O.; Adjou, E.; Olubi, A.; Kougblenou, S.; Ahoussi, E.; Sohounhloué, D. The Tomato (Solanum lycopersicum L.) in Community Development: An Overview Focused on Nutritional Properties, Agronomic Constraints, Recent Achievements and Future Prospective. Int. J. Front. Biol. Pharm. Res. 2022, 3, 8–16. [Google Scholar] [CrossRef]
  3. Padmanabhan, P.; Cheema, A.; Paliyath, G. Solanaceous Fruits Including Tomato, Eggplant, and Peppers. In Encyclopedia of Food and Health; Caballero, B., Finglas, P.M., Toldrá, F., Eds.; Academic Press: Oxford, UK, 2016; pp. 24–32. [Google Scholar] [CrossRef]
  4. Shahbandeh, M. Global Production of Vegetables in 2022, by Type; Statista: Hamburg, Germany, 2022. [Google Scholar]
  5. SIAP. Panorama Agroalimentario 2018–2024; SIAP: Ciudad de México, Mexico, 2024; Available online: https://www.gob.mx/siap/acciones-y-programas/panorama-agroalimentario-258035 (accessed on 5 October 2024).
  6. Javanmardi, J.; Moradiani, M. Tomato Transplant Production Method Affects Plant Development and Field Performance. Int. J. Veg. Sci. 2017, 23, 31–41. [Google Scholar] [CrossRef]
  7. Nage, S.M.; Mathur, S.M.; Meena, S.S. Vegetable Transplanters for India: A Review. Agric. Sci. Dig. 2023, 43, 129–134. [Google Scholar] [CrossRef]
  8. Grande, G.; Hidalgo-Reyes, M.; Cruz, P.; Velázquez, N. Evolution and Technological Development of Automatic Transplanters for Vegetables: A Review. INMATEH-Agric. Eng. 2024, 72, 830–847. [Google Scholar] [CrossRef]
  9. Pandirwar, A.; Kumar, A.; Mani, I.; Islam, S. Biometric Properties of Onion Seedlings Relevant to the Development of Onion Seedling Transplanter. J. Appl. Nat. Sci. 2015, 7, 768–773. [Google Scholar] [CrossRef]
  10. Zeng, F.; Li, X.; Bai, H.; Cui, J.; Liu, X.; Zhang, Y. Experimental Study on Pot Damage and Contact Stress Distribution Characteristics of Oil Sunflower Plug Seedlings. Appl. Sci. 2022, 12, 10889. [Google Scholar] [CrossRef]
  11. Pagare, V.; Din, M.; Mehta, C.R.; Nandede, B.M.; Kumar, M. Morphological and Mechanical Characteristics of Onion Seedlings Insight to Mechanized Transplantation. Indian J. Agric. Res. 2022, 58, 1235–1243. [Google Scholar] [CrossRef]
  12. Khadatkar, A.; Gaikwad, B.; Pandirwar, A. Biometric Properties of Plug Vegetable Seedlings Relevant to the Design of Vegetable Transplanter. J. Agric. Eng. 2020, 57, 16–24. [Google Scholar]
  13. Hu, S.; Hu, M.; Zhang, W.; Jiang, Z. Experimental and Simulation Study on Mechanical Properties of Stem of Pepper Hole Seedlings. J. Chin. Agric. Mech. 2022, 43, 9–18. [Google Scholar] [CrossRef]
  14. Magar, A.P.; Nalawade, S.M.; Walunj, A.A.; Khadatkar, A.; Bhangare, S.C.; Bhalekar, M.N.; Nimbalkar, C.A.; Gaikwad, B.B. Engineering Properties of Some Plug-Type Vegetable Seedlings for Development of Automatic Vegetable Transplanter. J. Agric. Eng. 2023, 60, 1–13. [Google Scholar] [CrossRef]
  15. Abubakar, A.J.; Iya, S.A.; Aliyu, B.; Tashiwa, Y.I. Determination of Physico-Mechanical Properties of Tomato Seedlings for Design of a Tomato Transplanter. J. Agric. Eng. Technol. 2020, 25, 106–122. [Google Scholar]
  16. Sharma, A.; Khar, S.; Chaudhary, D.; Thakur, P. Study of Biometric Attributes of Plug Type Tomato Seedlings Pertinent to Transplanter Design. Indian J. Ecol. 2023, 50, 503–507. [Google Scholar] [CrossRef]
  17. Han, L.; Mao, H.; Hu, J.; Miao, X.; Tian, K.; Yang, X. Experiment on Mechanical Property of Seedling Pot for Automatic Transplanter. Nongye Gongcheng Xuebao/Trans. Chin. Soc. Agric. Eng. 2013, 29, 24–29. [Google Scholar]
  18. Tian, Z.; Gao, A.; Ma, W.; Jiang, H.; Cao, D.; Wang, W.; Qian, J.; Xu, L. Modeling the Mechanical Properties of Root–Substrate Interaction with a Transplanter Using Artificial Neural Networks. Agriculture 2024, 14, 651. [Google Scholar] [CrossRef]
  19. Cui, J.; Li, X.; Zeng, F.; Bai, H. Study on Contact Stress Distribution Characteristics and Damage of Plug Seedlings Based on Flexible Fressure Sensor. Sensors 2023, 23, 8175. [Google Scholar] [CrossRef] [PubMed]
  20. Zeng, F.; Cui, J.; Li, X.; Bai, H. Establishment of the Interaction Simulation Model between Plug Seedlings and Soil. Agronomy 2024, 14, 4. [Google Scholar] [CrossRef]
  21. Cui, J.; Li, X.; Zeng, F.; Bai, H.; Zhang, Y. Parameter Calibration and Optimization of a Discrete Element Model of Plug Seedling Pots Based on a Collision Impact Force. Appl. Sci. 2023, 13, 6278. [Google Scholar] [CrossRef]
  22. American Horticultural Industry Association d/b/a American Hort an ANSI Accredited Standard Developing Organization. American Standard for Nursery Stock (ASNS); AmericanHort: Columbus, OH, USA, 2014. [Google Scholar]
  23. ASAE S358.3; Moisture Measurement Forages. American Society and Biological Engineers Standards: St. Joseph, MI, USA, 2012.
  24. Paneque, P.P.; López, G.; Mayans, P.R.; Muñoz, F.; Gaytán, J.G. Fundamentos Teóricos y Análisis de Máquinas Agrícolas, 1st ed.; Universidad Autónoma Chapingo: Texcoco, Mexico, 2017. [Google Scholar]
  25. Muñoz, F.; Gaytán, J.G.; Serwatowsky, R.; Gracia, C. Trasplante Mecanizado de Hortalizas Mechanized Transplant of Vegetables. Rev. Cienc. Técnicas Agropecu. 2006, 15, 5–11. [Google Scholar]
  26. Cruz, P.; García, S.; Márquez, C.; López, G. Determinación de Las Propiedades Físico-Mecánicas Para El Descascarado de Las Cápsulas de La Higuerilla (Ricinus communis L.). Rev. Mex. Ciencias Agrícolas 2012, 3, 644–649. [Google Scholar]
  27. Onwe, D.N.; Umani, K.C.; Olosunde, W.A.; Ossom, I.S. Comparative Analysis of Moisture-Dependent Physical and Mechanical Properties of Two Varieties of African Star Apple (Chrysophyllum Albidum) Seeds Relevant in Engineering Design. Sci. Afr. 2020, 8, e00303. [Google Scholar] [CrossRef]
  28. Mohsenin, N.N. Physical Properties of Plant and Animal Materials, 2nd ed.; Gordon and Breach Science Publishers, Inc.: New York, NY, USA, 1986. [Google Scholar]
  29. Gallegos-Cedillo, V.M.; Nájera, C.; Gruda, N.S.; Signore, A.; Gallegos, J.; Rodríguez, R.; Ochoa, J.; Egea-Gilabert, C.; Fernández, J.A. An In-Depth Analysis of Sustainable Practices in Vegetable Seedlings Nurseries: A Review. Sci. Hortic. 2024, 334, 113342. [Google Scholar] [CrossRef]
  30. Xu, X.; Yang, F.; Song, J.; Zhang, R.; Cai, W. Does the Daily Light Integral Influence the Sowing Density of Tomato Plug Seedlings in a Controlled Environment? Horticulturae 2024, 10, 730. [Google Scholar] [CrossRef]
  31. Bebre, I.; Riebl, H.; Annighöfer, P. Seedling Growth and Biomass Production under Different Light Availability Levels and Competition Types. Forests 2021, 12, 1376. [Google Scholar] [CrossRef]
  32. Bauer, S.; Wyszomirski, T.; Berger, U.; Hildenbrandt, H.; Grimm, V. Asymmetric Competition as a Natural Outcome of Neighbour Interactions among Plants: Results from the Field-of-Neighbourhood Modelling Approach. Plant Ecol. 2004, 170, 135–145. [Google Scholar] [CrossRef]
  33. Huber, M.; Nieuwendijk, N.M.; Pantazopoulou, C.K.; Pierik, R. Light Signalling Shapes Plant–Plant Interactions in Dense Canopies. Plant Cell Environ. 2021, 44, 1014–1029. [Google Scholar] [CrossRef]
  34. Maynard, E.T.; Guan, W.; Langenhoven, P.; Hoagland, L. Tomato Seedling Performance in Commercial Organic Growing Media. Horttechnology 2024, 34, 80–91. [Google Scholar] [CrossRef]
  35. Han, L.; Xiang, D.; Xu, Q.; Du, X.; Ma, G.; Mao, H. Development of Simplified Seedling Transplanting Device for Supporting Efficient Production of Vegetable Raw Materials. Appl. Sci. 2023, 13, 10022. [Google Scholar] [CrossRef]
  36. Jin, X.; Li, D.Y.; Ma, H.; Ji, J.T.; Zhao, K.X.; Pang, J. Development of Single Row Automatic Transplanting Device for Potted Vegetable Seedlings. Int. J. Agric. Biol. Eng. 2018, 11, 67–75. [Google Scholar] [CrossRef]
  37. Han, L.; Ma, H.; Mo, M.; Kumi, F.K.; Hu, J.; Mao, H. Design and Test of an Efficient Seedling Pick-up Device with a Combination of Air Jet Ejection and Mechanical Action. J. Agric. Eng. 2024, 55, 1575. [Google Scholar] [CrossRef]
  38. Ji, D.; Liu, L.; Zeng, F.; Zhang, G.; Liu, Y.; Diao, H.; Tian, S.; Zhao, Z. Design and Experimental Study of a Traction Double-Row Automatic Transplanter for Solanum Lycopersicum Seedlings. Horticulturae 2024, 10, 692. [Google Scholar] [CrossRef]
  39. Jiang, Z.; Hu, Y.; Jiang, H.; Tong, J. Design and Force Analysis of End-Effector for Plug Seedling Transplanter. PLoS Comput. Biol. 2017, 12, e0180229. [Google Scholar] [CrossRef] [PubMed]
  40. Chen, J.; Zhou, H.; Che, H.; Liu, Y.; Li, P. Optimal Design of Ejector Belt Seedling Collecting Mechanism Based on Edem. INMATEH Agric. Eng. 2023, 69, 109–120. [Google Scholar] [CrossRef]
  41. Bai, H.; Li, X.; Zeng, F.; Cui, J.; Zhang, Y. Study on the Impact Damage Characteristics of Transplanting Seedlings Based on Pressure Distribution Measurement System. Horticulturae 2022, 8, 1080. [Google Scholar] [CrossRef]
Figure 1. Flowchart for determining physical and mechanical properties of tomato seedlings.
Agriengineering 07 00138 g001
Figure 2. Physical dimensions of tomato seedling.
Agriengineering 07 00138 g002
Figure 3. Device for determining (a) the center of mass (CM) of the seedling; (b) distance d p and oscillation of the seedlings.
Agriengineering 07 00138 g003
Figure 4. (a) AF test of seedlings attached by their stems to the germination tray, (b) RBPF.
Agriengineering 07 00138 g004
Figure 5. (a) Device for testing the SFC of seedlings, (b) diagram of the DT at two heights.
Agriengineering 07 00138 g005
Figure 6. Selection of the best model using the criteria: (a) Bayesian Information Criterion (BIC) and (b) adjusted coefficient of determination ( R a 2 ). The optimal model was identified based on the lowest BIC and the highest R a 2 on the Y-axis. These metrics indicate the most suitable model among those incorporating different combinations of variables (X1 to X11), as highlighted in the shaded area.
Agriengineering 07 00138 g006
Figure 7. Model diagnostics for seedlings CM: (a) residuals vs. predicted values and (b) actual values vs. predicted values.
Agriengineering 07 00138 g007
Figure 8. AF of tomato seedlings in cavities of germination trays. Different lowercase letters (a and b) indicate significant differences (p-value < 2 × 10⁻¹⁶) among hybrids according to Tukey’s test.
Agriengineering 07 00138 g008
Figure 9. Damage observed in seedlings subjected to the AF test: (a) RB breakage in an H1 seedling, (b) RB damage in an H2 seedling, and (c) residual substrate in the cavity due to an incomplete root system in an H3 seedling.
Agriengineering 07 00138 g009
Figure 10. Average final loads from the RBPF test on seedlings. Different lowercase letters (a, b, and c) indicate statistically significant differences between hybrids (p-value < 6.66 × 10⁻¹⁰) according to Tukey’s test.
Agriengineering 07 00138 g010
Figure 11. Mean comparison of SFC values using Tukey’s test: (a) by hybrid on each material and (b) by material for each hybrid. Different lowercase letters (a and b) indicate significant differences.
Agriengineering 07 00138 g011
Figure 12. Residual substrate amount left on the galvanized steel sheet (GSS) during the DT. Different lowercase letters (a and b) indicate significant differences among the F1 hybrids studied.
Agriengineering 07 00138 g012
Table 1. General seedling dimensions.
Hybrid Total   Height   ( h t )
(mm)
Canopy (mm)
XYZ
H1Max.336232231147
Min.180912232
x ¯ ± S D 260.58 ± 36.88 b142.01 ± 26.93 b91.34 ± 28.74 b75.28 ± 23.08 b
CV0.140.190.310.31
H2Max.358229188174
Min.2341144856
x ¯ ± S D 311.76 ± 26.80 a170.24 ± 29.74 a106.84 ± 23.66 a98.14 ± 27.39 a
CV0.080.170.220.28
H3Max.302208174144
Min.185604729
x ¯ ± S D 233.52 ± 26.05 c141.18 ± 31.61 b93.14 ± 25.24 b83.46 ± 24.93 b
CV0.110.220.270.30
p-value<2 × 10⁻¹⁶ ***6.45 × 10⁻⁷ ***0.00584 **5.16 × 10⁻⁵ ***
x ¯ —mean, SD—standard deviation, CV—coefficient of variation, and (***, **)—significance levels. Superscript letters (a, b, and c) indicate significant groups according to Tukey’s test of each variable.
Table 2. Dimensions of the seedling root ball (RB) and stem.
HybridRB (mm)Stem (mm)
Height   ( h r b ) Major   Base   ( b m a ) Minor   Base   ( b m i ) Height   ( h s ) Diameter   ( d s )
H1Max.62.7325.9812.6186.233.78
Min.54.1023.810.4436.812.73
x ¯ ± S D 59.58 ± 1.87 a24.94 ± 0.57 ab11.66 ± 0.41 ab53.18 ± 8.23 a3.26 ± 0.25 b
CV0.030.020.030.150.08
H2Max.64.0626.5514.6163.534.62
Min.51.923.3510.6135.482.95
x ¯ ± S D 58.56 ± 2.70 a25.03 ± 0.76 a11.97 ± 0.75 a47.41 ± 6.31 b3.65 ± 0.38 a
CV0.040.030.060.130.10
H3Max.62.3926.4112.6275.364.49
Min.54.4523.358.7739.302.70
x ¯ ± S D 59.15 ± 1.89 a24.65 ± 0.59 b11.42 ± 0.79 b49.51 ± 7.70 b3.70 ± 0.42 a
CV0.030.020.070.160.11
p-value0.0684 ·0.00931 **0.000353 ***0.000687 ***2.35 × 10⁻⁹ ***
x ¯ —mean, SD—standard deviation, CV—coefficient of variation, and (***, **, and ·)—significance levels. Superscript letters (a and b) indicate significant groups according to Tukey’s test of each variable.
Table 3. Total weight ( w t ) and moisture content (MC) of seedlings.
Hybrid w t (g)MC (%)
RBStemRemaining Foliage
H1Max.16.1483.9995.8393.75
Min.6.3758.2686.2185.22
x ¯ ± S D 11.76 ± 2.00 a77.37 ± 6.84 a91.94 ± 2.34 c91.40 ± 1.58 b
CV0.170.090.030.02
H2Max.18.1483.0295.8394.97
Min.7.8555.9290.0091.76
x ¯ ± S D 11.92 ± 2.12 a74.31 ± 6.68 b93.24 ± 1.36 b93.41 ± 1.20 a
CV0.180.090.010.01
H3Max.13.781.4598.0494.95
Min.7.1957.9290.9190.53
x ¯ ± S D 10.71 ± 1.58 b74.75 ± 5.34 ab94.51 ± 1.39 a92.92 ± 0.93 a
CV0.150.070.010.01
p-value0.00322 **0.0351 *1.25 × 10−10 ***4.6 × 10⁻¹⁵ ***
x ¯ —mean, SD—standard deviation, CV—coefficient of variation, and (***, **, and *)—significance levels. Superscript letters (a, b, and c) indicate significant groups according to Tukey’s test of each variable.
Table 4. Location of the center of mass (CM) and oscillation period (T) of seedlings.
Hybrid d e (mm) d p (mm)T (s)
H1Max.88265.40.95
Min.50125.480.72
x ¯ ± S D 64.20 ± 8.56 b196.38 ± 34.02 b0.85 ± 0.06 b
CV0.130.170.07
H2Max.1102790.96
Min.611690.73
x ¯ ± S D 78.36 ± 10.87 a233.4 ± 23.72 a0.88 ± 0.04 a
CV0.140.100.05
H3Max.932100.86
Min.451250.62
x ¯ ± S D 66.48 ± 10.48 b167.04 ± 20.84 c0.78 ± 0.04 c
CV0.160.120.06
p-value2.85 × 10−11 ***<2 × 10⁻¹⁶ ***<2 × 10⁻¹⁶ ***
x ¯ —mean, SD—standard deviation, CV—coefficient of variation, and ***—significance levels. Superscript letters (a, b, and c) indicate significant groups according to Tukey’s test of each variable.
Table 5. Summary of the ANOVA and VIF for the best model obtained.
VariableDFSum of SquaresMean SquareF-Valuep-ValueVIF
X 1 18094.78094.7344.8738<2.2 × 10⁻¹⁶ ***1.2716
X 3 14362.14362.1185.8451<2.2 × 10⁻¹⁶ ***1.3485
X 4 1103.5103.54.40890.037509 *1.0451
X 7 14050.84050.8172.5820<2.2 × 10⁻¹⁶ ***1.1268
X 8 1378.3378.316.11719.574 × 10−5 ***1.3473
X 11 1200.9200.98.55960.003999 **1.2198
Residuals1433356.423.5
(***, **, and *)—significance levels.
Disclaimer/Publisher’s Note: The statements, opinions and data contained in all publications are solely those of the individual author(s) and contributor(s) and not of MDPI and/or the editor(s). MDPI and/or the editor(s) disclaim responsibility for any injury to people or property resulting from any ideas, methods, instructions or products referred to in the content.

