
Evaluation of the Flow Properties of Coffea canephora During Storage as Affected by Roasting Level, Particle Size, and Storage Temperature

 , and
, and
Abstract
1. Introduction
2. Materials and Methods
2.1. Coffee Beans
2.2. Roasting and Grinding
2.3. Shear Test
2.3.1. Flow Properties
2.3.2. Internal Friction Angle, Effective Internal Friction Angle, and Friction Angle with the Wall
2.3.3. Internal and External Friction Coefficients
2.3.4. Flow Function
2.3.5. K Coefficient
2.4. Experimental Design
3. Results and Discussion
3.1. Roasted and Ground Coffee
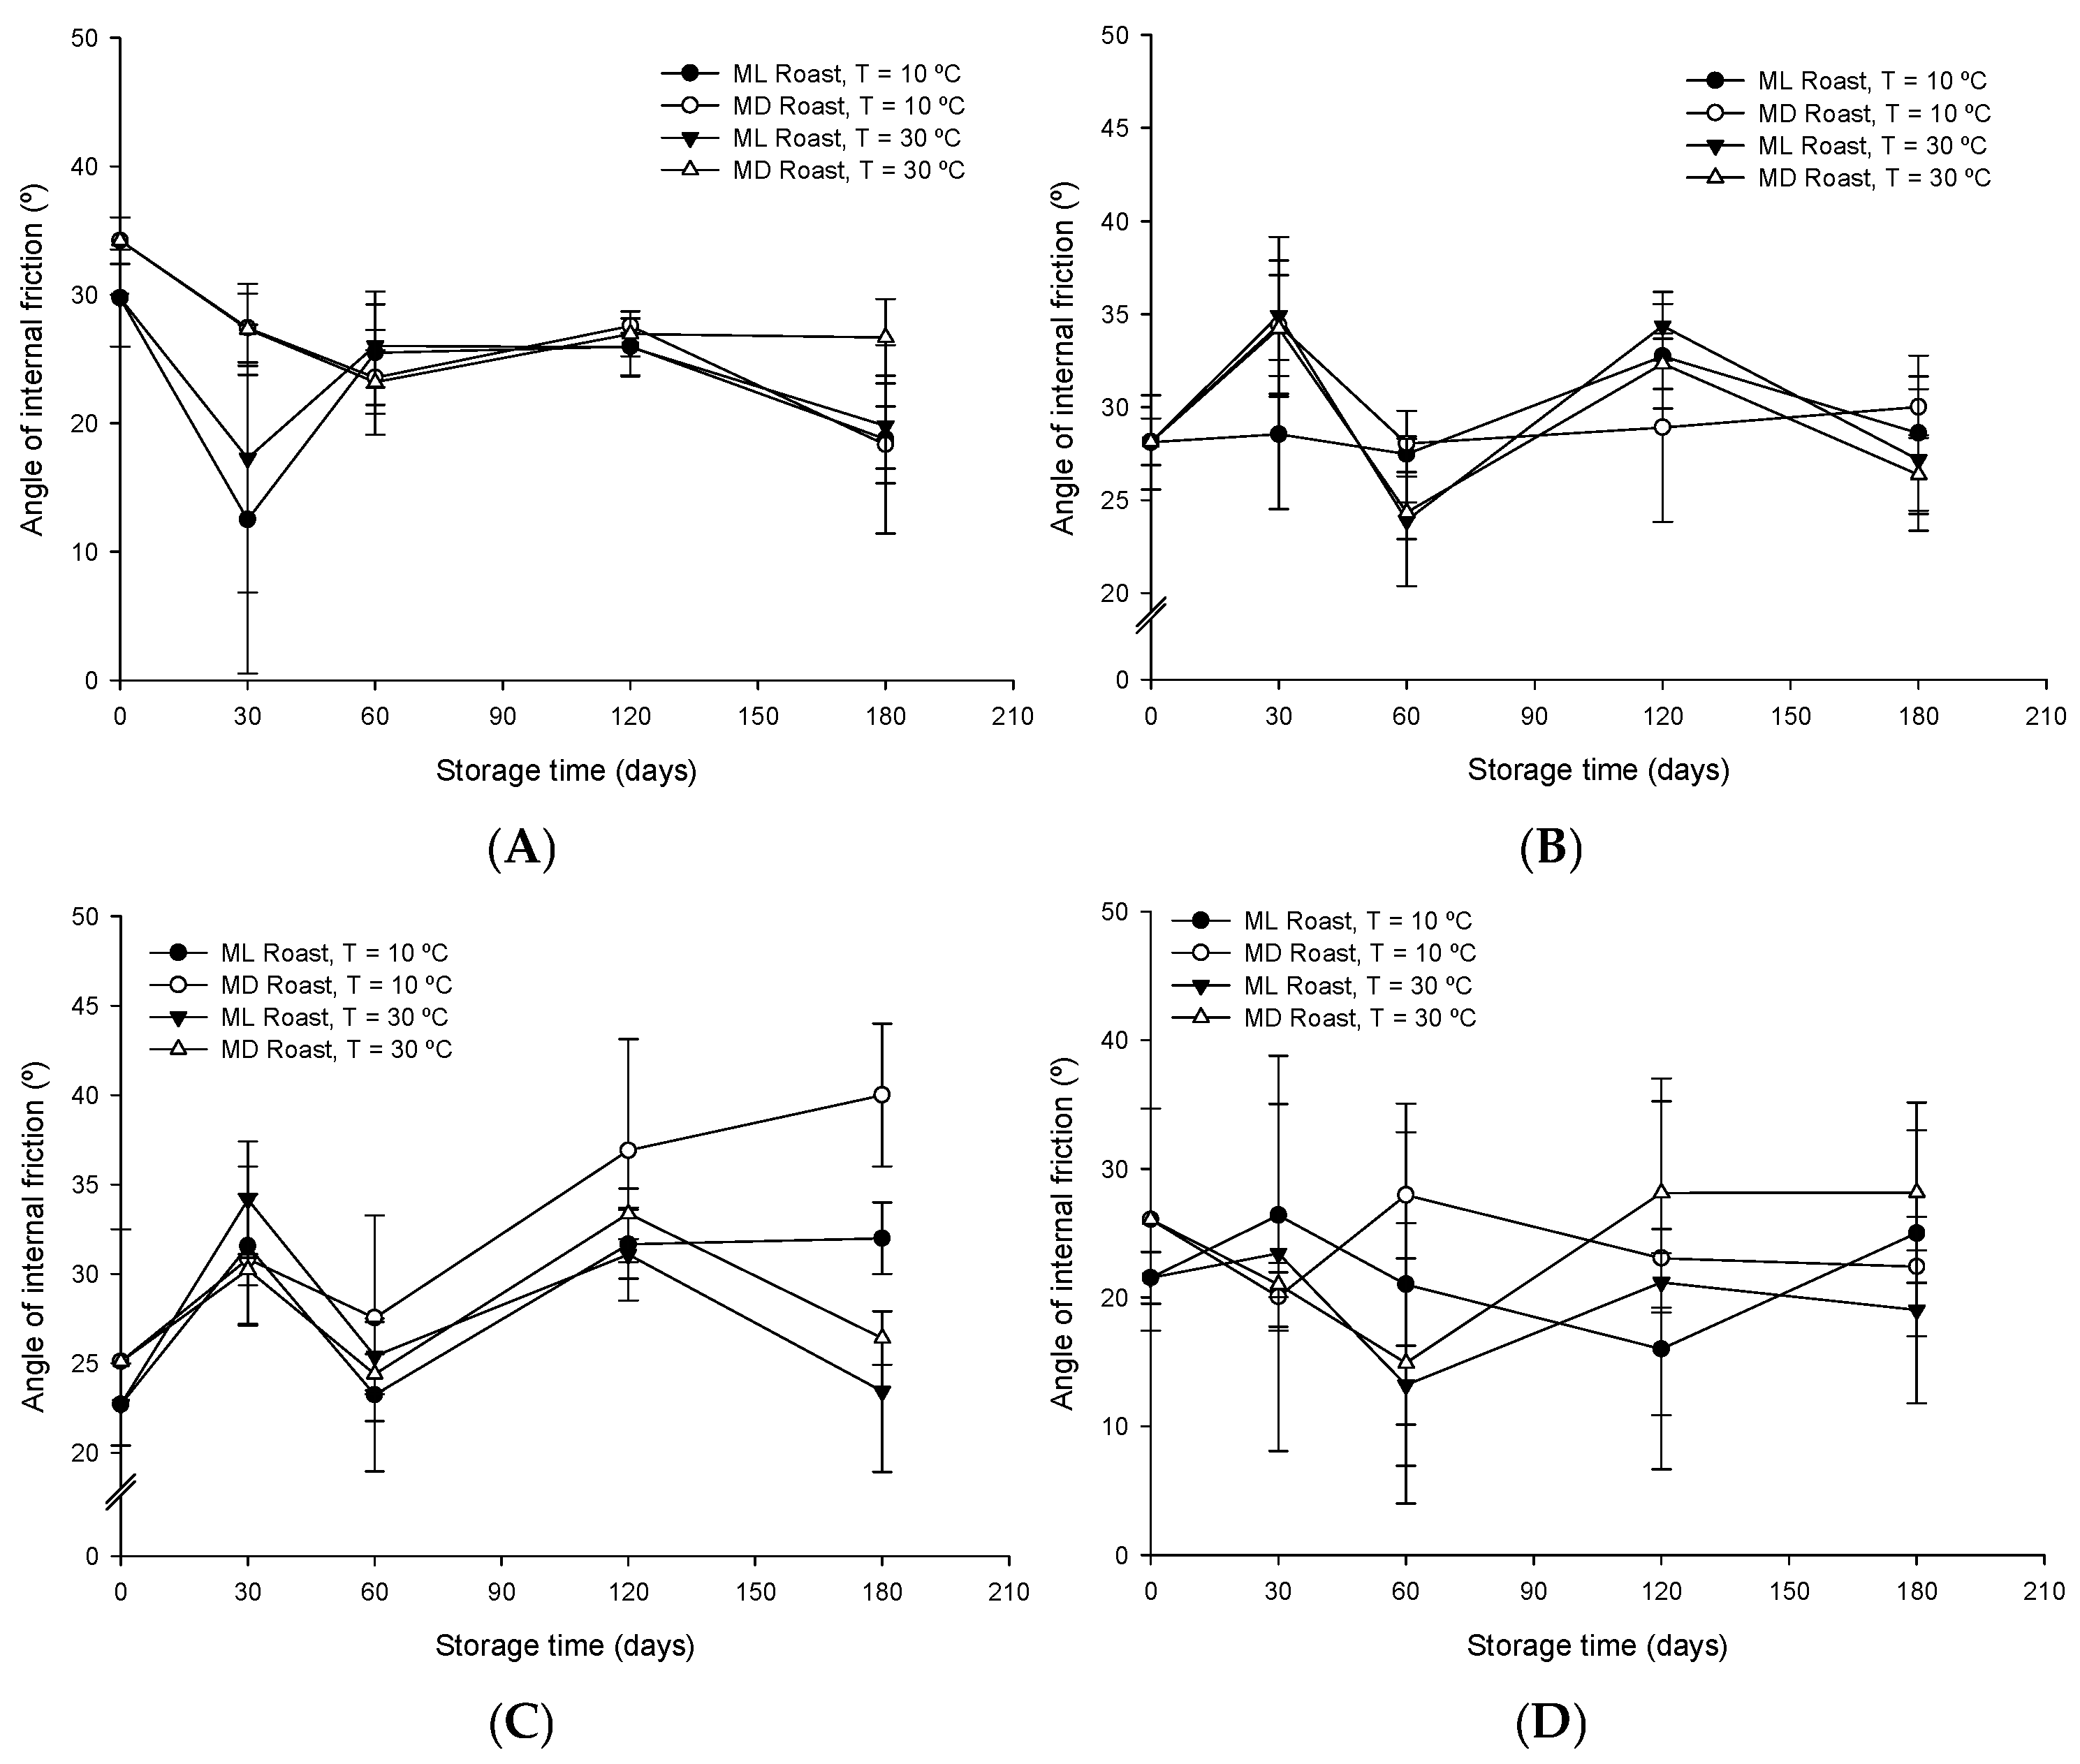
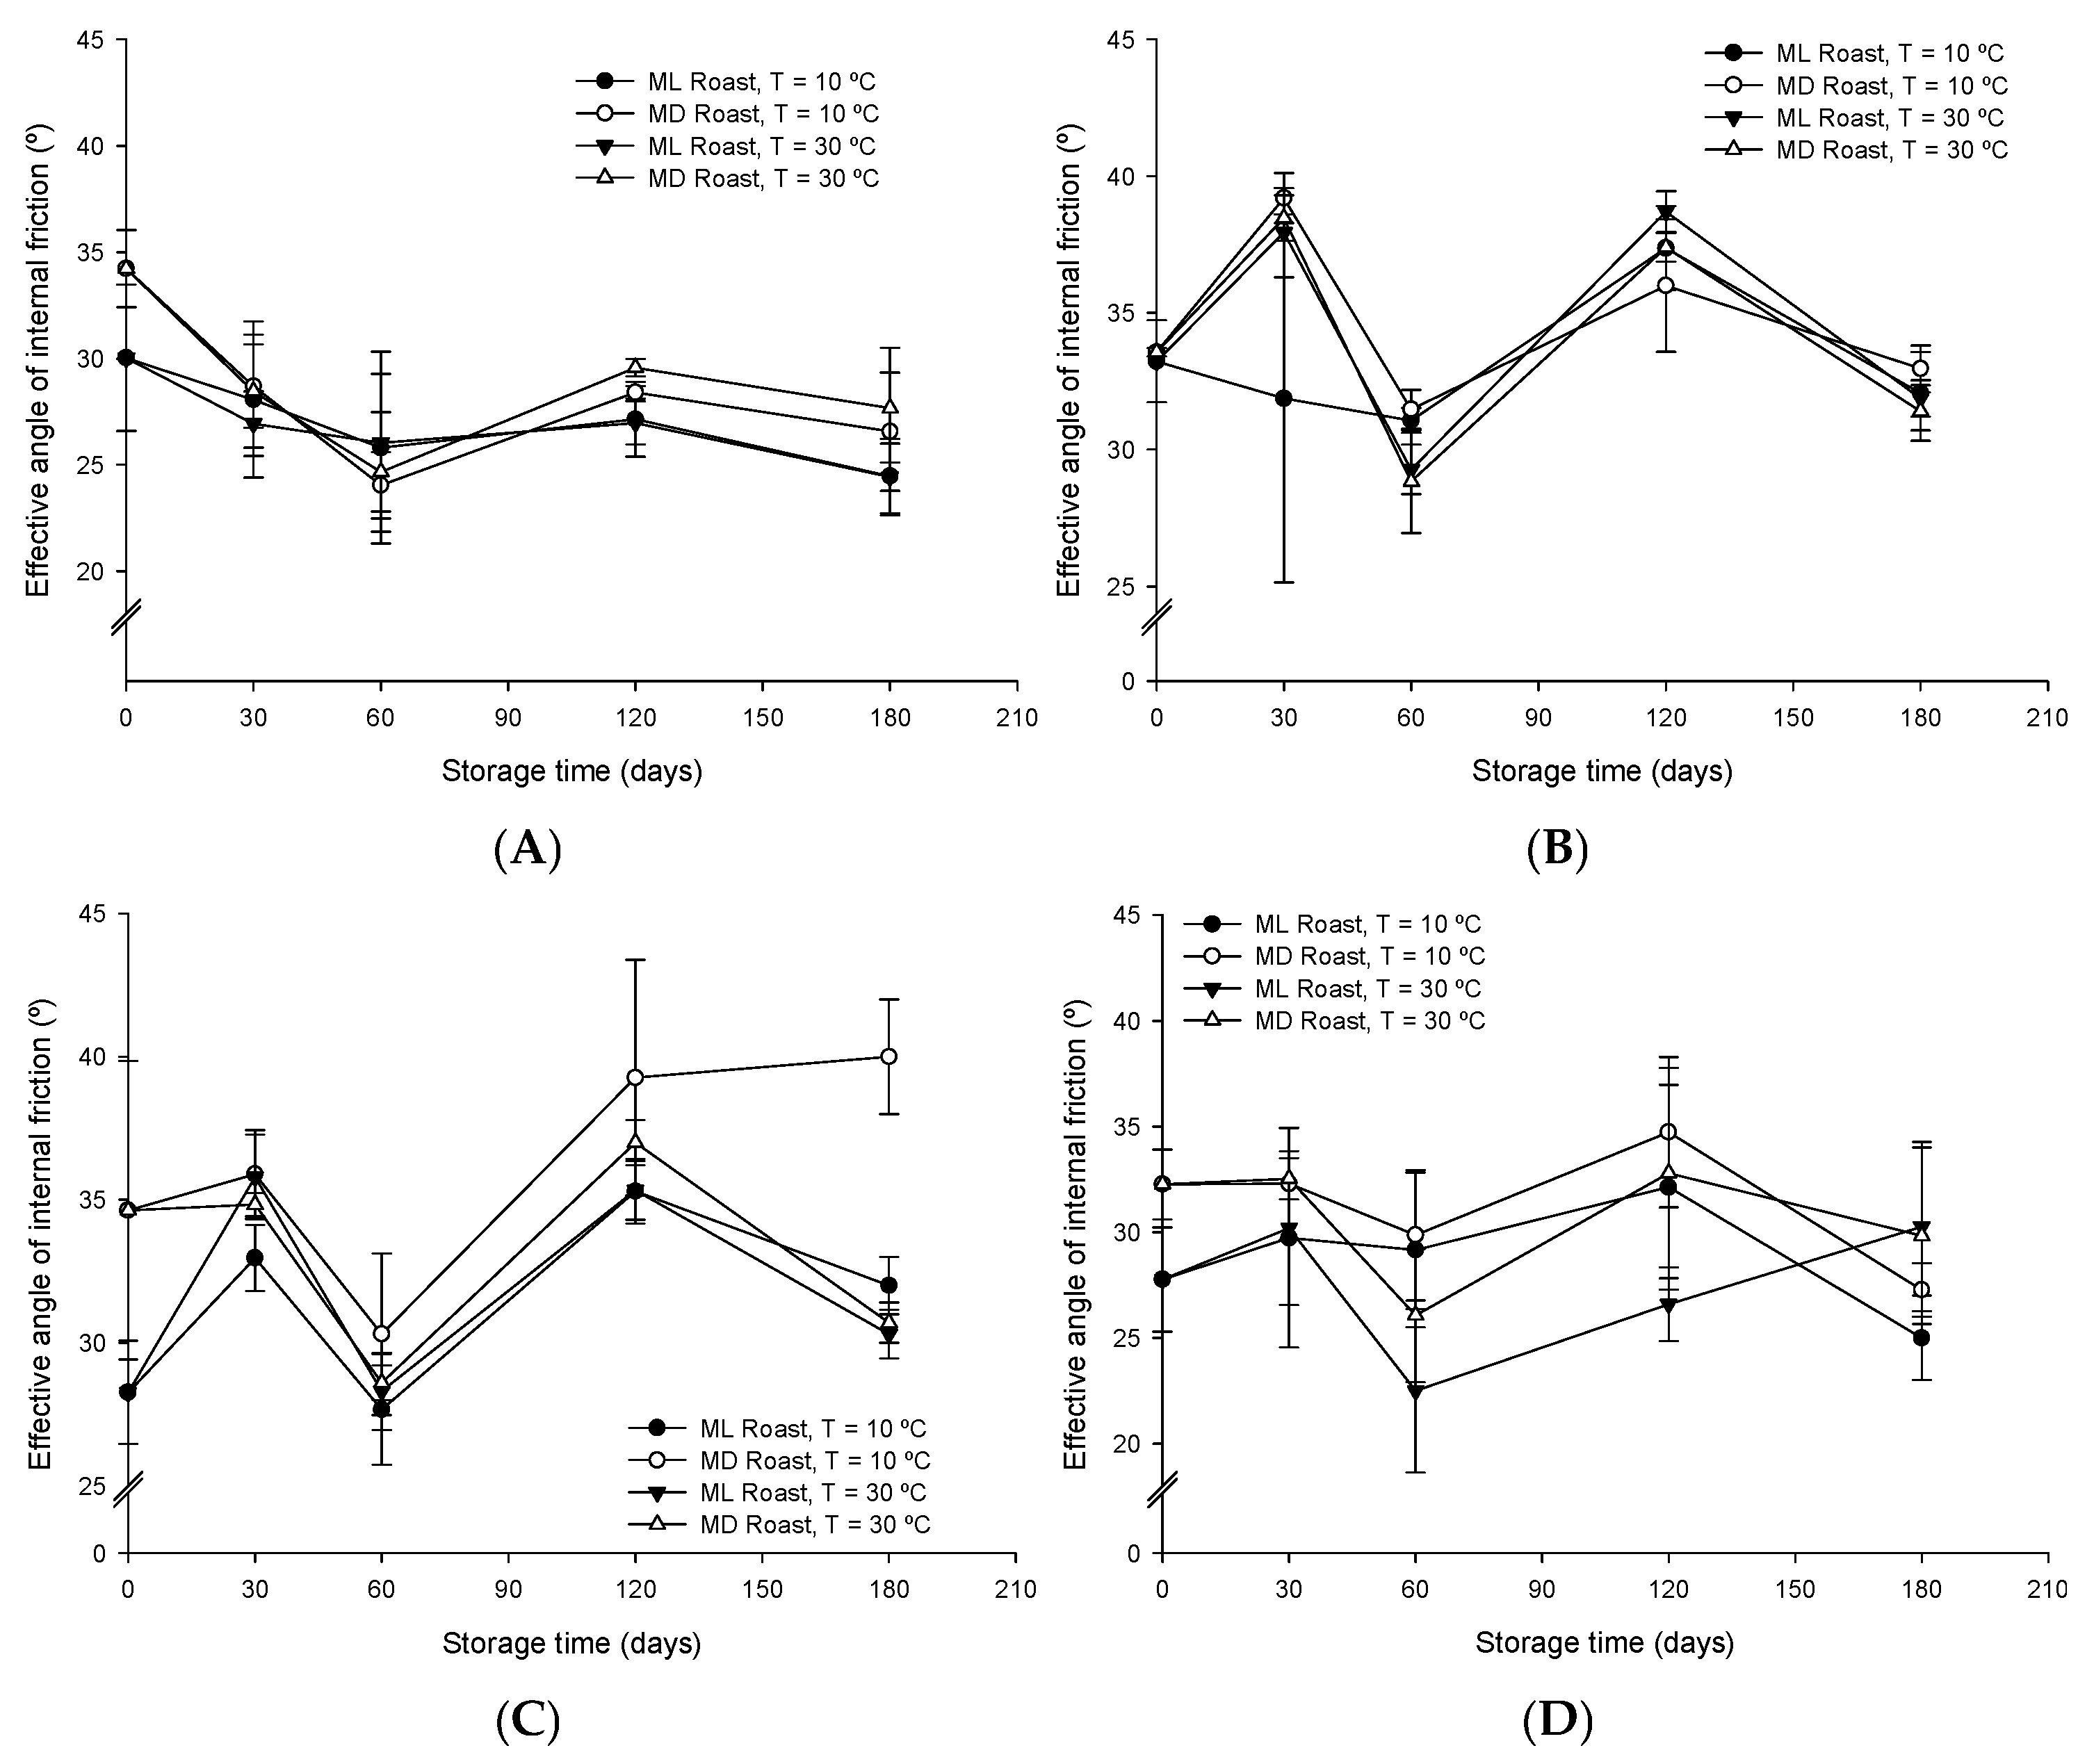
3.2. Internal Friction Angle, Effective Internal Friction Angle, and Friction Angle with the Wall
3.3. Internal and External Friction Coefficients
3.4. Flow Function
3.5. K Coefficient
4. Conclusions
Author Contributions
Funding
Data Availability Statement
Conflicts of Interest
References
- ABIC. Available online: https://estatisticas.abic.com.br/wp-content/uploads/2023/12/2023.12.SumarioCafe.pdf (accessed on 13 November 2024).
- Robberts, T.C. Food Plant Engineering Systems; CRC Press: New York, NY, USA, 2002; 268p. [Google Scholar]
- Jenike, A.W. Storage and Flow of Solids; Bulletin 123; University of Utah: Salt Lake City, UT, USA, 1964; 89p. [Google Scholar]
- Jenike, A.W.; Johanson, J. Flow Factor Tester and Consolidating Bench Operating Instructions; Jenike & Johanson, Inc: Tyngsborough, MA, USA, 1979; 40p. [Google Scholar]
- Gandia, R.M.; Gomes, F.C.; Paula, W.C.; Oliveira Junior, E.A.; Rodriguez, P.J.A. Static and dynamic pressure measurements of maize grain in silos under different conditions. Biosyst. Eng. 2021, 209, 180–199. [Google Scholar] [CrossRef]
- Knowlton, T.M.; Klinzing, G.E.; Yang, W.C.; Carson, J.W. The importance of storage, transfer and collection. Chem. Eng. Prog. 1994, 90, 44–54. [Google Scholar]
- Aslan Türker, D.; Göksel Saraç, M.; Doğan, M. The influence of anti-caking agents on powder flow properties of ready-to-drink coffee during storage. Harran Tarım Gıda Bilim. Derg. 2024, 28, 258–266. [Google Scholar] [CrossRef]
- Massaro Sousa, L.; Schulz, C.G.; Condotta, R.; Ferreira, M.C. On the design of conical hoppers for spent coffee grounds: Moisture content and particle-size effects. J. Food Eng. 2021, 300, 110537. [Google Scholar] [CrossRef]
- Mo, C.; Johnston, R.; Navarini, L.; Ellero, M. Modeling the effect of flow-induced mechanical erosion during coffee filtration. Phys. Fluids 2021, 33, 093101. [Google Scholar] [CrossRef]
- Oliveira, G.H.H.; Corrêa, P.C.; Oliveira, A.P.L.R.; Vargas-Elías, G.A.; Calil Júnior, C. Arabica coffee flow properties assessed using different roasts and particle sizes during storage. Braz. J. Food Technol. 2022, 25, e2021026. [Google Scholar] [CrossRef]
- Mohsenin, N.N. Physical Properties of Plant and Animal Materials; Gordon and Breach Publishers: New York, NY, USA, 1986; 841p. [Google Scholar]
- Boumans, G. Grain Handling and Storage; Elsevier Science Publishers: Amsterdam, The Netherlands, 1985; 436p. [Google Scholar]
- Silva, F.S. Propriedades Físicas dos Grãos de Café Como Subsídio em Projetos de Equipamentos e de Silos Utilizando a Metodologia de Jenike. Ph.D. Thesis, Universidade Federal de Viçosa, Viçosa, Brazil, 2003. [Google Scholar]
- Gaggero, M.R.; Trein, C.R.; Ippoliti, G. Influência de sistemas de preparo e pastejo nas características físicas do solo. Rev. Prog. Ciênc. Agro-Ambient. 2002, 1, 1–16. [Google Scholar]
- Chithra, S.; Indupriya, G. Contributions of Different Standards and Codes for the Design of Silo: A Review. Asian Rev. Civ. Eng. 2016, 5, 27–33. [Google Scholar] [CrossRef]
- Naka, S. Determinação das Propriedades Físicas dos Grãos de Mamona ‘Guarani’ Visando Armazenagem em Silos Verticais. Master’s Thesis, Universidade Estadual de Campinas, Campinas, Brazil, 2010. [Google Scholar]
- Malaquias, J.V.; Celestino, S.M.C.; Xavier, M.F.F. Optimization of the roasting conditions of arabica coffee cultivated in the cerrado area of Brazil. Braz. J. Food Technol. 2018, 21, e2016162. [Google Scholar] [CrossRef]
- Milani, A.P. Determinação das Propriedades de Produtos Armazenados para Projetos de Pressões e Fluxo em Silos. Ph.D. Thesis, Universidade de São Paulo, São Paulo, Brazil, 1993. [Google Scholar]
- BMHB—British Materials Handling Board. Draft Code of Practice for the Design of Silos, Bins, Bunkers and Hoppers; British Materials Handling Board: London, UK, 1985. [Google Scholar]
- Jan, S.; Ghoroi, C.; Saxena, D.C. Characterization of bulk and shear properties of basmati and non-basmati rice flour. J. Sci. Food Agric. 2018, 98, 667–673. [Google Scholar] [CrossRef] [PubMed]
- DIN 1055-6: 2005-03; Actions on Structures, Part—6 Design Loads for Buildings: Loads in Silo Bins. German Standard: Dubai, United Arab Emirates, 2005.
- Brasil, Ministério da Agricultura e Reforma Agrária, Secretaria Nacional de Defesa Agropecuária. Regras para Análise de Sementes; Secretaria Nacional de Defesa Agropecuária: Brasília, Brazil, 2009. [Google Scholar]
- Baryeh, E.A. Physical properties of bambara groundnuts. J. Food Eng. 2001, 47, 321–326. [Google Scholar] [CrossRef]
- Duffy, S.P.; Puri, V.M. Flowability parameters and flow functions for confectionery sugar and detergent powder at two moisture contents. App. Eng. Agric. 1996, 12, 601–606. [Google Scholar] [CrossRef]
- Geldart, D.; Abdullah, E.C.; Verlinden, A. Characterisation of dry powders. Powder Technol. 2009, 190, 70–74. [Google Scholar] [CrossRef]
- Medeiros, M.L.; Lannes, S.C.S. Propriedades físicas de substitutos de cacau. Ciênc. Tecnol. Alim. 2010, 30, 243–253. [Google Scholar] [CrossRef]
- Tomasetta, I.; Barletta, D.; Lettieri, P.; Poletto, M. The measurement of powder flow properties with a mechanically stirred aerated bed. Chem. Eng. Sci. 2012, 69, 373–381. [Google Scholar] [CrossRef]
- Silva, F.S.; Corrêa, P.C.; Goneli, A.L.D.; Ribeiro, R.M.; Afonso Júnior, P.C. Efeito do beneficiamento nas propriedades físicas e mecânicas dos grãos de arroz de distintas variedades. Rev. Bras. Prod. Agroind. 2003, 5, 33–41. [Google Scholar] [CrossRef]
- Jenike, A.W. Storage and flow of solids; University of Utah: Salt Lake City, UT, USA, 1980; 197p. [Google Scholar]


| Roast | T (°C) | Storage Time (Days) | Particle Size | |||
|---|---|---|---|---|---|---|
| Whole | Fine | Medium | Coarse | |||
| ML | 10 | 0 | 0.5742 ± 0.0888 | 0.5349 ± 0.0577 | 0.4188 ± 0.0465 | 0.3950 ± 0.0405 |
| 30 | 0.2294 ± 0.2263 | 0.5459 ± 0.0890 | 0.6177 ± 0.1061 | 0.5064 ± 0.1941 | ||
| 60 | 0.4798 ± 0.1048 | 0.5200 ± 0.0214 | 0.4313 ± 0.0900 | 0.4008 ± 0.2822 | ||
| 120 | 0.4876 ± 0.0475 | 0.6442 ± 0.0680 | 0.6174 ± 0.0461 | 0.2926 ± 0.1798 | ||
| 180 | 0.3436 ± 0.1406 | 0.5479 ± 0.0970 | 0.5496 ± 0.0444 | 0.3480 ± 0.0917 | ||
| 30 | 0 | 0.5742 ± 0.0888 | 0.5349 ± 0.0577 | 0.4188 ± 0.0465 | 0.3950 ± 0.0405 | |
| 30 | 0.3180 ± 0.1996 | 0.7024 ± 0.1133 | 0.6809 ± 0.0834 | 0.5840 ± 0.0834 | ||
| 60 | 0.4897 ± 0.0691 | 0.4432 ± 0.0206 | 0.4753 ± 0.0407 | 0.2350 ± 0.0569 | ||
| 120 | 0.4869 ± 0.0486 | 0.6845 ± 0.0465 | 0.6043 ± 0.0610 | 0.3877 ± 0.0462 | ||
| 180 | 0.3610 ± 0.0664 | 0.5151 ± 0.0841 | 0.4355 ± 0.0924 | 0.3490 ± 0.1415 | ||
| MD | 10 | 0 | 0.6811 ± 0.0469 | 0.5349 ± 0.0281 | 0.4744 ± 0.1547 | 0.4981 ± 0.1852 |
| 30 | 0.5201 ± 0.0597 | 0.6862 ± 0.0683 | 0.5992 ± 0.0881 | 0.3754 ± 0.2231 | ||
| 60 | 0.4367 ± 0.0449 | 0.5329 ± 0.0398 | 0.5258 ± 0.1285 | 0.5344 ± 0.1120 | ||
| 120 | 0.5228 ± 0.0124 | 0.5558 ± 0.1152 | 0.7609 ± 0.1793 | 0.4400 ± 0.2479 | ||
| 180 | 0.3320 ± 0.0582 | 0.5778 ± 0.0384 | 0.6191 ± 0.0703 | 0.4124 ± 0.0334 | ||
| 30 | 0 | 0.6811 ± 0.0469 | 0.5349 ± 0.0281 | 0.4744 ± 0.1547 | 0.4981 ± 0.1852 | |
| 30 | 0.5186 ± 0.0791 | 0.6832 ± 0.0948 | 0.5829 ± 0.0205 | 0.3940 ± 0.2193 | ||
| 60 | 0.4602 ± 0.0599 | 0.4540 ± 0.0850 | 0.4538 ± 0.0236 | 0.2730 ± 0.2064 | ||
| 120 | 0.5092 ± 0.0385 | 0.6333 ± 0.0330 | 0.6589 ± 0.0359 | 0.5472 ± 0.2127 | ||
| 180 | 0.5246 ± 0.0369 | 0.4963 ± 0.0464 | 0.4967 ± 0.0327 | 0.5419 ± 0.1532 | ||
| Roast | T (°C) | Storage Time (Days) | Particle Size | |||
|---|---|---|---|---|---|---|
| Whole | Fine | Medium | Coarse | |||
| ML | 10 | 0 | 0.3848 ± 0.0035 | 0.5488 ± 0.0072 | 0.5003 ± 0.0081 | 0.4614 ± 0.0053 |
| 30 | 0.3106 ± 0.0033 | 0.5261 ± 0.0069 | 0.5044 ± 0.0034 | 0.4240 ± 0.0028 | ||
| 60 | 0.2380 ± 0.0021 | 0.4352 ± 0.0022 | 0.4125 ± 0.0077 | 0.2733 ± 0.0057 | ||
| 120 | 0.2572 ± 0.0031 | 0.5773 ± 0.0024 | 0.5315 ± 0.0082 | 0.5308 ± 0.0036 | ||
| 180 | 0.2903 ± 0.0016 | 0.4704 ± 0.0054 | 0.4046 ± 0.0041 | 0.5163 ± 0.0044 | ||
| 30 | 0 | 0.3848 ± 0.0035 | 0.5488 ± 0.0072 | 0.5003 ± 0.0081 | 0.4614 ± 0.0053 | |
| 30 | 0.3079 ± 0.0020 | 0.4995 ± 0.0067 | 0.4921 ± 0.0043 | 0.3798 ± 0.0018 | ||
| 60 | 0.2667 ± 0.0039 | 0.4337 ± 0.0067 | 0.3879 ± 0.0073 | 0.2857 ± 0.0035 | ||
| 120 | 0.3639 ± 0.0041 | 0.5143 ± 0.0045 | 0.4478 ± 0.0029 | 0.4084 ± 0.0041 | ||
| 180 | 0.3865 ± 0.0031 | 0.0.5513 ± 0.0073 | 0.5095 ± 0.0044 | 0.4473 ± 0.0021 | ||
| MD | 10 | 0 | 0.3752 ± 0.0116 | 0.5235 ± 0.0078 | 0.4529 ± 0.0053 | 0.3825 ± 0.0042 |
| 30 | 0.3498 ± 0.0053 | 0.5391 ± 0.0045 | 0.4799 ± 0.0062 | 0.4430 ± 0.0054 | ||
| 60 | 0.2777 ± 0.0044 | 0.4493 ± 0.0042 | 0.4524 ± 0.0067 | 0.3040 ± 0.0019 | ||
| 120 | 0.3250 ± 0.0018 | 0.5176 ± 0.0068 | 0.5224 ± 0.0029 | 0.4428 ± 0.0036 | ||
| 180 | 0.3002 ± 0.0016 | 0.4807 ± 0.0065 | 0.4620 ± 0.0021 | 0.4558 ± 0.0021 | ||
| 30 | 0 | 0.3752 ± 0.0116 | 0.5235 ± 0.0078 | 0.4529 ± 0.0053 | 0.3825 ± 0.0042 | |
| 30 | 0.3689 ± 0.0043 | 0.4939 ± 0.0062 | 0.4865 ± 0.0032 | 0.4413 ± 0.0025 | ||
| 60 | 0.2543 ± 0.0039 | 0.4494 ± 0.0055 | 0.3839 ± 0.0053 | 0.3308 ± 0.0039 | ||
| 120 | 0.3090 ± 0.0030 | 0.5366 ± 0.0045 | 0.5500 ± 0.0056 | 0.4273 ± 0.0031 | ||
| 180 | 0.3686 ± 0.0041 | 0.5604 ± 0.0087 | 0.5422 ± 0.0034 | 0.4906 ± 0.0033 | ||
| Roast | T (°C) | Storage Time (Days) | Particle Size | |||
|---|---|---|---|---|---|---|
| Whole | Fine | Medium | Coarse | |||
| ML | 10 | 0 | 0.2413 ± 0.0222 | 0.4855 ± 0.0358 | 0.4381 ± 0.0380 | 0.3282 ± 0.0199 |
| 30 | 0.2165 ± 0.0172 | 0.4977 ± 0.0373 | 0.4364 ± 0.0303 | 0.2893 ± 0.0186 | ||
| 60 | 0.2297 ± 0.0250 | 0.4373 ± 0.0215 | 0.3563 ± 0.0295 | 0.2701 ± 0.0181 | ||
| 120 | 0.1954 ± 0.0182 | 0.5130 ± 0.0336 | 0.4098 ± 0.1000 | 0.3430 ± 0.0183 | ||
| 180 | 0.2558 ± 0.0287 | 0.5008 ± 0.0210 | 0.3401 ± 0.0935 | 0.3477 ± 0.0271 | ||
| 30 | 0 | 0.2413 ± 0.0222 | 0.4855 ± 0.0358 | 0.4381 ± 0.0380 | 0.3282 ± 0.0199 | |
| 30 | 0.2367 ± 0.0189 | 0.4951 ± 0.0253 | 0.4577 ± 0.0268 | 0.3132 ±0. 0307 | ||
| 60 | 0.2292 ± 0.0177 | 0.3832 ± 0.0131 | 0.3471 ± 0.0217 | 0.2660 ± 0.0237 | ||
| 120 | 0.2789 ± 0.0264 | 0.5680 ± 0.0203 | 0.3944 ± 0.0601 | 0.4399 ± 0.0251 | ||
| 180 | 0.3425 ± 0.0225 | 0.5123 ± 0.1154 | 0.4545 ± 0.0297 | 0.3747 ± 0.0238 | ||
| MD | 10 | 0 | 0.2241 ± 0.0100 | 0.2296 ± 0.0175 | 0.4596 ± 0.0397 | 0.3580 ± 0.0441 |
| 30 | 0.2450 ± 0.0217 | 0.5514 ± 0.0229 | 0.4877 ± 0.0216 | 0.2782 ± 0.0182 | ||
| 60 | 0.1985 ± 0.0218 | 0.4215 ± 0.0162 | 0.3986 ± 0.0298 | 0.3093 ± 0.0195 | ||
| 120 | 0.2505 ± 0.0113 | 0.5373 ± 0.0243 | 0.4154 ± 0.0960 | 0.4873 ± 0.0136 | ||
| 180 | 0.3162 ± 0.0272 | 0.4686 ± 0.0395 | 0.3649 ± 0.1009 | 0.3610 ± 0.0344 | ||
| 30 | 0 | 0.2241 ± 0.0100 | 0.2296 ± 0.0175 | 0.4596 ± 0.0397 | 0.3580 ± 0.0441 | |
| 30 | 0.2387 ± 0.0152 | 0.5396 ± 0.0133 | 0.4670 ± 0.0425 | 0.4604 ± 0.0169 | ||
| 60 | 0.2366 ± 0.0154 | 0.3946 ± 0.0258 | 0.3193 ± 0.0141 | 0.3714 ± 0.0233 | ||
| 120 | 0.3186 ± 0.0175 | 0.5493 ± 0.0173 | 0.4344 ± 0.0910 | 0.4091 ± 0.0056 | ||
| 180 | 0.3866 ± 0.0205 | 0.5699 ± 0.0329 | 0.4978 ± 0.0491 | 0.4441 ± 0.0331 | ||
| Roast | T (°C) | Storage Time (Days) | Particle Size | |||
|---|---|---|---|---|---|---|
| Whole | Fine | Medium | Coarse | |||
| ML | 10 | 0 | 0.2314 ± 0.0167 | 0.3799 ± 0.0105 | 0.3216 ± 0.0231 | 0.2730 ± 0.0103 |
| 30 | 0.1983 ± 0.0145 | 0.3919 ± 0.0146 | 0.3527 ± 0.0162 | 0.2960 ± 0.0084 | ||
| 60 | 0.2754 ± 0.0148 | 0.3547 ± 0.0214 | 0.2801 ± 0.0143 | 0.2632 ± 0.0189 | ||
| 120 | 0.1562 ± 0.0183 | 0.3545 ± 0.0109 | 0.3519 ± 0.0079 | 0.3300 ± 0.0147 | ||
| 180 | 0.2211 ± 0.0092 | 0.3960 ± 0.0194 | 0.2842 ± 0.0158 | 0.2769 ± 0.0139 | ||
| 30 | 0 | 0.2314 ± 0.0167 | 0.3799 ± 0.0105 | 0.3216 ± 0.0231 | 0.2730 ± 0.0103 | |
| 30 | 0.2290 ± 0.0097 | 0.3458 ± 0.0176 | 0.3659 ± 0.0356 | 0.3123 ± 0.0293 | ||
| 60 | 0.1995 ± 0.0109 | 0.3705 ± 0.0166 | 0.2909 ± 0.0138 | 0.2713 ± 0.0284 | ||
| 120 | 0.2823 ± 0.0163 | 0.4292 ± 0.0272 | 0.3604 ± 0.0079 | 0.2943 ± 0.0134 | ||
| 180 | 0.3295 ± 0.0132 | 0.4588 ± 0.0312 | 0.4266 ± 0.0209 | 0.3490 ± 0.0210 | ||
| MD | 10 | 0 | 0.2222 ± 0.0092 | 0.2314 ± 0.0085 | 0.3505 ± 0.0120 | 0.3239 ± 0.0157 |
| 30 | 0.2401 ± 0.0187 | 0.4057 ± 0.0193 | 0.3640 ± 0.0209 | 0.2840 ± 0.0122 | ||
| 60 | 0.1932 ± 0.0234 | 0.3318 ± 0.0351 | 0.2921 ± 0.0139 | 0.2251 ± 0.0240 | ||
| 120 | 0.2249 ± 0.0126 | 0.3749 ± 0.0299 | 0.3606 ± 0.0060 | 0.2965 ± 0.0129 | ||
| 180 | 0.2470 ± 0.0127 | 0.3631 ± 0.0198 | 0.3018 ± 0.0085 | 0.2385 ± 0.0209 | ||
| 30 | 0 | 0.2222 ± 0.0092 | 0.2314 ± 0.0085 | 0.3505 ± 0.0120 | 0.3239 ± 0.0157 | |
| 30 | 0.2144 ± 0.0110 | 0.4051 ± 0.0117 | 0.3612 ± 0.0505 | 0.3385 ± 0.0204 | ||
| 60 | 0.2102 ± 0.0123 | 0.3589 ± 0.0199 | 0.3041 ± 0.0134 | 0.2622 ± 0.0200 | ||
| 120 | 0.3141 ± 0.0100 | 0.4536 ± 0.0264 | 0.3795 ± 0.0046 | 0.3111 ± 0.0191 | ||
| 180 | 0.3732 ± 0.0100 | 0.5097 ± 0.0242 | 0.4614 ± 0.0144 | 0.3826 ± 0.0172 | ||
| Storage Time (Days) | Particle Sizes 1 | |||
|---|---|---|---|---|
| Whole Coffee | Fine | Medium | Coarse | |
| 0 | 0.600 ± 0.055 abcB | 0.542 ± 0.024 cAB | 0.632 ± 0.030 bA | 0.665 ± 0.073 abA |
| 30 | 0.646 ± 0.047 abAB | 0.516 ± 0.098 cdAB | 0.532 ± 0.034 cB | 0.602 ± 0.072 bA |
| 60 | 0.676 ± 0.066 aAB | 0.597 ± 0.021 aA | 0.637 ± 0.028 aA | 0.679 ± 0.093 aA |
| 120 | 0.654 ± 0.024 abAB | 0.461 ± 0.022 cdB | 0.506 ± 0.017 cB | 0.613 ± 0.080 bA |
| 180 | 0.703 ± 0.023 aA | 0.565 ± 0.025 bA | 0.595 ± 0.015 bAB | 0.596 ± 0.072 bA |
| Storage Time (Days) | Particle Sizes 1 | |||
|---|---|---|---|---|
| Whole Coffee | Fine | Medium | Coarse | |
| 0 | 0.525 ± 0.028 aD | 0.536 ± 0.002 aAC | 0.520 ± 0.079 aBC | 0.560 ± 0.026 aB |
| 30 | 0.638 ± 0.045 aB | 0.448 ± 0.014 dB | 0.506 ± 0.020 cBC | 0.557 ± 0.032 bB |
| 60 | 0.705 ± 0.039 aA | 0.598 ± 0.035 bA | 0.610 ± 0.037 bA | 0.590 ± 0.098 bAB |
| 120 | 0.619 ± 0.013 aBC | 0.483 ± 0.030 bBC | 0.460 ± 0.047 bB | 0.564 ± 0.072 aB |
| 180 | 0.654 ± 0.051 aAC | 0.561 ± 0.018 bA | 0.587 ± 0.013 abAC | 0.646 ± 0.030 aA |
Disclaimer/Publisher’s Note: The statements, opinions and data contained in all publications are solely those of the individual author(s) and contributor(s) and not of MDPI and/or the editor(s). MDPI and/or the editor(s) disclaim responsibility for any injury to people or property resulting from any ideas, methods, instructions or products referred to in the content. |
© 2025 by the authors. Licensee MDPI, Basel, Switzerland. This article is an open access article distributed under the terms and conditions of the Creative Commons Attribution (CC BY) license (https://creativecommons.org/licenses/by/4.0/).
Share and Cite
Oliveira, G.H.H.d.; Corrêa, P.C.; Oliveira, A.P.L.R.d.; Vargas-Elías, G.A.; Calil Junior, C. Evaluation of the Flow Properties of Coffea canephora During Storage as Affected by Roasting Level, Particle Size, and Storage Temperature. AgriEngineering 2025, 7, 84. https://doi.org/10.3390/agriengineering7030084
Oliveira GHHd, Corrêa PC, Oliveira APLRd, Vargas-Elías GA, Calil Junior C. Evaluation of the Flow Properties of Coffea canephora During Storage as Affected by Roasting Level, Particle Size, and Storage Temperature. AgriEngineering. 2025; 7(3):84. https://doi.org/10.3390/agriengineering7030084
Chicago/Turabian StyleOliveira, Gabriel Henrique Horta de, Paulo Cesar Corrêa, Ana Paula Lelis Rodrigues de Oliveira, Guillermo Asdrúbal Vargas-Elías, and Carlito Calil Junior. 2025. "Evaluation of the Flow Properties of Coffea canephora During Storage as Affected by Roasting Level, Particle Size, and Storage Temperature" AgriEngineering 7, no. 3: 84. https://doi.org/10.3390/agriengineering7030084
APA StyleOliveira, G. H. H. d., Corrêa, P. C., Oliveira, A. P. L. R. d., Vargas-Elías, G. A., & Calil Junior, C. (2025). Evaluation of the Flow Properties of Coffea canephora During Storage as Affected by Roasting Level, Particle Size, and Storage Temperature. AgriEngineering, 7(3), 84. https://doi.org/10.3390/agriengineering7030084