Abstract
This study introduces an IoT-enabled smart greenhouse system tailored for rice cultivation and designed as a controlled experimental platform to evaluate fertilizer application methods. Traditional greenhouse farming often struggles with unpredictable weather, pest infestations, and inefficient resource use. To overcome these challenges, the proposed system optimizes environmental conditions and enables precise monitoring and control through the Thingsboard IoT platform, which tracks temperature, humidity, and sunlight intensity in real time. The cultivation process involved Inceptisol soil preparation, slurrying, fertilization, seeding, transplantation, and continuous monitoring. The novelty lies in its dual-purpose design, enabling both cultivation and structured agronomic experimentation under identical environmental conditions. The system enables both rice cultivation and comparative testing of nano-silica fertilizer applied via root (soil) and foliar (leaf) methods. Automated temperature control (maintaining 20–36.5 °C) and humidity regulation (10–85% RH) with a mist blower response time under 5 s ensured consistent conditions. Sensor accuracy was validated with deviations of 0.4% (±0.11 °C) and 0.77% (±0.5% RH). Compared to conventional setups, this system achieved superior environmental stability and control precision, improving experimental reproducibility. Its integration potential with machine learning models opens new possibilities for forecasting plant responses based on historical data. Overall, the study demonstrates how advanced technology can enhance agricultural precision, sustainability, and research reliability.
1. Introduction
Global demand for rice has continued to rise in recent years, prompting the need for innovations in agricultural practices to ensure sustainable and efficient production. Traditional rice cultivation is challenged by unpredictable weather, pest infestations, and limited resource availability, all of which can adversely affect crop yield and quality. To overcome these limitations, the integration of technology into agriculture, particularly through smart farming systems, has emerged as a promising solution. Smart farming leverages Internet of Things (IoT) technology, automation, and data analytics to enhance agricultural efficiency, optimize resource management, and improve crop productivity [,].
Recent developments in smart farming systems have introduced advanced sensor technologies, automated control mechanisms, and real-time data processing capabilities []. IoT-enabled greenhouses are specifically designed to monitor and regulate environmental parameters such as temperature, humidity, and soil moisture, thereby creating optimal conditions for plant growth []. These systems often incorporate machine learning algorithms to interpret data and generate actionable insights, supporting better decision-making and resource allocation []. Furthermore, improvements in wireless communication and cloud computing have enabled seamless integration of IoT devices, forming a responsive and interconnected agricultural ecosystem [,].
The convergence of IoT and artificial intelligence (AI) technologies has significantly advanced smart agriculture. In greenhouse applications, IoT systems integrate diverse sensors and communication protocols to optimize crop production and resource efficiency []. AIoT enhances intelligent decision-making, predictive analytics, and real-time monitoring []. Despite challenges such as data security and infrastructure costs, IoT continues to drive precision farming and smart irrigation []. Hardware and communication innovations contribute to improved productivity and sustainability [], while IoT applications in early fire detection and water management bolster agricultural resilience [,]. Nonetheless, economic and technical barriers remain in deploying smart sensors across agricultural settings [,,,,]. The integration of AI and IoT supports enhanced data analysis and decision-making in precision agriculture [,,,,,], with ongoing research highlighting the transformative potential of IoT in improving efficiency, reducing resource consumption, and increasing yields [].
Despite these advancements, several gaps persist in the development of intelligent farming systems. High implementation and maintenance costs pose challenges for small-scale farmers [], and interoperability issues among IoT devices hinder widespread adoption due to the lack of standardized protocols []. Moreover, long-term studies are needed to assess the impacts of IoT-based agriculture on crop performance, soil health, and environmental sustainability [,].
In parallel, nano-silica has emerged as a promising fertilizer, with foliar spraying proving more effective than soil or root application. Foliar application enhances rice plant height and biomass under both normal and stress conditions [], as nano-silica is absorbed through leaf apoplast and distributed efficiently []. Soil application, by contrast, suffers from adsorption, desorption, and polymerization reactions influenced by concentration and pH, leading to significant losses and higher dosage requirements []. Foliar spraying also boosts proline levels and antioxidant enzyme activity, improving tolerance to abiotic stress [], particularly in saline and alkaline soils [].
However, to rigorously evaluate the comparative effectiveness of these application methods, a precision-controlled farming system is essential. Most existing greenhouse systems are designed for production or simulation, not for structured experimentation. This study addresses that gap by developing an IoT-equipped smart greenhouse system specifically designed as a comparative testing platform. With automated temperature control and humidity regulation, the system enables parallel testing of nano-silica fertilizer via soil and foliar application under identical environmental conditions. This transforms the greenhouse into a valid and replicable research environment, capable of supporting experimental agronomy and input optimization.
Previous IoT-based greenhouse systems often lacked experimental flexibility, suffered from limited sensor integration, and were designed primarily for production rather than research. These limitations motivated the development of our system, which integrates real-time monitoring, automated control, and modular treatment zones. The objective of this study is to evaluate the effectiveness of nano-silica fertilizer applied via foliar and soil methods under controlled conditions. We hypothesize that foliar application will yield superior plant growth due to better nutrient absorption. Key contributions of this work include development of a modular IoT-enhanced greenhouse for rice experimentation, integration of real-time sensor data with automated control systems, comparative evaluation framework for fertilizer application methods, and validation of sensor accuracy and environmental stability.
Several studies have explored IoT applications in agriculture, including greenhouse automation and smart irrigation. However, most systems focus on production optimization rather than structured experimentation. For example, previous greenhouse designs have incorporated temperature and humidity control but lacked comparative treatment zones for evaluating input strategies [,,,]. Other implementations of sensor-based irrigation systems often omit validation of sensor accuracy, which is critical for reliable environmental control [,,]. In contrast, our system introduces a dual-purpose design with replicated treatment containers, validated sensors, and real-time cloud monitoring. Components such as the ESP32 microcontroller, Thingsboard platform, and mist blower control were either newly implemented or modified to support experimental rigor.
Accordingly, this study seeks to address two main research questions. The first concerns the design and performance of an IoT-enabled smart greenhouse capable of maintaining precise and stable environmental conditions to support structured agronomic experimentation. The second focuses on evaluating the system’s capability to facilitate controlled comparative experiments—specifically, assessing the differences between foliar and soil applications of nano-silica fertilizer at varying dosages (100, 200, and 300 kg/ha) on rice plants under identical environmental conditions. To rigorously compare the effectiveness of nano-silica fertilizer applied via foliar and soil methods, a precision-controlled environment is essential. The IoT-enabled greenhouse developed in this study provides such a platform by maintaining uniform temperature and humidity, also monitoring light intensity across treatment zones. This allows for direct attribution of plant response differences to the fertilizer application method rather than environmental variability. The integration of IoT technology thus plays a critical role in ensuring experimental validity and repeatability. By integrating advanced technologies into a structured experimental framework, this research contributes to the development of sustainable, efficient, and data-driven rice farming research practices. The system also holds potential for broader applications, including testing various fertilizer formulations, optimizing dosage and timing, and enabling predictive modeling of plant responses through future integration with machine learning.
Unlike most previous IoT-based greenhouse systems that mainly focus on production optimization or environmental control, this study introduces a dual-purpose IoT-enabled greenhouse platform specifically designed for comparative agronomic experimentation under identical environmental conditions. The system combines validated environmental control precision, maintaining temperature (20–36.5 °C) and humidity (10–85% RH) with high sensor accuracy (0.4% ± 0.11 °C and 0.77% ± 0.5% RH)—with a modular treatment structure that allows for parallel evaluation of foliar and soil fertilization methods. Furthermore, the experiment integrates a dosage optimization framework (100, 200, and 300 kg/ha) for both application modes, demonstrating how the platform can be extended to future machine learning-based predictive modeling of dosage–response relationships. This combination of real-time control precision and structured comparative design establishes a novel, replicable, and data-driven experimental platform for smart farming research.
2. Design of Control and Monitoring System
2.1. Design of Greenhouse Smart Farming System
The research scenario is a test rice plant with an integrated greenhouse system with an IoT-based instrumentation system. The Greenhouse was built according to standards and is carried out in the design and build stages. The design begins with designing the greenhouse according to standards referring to the minimum greenhouse standards of the Ministry of Agriculture of the Republic of Indonesia as shown in Figure 1. The greenhouse dimensions (14 m × 3.5 m) and flow rates for irrigation (7.7 L/min for drip, 6.5 L/min for foliar spray).
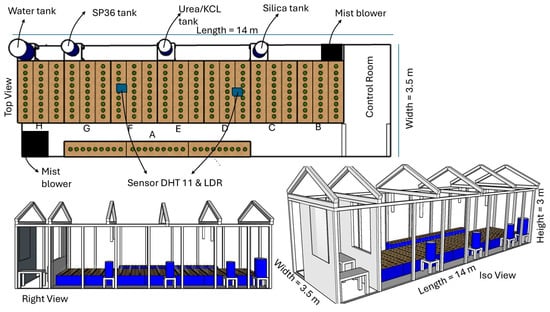
Figure 1.
Greenhouse Design.
Figure 2 shows the Integrated Block Diagram of a greenhouse system that integrates environmental sensors (DHT11 for temperature/RH, LDR light sensor), ESP32/Mega2560 based microcontroller, IoT platform (Thingsboard and Google Sheets) for real-time visualization, cloud storage, and historical data. DTH11 sensor data is used to control the mist blower actuator, while the water pump actuator, automatic valve are used as actions in the fertilization and irrigation process which then affect the planting system (rice plant containers, fertilizer tanks, and leaf and soil management).
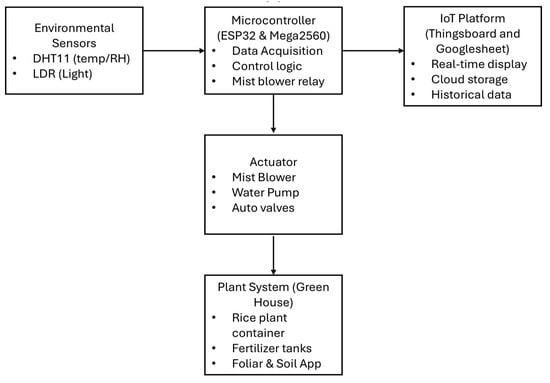
Figure 2.
Integrated Block Diagram of the system.
The greenhouse design is divided into two rooms: the control room and the planting room. In the planting room, there are 8 containers and 4 drums (one 200 L drum, three 120 L drums). These containers are used for various rice plant treatments, while the drums are filled with fertilizer and water for irrigation and fertilization. Each container is divided into 3 partitions, forming 3 rows. Each row contains 10 clumps of rice, with each clump containing 3 rice seeds. The containers and drums are designed in such a way that they can drain water and fertilizer easily. The drum containing water for irrigation is placed with 1 automatic valve that can be turned on by Arduino Mega2560 with each end of the pipe adjusted so that the flow is the same each time it enters the container. For drums containing urea, sp36 and kcl, 7 automatic valves are placed that can be turned on by Arduino Mega2560 with each end of the pipe adjusted so that the flow is the same each time it enters the container through the soil. Meanwhile, for the drum containing silica fertilizer, 3 automatic valves are placed which have also been adjusted to the fertilization treatment in each container (through leaves or roots). The irrigation and fertilization design can be seen in Figure 3.
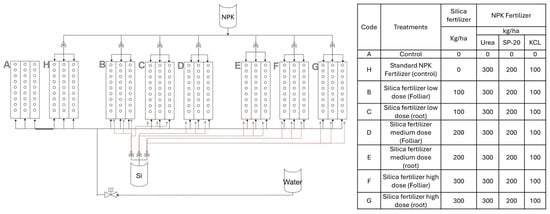
Figure 3.
Greenhouse piping design enables water and fertilizer spray management.
Irrigation and fertilization used a pump from the tank by setting the duration of the automatic valve opening and the duration of the pump on. The treatment was divided into 3 experimental sections: root application, foliar application, and control. The Greenhouse piping design enables water and fertilizer spray management shown in Figure 3. The planting scenario was divided into 8 treatments, with Container A serving as the absolute control (no fertilizer), while Container H received only NPK fertilizer. Containers B through G tested the silica treatments: B (foliar application of 100 kg/ha), C (soil application of 100 kg/ha), D (foliar application of 200 kg/ha), E (soil application of 200 kg/ha), F (foliar application of 300 kg/ha), and G (soil application of 300 kg/ha). Crucially, to isolate the effect of silica, all treatments from B through H received identical standard doses of NPK fertilizer applied to the soil (300 kg/ha of Urea, 200 kg/ha of SP-36, and 100 kg/ha of KCl). Each container was further divided into three sections, with each section containing 10 rice plants and forming one replication. This design ensured that each treatment combination was replicated three times (a total of 30 plants per treatment).
The supporting schematic design for the greenhouse irrigation process is shown in Figure 4. The design showed a diagram of the irrigation process through the roots and leaves. Water through the leaves with a sprayer. Irrigation and fertilization systems in rice crops are designed to be supported by instrumentation and IoT systems. Instrumentation and IoT-based systems can help users control the amount of irrigation and fertilization in specific doses depending on the planting substrate plot and its treatment. Plant treatment is carried out in two parts, namely, through the roots (drip) and leaves (foliar spray). Meanwhile, the dosage for plants is divided into four dosages: low, medium, high and control doses.
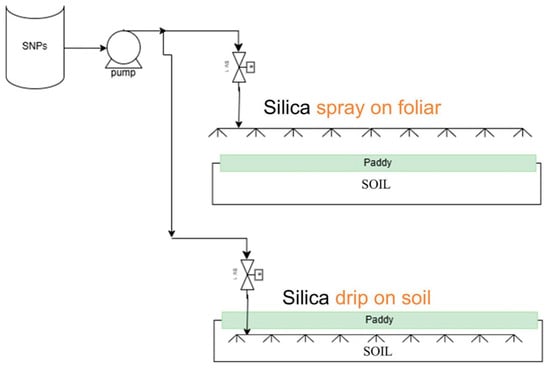
Figure 4.
General Process Scheme: drip and spray system.
In tank one, which contains silica nanoparticles (SNPs) with different nano-silica concentrations (100, 200, 300 kg/ha), solution pH (6.5), and application rates (7.7 L/min for foliar spray, 6.5 L/min for soil irrigation), both irrigation and foliar spray schemes will be delivered from this tank. Irrigation is alternated during the fertilizer application process. Then, the other two tanks contain standard fertilizers (urea, KCl, etc.) and are applied by the flood method. The fourth tank contains only water, also applied by the flood method. The application of SNP fertilizers is developed by spraying with a nozzle.
Greenhouse Smart Farming System using sensor systems to measure temperature, humidity, and sunlight intensity for optimizing plant growth control as shown in Figure 5. Where this temperature value is used as a control parameter to turn on the mist blower. By precisely regulating those environmental factors in real time can enable precise management of environmental conditions, which leads to improved crop quality, increased yields, and resource efficiency. The system used consists of an ESP32 as the microcontroller built with Wi-Fi module, DHT11 sensor module for measuring temperature and environmental humidity, LDR sensor module SEN-0012 for measuring sunlight intensity and mist blower with SSR driver as a tool that will turn on if the greenhouse temperature becomes too hot. The measurement results from all sensors can be monitored and viewed in real time on the display located in the greenhouse control room and are stored in the cloud based on the Thingsboard and Googlesheet application using communication protocols MQTT for telemetry to Thingsboard and HTTP for Googlesheet access.

Figure 5.
IoT monitoring and control temperature system.
Thingsboard and Google Spreadsheet use a batch transmission method with a fixed interval every 3 min. For Thingsboard, this is done through the MQTT protocol, and for spreadsheets, it is done through HTTP/HTTPS. First, data from sensors is collected and then sent all at once in one request. The end-to-end latency for MQTT is about 200 ms, but for TLS handshake connections with Google Sheets, it can take longer depending on network conditions (between 1 and 3 s). This means that the system can respond almost in real time, which is an important aspect for precision agriculture’s dynamic environmental control. These improvements make sure that the smart greenhouse system not only gathers accurate data but also sends it quickly and reliably, which helps both scientific research and day-to-day operations.
In addition, the Greenhouse Smart Farming System also uses an Arduino Mega2560, Automatic Valve, Relay module driver and Nextion HMI display (Figure 6) to apply irrigation flow from the tank using a water pump. Fertilizer application is regulated based on the time when the pump flow rate is 7.7 L/minute for leaf spraying and 6.5 L/minute for soil irrigation.
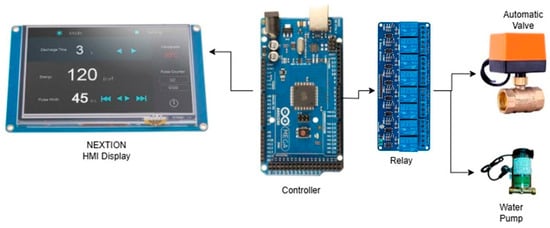
Figure 6.
Watering and fertilizing system.
2.2. Sensors
2.2.1. Temperature and Humidity Sensor
The DHT11 temperature and humidity sensor has a temperature and humidity sensor complex with a calibrated digital signal output. By using exclusive digital signal acquisition technology as well as temperature and humidity sensor technology, it ensures high reliability and excellent long-term stability. This sensor includes a resistance component for humidity measurement and an NTC temperature measurement component and is connected to a powerful 8-bit microcontroller, which provides excellent quality, fast response, anti-interference capability and cost-effectiveness.
Each DHT11 element is rigorously calibrated in the laboratory, making the humidity calibration extremely accurate. The calibration coefficients are stored as programs in OTP memory that are used by the sensor’s internal signal detection process. The single-wire serial interface enables quick and easy system integration. Its small size, low power consumption and signal transmission distance of up to 20 m make it the best choice for various applications, even the most demanding ones. The component is a single row 4-pin package. The connection is convenient, and special packages can be provided depending on the user’s needs. The DHT11 sensor module provides a temperature range from 0 °C to 50 °C and a humidity range from 20% to 90%, with high reliability due to factory calibration. The DHT11 is easy to connect with microcontrollers like Arduino and Raspberry Pi [].
2.2.2. Light-Dependent Resistance (LDR) Sensor
A cost-effective digital and analog sensor module that can measure and detect light intensity is the LDR sensor module SEN-0012. Another name for this sensor is photoresistor sensor. The light-dependent resistor (LDR) integrated into this sensor supports light detection. There are four connections on this sensor module. where the pins “DO” and “AO” stand for the digital and analog output, respectively. When there is no light, the performance of the module increases, and when there is light, it decreases. The sensitivity of the sensor can be changed using the integrated potentiometer.
The LDR sensor module consists mainly of the LDR, LM393 Comparators, Variable Resistor (Trim-pot), Power LED, and output LED. The LDR (or light-dependent resistor) is a type of variable resistor. It is also called a photoresistor. The light-dependent resistor (LDR) works on the principle of “photoconductivity”. The LDR changes according to the intensity of light falling on the LDR. As the light intensity on the LDR surface increases, the LDR decreases and the element conductivity increases. As the light intensity on the LDR surface decreases, the LDR increases and the element conductivity decreases.
The LDR sensor module has an integrated variable resistor or potentiometer. This variable resistor is preset to 10 kΩ. This sets the sensitivity of this LDR sensor. Rotate the preset knob to adjust the sensitivity of light intensity detection. If we rotate the preset knob clockwise, the sensitivity of light intensity detection will increase. If it is rotated counterclockwise, the sensitivity of light intensity detection will decrease [].
2.3. Control and IoT System
2.3.1. Control System
- Temperature Control
The temperature control system utilized a SSR (Solid State Relay) module that opens and closes a switch due to an input signal applied to the control circuit. The SSR module connects the DC+ terminal to the positive pole of the 5 Volt power supply. Then, DC- terminal connects to the negative pole of the power supply. The CH terminal serves as the relay module’s signal trigger terminal, which is connected to the digital output of Arduino esp32. The normally closed (NC) SSR was connected to an AC source, and the SSR’s COM pin was connected to the mist blower. The input signal is the temperature read from the Arduino. When the temperature is more than 30 °C, the Arduino sends the signal LOW to the SSR, activating the SSR and allowing for the current to flow through the circuit. When the temperature is less than 30 °C, the Arduino will send a HIGH signal to the SSR, then the circuit closes. The control flow chart of the system can be seen in Figure 7. Figure 8 shows a block diagram of the temperature room control system. The controller will ensure that the temperature of the greenhouse does not exceed 40 °C so that the set point temperature is set at 30 °C to turn on the blower.
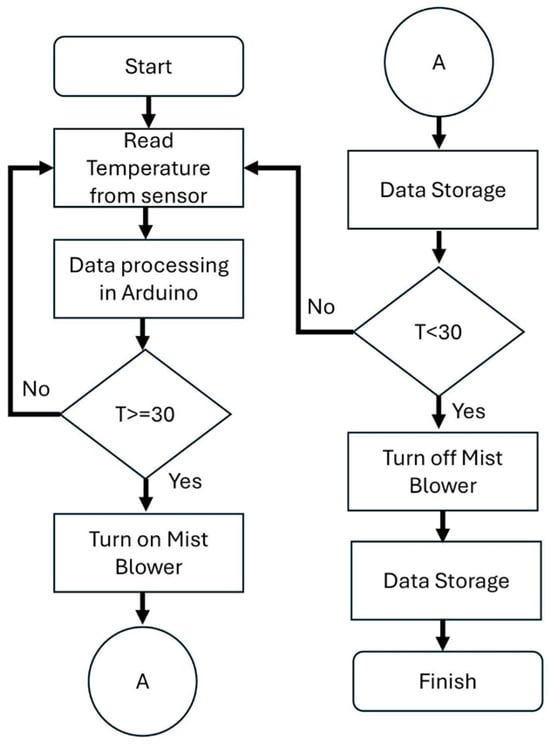
Figure 7.
Mist blower on–off control flowchart.

Figure 8.
Block diagram of temperature room control system.
- Flow Water Control
Watering and fertilizing the planting medium are measured using a timer to determine the flow rate in units of time or the flow rate of the liquid (Figure 9). The flow rate time of the liquid to be distributed to each planting medium is used as the delay time for each automatic valve or solenoid valve (SV) to activate the ON/OFF control. Thus, the liquid is distributed to only one SV at a time (and so on) based on the delay time. Figure 10 shows the flow diagram for controlling the on-off of a water pump, where the control process starts from determining the delay time and selecting the valve via the TFT screen, then the controller will continue the process.

Figure 9.
Block diagram of watering and fertilizing system.
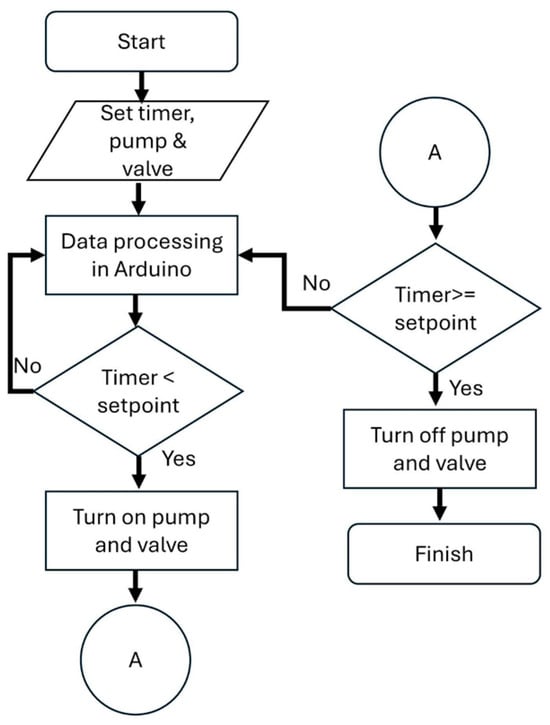
Figure 10.
Water pump on–off control flowchart.
2.3.2. Hardware Description of IoT System
The ESP32 Wi-Fi module enables the system to connect to a wireless network. The algorithm used by the ESP32 to retrieve data from the DHT11 and LDR sensors, then control the temperature by turning the mist blower on or off, and also to send the data to Thingsboard and Google Sheets, is shown in Figure 11. After integrating the library, the humidity, light intensity, and temperature variables as control variables, Wi-Fi access, and cloud configuration access are defined. Then, the ESP32 reads the sensor measurement data and sends it automatically and without external interference to Thingsboard and Google Sheets via a WLAN AP. The open-source Thingsboard IoT Application Program Interface (API) provides an Internet of Things platform that uses the MQTT publish-subscribe network protocol to store and retrieve temperature, humidity, and light intensity data. The three main actors in the message exchange process are the publisher, the MQTT broker, and the subscriber [,]. Thingsboard and Google Spreadsheet use a batch transmission method with a fixed interval every 3 min. For Thingsboard, this is done through the MQTT protocol, and for spreadsheets, it is done through HTTP/HTTPS. First, data from sensors is collected and then sent all at once in one request. The end-to-end latency for MQTT is about 200ms, but for TLS handshake connections with Google Sheets, it can take longer depending on network conditions (between 1 and 3 s). This means that the system can respond almost in real time, which is an important aspect for precision agriculture’s dynamic environmental control. These improvements make sure that the smart greenhouse system not only gathers accurate data but also sends it quickly and reliably, which helps both scientific research and day-to-day operations. Reliability testing was conducted over 7 days and showed 96.5% successful data transmission, with an average latency of 200 ms.
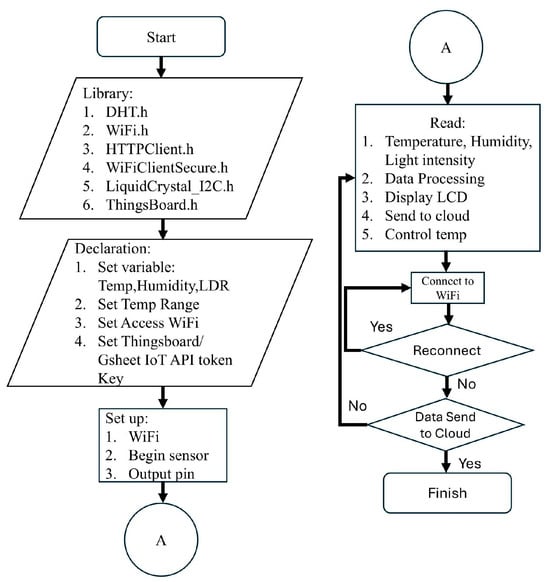
Figure 11.
The data collection and transmission algorithm using an Arduino esp32 to the Thingsboard IoT platform.
2.3.3. Sensor Characteristics
Sensor calibration was performed prior to deployment. The DHT11 sensor readings were compared with a calibrated Krisbow temperature and humidity sensor (±1 °C, ±5% RH), while the LDR sensor was validated against a Sanwa mobiken LX2 illuminance meter (±(5% + 1) below 3000 lx; ±(7.5% + 1) 3000 lx or higher). Calibration tests were conducted over a 24 h period under Greenhouse conditions. Table 1 shows the characteristics of the sensor. DHT11 showed an average deviation of 0.4% (±0.11 °C) and 0.77% (±0.5%RH), while the LDR sensor maintained a deviation within ±9.9% of reference values. These results confirm the sensors’ reliability for environmental monitoring in the greenhouse.

Table 1.
Characteristics of the sensor [].
2.4. Planting Design
During the growth period, standard urea fertilizer was applied three times, at 7, 21, and 36 days after planting. SP36 fertilizer was applied once, at 7 days after planting, while KCL fertilizer was applied twice, at 7 and 36 days after planting. Meanwhile, the application of silica nanoparticle (SNP) fertilizer was carried out 2 times, at 56 and 63 days after planting. The SNP application was regulated based on different doses, namely, low, medium, high, and control, where the concentrations used were 100, 200, and 300 kg/ha. The application was also carried out with two different treatments: root (flood irrigation) and foliar (foliar spray). Therefore, 8 planting media were needed to conduct the treatment test on these plants. Based on statistical treatment calculations, the number of plants to be tested for each planting medium was 10 plants with 3 replicates (30 plants).
The study employed a Randomized Complete Block Design (RCBD) to evaluate silica fertilizer efficacy. The experiment utilized eight planting containers (labeled A to H, each measuring 1.5 m × 2.0 m) arranged in a fixed sequence, with each container representing a distinct treatment. The treatments were systematically assigned as follows: Container A served as an absolute control (no fertilizer), while Container H received only NPK fertilizer. Containers B through G tested the silica treatments: B (foliar application at 100 kg/ha), C (soil application at 100 kg/ha), D (foliar at 200 kg/ha), E (soil at 200 kg/ha), F (foliar at 300 kg/ha), and G (soil at 300 kg/ha). Crucially, to isolate the effect of silica, all treatments from B to H received an identical, standardized dose of NPK fertilizer applied to the soil (300 kg/ha Urea, 200 kg/ha SP-36, and 100 kg/ha KCl). Each container was subdivided into three sections, with each section housing 10 rice plants and constituting one replica. This design ensured that each treatment combination was replicated three times (totaling 30 plants per treatment). While the assignment was systematic, this approach effectively controlled for spatial variation and provided a robust framework for the comparative analysis of silica fertilizer effects within the IoT-controlled environment.
3. Results & Discussion
3.1. IoT-Based Environmental Monitoring for Controlled Cultivation
Figure 12 and Figure 13 illustrate the real-time monitoring of temperature, humidity, and light intensity over a 24 h period. In Figure 12, an illustration of the temperature, humidity and light intensity values for a full day on 4 December 2025, can be seen via the Thingsboard application. The temperature remained within 27–31 °C range during the day, with a mean of 29 °C and standard deviation of ±0.8 °C against the setpoint value of 30 °C, indicating effective mist blower regulation. Humidity levels averaged 77% RH, while light intensity peaked during the day, represented by a value of 0 ADC bits. This 0 bit ADC value means that the light intensity is above 14 Klx. At night, the temperature could be as low as 21.4–22 °C, where this value was more stable. The average humidity level at night was 72% RH, while there was no light intensity at night, represented by 4095 ADC bits. This 4095 bit ADC value means that the lux value is around less than 11 lx. These stable conditions validate the system’s capability to maintain consistent microclimates, essential for controlled agronomic experimentation. The data also demonstrate the responsiveness of the IoT system to environmental fluctuations. Meanwhile, Figure 13 displays the monitoring results in the Google Spreadsheet application throughout the day. The system incorporates a data preprocessing stage, where raw sensor readings are filtered to remove outliers, normalized, and grouped into consistent time intervals (e.g., every 3 min).
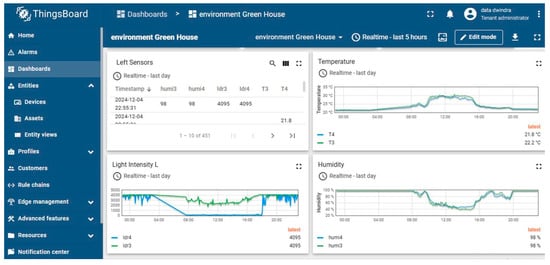
Figure 12.
Thingsboard IoT platform display.
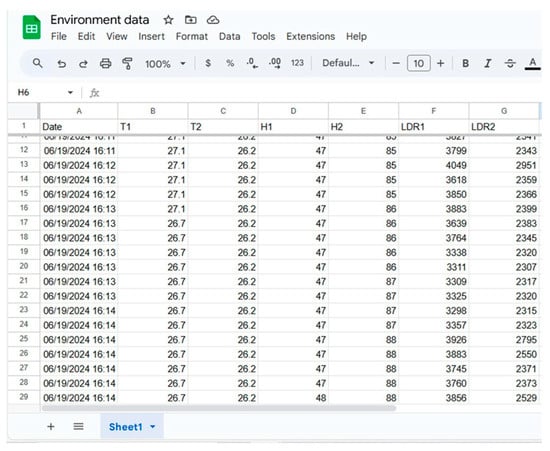
Figure 13.
Data display in Google Sheet.
In detail, before data is sent to the cloud, data processing is performed first. The data preprocessing process includes physical range validation to ensure sensor readings are within limits (temperature: 0–100 °C, humidity: 0–100 %, LDR: 11–14,000 lx), the application of data averaging from two redundant sensors for each parameter (temperature, humidity, and light intensity) to reduce noise and increase reliability, as well as a cross-checking mechanism that selects the highest value of the two temperature readings as the basis for control decisions to ensure the system always responds to the most critical conditions, followed by the necessary data type conversion to prepare data transmission that is compatible with cloud communication protocols. The system also implements an error handling mechanism that includes network connectivity that automatically detects Wi-Fi status and performs reconnection when the connection is lost, equipped with Thingsboard connection validation before data transmission that will initiate reconnection if a failure occurs, as well as the implementation of interval-based transmission with variables that prevent continuous data transmission and provide recovery time when an error occurs, while on the control side, time-based execution is implemented with time variables that ensure the stability of actuator operation even though there is latency in sensor readings.
To overcome communication latency in our IoT system, the program has implemented decoupling between the real-time control process and data transmission through a separate timing mechanism, where the actuator (mist blower) control is executed every 50 s based on a time variable independently from the data sending process to the cloud which is performed every 3 min based on a variable, so that critical control decisions are not affected by latency or internet connection failures, while the use of non-blocking delay with an increment counter ensures that the system’s responsiveness is maintained without being hampered by long-consuming communication operations.
The process of sending data to Thingsboard and Google Spreadsheet uses a batch transmission method with a fixed interval every 3 min via the MQTT protocol for Thingsboard and HTTP/HTTPS for spreadsheets, where data from sensors is collected first and then sent simultaneously in one request, with an end-to-end latency value of around 200 ms for MQTT, while spreadsheets tend to take longer depending on network conditions (between 1 and 3 s) for TLS handshake connections with Google Sheets. This indicates that the system is capable of near real-time responsiveness-an essential feature for dynamic environmental control in precision agriculture. Together, these enhancements ensure that the smart greenhouse system not only collects accurate data but also transmits it efficiently and reliably, supporting both operational performance and scientific experimentation.
This dual-mode accessibility—live monitoring and retrospective data logging—enhances the analytical robustness of the system and supports longitudinal studies.
The integration of Thingsboard with ESP32 microcontrollers and sensor arrays reflects the broader trend in smart agriculture toward cyber-physical systems that combine sensing, control, and data analytics [,,,]. Such systems enable researchers to maintain environmental parameters within tightly controlled thresholds, which is particularly critical when conducting comparative experiments, such as evaluating the efficacy of nano-silica fertilizer via foliar versus soil application. By minimizing external variability, the greenhouse functions as a replicable and scalable platform for experimental agronomy.
Moreover, the ability to export structured datasets facilitates statistical analysis and modeling, allowing researchers to correlate environmental conditions with plant responses. This supports the development of predictive frameworks and decision-support tools, as emphasized in the recent literature on AIoT applications in agriculture [,,]. The system’s responsiveness and data fidelity thus contribute not only to operational efficiency but also to scientific rigor in agricultural experimentation.
In summary, the environmental monitoring infrastructure established through Thingsboard and supporting technologies provides a foundation for precision-controlled cultivation. It transforms the greenhouse from a passive growing space into an active research environment, capable of supporting complex experimental designs and advancing the frontiers of smart farming.
3.2. Planting Design Result
3.2.1. Greenhouse with IoT System
The developed greenhouse system, integrated with an IoT-based instrumentation and control framework, is shown in Figure 14. This system was designed to support precision rice cultivation through a structured sequence of agronomic processes. The cultivation began with the preparation of the planting medium, which involved soaking Inceptisol soil, slurrying, and organic fertilization using manure. The soil was first dried and finely ground, then placed in trays and submerged with water approximately 1 cm above the surface. This soaking phase lasted seven days, followed by uniform stirring to initiate the slurry process, which was allowed to settle for another seven days. Subsequently, manure was mixed evenly into the sludge and left to stabilize for two weeks, forming a nutrient-rich medium. High-quality rice seeds were then sown into this prepared substrate, marking the transition to the seedling and transplantation phases. These steps are documented in Figure 14.
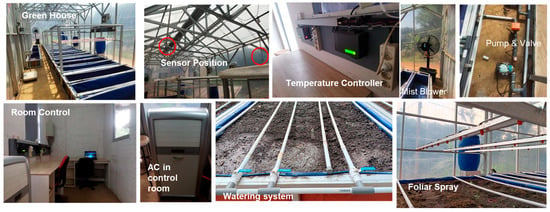
Figure 14.
Instrumentation and Control System in the Green House (IC4G).
Following transplantation, the cultivation process progressed into the monitoring phase, supported by scheduled irrigation and fertilization. Throughout these stages, the IoT system played a central role in maintaining optimal environmental conditions. Real-time monitoring of temperature, humidity, and sunlight intensity was conducted via the Thingsboard IoT platform, which provided continuous data visualization and logging capabilities. These parameters were displayed on the dashboard interface and stored for retrospective analysis, enabling researchers to correlate environmental fluctuations with plant growth responses [,,]. The rice cultivation workflow within the greenhouse is illustrated in Figure 15.
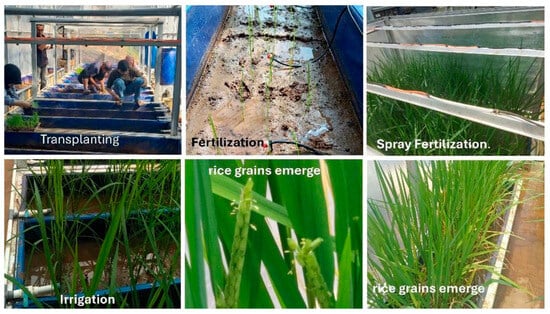
Figure 15.
The rice cultivation process in the Greenhouse with the IoT system.
The integration of IoT technology into the greenhouse system exemplifies the transformative potential of smart farming in modern agriculture. By enabling precise control over microclimatic variables, the system enhances resource efficiency and supports optimal plant development. This aligns with the broader objectives of precision agriculture, where data-driven approaches are employed to improve productivity and sustainability [,,]. The successful implementation of this system demonstrates how traditional agricultural practices can be augmented through technological innovation, paving the way for scalable and replicable smart farming models.
3.2.2. Control Temperature Performance
Temperature regulation within the greenhouse was successfully achieved through an advanced IoT-integrated control system. Figure 16 shows that before 18 September 2024, the system had not yet implemented air temperature control. Temperatures could still reach 45 °C, which could instantly kill rice plants. From September 18th onward, the system was equipped with room temperature control, and it can be seen that temperatures were maintained between 30 and 40 °C on average from September to October, with an average maximum of 36.5 °C. After the control process was running, the maximum overshoot was at a temperature of 39 °C on 3 October 2024 and another example was seen on 21 September 2024, the maximum overshoot was at 35.6 °C.

Figure 16.
Temperature Performance before and after Control.
Further studies were conducted on the control system analysis taken on 21 September 2024, from 7 to 9 a.m. The temperature rose from 22.7 Celsius to reach the setpoint of 30 Celsius at around 8 a.m. At 8 am, the blower will turn on because of the algorithm created. For approximately 1 h, the greenhouse room temperature can be maintained at around 30 Celsius with system characteristics, namely maximum overshoot ~2.67% (30.8 °C at 8:26 a.m.) and control accuracy (Steady State Error) ≈ ± 0.47 °C. While the response time of the mist blower is made by a control algorithm in a range of 5 min.
This level of precision is critical for rice cultivation as temperature directly influences physiological processes such as photosynthesis, respiration, and nutrient uptake. The system’s performance was documented both before and after implementation, clearly demonstrating its effectiveness in stabilizing the microclimate and minimizing plant stress.
Figure 17 illustrates the environmental conditions during the initial vegetative growth stage of the rice plants, with a specific focus on temperature monitoring. The vegetative phase commenced with seeding and transplanting on 18 September 2024. The initial application of NPK fertilizer (as Urea, SP-36, and KCl) was performed on the same day (18 September), followed by supplemental Urea application on 9 October 2024, and additional Urea and KCl on 23 October 2024. The nano-silica fertilizer treatments were subsequently applied in two split applications on 11 and 18 November 2024. Throughout this vegetative period, the IoT-based control system successfully maintained the air temperature inside the greenhouse within a range of 30–37 °C. This stable and optimal thermal environment was crucial for supporting healthy plant development and establishing a strong foundation for the subsequent generative phase.

Figure 17.
Temperature performance along planting process.
In addition to temperature, humidity levels were also monitored and maintained within the optimal range, as shown in Figure 18. In the first two months of September and October, humidity levels were also recorded well in the database. Humidity levels were not controlled, but temperature control had a direct impact. The data shows that humidity levels tended to be low at the beginning of the planting process and increased in October and November. This can be interpreted as a result of limited total transpiration (evaporation of water from leaves) from all plants. Furthermore, with a loose canopy, more sunlight directly reaches the soil surface and increases direct evaporation from the growing medium. However, the more open air allows for more intensive air exchange with the outside environment, preventing large amounts of water vapor from being “trapped.” This naturally causes humidity inside the greenhouse to tend to be lower. This dual-parameter monitoring strengthens the greenhouse’s role as a precision platform for agricultural experiments.

Figure 18.
Humidity performance along planting process.
The smart greenhouse system demonstrated significant improvements in control precision and sensor responsiveness compared to conventional setups. Temperature was maintained within a range of 20–36.5 °C, and humidity around 10–85% RH, with mist blower activation responding in under 5 seconds. Sensor accuracy was validated with deviations of 0.4% (±0.11 °C) and 0.77% (±0.5%RH), indicating reliable environmental regulation. These performance metrics align with and, in some cases, exceed benchmarks reported in prior studies on IoT-based agricultural systems [,,]. The system’s ability to maintain consistent microclimatic conditions underpins its suitability for structured agronomic experimentation. By integrating real-time monitoring, automated control, and cloud-based data management, the platform offers a replicable and scalable framework for precision agriculture. Compared to existing systems, it provides enhanced responsiveness, reduced latency, and improved data fidelity, contributing to more reliable environmental control and experimental reproducibility.
In Table 2, the average temperature, humidity, and light intensity values monitored by automatic sensors for three consecutive months in a rice planting greenhouse showed that the highest temperature occurred in September (36.44 °C), then decreased until November (33.02 °C), while the average humidity increased from 42.52% to 52.56%, and the highest light intensity (lux) was recorded in October (12,037.02 lux); these data prove that the application of temperature, humidity, and light sensors in rice greenhouses greatly supports real-time environmental control and monitoring, allowing planting conditions to remain optimal and stable throughout the season, and the risk of disturbances from environmental changes can be effectively suppressed.

Table 2.
Summaries environment parameters (temperature, humidity, light).
The greenhouse’s temperature control system aims to maintain daytime temperatures close to the set point of 30 °C, with real-time monitoring using integrated sensors. Based on September data, the average temperature was recorded at 36.44 °C with a standard deviation of 3.70 °C, indicating significant fluctuations. However, it is important to note that the system has shown significant improvement compared to previous conditions, where temperatures could spike above 45 °C. Currently, the maximum temperature recorded is only 42.70 °C, indicating that the system has successfully mitigated extreme spikes, although it has not yet stabilized completely.
In October, the average temperature decreased to 35.32 °C with a standard deviation of 2.63 °C, indicating increased stability compared to the previous month. Humidity began to show greater variability (Stdev 9.97%), likely influenced by changes in irrigation patterns and weather conditions. Light intensity increased to an average of 12,037 lux with lower fluctuations (Stdev 477.73 lux), indicating the onset of the rainy season.
Entering November, the average temperature decreased again to 33.02 °C, with a standard deviation of 4.14 °C. Despite the slight increase in fluctuations, the maximum temperature recorded was only 40.71 °C, still significantly lower than the initial conditions before the system was implemented. Humidity showed high variability (Stdev 13.34%), which could be a concern for active humidity control. Light intensity decreased dramatically to an average of 7894 lux, but with very high fluctuations (Stdev 2222.27 lux), likely due to seasonal changes or atmospheric conditions.
Overall, the downward trend in average and maximum temperatures from September to November indicates that the implemented control system has had a positive impact in mitigating temperature extremes. While there are still fluctuations that need to be addressed, particularly in humidity and light, the system has shown promising development potential. These findings form the basis for further iterations, such as the integration of adaptive control algorithms (PID or fuzzy logic), the addition of automatic shading based on light intensity, and ventilation scheduling based on daily weather forecasts. With a rigorous statistical approach and a commitment to continuous validation, the system demonstrates not only technical potential but also readiness for broader application in optimal greenhouse microenvironment management.
IoT-based systems offer significant advantages in greenhouse management by enabling continuous monitoring and dynamic adjustment of environmental conditions [,,]. In regions with pronounced diurnal temperature variations, such as tropical climates, maintaining a stable internal temperature can be challenging. The system’s ability to respond to real-time sensor data and automatically regulate heating or cooling inputs ensures that rice plants are not exposed to thermal stress, which could compromise growth and yield.
Moreover, the integration of machine learning algorithms enhances the system’s predictive capabilities, allowing it to anticipate environmental changes and adjust proactively []. This intelligent control mechanism supports long-term sustainability by reducing energy consumption and optimizing resource use.
Consistent temperature regulation is not only beneficial for plant physiology but also contributes to improved crop quality and productivity []. The success of this control system underscores the feasibility of deploying IoT technologies in precision agriculture and highlights their potential for broader adoption to support precision rice cultivation, structured experimentation research and commercial farming contexts. By ensuring environmental stability, the system enables rigorous testing of agronomic interventions, such as nano-silica fertilizer application, under controlled conditions, thereby advancing the scientific understanding of crop responses and supporting data-driven agricultural innovation.
4. Conclusions
This study successfully designed and implemented a smart greenhouse system equipped with IoT technology to support precision rice cultivation and structured experimentation. The system demonstrated consistent performance in monitoring and regulating key environmental parameters, temperature, humidity, and light intensity, ensuring optimal and stable growing conditions throughout the cultivation process. Beyond its role as a cultivation space, the greenhouse was purposefully developed as a comparative research platform, enabling parallel testing of nano-silica fertilizer application via foliar and soil methods under identical environmental conditions. This design minimizes external variability and enhances the reliability of treatment evaluation, addressing a critical gap in agricultural experimentation where environmental inconsistency often limits the validity of comparative studies. The successful deployment of this system highlights the potential of smart farming technologies to improve agricultural productivity, resource efficiency, and sustainability. It also demonstrates how traditional farming practices can be transformed through digital innovation, offering scalable and replicable models for both research and commercial use.
In conclusion, the IoT-enabled greenhouse system provides a robust foundation for future agricultural experimentation. Its precision control and data-driven architecture support advanced input testing, including dosage optimization and interaction studies, and open pathways for integration with predictive analytics—contributing meaningfully to the advancement of sustainable and intelligent food production systems.
This study successfully demonstrates the design and implementation of an IoT-enhanced greenhouse system capable of supporting precision-controlled rice cultivation. While the current focus is on validating the system’s environmental monitoring and control capabilities, agronomic results from the nano-silica fertilizer comparison are still under analysis and will be presented in a subsequent publication. The system’s modular design also allows for future integration with machine learning models to predict plant responses, paving the way for advanced smart farming applications. While the system demonstrates strong performance in environmental control and experimental flexibility, limitations include scalability to larger farms, initial setup cost, and reliance on stable internet connectivity. Also, we use ON/OFF control logic due to its simplicity and reliability in small-scale greenhouse setups. Future work will focus on evaluating the energy efficiency and long-term operational stability of the proposed IoT-enabled greenhouse system through extended monitoring experiments. We also acknowledge the current limitations and plan to incorporate advanced control strategies such as PID and fuzzy logic models in future iterations to enhance system responsiveness. Additionally, we aim to integrate AI-based decision models capable of predicting plant responses and optimizing fertilizer schedules using historical data. The scalability and adaptability of the system further open opportunities for deployment across various crop types and climatic conditions, supporting broader applications in precision agriculture.
Author Contributions
Conceptualization, I.M.J., D.W.M., O.M. and C.P.; methodology, I.M.J., D.W.M. and O.M.; software, D.W.M.; validation, I.M.J., F.F., O.M., C.P., N.N.R., P.W., K.M.P., S.V., A.A., M.H. and N.L.W.; formal analysis, D.W.M., F.F. and O.M.; investigation, D.W.M. and O.M.; resources, I.M.J.; data curation, I.M.J., D.W.M., F.F. and O.M.; writing—original draft preparation, I.M.J., D.W.M. and O.M.; writing—review and editing, I.M.J., F.F., O.M., C.P., N.N.R., P.W., K.M.P., S.V., A.A., M.H. and N.L.W.; visualization, D.W.M. and O.M.; supervision, I.M.J.; project administration, D.W.M. and C.P.; funding acquisition, I.M.J. All authors have read and agreed to the published version of the manuscript.
Funding
This work was supported by Riset Kolaborasi Indonesia from Universitas Padjadjaran with contract no. 2213/UN6.3.1/TU.00/2024; and The APC was funded by Universitas Padjadjaran.
Data Availability Statement
The original contributions presented in this study are included in the article. Further inquiries can be directed to the corresponding author.
Acknowledgments
The authors would like to acknowledge Dyah Pramesti L for their help and technical support during the Integration and performance testing.
Conflicts of Interest
The authors declare no conflicts of interest.
References
- Khalid, M.H.; Walaa, M.E.; Farid, M.S. Technologies, Protocols, and applications of Internet of Things in greenhouse Farming: A survey of recent advances. Inf. Process. Agric. 2025, 12, 91–111. [Google Scholar] [CrossRef]
- Dalhatu, M.; Ehsan, A.; Shohreh, A.; Maria, T.; Marie-José, M.; Reza, E. Artificial Intelligence of Things (AIoT) for smart agriculture: A review of architectures, technologies and solutions. J. Netw. Comput. Appl. 2024, 228, 103905. [Google Scholar] [CrossRef]
- Bam, B.S.; Dhanalakshmi, R. Recent advancements and challenges of Internet of Things in smart agriculture: A survey. Future Gener. Comput. Syst. 2022, 126, 169–184. [Google Scholar] [CrossRef]
- Chander, P.; Lakhwinder, P.S.; Ajay, G.; Shiv, K.L. Advancements in smart farming: A comprehensive review of IoT, wireless communication, sensors, and hardware for agricultural automation. Sens. Actuators A Phys. 2023, 362, 114605. [Google Scholar] [CrossRef]
- Biswaranjan, A.; Kyvalya, G.; Anuradha, Y.; Sujata, D. Chapter 1—Internet of things (IoT) and data analytics in smart agriculture: Benefits and challenges. In AI, Edge and IoT-Based Smart Agriculture; Ajith, A., Sujata, D., Eds.; Academic Press: New York, NY, USA, 2022; pp. 3–16. [Google Scholar] [CrossRef]
- Abdennabi, M.; Zahra, O.; Rachid, E.A.; Hassan, Q.; Mohammed, O.J.; Haris, M.K. Integrated internet of things (IoT) solutions for early fire detection in smart agriculture. Results Eng. 2024, 24, 103392. [Google Scholar] [CrossRef]
- Abdennabi, M.; Rachid, J.; Haris, M.K.; Rachid, E.A.; Hassan, Q.; Mohammed, O.J. IoT-based smart irrigation management system to enhance agricultural water security using embedded systems, telemetry data, and cloud computing. Results Eng. 2024, 23, 102829. [Google Scholar] [CrossRef]
- Prem, R.; Abhratanu, G.; Satadal, A.; Suchandra, B. Internet of Things and smart sensors in agriculture: Scopes and challenges. J. Agric. Food Res. 2023, 14, 100776. [Google Scholar] [CrossRef]
- Abdennabi, M.; Ishaq, G.M.A.; Haris, M.K.; Rachid, E.A.; Surendar, R.S.; Muyeen, S.M. High-technology agriculture system to enhance food security: A concept of smart irrigation system using Internet of Things and cloud computing. J. Saudi Soc. Agric. Sci. 2024. [CrossRef]
- Vijendra, K.; Kul, V.S.; Naresh, K.; Anant, P.; Tanmay, R.K.; Upaka, R. A comprehensive review on smart and sustainable agriculture using IoT technologies. Smart Agri. Technol. 2024, 8, 100487. [Google Scholar] [CrossRef]
- Senthilkumar, M.; Akshaya, R.; Sreejith, K. An Internet of Things-based Efficient Solution for Smart Farming. Procedia Comp. Sci. 2023, 218, 2806–2819. [Google Scholar] [CrossRef]
- Vivek, R.P.; Narendra, K.; Sandeep, K.; Antar, S.H.A.; Ajay, K.V. A systematic review of IoT technologies and their constituents for smart and sustainable agriculture applications. Sci. Afr. 2023, 19, e01577. [Google Scholar] [CrossRef]
- Maged, E.A.M.; Muhammad, M. Chapter 3—Towards smart farming: Applications of artificial intelligence and internet of things in precision agriculture. In Hyperautomation in Precision Agriculture; Sartajvir, S., Vishakha, S., Eds.; Academic Press: New York, NY, USA, 2025; pp. 27–37. [Google Scholar] [CrossRef]
- Ali, A.; Hussain, T.; Zahid, A. Smart Irrigation Technologies and Prospects for Enhancing Water Use Efficiency for Sustainable Agriculture. AgriEngineering 2025, 7, 106. [Google Scholar] [CrossRef]
- Patil, B.; Asra, S. Smart IoT-Driven Precision Irrigation: Enhancing Water Efficiency with Machine Learning and Real-Time Environmental Monitoring. In Proceedings of the 2025 International Conference on Computing Technologies & Data Communication (ICCTDC), Hassan, India, 4–5 July 2025; pp. 1–8. [Google Scholar] [CrossRef]
- Ojha, R.; Manvir; Fayaz, A.; Kaundal, M. Smart Irrigation Systems Using the Internet of Things: Applications in Farming Systems. J. Adv. Biol. Biotechnol. 2025, 28, 361–376. [Google Scholar] [CrossRef]
- Karn, S.; Kotecha, R.; Pandey, R.K. Towards Sustainable Farming: Leveraging AIoT for Precision Water Management and Crop Yield Optimization. Procedia Comput. Sci. 2024, 233, 772–781. [Google Scholar] [CrossRef]
- Monchusi, B.B.; Kgopa, A.T.; Mokwana, T.I. Integrating IoT and AI for Precision Agriculture: Enhancing Water Management and Crop Monitoring in Small-Scale Farms. In Proceedings of the 2024 International Conference on Intelligent and Innovative Computing Applications (ICONIC), Flic en Flac, Mauritius, 7–9 November 2024; pp. 151–158. [Google Scholar] [CrossRef]
- Dhanasekar, S. A comprehensive review on current issues and advancements of Internet of Things in precision agriculture. Comput. Sci. Rev. 2025, 55, 100694. [Google Scholar] [CrossRef]
- Dhanaraju, M.; Chenniappan, P.; Ramalingam, K.; Pazhanivelan, S.; Kaliaperumal, R. Smart farming: Internet of Things (IoT)-based sustainable agriculture. Agriculture 2022, 12, 1745. [Google Scholar] [CrossRef]
- Rao, K.S.; El-Hami, K.; Kodaki, T.; Matsushige, K.; Makino, K. A novel method for synthesis of silica nanoparticles. J. Colloid Interface Sci. 2005, 289, 125–131. [Google Scholar] [CrossRef]
- Elshayb, O.M.; Nada, A.M.; Ibrahim, H.M.; Amin, H.E.; Atta, A.M. Application of silica nanoparticles for improving growth, yield, and enzymatic antioxidant for the hybrid rice ehr1 growing under water regime conditions. Materials 2021, 14, 1150. [Google Scholar] [CrossRef]
- Keeping, M.G. Uptake of silicon by sugarcane from applied sources may not reflect plant-available soil silicon and total silicon content of sources. Front. Plant Sci. 2017, 8, 760. [Google Scholar] [CrossRef] [PubMed]
- Saad, K.A.M.; Abouelsoud, H.M.; Hafez, E.M.; Ali, O.A.M. Integrated effect of nano-Zn, nano-Si, and drainage using crop straw–filled ditches on saline sodic soil properties and rice productivity. Arab. J. Geosci. 2019, 12, 471. [Google Scholar] [CrossRef]
- DHT11 Humidity & Temperature Sensor Datasheet. 2024. Available online: https://www.mouser.com/datasheet/2/758/DHT11-Technical-Data-Sheet-Translated-Version-1143054.pdf (accessed on 26 September 2025).
- LDR Sensor Module: How LDR Sensor Works. Available online: https://www.electroduino.com/ldr-sensor-module-how-ldr-sensor-works/ (accessed on 26 September 2025).
- Azzola, F. Android Things Projects, 1st ed.; Packt Publishing Ltd.: Birmingham, UK, 2017; pp. 1–232. [Google Scholar]
- Suriasni, P.A.; Faizal, F.; Hermawan, W.; Subhan, U.; Panatarani, C.; Joni, I.M. IoT Water Quality Monitoring and Control System in Moving Bed Biofilm Reactor to Reduce Total Ammonia Nitrogen. Sensors 2024, 24, 494. [Google Scholar] [CrossRef] [PubMed]
Disclaimer/Publisher’s Note: The statements, opinions and data contained in all publications are solely those of the individual author(s) and contributor(s) and not of MDPI and/or the editor(s). MDPI and/or the editor(s) disclaim responsibility for any injury to people or property resulting from any ideas, methods, instructions or products referred to in the content. |
© 2025 by the authors. Licensee MDPI, Basel, Switzerland. This article is an open access article distributed under the terms and conditions of the Creative Commons Attribution (CC BY) license (https://creativecommons.org/licenses/by/4.0/).