Abstract
The use of Remotely Piloted Aircraft (RPA) for spraying coffee crops has expanded due to their practicality and cost reduction. This study aimed to evaluate spray rate effects on coffee crops using two RPA (T10 and T20). The study was conducted on a commercial farm with 10-year-old Coffea arabica Catucaí Amarelo. Two aircraft were used, T1 (hydraulic) and T2 (rotary nozzles). The application rates were established at 25 and 50 L ha−1. The application quality was obtained by attaching Water-Sensitive Papers (WSPs) to the upper, middle, and lower parts of coffee trees, inside and outside the plants, in addition to the inter-row areas. The statistical Nested Crossed Design was applied to analyze the dataset for the experimental field with three distinct factors (RPA, application rate, and WSP position) and four replications. WSP position was the most determinant factor across all design effects, followed by RPA. The external layers of leaves received more droplets than internal parts of coffee trees. The WSP position information indicated that no droplets reached the middle interior parts of the plants or underneath them. The inter-row positions (soil) received significantly more drops than the coffee plants, regardless of application rate or RPA. The potential for drift to the soil was high in both applications. The Potential Drift Risks were more significant for RPA T2. Future studies may deepen understanding of the relationship between coverage and specific application models for coffee farming, as traditional application methods require improvements.
1. Introduction
Brazil remains a global leader in coffee production and exports [1]. This crop is essential to the national economy; however, it is facing challenges related to phytosanitary management and vulnerability to pests and diseases [2], which compromise both productivity and cultivation efficiency. In this context, the technology for applying phytosanitary products plays a fundamental role, as it is not only essential for controlling biotic factors but also ensures the quality of the final product [3].
The deployment of application technology is defined as the use of scientific knowledge that ensures biologically active precise deposition on a target, in the appropriate quantity, economically, and with minimal environmental contamination [4]. Furthermore, factors such as climate, type of equipment, and the technique used influence spraying effectiveness, making it essential to adopt technologies that ensure uniform distribution of phytosanitary products.
Remotely Piloted Aircraft (RPA) are defined as aerial vehicles that operate without the need for a human pilot on board [5]. This type of aircraft is remotely controlled and can fly autonomously using previously programmed routes. RPA for the application of phytosanitary products has expanded worldwide [6], offering several advantages, such as improved application efficiency [7,8], cost reduction [9], the possibility of application in areas with sloping terrain, and reduced operator contamination with chemical pesticides [10].
However, because this is relatively new technology in many countries, there is still a lack of research to support its efficient application [11]. Because this technology requires smaller spray volumes, airflow, and higher plant heights, its understanding is complex, especially in perennial crops such as coffee [3,12].
Spraying systems using RPA operate with smaller application volumes compared to conventional ground-based methods [13], which implies higher active ingredient concentrations in their tanks. Furthermore, spraying using RPA enables phytosanitary product application in areas that are difficult to access for ground-based sprayers, while also contributing to reducing the risk of worker exposure to the applied products [11]. Therefore, the efficient use of RPA requires the careful definition of operational and climatic parameters, such as wind speed, relative humidity, temperature, altitude, and flight speed [12].
Applying phytosanitary products using RPA allows for reduced rates, increasing the equipment’s operational capacity. However, this reduction in application rate directly affects target coverage and, consequently, operational efficiency [14]. Therefore, applying RPA in coffee farming requires deep understanding and efficient management to overcome the challenges and ensure maximum operational effectiveness.
Innovations such as rotating nozzles, which ensure uniform application with ventilation to direct droplets to the target have contributed to reducing drift [15]. Among the various techniques for applying phytosanitary products, hydraulic spraying stands out as one of the most widely used, due to its versatility in different conditions. However, during applications, controlling droplet size is essential for efficient and safe applications. In traditional systems, which operate with hydraulic pressure, droplet formation tends to be uneven, which can hinder adequate target coverage when applying RPA.
Owing to the reduced application rates with RPA, autonomy and operational capacity can be increased and soil losses can be reduced. However, this reduction requires improvements in the application technology used [11] and route planning [5]. Therefore, there is a need for more research on plant protection using RPA, mainly due to the reduced application rates, among other challenges [16]. These difficulties are mainly associated with the efficiency of target coverage. Therefore, to achieve lower application rates and, simultaneously, better coverage, nozzles with reduced orifices are used. However, this practice results in the formation of smaller droplets, increasing the risk of environmental contamination due to drift. Therefore, alternatives to minimize this problem have been sought [11].
The application of phytosanitary products to perennial crops with varying levels of foliage can pose a challenge for RPA operations, especially when using low application volumes, which can compromise coverage [17]. Therefore, this study aims to evaluate the effects of different spray volumes and nozzle types on the application of phytosanitary products using RPA in coffee farming. Specifically, the application quality and coverage obtained with a conventional hydraulic spraying system and a rotary spraying system are evaluated across the different strata of a coffee plantation.
2. Materials and Methods
2.1. Site of Study
The study was conducted on a commercial coffee farm located in the municipality of Santo Antônio do Amparo, in the southern region of the state of Minas Gerais, at the geographic coordinates 20°56′45″ S latitude and 44°55′8″ W longitude, at an altitude of 990 m. The climate of the region is classified as Cwb, according to the Köppen System, characterizing it as highland subtropical. The predominant soil type is Oxissol.
Two aircraft were used for the application: T1, a DJI AGRAS T10 (Figure 1A) equipped with an 8 L spray tank, four hydraulic spray systems using SX11001VS nozzles (Figure 1C), and four engines; and T2, a DJI AGRAS T20P (Figure 1B) with a 20 L capacity, two rotary spray systems (Figure 1E), and four engines. The application volumes were set at 25 and 50 L ha−1 for both aircraft, they were evaluated by deposition on water-sensitive papers (Figure 1D), fixed in different locations in the crop on the coffee leaves (Figure 1F). The working height was 3.2 m above the coffee tree canopy, and the operating speed was 12 km h−1. In RPA T1, the droplet size was fine (200 µm), according to the hydraulic nozzle model without programming in the aircraft’s control system. In RPA T2, the droplet size was programmed to medium (320 µm) in the aircraft’s control system, as this functionality is available in the rotary nozzles.
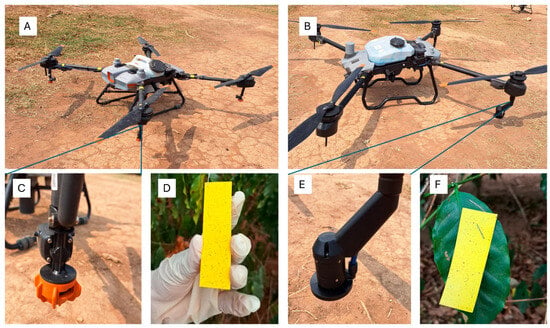
Figure 1.
RPA used in the experiment. (A) T1, DJI AGRAS model T10; (B) T2, DJI AGRAS model T20P; (C) Details of the hydraulic tip model SX11001VS; (D) Water sensitive paper (WSP); (E) Details of the rotary sprayer; (F) WSP attached to the coffee plant leaves.
Spray deposition analysis was performed on a 10-year-old, recently pruned Coffea arabica crop, cultivar Catucaí Amarelo. The plants were spaced with 3.5 m between rows and 0.6 m between plants, with an average canopy height of 3.5 m and a canopy projection diameter of 1.73 m (the area covered by the vertical projection of the canopy).
During the field spray application, the temperature, relative humidity, and wind speed were monitored using a thermohygroanemometer. The temperature ranged from 23 to 27 °C, the relative humidity from 50 to 54%, and the wind speed from 4 to 8 km h−1.
2.2. Positions of Water-Sensitive Papers
Application quality assessment was achieved by attaching Water-Sensitive Papers (WSPs) to the upper, middle, and lower thirds of the plants, both in the inner and outer layers, as well as between the rows (Figure 2). The papers were analyzed with the aid of the DropScan® portable drop reading module, which was connected to a mobile application whose reports were generated for statistical analysis.
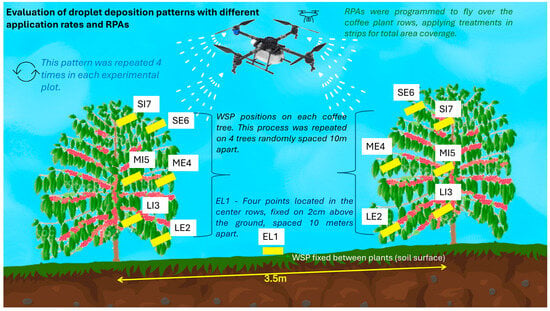
Figure 2.
Positions of WSPs for deposition assessment. SI7: upper inner; SE6: upper outer; MI5: middle inner; ME4: middle outer; LI3: lower inner; LE2: lower outer; EL1: inter-row.
For statistical analysis, the papers were grouped into seven locations according to their positioning on the plants. The first WSP was placed on the soil above the inter-rows (EL1), followed by LE2 as the outer lower layer and LI3 as the inner lower layer. The same arrangement was followed by WSPs ME4 and MI5 for the outer and inner middle parts of the coffee trees, respectively. In the upper part of the plants, the outer location was identified as SE6 and the inner location as SI7 (Figure 2). WSP locations were grouped for the repetitions and were evaluated individually for each variable studied.
Water-Sensitive Papers were placed on the coffee trees and in the inter-rows (EL1), centered in relation to the coffee trees and spaced 10 m apart in the experimental plot, with 4 repetitions (Figure 2). These papers were placed to detect the droplets and the percentage of the application that was able to reach the soil, thus representing the internal loss of spray solution during application.
2.3. Analysis of Water-Sensitive Papers (WSPs)
In the DropScan® system for the WSP reading application, the parameters evaluated were Drop Density (DD), coverage (COV), Diameter Volumetric Median (DMV) of drops, Real Rate Applied (RRA), Index of Quality Application (SPAN), and Potential Drift Risk (PDR). DD indicated the number of droplets in each square centimeter of the WSPs (drops cm−2), obtained by reading the WSPs with a digital scanner. COV indicated the percentage of the WSP area that was covered by the spray (%). DMV represented the diameter of a droplet within the spray spectrum (µm), which divides the volume into two equal parts, one smaller and the other larger than the DMV [4,18].
The Numerical Median Diameter (DMN) divides the droplet mass into two equal parts, with 50% of the droplets having a diameter larger than the DMN and 50% having a diameter smaller than the DMN, expressed in numerical values. In addition to the number of drops per cm2, the volume deposited (L ha−1), percentage coverage (%), and Real Rate Applied (RRA) were measured, which represented the real effective rate applied to the plants, obtained by evaluating the WSPs in L ha−1 and the percentage of PDR (% of drops smaller than 150 µm), according to [4].
In addition to these standardized parameters, WSP analysis allows classification of droplet types and SPAN indices by the accumulated volumetric diameters of the droplet spectrum at 10%, 50% and 90% (DV 0.1, DV 0.5 or DMV, and DV 0.9, respectively). The SPAN index was chosen because the droplet spectrum is a cloud of spray particles generated by nozzles or atomizers, formed by droplets of different sizes in a droplet spectrum. Droplet homogeneity is calculated as the ratio of different droplet strata using Equation (1):
where DV 0.9 is the accumulated volumetric diameter droplets in the 90% spectrum, DV 0.1 is the accumulated volumetric diameter droplets in the 10% spectrum, and DMV is the accumulated volumetric diameter droplets in the 50% spectrum.
SPAN = (DV 0.9 − DV 0.1)/DMV
The SPAN index represents an indicator of spray uniformity, so a value closer to 1 (one) indicates a more uniform application and numbers closer to zero indicate high variability.
2.4. Statistical Analysis
The experiment consisted of four treatments (Table 1) and four replicates. A completely randomized design with two aircraft (two types of spray systems) and two spray volumes (25 and 50 L ha−1) was used.

Table 1.
Description of treatments.
2.5. Nested Crossed Design
In this coffee experiment, three distinct factors were considered (RPA, application rate, and WSP position), where the application rate factor nested in the RPA factor and the hierarchical (nested) factor was finally crossed with the positioning factor that operated with 7 distinct levels, and the experiment was replicated 4 times with a total run of 2 × 2 × 7 × 4 = 112 samples. Both factors, RPA and application rate, operated at two levels, while position operated at seven levels.
Nested Crossed Design Model
The Nested Crossed Design Model is presented in Equation (2).
where = 1, 2, …, 7 (position of Water-Sensitive Papers); = 1, 2 (RPA); = 1, 2 (application rate); and = 1, 2, 3, 4 (replicates).
We performed an analysis of variance (ANOVA) for the different grouped factors and individualized the mean tests. The confidence interval adopted in the tests was 95%. For each grouped variable analysis, scatterplots of the results and means (estimated marginal means—emmeans) were employed, as well as heatmaps, with the response variables grouped according to the gray color intensity for the means found in each situation. All analyses were performed using R statistical software version 4.2.2.
3. Results and Discussion
3.1. Analysis of Variance and Interactions
Droplet density and coverage were directly affected by the RPA model and the positions of the droplets on the collection papers. However, the droplet DMV did not show significant differences for the factors studied. The actual rate applied in the field showed significance with respect to the RPA, droplet position (WSP position), and application rate factors. The effect was also significant for the interaction between RPA, position, and application rate (Table 2).

Table 2.
The analysis of variance (ANOVA) for factor effects. DD—Drop Density (drops cm−2); COV—coverage (%); DMV—Diameter Volumetric Median of drops (µm); RRA—Real Rate Applied L ha−1); SPAN—Quality Application (Index); PDR—Potential Drift Risk (%).
The ANOVA table reveals that the position effect was the most significant determinant factor across all design effects considered (WSP position, RPA, application rate × RPA, WSP position × RPA, and WSP position × application rate × RPA), with a p-value = 8.57 × 10⁻¹⁰, followed by RPA, with a p-value = 1.56 × 10⁻⁵, on the coverage (COV) response variable. This development underscored the profound influence of WSP position and RPA on the phytosanitary treatment of coffee trees with respect to the coverage (COV) response variable (Table 2, Line 2). Also, RPA with nested application rate × RPA and the interaction between WSP position and RPA were equally highly significant, with p-values = 0.0181 and 0.0144, respectively. Meanwhile, the interaction effects of WSP position × application rate × RPA were not significant (Table 2, Line 6).
The coverage obtained in the trials was low in the coffee plants. As discussed in [14], RPA, even with a high effective work capacity when compared to manual applications in hard-to-reach areas, can still be improved to reduce losses and increase coverage with adjuvants. Furthermore, the RPA route can improve the spray deposition and efficiency of application [5].
From the results for DMV, one can see that there were no significant differences among all the design effects considered, including position, which was always significant for the drop density and coverage in the previous analysis. This is an indication that all the design effects tested were almost the same, as we can see from the values for the following factors: position, with a p-value = 0.1763; RPA, with a p-value = 0.6942; application rate × RPA, with a p-value = 0.9300; WSP position × application rate, with a p-value = 0.8756; and WSP position × application rate × RPA, with a p-value = 0.9994. This clearly shows that none of these p-values were close to the significant level.
The RRA results reveal that the position effect was the most significant determinant factor across all design effects considered, with a p-value = 2.00 × 10⁻⁹, followed by RPA, with a p-value = 1.58 × 10⁻⁵, on the RRA response variable. This development underscores the profound influence of position and RPA type on the pest treatment of coffee plantations with respect to the RRA response variable. Also, RPA with nested application rate × RPA and the interaction of WSP position × application rate were also highly significant, with p-values = 0.0167 and 0.0111, respectively. Meanwhile, the interaction effect for WSP position × application rate × RPA, with a p-value = 0.7793, was not significant. In a coverage study on coffee plantations, ref. [19] found that RPA presented high coverage in fungicide applications. These results do not corroborate our research, and this may have been due to the spray formulation and the characteristics of the RPA used in the experiment. Thus, our results show that the effects of operational conditions and the spray used can directly affect the permanence and penetration of droplets inside coffee trees.
According to Table 2, the WSP position effect was significant, with a p-value of 0.0618 on SPAN, while all other factor effects, namely, those for RPA, application rate, WSP position × RPA, and WSP position × application rate × RPA, with p-values of 0.5235, 0.9921, 0.8590, and 0.9997, respectively, were not significant.
The PDR results showed that WSP position (p = 0.4793), RPA (p = 0.4343), application rate × RPA (p = 0.8560), and their interactions (WSP position × RPA (p = 0.9897) and WSP position × application rate × RPA (p = 0.9970)) were not statistically significant. This means that PDR did not vary meaningfully with changes in canopy position, drone type, or spray volume. The variation observed was likely due to random factors rather than treatment effects. In practical terms, PDR was stable across the field and operational setups, indicating consistent spray penetration or deposition. Any minor differences seen visually were not statistically strong, and addressing such differences may only require small operational tweaks at the edges if needed.
3.2. Droplet Density in Different Strata
When assessing droplet density at different plant positions, regardless of the RPA used, the mean number of drops had a confidence interval between 5 and 10 across all coffee tree strata, suggesting no statistical difference in droplet density. However, the inter-row positions received significantly more drops than the plants. This indicates that part of the applied product interacts with the soil, in areas where it is not normally intended to be reached (Figure 3).
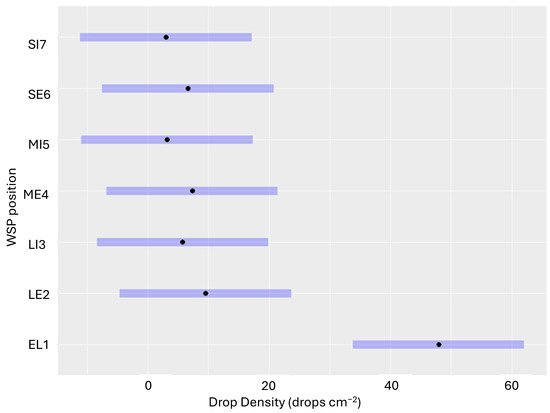
Figure 3.
Estimated marginal means of Drop Density (drops cm−2). Black dots indicate mean values for each position (adjusted for other factors). Purple bars indicate confidence intervals (95%) around those means.
Droplet density, depending on target size, cannot provide adequate coverage and promote pathogen control in coffee crops. Difficult targets such as fungi and contact insecticides require high drop coverage for greater effectiveness [4]. Leaf coverage percentage is essential for phytosanitary treatment of coffee plants [20]. Therefore, an adequate spray nozzle application rate is essential to produce the appropriate droplet size and ensure control efficiency. These parameters are therefore crucial for precise applications using RPA. However, using low application rates and nozzles that produce coarse droplets in RPA can compromise application coverage. Analysis of droplet density and coverage percentage revealed significant variations between treatments and different strata of the coffee plants (Table 2).
Droplet dispersion on the coffee trees did not differ significantly depending on the position of the test applied, but the average droplet densities obtained in Figure 3 indicate that more droplets were deposited on the outer parts of the plants than on the inner layers. This is evidenced by the dispersion bars, which are larger for the external positions of the plants, even though there is no statistical difference; the WSPs of SE6, ME4, and LE2 presented a higher mean and dispersion than the locations LI3, MI5, and SI7.
Heat maps of the average droplet deposition between different RPA and application rates are shown in Figure 4. Significant droplet deposition can be observed between the coffee tree rows, while droplet occurrence was low inside the plants.
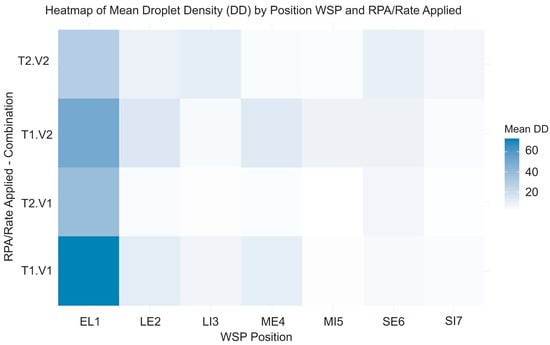
Figure 4.
Heatmap for combinations of RPA and application rates adopted according to the Drop Density (drops cm−2) for each WSP position.
The highest droplet density was observed between the coffee tree rows, possibly due to the lack of barriers between the RPA’s application paths. Conversely, leaf structure in trees can affect and impede droplet penetration. Furthermore, droplets deposited on the soil near the inter-rows can increase the pollution potential of spraying. Ref. [6] found that different application volumes did not significantly affect droplet deposition on coffee plants, while product losses to the soil between rows were the most significant. Our results were similar, proving that full-area application on coffee plants results in significant product losses between rows.
The spraying RPA routes were planned along the planting lines, effectively overlapping across the entire area. Therefore, it was expected that some of the spray would reach the ground during droplet deposition. However, regardless of the RPA used, the application process deposited a significant portion between the rows, in an area not directly relevant for application.
RPA T1 applied the same number of droplets between the rows, regardless of the volume deposited, in contrast to RPA T2. In the rotary droplet generation system, droplets were more uniform and tended to cluster better on the plant surfaces. In the case of the greater deposition with a lower application rate obtained with RPA T10, droplet overlap may have occurred with the larger volume, which made quantification by the digital scanning system difficult.
3.3. Coverage in Different Layers of the Coffee Trees
In Figure 5 (showing confidence intervals of marginal means), one can observe that EL1 has the highest mean coverage (2.5%), with no overlap with other positions in terms of confidence intervals (LE2, LI3, ME4, MI5, SE6, and SI7), suggesting a statistically significant difference. Also, all the other positions cluster around 0.2–0.5%, indicating low mean coverage, meaning that there was no serious observational significant difference between coffee tree positions (LE2, LI3, ME4, MI5, SE6, and SI7). Importantly, the large gap between position EL1 and the other positions reinforces that coverage is highly position-sensitive and dominated by EL1. Summarily, in practical terms on the coffee field, this means that EL1 received the highest number of fluid drops compared to any of the other positions considered; this might have been due to its openness to the surface.
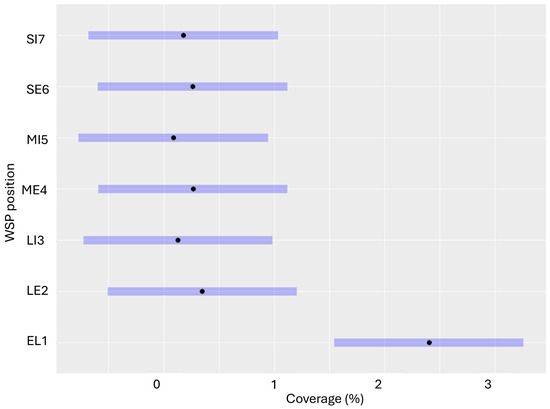
Figure 5.
Estimated marginal means (emmeans) of coverage. Black dots indicate mean values for each position (adjusted for other factors). Purple bars indicate confidence intervals around those means.
As shown in the heatmap in Figure 6, the RPA combined with the application rate (T1.V1) at the position EL1 had the highest mean coverage (4%), standing out clearly. RPA 1 with application rate 2 (T1.V2) at position EL1 also showed a relatively high mean value (3%), while T2.V1 and T2.V2 at position EL1 and T1.V1 and T2.V2 at position ME showed moderate coverage (1–2 and 1%, respectively). All other positions (LE2, LI3, ME4, MI5, SE6, and SI7) had very low coverage, almost near zero. This suggests that the EL1 position is the dominant contributor to coverage across RPA and application rate settings. To summarize, in practical terms on the coffee field, this means that EL1 received the highest number of fluid drops compared to any of the other positions considered; again, this was likely due to its openness to the surface. Recent research [21] found that the most intense coverage with application aircraft in coffee cultivation occurs in the lower parts of plants, which was a factor that contributed to our results.
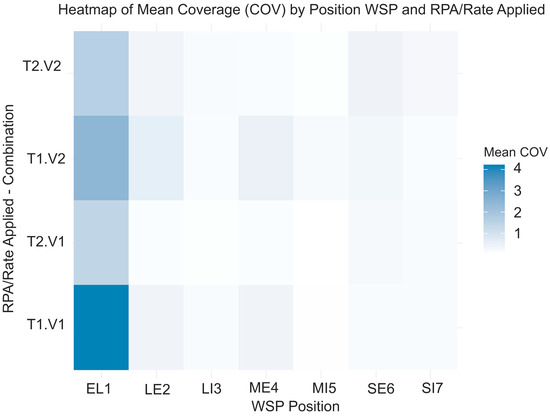
Figure 6.
Heatmap for combinations of RPA coverage adopted according to the droplet density in each WSP position.
The coverage percentage of a spray is important because it reflects the ability of the active ingredient of the commercial product to meet the target, which could be a plant or a pathogen or insect pest. Low coverage reduces the effectiveness of biologics and pesticide controls.
The percentage of leaf coverage is essential for the phytosanitary treatment of coffee plants, especially for contact products, and it is influenced by droplet size and density [20]. Furthermore, ref. [22] found coverage values lower than 3.00%, ranging from 0.66 to 2.67%, using RPA in a pear orchard (Pyrus spp.) with different application rates. In this study, it was observed that when the application volume increased to 50 L ha−1, there was a significant increase in coverage in the middle and lower thirds of the outer canopy, as well as an increase in losses between the rows. However, droplet deposition in the inner parts of the coffee plants remained a challenge. Studies in [14] described the difficulty in obtaining good target coverage with RPA application; therefore, greater coverage results in greater ease in reaching the target.
3.4. Droplet Characteristics (DMV) as a Function of WSP Position, Application Volume, and RPA Model
Interpretation of the confidence interval of the marginal DMV mean (Figure 7) showed that EL1 had the highest diameter median, about 300 µm, with no serious overlap with other positions’ confidence intervals (LE2, LI3, ME4, MI5, SE6, and SI7), suggesting a statistically significant difference. Also, all other positions (LE2, LI3, ME4, SE6, and SI7) clustered around 230–270 µm, indicating a moderate mean for DMV, meaning that there were no serious observational significant differences between positions (LE2, LI3, ME4, SE6, and SI7). Position MI5 clearly showed the lowest mean DMV, falling behind the rest.
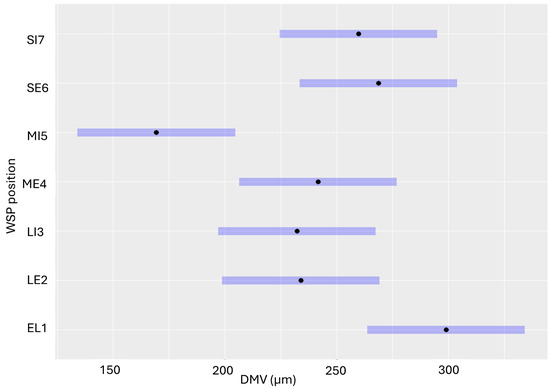
Figure 7.
Estimated marginal means (emmeans) of DMV. Black dots indicate mean values for each position (adjusted for other factors). Purple bars indicate confidence intervals around those means.
Importantly, the large gap between position EL1 and position MI5 reinforces that DMV is highly position-sensitive and dominated by EL1. In practical terms, this means that in the coffee field DMV is uniform, except for MI5, which underperforms, possibly due to its canopy structure or exposure limitations.
Furthermore, the internal positions of the plants received smaller droplets with respect to the external parts; this occurred because small droplets have a greater capacity to penetrate the interiors of plants. As applications using RPA result in greater soil losses compared to ground-based applications [14], especially in areas where plant canopies do not project, resulting in waste, the authors concluded that this effect can be mitigated by aligning the RPA’s flight directly over the crop rows (although the equipment’s working swath width and flight height may limit this optimization strategy).
The DMV heatmap (Figure 8) indicated that RPA T10 with application rate 2 (T1.V2) at position EL1 had the highest mean DMV (280 µm), standing out clearly. RPA T10 with application rate 1 (T1.V1) at position EL1 and RPA T20 with application rate 1 (T2.V1) and RPA T20 with application rate 2 (T2.V2) at position SE6 also showed a relatively high mean value (240 µm), while T2.V1 and T2.V2 at position EL1 showed a moderate DMV (200 µm). All other positions (LE2, LI3, ME4, MI5, and SI7) had a low DMV below 200 µm; in particular, position MI5 had a very low DMV, almost zero. This suggests that the EL1 and SE6 positions are the dominant contributors to DMV across RPA/application rate settings.
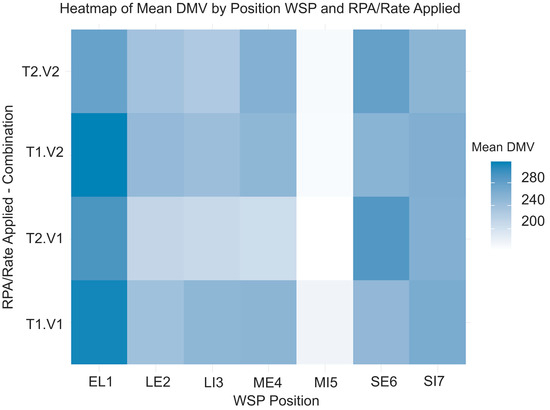
Figure 8.
Heatmap for combinations of RPA and application rate adopted according to the DMV in each WSP position.
Droplet diameter is directly affected by operational conditions, such as flight height and speed [21]. In our study, these parameters were fixed. However, there is a need for further investigation for each condition and tree size in coffee farming. The largest droplets were deposited between the rows, resulting from this area’s exposure to the full spectrum of spray droplets. However, inside the coffee trees, only the droplets with smaller diameters penetrated. These droplets had less mass and were less able to move laterally into the plants, while larger droplets moved faster downward, making it difficult for them to reach the plants. The movement of small droplets into trees must be driven by wind, and, depending on the dynamics of RPA propellers, this process can be facilitated or reduced.
3.5. Real Effective Application Rate (RRA)
Spraying means controlling biological agents that affect crop quality, but only a portion of the spray applied reaches the target. The RRA can reflect product application efficiency when the target is represented by an artificial surface such as a WSP.
The confidence interval of the marginal mean for the RRA (Figure 9) indicated that EL1 had the highest mean (25 L ha−1), with no overlap with other positions’ confidence intervals (LE2, LI3, ME4, MI5, SE6, and SI7), suggesting a statistically significant difference. Also, all other positions clustered around 0—5 L ha−1, indicating a low mean RRA, meaning that there were no serious observational significant differences between positions (LE2, LI3, ME4, MI5, SE6, and SI7). Importantly, the large gap between position EL1 and the other positions reinforces that RRA is highly position-sensitive and dominated by EL1. In practical terms on the coffee field, this means that EL1 received the highest number of fluid drops compared to the other positions considered; this might have been due to its openness to the surface without any interference.
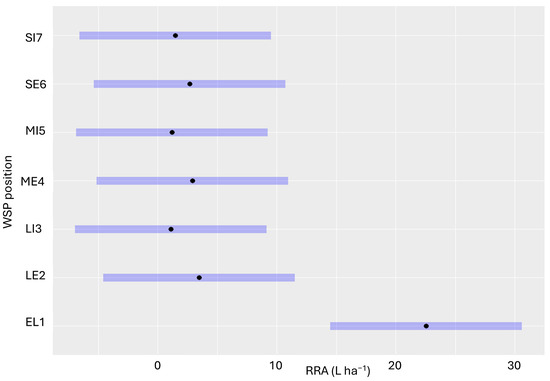
Figure 9.
Estimated marginal means (emmeans) of RRA (L ha−1). Black dots indicate mean values for each position (adjusted for other factors). Purple bars indicate confidence intervals around those means.
The heatmap in Figure 10 indicates that RPA T10 with rate 1 (T1.V1) at position EL1 had the highest mean RRA (40 L ha−1), standing out clearly. RPA 1 with application rate 2 (T1.V2) at EL1 also showed a relatively high mean value (30 L ha−1), while T2.V1 and T2.V2 at position EL1 showed moderate RRA means (10–20 L ha−1).
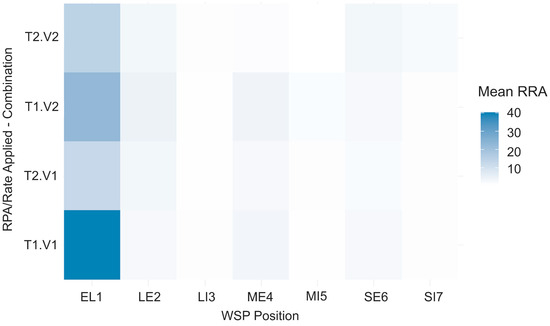
Figure 10.
Heatmap for combinations of RPA RRA (L ha−1) adopted according to the droplet density in each WSP position.
The actual volume deposited on the coffee plants was naturally lower than that programmed and dispensed by the RPA. However, collections with RPA T10 at 25 L ha−1 showed high deposition between the rows, at rates higher than the actual flight planning and programming of the application aircraft. This was mainly due to the lack of a pressure control mechanism in RPA T10. Thus, at specific points, droplet deposition can be increased by increasing the flow rate due to the pressure in the aircraft. Another important point may be the overlap of droplets between rows during the passage and return of an RPA during full-area application.
The actual volume applied by the RPA tended to decrease compared to the initial application schedule for all droplet collection positions. The smallest droplet quantities occurred inside the coffee trees, with a severe reduction between the volume applied and the amount contacting the plants.
Positions LI3, MI5, and SI7 received virtually no deposition, indicating that the spraying with both types of RPA and droplet generation tested in this study was ineffective in reaching these locations. New operational conditions may help overcome this problem, especially in crops with a high leafiness index, such as the one covered by this study.
Higher flight altitudes and lower speeds may also contribute to increased droplet penetration. Furthermore, the use of adjuvants and anti-evaporates in a spray can improve droplet durability during application, reducing drift losses and improving coverage conditions. Recent research [23] has discussed that there are greater barriers to penetration, especially droplets with larger diameters, due to the high leaf density of coffee plants, which reinforces that there is an increase in droplet diameter when using low application volumes, restricting penetration within the plant canopy.
3.6. Droplet Uniformity Index (SPAN)
The SPAN index is dimensionless and indicates the quality of applications and the uniformity of drops, so a value closer to 1 (one) indicates a more uniform application and values closer to zero indicate more variability. The SPAN index confidence interval plot (Figure 11) shows that position EL1 clustered around 0.9. Also, positions LE2, LI3, ME4, SE6, and SI7 clustered around 0.6–0.8, indicating moderate SPAN means, meaning that there were no serious observational significant differences between coffee tree positions. Position MI5 clearly showed the lowest means, falling behind the rest. Practically, EL1 produced the highest SPAN, while that of MI5 was consistently lowest, indicating a possible canopy structure effect limiting spray at MI5. Furthermore, the low SPAN indices found in the internal strata specifically reflect the low presence of droplets in these locations and the variability in sizes, with a tendency towards smaller diameter droplets in the interior.
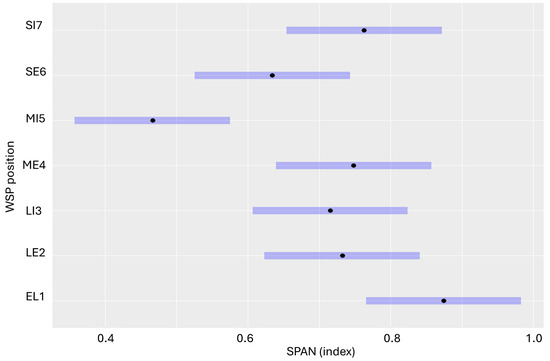
Figure 11.
Estimated marginal means (emmeans) of SPAN. Black dots indicate mean values for each position (adjusted for other factors). Purple bars indicate confidence intervals around those means.
Looking at the SPAN heatmap (Figure 12), we can see that RPA T2 with application rate 1 (T2.V1) and RPA T20 with application rate 2 (T2.V2) at position EL1 had the highest mean (0.9), while RPA T2 with application rate 1 (T2.V1) and RPA T1 with application rate 2 (T1.V2) at position SI7 showed high SPAN values (0.7–0.8). The SPAN indices for positions LE2, LI3, and ME4 clustered around 0.6–0.7, while those for SE6 clustered around 0.5–0.6. Position MI5 had a very low SPAN of almost zero. This suggests that the EL1 and SI7 positions are the dominant contributors to SPAN across RPA/application rate.
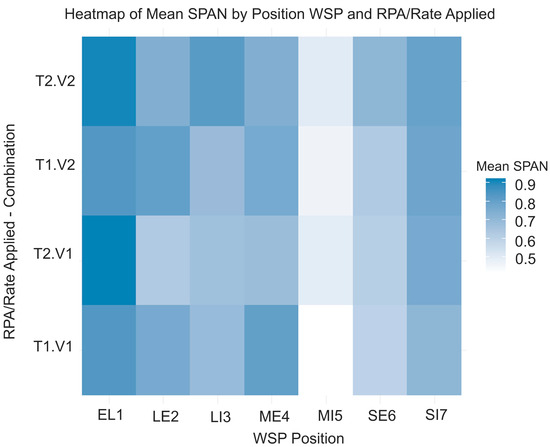
Figure 12.
Heatmap for combinations of RPA and SPAN indices, adopted according to the droplet density in each WSP position.
The RPA T2′s SPAN index demonstrated greater uniformity, due to the controlled and programmable droplet generator design (Figure 12). In this type of RPA, droplets are programmed to be uniformized by the rotation of a droplet generator system, providing greater uniformity in the deposition spectrum. This can be advantageous for uniform application and accurate target reach.
3.7. Drift Potential
The confidence intervals of the marginal means for PDR showed that positions ME4 and L3 had the highest marginal mean PDR values (Figure 13). Positions EL1, SE6, and SI7 had noticeably lower PDR means (6–10%), indicating less PDR for these positions. The spread of means suggests that mid-field positions tend to receive higher PDR values, while edge or corner positions have lower PDRs. In practical terms, regarding the coffee field, this means that spray penetration or droplet deposition measured by PDR was higher in certain central positions (like ME4 and LI3), possibly due to better canopy coverage and reduced edge loss, while edge positions like EL1 and SI7 received less spray.
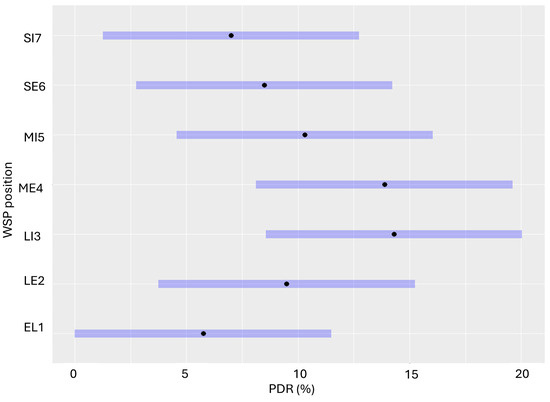
Figure 13.
Estimated marginal means (emmeans) of PDR. Black dots indicate mean values for each position (adjusted for other factors). Purple bars indicate confidence intervals around those means.
Susceptibility to drift is intensified by the presence of smaller-diameter droplets, which lose their kinetic energy quickly after release, being easily transported by air currents away from the target [24]. According to ref. [25], the velocity of finer droplets decays more rapidly to their final velocity over a short distance compared to coarser droplets, consequently affecting their airborne residence time and drift.
Spraying with RPA can generate droplet drift at certain altitudes, posing risks to non-target organisms [26]. Therefore, one strategy to minimize this problem is to increase droplet diameter. However, pest control efficiency using smaller-diameter droplets must also be considered, as they provide greater coverage and canopy penetration, despite their greater susceptibility to drift [4]. Additionally, ref. [9] points out the inherent challenges that exist in practical applications with RPA, in addition to the potential risk of drift; there are uncertainties regarding spray deposition on different crops and the possibility of leaf breakage induced by the downward flow generated by RPA.
The greatest drift potential was found in the inner layers of coffee trees because the droplets detected there were significantly smaller than those detected in the outer layers and between the rows. Furthermore, all deposition between the rows can be attributed to potential drift. Although the PDR assessment did not assign additional values to the WSPs between the rows, it appears that the entire volume deposited between the rows can be considered a potential soil contaminant. Further assessment of this impact should be addressed in future research on this topic.
In localized applications, prior mapping can be associated with the results shown in Figure 13. Methods for detecting pests and diseases using artificial intelligence, such as those developed in ref. [2], can also be associated with localized RPA applications, which can contribute to greater efficiency and reduced drift rates.
The heatmap for PDR as a function of WSP position and RPA/application rate clearly shows that T2.V2 at LI3 and T1.V1 at ME4 had the highest PDR values (16–18%), standing out from the rest (Figure 14). Lower PDR values were recorded at positions like EL1 and SI7 across most RPA/application rate combinations. This pattern again supports the idea that PDR is position-sensitive, with certain middle positions benefiting from better spray coverage. It also suggests that RPA spraying efficiency can be optimized by targeting certain positions with specific RPA/application rate settings, especially T2.V2 for LI3 and T1.V1 for ME4, while edge positions may need supplementary passes or adjusted spray strategies.
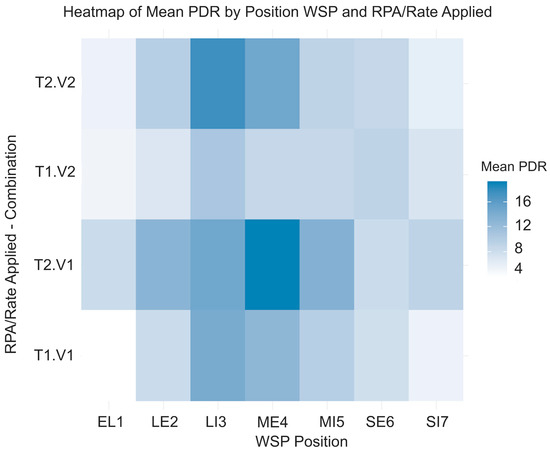
Figure 14.
Heatmap for combinations of RPA and Potential Drift Risk (PDR) adopted according to the droplet density in each WSP position.
Pesticide applications using RPA are increasing in modern agriculture, but quality parameters must be considered with each application. Additionally, it is essential to investigate whether droplets reach the desired locations. In our research, the interior parts of a mature coffee crop with high leaf growth rates received virtually no droplets in sufficient quantities for phytosanitary treatment with most conventional product applications.
In this regard, ref. [27] highlighted that aircraft type, nozzle, flight speed and height, crop, wind speed and direction, and environment are the main factors influencing drift. The potential risk of drift was highest in the upper and middle outer layers of the plants when using a hydraulic spraying system with a volume of 50 L ha−1. Crop coverage with air blast ground sprayers can be significantly superior to applications with RPA [28], and losses to the soil are significantly lower.
New flight parameters and prediction systems can be applied to predict the spatial variability in pesticide deposition using RPA [29] for herbicide application. Furthermore, artificial intelligence models can contribute to the optimization of RPA in pesticide application [30], and the use of adjuvants combined with different nozzle types can modify the results of spraying [31].
Rotary nozzles tend to produce more uniform droplets than hydraulic nozzles, due to the possibility of selecting the aircraft’s flight mode and the rotation of the micro-sprayer in droplet generation. In aircraft with hydraulic nozzles, the deposition tends to be more uneven. According to ref. [30], the rotary nozzle presented less spatial variability and greater uniformity in deposition, especially in flights at a 3 m altitude, as in our study.
New application protocols using RPA in coffee farming must be developed, considering the crop’s vegetation levels and plant architecture. Application rates must be adjusted to ensure that droplets reach coffee trees in appropriate quantities for the treatment and control of pests and diseases at different levels of the plants. New height and flight speed parameters, as well as the use of phytosanitary spray conditioning products, can help increase the efficiency of pesticide applications.
4. Conclusions
This study evaluated the performance of two RPA applying spray at different rates to a mature and leafy coffee crop. The main findings of this study can be summarized as follows:
- (a)
- Regardless of the RPA model, the inner layers of the coffee trees received the lowest droplet deposition compared to the inter-row areas.
- (b)
- The greatest percentage coverage and droplet density of the sprays were directed to the soil between the rows or even to the coffee trees’ peripheral zones.
- (c)
- The rotary nozzles presented greater droplet uniformity, and this spectrum enabled greater penetration into the coffee plant canopy when compared with the hydraulic nozzles.
- (d)
- The application rates of 25 and 50 L ha−1 were not sufficient to ensure minimum droplet coverage inside the coffee plants under the flight conditions studied. Coverage was adequate only on the external tops of plants and between the rows.
- (e)
- The Potential Drift Risks were more significant with RPA T2, where the percentage of small and very small droplets was higher in the total spectrum.
- (f)
- Future research on the use of RPA spraying systems in coffee farming could consider investigating different droplet generation systems and flight planning related to tree position. Furthermore, the relationship between planned and actual spray volume could be further investigated to promote greater sustainability and safety in pesticide applications.
Author Contributions
Conceptualization, A.C.M.F. and L.S.S.; methodology, A.C.M.F., L.S.S., G.A.e.S.F., R.d.O.F. and A.J.S.; investigation, A.C.M.F., L.S.S., J.M.d.S., R.d.O.F. and M.S.S.; data curation, A.C.M.F., A.J.S., J.M.d.S., H.C.R., M.S.S. and L.S.S.; writing—original draft preparation, A.C.M.F., A.J.S., G.A.e.S.F., R.d.O.F., F.O.e.S. and L.S.S.; writing—review and editing, A.C.M.F., A.J.S., G.A.e.S.F., R.d.O.F., F.O.e.S. and L.S.S.; supervision, A.B.E., S.M.S. and F.O.e.S. All authors have read and agreed to the published version of the manuscript.
Funding
This research was supported by National Council for Scientific and Technological Development-CNPQ project 310186/2023-4; Foundation for Research Support of the State of Minas Gerais, projects FAPEMIG APQ-0115123 and APQ-00661-22.
Data Availability Statement
The original contributions presented in this study are included in the article. Further inquiries can be directed to the corresponding author.
Conflicts of Interest
The authors declare no conflicts of interest.
References
- USDA Foreign Agricultural Service. Coffee: World Markets and Trade Report. 2024. Available online: https://www.fas.usda.gov/data/coffee-world-markets-and-trade-06252025 (accessed on 27 October 2025).
- Esgario, J.G.; de Castro, P.B.; Tassis, L.M.; Krohling, R.A. An app to assist farmers in the identification of diseases and pests of coffee leaves using deep learning. Inf. Process. Agric. 2022, 9, 38–47. [Google Scholar] [CrossRef]
- Cunha, J.P.D.; Lopes, L.D.L.; Alves, C.O.R.; Alvarenga, C.B.D. Spray deposition and losses to soil from a remotely piloted aircraft and airblast sprayer on coffee. AgriEngineering 2024, 6, 2385–2394. [Google Scholar] [CrossRef]
- Ferreira, M.C.; Matuo, T. Phytosanitary Product Application Technology: Fundamentals; Cultura Acadêmica: São Paulo, Brazil, 2024; 275p. [Google Scholar]
- Gugan, G.; Haque, A. Path planning for autonomous drones: Challenges and future directions. Drones 2023, 7, 169. [Google Scholar] [CrossRef]
- Cunha, J.P.; Fonseca, L.F.D.; Alvarenga, C.B.D.; Lopes, L.D.L.; Martins Filho, R. Spray Deposition from an Unmanned Aerial Vehicle on Coffee Crop. Eng. Agrícola 2024, 44, e20240021. [Google Scholar] [CrossRef]
- Alarcão Júnior, J.C.; Nuñez, D.N.C. The use of drones in agriculture 4.0. Braz. J. Sci. 2024, 3, 1–13. [Google Scholar] [CrossRef]
- Tsolakis, N.; Bechtsis, D.; Vasileiadis, G.; Menexes, I.; Bochtis, D.D. Sustainability in the digital farming era: A cyber-physical analysis approach for drone applications in agriculture 4.0. In Information and Communication Technologies for Agriculture—Theme IV: Actions; Springer International Publishing: Cham, Switzerland, 2022; pp. 29–53. [Google Scholar] [CrossRef]
- Neto, J.O.S.; Sasaki, R.S.; de Alvarenga, C.B. Aeronave remotamente pilotada (RPA) para aplicação de agrotóxico. Res. Soc. Dev. 2021, 10, e293101220573. [Google Scholar] [CrossRef]
- Andrade, J.D.A.; Pretto, R.D.; Carvalho, E.; Bolonhezi, D.; Scarpellini, R.J.; Cardoso, V.B. Avaliação de RPAs para pulverização em diferentes culturas. Ingeniería y Región 2018, 20, 72–77. [Google Scholar] [CrossRef]
- Cunha, J.P.A.R.D.; Silva, M.R.A.D. Spray deposition from a remotely piloted aircraft on the corn crop. Revista Ciência Agronômica 2023, 54, e20217862. [Google Scholar] [CrossRef]
- Santos, T.M.; Aiala, M.L.C.; dos Santos, T.G.; Nunes, J.G.P.; Ribeiro, M.E.A.; da Silva Barbosa, M.E.; da Vitória, E.L. Deriva na pulverização de calda aplicada por aeronave remotamente pilotada em uma lavoura de café conilon. Ep. E-Books 2024, 79, 73–84. [Google Scholar] [CrossRef]
- Xue, X.; Lan, Y.; Sun, Z.; Chang, C.; Hoffmann, W.C. Develop an unmanned aerial vehicle based automatic aerial spraying system. Comput. Electron. Agric. 2016, 128, 58–66. [Google Scholar] [CrossRef]
- Cunha, J.P.D.; Alvarenga, C.B.D.; Rinaldi, P.C.; Marques, M.G.; Zampiroli, R. Use of remotely piloted aircrafts for the application of plant protection products. Eng. Agrícola 2021, 41, 245–254. [Google Scholar] [CrossRef]
- Grella, M.; Gil, E.; Balsari, P.; Marucco, P.; Gallart, M. Advances in developing a new test method to assess spray drift potential from air blast sprayers. Span. J. Agric. Res. 2017, 15, e0207. [Google Scholar] [CrossRef]
- Lan, Y.; Chen, S. Current status and trends of plant protection UAV and its spraying technology in China. Int. J. Precis. Agric. Aviat. 2018, 1, 1–9. [Google Scholar] [CrossRef]
- Jiang, Y.; He, X.; Song, J.; Liu, Y.; Wang, C.; Li, T.; Chen, F. Comprehensive assessment of intelligent unmanned vehicle techniques in pesticide application: A case study in pear orchard. Front. Plant Sci. 2022, 13, 959429. [Google Scholar] [CrossRef]
- Arcoverde, S.N.; Tezolin, G.N.; Santos, R.M.D.; Nascimento, J.M.D.; Secretti, M.L. Different volumes and times of herbicide application for weed control in sugarcane. Sci. Electron. Arch. 2024, 17, 5. [Google Scholar] [CrossRef]
- Vitória, E.L.D.; Krohling, C.A.; Borges, F.R.P.; Ribeiro, L.F.O.; Ribeiro, M.E.A.; Chen, P.; Lan, Y.; Wang, S.; Moraes, H.M.F.; Furtado Júnior, M.R. Efficiency of fungicide application an using an unmanned aerial vehicle and pneumatic sprayer for control of hemileia vastatrix and cercospora coffeicola in mountain coffee crops. Agronomy 2023, 13, 340. [Google Scholar] [CrossRef]
- Alvarenga, C.B.D.; Zampiróli, R.; Cunha, J.P.A.R.D.; Rinaldi, P.C.N.; Cunha, B.A.D.; Faria, L.O. Application rate and hydraulic tips used in remotely piloted aircraft affect the phytosanitary products in coffee plant canopies. Acta Sci. Agron. 2024, 46, e62969. [Google Scholar] [CrossRef]
- Souza, F.G.; Portes, M.F.; Silva, M.V.; Teixeira, M.M.; Furtado Júnior, M.R. Impact of sprayer drone flight height on droplet spectrum in mountainous coffee plantation. Rev. Bras. Eng. Agrícola Ambient. 2022, 26, 901–906. [Google Scholar] [CrossRef]
- Qi, P.; Zhang, L.; Wang, Z.; Han, H.; Müller, J.; Li, T.; He, X. Effect of operational parameters of unmanned aerial vehicle (UAV) on droplet deposition in trellised pear orchard. Drones 2023, 7, 57. [Google Scholar] [CrossRef]
- Souza Júnior, J.M.D.; Ruas, R.A.A.; Duarte, L.O.; Faria, V.R.; Carvalho Filho, A.; Santos Júnior, C.R. Influência da densidade foliar na distribuição de calda no dossel do cafeeiro (Coffea arabica L.). Braz. Soc. Coffee 2017, 12, 216–222. [Google Scholar]
- Ahmad, F.; Qiu, B.; Dong, X.; Ma, J.; Huang, X.; Ahmed, S.; Chandio, F.A. Effect of operational parameters of UAV sprayer on spray deposition pattern in target and off-target zones during outer field weed control application. Comput. Electron. Agric. 2020, 172, 105350. [Google Scholar] [CrossRef]
- Liu, Q.; Chen, S.; Wang, G.; Lan, Y. Drift evaluation of a quadrotor unmanned aerial vehicle (UAV) sprayer: Effect of liquid pressure and wind speed on drift potential based on wind tunnel test. Appl. Sci. 2021, 11, 7258. [Google Scholar] [CrossRef]
- Wang, Z.; Hussain, M.; Yin, J.; Yuan, M.; Mo, Y.; Quan, M.; Tan, W. Analysis of droplet deposition and maize (Zea mays L.) growth control: Application of ethephon by small unmanned aerial vehicle and electric knapsack sprayer. Field Crops Res. 2023, 292, 108822. [Google Scholar] [CrossRef]
- Li, X.; Andaloro, J.T.; Lang, E.B.; Pan, Y. Best management practices for unmanned aerial vehicles (UAVs) application of insecticide products on rice. In Proceedings of the American Society of Agricultural and Biological Engineers, ASABE Annual International Meeting, Boston, MA, USA, 7–10 July 2019. [Google Scholar] [CrossRef]
- Biglia, A.; Grella, M.; Bloise, N.; Comba, L.; Mozzanini, E.; Sopegno, A.; Pittarello, M.; Dicembrini, E.; Alcatrão, L.E.; Guglieri, G.; et al. UAV-spray application in vineyards: Flight modes and spray system adjustment effects on canopy deposit, coverage, and off-target losses. Sci. Total Environ. 2022, 845, 157292. [Google Scholar] [CrossRef]
- Vitória, E.L.D.; Ribeiro, L.F.O.; Gontijo, I.; Pires, F.R.; Cotta, A.J.B.; Ferreira, F.D.A.; Moreira, J.W.D.M. Spatial Variability in the Deposition of Herbicide Droplets Sprayed Using a Remotely Piloted Aircraft. AgriEngineering 2025, 7, 245. [Google Scholar] [CrossRef]
- Güneş, D.; Hasegawa, H. Optimizing UAV sprayer performance using field data and machine learning approaches. Smart Agric. Technol. 2025, 11, 101013. [Google Scholar] [CrossRef]
- Silva, C.L.D.; Cunha, J.P.A.R.D.; Alvarenga, C.B.D.; Zampiroli, R. Interface Properties and Droplet Spectra as a Function of Adjuvants and Spray Nozzles. AgriEngineering 2025, 7, 116. [Google Scholar] [CrossRef]
Disclaimer/Publisher’s Note: The statements, opinions and data contained in all publications are solely those of the individual author(s) and contributor(s) and not of MDPI and/or the editor(s). MDPI and/or the editor(s) disclaim responsibility for any injury to people or property resulting from any ideas, methods, instructions or products referred to in the content. |
© 2025 by the authors. Licensee MDPI, Basel, Switzerland. This article is an open access article distributed under the terms and conditions of the Creative Commons Attribution (CC BY) license (https://creativecommons.org/licenses/by/4.0/).