Article

Predicting the Power Requirement of Agricultural Machinery Using ANN and Regression Models and the Optimization of Parameters Using an ANN–PSO Technique

1
Department of Farm Machinery and Power Engineering, College of Agricultural Engineering and Technology, CCS Haryana Agricultural University, Hisar 125004, Haryana, India
2
ICAR—Indian Institute of Wheat and Barley Research, Karnal 132001, Haryana, India
3
Department of Agricultural and Food Engineering, Indian Institute of Technology Kharagpur, Kharagpur 721302, West Bengal, India
4
School of Engineering, University of Petroleum and Energy Studies, Dehradun 248007, Uttarakhand, India
*
Author to whom correspondence should be addressed.
AgriEngineering 2024, 6(1), 185-204; https://doi.org/10.3390/agriengineering6010012
Submission received: 6 December 2023 / Revised: 15 January 2024 / Accepted: 15 January 2024 / Published: 18 January 2024
(This article belongs to the Special Issue Application of Artificial Neural Network in Agriculture)

Abstract

:
Optimizing the design and operational parameters for tillage tools is crucial for improved performance. Recently, artificial intelligence approaches, like ANN with learning capabilities, have gained attention for cost-effective and timely problem solving. Soil-bin experiments were conducted and data were used to develop ANN and regression models using gang angle, velocity ratio, soil CI, and depth as input parameters, while tractor equivalent PTO (PTOeq) power was used as an output. Both models were trained with a randomly selected 90% of the data, reserving 10% for testing purposes. In regression, models were iteratively fitted using nonlinear least-squares optimization. The ANN model utilized a multilayer feed-forward network with a backpropagation algorithm. The comparative performance of both models was evaluated in terms of R2 and mean square error (MSE). The ANN model outperformed the regression model in the training, testing, and validation phases. A well-trained ANN model was integrated with the particle-swarm optimization (PSO) technique for optimization of the operational parameters. The optimized configuration featured a 36.6° gang angle, 0.50 MPa CI, 100 mm depth, and 3.90 velocity ratio for a predicted tractor PTOeq power of 3.36 kW against an actual value of 3.45 kW. ANN–PSO predicted the optimal parameters with a variation between the predicted and the actual tractor PTOeq power within ±6.85%.

1. Introduction

The careful selection of energy-efficient agricultural machinery plays a pivotal role in reducing labor-intensive tasks, increasing cropping frequency, and minimizing field-preparation time. Traditional tillage implements often necessitate multiple passes to achieve the desired seedbed, leading to soil compaction that results from repetitive tractor passes. Combining active and passive tools strategically allows the forward thrust produced by the active tool to contribute to the power requirements of the passive tool. This reduces draft and specific energy requirements for tillage tasks, increases field productivity, and minimizes slip due to fewer passes [1,2,3,4,5,6]. Within an active–passive tillage implement, the performance and power requirement are affected by operational parameters [7,8]. The optimization of the design and operational parameters of agricultural machinery is a significant approach for improving tool performance, efficiency in production, and quality of cultivation while cutting down the energy expenditure and its harmful impact on the environment. The field operation of tillage implements under optimal parameters can fulfill the task of improving tilth quality with a minimum expenditure of energy [9,10]. Numerous research studies have demonstrated that the use of tillage equipment in field operations often demands a substantial amount of energy. Effectively managing this energy can lead to reduced fuel consumption and cost savings.
Predictive models help researchers predict the draft and power demand of tillage tools with the use of limited data, thereby eliminating the need to perform both costly and time-intensive field trials every time. It also helps research workers and manufacturers improve the design of tools through the comparison and analysis of multiple factors that affect the draft requirement of tools. Soft computing techniques have gained significant popularity over the past twenty years due to their better accuracy and fast process. In recent times, artificial intelligence-based techniques like artificial neural networks (ANN) have been used effectively for predictive modeling in various fields. One advantageous aspect of ANN is its capability to establish correlations within extensive and intricate datasets, devoid of any prior understanding of the interconnections. ANN models have seen a growing application in the realm of agricultural engineering due to their aptitude for addressing a wide range of challenging issues. This includes tasks such as pattern classification, prediction, and their ability to maintain performance even when dealing with noisy, incomplete, or inconsistent data [11,12]. ANNs comprise interconnected nonlinear processing elements, each featuring numerous inputs and outputs. These networks operate through three key phases: training, validation and testing, and application. Given the constraints of linear regression techniques for approximating functions, artificial neural networks (ANNs) can serve as a valuable method for predicting the necessary energy for tillage by considering various soil parameters and speed data. The nonlinear and stochastic characteristics of interactions between soil and tools, coupled with the constraints of linear regression techniques for function approximation attract the application of ANNs for the predictive modeling of soil-working machines due to their learning nature and ability to solve complex problems by transforming them into a differentiable function [13,14].
Researchers used various tools, viz. regression model, response surface methodology, ANN, genetic algorithm (GA), and genetic particle swarm optimization (GAPSO), for modeling and the optimization of operational parameters of tillage and seeding machinery [15,16,17]. The integrated approach of modeling tools and optimization techniques has been successfully applied by researchers in various fields [18,19]. The integration of ANN with global optimization techniques like GA and particle-swarm optimization (PSO) might be helpful for modeling and the optimization of parameters of a tillage implement. However, the ability of the PSO technique to work in discrete as well as analog systems, along with better computational efficiency, makes it advantageous over other techniques [20,21].
Hence, in light of these considerations, this study was undertaken to develop ANN and regression models for predicting the power requirement of active–passive tillage machinery. To achieve this, soil-bin experiments were conducted at various gang angles, u/v ratio, soil cone index, and operative depth, and the equivalent PTO (PTOeq) power was recorded. The data were used to develop ANN and regression models using gang angle, velocity ratio, soil CI, and operating depth as input parameters, while PTOeq power was used as an output parameter. The well-trained ANN model was also integrated with PSO, and different combinations of optimal parameters were predicted by ANN–PSO.

2. Materials and Methods

2.1. Prototype Active–Passive Disc Harrow and Its Associated Test Rig for Soil-Bin Investigations

Experiments were conducted using a test rig of a combined active–passive disc harrow (APDH). To aid in its development, SolidWorks 2013 software (version SP1.0) was utilized to construct a 3D model of the APDH test rig. The isometric view of the developed laboratory prototype APDH and its associated test rig, along with the nomenclature of different parts, are shown in Figure 1. The developed APDH comprised 03 notched discs (13) in the front active gang and 03 plain discs (16) in the rear passive gang. Each of these discs featured an edge diameter of 510 mm, with a spacing of 225 mm between adjacent discs. These discs were mounted on two separate 25 × 25 mm square gang axles (15), and these gangs were affixed to the primary frame constructed from MS angle iron (2) using suitable bearings (17). In order to supply power to the front gang axle during operation, a 7.5 kW three-phase electric motor running at 1425 rpm (5) was securely positioned on top of the primary frame, employing a chain and sprocket drive mechanism. Additionally, for adjusting and controlling its operating depth, a double-acting hydraulic cylinder (19) was positioned (vertically) at the central point of the primary frame.
A guide frame (3) was integrated to ease the mobility of the test rig inside the soil bin. It was accomplished by a firm and secure linkage between the primary frame of the test rig and the bin’s side rails (1) by employing appropriate rollers. Four rollers (20) were affixed to the guide frame and positioned atop the side rails to guide and maintain the intended path of the test rig inside the soil bin. Additionally, six rollers (21) were mounted on the guide frame within the C-section of the side rails (1) to counterbalance the upward force and uphold the desired operating depth of the test rig while it moved on the carriage. These rollers also served to prevent the guide frame from moving upward during the hydraulic depth adjustment of the test rig at the beginning of each experiment, as they were secured to the side rails. The primary frame was additionally outfitted with two cylindrical side rollers (18) that were pressed against the rails. These rollers played a crucial role in mitigating the lateral force generated while the disc was in operation. This ensured the primary frame’s stability and prevented it from slipping out of the rail. The developed harrow had an operating width of 630 mm, and its operating depth could be adjusted up to 200 mm. Furthermore, an arrangement existed for altering the gang angle of the front active set (α) by manipulating the angles of the shafts responsible for transmitting motion via the universal joints (8) and by using a set of holes in the primary frame, along with adjusting the positions of the pillow block bearings (17). The primary frame was equipped with two C-channels (4), which served as a means to attach the primary frame to the intermediary carriage and allow for a free vertical movement of the test rig during the adjustment of its operating depth. Table 1 outlines the test rig’s specifications.
During the soil-bin study, the forward speed was set at a constant 3.2 km h−1, which was the maximum allowable speed within the soil bin. The circumferential speed of the discs was manipulated by varying the disc’s rpm within a range of 80 to 150. This manipulation resulted in achieving different u/v ratios, specifically 2.40, 3.00, 3.60, and 4.60, for the APDH.

2.2. Experimental Plan for Tests in the Soil Bin

The design of active tillage machinery is primarily influenced by critical factors such as the gang angle, rotational direction of the tillage tool, operating depth, and the speed ratio (which is the ratio of the circumferential velocity of the tool (u) to the forward velocity of the implement (v)). These parameters collectively impact the draft and torque requirements of powered discs [22,23,24,25]. The rotation of the discs in the same direction as the travel is referred to as concurrent rotation while rotating in the opposite direction to travel is termed as non-concurrent or reverse rotation. To conduct experiments in the non-concurrent mode for the front-powered discs, the rotational direction of the discs was altered using a motor controller switch. However, after an initial assessment of the front active set in the non-concurrent mode, it became evident that soil accumulation in front of the discs led to a significant and undesirable increase in the draft and torque requirements. Consequently, experiments were not pursued in the non-concurrent mode for the front set.
The speed ratio (u/v) plays a pivotal role in determining soil tilth/pulverization at the expense of power consumption. An increased u/v ratio leads to an unwarranted rise in power consumption, while a lower u/v ratio leads to inadequate soil pulverization and increased fluctuations in cutting resistance [2,24]. The performance of APDH was evaluated by operating the discs in the concurrent mode of the front gang axle at various u/v ratios, α, operating depth, and soil cone indices, as mentioned in Table 2. Each experiment was conducted three times.
Given the numerous possible combinations of α for both the front and rear gangs, it is impractical to test every conceivable combination. Consequently, a strategic approach was adopted, focusing on the key parameters that exert a significant influence on the outcomes to streamline the process. Specifically, the rear gang angle (β) was kept constant (30 degrees) throughout each test. In contrast, α was systematically adjusted, ranging from 25 to 40 degrees. This variation in α was implemented due to the front gang’s operation in virgin soil, where it played a predominant role in contributing to the overall draft.

2.3. Instrumentation and Measurements for Tests in the Soil Bin

The effects of α, forward speed, operating depth, and u/v ratio on the performance of APDH were studied under uniform soil conditions. The experiments were conducted in the soil bin of the AgFE Department, IIT Kharagpur, India, during the months of June to October. In order to assess the consistency of the test bed, measurements of soil CI, bulk density, and moisture content (m.c.) were taken before commencing each experiment. The MC content of the soil was determined using a rapid infrared moisture meter, and this measurement process was repeated three times for each set of experiments to ensure accuracy and reliability. For the assessment of soil CI, a hydraulically operated soil cone penetrometer was employed. The procedures followed for these measurements adhered to the guidelines specified in the ASABE Standards S313.3 [26], ensuring consistency and standardization in the data-collection process. Prior to commencing each experiment, CI readings were systematically recorded at six specific locations spaced approximately 1 m apart along the prepared test bed. This vigilant monitoring process allowed us to assess the uniformity of the soil conditions. In instances where CI readings deviated substantially from the intended values, indicating non-uniformity, corrective action was taken. The test bed was intentionally disturbed and reprepared to ensure that the soil conditions met the required standards before proceeding with the experiments. A core sampler (150 mm length × 50 mm dia.) was inserted vertically into the soil to extract soil samples for the purpose of determining the soil’s bulk density. This sampling process was repeated three times for each set of experiments, ensuring the collection of representative soil samples [27].
The test rig’s vertical positioning was facilitated by a hydraulic system, and the operating depth was precisely measured using a combination of a potentiometer (rotary type) and a rack-and-pinion mechanism. To determine the forward speed accurately, a magnetic proximity sensor was affixed to the soil-processing carriage, allowing for precise measurement of the carriage’s movement speed. For assessing the draft requirement, a calibrated S-type load cell with a 2000 kg capacity was horizontally mounted between the soil-processing carriage and the intermediary carriage, as depicted in Figure 2. This load cell provided accurate measurements of the force or draft exerted during the experiments. The load cell was equipped with a nominal sensitivity of 2.0 millivolts per volt, exhibiting a composition error within the range of ±0.03%. It functions within an excitation voltage range of 9 to 12 volts (DC). For measuring the torque requirement of the front gang axle of the APDH, a high-precision HBM torque transducer with a capacity of 1000 N-m was employed. This torque transducer was coupled to the output shaft of a 7.5 kW three-phase induction motor, which was connected to the test rig using a bellow coupling. The outputs from all the sensors utilized in the experiment were directed to the Spider-8 data-acquisition system (HBM), which was configured to sample data at a frequency of 50 Hz. Furthermore, these data were saved to a PC for subsequent analysis and processing.

2.4. Experimental Procedure for Tests in the Soil Bin

The scope of this research was confined to a single soil texture, specifically sandy clay loam, maintaining an MC within a range of 10 ± 1% (dry basis). This deliberate limitation was imposed to ensure that the experiments remained manageable and focused. Prior to each test, soil preparation was carried out using the soil-processing carriage. This process involved the utilization of a rotary tiller to alleviate stresses within the soil. Subsequently, water was applied to bring the MC within the desired range. The soil within the soil bin was leveled using a leveling blade and compacted through a hydraulic roller operation to achieve the targeted CI. Experiments were conducted only after confirming the uniformity of the test bed, which was assessed by measuring the MC, CI, and bulk density of the soil. If a substantial difference (p ≤ 0.01) was detected in the recorded CI and bulk density compared to the targeted values, the test bed was intentionally disturbed and reprepared. This rigorous procedure was consistently followed to attain the desired soil conditions before each experiment.
Before conducting each test, the data on soil condition were collected using a core sampler and the hydraulically operated cone penetrometer. Experiments were conducted over a test span of seven meters within the central section of the established test bed with each test replicated thrice. The test apparatus was moved through the soil after configuring the α to the desired settings, choosing an appropriate gear to set the forward speed at different levels, utilizing a suitable chain and sprocket drive system to attain the desired front gang axle rotation speed, and adjusting the operating depth as needed. A calibrated S-type load cell, positioned between the soil-processing carriage and the intermediary carriage, along with a torque transducer and proximity switch, continuously collected data on draft, torque, and operating speed. These data were consistently gathered and monitored by the data-acquisition (DAQ) system. Upon completing each test, the soil bed was intentionally disturbed and subsequently prepared again, ensuring consistency and uniformity in the soil conditions for conducting subsequent tests.

2.5. Estimation of Equivalent PTO (PTOeq) Power of the Tractor

The tractor’s necessary equivalent PTO (PTOeq) power for performing harrowing in real field conditions was calculated using the collected draft and torque data obtained from the soil-bin testing following Equation (1), as given below:
PTO eq   power = D f   ×   v a   3.6   ×   η PTO   to   DB + 2   ×   π   ×   N FGA   ×   T FGA 60   ×   η PTO   to   FGA
Equation (1) for PTOeq power could be rewritten in terms of specific values as follows (Equation (2)):
PTO eq   power = SD   ×   v a   3.6   ×   η PTO   to   DB + 2   ×   π   ×   N FGA   ×   ST 60   ×   η PTO   to   FGA × A sd
where PTOeq power is the equivalent PTO power of the tractor in kW; Df is the draft in kN; SD is the specific draft in kN m−2; va is the forward speed in km h−1; TFGA is the torque required at front gang axle in kN-m; ST is the specific torque requirement in kN-m m−2; Asd is the area of soil disturbance in m2; NFGA is the rpm of front gang axle; ηPTO to DB is the transmission efficiency from PTO to drawbar, and ηPTO to FGA is the transmission efficiency from PTO to the front gang axle = 0.98 × 0.98, taking into account dual speed reduction.
In accordance with ASABE standards D497.5 [28], the transmission efficiency from PTO to drawbar (ηPTO to DB) was taken into account for agricultural 2WD tractors. Specifically, it was set at 0.55 for soft soil conditions (0.50 ± 0.03 kPa), 0.67 for tilled soil conditions (0.80 ± 0.03 kPa), and 0.72 for firm soil conditions (1.10 ± 0.03 kPa) for calculating the PTOeq power of the tractor.

2.6. Development of ANN and Regression Models

2.6.1. ANN Model

In the present study, a multilayer feedforward network utilizing the backpropagation algorithm was considered due to its learning capability for any complex problem [18]. The independent parameters, viz. α, cone index (MPa), depth (mm), and u/v ratio, were used as the input while the dependent parameter, namely PTOeq power, was used as the output in the ANN model, as presented in Figure 3. The model underwent training using a randomly chosen 90% of the complete dataset obtained from the soil-bin experiments. The trained model was then tested with the remaining 10% of the data. The model was trained using two hidden layers with the ‘tansig’ transfer activation function and the ‘purelin’ transfer function in the output layer. The ANN coding was run multiple times using the trial-and-error method in MATLAB to reach the convergence criteria of the minimum mean square error (MSE). A good-performing ANN model with low MSE and high R2 was then combined with particle-swarm optimization (PSO) to optimize different parameters.

2.6.2. Regression Model

In this study, multiple regression analyses were conducted, employing curve-fitting techniques, to investigate the relationships between individual independent factors (namely, CI, u/v ratio, depth, and α) and the dependent factor (PTOeq power). The analyses were carried out using SPSS Statistics 22.0 from IBM Corporation in New York, NY, USA. These individual relationships were subsequently integrated into the final regression model for estimating the PTOeq power requirement of APDH. The regression model was fitted iteratively to the test data utilizing nonlinear least-square optimization employing the Levenberg–Marquardt algorithm proposed by [29]. Interactions between independent parameters were omitted during model development to prevent unnecessary complexity, as they did not significantly enhance model accuracy.
The effectiveness of both the ANN and regression models was evaluated using a range of statistical criteria, including performance indices such as RMSE, R2, and MAPE, as detailed below:
RMSE =   i = 1 n E i M i 2 n 2
R 2 = 1 i = 1 n M i E i 2 i = 1 n M i A i 2
MAPE = i = 1 n M i   E i   /   M i n × 100
where, Ei, Mi, and A are the values of predicted, actual, and average PTOeq power, and n is the sample size. RMSE represents the standard deviation of the residuals and serves as an indicator of the predictive capability of the model. An RMSE of 0 would indicate an outstanding model. R2 is another statistical criterion commonly utilized in soft computing models. Mean absolute percentage error (MAPE), which is typically expressed as a percentage, was also employed in the evaluation as a performance measure of the model.

2.7. Optimization Using Particle Swarm Optimization (PSO)

The particle-swarm optimization (PSO) technique is inspired by the social behavior of fish and birds. It is a powerful meta-heuristic optimization algorithm with faster convergence and the ability to search the wide space for the global minimization or maximization of parameters of both a discrete and a continuous nature, which makes it advantageous over other techniques like genetic algorithm [20,21,30]. The working strategy of the PSO algorithm is given in Figure 4. The algorithm starts with a random solution, i.e., the unplanned allocation of position and velocity to each particle. The particles are speedily moved towards their personal best locations. After attaining the personal best locations, all particles are converged to a global best location. During the entire procedure, the algorithm keeps track of the positions and velocities of all particles. The information of existing position, existing velocity, distance between existing position and pbest, and distance between existing position and gbest is used for changing the position and velocity of particles, as given in Equations (6) and (7).
v m n + 1 = w v m n + c 1 r 1 p b m x m n + c 2 r 2   ( g b m x m n )
x m n + 1 = x m n + v m n + 1
where v m n denotes the velocity of the m th particle at iteration n, w   denotes the inertia weight factor, c 1 and c 2 are individual and social learning parameters, respectively, p b m represents the position of the m th particle at its personal best value, g b m denotes the position of the m th group at its global best value, x m n indicates the position of the m th particle at iteration n, and r 1 and r 2 are uniformly distributed random numbers.
In the present study, the design problem was of a minimization nature, involving α, cone index, depth, and u/v ratio, as represented by X1, X2, X3, and X4, respectively. Therefore, this problem can be represented mathematically in the following form:
min X X T f ( X )
25     X 1     40
0.5     X 2     1.1
100     X 3     140
2.40     X 4     4.60
where X = [ X 1 , X 2 , X 3 , X 4 ] T indicates the decision solution vector.

3. Results and Discussion

As per the experimental plan outlined in Table 2, the test rig for the APDH underwent testing within the soil bin under varying conditions. These conditions included different values for α at 25°, 30°, 35°, and 40°, various u/v ratios at 2.40, 3.00, 3.60, and 4.60, cone index (CI) values within the ranges of 0.50 ± 0.03, 0.80 ± 0.03, and 1.10 ± 0.03 kPa, and different working depths set at 100, 120, and 140 mm. It is noteworthy that the rear gang angle (β) remained fixed at 30° throughout the experiments. The research design adopted a fully randomized approach, and 03 replications were conducted for each soil condition and operational factor. To assess the significance of the various independent factors and their interactions, an ANOVA was performed. Furthermore, to examine the presence of significant differences between treatment means, multiple comparison procedures were carried out using Duncan’s multiple range (DMR) tests. The detailed findings of the experiments are presented in Table 3.

3.1. Effect of Operational Parameters on Specific Draft of APDH

Table 3 illustrates a noteworthy trend in the specific draft of the APDH. It consistently decreased as the u/v ratio increased across all settings of α and various operating conditions. What is particularly interesting is that this reduction in specific drafts became more noticeable up to a u/v ratio of 3.60. Beyond this point, any further increase in the u/v ratio resulted in a negligible reduction in the specific draft. This observation suggests that there is a point of diminishing returns when it comes to increasing the rpm of the discs. Beyond a certain threshold (a u/v ratio of 3.60 in this instance), the soil’s shear strength appears to have reached a minimum, indicating thorough soil pulverization. Consequently, further intensifying the no. of bites per unit time by increasing the disc’s rpm seems to have no significant effect on reducing specific draft. This reduction in the draft, leading to a decrease in the specific draft with an increase in the u/v ratio, is consistent with findings from previous experiments conducted with powered discs [22,24,25].
When examining the impact of α on the draft, two critical factors come into play. The first factor is the area of contact between the convex surface of the disc and the furrow wall, which we refer to as the rear-side bearing area. The second factor involves the amount of soil that the discs interact with during their forward movement. When the α increases, it leads to a larger area of contact between the convex surface of the disc and the furrow wall. This increased contact area results in greater scrubbing of the discs, which, in turn, demands higher energy to surmount the friction forces when the discs are in free-rolling mode. However, this extended rear-side bearing area also contributes to generating forward thrust or reducing the draft requirement when the discs are actively rotating. This reduction in draft occurs because the furrow wall provides bearing support to the discs. Therefore, the intrinsic result of the increase in α is to lower the draft when the discs are in free rolling mode, and increase it when they are in powered mode. This change in the draft is primarily due to the alteration in the rear-side bearing area. However, as α increases further, it also results in the discs handling a larger quantity of soil. This increase in the quantity of soil being processed leads to an elevated draft requirement for both the active and free-rolling modes of the discs. Consequently, the overall variation in draft force with changes in α is determined by the cumulative impact of these parameters. Additionally, it is important to note that, as α continues to increase, the rear-side bearing area of the discs eventually reduces to zero at a specific gang angle. This point is known as the critical gang angle. Beyond this critical angle, any further increase in α only serves to increase the amount of soil manipulated by the discs as also documented by [31].
From the data presented in Table 3, it is evident that the specific draft of the APDH exhibited a moderate increase, with an increase in α up to 35°, regardless of the u/v ratio and soil condition. However, beyond this point, there was a sharp and notable increase in the specific draft. This increase in specific draft with a higher α can be attributed to two primary factors. (1) As α increases, there is a reduction in the rear bearing area. This decrease in bearing area results in less support for the discs from the furrow wall, leading to an increase in the specific draft. (2) Additionally, an increase in α corresponds to a larger volume of soil manipulated by the discs. The greater quantity of soil being processed contributes to an elevated draft requirement. At higher α values, especially beyond 35°, the rear bearing area becomes nearly insignificant, and the substantial increase in the amount of soil being manipulated intensifies the specific draft. The rise in draft associated with an augmentation in disc angle plays a substantial role in driving up the specific draft of the APDH. Similar observations regarding draft have been reported in experiments conducted with powered discs in Bangkok clay and sandy loam soils by researchers such as [23,24,25,32]. These findings collectively support the observed trend of increased specific draft with higher α in the APDH.
The specific draft of APDH was augmented with an increase in soil CI and operating depth at all tested conditions (Table 3) which is a direct consequence of the heightened soil resistance associated with these conditions.

3.2. Effect of Operational Parameters on Specific Torque of APDH

The data presented in Table 3 reveals a consistent pattern: The specific torque requirement of the APDH decreased as the u/v ratio (rpm of the front gang axle) increased across all tested conditions. This reduction in specific torque requirement was particularly notable up to a u/v ratio of 3.60, beyond which any further elevation in the u/v ratio resulted in only a negligible reduction. This is because, at higher rotational speeds of the discs (higher u/v ratios), there is a decrease in the force necessary for cutting. Essentially, the resistance to cutting is reduced at these higher speeds. Furthermore, at elevated u/v ratio settings, the powered discs operated in the same area of tilled soil for an extended period of time and repeatedly interacted with the soil that had already been tilled. This repeated interaction contributed to a decrease in the average torque required. The minimal decrease in specific torque beyond the u/v ratio of 3.60 may be due to a balance between factors. While there may be an increased torque requirement to overcome air resistance and the increased soil displacement at a higher rpm of the discs, this increase is counteracted by the reduced torque required for cutting the pulverized soil. This equilibrium results in no significant change in the total torque requirement when the u/v ratio is increased from 3.60 to 4.60.
Similar observations regarding the decrease in torque demand with an increase in the u/v ratio have been reported in tests carried out utilizing powered discs in Bangkok clay and sandy loam soils by researchers such as [23,24,25]. These findings corroborate the observed trend of reduced torque demand with higher u/v ratios in the APDH.
Furthermore, Table 3 reveals a noticeable trend. The specific torque requirement of the APDH decreased as α increased under all tested conditions. This reduction was particularly pronounced from 25° to 35°. However, when α increased further from 35° to 40°, this reduction became almost negligible. The potential explanation for this decrease in specific torque requirement lies in the lower friction force generated because of the diminished contact area between the rear side of the disc and the furrow wall as α increases. Essentially, the greater α leads to less contact between the discs and the furrow wall, resulting in reduced friction and, consequently, a decreased torque requirement. The substantial decrease in the specific torque requirement observed from 25° to 35° is a direct consequence of the increased volume of soil being handled. However, as α continues to increase from 35° to 40°, the effect of this reduced rear-side bearing area on the torque requirement is partially offset by the substantial increase in the amount of soil being processed. This balancing act leads to a lesser reduction in the torque demand of the APDH within this range of α.
It is worth noting that this phenomenon of reduced torque, responsible for the decline in specific torque requirement with an increase in disc angle, has also been reported in tests conducted with powered discs in Bangkok clay and sandy loam soils by researchers such as [23,24,25]. These research findings align with the observed trend of the decreased specific torque requirement with an increased α in the APDH.
The specific torque demand of the APDH increased as both the soil CI and operating depth increased across all tested conditions (Table 3). This increase in specific torque is because of the increased soil resistance linked with greater CI values and operating at greater depths.

3.3. Effect of Operational Parameters on PTOeq Power of APDH

The results of the ANOVA for the PTOeq power for APDH are given in Table 4. From this table, it is evident that the effects of all considered factors were significant for the PTOeq power for APDH at a 99% confidence interval. No significant effect was found for their interactions except the interactions of depth with α and soil CI. The F values given in Table 4 demonstrate that the soil CI had the utmost influence on the PTOeq power followed by the depth, u/v ratio, and α in that order. The individual effects of these parameters on the PTOeq power for APDH are discussed separately in the following sections.
Table 3 highlights an interesting trend; PTOeq power for the APDH decreased as the u/v ratio increased from 2.40 to 3.60. However, beyond this point, there was a sharp increase in PTOeq power when the u/v ratio reached 4.6 across all investigated combinations of soil and working parameters. This pattern clearly indicates the presence of an optimal u/v ratio for actively rotating discs in terms of energy consumption. The initial decline in PTOeq power from a u/v ratio of 2.40 to 3.60 can be explained by the significant reduction in the draft and torque requirements of the APDH as the u/v ratio increased. This reduction effectively counteracted the higher power requirement resulting from an increase in the rpm of the front gang. Notably, there was only a marginal reduction in the draft and torque demand of the APDH when the u/v ratio was increased from 3.60 to 4.60. However, as the u/v ratio exceeded 3.60, the disc rpm continued to increase, leading to a sharp rise in PTOeq power (according to Equation (2)). In essence, beyond a u/v ratio of 3.60, the increase in disc rpm surpassed the decrease in the draft and torque requirements of the APDH. Consequently, increasing the u/v ratio beyond 3.60 provided no advantage in terms of draft and torque reduction; instead, it resulted in unnecessary power consumption to overcome air resistance due to higher disc rotation, greater soil-slice displacement, and the additional task of further soil pulverization.
The mean PTOeq powers for APDH for the u/v ratios of 2.40, 3.00, 3.60, and 4.60 was found to be 5.67, 5.34, 5.08, and 5.95 kW, respectively, for the entire test range of α, depth, and soil CI. Significant differences existed between the average values of PTOeq power for APDH recorded at various levels of u/v ratio at a 95% confidence interval.
As shown in Table 3, the PTOeq power for the APDH displayed a particular pattern in response to changes in α (gang angle) across all tested soil and working parameter combinations. Initially, PTOeq power decreased as α increased from 25° to 35°. However, beyond 35°, there was a sharp increase in PTOeq power when α reached 40°, indicating the presence of an optimal gang angle setting for the APDH near 35°. The initial decline in PTOeq power with the increase in α from 25° to 35° was primarily attributed to a significant reduction in torque requirements. However, as α continued to increase beyond 35°, PTOeq power increased due to a sharp rise in the draft, while the torque requirement exhibited almost negligible reduction.
The mean PTOeq powers for α of 25°, 30°, 35°, and 40° were found to be 5.73, 5.50, 5.19, and 5.63 kW, respectively, for the test range of u/v ratio, depth, and soil CI. No substantial difference was found to exist among the mean PTOeq power at α of 25° and 40°, whereas PTOeq power at α of 30° and 35° was found to be significantly different from each other as well as from PTOeq power at α of 25° and 40°.
In general, the PTOeq power for APDH was found to increase with an increase in operating depth at all tested levels of α, u/v ratio, and soil CI. The obvious explanation for the increase in PTOeq power for APDH with an increase in depth was the higher draft and torque requirement of APDH at higher depths of operation. Furthermore, the PTOeq power for APDH enhanced with an increase in soil CI at all tested conditions because of the higher penetration resistance linked with more CI values.

3.4. Multiple Regression Model

To develop the regression model, the Levenberg–Marquardt estimation technique [29] was followed with the negligence of interactions between parameters. This was because it added complexity to the model without yielding substantial improvement in accuracy. Multicollinearity was checked by taking into account the tolerance and variance inflation factor (IFvar) as measures of any possible correlations between the factors. The results indicated no evidence of multicollinearity, as the IFvar value was one.
The average draft and torque data obtained from the soil-bin tests were at three levels each of operating depth and soil CI; four levels each of u/v ratio and α were analyzed using SPSS 22.0 software and were used to develop the PTOeq power model for APDH using a multiple regression technique. Soil CI and operating depth were found to have a linear relationship with PTOeq power requirement. However, α and u/v ratio had a quadratic relationship with PTOeq power requirement. The formulated model for estimating the PTOeq power requirement of APDH is as follows (Equation (8)):
PTO eq   power   = C 0 + C 1   ×   α   +   C 2 ×   α 2 + C 3   ×   u v + C 4   ×   u v 2 + C 5   ×   CI   +   C 6   × d
where, PTOeq power is in kW; α is the gang angle of the front set in degrees; CI is the cone index of the soil before tillage in MPa; d is the operating depth in mm; u/v is the speed ratio; and Ci = regression coefficients, the values of which are provided in Table 5 along with the standard error values, i = 0, 1, 2, 3, 4, 5.
The results of regression analysis for the PTOeq power prediction model of APDH are given in Table 6. The high R2 affirmed the precision of the formulated model and suggested that the variables under consideration could account for a significant portion of the variance observed in the experimental data.

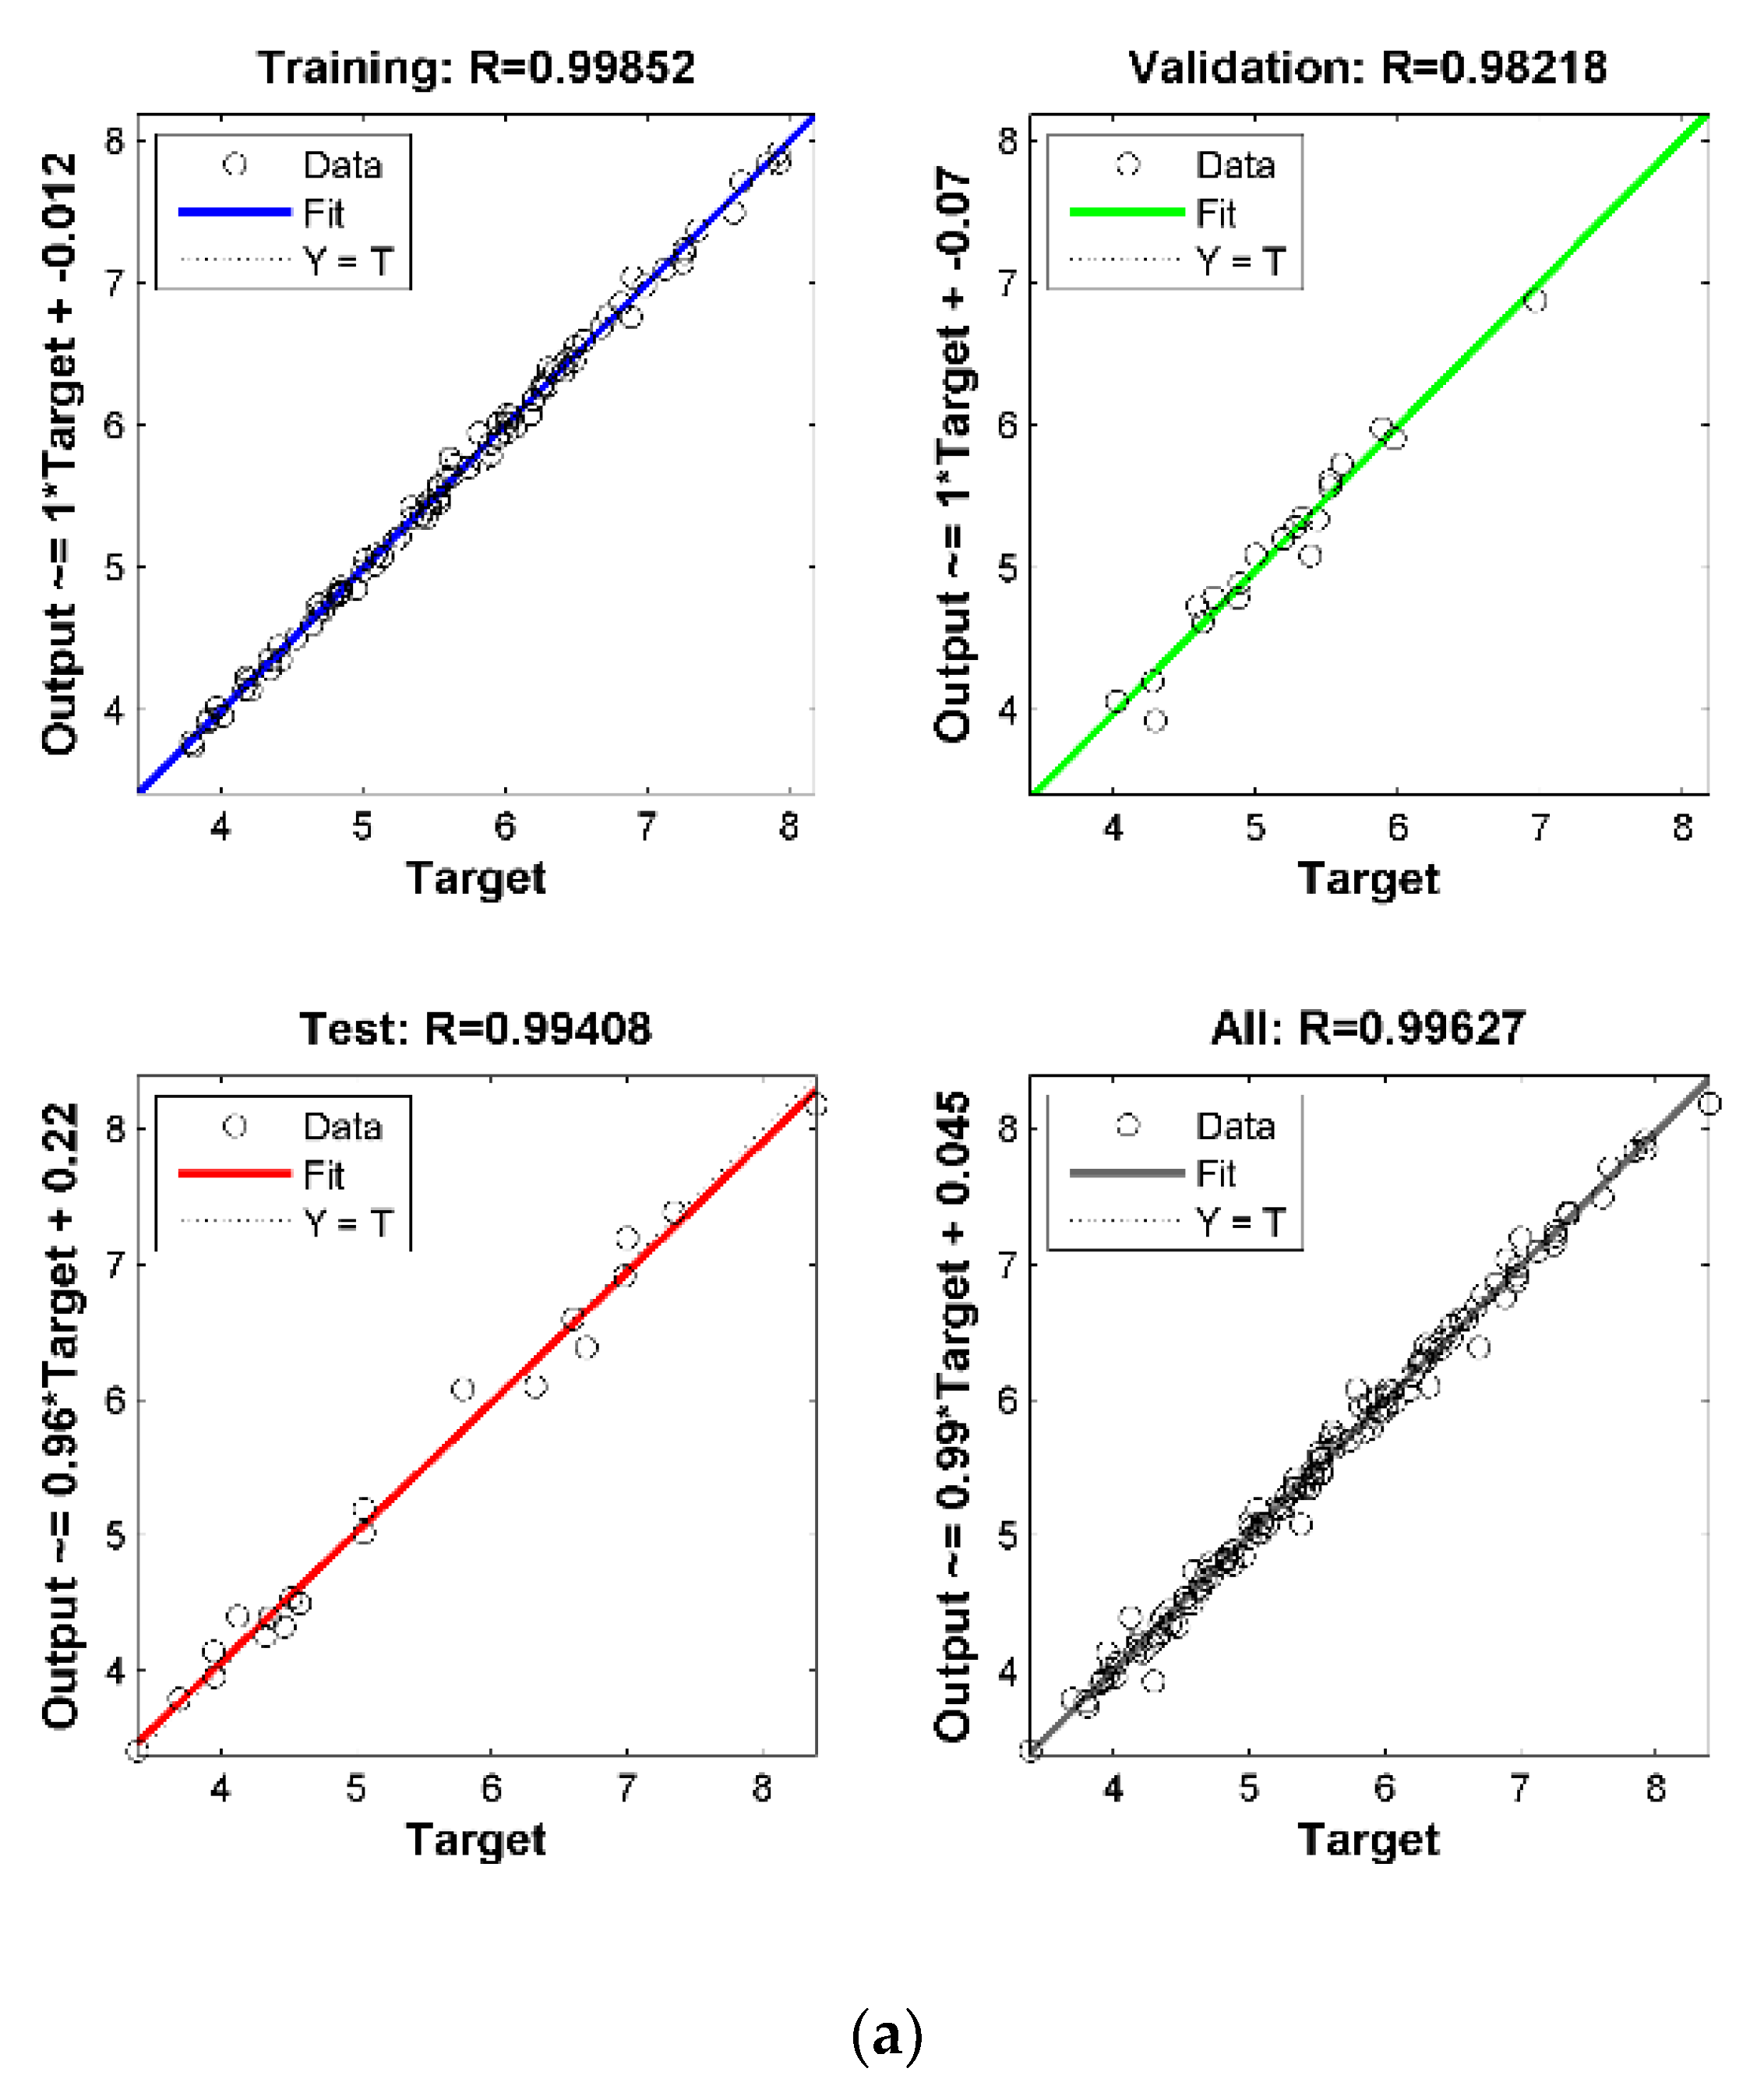
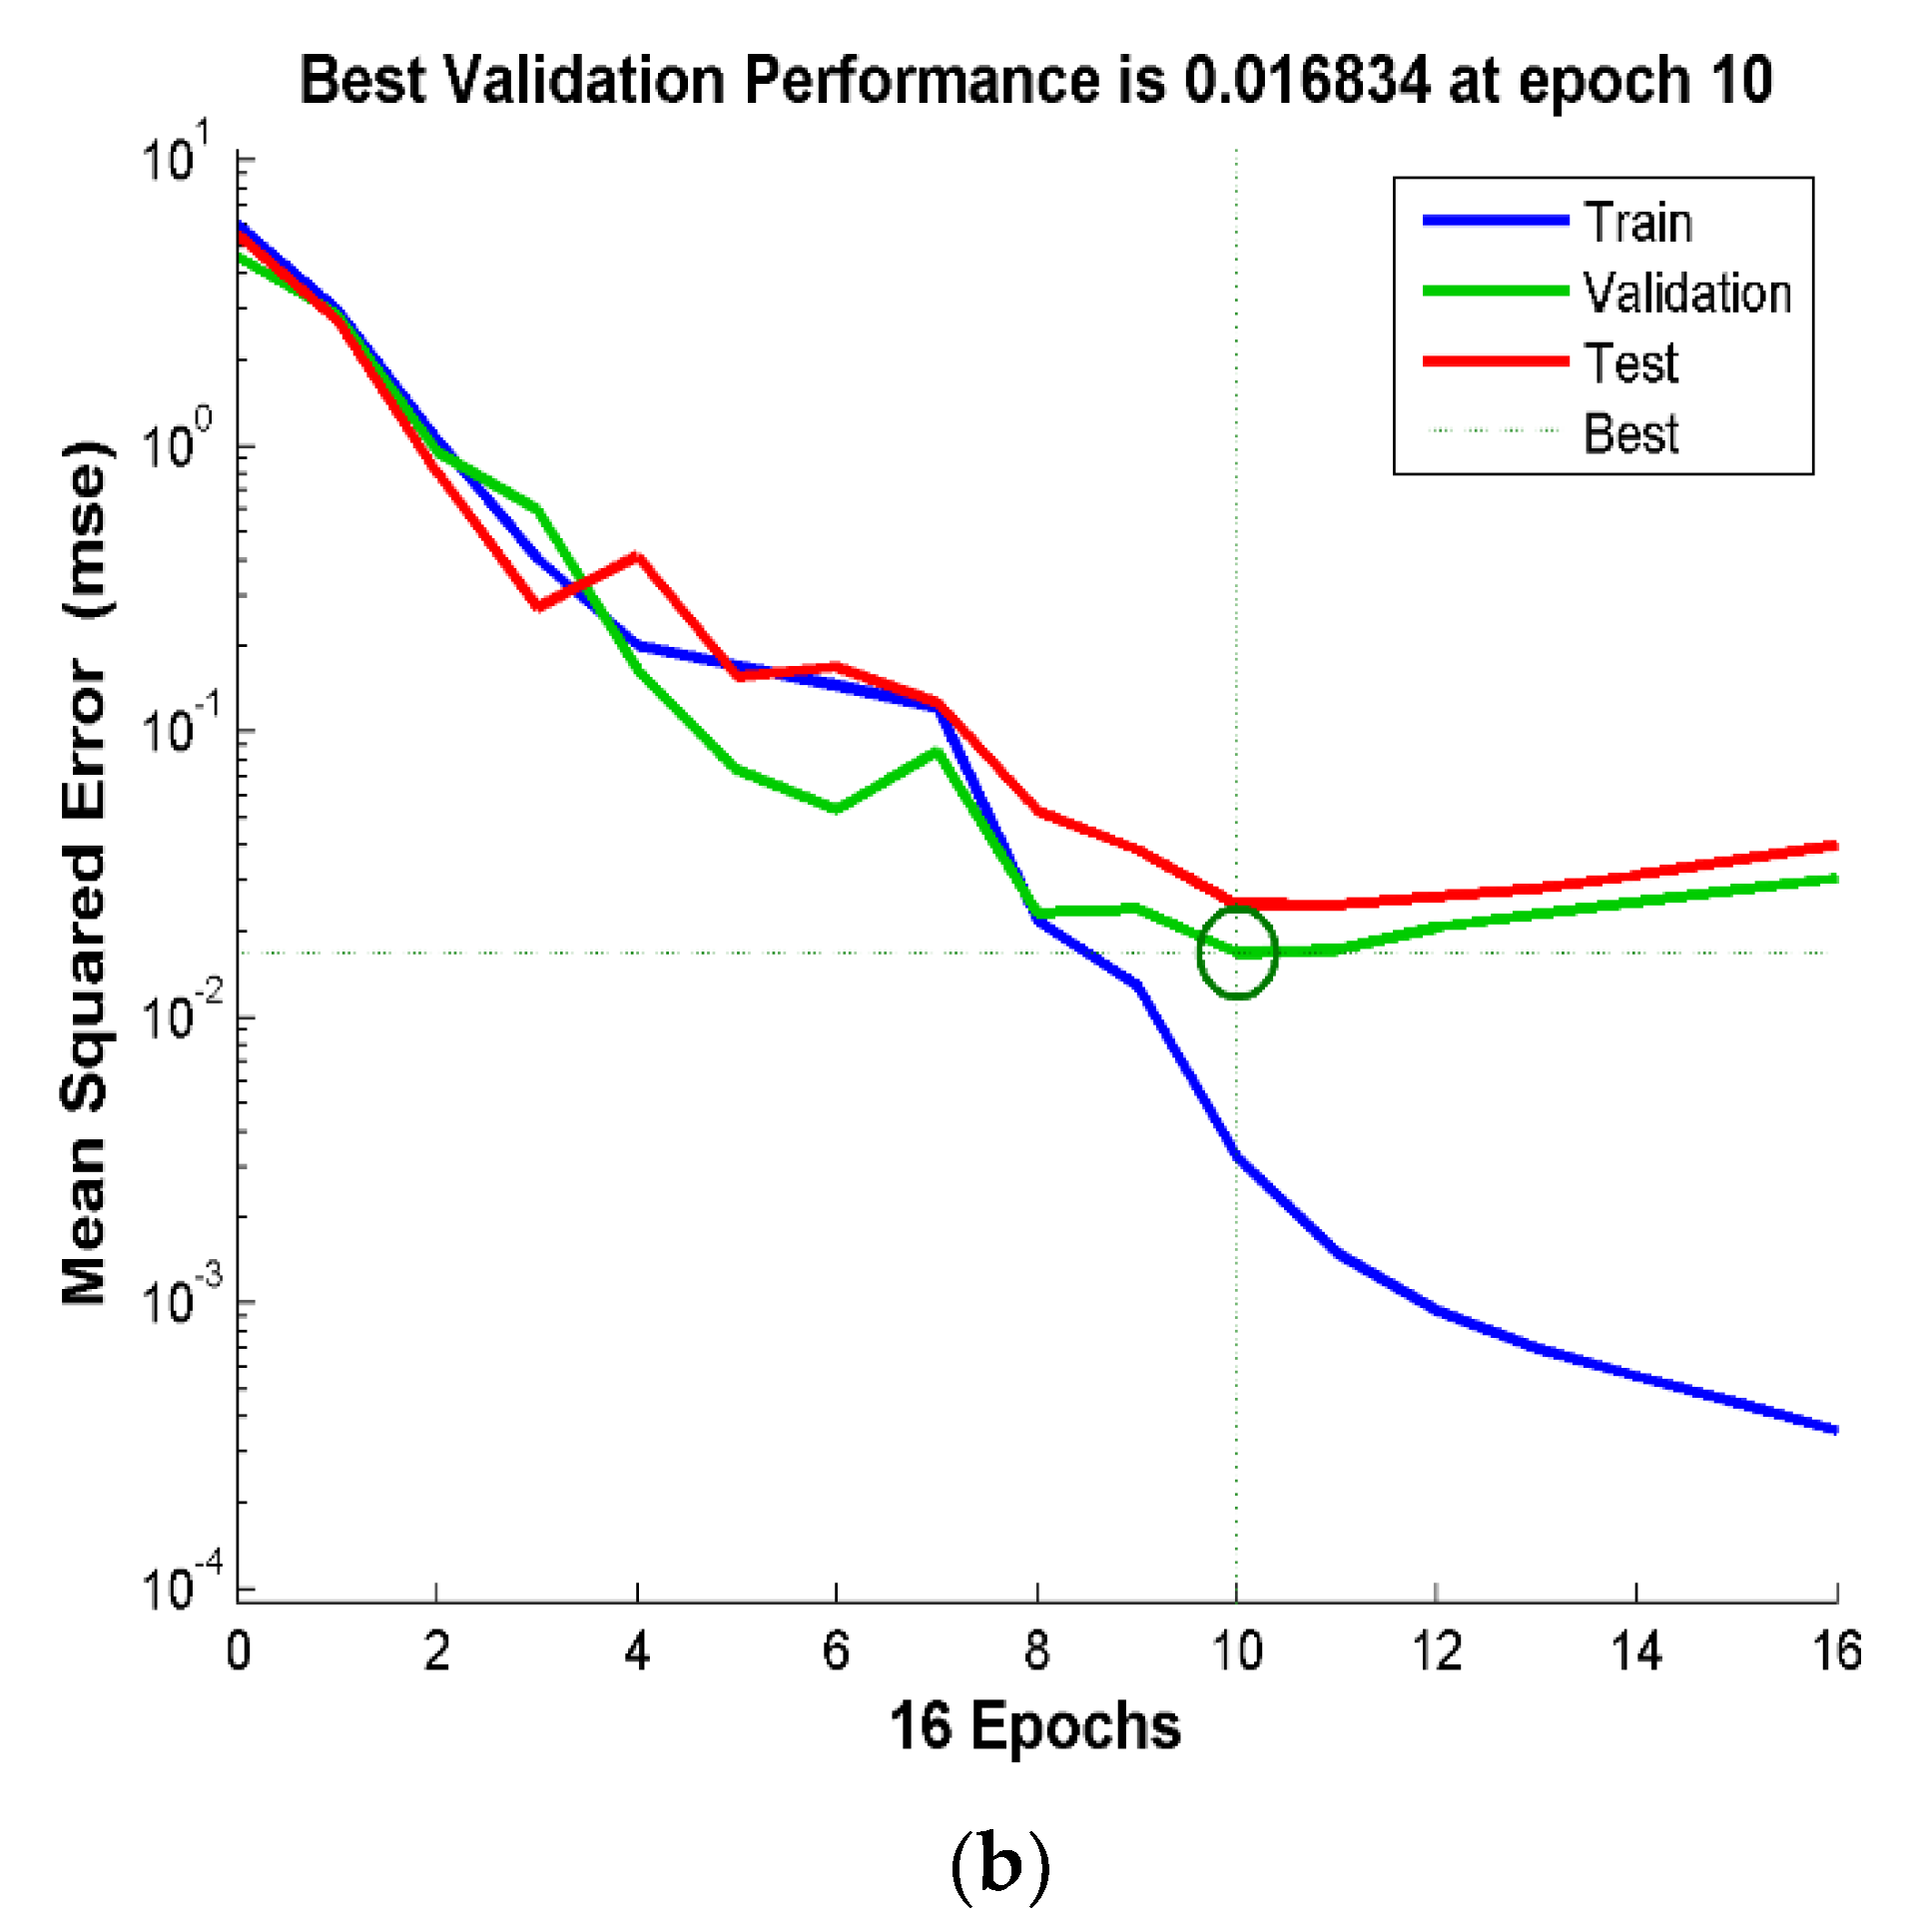
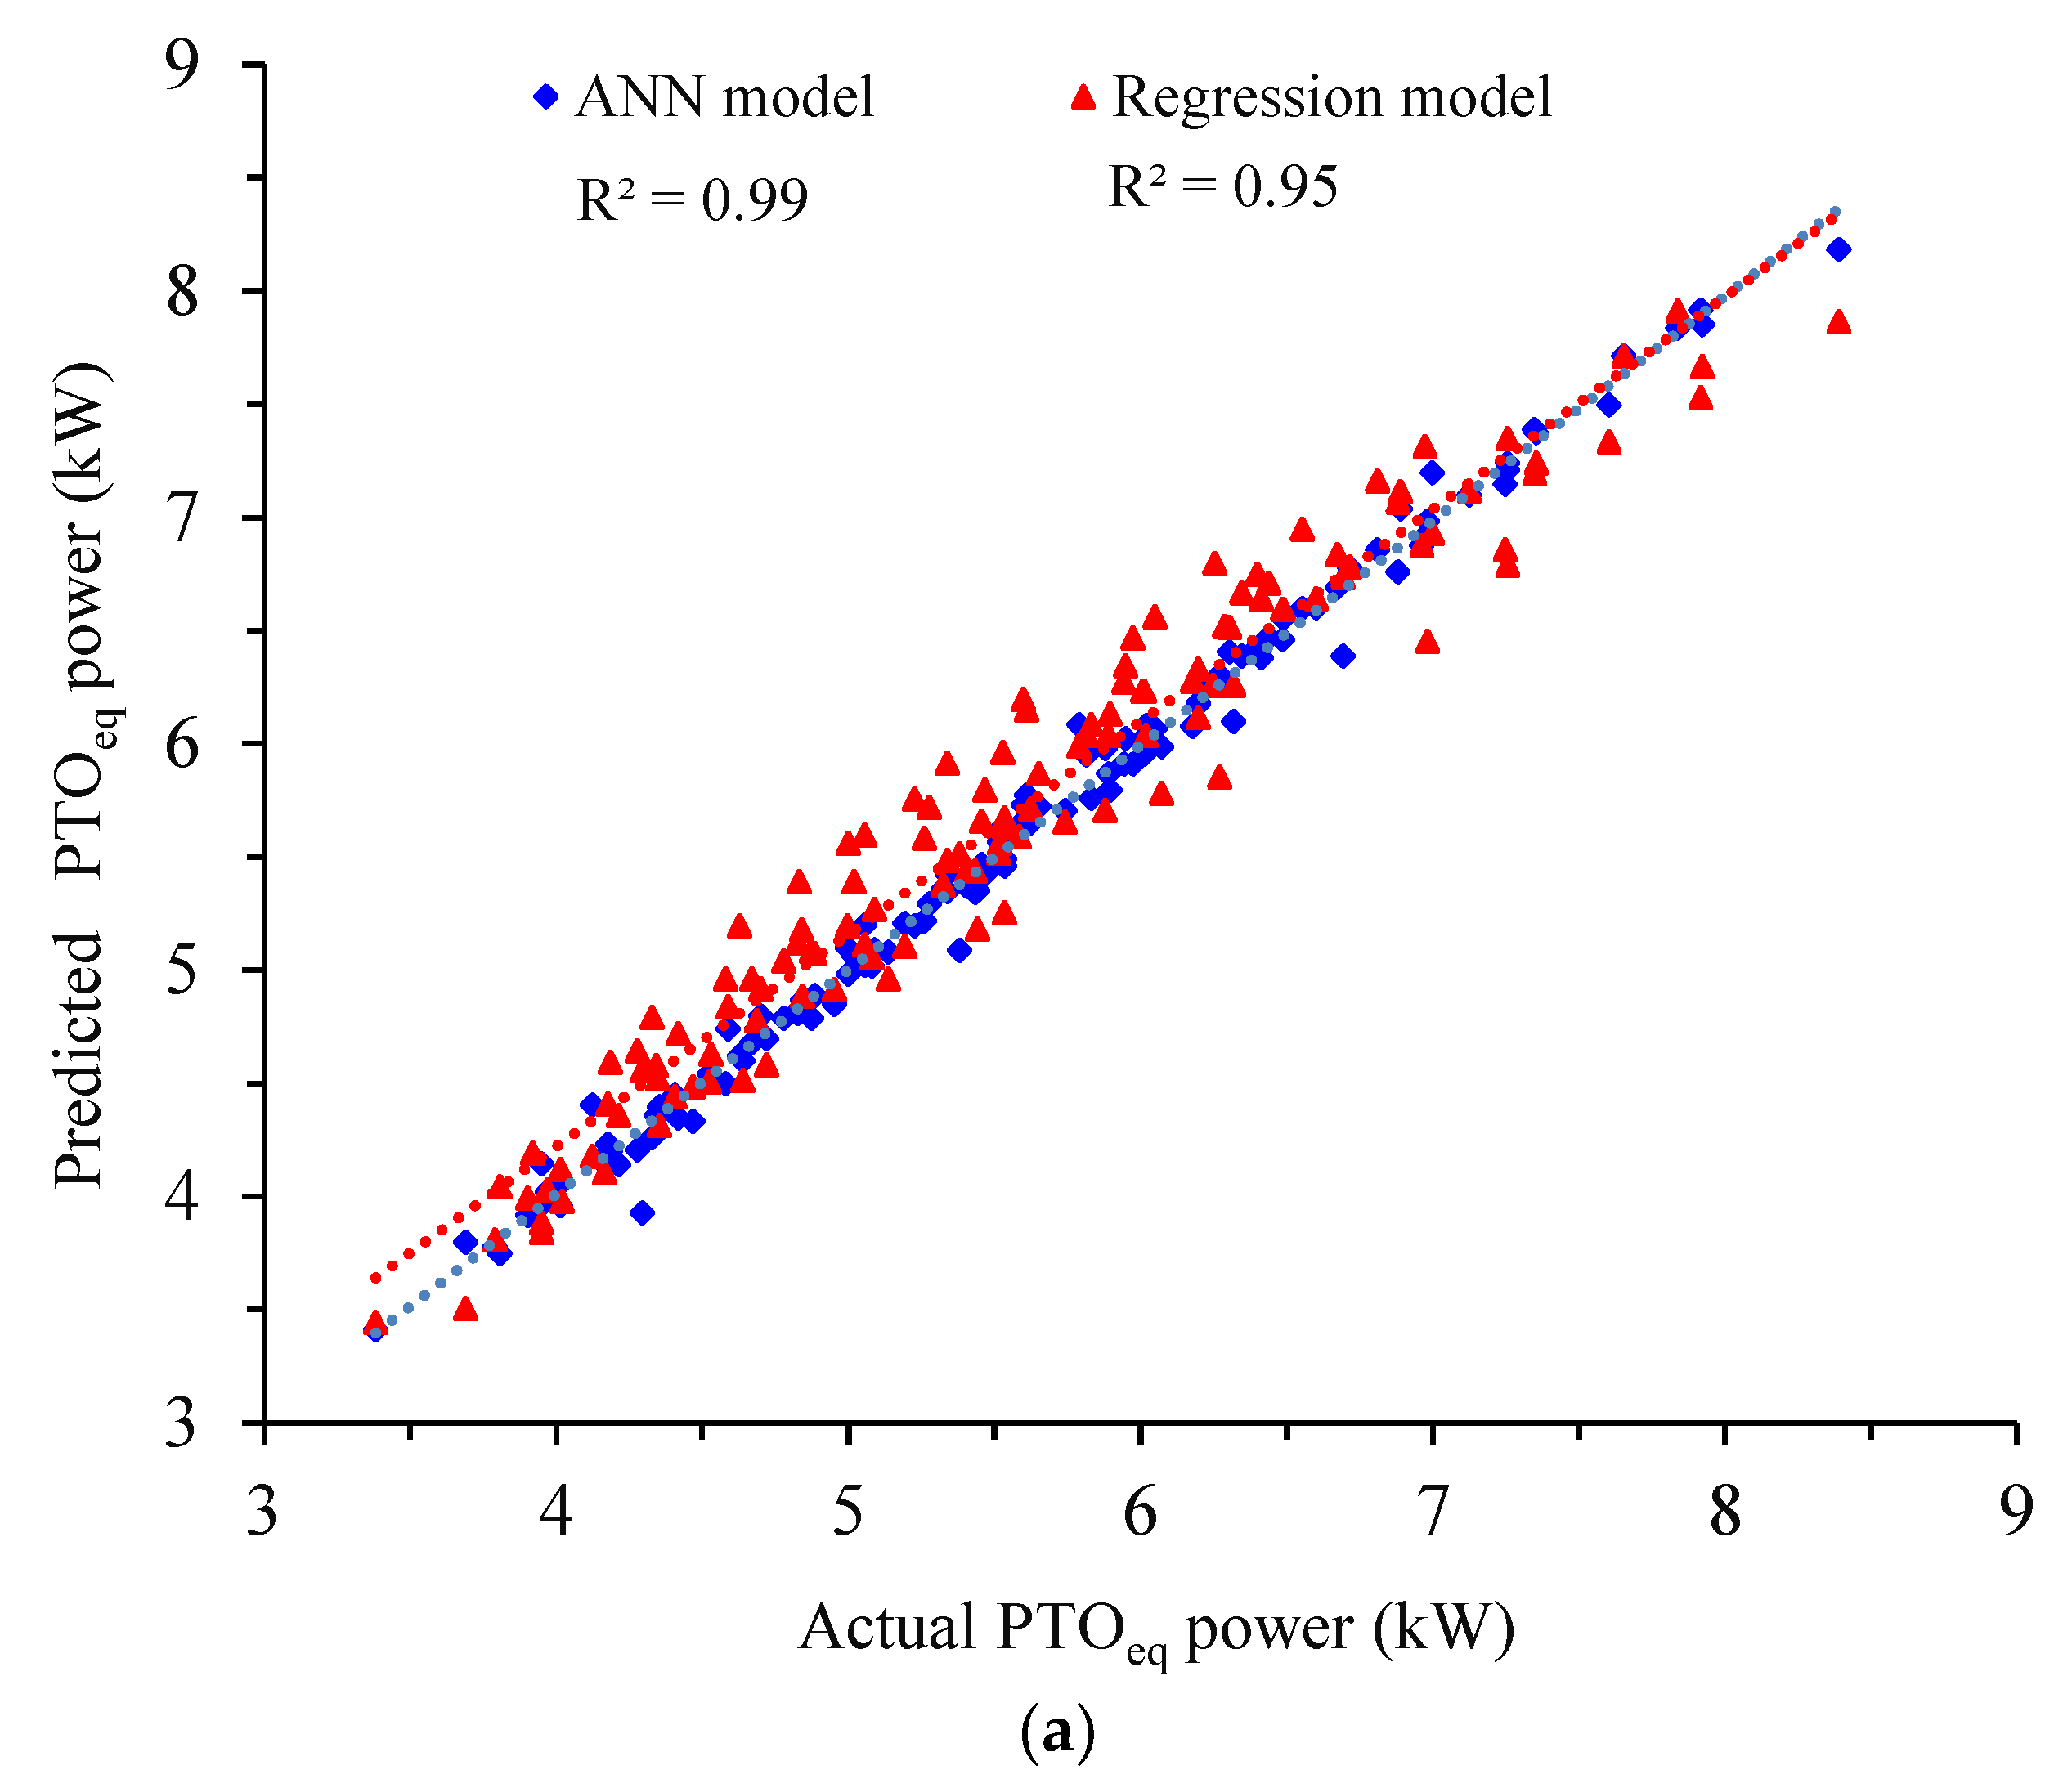
3.5. Performance of ANN and Regression Models during the Training and Testing Phases

It is evident from the regression plot presented in Figure 5 that the formulated ANN model predicted PTOeq power reasonably well, with values close to the actual one during the training phase. In the training process of the model, mean square error (MSE) reached a minimum value within 10 epochs for validation, relating it to a faster convergence of the model. The comparative performances of the ANN and regression model during the training and testing phases are exhibited in Figure 6 and Table 7. Both models predicted the PTOeq power data close to the actual one; however, the performance of ANN was superior to the regression model in terms of the R2 value and MSE during the training as well as the testing phase.

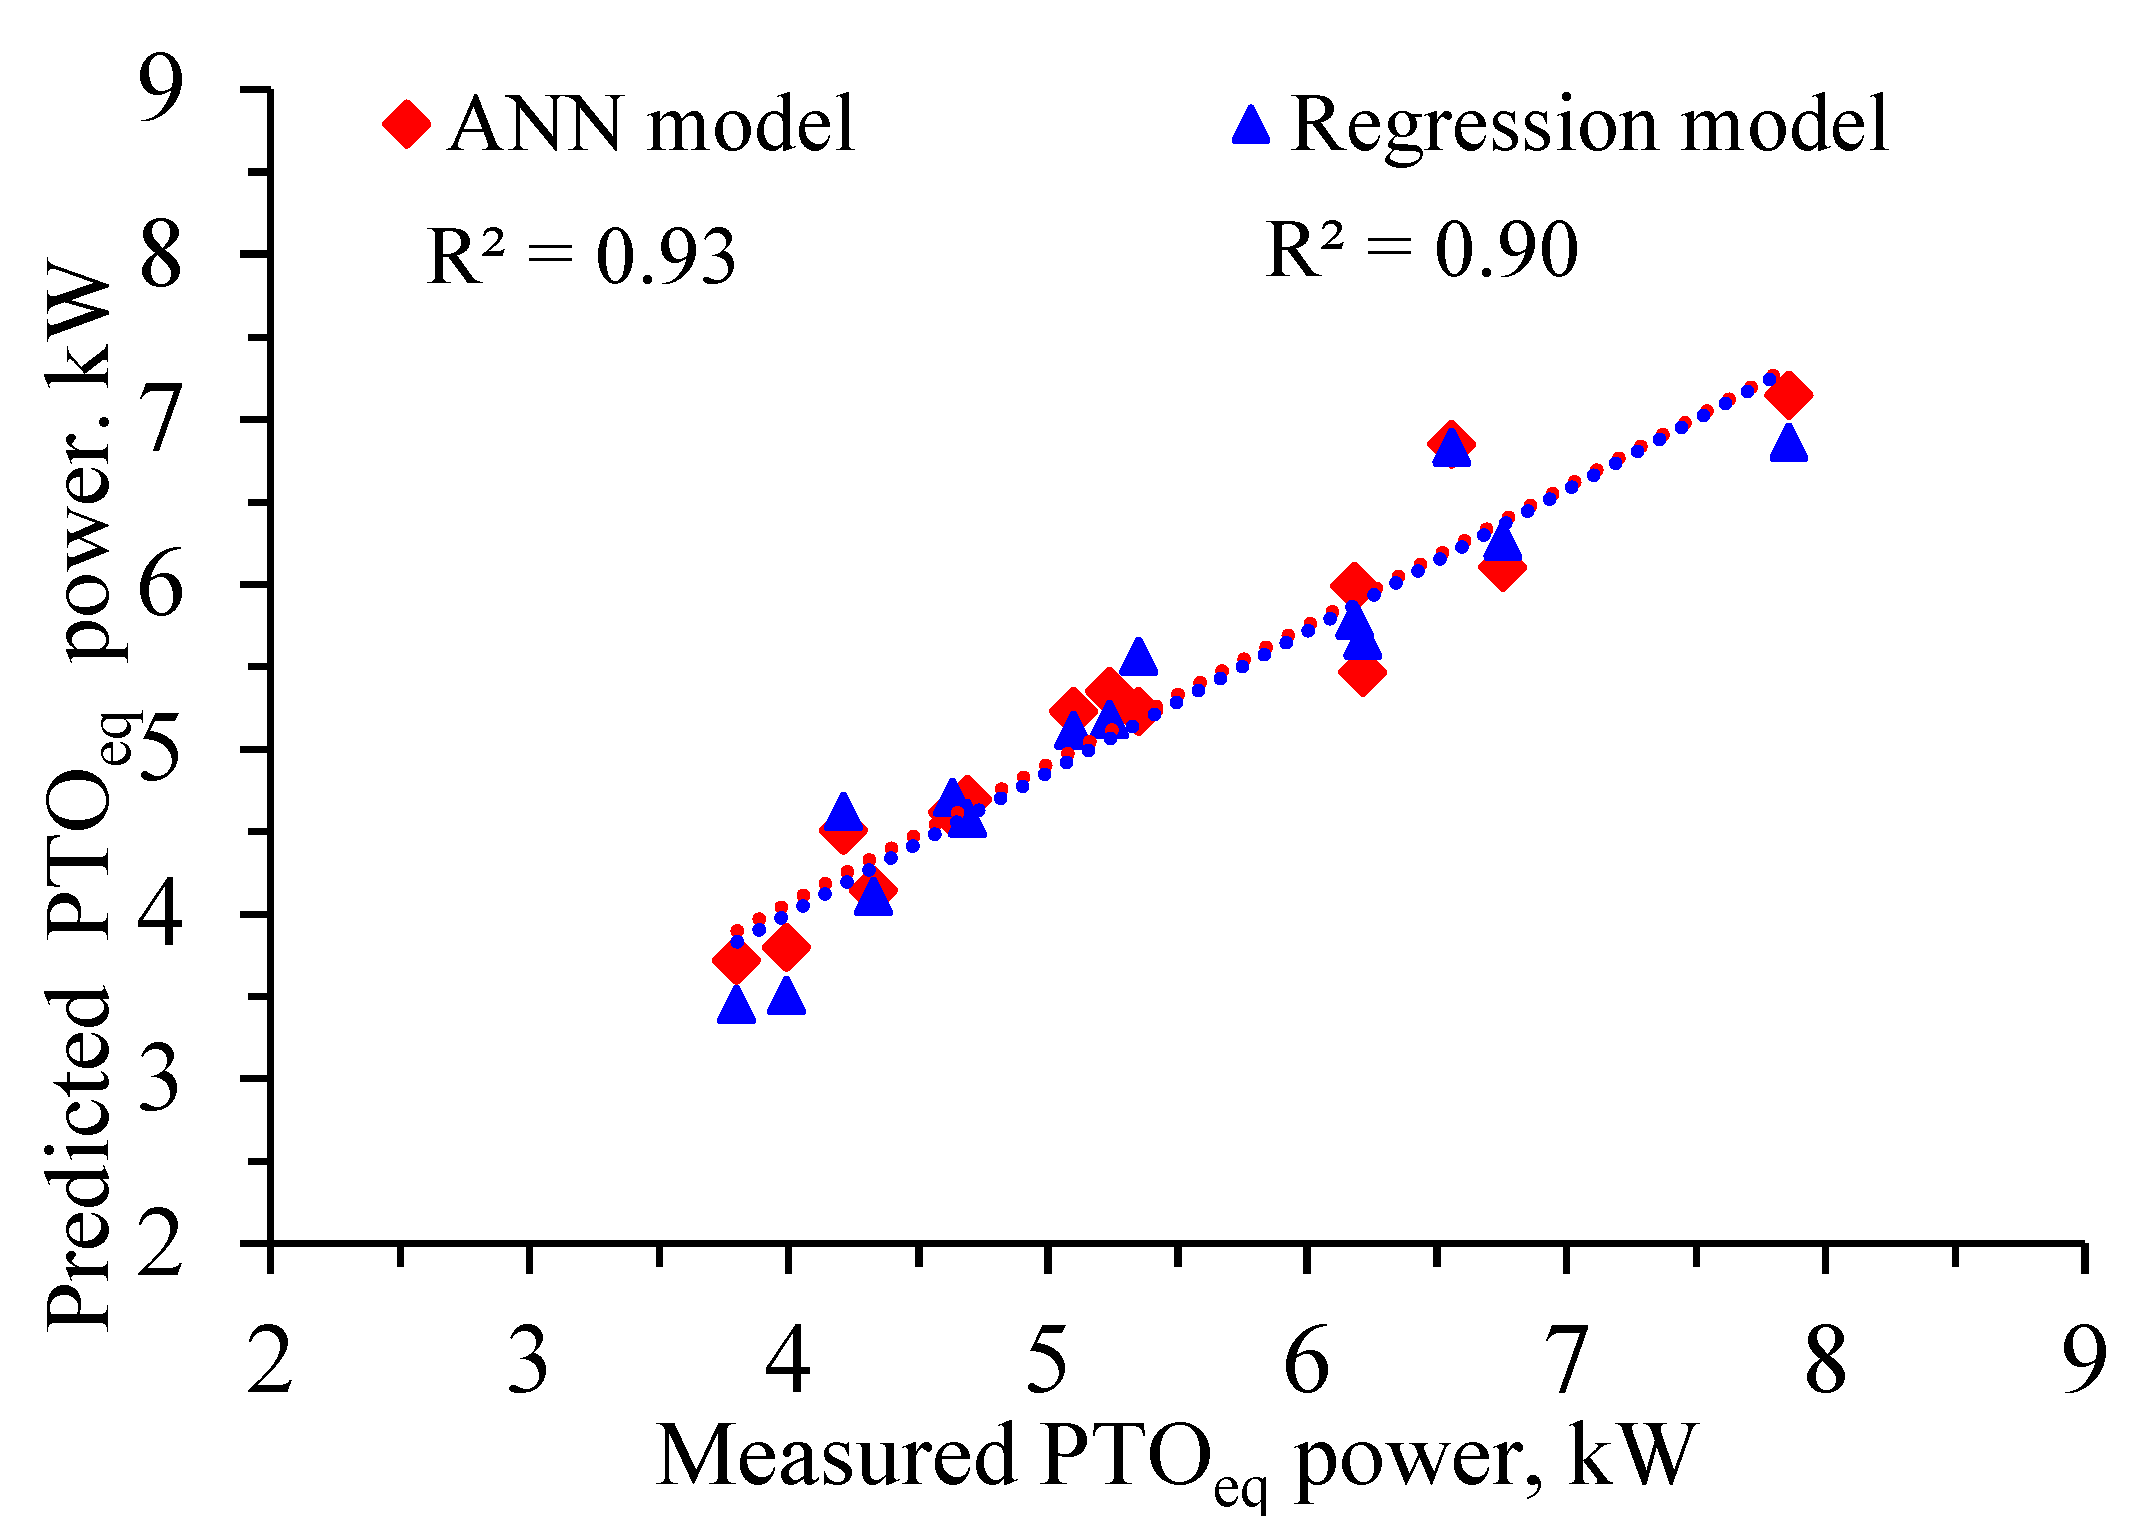
3.6. Validation of Formulated Models with Independent Data

The formulated models were also validated by keeping the levels of front gang angles, cone index, and depth as used in the experiment but varying the u/v ratio now by changing the forward speed (2.5–3.2 km h−1) while keeping the disc speed fixed as 100 rpm (Figure 7). During the validation of models with independent data also, ANN outperformed the regression model with a high R2 value and low MSE. From the presented results, it is evident that, overall, the ANN model showed superior performance and precisely predicted PTOeq power close to the measured values.

3.7. Prediction of Optimal Parameters Using ANN–PSO

The well-trained ANN model was coupled with PSO to predict the optimal operational settings. The program was run repeatedly to estimate different combinations of optimal parameters, as given in Table 8. The predicted PTOeq power was compared with the actual PTOeq power available either in the standard run or alternatively, through experimentation with the new sets of conditions. It is interesting to see that the PSO-trained ANN model indicated better performance than the regression model in terms of RMSE, MAPE, and R2 value during the training phase of the model. However, in some instances, the performance of the regression model was better during the testing phase compared to the ANN–PSO technique (for instance, combinations given at serial numbers 1 and 2).
One interesting thing to be observed in Table 8 is that all combinations exhibited an optimal front gang angle of 35 ± 2° and a cone index of 0.5 MPa to achieve the minimum PTOeq power. Among various combinations, optimal parameters having a 36.6° front gang angle, 0.5 MPa cone index, 100 mm depth, and 3.90 u/v ratio were considered according to the performance indices of the model, i.e., low RMSE and high R2 value along with lesser variability in the predicted and actual PTOeq power. The results given in Table 8 indicate that the ANN–PSO model predicted the optimal parameters with reasonably good accuracy and low variation (±6.85%) between the predicted and actual PTOeq power. The learning ability of ANN and the optimization of network parameters by the PSO technique makes ANN–PSO a faster and more accurate technique for handling complex and nonlinear problems. The convergence plot of the fitness function of PSO is presented in Figure 8. It is evident from Figure 8 that all particles converged rapidly towards the global minimum within 20 iterations, which makes it faster and advantageous over other techniques [30].

4. Conclusions

Predicting the power requirements of agricultural machinery is crucial for optimizing performance, reducing energy consumption, and improving overall efficiency. In this study, predictive models for the power requirement of tillage machinery, particularly an active–passive tillage machinery, were formulated by means of artificial neural networks (ANNs) and regression techniques using data from soil-bin experiments conducted at various gang angles, u/v ratios, soil cone indexes, and operative depths. The following conclusions were drawn from the study:
  • Both the ANN and regression models performed well in predicting the power requirement; however, the ANN model had superior performance over the regression model, as evidenced by high R2 values and low MSE during the training, testing, and validation phases.
  • The well-trained ANN model was then integrated with PSO and different combinations of optimal parameters were predicted by ANN–PSO with good accuracy and lesser variation (±6.85%) between the predicted and actual PTOeq power.
  • The combination of a 36.6° front gang angle, 0.50 MPa cone index, 100 mm depth, and 3.90 u/v ratio was found to be an optimal setting for the predicted PTOeq power of 3.36 kW against 3.45 kW (actual).
  • It was observed that all combinations of soil and working parameters (i.e., CI and depth) exhibited an optimal front gang angle in the range of 35 ± 2° and a u/v ratio of 3.65 ± 0.25 to achieve the minimum PTOeq power.
These findings can have practical implications in agriculture by aiding in the selection of optimal equipment settings to reduce energy consumption, minimize operational costs, and improve fieldwork efficiency. In conclusion, this study underscores the significant role of techniques like ANN and PSO in the precise prediction of performance characteristics and the optimization of operational parameters of tillage tools for improved efficiency and quality of work with minimal expenditure of energy.

Author Contributions

Conceptualization, G.U.; methodology, G.U. and H.R.; software, N.K. and R.D.; validation, G.U. and N.K.; formal analysis, G.U. and R.D.; investigation, G.U. and H.R.; resources, H.R.; data curation, G.U. and R.D.; writing—original draft preparation, G.U.; writing—review and editing, G.U. and N.K.; visualization, H.R.; supervision, H.R.; project administration, G.U. and H.R.; funding acquisition, H.R. All authors have read and agreed to the published version of the manuscript.

Funding

This research received funding from MHRD, Govt. of India.

Data Availability Statement

The data are contained in the article.

Acknowledgments

The funding and cooperation received from MHRD, Govt. of India, to carry out this research work is sincerely acknowledged.

Conflicts of Interest

The authors declare no conflicts of interest.

References

  1. Wilkes, R.D.; Addai, S.H. The use of the ‘Wye Double Digger’ as an alternative to the plough to reduce energy requirement per hectare and soil damage. In Proceedings of the International Conference on Agricultural Engineering, Richmond, Australia, 25–30 September 1988. Paper (No. 88-190). [Google Scholar]
  2. Shinners, K.J.; Wilkes, J.M.; England, T.D. Performance characteristics of a tillage machine with active-passive components. J. Agric. Eng. Res. 1993, 55, 277–297. [Google Scholar]
  3. Manian, R.; Kathirvel, K. Development and evaluation of an active-passive tillage machine. Agric. Mech. Asia Afr. Lat. Am. 2001, 32, 9–18. [Google Scholar]
  4. Mehta, C.R.; Singh, K.; Selvan, M.M. A decision support system for selection of tractor–implement system used on Indian farms. J. Terramech. 2011, 48, 65–73. [Google Scholar] [CrossRef]
  5. Upadhyay, G.; Raheman, H. Effect of velocity ratio on performance characteristics of an active-passive combination tillage implement. Biosyst. Eng. 2020, 191, 1–12. [Google Scholar]
  6. Sarkar, P.; Upadhyay, G.; Raheman, H. Active-passive and passive-passive configurations of combined tillage implements for improved tillage and tractive performance: A review. Span. J. Agric. Res. 2021, 19, e02R01. [Google Scholar] [CrossRef]
  7. Ranjbarian, S.; Askari, M.; Jannatkhah, J. Performance of tractor and tillage implements in clay soil. J. Saudi Soc. Agric. Sci. 2017, 16, 154–162. [Google Scholar]
  8. Nataraj, E.; Sarkar, P.; Raheman, H.; Upadhyay, G. Embedded digital display and warning system of velocity ratio and wheel slip for tractor operated active tillage implements. J. Terramech. 2021, 97, 35–43. [Google Scholar]
  9. Damanauskas, V.; Velykis, A.; Satkus, A. Efficiency of disc harrow adjustment for stubble tillage quality and fuel consumption. Soil Tillage Res. 2019, 194, 104311. [Google Scholar] [CrossRef]
  10. Fawzi, H.; Mostafa, S.A.; Ahmed, D.; Alduais, N.; Mohammed, M.A.; Elhoseny, M. TOQO: A new tillage operations quality optimization model based on parallel and dynamic decision support system. J. Clean. Prod. 2021, 316, 128263. [Google Scholar]
  11. Sablani, S.S.; Ramaswamy, H.S.; Sreekanth, S.; Prasher, S.O. Neural network modeling of heat transfer to liquid particle mixtures in cans subjected to end-over-end processing. Food Res. Int. 1997, 30, 105–116. [Google Scholar]
  12. Kumar, N.; Upadhyay, G.; Kumar, P. Comparative Performance of Multiple Linear Regression and Artificial Neural Network Based Models in Estimation of Evaporation. Adv. Res. 2017, 11, 1–11. [Google Scholar]
  13. Kalogirou, S.A. Artificial neural networks in renewable energy systems applications: A review. Renew. Sustain. Energy Rev. 2001, 5, 373–401. [Google Scholar]
  14. Kumar, M.; Yadav, N. Multilayer perceptrons and radial basis function neural network methods for the solution of differential equations: A survey. Comput. Math. Appl. 2011, 62, 3796–3811. [Google Scholar] [CrossRef]
  15. Zeng, Z.; Chen, Y.; Zhang, X. Modelling the interaction of a deep tillage tool with heterogeneous soil. Comput. Electron. Agric. 2017, 143, 130–138. [Google Scholar] [CrossRef]
  16. Askari, M.; Abbaspour-Gilandeh, Y.; Taghinezhad, E.; Hegazy, R.; Okasha, M. Prediction and optimizing the multiple responses of the overall energy efficiency (OEE) of a tractor-implement system using response surface methodology. J. Terramech. 2022, 103, 11–17. [Google Scholar] [CrossRef]
  17. Wang, S.; Zhao, B.; Yi, S.; Zhou, Z.; Zhao, X. GAPSO-Optimized fuzzy PID controller for electric-driven seeding. Sensors 2022, 22, 6678. [Google Scholar] [CrossRef]
  18. Alzoubi, I.; Delavar, M.R.; Mirzaei, F.; Nadjar Arrabi, B. Comparing ANFIS and integrating algorithm models (ICA-ANN, PSO-ANN, and GA-ANN) for prediction of energy consumption for irrigation land leveling. Geosystem Eng. 2018, 21, 81–94. [Google Scholar] [CrossRef]
  19. Rabbani, A.; Samui, P.; Kumari, S. A novel hybrid model of augmented grey wolf optimizer and artificial neural network for predicting shear strength of soil. Model. Earth Syst. Environ. 2023, 9, 2327–2347. [Google Scholar] [CrossRef]
  20. Hassan, R.; Cohanim, B.; De Weck, O.; Venter, G. A comparison of particle swarm optimization and the genetic algorithm. In Proceedings of the 46th AIAA/ASME/ASCE/AHS/ASC Structures, Structural Dynamics and Materials Conference, Austin, TX, USA, 18–21 April 2005; p. 1897. [Google Scholar]
  21. Kundu, P.; Paul, V.; Kumar, V.; Mishra, I.M. Formulation development, modeling and optimization of emulsification process using evolving RSM coupled hybrid ANN-GA framework. Chem. Eng. Res. Des. 2015, 104, 773–790. [Google Scholar] [CrossRef]
  22. Hoki, M.; Burkhardt, T.H.; Wilkinson, R.H.; Tanoue, T. Study of PTO driven powered disk tiller. Trans. ASAE 1988, 31, 1355–1360. [Google Scholar] [CrossRef]
  23. Salokhe, V.M.; Quang, N.B. Dynamics of a powered disk in clay soil. J. Terramech. 1995, 32, 231–244. [Google Scholar] [CrossRef]
  24. Hann, M.J.; Giessibl, J. Force measurements on driven discs. J. Agric. Eng. Res. 1998, 69, 149–157. [Google Scholar] [CrossRef]
  25. Nalavade, P.P.; Salokhe, V.M.; Niyamapa, T.; Soni, P. Performance of free rolling and powered tillage discs. Soil Tillage Res. 2010, 109, 87–93. [Google Scholar]
  26. ASAE S313.3; Soil Cone Penetrometer. ASABE Standards: St. Joseph, MI, USA, 2001.
  27. ASA 30-2.2-1965; Methods of Soil Analysis. Bulk Density. ASA Standards: Madison, WI, USA, 1965.
  28. ASAE D497.5; Agricultural Machinery Management Data. ASABE Standards: St. Joseph, MI, USA, 2006.
  29. Marquardt, D.W. An algorithm for least-squares estimation of nonlinear parameters. J. Soc. Ind. Appl. Math. 1963, 11, 431–441. [Google Scholar]
  30. Parrott, D.; Li, X. Locating and tracking multiple dynamic optima by a particle swarm model using speciation. IEEE Trans. Evol. Comput. 2006, 10, 440–458. [Google Scholar] [CrossRef]
  31. O’Dogherty, M.J.; Godwin, R.J.; Hann, M.J.; Al-Ghazal, A.A. A geometrical analysis of inclined and tilted spherical plough discs. J. Agric. Eng. Res. 1996, 63, 205–217. [Google Scholar]
  32. Islam, M.S.; Salokhe, V.M.; Gupta, C.P.; Hoki, M. Effects of PTO-powered disk tilling on some physical properties of Bangkok clay soil. Soil Tillage Res. 1994, 32, 93–104. [Google Scholar] [CrossRef]
Figure 1. Test rig of the laboratory prototype APDH. (1) Side rail; (2) primary frame; (3) guide frame; (4) C-bar linkage having vertical slot; (5) motor; (6) torque transducer; (7) bellow coupling; (8) universal joint; (9) sprocket 1; (10) sprocket 2; (11) sprocket 3; (12) sprocket 4; (13) notched disc; (14) spool bearing; (15) gang axle; (16) plain disc; (17) pillow block bearing; (18) side roller; (19) double-acting hydraulic cylinder; (20) roller on top of the side rail; (21) roller on C-section of the side rail.
Agriengineering 06 00012 g001
Figure 2. Experimental setup of the soil bin.
Agriengineering 06 00012 g002
Figure 3. Pattern of ANN architecture used in the present study.
Agriengineering 06 00012 g003
Figure 4. Working strategy of PSO algorithm.
Agriengineering 06 00012 g004
Figure 5. Regression (a) and MSE plots (b) during the training phase of the ANN model.
Agriengineering 06 00012 g005aAgriengineering 06 00012 g005b
Figure 6. Comparative performance of the ANN and regression models during the (a) training and (b) testing phases.
Agriengineering 06 00012 g006aAgriengineering 06 00012 g006b
Figure 7. Performance of the ANN and regression models during the validation with independent data.
Agriengineering 06 00012 g007
Figure 8. Convergence plot of PSO fitness function.
Agriengineering 06 00012 g008
Table 1. APDH test rig’s details.
ParticularsValue
Type of disc harrow Offset
Type of discsSpherical with notched concave surfaces at the front and smooth discs at the rear
Diameter of discs, mm510
Concavity of discs, mm60
Spacing between discs, mm225
Gang axle, mm × mm25 × 25
Working width, mm630
Gang angle adjustment, degrees25 to 40
Overall dimensions (l × w × h), mm × mm × mm1965 × 1620 × 1237
Table 2. Research plan for the soil-bin study of APDH.
VariablesLevelsValues
General factors
Soil texture1Sandy clay loam
Soil moisture content (MC), % (db)110 ± 1
Working width, mm1630
Forward speed, km h−113.2
Rear gang angle (β), degrees130
Independent factors
Front gang angle (α), degrees425, 30, 35, and 40
Operating depth, mm3100, 120, and 140
u/v ratio42.40, 3.00, 3.60, and 4.60
Soil CI, MPa (bulk density, g cm−3)30.50 ± 0.03 (1.43), 0.08 ± 0.03 (1.58), and 1.10 ± 0.03 (1.73)
Dependent factors
Draft, kN
Torque, kN-m
Table 3. Performance results of the soil-bin tests.
VariableLevelsSpecific Draft,
kN m−2
Specific Torque,
kN m m−2
Equivalent PTO Power Pe, kW
Front gang angle (α), degrees2513.23 a5.15 a5.73 a
3014.71 b4.50 b5.50 b
3517.04 c3.69 c5.19 c
4023.12 d3.34 d5.63 a
u/v ratio 2.4020.57 a5.38 a5.67 a
3.0018.32 b4.19 b5.34 b
3.6014.99 c3.57 c5.08 c
4.6014.22 d3.54 c5.95 d
CI, MPa0.5013.47 a3.06 a4.40 a
0.8017.08 b4.29 b5.58 b
1.1020.52 c5.16 c6.55 c
Operating depth, mm10018.00 a4.48 a4.90 a
12016.85 b4.14 b5.50 b
14016.23 c3.89 c6.13 c
According to DMR tests, average values that are denoted by distinct lowercase letters within the same column for a particular variable are considered to be significantly different at a confidence level of 95%.
Table 4. Results of ANOVA for the estimated PTOeq for APDH.
Dependent Variable: PTOeq Power, kW
SourcedfMean SquareComputed F Value
Model14494.75751.95 **
α35.9947.56 **
CI2167.441328.83 **
depth254.89435.61 **
u/v ratio315.55123.40 **
α × CI60.100.82
α × depth60.292.33 **
α × u/v ratio90.211.68
CI × depth41.4411.47 **
CI × u/v ratio60.332.65
depth × u/v ratio60.040.35
α × CI × depth120.040.33
α × CI × u/v ratio180.040.29
α × depth × u/v ratio180.010.09
CI × depth × u/v ratio120.020.13
α × CI × depth × u/v ratio360.010.08
Error2880.13
** significant at 1% probability level, R2 = 0.99, adjusted R2 = 0.99, df = degrees of freedom.
Table 5. Regression coefficients and their respective standard errors for the PTOeq power prediction model.
Regression CoefficientsPTOeq Power Model
EstimateStandard Error
C012.300.903
C1−0.4520.049
C20.0070.001
C3−3.760.247
C40.550.035
C53.590.077
C60.030.001
Table 6. Results of regression analysis for the formulated regression model.
SourcePTOeq Power Model
(R2 = 0.95)
SSdfMS
Regression4541.187648.74
Residual7.101370.05
UT4548.28144-
CT174.44143-
SS = sum of squares (Type III); df = degrees of freedom; MS = mean square; UT = uncorrected total; CT = corrected total.
Table 7. Performance indices of ANN and regression models.
ModelRMSEMAPER2
Training TestingTraining TestingTraining Testing
ANN0.0930.1761.2142.8710.990.98
Regression0.2710.2294.0013.6440.950.96
Table 8. Various sets of optimal parameters forecasted through the use of ANN–PSO.
S. No.RMSEMAPER2α, °CI, MPaDepth, mmu/v RatioPTOeq PowerVariation, %
TrainingTestingTrainingTestingTrainingTestingPredictedActual
10.1540.3021.5094.0180.980.9535.00.51003.603.363.59−6.85
20.1650.2662.0584.9030.980.9035.50.51203.404.003.892.75
30.0930.1761.2142.8710.990.9836.60.51003.903.363.45−2.67
40.1250.1111.5211.7730.990.9935.70.51403.904.204.024.29
Disclaimer/Publisher’s Note: The statements, opinions and data contained in all publications are solely those of the individual author(s) and contributor(s) and not of MDPI and/or the editor(s). MDPI and/or the editor(s) disclaim responsibility for any injury to people or property resulting from any ideas, methods, instructions or products referred to in the content.

