Article

Equitable Access to Urban Green Spaces Under Heat Stress: An Agent-Based Simulation (ABS) of Age-Differentiated Walkability Through a Behavioral Perspective


IMM Design Lab, Department of Architecture, Built Environment and Construction Engineering, Politecnico di Milano, Via Giuseppe Ponzio 31, 20133 Milano, Italy
*
Authors to whom correspondence should be addressed.
Smart Cities 2026, 9(6), 97; https://doi.org/10.3390/smartcities9060097
Submission received: 31 January 2026 / Revised: 18 May 2026 / Accepted: 21 May 2026 / Published: 28 May 2026

Highlights

What are the main findings?
  • Integrating behavioral simulation with spatial analysis supports context-sensitive assessments of walkability equity.
  • Results show inequity emerges from relational configurations, not single deficits.
What is the implication of the main finding?
  • The proposed workflow provides a transferable, process-based approach for diagnosing urban accessibility.
  • The findings inform smart-city strategies by highlighting how environmental stress reshapes everyday accessibility.

Abstract

Urban green spaces play a critical role in mitigating heat stress and enhancing urban livability, in line with the objectives and expectations of the United Nations Sustainable Development Goals 10 (Reduced Inequalities) and 11 (Sustainable Cities and Communities). This study employs Physarealm (Grasshopper), a lightweight agent-based simulation (ABS) model, to dynamically simulate pedestrian behaviors for different mobility groups. Together with Space Syntax, the results—time-extended movement and interaction patterns—are conceptualized as a relational configuration of green space provision (supply), pedestrian activity intensity (demand), and thermal exposure (environmental resistance). Three contrasting urban areas in northern Italy (Lambrate, Bolognina, and Ispra) are selected as case studies. The results demonstrate that urban inequality cannot be sufficiently explained by the inadequacy of single components, but emerges from imbalanced relational configurations of supply, demand, and environmental resistance. In May, 100% and 95% of traversed cells in Lambrate and Bolognina fall within the high-heat-stress range (>32 °C), compared with 59% in Ispra. Correspondingly, average green provision within the 5 min walking range is 5.4% in Lambrate, 7.2% in Bolognina, and 37% in Ispra. By uncovering relational mismatch patterns that are often overlooked in conventional urban analyses, this study enables a multi-dimensional diagnosis of imbalances. By positioning ABS as a front-end process generator and Space Syntax as a structural interpretation step, it demonstrates how dynamic behavioral processes can be reorganized into network-scale diagnostic representations. The study supports a climate-sensitive and human-centered diagnosis of walkability and green space accessibility, while contributing a transferable analytical approach for identifying relational inequality patterns within open urban data science contexts.

1. Introduction

1.1. Urban Livability and Sustainable Walkability

Beyond a transportation issue, urban walkability has increasingly been recognized as a critical attribute of livability in sustainable cities, serving as a measure of physical health, environmental performance, and social inclusion [1,2]. A well-designed walking environment helps to enhance social interactions among urban residents in and around the neighborhoods, as well as encourages daily physical activities by fostering a more coherent urban fabric through reducing the dependence on private vehicles, which constitutes an essential component of Sustainable Development Goal (SDG) 11: “inclusive, safe, resilient, and sustainable cities and human settlements” [3]. Despite this growing recognition, urban walkability is still predominantly assessed through static, infrastructure-oriented indicators, such as sidewalk provision or proximity to destinations, reflecting a tendency long noted in landscape planning studies that lived experience is often neglected in favor of spatial provision [4].
In this context, urban green spaces (UGSs) serve as crucial structural elements of the walkability system. Parks, pocket gardens, and linear green corridors offer opportunities for leisure and recreation [5,6] and, at the same time, improve air quality and mitigate the urban heat island (UHI) effect [7]. Urban green spaces shape the environmental comfort and experiential quality of everyday walking environments.
Yet, while these benefits for urban resilience and livability are well-acknowledged, their distribution reflects persistent socio-spatial differentiation across the urban fabric [8]. The accessibility and quality of green infrastructure are often influenced by income, density, and urban morphology [9,10], according to research on environmental justice. This uneven greenery geography creates a “green equity paradox” [11], while cities increase the total green cover, but reinforce inequality in stakeholders’ actual benefits. Taking Barcelona as an example, the growth of green infrastructure and ecological projects has indeed improved the overall greenery level, but these interventions have also marginalized vulnerable groups or excluded them from the actual benefits [12].
When walkability is considered not only as a mobility mode but also as a matter of spatial justice, it becomes a critical entry point for addressing inequities embedded in everyday urban experiences [13]. As cities strive for climate adaptation and low-carbon transition, it becomes essential to create inclusive environments that enhance health and sustainability simultaneously by understanding how the conditions of walking mediate access to green spaces, and how urban morphology shapes walkability and green space proximity [14,15].

1.2. Ecosystem Services and Spatial Accessibility Under Urban Heat Stress

Another critical concern lies in the spatial and temporal discrepancy between the assessment of ecosystem services and their actual entry into urban processes. Green infrastructure can offer supporting and regulating services in the long run [16,17]; however, urban planning focuses on the short-term (e.g., decades) land value and temporary functional zoning at the expense of the slowly released ecological services [4,18]. Cultural services (i.e., the value of the experience, identification, or inspiration associated with an ecosystem) are hard to quantify and therefore have a relatively weak impact on decision-making [19], although they have a great influence on urban life. This gap points to a hidden mismatch between how ecosystem services are evaluated and how they are actually obtained, which can be understood through a relational structure of the form “demand—travel—service”, which are often examined in isolation [20] within existing research.
Urban scholars worldwide have extensively evaluated accessibility (“demand” and “service”) using various refined methodologies, including distance-based approaches, cumulative opportunity models, potential models, and the 2SFCA method, to ensure analytical outcomes align with reality [21,22]. These approaches describe important dimensions of ecological benefit distribution, which largely focus on “what” is available and “where” to access. Green space density, proximity, or diversity are often introduced to infer the quality of green infrastructure, which implicitly assumes that all residents can approach these benefits under comparable conditions [23,24]. But the third component—travel—has received far less analytical attention, leaving “how services are obtained” less explicitly examined. Yet, to access ecosystem services is contingent on not merely their presence but the feasibility of reaching them through the existing urban environment.
Under thermal pressures, the continuity, comfort, and microclimatic characteristics of walking routes become decisive factors, especially for children and elderly adults. Urban heat stress, as an environmental resistance, systematically constrains walking-based access to ecosystem services, amplifies age-related vulnerabilities, and transforms climatic exposure into a key determinant of spatial inclusion [21,25]. Routes that are excessively exposed, and zones that are fragmented, or thermally stressed, can diminish or even negate the effective benefits of green spaces [26]. Consequently, ecological services may appear adequate spatially, but in reality, remain practically inaccessible, in particular to mobility-limited groups. This highlights “travel”, specifically walking, as a central relational mechanism through which the differentiated accessibility outcomes emerge from the interaction of ecosystem service provision, population demand, and environmental stress.

1.3. Age-Differentiated Urban Mobility and Inclusion

Walkability bridges people to the ecological and social infrastructure [27,28]. But the ability to reach, experience, and benefit from urban green spaces varies significantly across different age groups [29,30]. Research on environmental gerontology shows that older adults and children experience spatial contraction in their daily activity ranges, becoming more reliant on neighborhood spaces for recreation, nature engagement, and social interaction [31]. In other words, the neighborhood is more than a spatial unit, it is a lifeworld [32], whose proximity and familiarity decide the access to public space [33] and, ultimately, the sense of inclusion [34].
Nonetheless, conventional urban planning and policy practices tend to treat citizens as a homogeneous group or rely on sociological average values, taking their mobility patterns as a unified benchmark [35]. However, urban morphology (including street connectivity, intersection density, block size, and the allocation of green and open areas) plays a decisive role in determining who can walk comfortably and who cannot [36,37]. As a result, the barriers of heat-exposed routes and distant services extend beyond physical effort, becoming a form of spatial exclusion for mobility-limited populations [38].
These barriers are further intensified as thermal discomfort and exposure extremely constrain the walking capacity of older adults and children [39], transforming climatic conditions into a non-neutral determinant of spatial inclusion. Despite this recognition, behavior-sensitive mobility remains rarely operationalized in walkability or green space accessibility assessments, which continue to rely on averaged mobility indicators that obscure differentiated constraints and vulnerabilities [40,41].
These mobility constraints are further amplified by uneven investment patterns of green gentrification, through which improvements in green spaces benefit already advantaged neighborhoods [42]. While general urban green space coverage appears adequate, high-quality green spaces are often concentrated in affluent areas, leading to an uneven distribution of ecological benefits [43,44]. In this sense, spatial inequities lie not in “where” green spaces are located, but “how” (different) groups are able to reach and benefit under varying conditions. On this topic, ensuring comfortable and feasible access to urban services and infrastructures for diverse pedestrian groups extends beyond a technical challenge, becoming a fundamental question of urban justice, closely aligned with global commitments to reducing inequalities and promoting inclusive urban development [45], and calling for systemic perspectives capable of capturing the relational and dynamic accessibility patterns of everyday urban life.

1.4. Agent-Based Simulation (ABS) as a Potential Tool for Urban Ecosystem Service Studies

But from a dynamic perspective, existing studies remain grounded in static or quasi-dynamic (time-sliced) analytical frameworks on green space accessibility and environmental justice [46,47], as spatial–temporal sensitivity analyses based on differentiated population behaviors are playing an increasingly important role in equity-oriented studies [48]. To address the “dynamic” nature when modelling ecosystem–service interactions, individual-level movement, as well as emergent spatial patterns of heterogeneous mobility behaviors, Agent-Based Simulation (ABS) or Agent-Based Modeling (ABM) have increasingly been used as a potential tool. As “artificial laboratories” [49], ABS and ABM operate on the principle that “a system is modeled as a collection of autonomous decision-making entities called agents. Each agent individually assesses its situation and makes decisions based on a set of rules” [50]. This could therefore be applicable in explaining the “dynamic and complex” interaction for addressing the limitations of static or allocation-based assessments, as it enables the explicit modelling of heterogeneous pedestrian behaviour, spatial configuration, and their interaction with environmental conditions [51,52].
ABS-based approaches have been adopted to represent complex urban systems. Typically, segment-based platforms such as NetLogo provide the simulation settings by defining customized distance/route choice logics (e.g., metric, topological, and angular shortest paths) [53], which create simulated footfall distributions at the street segment level, thus providing comparable patterns with observed results [54,55]. Emerging applications through multi-disciplinary and cross-disciplinary methods signal their potential. The UrbanSim system is used to simulate the dynamic process of urban development [56] and supports integrated analysis of land use, transportation, and environmental planning. Through detailed (household/employment individual records) and explicit real estate market demand modeling, it more accurately reflects complex urban systems to contribute to urban development planning. In terms of visitation dynamics in open public spaces, researchers like Cheliotis. K [49] constructed ABMs for public space usage, encoding activity rules based on observational studies. Through parameter scans and Lorenz curves, the models evaluated the plausibility of simulated activity distributions at the aggregate level while acknowledging its limitations in reproducing individual dwell times, based on spatial configuration, distance thresholds, and site attractiveness, producing spatial intensity maps of visitation pressure and accessibility [57].
DepthMap, as a classic spatial syntax analysis tool, offers the opportunity to integrate urban ABS to visualize cross-network flow analysis, providing simulation data for medical care, emergency evacuation, and public transportation congestion [58]. Syntax-derived metrics can be further integrated into agent-based approaches, enabling the movement decision of pedestrian agents to be influenced by both distance criteria and the overarching spatial structure of the network. By combining these two parameters, the resultant cross-network flow patterns exhibit both topological accessibility and behavioral dynamics [53]. This combination could be used to measure how well emergency evacuations work, how crowded public transportation functions, as well as the accessibility of core public services.
With recent advances in artificial intelligence, ABS/ABM frameworks have increasingly incorporated AI-driven components to enhance the representation of complex urban dynamics [24]. OpenCity, an open smart city architecture testing platform hosted by Virginia Commonwealth University (VCU), uses Large Language Model (LLM) agents to simulate and predict urban activities on a large scale [59,60]. This ability is crucial for comprehending the ecological and social aspects of green infrastructure performance. However, the application of ABS to the modeling of ecosystem service accessibility under heat stress and to the analysis of age-differentiated equity outcomes in fragmented urban green space systems has not yet been widely implemented.
These studies have pointed toward the value of dynamic approaches, suggesting the need to further advance human-centered, behavior-based analyses that capture the temporally sensitive nature of pedestrian accessibility beyond static or time-sliced representations, especially under urban heat stress.

1.5. Research Gaps and Contributions of This Study

Although substantial theoretical progress has been made in studies of walkability, green space distribution, and urban thermal environment, research that integrates these dimensions, as well as examines their equity implications under climate stress, remains limited. Firstly, conventional analyses based on homogeneous spatial attributes fail to capture the behavioral and perceptual differences among age-differentiated population groups. Secondly, heat exposure is typically treated as a macro-level environmental variable, with limited attention to how it alters the actual route choices of different groups, which often results in uniform, “one-size-fits-all” urban interventions that lead to inefficient resource allocation. When non-customized design strategies fail to adequately meet the diverse needs of urban infrastructure users, planning effectiveness is reduced. Finally, urban morphology, pedestrian behaviors, and climatic conditions are often addressed as separate analytical dimensions, lacking an integrated framework capable of revealing the hidden causality and cumulative effects. Together, these gaps unveil the absence of an analytical approach capable of simultaneously capturing heterogeneous pedestrian behaviour, climate-induced environmental resistance, and their interaction with urban spatial configuration, specifically at fine-grained spatial scales.
Building on the identified research gaps, this study is directed by the following research question:
How do the interactions between green space, pedestrian mobility, and thermal conditions shape age-differentiated walkability and environmental exposure in urban contexts?
The study adopts a diagnostic approach aimed at revealing relational mismatches between supply, demand, and environmental resistance. In this sense, the objective is not to evaluate whether a city is equitable or not, but to understand how specific spatial and behavioural configurations produce differentiated accessibility and exposure outcomes across population groups. Within this unified diagnostic workflow, the methodological framework clearly links these dimensions by integrating Agent-Based Simulation (ABS), Space Syntax analysis, and Land Surface Temperature (LST) mapping to examine the interaction patterns between people and nature under thermal environmental conditions. This multi-layered diagnostic approach seeks to explore how urban form generates inclusive or exclusionary impacts on everyday walkability, thus providing scientific support for achieving more equitable and sustainable urban development. It integrates pedestrian behaviour, spatial configuration, and thermal conditions within a unified diagnostic structure, allowing walkability equity to be examined through their dynamic interaction under climate stress.

2. Study Areas and Data

2.1. Study Areas

This study conducts an in-depth analysis of three urban areas in Italy—Lambrate (Milan), Bolognina (Bologna), and Ispra, each representing a distinct spatial configuration and administrative context, to reflect their contrasting ecological, spatial, and demographic characteristics, which together provide complementary insights into the performance of urban green infrastructure in local and medium-scale European urban contexts.
Lambrate is located in northeastern Milan, characterized by an urban fabric that combines industrial heritage with ongoing regenerative development. It is a densely populated neighborhood in the expansive area within the metropolis of Milan. A major railway runs through the center of the site, creating a strong physical and ecological barrier. Bolognina, situated north of Bologna’s Central Station, has recently emerged as a pilot area for urban regeneration through building refurbishment, public space enhancement, and community-driven governance. Its densely interwoven secondary streets form closed or semi-closed neighborhoods. Ispra, located on the eastern shore of Lake Maggiore in northern Italy, represents a low-density urban settlement embedded within a rich ecological landscape. It hosts the Joint Research Centre (JRC) of the European Commission, making it a strategically significant site for environmental innovation and data-informed governance.
From a comparative perspective, Lambrate, Bolognina, and Ispra represent distinct typologies of green infrastructure governance and urban forms. Lambrate allows to examine the influence of grey infrastructure barriers (railway) on green infrastructure performance. Ispra exemplifies ecological adjacency and peri-urban continuity, while Bolognina illustrates the inner-city fragmentation and redevelopment dynamics. The inclusion of these cases supports a multiscalar and typologically diverse analysis of urban green infrastructure efficiency—in line with calls for ecological urbanism to be grounded in regional heterogeneity and context-specific urban ecologies [61,62].

2.2. Data Sources and Description

This research works on a collection of spatial datasets describing the built environment, demographic distribution, and satellite imagery. The data resources were obtained from regional geoportals, global demographic repositories, and remote-sensing archives, which provide the multi-layered spatial foundation for age-differentiated accessibility modelling. Table 1 summarizes all GIS data used in the analysis, along with their sources and acquisition dates. Precisely, demographic data are derived from WorldPop (2025 release), spatial datasets such as administrative boundaries, buildings, and green spaces are obtained from regional geoportals (2024), while NDVI and Land Surface Temperature (LST) are extracted from Landsat 8–9 imagery acquired in May and November 2024, with the specific acquisition dates falling between the 1st and 15th day of each month depending on cloud cover conditions (<30%).
The public green spaces exhibit distinct distribution characteristics across the three candidate sites. In Lambrate, green spaces are scattered, including linear parks, small pocket green spaces, and roadside green belts, often fragmented by transportation infrastructure and high-density buildups, mixed with the diverse social demographic structure (including elderly residents and students). In Bolognina, informal green spaces and potential ecological corridors exist along the railway lines. However, strong physical barriers limit connectivity, resulting in a “high-potential, low-connectivity” fragmented urban area. In contrast, Ispra is characterized by dispersed built forms, extensive peri-urban green areas, and close proximity to Natura 2000 protected zones. This spatial configuration provides a valuable testing ground for evaluating green infrastructure performance in semi-rural contexts with high ecological value but fragmented planning regimes.
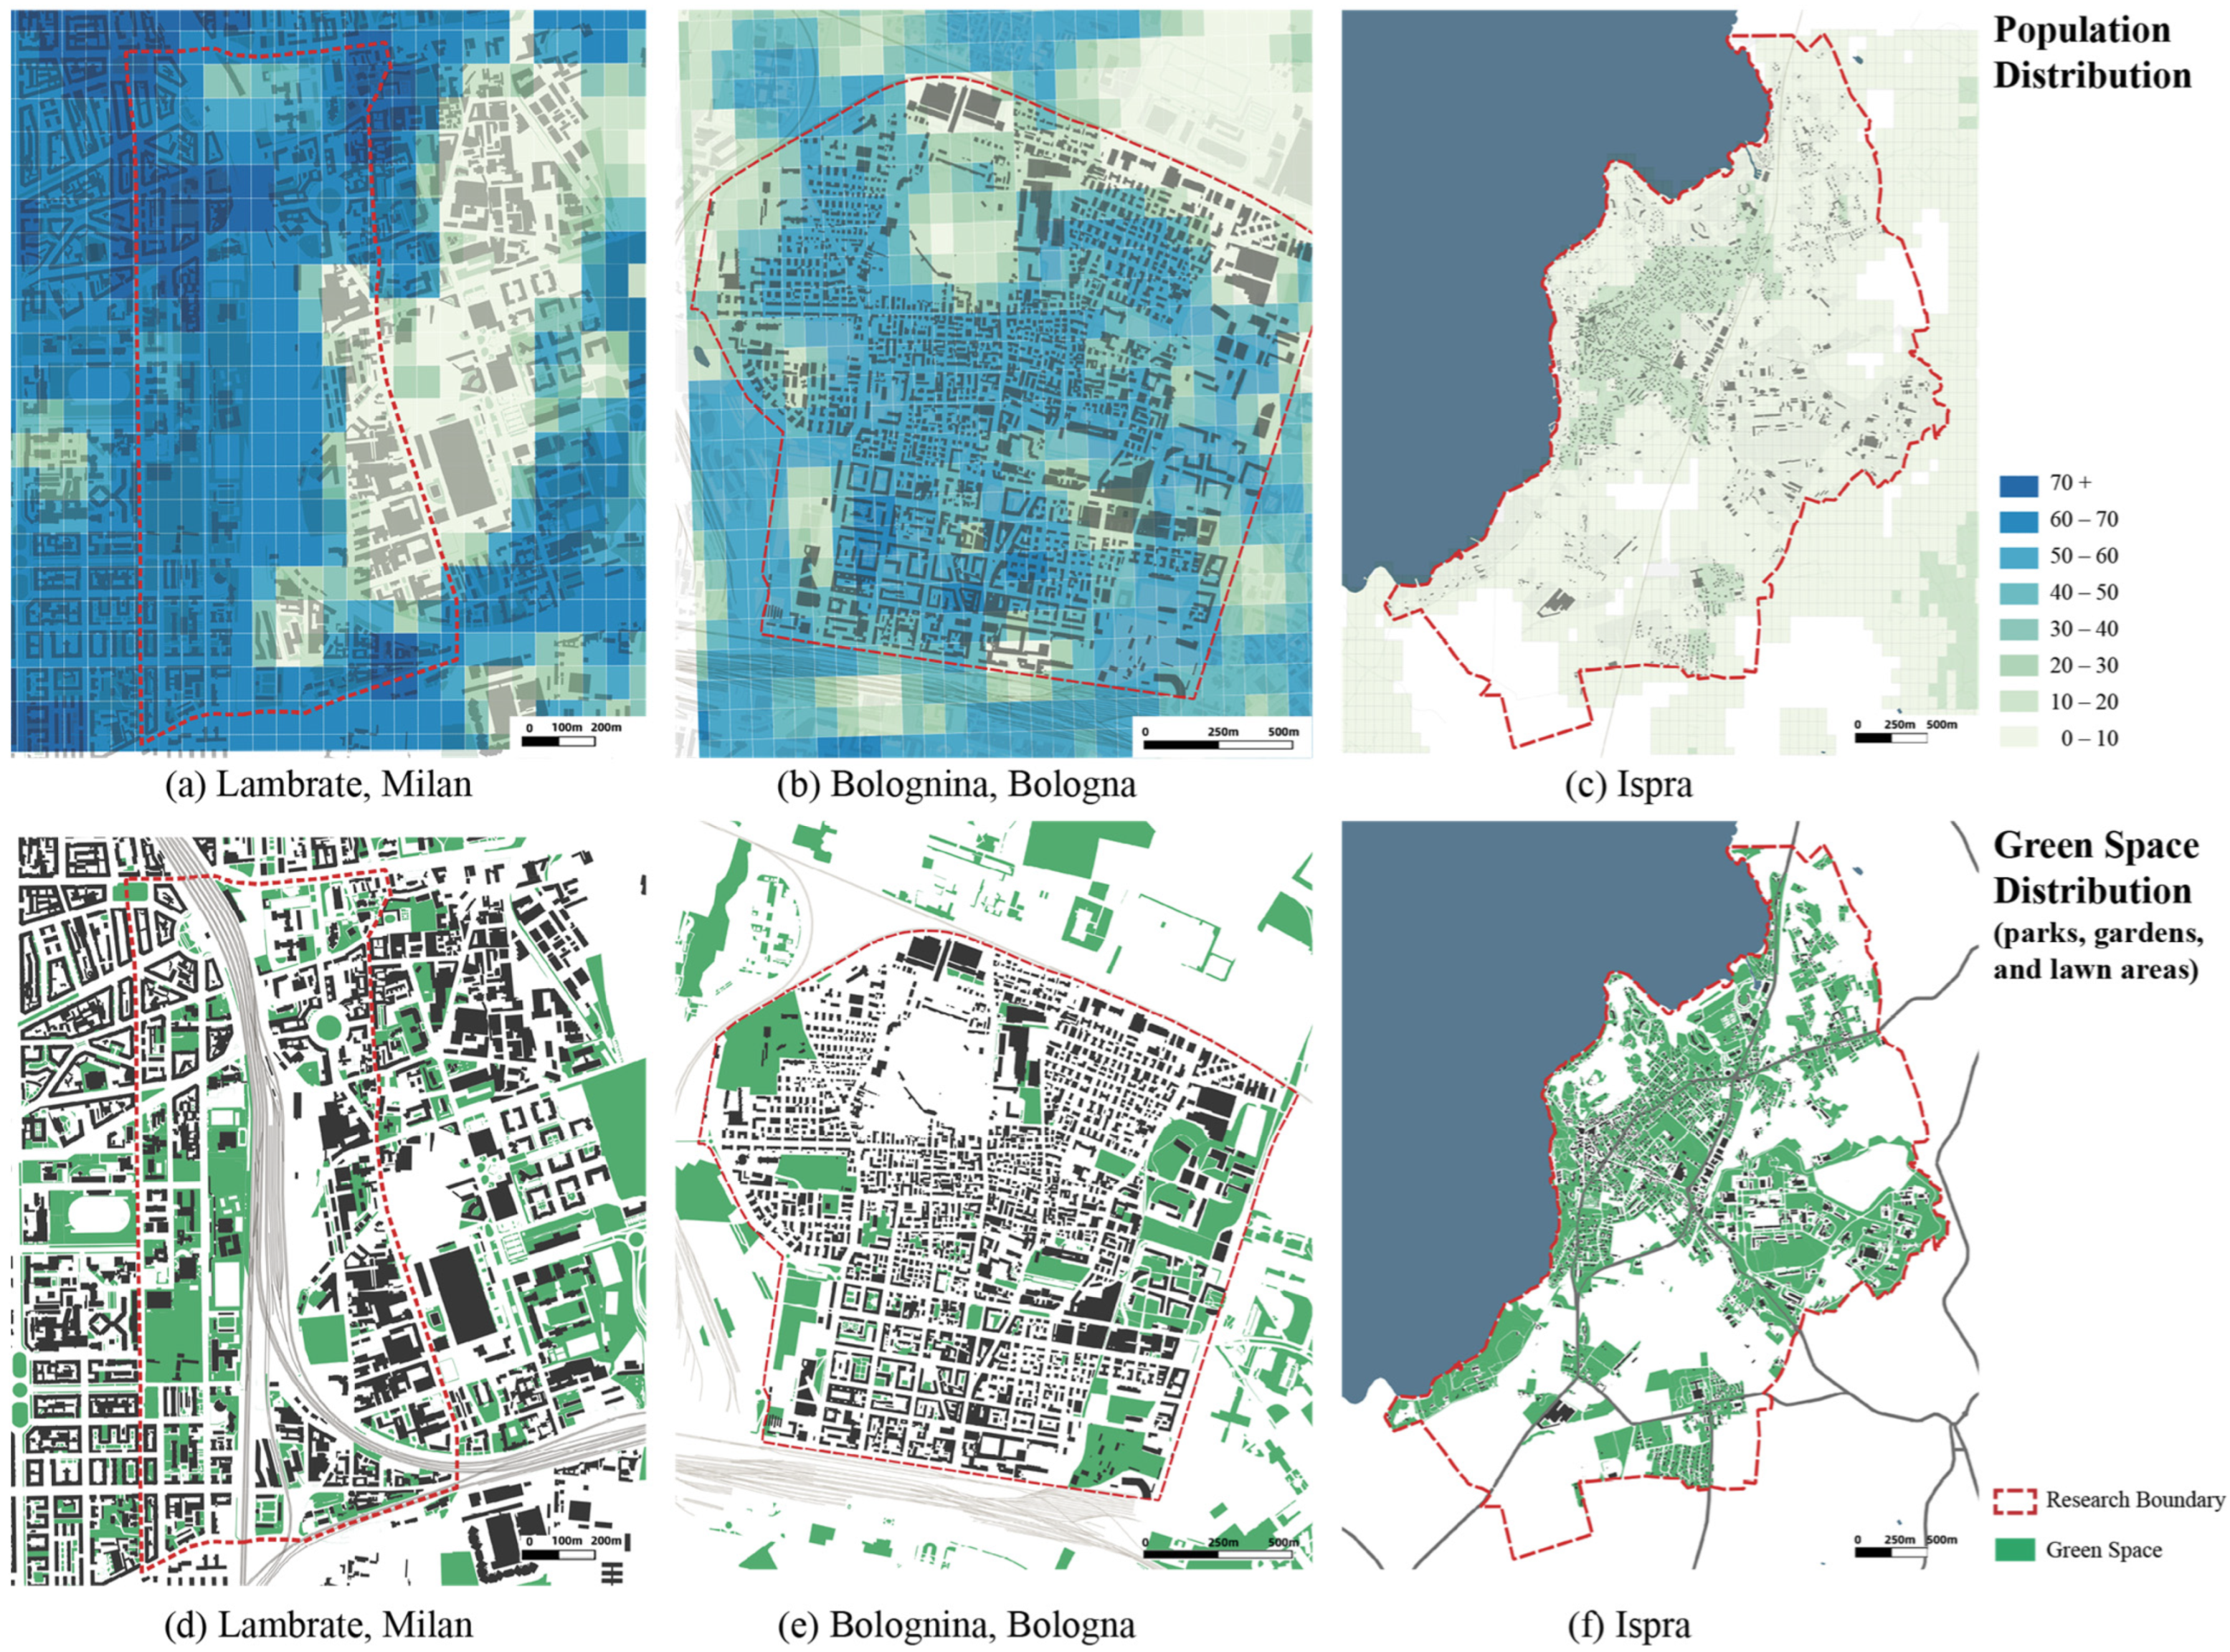
Figure 1a–c shows the distribution of population across the three study areas, indicating the distinct concentration patterns in each zone. In Lambrate, pronounced aggregation appears on the western side of the railway, while the eastern industrial zone shows a clear absence of residential population. Bologna exhibits a more even distribution, reflecting the uniform spatial arrangement of residential buildings across the district. Ispra demonstrates a more village-like pattern, with compact clusters concentrated along the waterfront and aligned with the main road network; its total population is approximately 5300. The population data are derived from WorldPop (Table 1), which produces gridded estimates by redistributing census counts through a dasymetric modelling approach [63]. Due to the heatmap-based population representation, population density values may be allocated to non-residential areas, such as public spaces or transportation corridors. These model-driven artefacts will be further processed in Section 3.2.1 (Population data preparation) to refine the dataset for subsequent simulation.
Considering that the functional influence of urban green spaces is not confined to administrative boundaries [64], the green space statistics (Table 2) were calculated within each boundary and an additional 390 m external buffer, which will be explained in detail in Section 3.2.1. As shown in Table 2, the three study areas exhibit marked differences in green space provision. Lambrate and Bolognina, both compact and densely built urban districts, offer limited green space per capita, with 50.59 m2 and 33.42 m2, respectively. In contrast, Ispra provides a substantially higher level of green space availability, approximately 920 m2 per capita. This contrast highlights the structural differences between compact urban neighborhoods and low-density village environments, and provides a diverse set of morphological contexts for subsequent modelling. Based on these spatial characteristics, Section 3 introduces the methodological framework used to process and integrate data, as well as the simulation procedures employed in this study.

3. Methodology

3.1. Methodological Framework

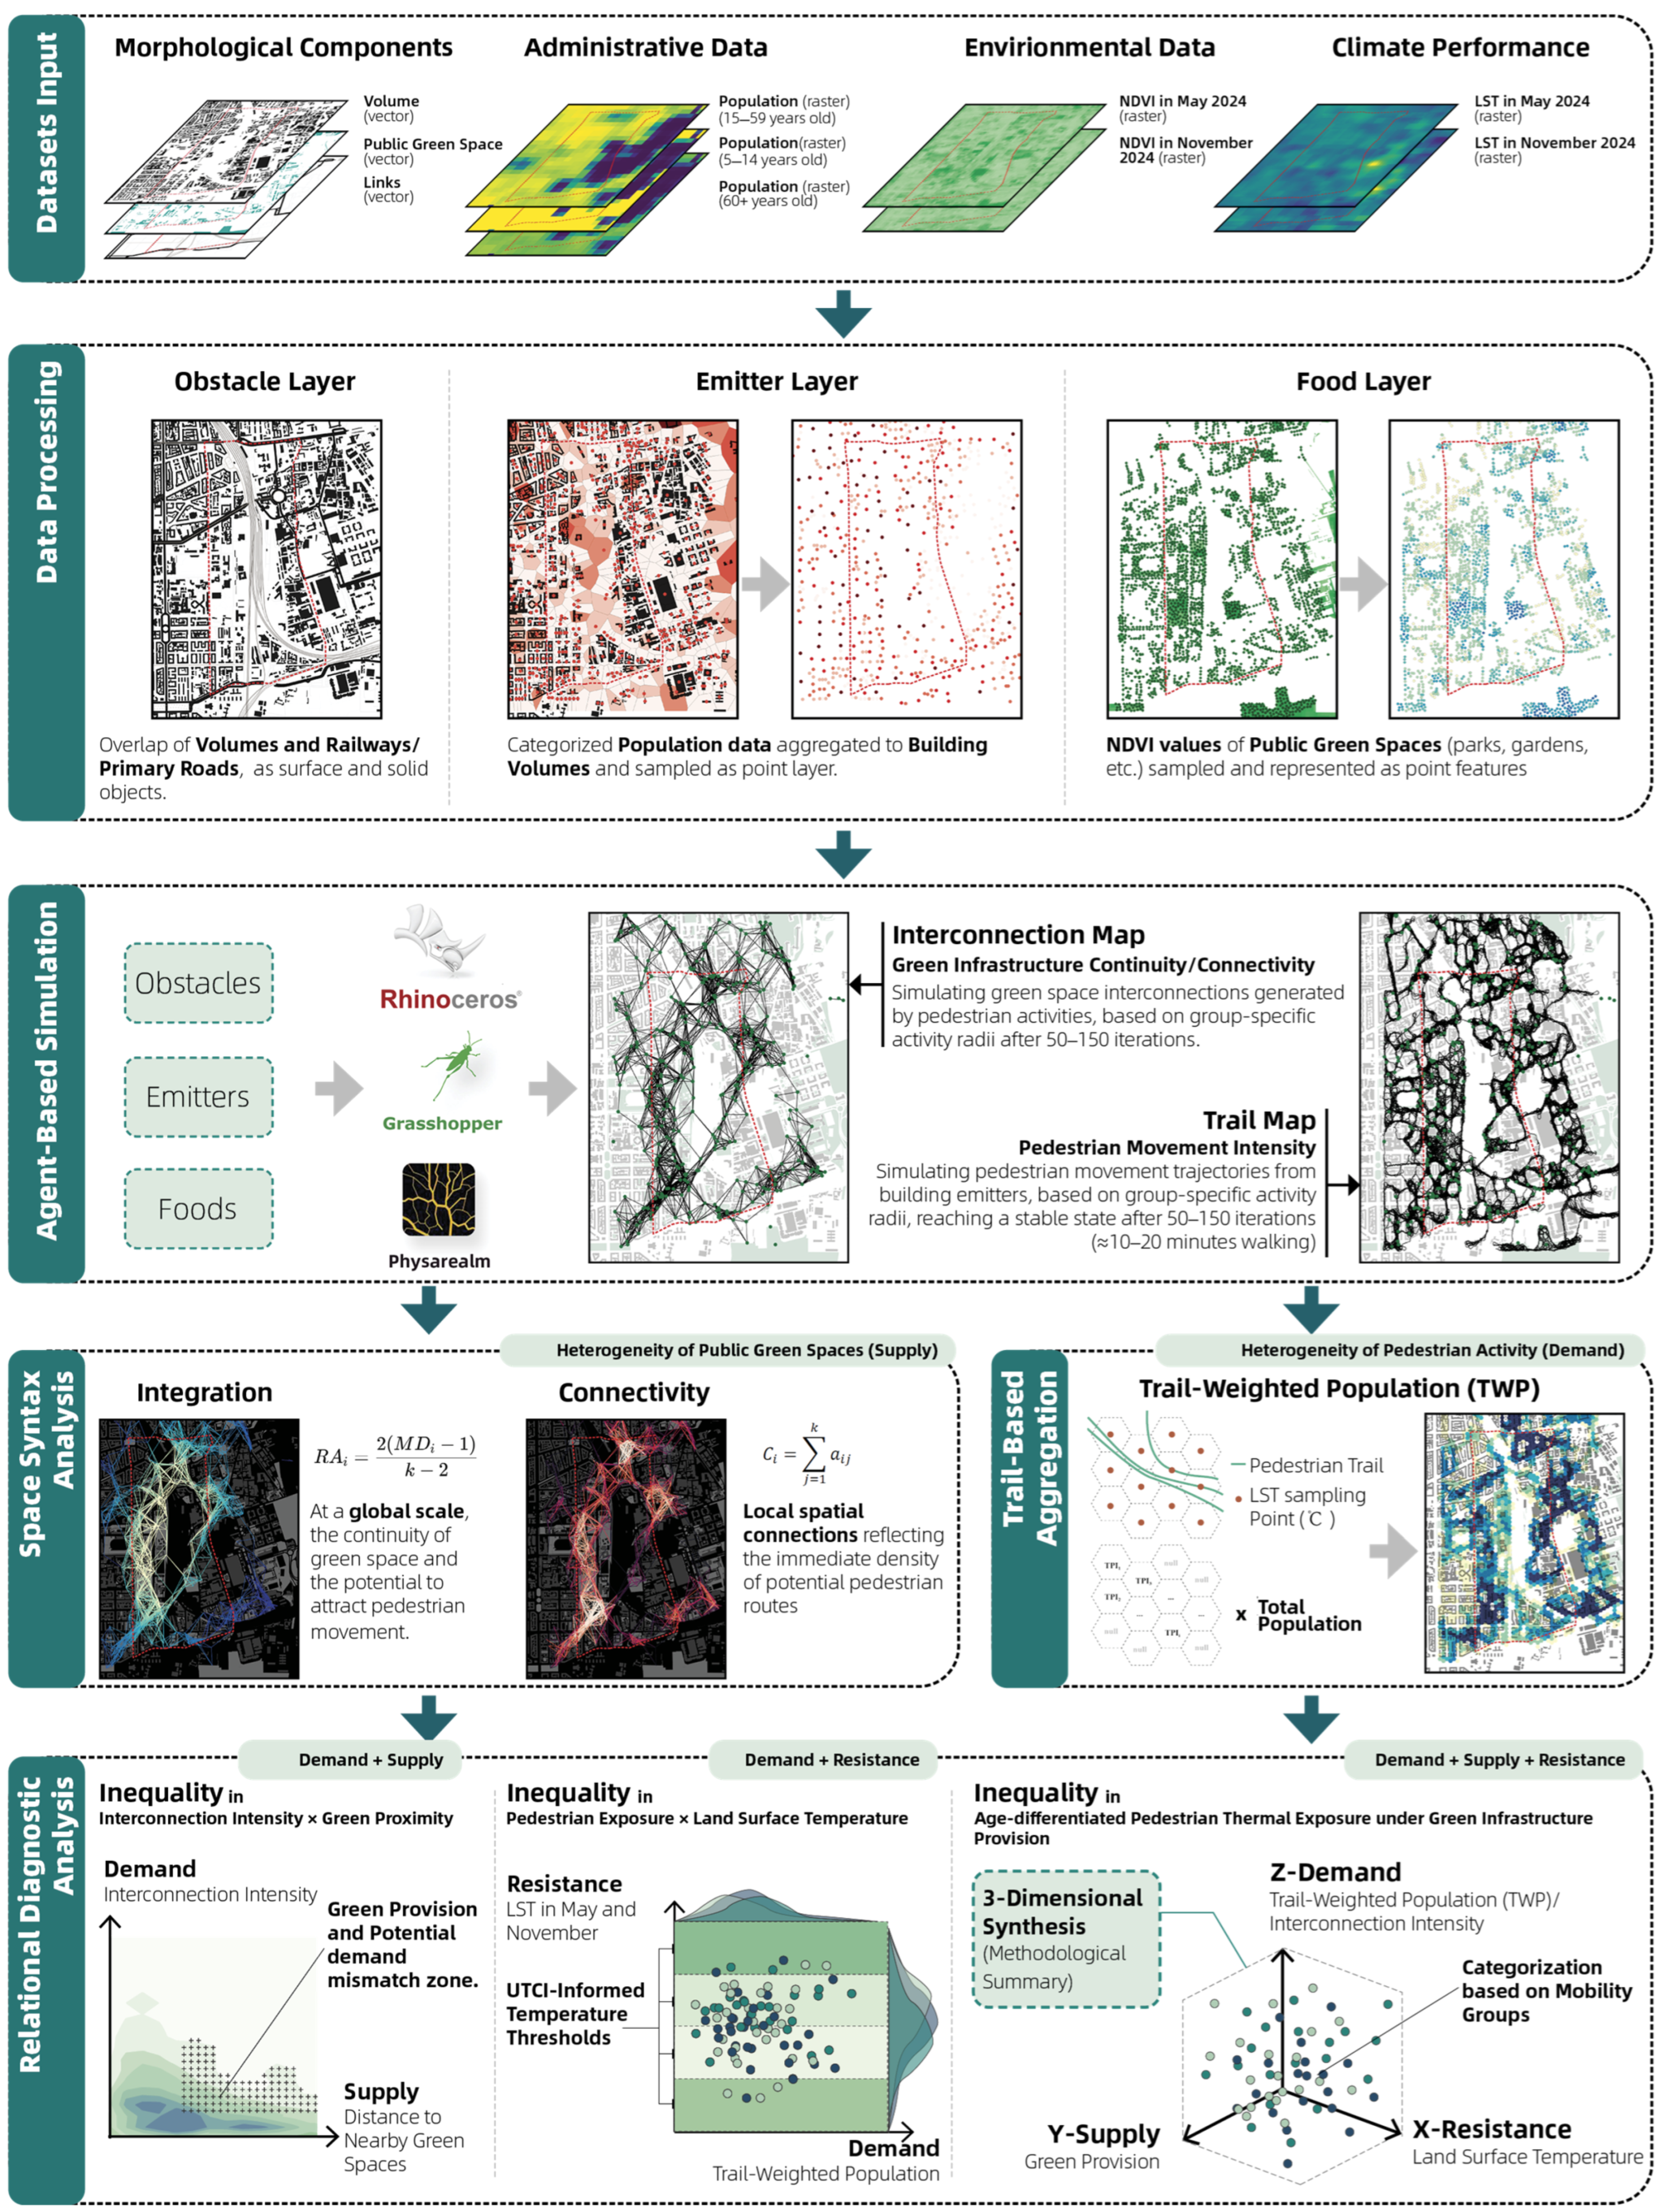
The general methodology processes both spatial and behavioral data, and includes the workflow of the ABS model and quantitative relational diagnosis. Based on the simulation results, the study develops an integrated diagnostic framework that captures both green space provision and urban climate adaptability. Combining human mobility with climate risk exposure, the methodology offers a chance to identify behavioral discontinuities and provides a grounded basis for guiding targeted green space interventions in urban planning. This paper employs Agent-Based Simulation (ABS) as a diagnostic tool to reveal relational mismatches among green space provision, pedestrian demand, and thermal exposure, rather than merely estimating accessibility levels.
Building on this framework (Figure 2), the workflow proceeds from data preparation into the construction of obstacle, emitter, and food layers, which are represented as solid and point-based geometries for ABS. Within this workflow, ABS is used to generate dynamic pedestrian movement and exposure patterns, Space Syntax analysis is used to interpret the structural configuration of interconnection networks, and Land Surface Temperature (LST) is combined as an environmental resistance factor shaping walking conditions. The model generates two complementary types of simulation outputs: (a) interconnection maps, which represent stabilized networks of agent interactions reflecting the structural continuity of green spaces, and (b) trail maps, which represent individual pedestrian movement trajectories originating from building-based emitters and constrained by age-specific activity radii, thereby capturing heterogeneous walking behavior.
Having simulated interconnection and movement patterns, the ABS outputs are subsequently examined to diagnose and explain age-differentiated inequities in access to urban green spaces under heat stress, with particular attention to relational mismatches among supply (Green Provision), demand (People), and environmental resistance (Thermal Stress).
At the one-dimensional level, Space Syntax Analysis is applied to the Interconnection Maps to explore the heterogeneity of green space supply, focusing on continuity of green space and the potential to attract pedestrians. In parallel, pedestrian demand is quantified using Trail-Weighted Population (TWP) measures, which aggregate simulated pedestrian presence along walking trajectories to capture the spatial intensity of pedestrian activity.
Building on the above, two-dimensional relational analyses are conducted subsequently. The joint examination of interconnection intensity (demand) and green proximity (supply) explores mismatches between pedestrian activity patterns and the spatial distribution of resources. And the combination of pedestrian exposure (demand as well) and Land Surface Temperature (resistance) reveals disparities in thermal conditions experienced during pedestrian movement. Finally, the results are synthesized into a three-dimensional relational space that integrates supply, demand, and resistance, serving as a methodological summary through the cross-mapping of multiple analytical dimensions and providing a unified basis for subsequent diagnostic interpretation. This three-dimensional relational representation enables the classification of accessibility conditions and the identification of recurrent inequity patterns, which are examined comparatively across the case studies in Section 4.

3.2. Data Preparation

3.2.1. Standard and Mobility-Constrained Agent Groups

As mentioned in Section 2.2, the mapping algorithm of WorldPop leads to a distribution of population data that does not follow the pattern of built volumes. At this step, the WorldPop data are further processed: population distributions are relocated to the nearest building volumes and stored as a point layer as agent emitters. In the ABS stage, these emitters are prepared to analyse the accessibility of urban green spaces with higher precision.
To refine the discussion of inequality, this study further divides urban residents into two agent groups: the Standard-mobility Group and the Mobility-constrained Group. This classification is based on differences in accessibility and perception capabilities. The Mobility-constrained Group is defined as a behavioral proxy representing pedestrians with reduced walking capacity under physiological and environmental constraints, rather than as a fixed demographic or medical category, with particular emphasis on the usage constraints faced by elderly individuals and those with limited mobility due to factors such as high-temperature exposure and walking difficulties. By setting different walking speed and distance thresholds, the model can more realistically simulate the actual experience of various groups regarding the continuity of urban green spaces, thereby revealing the potential disconnect between “structural green space accessibility” and “perceived fairness”.
According to the research of M. Southworth [27] and K. Turoń [65], the average speed of adult pedestrians in cities is 1.2–1.5 m/s, depending on the urban form and quality of the walking environment. This is also in coherence with the United Nations Economic Commission for Europe (UNECE) [3], which takes 5.0 km/h as the average walking speed for general pedestrians. Based on values reported in the literature and relevant research, this study took 1.2 m/s as the walking speed for the Standard-mobility Group and used its 5 min catchment as the radius for agent simulation (RGroup = 390 m). In contrast, elderly people walk more slowly than general adults (about 20–30% slower), as researched by M. Reisi [66] and H. Mohsen [67]. The average walking speed of people aged 65 and above is 0.8–1.0 m/s, so that 0.9 m/s and 270 m were taken as the RGroup for the Mobility-constrained group. Walking speed and activity radius are defined on these values to ensure consistency with empirically observed pedestrian behavior.
This differentiation allows the diagnosis of mismatches between the structural accessibility of green space and the experienced accessibility by pedestrians with different mobility capacities. In the simulation, parks and gardens (public and semi-public spaces) are taken as destinations instead of all types of green spaces. This is due to the role parks and gardens play in citizens’ daily lives, and ensures consistency in accessibility assessment by focusing on green spaces that are generally open to public use.

3.2.2. Green Space Sampling Based on Normalized Difference Vegetation Index (NDVI)

In this ABS model, the green space data was operated as a point cloud layer, which requires converting green space polygons into regular sampling points, as the “food” layer. It represents green spaces that attract pedestrian agents within the resistance-based movement model. First, all urban green spaces were sampled at a density of one point per 200 m2, while patches smaller than 200 m2 were represented by a single point to ensure their presence in the model. On this basis, Normalized Difference Vegetation Index (NDVI) values were extracted for all sampling points, and points with NDVI values greater than 0.5 were duplicated to increase the weight of medium- to high-quality vegetated areas. According to previous research [24,43,68], higher NDVI values generally indicate higher vegetation health, density, and environmental quality [69], which makes such green spaces more attractive to residents [70]. This threshold follows commonly adopted classifications of medium-to-high vegetation density in urban remote sensing studies, while point duplication is used as a discrete weighting strategy compatible with the point-based structure of the ABS model. Therefore, in this simulation, assigning additional weight to green spaces with NDVI > 0.5 enables the ABS to better approximate actual human spatial preference patterns. The NDVI-based sampling and weighting procedure is applied uniformly across all study areas to ensure methodological consistency and comparability of green space attractiveness within the simulation.
N D V I = N I R R E D N I R + R E D
Formula (1) represents the calculation of Normalized Difference Vegetation Index ( N D V I ) used in this study, where R E D and N I R stand for the spectral reflectance measurements acquired in the red (visible) and near-infrared regions from Landsat 8–9, respectively.

3.3. Modeling Human Walkability

3.3.1. Agent-Based Simulation for Pedestrian Movement Patterns

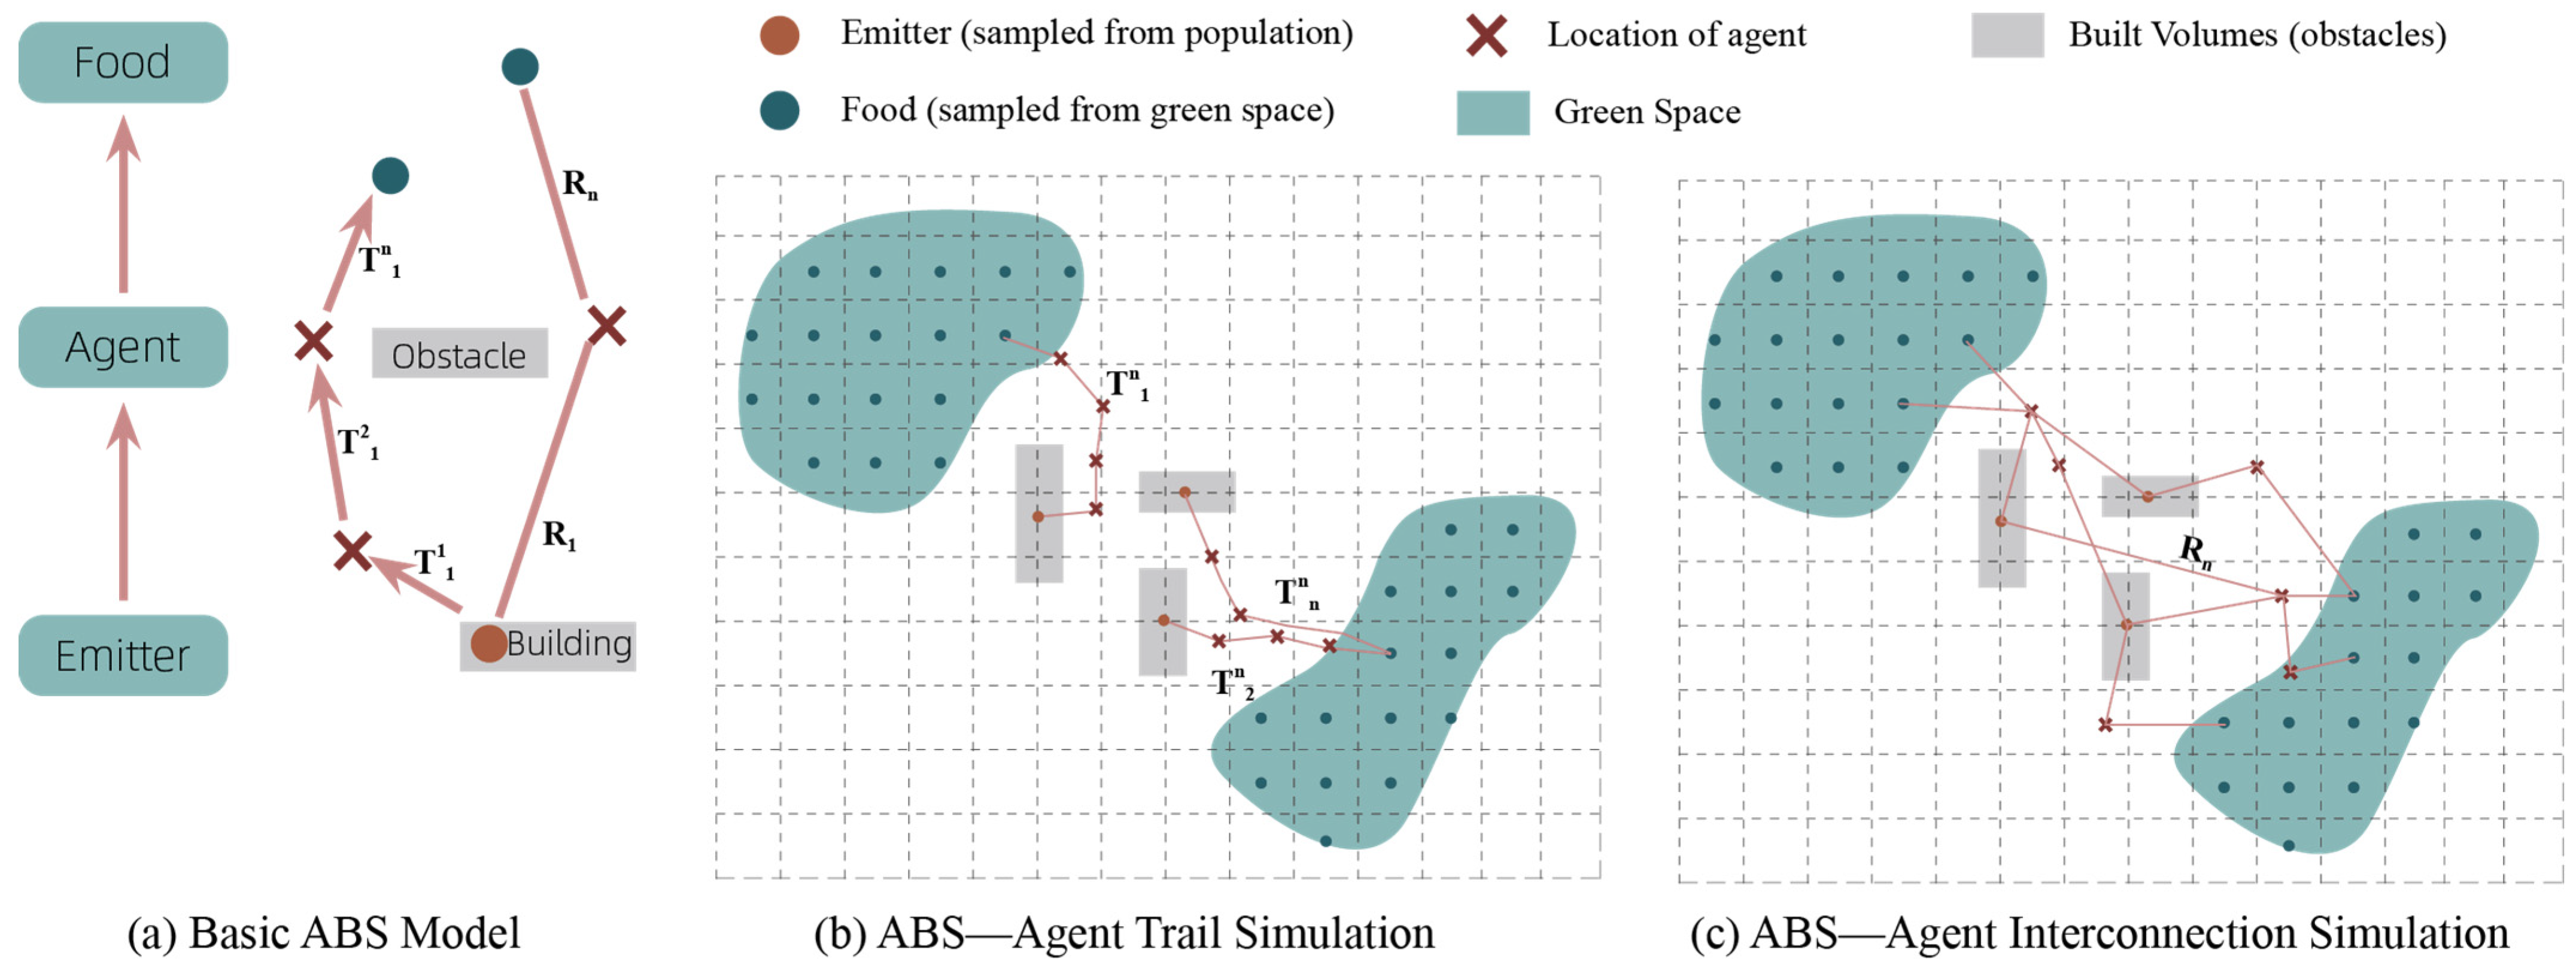
In this study, the ABS model is derived from the Physarealm plugin for Rhino Grasshopper. Physarealm works as a multi-agent system where agents adhere to local gradients inside a diffusive-decaying trail field, reinforcing trails through deposition; the resultant global network pattern emerges as a self-organized consequence of these iterative local rules [71,72]. Physarealm consists of modules including emitter (releases agent points), food (attracts agent points), and environment (e.g., obstacles and land slopes), and the central processing core. The principle is that by locating the emitters’ positions through sampling points (population points in buildings, in this case), the emitters send agent points to move around to find food points within the environment (Figure 3a).
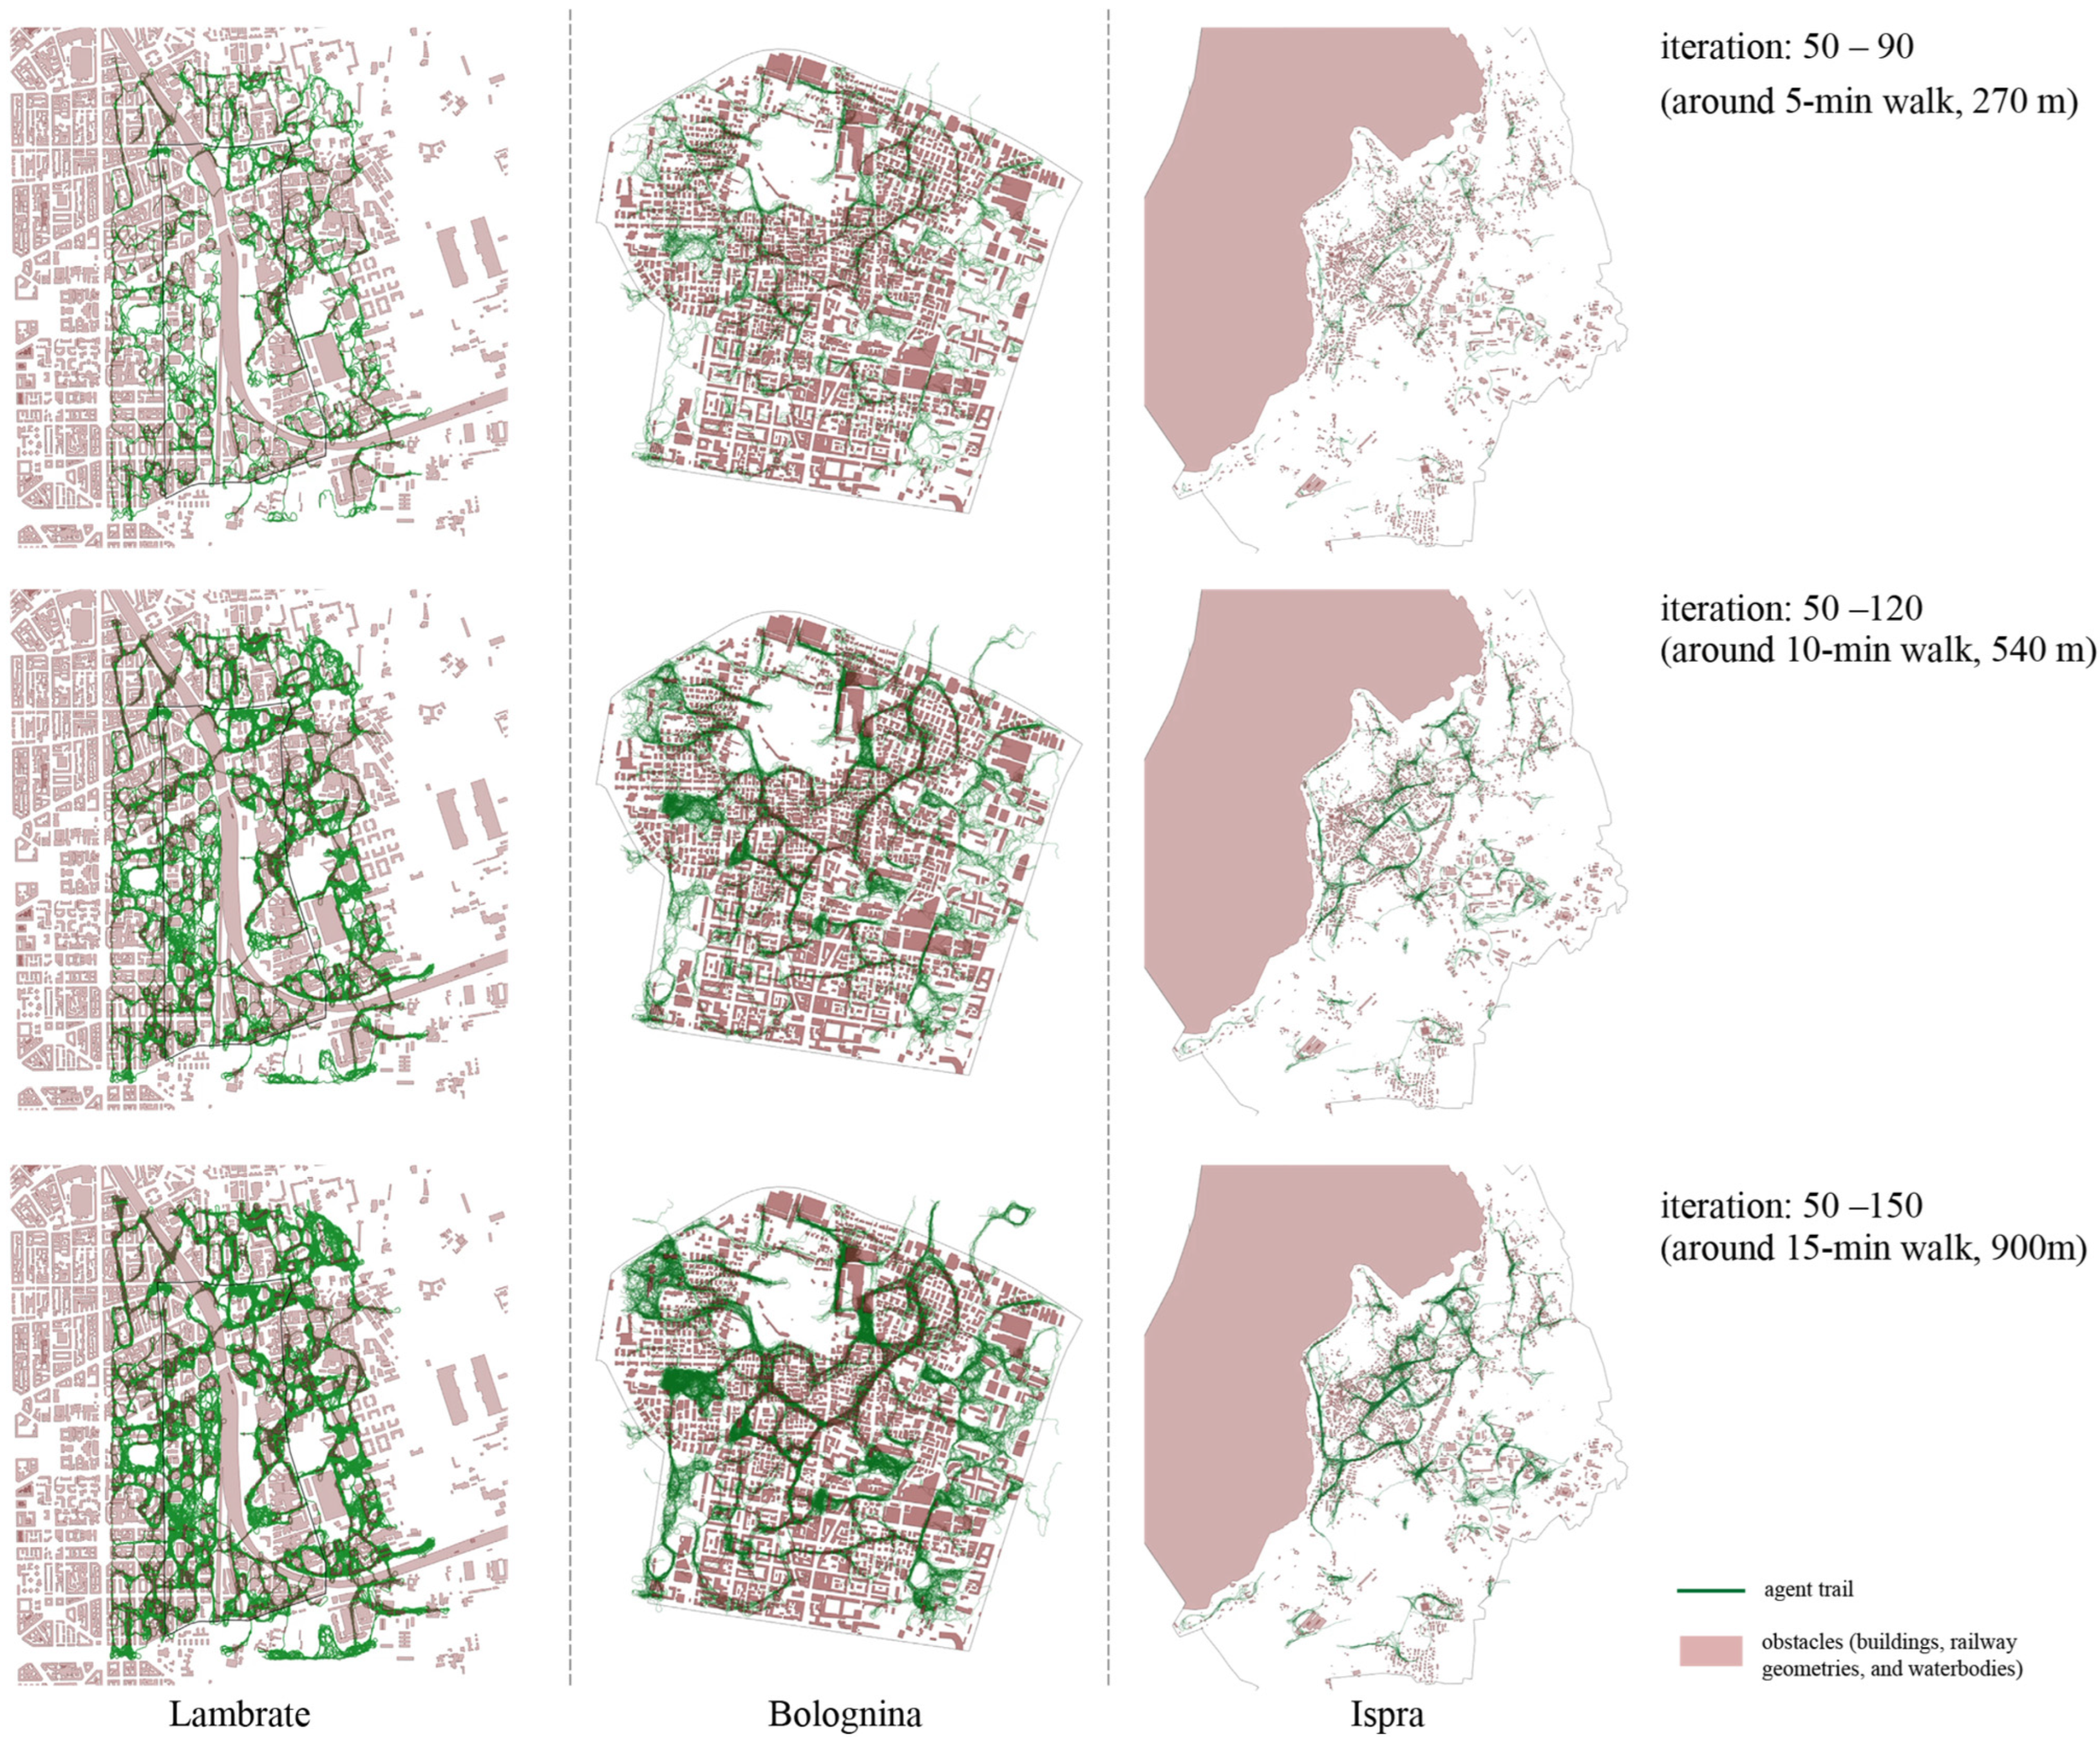
The ABS model consists of two complementary simulations based on the pre-processed geometry of urban components as the input layers in QGIS (Section 3.2). As shown in Figure 3b, the first simulation is the Agent Trail Simulation. It focuses on capturing and aggregating the movement trajectories of individual agents. During the simulation, agents are emitted from buildings and navigate around obstacles toward nearby public green spaces (food nodes). Once the simulation reaches a stable state (after around 50 iterations), the system begins recording all trails generated by the agents. The trajectories produced between iterations 50 and 150 (T50n to T150n) are recorded into cumulative trail layers, whose spatial distribution and density are used for statistical analysis. The resulting map represents the stabilized output, illustrating the cumulative movement trajectories of individual pedestrian agents departing from residential buildings and exploring surrounding green spaces over a simulated duration of 10–15 min (iterations 50 to 150). To ensure comparability across the three study areas, all simulations are run using an identical set of input parameters (Table 3). Statistical analysis (detailed in Section 3.3.3—Trail-Weighted Analysis) of these aggregated trajectories reveals the emergent mobility tendencies of different age groups, providing the behavioural basis for subsequent assessments of urban heat exposure and infrastructural equity. Based on this result, trail density and spatial concentration are interpreted as proxies for pedestrian demand and cumulative exposure along walking routes.
The second one, Agent Interconnection Simulation (Figure 3c), examines the spatial interaction relationships among emitters and food nodes. When agents come within the predefined proximity threshold (RGroup), an interconnection event is registered. The resulting distribution and density of these interconnections indicate the potential pedestrian-mediated linkages between green space patches, offering insights into how site morphology influences ecological and social connectivity. The distance between agents must not exceed the RGroup (Formula (2)), which is different for each mobility group; otherwise, the agent’s interaction fails and disappears. Since Physarealm is a dynamic simulation, once the agents’ movement stabilizes (50–150 iterations), time slices can be taken for further analysis of the movement network and location [24]. Given the exploratory and diagnostic nature of ABS, convergence is assessed at the level of macroscopic spatial patterns rather than through formal statistical equilibrium tests (see Appendix A.1).
R i j ( A ) R G r o u p
According to the categorization of the agent groups and the required input geometries (point and polygon layers), Table 3 summarizes the parameter settings of the Physarealm simulation. The Starting Agent Numbers (PopS) were defined based on the corresponding population, with one agent representing ten people. And the distribution of emitters was derived from buildings. As a result, the Interconnection network is used diagnostically to evaluate the structural continuity and potential accessibility of green spaces within the urban fabric.

3.3.2. Space Syntax Analysis of Green Space Interconnection Patterns

The results of the Agent Interconnection Simulation are represented as networks defined by corresponding thresholds (Figure 3c). Moving from behavior-driven patterns to structural hierarchy and weighting, these interconnection networks are further examined using Space Syntax (DepthMapX version 0.8.0). These networks are processed by segment analysis [73] to examine their topological characteristics. Specifically, connectivity and integration measures are employed to visualize the potential for interactions (i.e., access and encounter) among agents. Through this analysis, a system-wide description of green space utilization patterns and activity intensity across different agent groups is derived.
The core idea treats segments as nodes and their intersections as edges, computing accessibility by topological steps rather than Euclidean distance. Connectivity (Formula (3)) utilizes the degrees of segments (number of intersecting segments) to reflect interaction density and potential activity clustering. It is used to characterize the activity ranges of residents within the neighborhood and to identify active zones and homogeneity, thereby observing the agent distribution patterns across the study area.
C i = j = 1 k a i j
where a i j refers to the adjacency value between node i and node j , equal to 1 if i and j intersect (or directly connect), and 0 otherwise; k is the total number of segments in the system.
Integration analysis (Formulas (4) and (5)) is based on the topological depth relations between a given segment and all other segments in the network; lower R A i values indicate higher global integration, implying that the location is more easily reachable within the overall configuration and plays a stronger role in structuring spatial accessibility. This measure facilitates the identification of highly integrated zones characterized by concentrated movement and activity, contrasting with weakly integrated zones that typically operate as outlying, fragmented, or less accessible parts.
M D i = 1 k 1 k d i k
R A i = 2 M D i 1 k 2
In Formula (4) Mean Depth ( M D i ) and Formula (5) Relative Asymmetry ( R A i ), k stands for the number of segments in the system, and d stands for the depth, k d i k stands for the total depth sum from the root node i to all other spaces in the researched zone [74,75].
Connectivity and Integration collectively reveal disparities in interaction density and accessibility across distinct spatial units, providing a systematic spatial foundation for understanding green space utilisation intensity, activity distribution patterns, and potential imbalances within the study area. These outcomes provide crucial inputs for subsequent thermal environment overlay analysis and comprehensive diagnostics.

3.3.3. Trail-Based Aggregation of Pedestrian Exposure Intensity

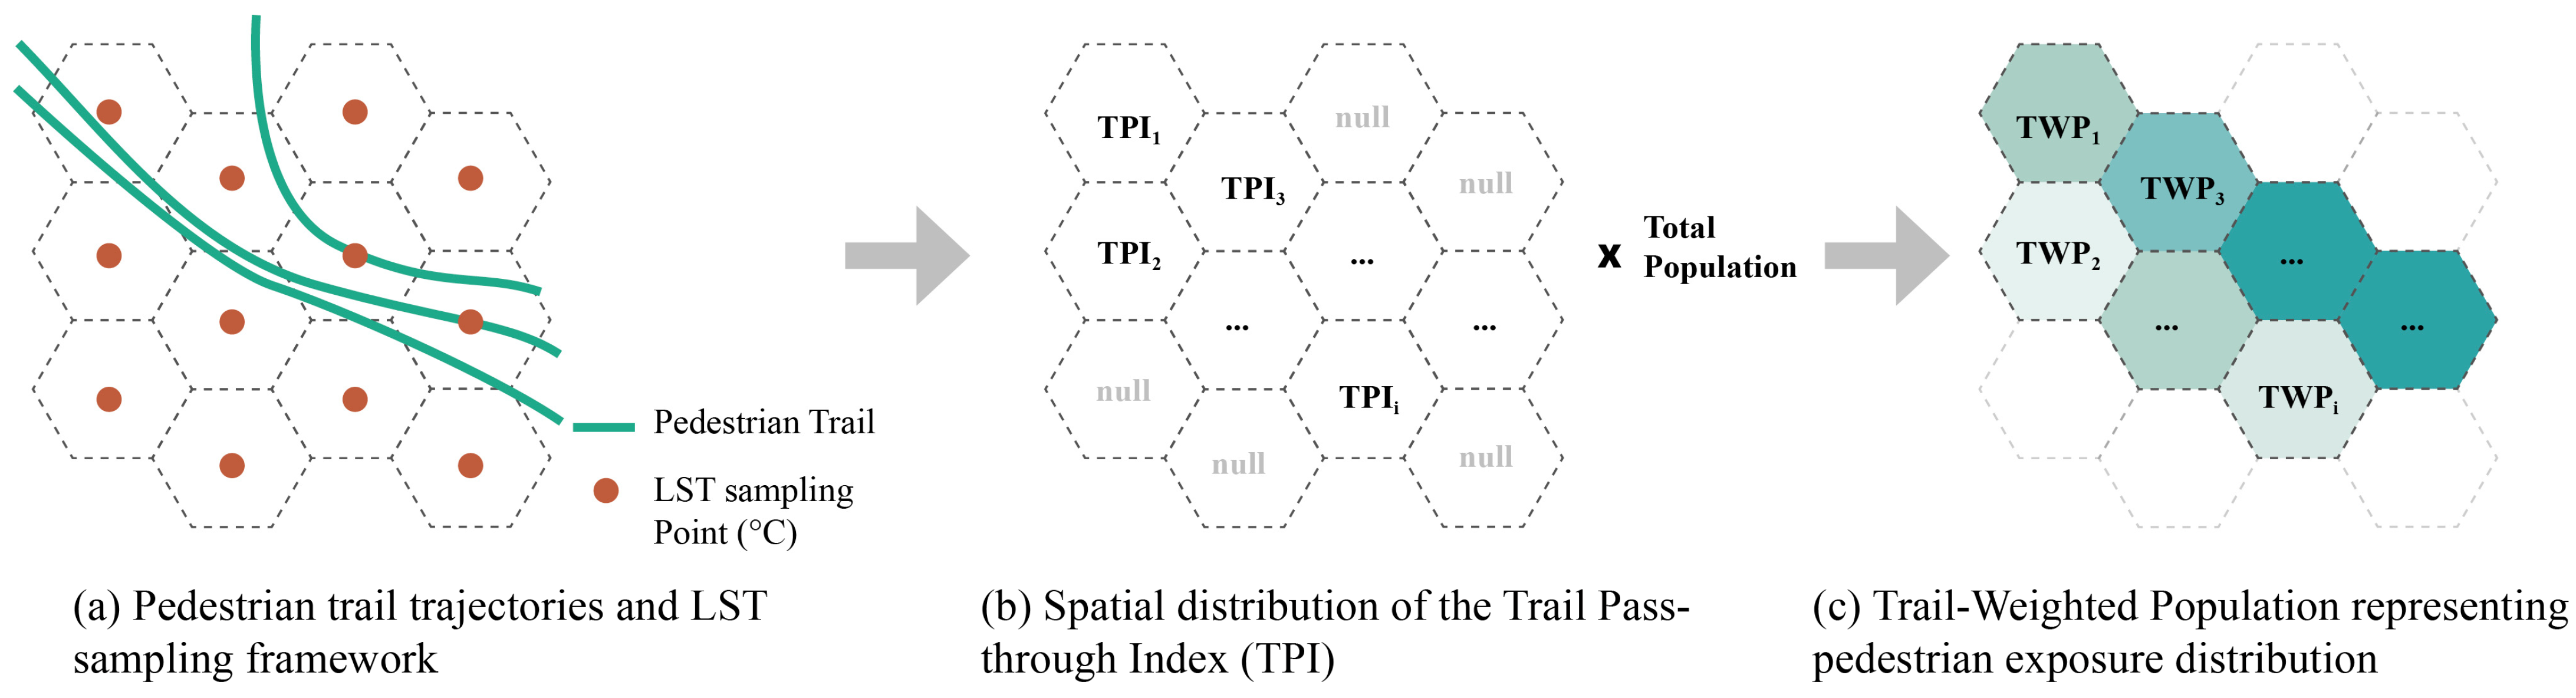
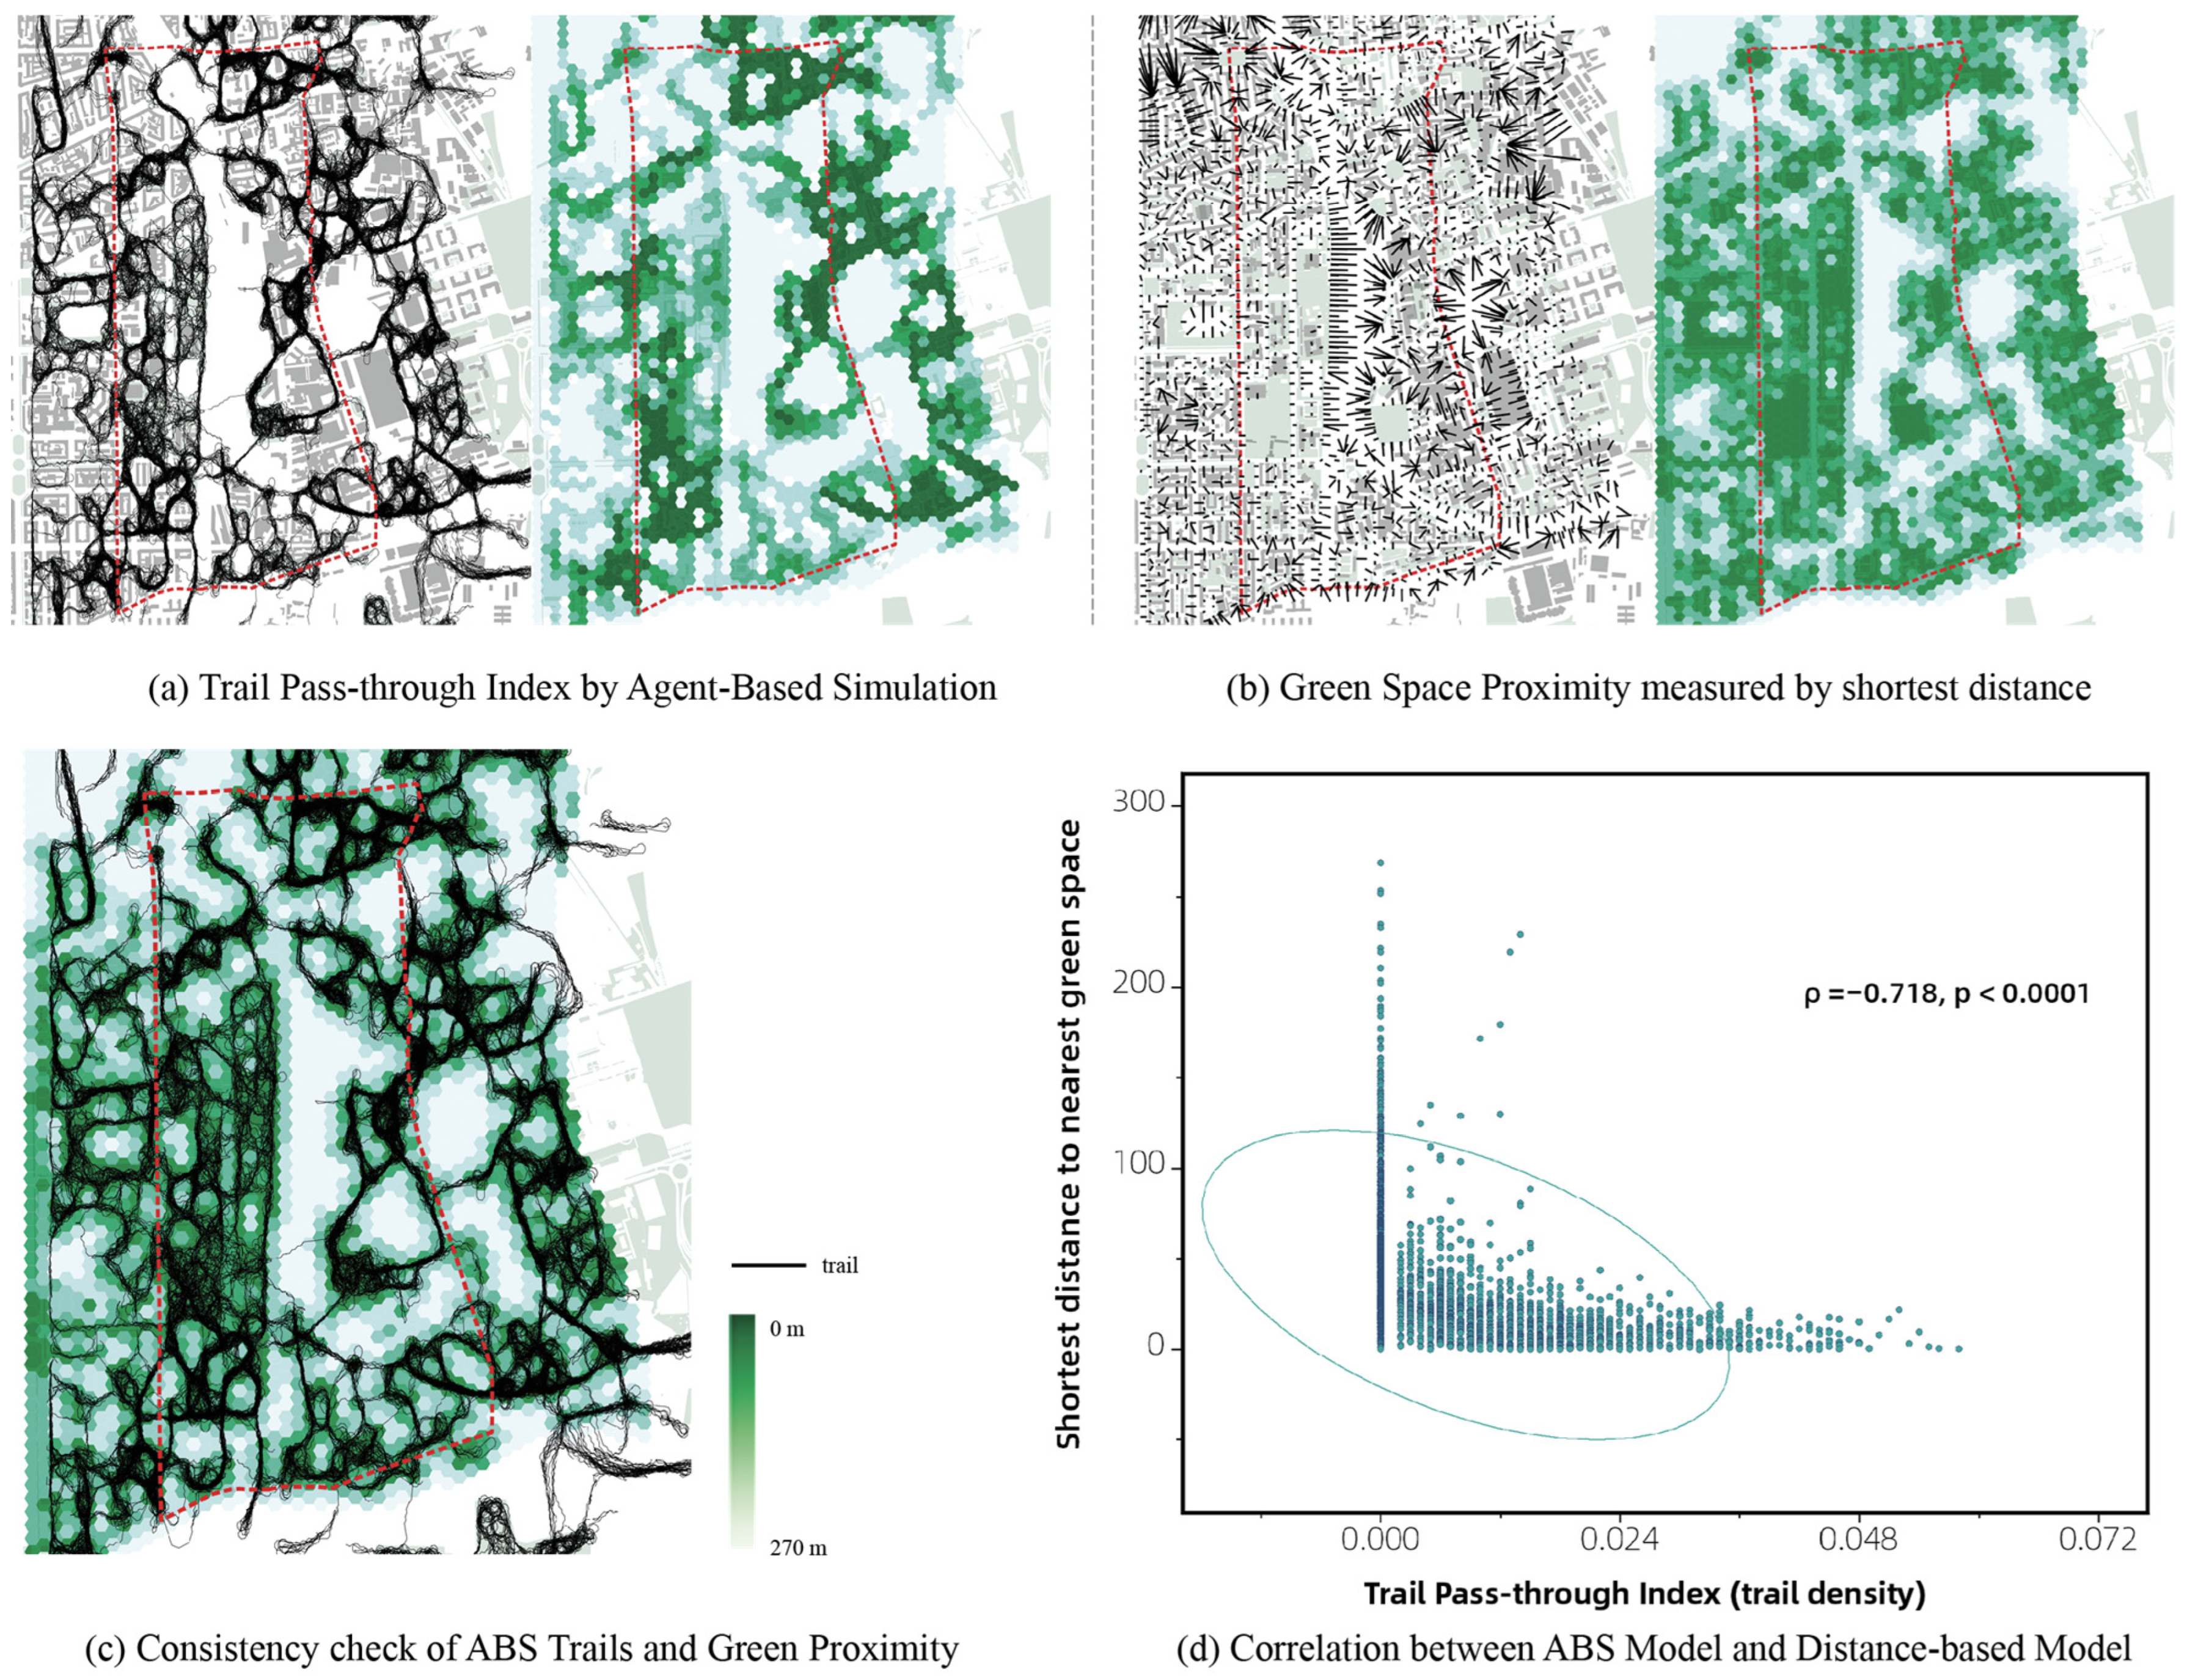
In the previous section, the Agent Trail Simulation processed and recorded the pedestrian access to nearby green spaces, in which pedestrians are modelled as individual agents (as shown in Figure 3b). The individual movement trajectories correspond to approximately 10–15 min of continuous walking activity. This temporal equivalence is derived from the input walking speed parameters assigned to each mobility group (see Appendix A.2). And when aggregated spatially, these individual trajectories form macroscopic patterns that reflect experienced pedestrian mobility. From an experience-oriented perspective, the trail-based results capture the differentiated conditions encountered by distinct mobility groups and can be meaningfully aligned with route-based environmental exposure variables, thus Land Surface Temperature (LST). As a result, the outcomes of the Agent Trail Simulation are projected onto a 50 m × 50 m hexagonal grid (Figure 4a) and analysed in relation to the sampled LST data. This grid resolution was selected by considering both the spatial extent of the study areas and the computational load of the ABS, allowing the total number of cells to remain within an analytically manageable range (approximately 4000–5000) while preserving local pattern detection and cross-case comparability. Landsat 8–9 imagery acquired in May (early summer) and November 2024 (early winter) was used in this study, with LST derived from the thermal infrared band (Band 10). The chosen seasonal data represent contrasting seasonal thermal conditions and exhibit spatial gradients across urban surfaces—such as residential areas, green spaces, and roads—without being dominated by extreme seasonal conditions, but allowing pedestrian exposure to be examined under both warmer and cooler walking environments.
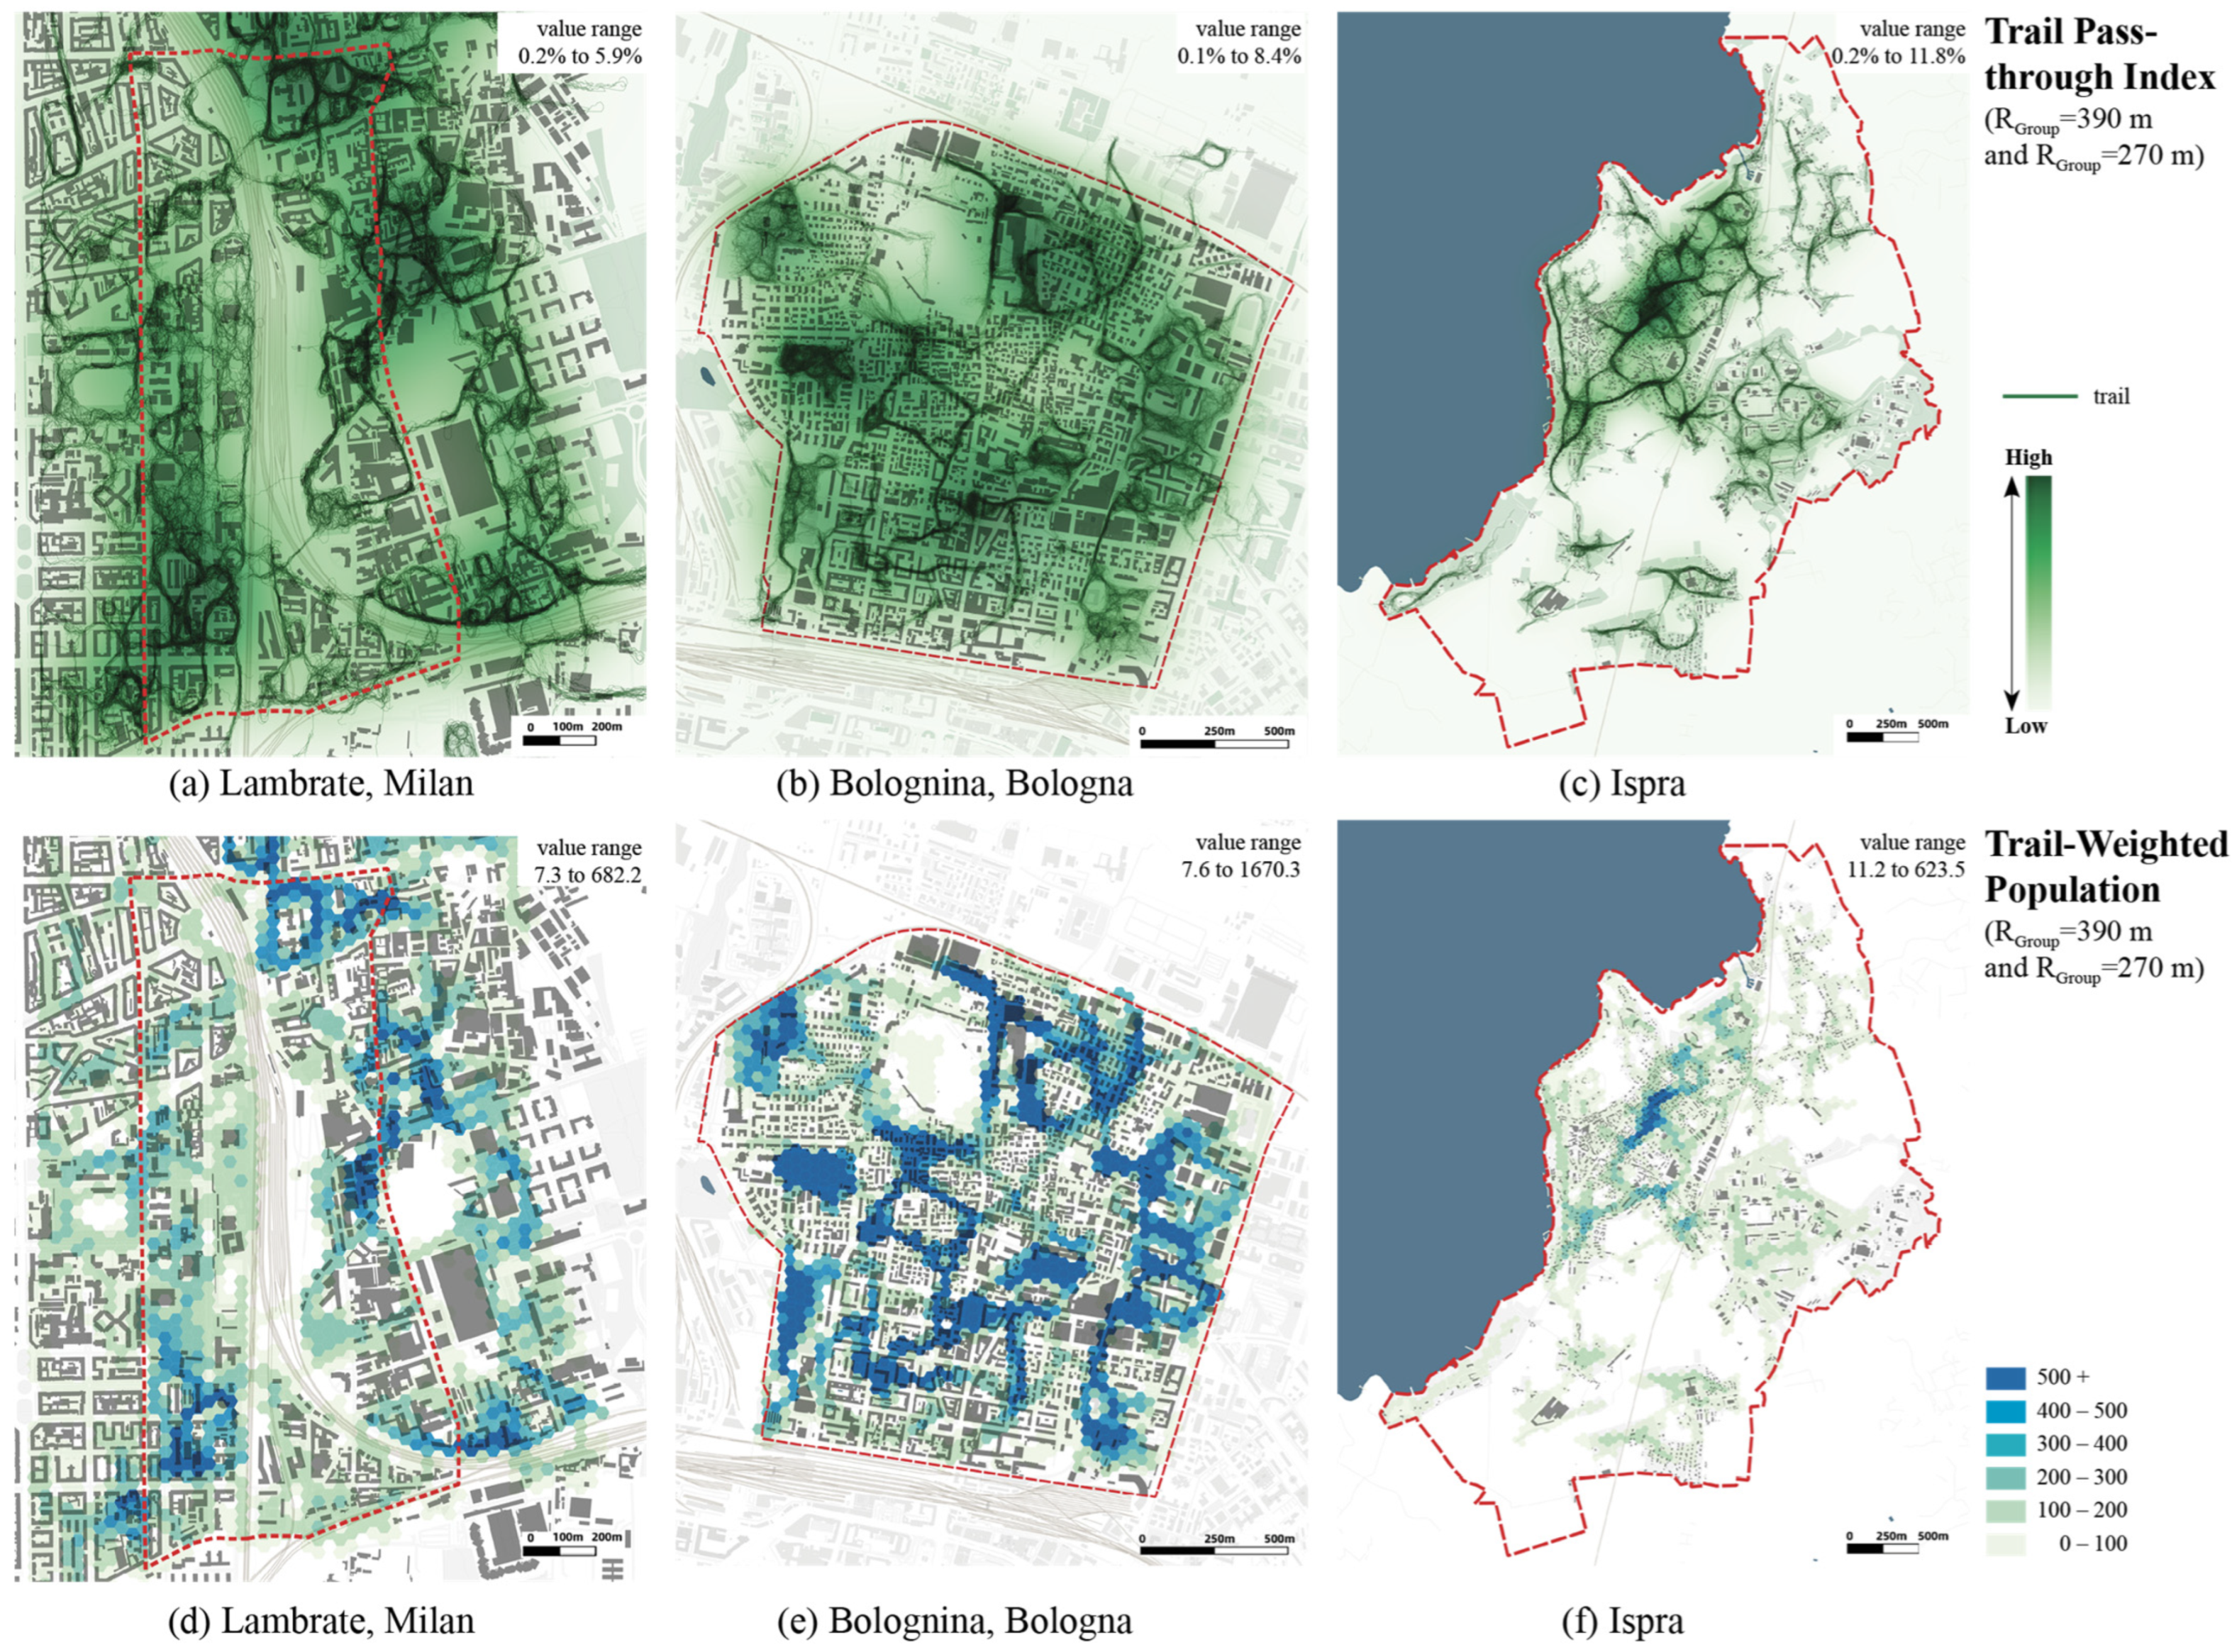
Based on the number of simulated pedestrian trails intersecting the cell ( n i ), a normalized index termed the Trail Pass-through Index ( T P I i ) was calculated by dividing the trail count of each cell by the total number of trails across the study area (Formula (6)), as shown in Figure 4b. The T P I i represents the relative intensity of pedestrian pass-through activity along walking routes to urban green spaces. To express this movement pattern in population terms, the index was further multiplied by the total population of the study area, resulting in the Trail-Weighted Population ( T W P i ), which reflects the population exposure during pedestrian trips to green amenities (Formula (7)).
T P I i = n i N
T W P i = T P I i × P o p t o t a l
where n i is the number of (unique) trails intersecting cell i , and N is the total number of trails recorded in the study area. Here P o p t o t a l is the total population within the study area according to different mobility groups. T P I i captures the morphology-driven likelihood of green space choice by pedestrians, indicating where access is structurally more likely to occur, while T W P i , by explicitly incorporating the total population, better reflects the lived experience and cumulative exposure of pedestrians across the study areas, which facilitates comparative analysis across different case studies.

3.4. From Spatial Mapping to Diagnostic Analysis: Interpreting Structural–Exposure Relationships

Through the mapping of the green spaces’ interconnection and pedestrian concentration in Section 3.3, the base for assessing the equity in the interaction between pedestrians, environmental resources, and heat stress has been obtained. However, spatial patterns alone do not explain how structural differences in green provision are translated into uneven environmental exposure through mobility. To address this gap, this section introduces a cross-mapping approach that integrates structural characteristics of green infrastructure (supply), pedestrian walkability patterns (demand), and thermal environmental conditions (resistance). This cross-mapping approach allows the joint interpretation of these three layers to identify areas where their spatial alignment or misalignment shapes exposure patterns, and reveals how distinct combinations give rise to differentiated walking experience outcomes across urban contexts.

3.4.1. Spatial Imbalance Between Green Structure and Pedestrian Intensity

To describe the overall evenness of resource distribution, the Gini coefficient has been widely applied in studies of economic, public service, and spatial equity. However, as a static metric, it primarily reflects whether a distribution is equal, without distinguishing between “equally adequate” and “unequally inadequate” conditions. To complement this limitation, pedestrian activity intensity (from the interconnection map in Section 3.3.2) is aggregated within the hexagonal cells and cross-referenced with green proximity, measured as the distance to the nearest green space.
Through density plot visualization, this approach identifies the locally dominant configuration (Peak point) of activity intensity and green proximity in each case, which serves as contextual benchmarks for diagnosing potential spatial overload. This peak point represents the most frequent co-occurrence of pedestrian intensity and green proximity. Deviations from this point, reflecting either potential spatial overload (high pedestrian demand with low green accessibility) or redundancy (low pedestrian demand with high green accessibility), are marked as “mismatch zones” between pedestrian demand and green infrastructure supply.

3.4.2. Uneven Thermal Exposure Under Existing Walkability Patterns

Instead of treating temperature as a static spatial attribute, this analysis examines thermal conditions from the perspective of pedestrian experience, building on the trail-based aggregation of pedestrian intensity introduced in Section 3.3.3. Trail-Weighted Population (TWP) is used to represent the intensity of pedestrian activity along walking trajectories and is plotted against land surface temperature (LST) values sampled within the hexagon, forming a pedestrian-weighted distribution of thermal exposure. Cumulative distribution curves are further employed to summarize how pedestrian exposure is distributed across temperature ranges, thereby enabling comparative analysis across the study cases. The width of the curve captures the degree of concentration of pedestrian thermal exposure, with narrower and steeper curves indicating more evenly distributed exposure, whereas wider curves signal greater inequality. The position of the peak indicates the prevailing thermal exposure range. Together, these two features distinguish between evenly shared heat stress or uneven exposure under thermally comfortable conditions.
The sampled Land Surface Temperature values are further classified according to the Universal Thermal Climate Index (UTCI) [76], which provides a human-centered benchmark to interpret outdoor thermal stress. The UTCI thermal zones are used to interpret LST values in relation to pedestrian thermal stress. Based on the UTCI categorization and existing urban climate studies [77], LST values are grouped into four temperature ranges in this research: cold stress values (<9 °C), no thermal stress (9–26 °C), moderate heat stress (26–32 °C), and high heat stress (≥32 °C).

3.4.3. Relational Configuration of Supply, Demand, and Environmental Resistance

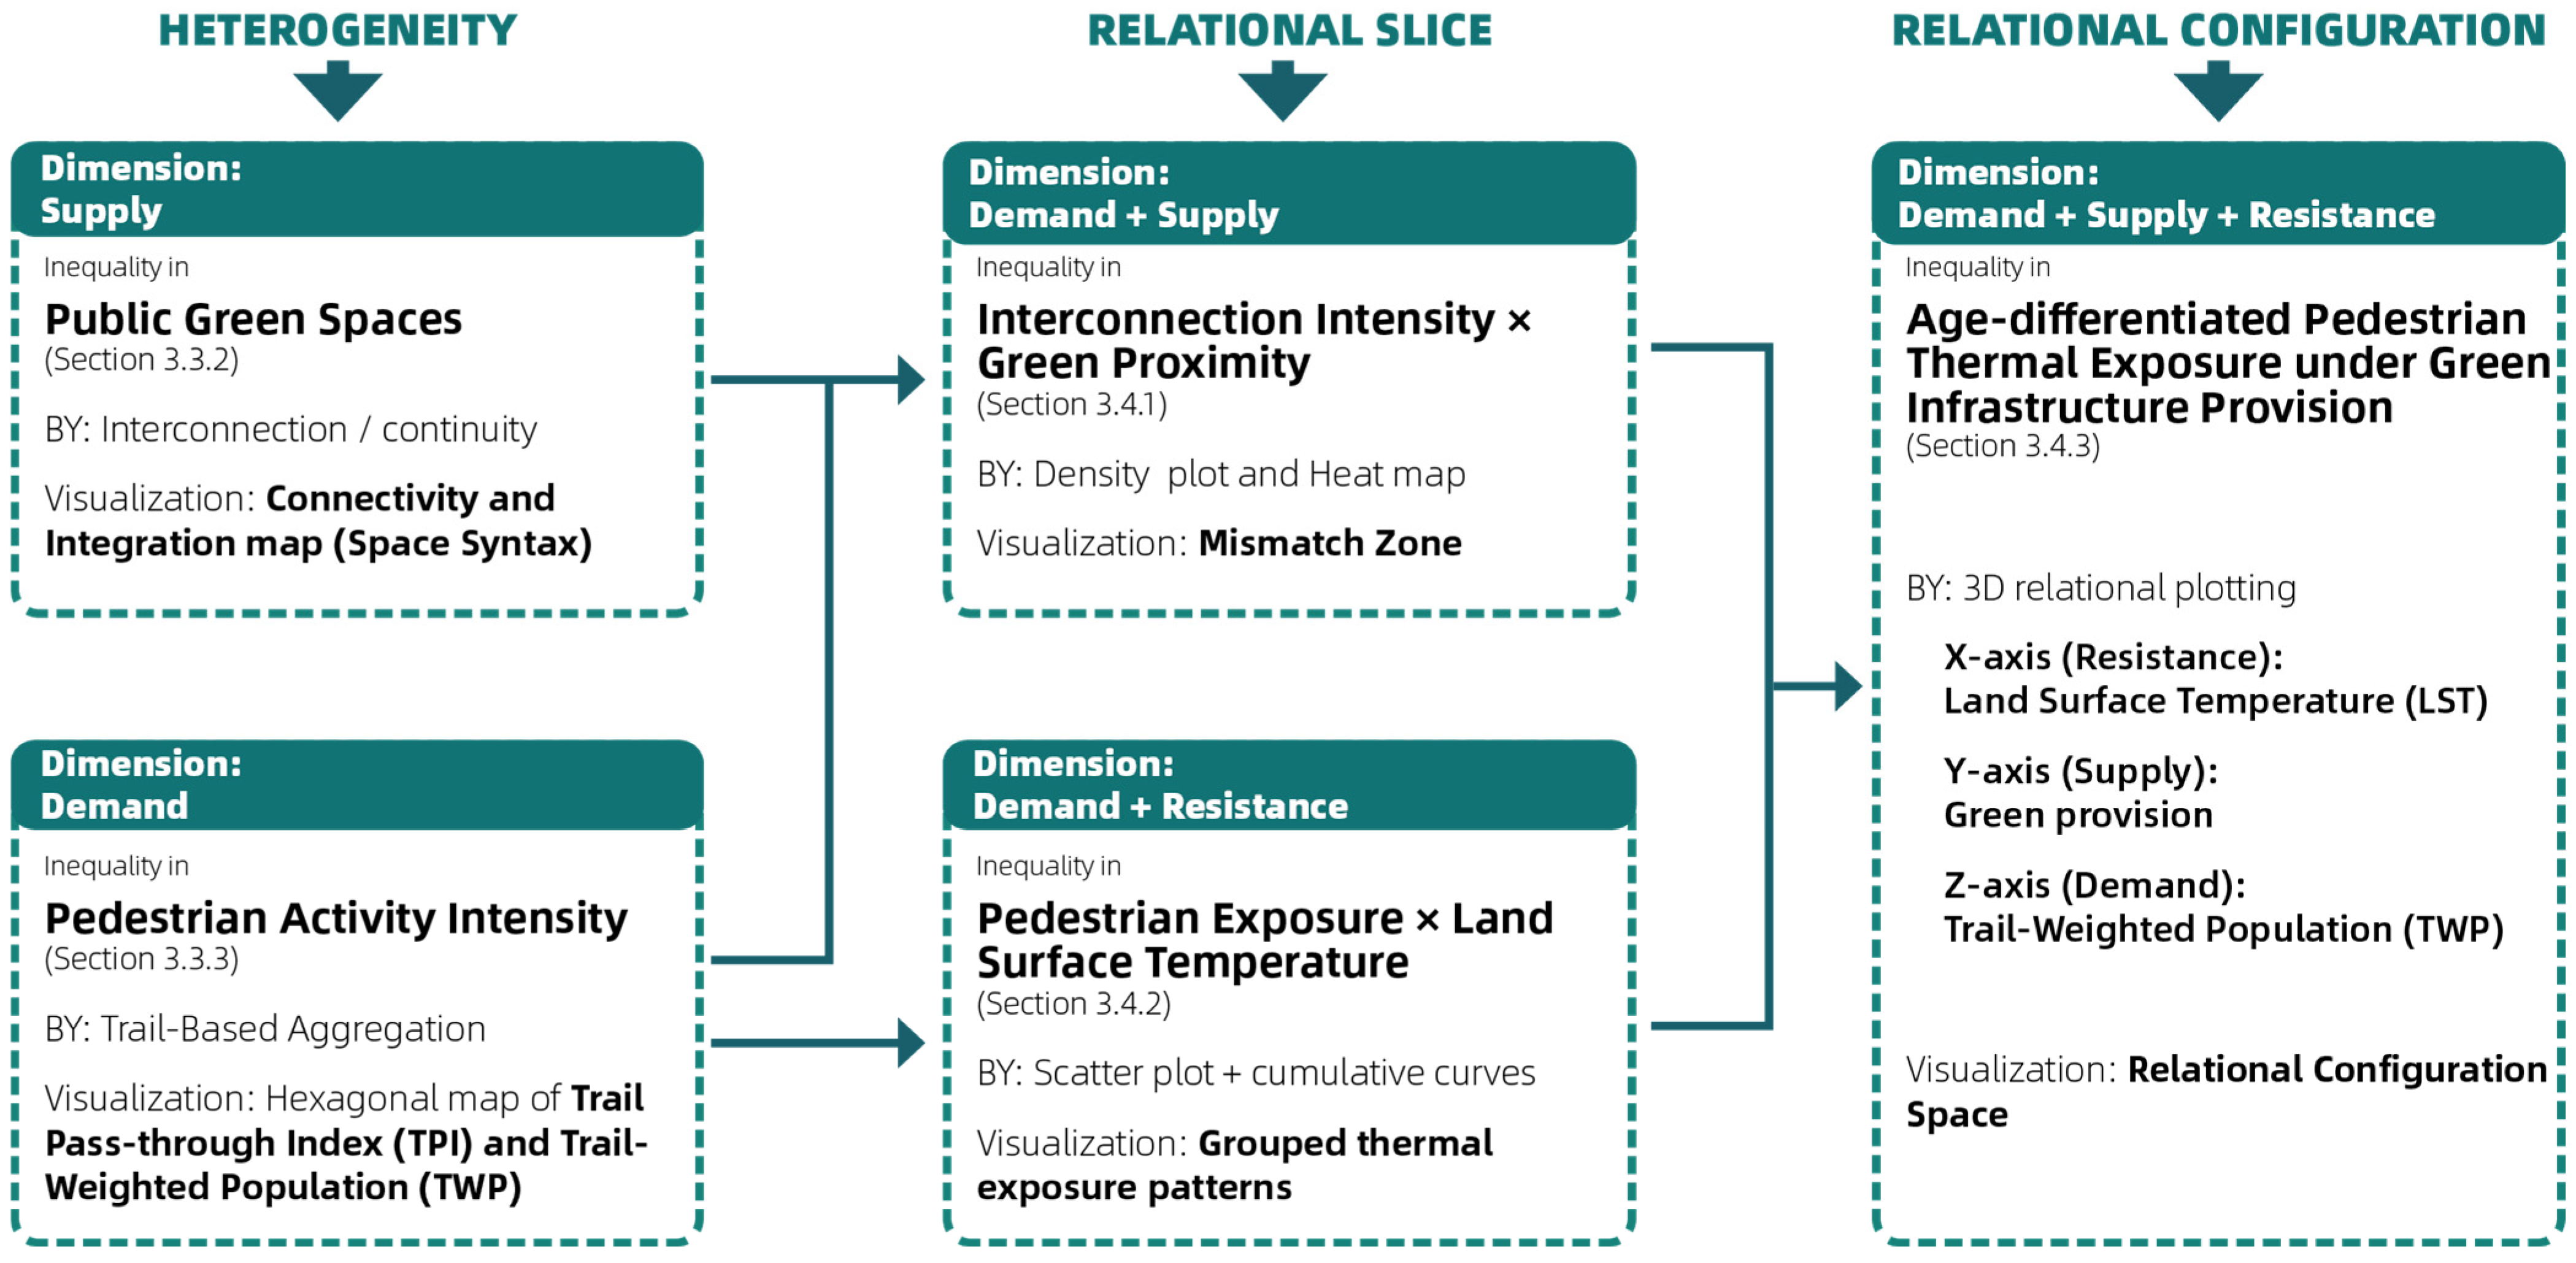
The three-dimensional relational framework integrates the results of the preceding layered analyses within a unified relational space, characterising combined patterns of pedestrian thermal exposure across the study areas from a systemic perspective. As illustrated in Figure 5, the analytical process progresses from one dimension that separately describes heterogeneity in supply or demand, to two-dimensional overlays that reveal green infrastructure structure, pedestrian activity patterns, and the relationships between pedestrian exposure and thermal conditions across different relational slices. As a summary, the three elements are synchronously positioned and examined within a complete three-dimensional relational space, enabling a consolidated representation of walkability-related equity among different mobility groups across the study areas. This three-dimensional relational framework supports the interpretation of walkability equity by examining how supply, demand, and resistance interact within individual spatial units.
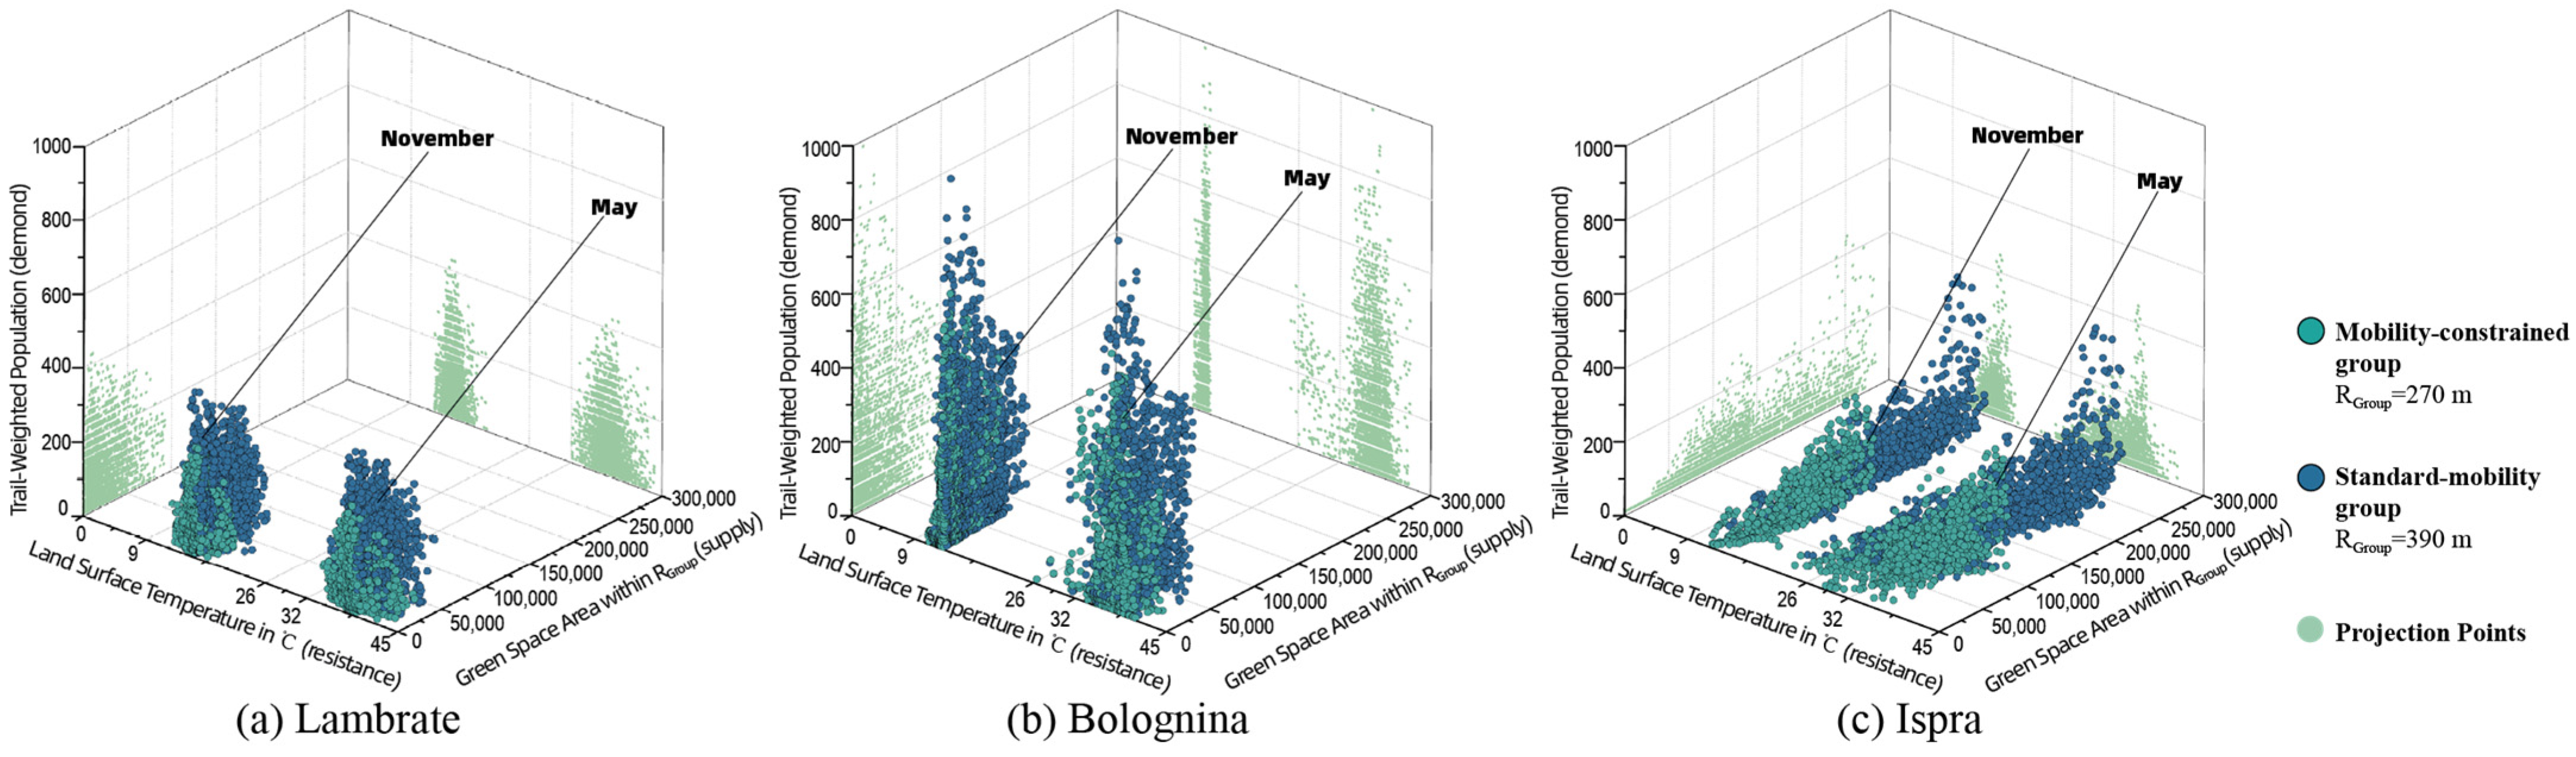
Within this three-dimensional relational framework, the analytical unit (hexagon) is consistent with the two-dimensional maps and jointly characterized by green space provision, pedestrian intensity, and thermal exposure. Specifically, the X-axis represents thermal resistance, measured using land surface temperature (LST) for May and November; the Y-axis represents green provision (supply), reflecting the spatial availability of green resources within pedestrian activity ranges and derived from buffered green space area (consistent with the green proximity measure in Section 3.4.1, expressed as area); and the Z-axis represents pedestrian demand, captured through the spatial intensity of Trail-Weighted Population (TWP) or interconnection degree. At the aggregate level, mapping supply, demand, and environmental resistance into a shared relational space captures the structural configurations underlying walkability equity across the study areas.

4. Results

4.1. Network Patterns of Green Space Accessibility

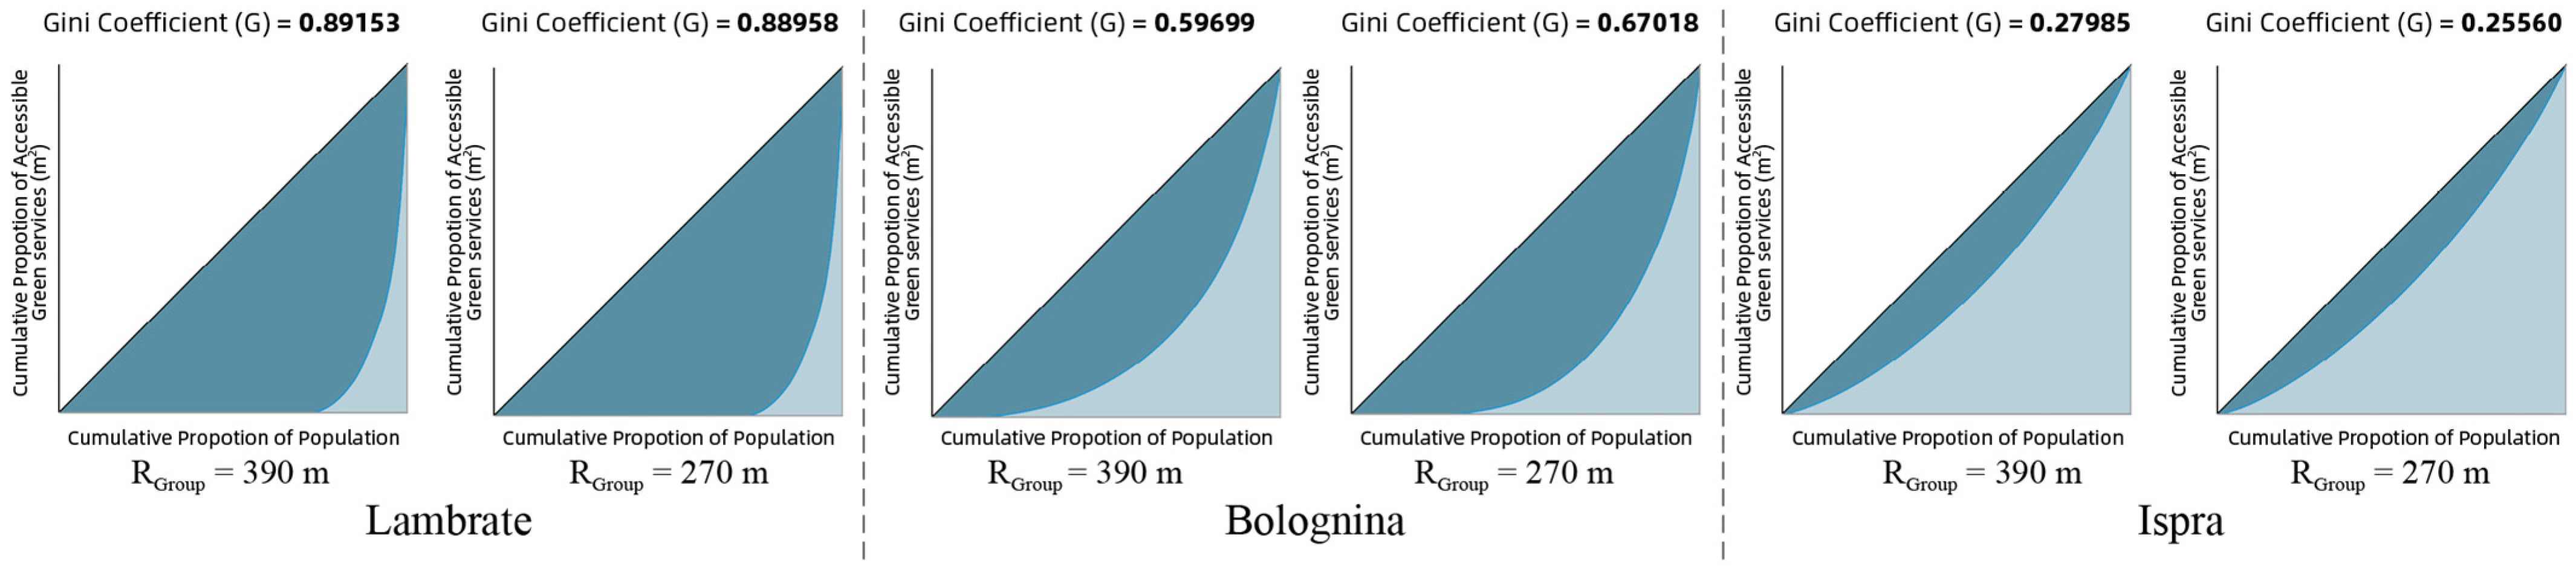
The distribution of public green spaces constitutes a foundational sign of accessibility for different mobility groups. The Gini coefficient is used primarily to characterise the relationship between population (by sample points) and green space (the area of green space within buffers defined by the corresponding RGroup) across the study areas. As shown in Figure 6, Lambrate (the Standard-mobility group and the Mobility-constrained group) exhibits extremely high Gini coefficient values (0.89153 and 0.88958, respectively), indicating a more uneven distribution of natural resources. This pattern is consistent with the presence of major railway infrastructure occupying the central portion of the area, which divides the site into eastern and western zones. In contrast, the other study areas display comparatively lower levels of inequality. Ispra, in particular, shows the most balanced accessibility pattern for both groups (0.27985 and 0.25560), as extensive green spaces are visibly interwoven with residential areas in the input map, which is further reflected in its flatter Lorenz curve. While these aggregate measures provide an overview of distributional equity, they do not yet reflect accessibility as experienced through pedestrian movement.
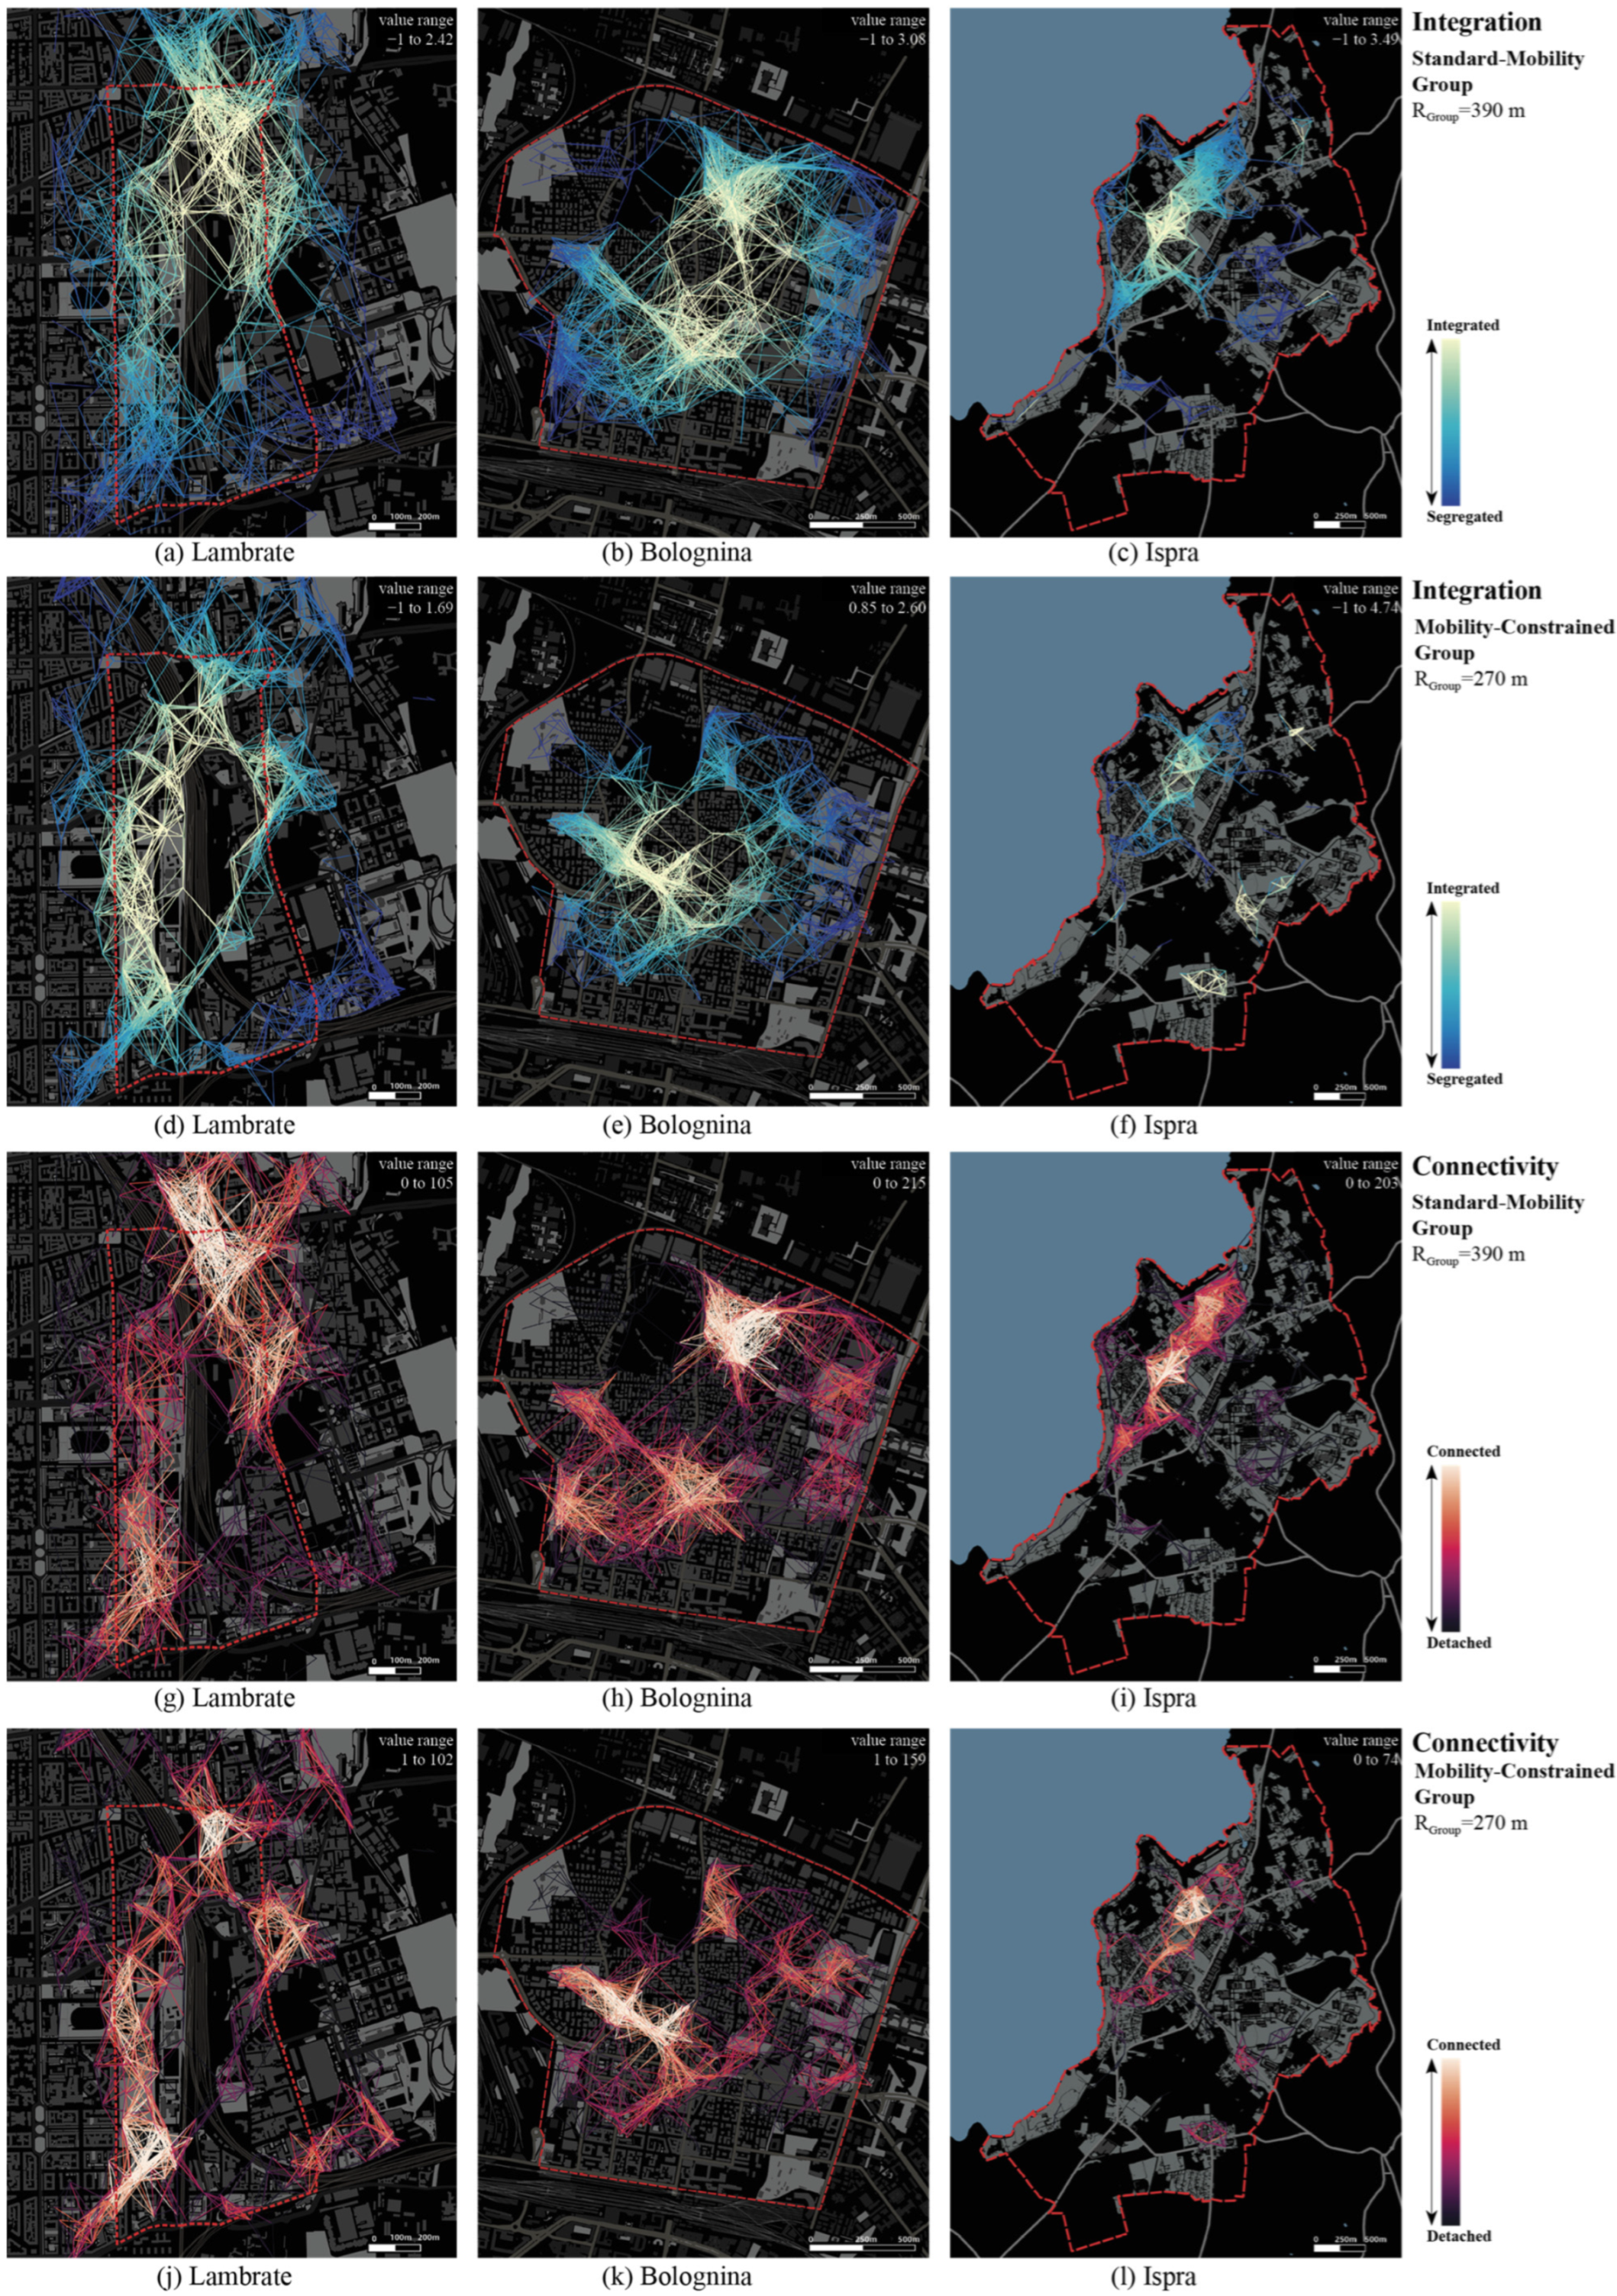
Moving beyond aggregate equity signs, network-based analyses reveal how green spaces are structurally embedded within everyday pedestrian movement. The interconnection networks from ABS were further examined through integration and connectivity analysis using DepthMapX. In Lambrate, higher integration and connectivity values are largely co-located with green spaces, indicating that pedestrian movement is structurally organised around green infrastructure, showing that existing green spaces are effectively utilised within everyday mobility networks. In Ispra, overall connectivity is not low; instead, the interconnection network is predominantly concentrated within residential areas, while distant green spaces are not linked into the main network and tend to form separate clusters, which is more evident for the Constrained-mobility group (Figure 7f). Nevertheless, pedestrian activity remains embedded within a landscape with dense green provision, and pedestrian movement and green space distribution still show a close spatial alignment.
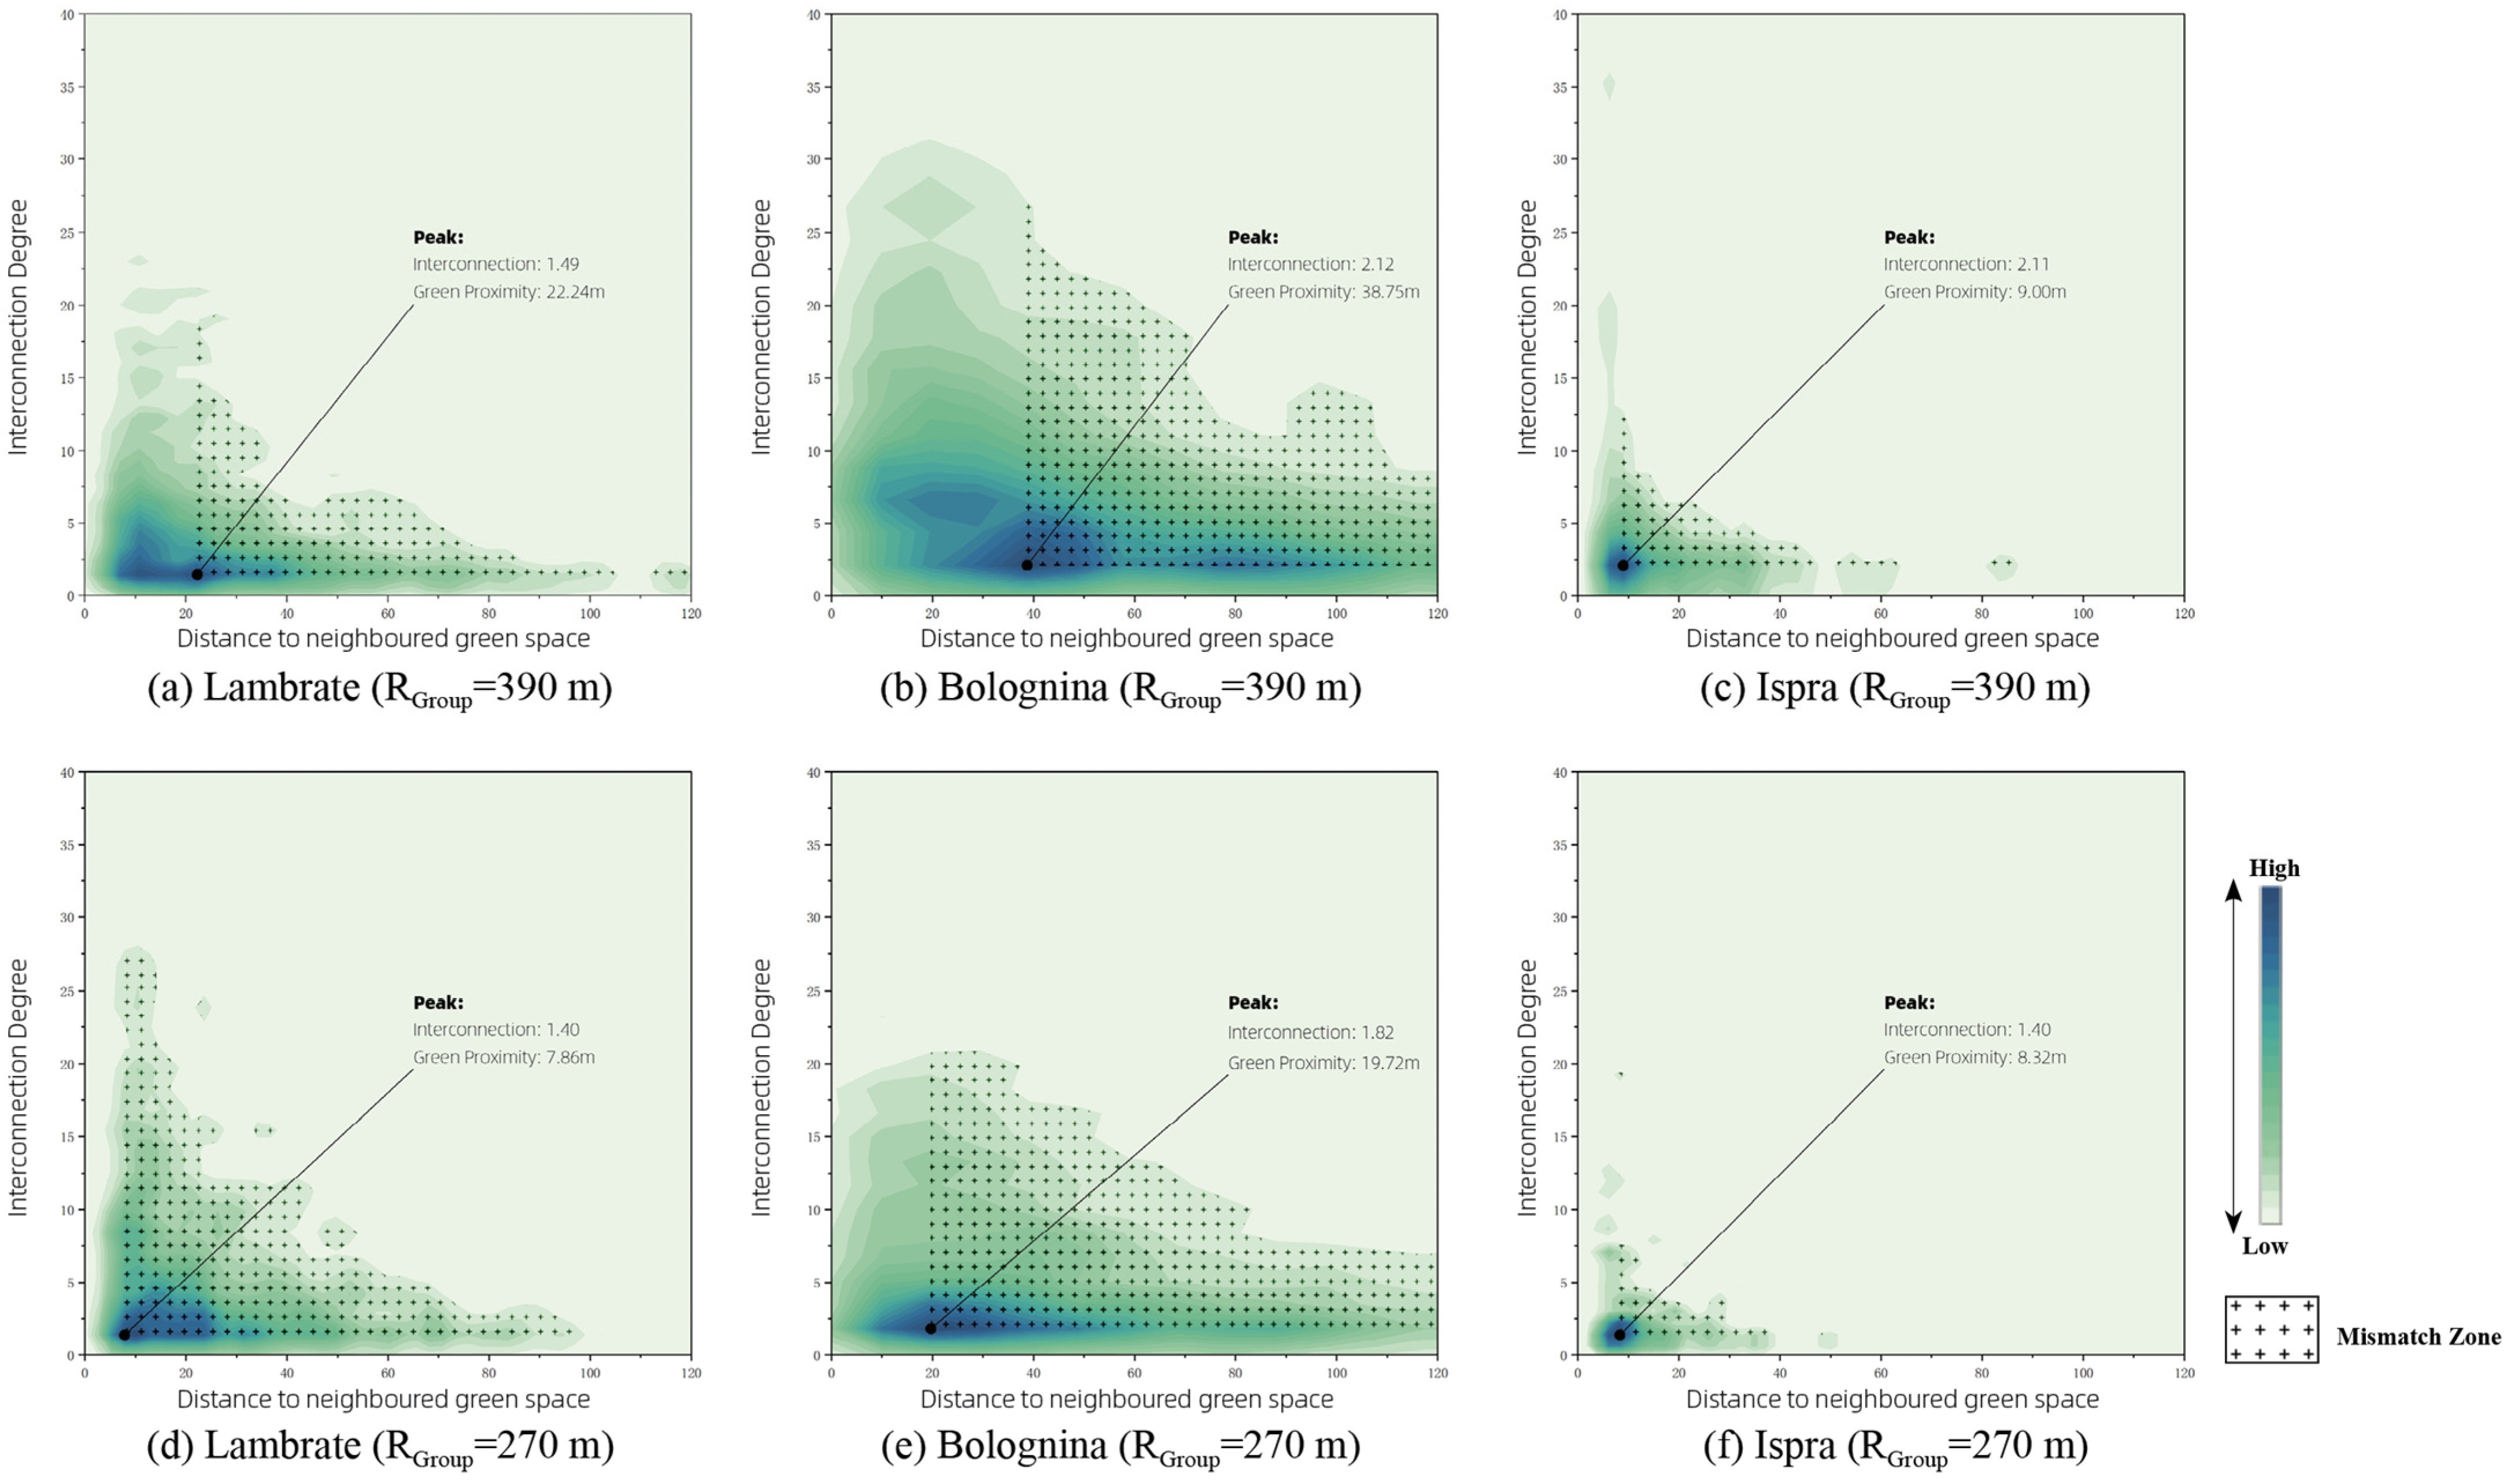
Contrary to the Gini coefficient, Bolognina exhibits a dense interconnection network; however, the result reveals that areas with the highest integration and connectivity are rarely located within major green spaces, but in built-up areas or around fragmented pocket gardens. In other words, pedestrian activity tends to concentrate not inside green spaces, but “on the way to green spaces.” To explain this unexpected pattern, Figure 8 introduces a density-based analysis of interconnection intensity against green proximity (measured as distance to neighbouring green spaces), allowing supply–demand mismatches to be identified. At the relational level, demand–supply mismatches become visible when pedestrian activity intensity is examined in relation to green space proximity.
By sampling the number of the network segments into hexagonal cells and measuring the distance from each cell to the nearest green space, the analysis jointly captures potential pedestrian activity intensity (demand) and green space proximity (supply), enabling an assessment of supply–demand balance across the three cases. When scaled into a unified coordinate system, differences in these relationships become more apparent.
In Bolognina, despite a lower Gini coefficient compared to Lambrate, the density distributions reveal a pronounced mismatch between pedestrian demand and green space provision. High interconnection intensity is predominantly concentrated in areas distant from major green spaces, while green resources are largely located along the perimeter of the study area. As a result, pedestrians form high-intensity activity patterns along routes “on the way to green spaces.” This condition is reflected in the extensive Mismatch Zones observed in Figure 8b,e, where density distributions extend markedly toward higher values along the green proximity axis, indicating that intense pedestrian activity occurs at locations increasingly distant from green spaces relative to pedestrian mobility ranges. These Mismatch Zones, therefore, represent areas where pedestrian activity intensity and green space accessibility are poorly aligned.
In contrast, Ispra exhibits a high level of green space provision combined with the lowest population density among the three cases. Input data (Table 2) indicates a relatively even distribution of green spaces within residential areas, a pattern further supported by Figure 8c,f. Pedestrian activity in Ispra is spatially clustered along internal residential axes, while peripheral green spaces show low or negligible levels of pedestrian interaction. This suggests that under conditions of abundant and evenly distributed green spaces, pedestrian activity tends to remain locally embedded, with limited incentive to access more distant green areas.
Lambrate presents an intermediate and mobility-sensitive pattern. Under mobility-constrained conditions, corresponding to children and elderly groups, peak pedestrian activity occurs close to green spaces (green proximity ≈ 7.86 m), and high-connectivity regions form continuous network structures aligned with green space locations. Under the Standard-mobility condition, however, high-frequency activity areas are less extensive and become spatially divided by railway infrastructure into two distinct clusters. In this case, the peak green proximity shifts outward to approximately 22.24 m, approaching the scale observed in Bolognina for the Constrained-mobility group. These results indicate that while Lambrate maintains a relatively balanced supply–demand relationship overall, its internal spatial configuration responds to variations in pedestrian mobility sensitively, shaping accessibility outcomes differently across mobility groups.

4.2. Spatial Patterns of Pedestrian Thermal Exposure

This section presents a stepwise analysis of pedestrian thermal exposure, combining spatial patterns with seasonal thermal conditions, and focuses on pedestrians’ repeated movements over time. Agent trails are aggregated at the hexagon-cell level and quantified using the Trail Pass-through Index (TPI) and Trail-Weighted Population (TWP). This spatial framing establishes the demand side of pedestrian exposure, with Land Surface Temperature (LST) subsequently considered as the resistance factor shaping the walking conditions. On this basis, heat stress is no longer considered in isolation, but in relation to green space accessibility within everyday walkability.
As illustrated by the trail-based spatial patterns in Figure 9, the three study areas exhibit different spatial patterns of pedestrian exposure. The result of Lambrate shows a pronounced clustered structure (Figure 9a,d), with high-intensity areas forming several continuous activity clusters within residential zones, even including the industrial blocks, whose sampled population is almost zero. This reflects a concentrated but connected spatial pattern of pedestrian movement. In Bolognina, due to its larger population base, overall exposure levels are consistently high, the majority of cells exhibiting TWP values exceeding 400, indicating widespread and sustained high-intensity pedestrian activity (it should be noted that these values represent cumulative potential pedestrian exposure across multiple simulation iterations, rather than the simultaneous presence of all pedestrians in real-world conditions). By contrast, Ispra displays the lowest overall level of pedestrian exposure, with high-exposure cells (TWP > 400) occurring only locally within the core residential areas near the lakeshore, while the remainder of the area is characterised by dispersed pedestrian activity. Together, these differences provide a spatial context for interpreting pedestrian exposure patterns under subsequent thermal conditions.
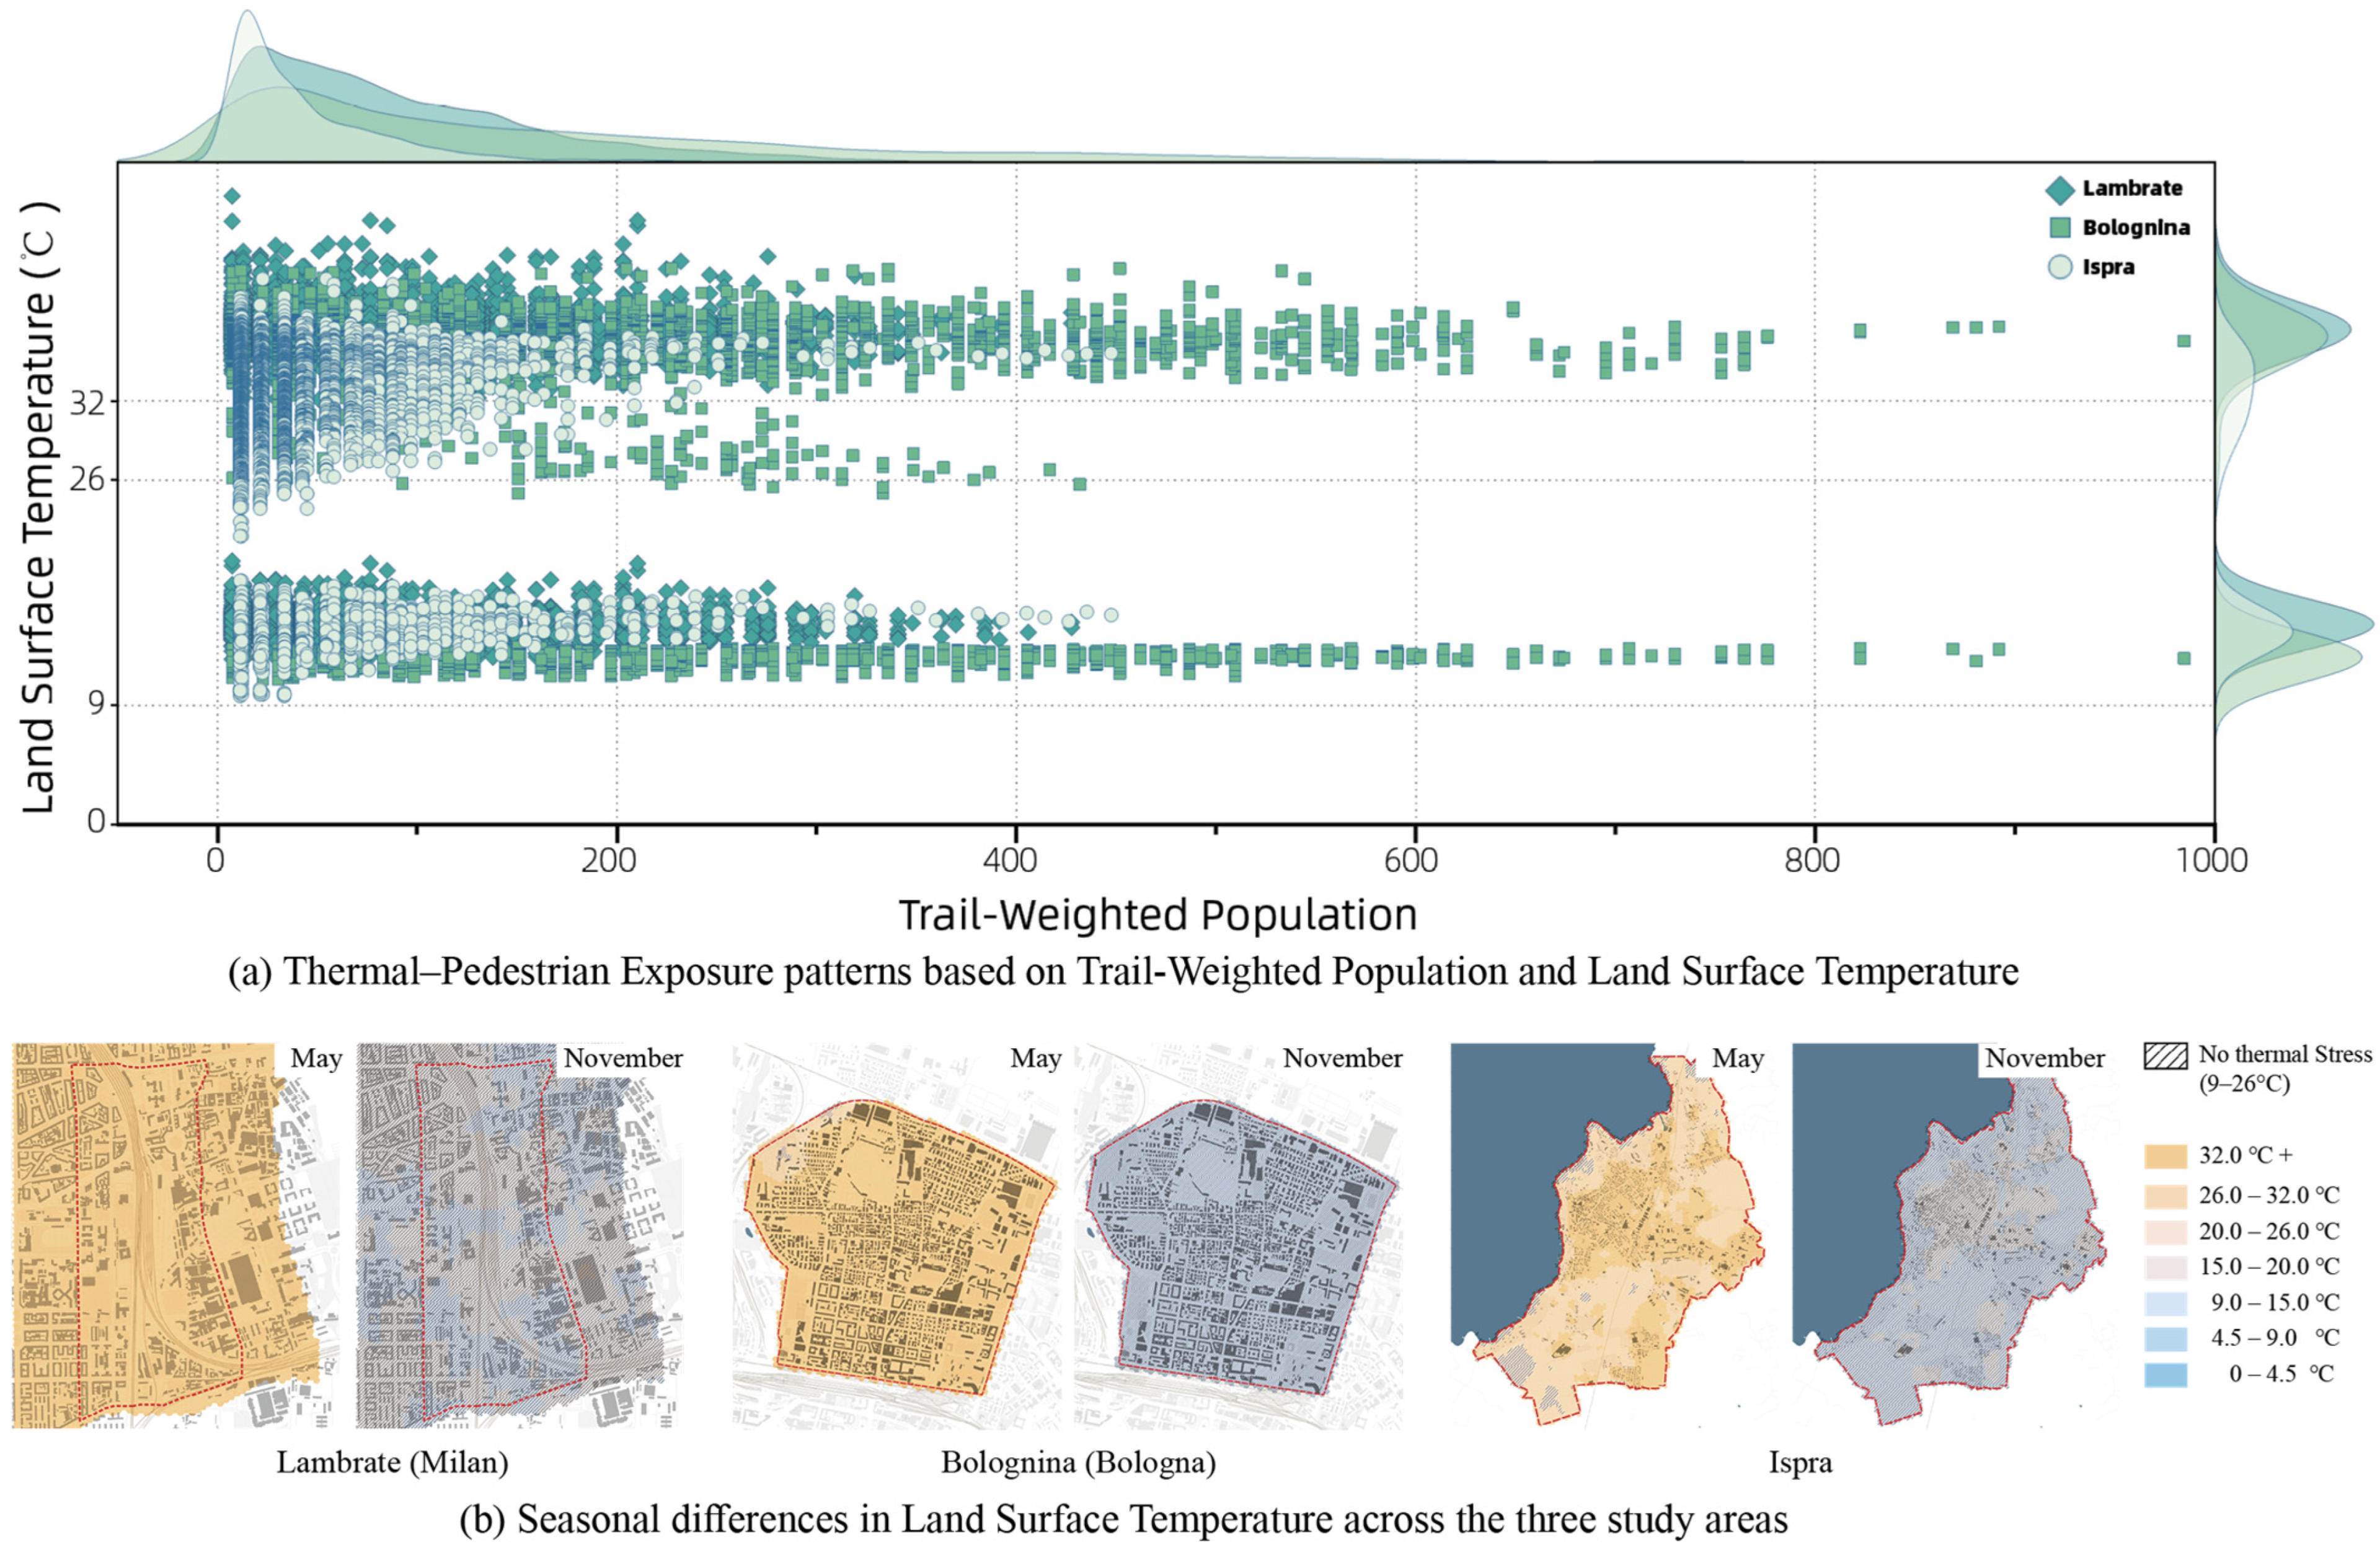
Pedestrian exposure intensity is further examined under thermal environmental conditions by statistically overlaying population (demand) with Land Surface Temperature (resistance) in Figure 10a. The scatter plot relates Trail-Weighted Population (TWP) to seasonal LST, revealing two distinct temperature bands corresponding to the warm (May) and cool (November) conditions. In May (early summer), both Bolognina and Lambrate exhibit broadly distributed pedestrian exposure, with upper-tail extensions to the high heat stress range (≥32 °C) and peaks around 35 °C. By contrast, Ispra shows a lower level of exposure, having more than half of its cells in the moderate heat stress range (26–32 °C). This contrast is further reflected in the proportion of traversed cells falling within the high-heat-stress range (>32 °C), accounting for 100% in Lambrate and 95% in Bolognina, compared with 59% in Ispra.
Importantly, from a distributional perspective, Ispra does not concentrate within a single temperature zone but remains more dispersed, whereas Bolognina and Lambrate display more peaky distributions within higher temperature bands, as indicated by the LST accumulation curves in the right-hand marginal distribution of Figure 10a. The LST accumulation curves for Lambrate and Bolognina are steep and narrow, reflecting a strong concentration of pedestrian exposure within higher temperature ranges. In contrast, Ispra shows a flatter accumulation curve, indicating a more dispersed exposure pattern in which a non-negligible proportion of pedestrians remain under lower thermal stress. However, from an equity perspective, Ispra can be regarded as the least “equal,” since pedestrian exposure is not concentrated within a specific temperature range. This distribution represents an “inequality favorably,” as opposed to the other two cases, that “equal yet stressed” pattern of thermal exposure in Lambrate and Bolognina.
For the November (early winter) conditions, exposure distributions across all three study areas converge markedly. The LST values are largely confined to the 9–26 °C “UTCI no thermal stress” range. Additionally, the Land Surface Temperature is employed here as a comparative and diagnostic indicator of thermal conditions along pedestrian routes, rather than as a direct measure of perceived thermal comfort, which may be influenced by wind, humidity, shading, and individual physiological factors.

4.3. Three-Dimensional Synthesis of Green Accessibility and Thermal Exposure

To summarize the structural relationship between green space provision, pedestrian exposure intensity, and thermal condition, a three-dimensional synthesis is introduced. It integrates the key results from the previous analysis into a unified relational coordinate, allowing compound exposure patterns to be clearly observed beyond one- or two-dimensional analysis. Following the definition, the Land Surface Temperature (x-axis) reflects the thermal resistance; green space provision (y-axis) is described as the effective supply accessible within daily walking ranges (RGroup); and Trail-Weighted Population (z-axis) represents the scale of pedestrian exposure as demand. Across the three study areas, the supply dimension shows a clear contrast: average green provision within the 5 min walking range is 5.4% in Lambrate, 7.2% in Bolognina, and 37% in Ispra.
In Figure 11, the three-dimensional diagram reveals distinct exposure configurations remarkably across the three study cases. In Lambrate, the point cloud is separated into two distinct clusters corresponding to the Standard-mobility group (RGroup = 390 m) and the Mobility-constrained group (RGroup = 270 m). Higher exposure of children and elderly people is concentrated where moderated green space provision coincides with relatively elevated thermal resistance, while Standard-mobility pedestrians exhibit closer to higher green space provision conditions. This indicates that the inequities in Lambrate are shaped primarily by group-specific mobility (behavior-sensitive) constraints rather than overall green space distribution. By contrast, Bolognina shows a tall and strongly skewed configuration, where high pedestrian demand overlaps persistently with limited green space provision and higher heat stress, especially in May. This result reflects a demand-intensive but supply-constrained pattern, consistent with the previously identified “equal but insufficient” pattern. Ispra, in comparison, displays the flattest and most dispersed distribution. Most of its cells are characterized by low pedestrian exposure and mild thermal resistance. The urban green spaces contribute abundantly, although localized high-exposure points still emerge within residential cores, which is consistent with the result of Figure 9f in Section 4.2.
Overall, Figure 11 demonstrates that pedestrian heat exposure in urban green space contexts emerges as a structural outcome shaped by the combined configuration of green space provision, pedestrian activity intensity, and thermal conditions. Within this relational space, different configurations can be interpreted diagnostically across the study areas. Areas characterized by high pedestrian demand, limited green space provision, and elevated thermal resistance indicate conditions of spatial stress and potential inequity. In planning terms, such configurations point to areas where everyday accessibility is under pressure and where vulnerable groups may be disproportionately exposed to thermal burden. By contrast, configurations with low demand and high provision suggest relative redundancy or underutilization, indicating that existing green resources may be weakly integrated into everyday movement patterns or insufficiently connected to surrounding residential areas. Intermediate conditions reflect varying degrees of balance between accessibility and exposure, but may still reveal context-specific tensions between pedestrian intensity, environmental support, and thermal comfort. As a diagnostic reading, these relational configurations help identify possible planning attentions, including the need to reduce accessibility pressure, improve the spatial integration of existing green resources, or strengthen the climatic support of walking environments. Taken together, these relational patterns provide an analytical basis for comparative diagnosis across the study areas.

5. Discussion

The UN Sustainable Development Goals, especially SDG 10, put the “Reduced Inequalities” at the focal point of global and urban development, emphasizing the guiding principles for development based on age, sex, physical ability, and so on. Within this framework, equity is no longer a normative ideal but a directional objective for taking actions. In the context of urban design, this shift implies that equity should not be understood as a simplistic notion of “equal distribution,” but as an attention to how different people, starting from different conditions, are able to access, use, and experience urban space. This is also closely aligned with SDG 11, which frames sustainable cities as places with inclusivity, accessibility, and everyday livability. In relation to the research question and goals of conducting this study, the following discussion examines how the interaction between green space provision, pedestrian mobility, and thermal conditions produces differentiated accessibility and exposure patterns, thus explaining the relational nature of urban inequality observed in the results.

5.1. Methodological Implications: ABS as a Computational Diagnostic Tool

This study reflects on the methodological positioning of agent-based simulation (ABS) within the overall research framework. ABS is not only employed as a general analytical or interpretative framework, but is explicitly used to generate dynamic pedestrian movement and exposure, and further serves as front-end inputs for subsequent structural analysis and diagnosis. As a diagnostic-oriented methodological module, this framework aims to reveal potential patterns of inequality through the simulation of behavioural processes, rather than to directly produce normative policy evaluations or planning solutions. Its core contribution lies in obtaining a process-based understanding of how behaviour unfolds within a specific context before structural interpretation and intervention are undertaken. Nevertheless, the diagnostic outputs may help planners identify areas where age-sensitive accessibility, green space provision, and thermal vulnerability are structurally misaligned, thereby supporting more targeted and context-aware planning attention.
At the level of methodological implementation, Physarealm, as a lightweight ABS tool, is used to simulate pedestrian movement driven by urban morphological characteristics under conditions of relatively limited input data, generating dynamic trajectories and exposure outcomes that extend beyond single time-sliced representations. These simulation outputs function as input data for subsequent space syntax analysis. By projecting and processing simulated paths within the network, dynamic behavioural outcomes are reorganised and interpreted at the network scale. This methodological positioning highlights the value of ABS as a complementary analytical component within open urban data science workflows, while establishing a methodological dialogue with existing studies [53] that commonly adopt space syntax as a structural input prior to agent-based modelling. Rather than replicating this sequence, the present study reverses the order by first generating behavioural processes and then applying structural processing, thereby further demonstrating the flexibility of ABS/ABM as an analytical tool in methodological composition and sequencing.
Within this methodological chain, ABS primarily fulfils a process-generating function, while space syntax analysis is employed to structurally process the simulated outcomes, together forming the basis for the final diagnostic stage. Compared with static accessibility indicators, this Simulation—Interpretation—Diagnosis workflow allows environmental resistance to be more clearly identified in terms of how it reshapes effective accessibility and exposure patterns, particularly for population groups with constrained mobility ranges.
It is important to note that the present study does not aim to validate the ABS model in a predictive sense. Model reliability is supported through the consistency and stability of the emergent spatial patterns, as examined by convergence analysis and comparison with conventional accessibility measures (Appendix A.1 and Appendix A.3). It reflects the diagnostic logic of the approach, where the emphasis lies on revealing relational structural configurations rather than reproducing exact empirical behaviours. Nevertheless, the absence of direct calibration with observed pedestrian data remains a limitation, and future research may incorporate pedestrian movement datasets.

5.2. Beyond Structural Equity: Relational Accessibility and Lived Experience

The results of this research reveal a phenomenon frequently neglected in planning and spatial studies, that structural equity does not always guarantee equitable living experiences. Taking the case of Bolognina as an example, even though urban green spaces seem fairly balanced by statistical values (Gini coefficient) and structure distribution, inequality emerges in a more contextualized and localized form once pedestrian mobility patterns and thermal exposure join. These findings push the discussion of “equality” beyond resource or infrastructure allocation toward a more human-centered standpoint, echoing the growing research attention to dynamic accessibility metrics and movement-based experiences [20,21].
Moving beyond the dualistic understanding, urban inequality does not come from the inadequacy of any singular component, but specific configurations of supply, demand, and resistance. The three-dimensional analysis further demonstrates: inequality across different areas cannot be explained by the amount of green space or population level only, but is shaped comprehensively by green space accessibility, pedestrian intensity, and thermal exposure together [41]. When accepting this perspective, inequality is no longer a (one-dimensional) homogeneity-heterogeneity problem, but a (multi-dimensional) relational condition that calls for systemic interpretations.
From a systemic perspective, when cities are understood as complex systems, analyses based on single measures or statistics exhibit their limitations. This research integrates pedestrian behavior with environmental variables, introducing the relational diagnosis as its main approach, addressing the concerns of single-population or average-based metrics [21,39]. Instead of defining a judgment of whether a city is “equitable” or not, this approach focuses on uncovering misalignments, allowing patterns of mismatch, which usually remain invisible in indicator-based analyses, to emerge. And further contributes to the literature by proposing a relational framework that integrates pedestrian behavior, green space accessibility, and thermal conditions to assess walkability equity [42,43].

5.3. Relational Diagnosis as a Planning-Relevant Analytical Perspective

As a diagnostic tool, this methodological framework is intended to identify and interpret the patterns of inequality rather than producing normative policy evaluations or planning solutions directly. It highlights the importance of understanding the structural configuration of multiple components within a specific context before moving toward strategic design or intervention. Due to the diagnostic nature, the applicability is subject to certain conditions. The analytical outcomes depend on the spatial scale and resolution of the input data. And during the ABS, building blocks and major roads are taken as spatial obstacles, whereas the thermal environment is incorporated through observed LST overlaid onto the simulation results. The combination of different data sources and modeling assumptions, therefore, defines the current interpretative boundaries. In addition, the three cases in this study are all located in northern Italy, where climatic seasonality is more pronounced, so that caution is required when extending to other climatic or urban contexts. This study provides an open analytical interface for future research. Further studies may extend and test by introducing additional types of pedestrian behavior variables and more complex environmental conditions, such as road slope or extreme climate events, thereby assessing its adaptability and explanatory capacity across diverse urban contexts. Factors such as perceived safety, comfort, spatial preference, and health-related motivations for using green spaces may also influence everyday accessibility and should be considered in future developments of the framework, especially in connection with broader human health and One Health approaches to urban green space use.
A further point concerns the sensitivity of the diagnostic outputs to the key parameters embedded in the model. The results are influenced by key model parameters, including walking radii, speed differentiation, NDVI thresholds, and green space weighting. While these parameters are grounded in the literature and specified to reflect realistic urban conditions, variations may affect the spatial intensity and distribution of simulated patterns. However, the overall relational structure of supply–demand–resistance configurations remains robust, as the framework is designed to identify diagnostic patterns rather than produce precise predictive results. Given the dynamic nature of the ABS model, the analytical value of the simulation lies in the emergent differences in pattern strength, clustering, and intensity across the study areas. In this sense, the robustness of the approach is based on its capacity to unveil systemic relationships, rather than on the precise calibration of individual parameters.

6. Conclusions

This paper proposes a relational diagnostic approach, implemented through Agent-Based Simulation (ABS), to examine urban green space equity through the lens of pedestrian behavior and thermal conditions, demonstrating that urban inequality is shaped by not only single factors or static spatial distribution, but by specific relational configurations between supply, demand, and environmental resistance. Empirically, the study shows that apparent equity in green space quantity does not guarantee equitable pedestrian experiences under everyday thermal conditions; methodologically, it advances a relational diagnostic framework that integrates pedestrian behavior and climate exposure; and conceptually, it reframes urban equity as a systemic and relational condition rather than a distributive outcome.
By explicitly modeling pedestrian behavior and its interaction with thermal conditions, the research shifts the discussion of equity from an evaluative issue to a systemic comprehension. The findings show that areas appearing equitable in terms of green space quantity may still produce uneven lived experiences for different pedestrians under everyday thermal conditions, underscoring the importance of a human-centered perspective. Rather than functioning as a normative evaluative tool, the proposed framework offers a novel analytical diagnostic pathway for identifying inequality patterns in complex urban contexts and lays the foundation for future research that may further engage with design or policy objectives across diverse urban settings.

Supplementary Materials

The complete set of data, tables, and maps can be accessed at https://drive.google.com/drive/folders/1Tt3ebIqzodm2RyNW2Ahk2PMAtSIVq5hY?usp=sharing (accessed on 31 January 2026).

Author Contributions

T.D.: Writing—original draft, Conceptualization, Methodology, Investigation, Visualization, Formal analysis, Software. M.T.: Conceptualization, Methodology, Project administration, Supervision, Validation, Writing—review & editing. All authors have read and agreed to the published version of the manuscript.

Funding

T. Dong is supported by the China Scholarship Council (CSC) doctoral fellowship under Grant No. 202107820015. No additional external funding was received for this research.

Data Availability Statement

The original contributions presented in this study are included in the article/Supplementary Materials. Further inquiries can be directed to the corresponding authors.

Acknowledgments

During the preparation of this manuscript/study, the authors used ChatGPT-4o for the purposes of grammar editing and spelling. In Section 2 and Section 3, ChatGPT-4o was used to translate Italian data sources. Beyond these, no additional AI functions were applied, and no references or theories were fabricated. The authors have reviewed and edited all outputs and take full responsibility for the content of this publication.

Conflicts of Interest

The authors declare no conflicts of interest.

Abbreviations

The following abbreviations are used in this manuscript:
ABSAgent-Based Simulation
ABMAgent-Based Model
TPITrail Pass-through Index
TWPTrail-Weighted Population
LSTLand Surface Temperature
UTCIUniversal Thermal Climate Index
PCAPrincipal Component Analysis
SDGsSustainable Development Goals
UHIUrban Heat Island

Appendix A

Appendix A.1. Model Stability and Convergence Behavior

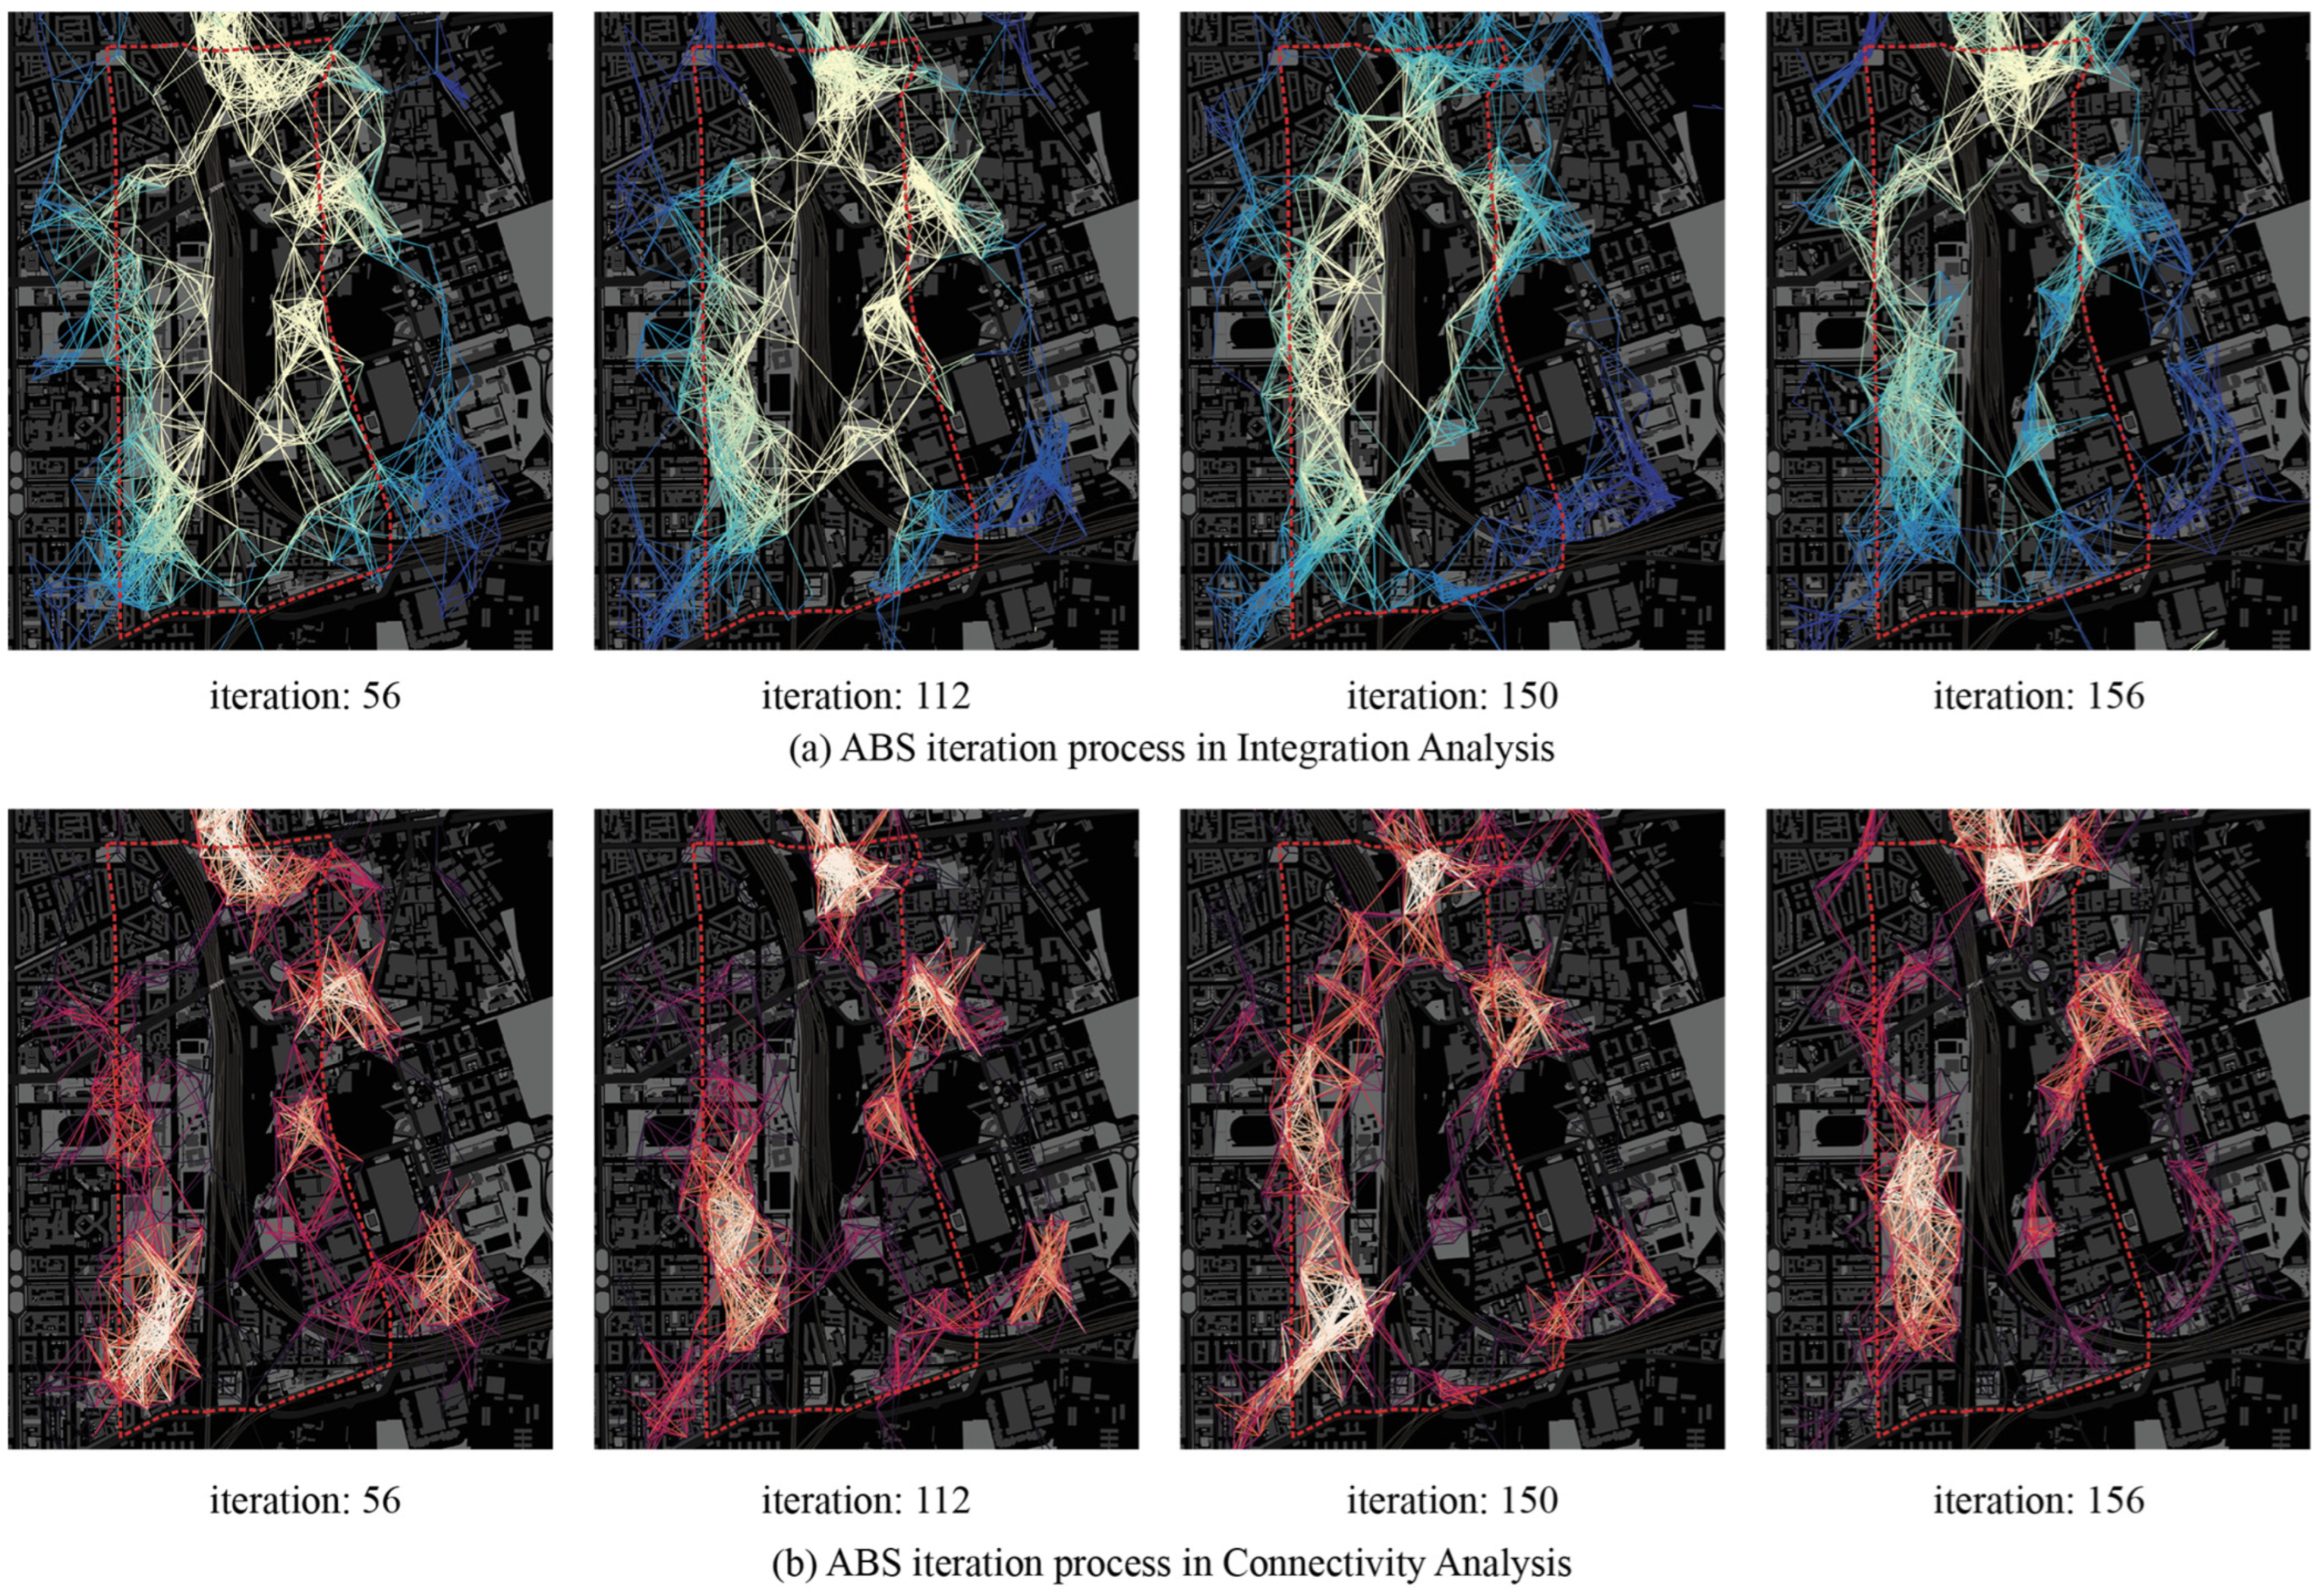
To illustrate the stabilization behavior of the Agent-Based Simulation model used in this research, Figure A1 presents the evolution of interconnection patterns for the Mobility-constrained group (RGroup = 270 m) in the Lambrate case. This example illustrates the progressive formation and consolidation of green space interconnection patterns by potential pedestrian movement during the simulation process. Stability in this study is defined as the convergence of the macroscopic spatial pattern of the interconnection pattern, where additional iterations no longer produce obvious changes in the dominant interconnection structure or density distribution. From approximately iteration 50 onward, the dominant pattern becomes stable, with subsequent iterations primarily intensifying existing paths rather than altering their overall spatial configuration. Based on this convergence behavior, the simulation results between iterations 50 and 150 are used for subsequent analyses.
Figure A1. Evolution of Interconnection patterns across successive iteration windows.
Smartcities 09 00097 g0a1

Appendix A.2. Temporal Slicing and Reproducibility

As Supplementary Materials, Figure A2 presents the agent trails of the Mobility-constrained group (RGroup = 270 m) extracted from the stabilized phase of the simulation (iterations 50–150), using time slices corresponding to 5, 10, and 15 min walking durations. This figure supports the methodological assumption that simulation outputs obtained after the stabilization phase are consistent under fixed parameter settings and can be reliably used for subsequent analysis.
Figure A2. Agent trails extracted from the stabilized simulation phase (iterations 50–150).
Smartcities 09 00097 g0a2

Appendix A.3. External Comparison with Traditional Distance-Based Simulation

To contextualize the behavior of the proposed ABS model, an external comparison was conducted with the traditional distance-based accessibility measure as a reference. This external comparison is introduced as an interpretive reference rather than a validation exercise, with the aim of situating the ABS outputs relative to a widely used distance-based accessibility measure. Figure A3a is the result of ABS trail simulation, and Figure A3b shows the shortest distance from each hexagon center to the nearest public green space. The spatial correspondence between high trail density and high green proximity zones suggests a consistency between the two simulation results (Figure A3c). Additionally, a statistically significant Spearman correlation (ρ = −0.718, p < 0.0001) indicates a strong monotonic association between these two simulation methods (Figure A3d). This comparison does not aim to validate predictive accuracy, but to demonstrate that the ABS model produces interpretable and structurally coherent patterns relative to a widely used baseline.
Figure A3. External comparison of ABS model output with the shortest-path proximity.
Smartcities 09 00097 g0a3
Table A1. Descriptive Statistics.
VariableNMeanSDSumMinimumMaximum
ABS (Trail Pass-through Index)26670.008510.0108122.70600.058
Green Space Proximity (Shortest Distance)266735.2774834.8945194,085.040150.00339268.56078
Table A2. Spearman Correlation.
VariableABS (Trail Pass-Through Index)Green Space Proximity (Shortest Distance)
ABS (Trail Pass-through Index)1−0.71843
p-value<0.0001
Green Space Proximity (Shortest
Distance)
−0.718431
p-value<0.0001

References

  1. Ewing, R.; Handy, S. Measuring the Unmeasurable: Urban Design Qualities Related to Walkability. J. Urban Des. 2009, 14, 65–84. [Google Scholar] [CrossRef]
  2. Forsyth, A. What is a walkable place? The walkability debate in urban design. Urban Des. Int. 2015, 20, 274–292. [Google Scholar] [CrossRef]
  3. United Nations Economic Commission for Europe. A Handbook on Sustainable Urban Mobility and Spatial Planning: Promoting Active Mobility; United Nations: New York, NY, USA, 2020. [Google Scholar] [CrossRef]
  4. Chiesura, A. The role of urban parks for the sustainable city. Landsc. Urban Plan. 2004, 68, 129–138. [Google Scholar] [CrossRef]
  5. Green Urbanism: Learning from European Cities; Island Press: Washington, DC, USA, 2000.
  6. Wolch, J.R.; Byrne, J.; Newell, J.P. Urban green space, public health, and environmental justice: The challenge of making cities ‘just green enough‘. Landsc. Urban Plan. 2014, 125, 234–244. [Google Scholar] [CrossRef]
  7. Norton, B.A.; Coutts, A.M.; Livesley, S.J.; Harris, R.J.; Hunter, A.M.; Williams, N.S.G. Planning for cooler cities: A framework to prioritise green infrastructure to mitigate high temperatures in urban landscapes. Landsc. Urban Plan. 2015, 134, 127–138. [Google Scholar] [CrossRef]
  8. Pham, T.-T.-H.; Lachapelle, U. Who participates in greening everyday urban space? Understanding community-led urban greening through the case of the Green Alleys of Montréal (Canada). Landsc. Urban Plan. 2026, 266, 105533. [Google Scholar] [CrossRef]
  9. Li, X.; Zhang, C.; Li, W.; Kuzovkina, Y.A. Environmental inequities in terms of different types of urban greenery in Hartford, Connecticut. Urban For. Urban Green. 2016, 18, 163–172. [Google Scholar] [CrossRef]
  10. Dong, T.; Tadi, M. Digital Twin-Assisted Urban Resilience: A Data-Driven Framework for Sustainable Regeneration in Paranoá, Brasilia. Urban Sci. 2025, 9, 333. [Google Scholar] [CrossRef]
  11. Xiao, Y.; Cen, L. Do new urban parks really improve green equity? A longitudinal analysis of Shanghai (2000–2020). Landsc. Urban Plan. 2026, 265, 105519. [Google Scholar] [CrossRef]
  12. Anguelovski, I.; Connolly, J.J.T.; Masip, L.; Pearsall, H. Assessing green gentrification in historically disenfranchised neighborhoods: A longitudinal and spatial analysis of Barcelona. Urban Geogr. 2018, 39, 458–491. [Google Scholar] [CrossRef]
  13. Montgomery, J. Making a city: Urbanity, vitality and urban design. J. Urban Des. 1998, 3, 93–116. [Google Scholar] [CrossRef]
  14. Grimm, N.B.; Faeth, S.H.; Golubiewski, N.E.; Redman, C.L.; Wu, J.; Bai, X.; Briggs, J.M. Global Change and the Ecology of Cities. Science 2008, 319, 756–760. [Google Scholar] [CrossRef]
  15. Hunter, R.F.; Cleland, C.; Cleary, A.; Droomers, M.; Wheeler, B.W.; Sinnett, D.; Nieuwenhuijsen, M.J.; Braubach, M. Environmental, health, wellbeing, social and equity effects of urban green space interventions: A meta-narrative evidence synthesis. Environ. Int. 2019, 130, 104923. [Google Scholar] [CrossRef]
  16. Gupta, K.; Ghale, B.; Sarath, R.; Kaur, R.; Roy, A. Understanding the Role of Blue-Green Infrastructure in Abatement of Urban Heat Island Effect. In Blue-Green Infrastructure for Sustainable Urban Settlements: Implications for Developing Countries Under Climate Change; Joshi, P.K., Rao, K.S., Bhadouria, R., Tripathi, S., Singh, R., Eds.; Springer: Cham, Switzerland, 2024; pp. 83–109. [Google Scholar]
  17. Ben Amor, A.; Hemmami, H.; Zeghoud, S.; Ben Amor, I. Strength and Limitation of Nature-Based Solutions Towards Adaptation and Mitigation of Climate Change in Developing Countries. In Blue-Green Infrastructure for Sustainable Urban Settlements: Implications for Developing Countries Under Climate Change; Joshi, P.K., Rao, K.S., Bhadouria, R., Tripathi, S., Singh, R., Eds.; Springer: Cham, Switzerland, 2024; pp. 3–30. [Google Scholar]
  18. De Ridder, K.; Adamec, V.; Bañuelos, A.; Bruse, M.; Bürger, M.; Damsgaard, O.; Dufek, J.; Hirsch, J.; Lefebre, F.; Pérez-Lacorzana, J.M.; et al. An integrated methodology to assess the benefits of urban green space. Sci. Total Environ. 2004, 334–335, 489–497. [Google Scholar] [CrossRef]
  19. Wu, J. Urban ecology and sustainability: The state-of-the-science and future directions. Landsc. Urban Plan. 2014, 125, 209–221. [Google Scholar] [CrossRef]
  20. Geurs, K.T.; Van Wee, B. Accessibility evaluation of land-use and transport strategies: Review and research directions. J. Transp. Geogr. 2004, 12, 127–140. [Google Scholar] [CrossRef]
  21. Guo, S.; Song, C.; Pei, T.; Liu, Y.; Ma, T.; Du, Y.; Chen, J.; Fan, Z.; Tang, X.; Peng, Y.; et al. Accessibility to urban parks for elderly residents: Perspectives from mobile phone data. Landsc. Urban Plan. 2019, 191, 103642. [Google Scholar] [CrossRef]
  22. Xing, L.; Liu, Y.; Liu, X. Measuring spatial disparity in accessibility with a multi-mode method based on park green spaces classification in Wuhan, China. Appl. Geogr. 2018, 94, 251–261. [Google Scholar] [CrossRef]
  23. Biraghi, C.A.; Ogut, O.; Dong, T.; Tadi, M. CityTime: A Novel Model to Redefine the 15-Minute City Globally Through Urban Diversity and Proximity. Urban Sci. 2025, 9, 36. [Google Scholar] [CrossRef]
  24. Dong, T.; Tadi, M.; Tesfaye, S.T. Unveiling Hidden Green Corridors: An Agent-Based Simulation (ABS) of Urban Green Continuity for Ecosystem Services and Climate Resilience. Smart Cities 2025, 8, 163. [Google Scholar] [CrossRef]
  25. Zhou, Y.; Zhao, H.; Luo, Y.; Yi, X.; Lun, F. Exploring the inequality in urban parks’ distribution and their cooling effects from the perspective of urbanization. Landsc. Urban Plan. 2025, 260, 105390. [Google Scholar] [CrossRef]
  26. Xie, M.; Gao, Y.; Cao, Y.; Breuste, J.; Fu, M.; Tong, D. Dynamics and Temperature Regulation Function of Urban Green Connectivity. J. Urban Plan. Dev. 2015, 141, A5014008. [Google Scholar] [CrossRef]
  27. Southworth, M. Designing the Walkable City. J. Urban Plan. Dev. 2005, 131, 246–257. [Google Scholar] [CrossRef]
  28. Gehl, J. Cities for People; Island Press: Washington, DC, USA, 2010. [Google Scholar]
  29. Steptoe, A.; Breeze, E.; Banks, J.; Nazroo, J. Cohort Profile: The English Longitudinal Study of Ageing. Int. J. Epidemiol. 2013, 42, 1640–1648. [Google Scholar] [CrossRef]
  30. Van Cauwenberg, J.; Clarys, P.; De Bourdeaudhuij, I.; Ghekiere, A.; De Geus, B.; Owen, N.; Deforche, B. Environmental influences on older adults’ transportation cycling experiences: A study using bike-along interviews. Landsc. Urban Plan. 2018, 169, 37–46. [Google Scholar] [CrossRef]
  31. Gilroy, R. Places that Support Human Flourishing: Lessons from Later Life. Plan. Theory Pract. 2008, 9, 145–163. [Google Scholar] [CrossRef]
  32. Liu, X.; Song, Y.; Wu, K.; Wang, J.; Li, D.; Long, Y. Understanding urban China with open data. Cities 2015, 47, 53–61. [Google Scholar] [CrossRef]
  33. Ye, Y.; Li, D.; Liu, X. How block density and typology affect urban vitality: An exploratory analysis in Shenzhen, China. Urban Geogr. 2018, 39, 631–652. [Google Scholar] [CrossRef]
  34. Stanford, H.R.; Hurley, J.; Garrard, G.E.; Kirk, H. Exploring the secret gardens of the city: An assessment of human-nature interactions on informal green space using citizen science data. Urban For. Urban Green. 2024, 98, 128414. [Google Scholar] [CrossRef]
  35. Lucas, K. Transport and social exclusion: Where are we now? Transp. Policy 2012, 20, 105–113. [Google Scholar] [CrossRef]
  36. Lamíquiz, P.J.; López-Domínguez, J. Effects of built environment on walking at the neighbourhood scale. A new role for street networks by modelling their configurational accessibility? Transp. Res. Part A Policy Pract. 2015, 74, 148–163. [Google Scholar] [CrossRef]
  37. Biraghi, C.A.; Zadeh, H.M.; Bruschi, A.; Tadi, M. Reclaiming Urban Spaces: A Systemic Approach to Integrated Pedestrian-Centric City Design in Rio de Janeiro. UP 2025, 10, 9703. [Google Scholar] [CrossRef]
  38. Lopes, M.N.; Camanho, A.S. Public Green Space Use and Consequences on Urban Vitality: An Assessment of European Cities. Soc. Indic. Res. 2013, 113, 751–767. [Google Scholar] [CrossRef]
  39. Luber, G.; McGeehin, M. Climate Change and Extreme Heat Events. Am. J. Prev. Med. 2008, 35, 429–435. [Google Scholar] [CrossRef] [PubMed]
  40. Adorno, B.V.; Pereira, R.H.M.; Amaral, S. Combining spatial clustering and spatial regression models to understand distributional inequities in access to urban green spaces. Landsc. Urban Plan. 2025, 256, 105297. [Google Scholar] [CrossRef]
  41. Páez, A.; Scott, D.M.; Morency, C. Measuring accessibility: Positive and normative implementations of various accessibility indicators. J. Transp. Geogr. 2012, 25, 141–153. [Google Scholar] [CrossRef]
  42. Checker, M. Wiped Out by the “Greenwave”: Environmental Gentrification and the Paradoxical Politics of Urban Sustainability. City Soc. 2011, 23, 210–229. [Google Scholar] [CrossRef]
  43. Parker, J.; Simpson, G.D. Public Green Infrastructure Contributes to City Livability: A Systematic Quantitative Review. Land 2018, 7, 161. [Google Scholar] [CrossRef]
  44. Dong, T.; Colucci, A.; Tadi, M. Systemic Action Network for Improving Blue–Green Infrastructure Based on the Natural Capital Investigation: The Strategic Plan in Vlorë, Albania. In Blue-Green Infrastructure for Sustainable Urban Settlements; Joshi, P.K., Rao, K.S., Bhadouria, R., Tripathi, S., Singh, R., Eds.; Springer: Cham, Switzerland, 2024; pp. 387–412. [Google Scholar] [CrossRef]
  45. United Nations. System of Environmental-Economic Accounting: Ecosystem Accounting; International Monetary Fund: Washington, DC, USA, 2025. [Google Scholar] [CrossRef]
  46. Martin, A.J.F.; Conway, T.M. Using the Gini Index to quantify urban green inequality: A systematic review and recommended reporting standards. Landsc. Urban Plan. 2025, 254, 105231. [Google Scholar] [CrossRef]
  47. Song, D.-X.; Zhong, D.; Chen, Z.; Qi, S.; Wang, C.; Yao, J.; He, T. A satellite perspective of interannual and seasonal variations in greenspace and human exposure over urban and peri-urban areas in Chinese cities from 2000 to 2020. Landsc. Urban Plan. 2025, 259, 105354. [Google Scholar] [CrossRef]
  48. Shan, L.; He, S. The role of peri-urban parks in enhancing urban green spaces accessibility in high-density contexts: An environmental justice perspective. Landsc. Urban Plan. 2025, 254, 105244. [Google Scholar] [CrossRef]
  49. Cheliotis, K. An agent-based model of public space use. Comput. Environ. Urban Syst. 2020, 81, 101476. [Google Scholar] [CrossRef]
  50. Bonabeau, E. Agent-based modeling: Methods and techniques for simulating human systems. Proc. Natl. Acad. Sci. USA 2002, 99, 7280–7287. [Google Scholar] [CrossRef]
  51. Hwang, S.; Rhim, H.; Kang, J.-Y.; Choi, J. Exploring the inequality of the particulate matter exposure level of public bicycle scheme users using an agent-based model. Comput. Environ. Urban Syst. 2026, 123, 102367. [Google Scholar] [CrossRef]
  52. Mueller, C.; Klein, U.; Hof, A. An easy-to-use spatial simulation for urban planning in smaller municipalities. Comput. Environ. Urban Syst. 2018, 71, 109–119. [Google Scholar] [CrossRef]
  53. Omer, I.; Kaplan, N. Using space syntax and agent-based approaches for modeling pedestrian volume at the urban scale. Comput. Environ. Urban Syst. 2017, 64, 57–67. [Google Scholar] [CrossRef]
  54. Liu, J.; Zhang, M.; Xia, Y.; Zheng, H.; Chen, C. Using agent-based modeling to assess multiple strategy options and trade-offs for the sustainable urbanization of cultural landscapes: A case in Nansha, China. Landsc. Urban Plan. 2022, 228, 104555. [Google Scholar] [CrossRef]
  55. Malik, A.; Abdalla, R. Agent-based modelling for urban sprawl in the region of Waterloo, Ontario, Canada. Model. Earth Syst. Environ. 2017, 3, 7. [Google Scholar] [CrossRef]
  56. Waddell, P. UrbanSim: Modeling Urban Development for Land Use, Transportation, and Environmental Planning. J. Am. Plan. Assoc. 2002, 68, 297–314. [Google Scholar] [CrossRef]
  57. Vallejo, M.; Rieser, V.; Corne, D.W. Agent-based Modelling for Green Space Allocation in Urban Areas—Factors Influencing Agent Behaviour. In Proceedings of the International Conference on Agents and Artificial Intelligence—Volume 2: ICAART; SciTePress: Lisbon, Portugal, 2015; pp. 257–262. [Google Scholar] [CrossRef]
  58. Orellana, N.; Al-Sayed, K. ON SPATIAL WAYFINDING: Agent and Human Navigation Patterns in Virtual and Real Worlds. 2013. Available online: https://api.semanticscholar.org/CorpusID:132632298 (accessed on 14 October 2025).
  59. Yan, Y.; Zeng, Q.; Zheng, Z.; Yuan, J.; Feng, J.; Zhang, J.; Xu, F.; Li, Y. OpenCity: A Scalable Platform to Simulate Urban Activities with Massive LLM Agents. arXiv 2024, arXiv:2410.21286. [Google Scholar] [CrossRef]
  60. Zohrabi, N.; Martin, P.J.; Kuzlu, M.; Linkous, L.; Eini, R.; Morrissett, A.; Zaman, M.; Tantawy, A.; Gueler, O.; Islam, M.A.; et al. OpenCity: An Open Architecture Testbed for Smart Cities. In 2021 IEEE International Smart Cities Conference (ISC2); IEEE: New York, NY, USA, 2021; pp. 1–7. [Google Scholar] [CrossRef]
  61. Beatley, T. Handbook of Biophilic City Planning and Design; Island Press/Center for Resource Economics: Washington, DC, USA, 2016. [Google Scholar] [CrossRef]
  62. Kabisch, N.; Qureshi, S.; Haase, D. Human–environment interactions in urban green spaces—A systematic review of contemporary issues and prospects for future research. Environ. Impact Assess. Rev. 2015, 50, 25–34. [Google Scholar] [CrossRef]
  63. Stevens, F.R.; Gaughan, A.E.; Linard, C.; Tatem, A.J. Disaggregating Census Data for Population Mapping Using Random Forests with Remotely-Sensed and Ancillary Data. PLoS ONE 2015, 10, e0107042. [Google Scholar] [CrossRef]
  64. Tzoulas, K.; Korpela, K.; Venn, S.; Yli-Pelkonen, V.; Kaźmierczak, A.; Niemela, J.; James, P. Promoting ecosystem and human health in urban areas using Green Infrastructure: A literature review. Landsc. Urban Plan. 2007, 81, 167–178. [Google Scholar] [CrossRef]
  65. Turoń, K.; Czech, P.; Juzek, M. The concept of a walkable city as an alternative form of urban mobility. SJSUT.ST 2017, 95, 223–230. [Google Scholar] [CrossRef]
  66. Reisi, M.; Nadoushan, M.A.; Aye, L. Local walkability index: Assessing built environment influence on walking. Bull. Geogr. Socio-Econ. Ser. 2019, 46, 7–21. [Google Scholar] [CrossRef]
  67. Mohsen, H.; Ahmadieh, H. Correlating walkability and urban morphology on Woman’s health using spatial statistical analysis: A comparative study of two neighborhoods in Beirut. Alex. Eng. J. 2019, 58, 945–955. [Google Scholar] [CrossRef]
  68. Chen, B.; Adimo, O.A.; Bao, Z. Assessment of aesthetic quality and multiple functions of urban green space from the users’ perspective: The case of Hangzhou Flower Garden, China. Landsc. Urban Plan. 2009, 93, 76–82. [Google Scholar] [CrossRef]
  69. Maas, J.; Verheij, R.A.; Groenewegen, P.P.; De Vries, S.; Spreeuwenberg, P. Green space, urbanity, and health: How strong is the relation? J. Epidemiol. Community Health 2006, 60, 587–592. [Google Scholar] [CrossRef] [PubMed]
  70. Hua, J.; Ren, C.; Yin, S.; Chen, W.Y. Effects of urban greenspaces on public health and wellbeing: Serial mediation model of objective and subjective measures. Urban For. Urban Green. 2025, 106, 128753. [Google Scholar] [CrossRef]
  71. Jones, J. Characteristics of Pattern Formation and Evolution in Approximations of Physarum Transport Networks. Artif. Life 2010, 16, 127–153. [Google Scholar] [CrossRef]
  72. Ma, Y.; Xu, W. Physarealm—A Bio-inspired Stigmergic Algorithm Tool for Form-Finding. In Protocols, Flows and Glitches, Proc. 22nd International Conference Association for Computer-Aided Architectural Design Research in Asia (CAADRIA) 2017; Janssen, P., Loh, P., Raonic, A., Schnabel, M.A., Eds.; Xi’an Jiaotong-Liverpool University: Suzhou, China, 2017; pp. 499–508. [Google Scholar] [CrossRef]
  73. Van Nes, A.; Yamu, C. Analysing Linear Spatial Relationships: The Measures of Connectivity, Integration, and Choice. In Introduction to Space Syntax in Urban Studies; Springer: Cham, Switzerland, 2021; pp. 35–86. [Google Scholar] [CrossRef]
  74. Hillier, B.; Hanson, J. The Social Logic of Space; Cambridge University Press: Cambridge, MA, USA, 1984. [Google Scholar] [CrossRef]
  75. Zolfagharkhani, M.; Ostwald, M.J. The Spatial Structure of Yazd Courtyard Houses: A Space Syntax Analysis of the Topological Characteristics of the Courtyard. Buildings 2021, 11, 262. [Google Scholar] [CrossRef]
  76. Jendritzky, G.; De Dear, R.; Havenith, G. UTCI—Why another thermal index? Int. J. Biometeorol. 2012, 56, 421–428. [Google Scholar] [CrossRef]
  77. Błażejczyk, K.; Jendritzky, G.; Bröde, P.; Fiala, D.; Havenith, G.; Epstein, Y.; Psikuta, A.; Kampmann, B. An introduction to the Universal Thermal Climate Index (UTCI). Geogr. Pol. 2013, 86, 5–10. [Google Scholar] [CrossRef]
Figure 1. Population Density and Green Space Distribution in the Three Study Areas (Lambrate, Bolognina, and Ispra). (Top row): Heatmaps of population derived from WorldPop (3 arc-second resolution) gridded data, illustrating local population concentration patterns across the three selected districts. Darker tones indicate a higher population. (Bottom row): Spatial distribution of green spaces used in the analysis, including publicly accessible and semi-public vegetated areas. These polygons represent the green space layer employed in the simulation and assessment. Administrative boundaries of the study areas are outlined in red.
Smartcities 09 00097 g001
Figure 2. General Methodological Framework.
Smartcities 09 00097 g002
Figure 3. Multi-Agent Model for Pedestrian Pattern Simulation.
Smartcities 09 00097 g003
Figure 4. Schematic illustration of the trail-based exposure analysis.
Smartcities 09 00097 g004
Figure 5. Analytical Progression from One-Dimensional Analysis to Three-Dimensional Relational Configuration.
Smartcities 09 00097 g005
Figure 6. Gini Coefficient and Lorenz Curve of Green Space Accessibility of Citizens.
Smartcities 09 00097 g006
Figure 7. Integration and Connectivity Analysis of ABS-Interconnection Network.
Smartcities 09 00097 g007
Figure 8. Density patterns of interconnection intensity and green proximity.
Smartcities 09 00097 g008
Figure 9. Spatial patterns of trail-based intensity derived from ABS. The upper row illustrates the Trail Pass-through Index (TPI), representing the frequency of trails passing through each cell; the lower row shows the Trail-Weighted Population (TWP), integrating population attributes into trail intensity to capture potential pedestrian presence in space.
Smartcities 09 00097 g009
Figure 10. Linking pedestrian exposure intensity with seasonal Land Surface Temperature patterns.
Smartcities 09 00097 g010
Figure 11. Three-Dimensional Relational Configuration of Green Space Provision, Pedestrian Exposure, and Thermal Conditions.
Smartcities 09 00097 g011
Table 1. Data Collection and Resource Links.
Data LayerData ResourceRepository Link
Administrative Boundary
(in vectors)
Geoportale—Lombardiahttps://www.geoportale.regione.lombardia.it/en-GB/home (accessed on 1 May 2024)
Population (in raster)WorldPop
(The Humanitarian Data Exchange)
https://data.humdata.org/dataset/worldpop-population-counts-2015-2030-ita (accessed on 22 Jan 2025)
Volume (in vectors)Geoportale—Regione Emilia-Romagna
Geoportale—Lombardia
https://geoportale.regione.emilia-romagna.it/ (accessed on 1 May 2024)
https://www.geoportale.regione.lombardia.it/en-GB/home (accessed on 1 May 2024)
Green Space (in vectors)Geoportale—Regione Emilia-Romagna
Geoportale—Lombardia
https://geoportale.regione.emilia-romagna.it/ (accessed on 1 May 2024)
https://www.geoportale.regione.lombardia.it/en-GB/home (accessed on 1 May 2024)
Normalized Difference Vegetation Index (NDVI)Landsat 8–9https://earthexplorer.usgs.gov/ (accessed on 22 Jan 2025)
Land Surface Temperature (LST)Landsat 8–9https://earthexplorer.usgs.gov/ (accessed on 22 Jan 2025)
Table 2. Population Structure and Green Space Provision in the Three Study Areas.
PopulationGreen Space
5–14
Years Old
15–59
Years Old
60+
Years Old
TotalTotal Green Space (m2)Average (m2/per Capita)
Lambrate1292.937249.742948.4411,491.11581,314.3150.59
Bolognina2342.1011,585.715235.2319,163.04640,338.0133.42
Ispra818.793023.141417.585259.524,841,168.18920.46
Table 3. Input parameters of ABS in Physarealm.
Input ParameterLambrateBologninaIspra
General SettingFood–Agent Ratio (TrRat)505050
Total Green Space Area581,314.31 m2640,338.01 m24,841,168.18 m2
Starting Agent Numbers (PopS: Standard-Mobility Group)7251159302
Starting Agent Numbers (PopS: Mobility-constrained Group)425758224
Number of Population Sampling Points (Emitter)66213781775
Number of Parks and Gardens Sample Points in Spring (Food)2954218310408
Number of Parks and Gardens Sample Points in Autumn (Food)2954218010027
Number of Buildings and Railway Geometries (Obstacles)151313723109
Agent SettingRadius of Standard Mobility Group
(Ddis = RStandard)
390 m390 m390 m
Radius of Mobility-constrained Group
(Ddis = RConstrained)
270 m270 m270 m
Disclaimer/Publisher’s Note: The statements, opinions and data contained in all publications are solely those of the individual author(s) and contributor(s) and not of MDPI and/or the editor(s). MDPI and/or the editor(s) disclaim responsibility for any injury to people or property resulting from any ideas, methods, instructions or products referred to in the content.