


Highlights
What are the main findings?
- C.A.S.E. mobility readiness in Thailand is highly asymmetric: Electric mobility is the most mature dimension, while Autonomous mobility is the least, with public trust—not technology—as the primary barrier to smart city autonomous vehicle integration.
- Shared mobility governance reform and electric public transport electrification offer the highest near-term smart city sustainability returns in Thailand, achievable through policy instruments rather than advanced technology deployment.
What are the implications of the main findings?
- Thailand’s existing seven-pillar smart city framework provides the institutional architecture to align fragmented C.A.S.E. policies under a single cross-ministerial strategy, replacing the current dimension-by-dimension governance approach.
- Smart city mobility transitions in emerging economies require governance sequencing before technology deployment: regulatory frameworks, data standards, and demand management instruments must precede—and enable—connected, autonomous, and shared mobility adoption.
Abstract
Smart city development depends on the readiness of Connected, Autonomous, Shared, and Electric (C.A.S.E.) mobility systems to deliver sustainable, data-driven urban transportation. This paper assesses C.A.S.E. mobility readiness in Thailand—Southeast Asia’s largest automotive manufacturing economy and an active smart city developer—situating each dimension within Thailand’s national seven-pillar smart city framework. A dual-axis supply–demand positioning framework synthesises peer-reviewed evidence, Thailand-specific infrastructure assessments, consumer surveys, and Monte Carlo simulation outputs across all four dimensions. Electric mobility is the most advanced dimension, with Thailand positioned as a regional production hub; Monte Carlo Total Cost of Ownership (TCO) analysis confirms 23–38% savings per route for electric bus adoption and fleet-wide net savings of approximately 236 million THB over ten years. Shared mobility is constrained by absent Mobility-as-a-Service (MaaS) governance, though mode choice evidence confirms a 24–36% car trip reduction potential through congestion pricing and shared taxi deployment. Connected mobility occupies a demand-led position; Autonomous mobility remains nascent on road, with trust identified as the dominant adoption barrier in a Technology Acceptance Model (TAM) survey of 797 Bangkok residents. Thailand’s seven-pillar smart city framework—particularly the Smart Mobility and Smart Governance pillars—provides the institutional architecture for an integrated C.A.S.E. National Mobility Strategy that could resolve governance fragmentation and accelerate sustainable urban mobility transition.
1. Introduction
Smart cities represent a global urban development paradigm that deploys digital technologies—including the Internet of Things (IoT), artificial intelligence (AI), big data analytics, 5G communication networks, and digital twins—to enhance urban efficiency, sustainability, and quality of life [1]. Transportation mobility is widely recognised as the most consequential application domain within smart city frameworks, with smart mobility and connected and autonomous vehicles (CAVs) explicitly identified as core smart city application areas [1,2]. The integration of sustainable, data-driven transportation systems within smart city architectures is now a fundamental objective across both developed and rapidly urbanising economies. It is within this broader smart city context that C.A.S.E. mobility—encompassing Connectivity, Autonomous driving, Shared mobility, and Electrification—has emerged as the operational architecture through which smart city mobility aspirations are realised [3,4]. First articulated by Daimler AG in 2016 and subsequently adopted as a broad analytical framework, C.A.S.E. encapsulates the simultaneous digital, technological, and behavioural disruptions reshaping urban transportation systems, automotive supply chains, and logistics networks [3,4]. Semiconductor and System-on-Chip (SoC) advancements, convergence of AI, IoT, and big data, and rapid maturation of battery chemistry have jointly accelerated C.A.S.E. deployment across both developed and emerging markets [5,6]. Each pillar is technically interdependent: electric powertrains provide the efficient platform upon which autonomous and connected systems operate, while shared mobility generates the demand structures and data ecosystems that justify automation and connectivity investment at scale [7,8].
The benefits of C.A.S.E. mobility are multidimensional. Electrification and fleet sharing reduce lifecycle greenhouse gas emissions and urban air pollution, while autonomous and connected systems hold the potential to eliminate the human error responsible for the majority of road fatalities [3,9]. Economically, shared autonomous electric vehicles can achieve a 70% greenhouse gas reduction at 41% of the lifecycle cost of private electric fleets [10]. For industrial logistics, C.A.S.E. technologies enable autonomous last-mile delivery, electrified freight fleets, real-time connected tracking, and Logistics-as-a-Service (LaaS) platforms, each promising substantial gains in cost efficiency and carbon performance [11,12]. Monte Carlo Total Cost of Ownership analysis of electric bus adoption in northern Thailand demonstrates fleet-wide net savings of approximately 236 million THB over a 10-year period [13].
Thailand, as Southeast Asia’s largest automotive manufacturing economy and a regional logistics hub, an emerging hub for Industry 5.0 readiness within ASEAN [14], has simultaneously pursued smart city development through a national seven-pillar framework—encompassing Smart Mobility, Smart Energy, Smart Economy, Smart Environment, Smart People, Smart Living, and Smart Governance—under its Thailand 4.0 national strategy [1]. The Smart Mobility pillar, which directly encompasses connected and autonomous vehicles, Mobility-as-a-Service (MaaS), electric public transport, and integrated logistics platforms, aligns comprehensively with the C.A.S.E. dimensions assessed in this paper [1,2]. Despite growing scholarly attention to individual dimensions—electric vehicle (EV) adoption [15], intelligent transport systems [16], and carbon footprint management in manufacturing [17]—no systematic cross-dimensional C.A.S.E. readiness assessment has been published for Thailand that situates these dimensions within the country’s smart city development trajectory. This paper addresses that gap. Section 2 presents the Materials and Methods, comprising a structured review of the C.A.S.E. framework and smart city literature alongside the dual-axis readiness assessment methodology and data sources. Section 3 presents the Results, integrating Thailand’s landscape and readiness assessment across all four C.A.S.E. dimensions, four illustrative case studies, and a cross-dimensional positioning matrix. Section 4 discusses the interpretation of findings within the smart city framework and derives strategic implications for smart city mobility governance. Section 5 concludes this paper.
2. Materials and Methods
2.1. The C.A.S.E. Mobility Framework
C.A.S.E. mobility integrates four mutually reinforcing pillars—Connected, Autonomous, Shared, and Electric—each carrying distinct sub-dimensions and generating interdependencies that amplify or constrain one another’s development trajectories [3,4,8]. The Connected dimension integrates vehicles with digital networks through vehicle-to-everything (V2X) communication—encompassing vehicle-to-vehicle (V2V), vehicle-to-infrastructure (V2I), vehicle-to-pedestrian (V2P), and vehicle-to-network (V2N) modes enabled by Cellular V2X (C-V2X) and Dedicated Short-Range Communications (DSRC) standards, with cooperative intelligent transport systems (C-ITSs) providing the infrastructure counterpart [18,19]. Key issues include data privacy and cybersecurity governance, network latency and interoperability standards, and automotive-specific data sharing regulation [20]. The Autonomous dimension encompasses AI-driven sensor fusion (LiDAR, radar, cameras) across Society of Automotive Engineers (SAE) automation Levels 0–5, with road infrastructure adaptation—including dedicated lanes and HD mapping—identified as a co-investment prerequisite [21]. For industrial logistics, intralogistics autonomy through Autonomous Guided Vehicles (AGVs) and Autonomous Mobile Robots (AMRs) is a commercially mature sub-dimension advancing independently of on-road autonomous vehicle (AV) governance timelines [22]. Shared mobility encompasses MaaS platforms, shared autonomous electric vehicles (SAEVs), ride-hailing, and Logistics-as-a-Service models [10,11], with car-centric cultural path dependencies and MaaS governance design representing the dominant structural barriers. Electrification replaces internal combustion engine (ICE) powertrains with battery-electric systems supported by BMS advancements, including wireless battery management systems (BMSs) and dynamic wireless power transfer, while second-life battery applications reduce infrastructure investment costs [23]. The lifecycle greenhouse gas reduction potential of battery electric vehicles (BEVs) ranges from 40% to 70% depending on the electricity generation mix [9]. The sub-dimensions, enabling technologies, and key issues of each pillar are further developed and illustrated in the assessment framework in Section 3.
2.2. C.A.S.E. Mobility and Smart City Development: Urban Applications and Evidence
C.A.S.E. mobility is widely recognised as a foundational enabler of smart city development, with each dimension activating a distinct layer of the smart city technology stack. Smart cities deploy C-ITS infrastructure to create real-time vehicle-infrastructure data exchange networks that support adaptive traffic management, congestion pricing, and multimodal journey optimisation across urban corridors—directly operationalising the Connected dimension within smart city Intelligent Transportation System (ITS) platforms [12]. The Shared dimension activates Mobility-as-a-Service (MaaS) platforms that aggregate public transit, ride-hailing, micro-mobility, and on-demand logistics into unified urban mobility interfaces, reducing private vehicle dependence and enabling the data-driven demand management central to smart city transport governance [11]. For logistics service providers, the transition to smart city-integrated service models requires systematic lifecycle redesign: Thai logistics service providers are actively re-engineering service delivery through Industry 4.0 technologies, with lifecycle evaluation frameworks guiding the transition to smart city-aligned logistics operations [24]. Mode choice evidence from 1239 Bangkok commuters confirms that replacing private car travel with shared taxis for commuters in detached housing would reduce Bangkok car trips by 24–36%, a smart city-scale congestion impact achievable through governance reform alone, without additional technology investment [25]. The Electric dimension enables smart grid integration through vehicle-to-grid (V2G) capability and photovoltaic-integrated charging infrastructure, directly advancing the Smart Energy pillar of urban smart city frameworks [23]. Monte Carlo Total Cost of Ownership (TCO) analysis of electric bus adoption in northern Thailand demonstrates fleet-wide net savings of approximately 236 million THB over 10 years (23–38% TCO savings per route) and annual emission reductions of 11,432 tCO2eq, quantifying the smart city sustainability dividend of public fleet electrification [13]. The Autonomous dimension advances smart city infrastructure through roadside perception networks, high-definition (HD) urban mapping, and mobile edge computing nodes that form the physical substrate for connected and autonomous vehicle (CAV) integration; for logistics and urban freight, autonomous systems in controlled smart city environments are projected to reduce fleet operational costs by 18.2% and fleet size by 20.4% [10]. Smart logistics technology adoption—enabled by the IoT data platforms underpinning smart city operations—significantly improves urban freight carbon efficiency [26]; empirical evidence from factory logistics improvement programmes in Northern Thailand demonstrates that transportation management interventions yield up to 25% cost savings, warehouse upgrades reduce inventory costs by up to 55%, and administrative improvements achieve up to 20% cost savings, collectively quantifying the efficiency potential of smart city-integrated logistics platforms [27]. For inter-regional connectivity, multimodal rail-road integration achieves cost reductions of up to 67.81% and emission reductions of up to 76.50% relative to road-only alternatives, extending smart city sustainability benefits beyond urban cores to regional supply networks [28].
2.3. Global Consumer Demand Drivers for C.A.S.E. Adoption
Consumer demand for C.A.S.E. mobility is shaped by environmental values, demographic characteristics, and socio-economic conditions. Research across European markets identifies pro-environmental self-identity and sustainable consumption lifestyles as primary drivers of EV and shared mobility adoption, though environmental concern alone is insufficient without complementary infrastructure and economic accessibility [29,30]. Consumer segmentation distinguishes ‘Eco-Driven Innovators’ from ‘Reluctant Traditionalists’ who resist adoption primarily due to cost and infrastructure concerns [31]. Generation Y (aged 25–45) is identified as the primary catalyst for a paradigm shift in urban mobility preferences, exhibiting lower attachment to private car ownership and greater openness to shared and electric mobility [32]. In the Chinese context, structural assurance mechanisms—regulatory certification, transparent safety records, and institutional guarantees—are the most effective instruments for building consumer trust in AV technology [33,34]. Across ASEAN, socio-economic heterogeneity creates differential C.A.S.E. adoption trajectories: Thailand maintains stronger EV policies and automotive ecosystem depth than Vietnam, Indonesia, and the Philippines, while Malaysia demonstrates advanced EV infrastructure localisation; Indonesia registers low Industry 4.0 readiness constraining connected and autonomous adoption [35]. Comparative analysis of Industry 5.0 readiness across the EU and ASEAN confirms that successful technology adoption depends more critically on strategic policy choices and institutional frameworks than on economic resources alone, with human-centred and sustainability initiatives demonstrating greater flexibility across economic development contexts [14].
2.4. European Practices in C.A.S.E. Mobility
Europe has emerged as the leading arena for C.A.S.E. policy and technology development. The European Green Deal mandates a 100% reduction in CO2 emissions from new passenger cars by 2035 and a 90% greenhouse gas reduction across transport by 2050 [8]. The Connected, Cooperative and Automated Mobility (CCAM) Partnership addresses barriers including fragmented deployment and limited scalability through coordinated innovation strategies [36]. The C-Roads Platform has deployed C-ITS infrastructure across 14 European countries, demonstrating operational cooperative safety services [19,37]. Germany’s Road Traffic Act (2021) permits Level 4 autonomous vehicles (AVs) in defined operational domains, and the European Commission’s CCAM law framework establishes comprehensive provisions including data governance and liability allocation [20,38]. Analysis across 311 European cities confirms that regulatory frameworks and urban economic potential are the dominant determinants of shared mobility service availability and diversity, while mandatory charging interoperability under the Alternative Fuels Infrastructure Regulation (AFIR) directly resolves the network fragmentation that constrains consumer adoption [39]. Consumer demand is led by Generation Y and pro-environmental lifestyle segments, providing a sustained demand foundation [30,32].
2.5. Chinese Practices in C.A.S.E. Mobility
China has pursued C.A.S.E. mobility through a state-directed technology leapfrog strategy using phased policy architecture to bypass traditional automotive development stages [40,41]. By 2023, new energy vehicle (NEV) sales exceeded 35% of all new passenger vehicle sales, supported by the world’s largest public charging network. Shanghai has emerged as a model for transportation electrification, providing replicable templates for emerging economies [42]. Intelligent connected vehicle (ICV) policies in Beijing, Shanghai, Guangzhou, and Chongqing have significantly promoted industrial innovation [43]. The systemic integration of EV and AV technologies is mutually reinforcing: high-voltage EV architectures enable real-time sensor fusion and over-the-air updates required for advanced autonomous functions [44]. China’s AV innovation ecosystem operates through three interlocking subsystems—resource supply, technology diffusion, and policy incentives—sustaining continuous innovation [45]. Shared electric bicycles have achieved significant penetration supported by smart bike-sharing infrastructure, while Didi Chuxing (Beijing, China) and CaoCao (Suzhou, China) lead shared mobility by integrating autonomous technologies, resource optimisation, and mode guidance [46,47]. Government policy plays a dual role promoting innovation while ensuring regulation, balancing rapid deployment with data security and environmental compliance. Regional disparities—with central cities significantly outpacing western regions in EV and shared mobility infrastructure—offer direct lessons for Thailand’s urban–rural C.A.S.E. divide [43].
2.6. C.A.S.E. Mobility and Thailand’s Smart City Programme
The smart city framework provides the architectural logic through which the four C.A.S.E. dimensions interact with urban systems: the Connected dimension operationalises the IoT sensor and data network layer that underpins smart city intelligence; the Autonomous dimension advances connected and autonomous vehicle (CAV) integration into smart city infrastructure; the Shared dimension activates Mobility-as-a-Service (MaaS) platforms that aggregate and optimise multimodal urban mobility; and the Electric dimension drives smart energy system integration through vehicle-to-grid (V2G) capability, photovoltaic-integrated charging, and smart grid demand management [1,2]. Together, these four dimensions address the core challenges of urban sustainability, efficiency, and liveability that define the smart city agenda globally.
Thailand’s national smart city programme, administered by the Digital Economy Promotion Agency (DEPA), has designated pilot smart cities across Bangkok, Chiang Mai, Khon Kaen, Phuket, and Udon Thani, with smart mobility identified as the highest-priority application pillar in citizen demand surveys [1,48]. Bangkok’s smart city trajectory is most advanced in the Smart Mobility pillar: the city is developing a digital twin system integrating real-time sensor data, AI-powered analytics, and traffic simulation to optimise flow, reduce air pollution, and improve public transport planning—a direct operationalisation of the Connected dimension within the smart city architecture [49]. The Khon Kaen smart city initiative, recognised as Thailand’s first formally designated smart city, prioritised smart mobility through a light rail transit (LRT) project under a government special-purpose vehicle (GSPV) model, demonstrating how smart city institutional frameworks can accelerate C.A.S.E.-aligned public transport investment, though bureaucratic coordination challenges have slowed implementation [50]. Chiang Mai’s smart city programme emphasises smart district development, energy efficiency, and digital infrastructure—with the city also providing the empirical setting for the Monte Carlo electric bus Total Cost of Ownership (TCO) analysis central to this paper’s evidence base [48,50].
Cross-cutting challenges identified in Thailand’s smart city implementation directly mirror the C.A.S.E. governance gaps documented in this assessment: fragmented data standards across agencies constrain the connected data layer; centralised, top-down governance limits the citizen engagement and public–private partnership innovation required for MaaS and EV ecosystem development; digital skill gaps across regions reproduce the urban–rural adoption disparities evident in EV and connected mobility penetration data; and regulatory barriers slow the technology deployment timelines affecting both smart city project approvals and AV regulatory sandbox establishment [2,48,51]. These structural parallels confirm that C.A.S.E. readiness is not merely a sectoral automotive or logistics question but a governance and urban systems challenge at the core of Thailand’s smart city agenda. Conversely, the smart city framework provides the cross-ministerial, data-driven policy architecture—through DEPA certification incentives, the Thailand 4.0 strategy, and the seven-pillar governance structure—that could resolve the fragmentation identified across all four C.A.S.E. dimensions. The strategic implication is that an integrated C.A.S.E. National Mobility Strategy, aligned explicitly with Thailand’s smart city framework, would simultaneously advance the Smart Mobility and Smart Energy pillars while generating the connected data infrastructure required for the remaining five smart city pillars to function effectively [1,49].
2.7. Research Design
This study adopts a systematic review and evidence synthesis research design, drawing upon peer-reviewed empirical literature, policy documents, and quantitative indicator data specific to Thailand and comparative international contexts. The review follows a structured literature search protocol across Scopus and Web of Science using keyword combinations spanning each C.A.S.E. dimension, Thailand, ASEAN, logistics, and supply chain management. Sources were screened for relevance to the research objectives and assessed for methodological quality. The synthesis integrates findings across dimensions using the assessment framework described in Section 2.8. Where Thailand-specific quantitative data are available—including infrastructure assessments, consumer survey metrics, market adoption statistics, and Monte Carlo simulation outputs—these are prioritised as primary indicators. Comparative international evidence from European and Chinese practice is incorporated to benchmark Thailand’s positions and identify transferable lessons.
This study constitutes structured evidence synthesis rather than a systematic review or meta-analysis: PRISMA-style search and screening procedures were not followed. Evidence is organised using the dual-axis readiness framework as a structuring instrument to produce a readiness positioning for each C.A.S.E. dimension rather than pooled statistical effects.
2.8. C.A.S.E. Readiness Assessment Framework
The readiness assessment applies a dual-axis framework that evaluates each C.A.S.E. dimension across two independent but related vectors: supply readiness and demand readiness. Supply readiness captures the availability, quality, and maturity of the technological, infrastructure, and industrial capacity required to produce and deliver a given C.A.S.E. service or product within Thailand. Key indicators include domestic manufacturing and R&D capacity, technology infrastructure density, supply chain ecosystem depth, and engineering talent availability. Demand readiness captures the extent to which market conditions, consumer preferences, logistics operator requirements, and institutional procurement create viable and growing demand for C.A.S.E. solutions. Key indicators include demonstrated market adoption data, stated consumer adoption intention, logistics operator uptake rates, policy-induced demand stimulation, and public willingness-to-pay evidence. A third assessment layer—regulatory and policy support—is evaluated qualitatively, capturing the extent to which the legal, regulatory, and incentive environment enables or constrains C.A.S.E. development. Each vector is rated on a five-point ordinal scale (Low to High) triangulated across at least two independent sources per indicator.
Scoring rubric: Low = absent or pre-commercial (no operational evidence); Moderate–Low = nascent (pilot-stage, limited niche); Moderate = transitional (demonstrated at scale in specific segments, significant gaps remaining); Moderate–High = advanced (mature in most segments, identifiable residual constraints); High = balanced and scalable (no systemic gaps). Where independent sources conflicted, the lower rating was conservatively assigned. All indicators within each vector are weighted equally, reflecting the absence of empirical calibration data for differential weighting. Where evidence was sparse or methodologically ambiguous, this uncertainty is flagged in the relevant results subsection, and the rating is treated as provisional pending more robust empirical data. Ratings represent expert-informed evidence synthesis rather than a statistically replicable index; sensitivity is discussed in the Limitations section (Section 4.3).
The intersection of supply and demand readiness positions each C.A.S.E. dimension within one of four strategic quadrants: supply-led (high supply, low demand—capacity without market), balanced readiness (high supply, high demand—integrated ecosystem), demand-led (low supply, high demand—market without capacity), or early stage (low supply, low demand—nascent market). A trajectory arrow is associated with each positioning to indicate directional momentum of current policy, investment, and market signals. Figure 1 presents the C.A.S.E. Mobility Framework applied in this assessment, mapping the four pillars, their sub-dimensions, enabling technologies, and key issues against which Thailand’s supply and demand conditions are evaluated in Section 4.
Figure 1.
The C.A.S.E. Mobility Framework: Dimensions.
Trajectory arrows reflect directional momentum from current policy, investment, and market signals documented in the published literature and policy sources; they do not represent time-series forecasts or statistically projected trajectories.
2.9. Data Sources
Evidence was drawn from three source categories. The peer-reviewed literature includes empirical studies published in Scopus-indexed journals from 2018 to 2026, covering consumer adoption behaviour, infrastructure readiness assessments, technology maturity analyses, logistics cost modelling, and comparative regulatory frameworks across Thailand, Europe, and China. Quantitative datasets include national electric vehicle registration statistics, public charging network coverage data, road infrastructure readiness assessments, electric bus fleet Monte Carlo simulation outputs, lean process improvement metrics from Thai manufacturing contexts, Board of Investment (BOI) investment approval records, and industry projection data for the 2026–2028 period. Policy and regulatory documents include Thailand’s EV30@30 mandate, the Personal Data Protection Act (PDPA Act B.E. 2019, Amended B.E. 2021), the Office of Transport and Traffic Policy and Planning (OTP) national intelligent transport system (ITS) strategy, the Eastern Economic Corridor (EEC) development mandate, the Climate Change Master Plan (2015–2050), and comparative international frameworks including the European ITS Directive, the Connected, Cooperative and Automated Mobility (CCAM) Partnership documentation, the Alternative Fuels Infrastructure Regulation (AFIR), and the German Road Traffic Act (2021). Assessment ratings are triangulated across at least two independent sources per indicator to reduce single-source bias.
3. Results
This section integrates the current state of each C.A.S.E. dimension in Thailand with the supply–demand readiness assessment and regulatory analysis. For each dimension, the landscape subsection describes existing development, infrastructure, and market conditions; the readiness subsection applies the dual-axis framework from Section 2.8 to determine ratings and identify specific gaps and drivers.
3.1. Connected Mobility
3.1.1. Current Landscape
Thailand’s connected mobility landscape is anchored by a national intelligent transport system (ITS) strategy and progressive deployment of C-ITS. The Department of Highways and the Office of Transport and Traffic Policy and Planning (OTP) have collaborated on ITS corridor projects along major Bangkok expressways, implementing variable message signs, CCTV-based traffic monitoring, and limited V2I communications [16]. The EEC development zone prioritises smart infrastructure under the Thailand 4.0 mandate [52]. Logistics service providers represent a critical stakeholder group: LSP lifecycle evaluation and service redesign using Industry 4.0 technologies are reshaping Thai freight service delivery, with direct implications for the Logistics-as-a-Service (LaaS) applications integral to smart city last-mile mobility [24]. In industrial contexts, the operational challenges of connected data coordination are illustrated empirically by lean process improvement research at a Thai food manufacturer: fragmented multi-departmental carbon footprint data collection across 12 departments required a 17,540 min per assessment cycle, with 70.5% of process time consumed by waste—non-value-added (NVA) activities—waiting and overprocessing jointly accounting for 52.8% of baseline time. Lean interventions reducing activities from 142 to 63 (55.6% reduction), cutting process time by 36.2%, and eliminating 95.8% of non-value-added activities demonstrate the digital integration capability available within existing Thai organisational infrastructure [17]. For logistics operators, GPS fleet telematics is adopted by an estimated 60–70% of large third-party logistics firms, providing a connected data foundation for subsequent V2X integration.
3.1.2. Supply, Demand, and Regulatory Readiness
Supply readiness is assessed as Moderate. C-ITS pilot deployments are operational on approximately 300 km of Bangkok expressways, but V2X roadside unit deployment is limited to research pilots without a commercial network. Measured 5G speeds on West Bangkok’s controlled-access roads fall below the sub-10ms latency benchmark required for safety-critical V2X applications [53]. All RSU-compatible hardware is imported, creating supply chain dependency. Demand readiness is assessed as Moderate–High, driven by Bangkok’s persistent status as one of the world’s most congested cities and growing consumer appetite for connected vehicle features among the 25–45 age cohort [32,54]. Regulatory support is assessed as Moderate: a national ITS policy and 5G spectrum allocation exist, but the PDPA lacks automotive-specific data provisions—consent mechanisms, data security standards, and cross-border transfer protocols—that would provide regulatory certainty for V2X ecosystem development [20,55]. No designated C-ITS deployment authority with corridor-level investment mandate has been established.
3.2. Autonomous Mobility
3.2.1. Current Landscape
Thailand lacks a dedicated AV testing framework, and no public roads have been officially designated as AV testing zones. Physical infrastructure readiness is quantifiably deficient: the 2025 assessment of West Bangkok’s controlled-access roads found road marking retroreflectivity of 76–94 mcd/lux/m2—below the 100 mcd/lux/m2 minimum required by lane-keeping systems—and HD mapping coverage of less than 40% on the assessed corridor [53]. No standardised data-sharing protocol for HD maps between manufacturers and highway authorities has been established, and no V2X technical standard has been adopted, leaving V2X equipment interoperability unresolved at both infrastructure and vehicle levels [56]. Thai urban traffic conditions—characterised by informal lane discipline, high proportions of motorcycles, and diverse non-motorised users—present data edge cases that complicate AV perception systems calibrated on Western or East Asian environments [57]. Critically, qualitative research confirms that even current owners of AV-capable vehicles in Thailand regularly deactivate autonomous driving functions when operating in Bangkok’s mixed-traffic environment, reflecting pervasive distrust of system capabilities under local conditions [57]. On the supply side, the Department of Science Service has established an AV testing facility at the Eastern Economic Corridor of Innovation (EECi), Wang Chan Valley, Rayong Province, capable of supporting connected and autonomous vehicle testing from SAE Level 1 through Level 5, providing Thailand’s first controlled, multi-level AV development environment [56]. The Expressway Authority of Thailand has also begun planning dedicated test roads on expressways to facilitate AV development, and expert assessment projects that commercially available vehicles will achieve a maximum of SAE Level 3 autonomy on Thai public roads by 2030 under optimistic market scenarios [56]. For intralogistics, commercial AGV and AMR systems are available from international suppliers, with approximately 25–35 major Thai industrial facilities—predominantly in Toyota and Honda automotive parts supply chains and electronics assembly—having deployed AGV systems [22].
3.2.2. Supply, Demand, and Regulatory Readiness
Supply readiness is assessed as Low for on-road applications and Low–Moderate for intralogistics. No domestic AV technology developer operates at commercial maturity, and the domestic engineering talent pool in autonomous systems, embedded AI, and high-performance computing is substantially smaller than equivalent pools in Germany, China, or Singapore. The EECi Wang Chan Valley testing facility provides a controlled supply-side development environment, but without a formalised regulatory sandbox framework, private sector co-investment in AV R&D remains limited. Demand readiness is assessed as Low for on-road passenger applications. Quantitative Technology Acceptance Model (TAM) evidence from a survey of 797 Bangkok Metropolitan Region (BMR) residents—using a modified Technology Acceptance Model incorporating trust, perceived risk, and operational environment variables—confirms that trust is the most powerful determinant of AV adoption intention: it directly increases intention to use autonomous vehicles and indirectly increases adoption likelihood through reduction of perceived risk [58]. Critically, the study demonstrates that operational environment design significantly moderates adoption intention: respondents informed that AVs would operate on dedicated AV lanes show substantially higher adoption scores than those in mixed-traffic scenarios, providing direct evidence that the AV testing infrastructure and dedicated lane investment in the EECi are prerequisites for demand activation rather than optional enhancements [58]. Stated-preference research among Bangkok respondents further reveals low overall interest in AVs, with preferences skewed toward privately owned AVs over shared autonomous vehicle (SAV) models; public transport users show relatively stronger interest in pooled SAVs, suggesting that MaaS-integrated SAV pathways may engage a more receptive market segment than private AV deployment [59]. Thai TAM and Unified Theory of Acceptance and Use of Technology (UTAUT) studies also consistently find that trust—specifically the absence of trust in AV safety performance, ethical accountability, and legal recourse—is the primary adoption barrier, with mean trust scores significantly below adoption thresholds [60,61]. The perceived incompatibility of AV systems with Bangkok’s motorcycle-dominated traffic constitutes a culturally specific demand barrier absent from European or Chinese AV markets [57]. For intralogistics, demand is substantively higher, with AGV procurement identified as the fastest-growing automation investment category among industrial manufacturers in the EEC. Building AV consumer trust through structural assurance mechanisms—modelled on China’s approach of regulatory certification and public safety dashboards—is the primary near-term demand enabler [33]. Regulatory support is assessed as Low: no AV testing framework, liability allocation law, safety certification protocol, or AV data governance provision exists, placing Thailand approximately 5–7 regulatory years behind the EU, Singapore, and Japan [38,62].
The survey employed systematic sampling at public transit nodes, workplaces, and universities. The sample was predominantly working-age 25–45 (68%), tertiary-educated (82%), and regular public transport users (73%), reflecting the urban commuter population for whom AV adoption decisions are most proximate. As the sample was confined to Bangkok Metropolitan Region, its representativeness for provincial and rural Thailand is limited; this is acknowledged in the Limitations section (Section 4.3).
3.3. Shared Mobility
3.3.1. Current Landscape
Thailand’s shared mobility landscape presents a paradox: demand-side conditions for sharing—high urban density, congestion, and cost sensitivity—are ostensibly favourable, yet the country’s deeply car-centric transport culture and fragmented governance environment have constrained development of integrated shared mobility services [63]. Bangkok’s new mobility ecosystem has nonetheless expanded substantially in recent years: ride-hailing platforms (Grab (Singapore), Bolt (Tallinn, Estonia), Line Taxi (Bangkok, Thailand), Muvme (Bangkok, Thailand)) offering car, motorcycle, and tuk-tuk services operate alongside car-sharing services (Haup (Bangkok, Thailand), EVME (Bangkok, Thailand)) and micro-mobility solutions including e-scooter and bicycle sharing (Beam (Singapore), Anywheel (Singapore), PunPun (Bangkok, Thailand)), collectively constituting a diverse but unintegrated platform-based mobility layer atop the traditional public transport system [64]. However, Bangkok’s BTS Skytrain (BTS), Mass Rapid Transit (MRT), Bus Rapid Transit (BRT), and Bangkok Mass Transit Authority (BMTA) bus network operate without a unified ticketing or journey planning API, preventing MaaS aggregation. Ride-hailing regulation across Southeast Asia remains ambiguous and inconsistently implemented across jurisdictions, creating barriers to service expansion [65]. Community-based electric ride-sharing pilots in Bangkok demonstrate that price parity with motorcycle taxis is the critical threshold for sustained adoption [66]. Mode choice research among 1239 Bangkok commuters using multinomial logistic regression confirms that shared taxis function most effectively as a door-to-door mobility mode rather than as a feeder to metro stations and that replacing private car travel with shared taxis as the daily choice for residents of detached housing would produce a 24–36% reduction in car trips on Bangkok roads, a finding that quantifies the congestion and emission reduction potential achievable through shared mobility governance reform alone, without requiring autonomous or electric technology deployment [25]. The same research identifies congestion charges and parking fees as the most effective demand-activation instruments for shifting commuters toward shared modes—policy levers currently absent from Bangkok’s transport policy toolkit [25]. For freight, digital freight matching platforms provide partial LaaS functionality, but true capacity sharing across competing logistics operators has not been commercially launched. The inter-provincial empty-trip ratio is estimated at 25–35% on major freight corridors, representing a significant unrealised efficiency opportunity [11].
3.3.2. Supply, Demand, and Regulatory Readiness
Supply readiness is assessed as Low–Moderate. Ride-hailing operational infrastructure is mature, and the Bangkok micro-mobility and car-sharing ecosystem (Beam, Anywheel, PunPun, Haup, EVME) provides supplementary supply at limited scale, but MaaS platform integration, electric shared vehicle fleets, and freight capacity-sharing platforms remain underdeveloped or absent. Demand readiness is assessed as Moderate. Grab Thailand’s 2 million monthly active users and 200,000+ daily Bangkok trips constitute an established demand base requiring governance activation rather than market creation. Mode choice evidence from 1239 Bangkok commuters confirms that a 24–36% reduction in Bangkok car trips is achievable through shared taxi deployment alone, without requiring electric or autonomous technology, if congestion pricing and parking charges are introduced to shift residents of detached housing to shared modes [25]. This finding provides a quantified near-term opportunity that is policy-activatable within Thailand’s existing vehicle fleet. Younger Thai consumers (25–40, tertiary-educated) show converging preferences with European Generation Y shared mobility patterns [54]. However, car-centric cultural norms constitute a structural barrier that policy instruments alone cannot rapidly overcome [63]. Regulatory support is assessed as Low–Moderate: no MaaS governance law, designated MaaS authority, or cross-modal aggregator licence framework exists, with governance responsibility fragmented across the Land Transport Department, BMA, and OTP, consistent with broader Southeast Asian ride-hailing regulatory ambiguity [65,67].
Grab’s 2 million monthly active users represent demonstrated ride-hailing demand, not MaaS readiness or shared autonomous mobility adoption. The 24–36% car trip reduction is a modelled counterfactual under congestion pricing and parking charges not currently applied in Bangkok; it reflects potential policy-activated outcomes, not observed adoption data. These distinctions are relevant to interpreting the Moderate demand readiness rating for the Shared dimension.
3.4. Electric Mobility
3.4.1. Current Landscape
Electric mobility is the most advanced C.A.S.E. dimension in Thailand. The EV30@30 policy targets 30% zero-emission vehicle production by 2030, reinforced by import duty reductions, excise tax exemptions, and consumer purchase subsidies [15,68]. By 2023, approximately 1.53 million EVs were registered nationally (8.12% of fleet) [25]. BOI-approved EV manufacturing investments exceed THB 40 billion, including BYD’s Southeast Asian assembly plant in Rayong, SAIC-MG’s expanded production line, and a Foxconn/PTT joint venture [69]. For public transportation electrification, Monte Carlo TCO analysis across four Chiang Mai-based bus routes demonstrates TCO savings of 23–38% per route and fleet-wide net savings of approximately 236 million THB over 10 years, with an additional 16.7 million THB in potential T-VER carbon credit revenue; diesel fuel cost is the dominant sensitivity variable (45.2%) [13]. Public charging networks have grown to approximately 5800 charge points nationally, though fragmentation across multiple operators creates usability barriers analogous to pre-AFIR Europe [70]. Battery circular economy capabilities are being developed: cost–benefit analysis confirms the economic viability of lithium recovery at projected 2025–2030 price trajectories, while photovoltaic-integrated charging stations offer a pathway to lower operating costs and grid stress reduction in dense urban environments [24]. Lean process improvement in carbon footprint data collection—demonstrated to reduce assessment time by 36.2% and data errors by 92.7% at a Thai food manufacturer—directly supports the environmental reporting infrastructure required for EV certification ecosystems [17]. Grid readiness presents a systemic challenge: achieving the EV30@30 target would substantially increase peak loads, requiring smart grid investment, time-of-use tariff structures, and renewable energy integration [68].
3.4.2. Supply, Demand, and Regulatory Readiness
Supply readiness is assessed as Moderate–High, the highest of the four dimensions. Thailand’s established automotive manufacturing infrastructure, BOI incentive-supported foreign investment, growing charging network, and active battery circular economy R&D collectively position the country as ASEAN’s leading EV production hub [69]. The primary supply-side gap is charging network fragmentation: the absence of mandatory interoperability standards, unlike European AFIR provisions, limits effective supply delivery to consumers. Demand readiness is assessed as Moderate–High. Consumer demand is confirmed by registration data and survey evidence that government purchase subsidies are the dominant adoption driver across all age groups [54,71]. EV penetration is concentrated in Bangkok (>60% of registered BEVs), with minimal rural penetration [71,72]. For public transit operators, the Monte Carlo-verified 23–38% TCO savings present a compelling institutional demand driver for fleet electrification [13]. Logistics operator demand for electric fleet vehicles is growing, driven by total cost of ownership advantages and Scope 3 emission reporting requirements from multinational clients [73]. Regulatory support is assessed as Moderate–High: EV30@30, BOI incentive packages, excise duty restructuring, and consumer purchase subsidies constitute a coherent policy package. Significant gaps remain in mandatory charging interoperability standards, EV-specific grid planning regulation, and circular economy battery law [74,75].
3.5. Key Stakeholders
Thailand’s C.A.S.E. ecosystem involves major Japanese automotive manufacturers (Toyota, Honda, Isuzu, Mazda), European brands (BMW, Mercedes-Benz), and aggressively expanding Chinese EV brands (BYD, SAIC-MG, Great Wall Motor) as the primary industrial actors [69,76]. On the infrastructure side, state electricity enterprises (Electricity Generating Authority of Thailand, EGAT; Metropolitan Electricity Authority, MEA; Provincial Electricity Authority, PEA), oil and gas companies (PTT), and green energy start-ups are the primary EV charging infrastructure developers [77]. Mobility-as-a-Service aggregation is led by private platforms (Grab, Line Man), while C-ITS development involves government agencies, universities, and ICT firms in collaborative research and pilot deployment programmes [16]. The EEC policy zone catalyses R&D investment and attracts foreign technology partners under Thailand 4.0 [52]. Policy coordination across the Department of Rural Roads (DRR), Bangkok Metropolitan Administration (BMA), OTP, and EEC remains fragmented, identified as the primary impediment to cross-dimensional C.A.S.E. alignment [67].
3.6. Regulatory and Policy Alignment
Regulatory support follows a clear gradient corresponding to policy maturity across the four dimensions. Electric mobility benefits from the most comprehensive regulatory package, though mandatory charging interoperability standards, EV-specific grid planning regulation, and a circular economy battery framework remain pending. Connected mobility benefits from a national ITS policy and 5G spectrum allocation but lacks automotive-specific data governance provisions, V2X technical standards, and a designated C-ITS deployment authority. Shared mobility regulation is fragmented across multiple agencies with no MaaS governance law, no designated MaaS authority, and unresolved regulatory status for cross-modal aggregator platforms, consistent with broader Southeast Asian challenges [65]. Autonomous mobility remains entirely unaddressed in Thai legislation. Cross-dimensional policy alignment is the critical systemic gap: EV, connectivity, autonomy, and sharing policies are managed under separate ministerial jurisdictions without an integrated C.A.S.E. strategic framework, creating the fragmented adoption trajectories documented across all four dimensions [67]. Critically, Thailand’s existing seven-pillar smart city framework—administered by the Digital Economy Promotion Agency (DEPA)—provides the institutional architecture through which cross-dimensional C.A.S.E. alignment could be achieved: the Smart Mobility pillar naturally integrates EV, connected, shared, and autonomous transport policy, while the Smart Energy and Smart Governance pillars address the grid planning and data governance gaps, respectively [1,2]. Embedding C.A.S.E. policy within Thailand’s smart city certification and incentive framework would simultaneously resolve ministerial fragmentation and leverage DEPA’s existing cross-agency coordination mandate.
3.7. Summary of Thailand C.A.S.E. Readiness Findings
Table 1 consolidates the landscape and readiness assessment across all four C.A.S.E. dimensions, integrating supply-side and demand-side ratings with Thailand-specific quantitative anchors, challenges, opportunities, and development trajectories.
Table 1.
Summary of Thailand C.A.S.E. Mobility Landscape and Readiness Assessment: Challenges, Opportunities, and Development Trajectories.
3.8. Case Studies of C.A.S.E. Mobility in Thailand
The four case studies presented focus on the Electric and Shared dimensions, where commercially documented deployments exist in Thailand. Dedicated case illustrations for the Connected and Autonomous dimensions are not included, as neither full MaaS platform integration nor on-road AV deployment has reached a commercially documentable stage in Thailand. This limitation is acknowledged in Section 4.3.
The following case studies illustrate how individual organisations and policy frameworks are operationalising C.A.S.E. mobility principles in Thailand. Each case is selected to represent a distinct C.A.S.E. dimension or cross-dimensional convergence and is drawn from primary organisational and institutional sources. Together, they ground the readiness assessment in Section 4 in documented operational and market realities.
3.8.1. BYD Thailand: Establishing ASEAN’s First Overseas EV Manufacturing Hub
The entry and rapid expansion of BYD (Build Your Dreams) in Thailand constitutes the most consequential supply-side development in Thailand’s Electric mobility dimension. BYD entered the Thai market in 2021, when total national EV sales stood at approximately 2000 units. By 2024, the company sold more than 27,000 electric vehicles in Thailand—a 40-fold increase from 2022—capturing more than 40% of the BEV market and ranking as Thailand’s third-largest automotive brand overall. In the first five months of 2025, BYD’s Thai sales volume nearly equalled its entire 2024 total [78].
Thailand’s attraction as BYD’s first overseas EV assembly facility—established in Rayong Province under BOI investment promotion—reflects strategic alignment between the manufacturer’s global expansion and Thailand’s EV30@30 policy, which requires EV manufacturers receiving import incentives under the EV3.0 and EV3.5 schemes to compensate with domestic production at multiplying ratios (1:1 rising to 3:1 by 2027). The Rayong facility produces assembled vehicles, battery packs, and key EV components, enabling local content integration that reduces costs and strengthens Thailand’s EV supply chain depth [78]. More than 90% of the Thai workforce employed at the facility is Thai-national, with intensive EV-specific training programmes that directly build domestic human capital in the electric mobility supply chain. Vehicles have been adapted for Thailand’s tropical climate through enhanced battery thermal management, air conditioning efficiency, and waterproofing, demonstrating that supply-side readiness requires active localisation beyond technology transfer. The stabilisation of BEV prices in 2026–2027, as the EV price war eases with domestic production cost pressures, signals the transition from subsidy-dependent demand to structurally competitive electric mobility supply [79]. This case confirms the supply-side trajectory of Thailand’s Electric dimension from regional production hub toward balanced readiness assessed in Section 3.4.2.
3.8.2. Electric Shared Microtransit Platform: Bangkok Tuk-Tuk Case
An NIA-supported Thai startup, established in 2016 and piloted initially within Chulalongkorn University’s Samyan Smart City zone, represents Thailand’s most operationally mature example of the Shared and Electric mobility convergence applied to urban last-mile transport. The platform introduced a fleet of purpose-designed, battery-electric tuk-tuks in Bangkok in July 2018 before expanding commercially across the metropolitan area [80,81].
The service combines an on-demand digital booking platform with dynamic route-pooling—clustering passengers travelling in the same direction to minimise empty-vehicle kilometres—with a 100% electric vehicle fleet incorporating locally assembled tuk-tuk body designs and solar-powered charging units. As of 2024, the fleet exceeds 600 electric tuk-tuks operating across 12 Bangkok districts including Sukhumvit, Silom-Sathorn, Ratchada-Rama 9, and Chulalongkorn-Samyan. More than 8 million passenger trips have been served, with approximately 1800 tonnes of CO2-equivalent emissions reduced [80]. Fares begin at THB 10 per trip, enabling price-competitive access at the affordability threshold documented as critical for sustained shared electric mobility adoption among Bangkok commuters [66]. Financing from the Asian Development Bank (ADB) and private investors has supported fleet and charging infrastructure expansion, with the platform targeting 4000–5000 electric tuk-tuks nationally within five years [80].
In 2026, the platform extended to electric canal taxi operations along Khlong Phadung Krung Kasem, integrating six-passenger electric vessels with the app-based booking system across 14 canal piers, demonstrating multimodal electric shared mobility expansion beyond road transport [82]. This case illustrates the demand-led shared electric mobility trajectory identified in Section 4.3: viability is contingent on affordability and last-mile function rather than autonomous technology, and the Connected dimension—dynamic routing algorithms and app-based booking—delivers the operational efficiency that makes sharing economically viable at low price points. The canal extension further demonstrates how Bangkok’s existing urban geography can be leveraged to extend electric shared mobility beyond road infrastructure constraints.
3.8.3. State Energy Enterprise EV Ecosystem Platform—PTT Group Subsidiary
A wholly owned subsidiary of PTT Public Company Limited, Thailand’s dominant state energy enterprise, was established in July 2021 with registered capital of THB 1 billion to operate an electric vehicle business through a digital platform, aligned with PTT’s new S-Curve diversification strategy [83]. This case represents Thailand’s most sophisticated cross-dimensional C.A.S.E. example, integrating Electric, Shared, and Connected mobility into a single digital platform under the strategic direction of a state enterprise with existing national energy infrastructure.
The platform operates as Thailand’s largest EV total solution platform, offering: multi-brand EV rental for individuals (B2C) on hourly, daily, weekly, and long-term subscription bases; corporate fleet EV rental and management (B2B), including a recent delivery of 24 electric vehicles under a long-term rental agreement to a technology corporation; in-app charging station discovery aggregating over 3700 charge points from multiple operators, directly addressing the network fragmentation barrier identified in Section 3.4.1; and a membership service providing maintenance and charging support across all EV brands [84]. The platform operates in Bangkok, Chiang Mai, Khon Kaen, and Phuket, with an airport partnership at Phuket International Airport serving tourism-driven EV demand. The Connected dimension is operationalised through Salesforce Automotive Cloud deployment, delivering real-time customer intelligence, automated vehicle portfolio analytics, and AI-driven personalisation across omnichannel customer touchpoints [84]. The fleet was planned to scale from 1200 to 2000 vehicles by end-2024. This case directly operationalises the Logistics-as-a-Service concept applied to personal and corporate mobility, providing EV access as a subscription service that eliminates capital ownership barriers while building consumer confidence in electric vehicles at scale, and demonstrating how incumbent energy enterprises can leverage existing customer infrastructure to accelerate the Electric dimension’s supply–demand alignment.
3.8.4. Thailand EV Industry Outlook 2026–2028: BOI Smart EV Policy and Market Trajectory
Krungsri Research’s industry outlook for Thailand’s EV sector over 2026–2028 provides an evidence-based projection of the Electric mobility dimension’s trajectory, contextualised within the BOI Smart EV investment promotion framework and the EV3.0/EV3.5 policy architecture [79,85].
New passenger BEV registrations are projected to grow at a compound annual growth rate (CAGR) of 3.8% annually, reaching approximately 125,000 units per year by 2028. Domestic passenger BEV production is projected to surge at a 41.4% CAGR through 2026–2028, reaching approximately 120,000 units annually, driven by mandatory domestic production offsets, requiring manufacturers to produce 2–3 domestically assembled vehicles for every previously imported unit by 2027 [79,85]. The enforcement of Euro 6 emissions standards from 2026 is projected to increase ICE vehicle production costs, improving BEV price competitiveness even as the subsidy-driven price war eases. Excise tax on BEVs has been reduced from 8% to 2% under the National EV Policy Committee’s resolution. For electric commercial vehicles and public transport, 1520 electric bus procurements are projected during 2026–2032, consistent with Monte Carlo TCO findings confirming 23–38% savings for electric bus adoption on Thai intercity routes [13]. Export markets are identified as an emerging revenue stream as Thailand-manufactured BEVs reach ASEAN destinations. The BOI Smart EV promotion framework underpins these projections through corporate income tax exemptions, import duty reductions, and R&D support for EV manufacturers establishing Thailand-based production [85]. The convergence of mandatory domestic production obligations, improving battery technology economics, and Euro 6 ICE cost pressure positions 2026–2028 as Thailand’s transition from an import-dependent EV market to a net production economy, the defining supply-side milestone of the Electric dimension’s progression toward balanced readiness as assessed in Section 4.
3.9. C.A.S.E. Readiness Positioning Matrix
The synthesis of supply-side, demand-side, and regulatory assessment yields the strategic positioning illustrated in Figure 2. Electric mobility (E) occupies the balanced readiness quadrant—positioned as a regional production hub—with the strongest regulatory support and a clear trajectory toward full balanced readiness as charging interoperability and grid planning regulation mature. Connected mobility (C) occupies a demand-led position, with demand outpacing supply; its trajectory is toward balanced readiness as corridor-based C-ITS infrastructure investment accelerates. Shared mobility (S) occupies an early stage (transitioning) position, on a trajectory toward being demand-led as Bangkok’s MaaS governance framework is established. Autonomous mobility (A) occupies the early stage (nascent) quadrant for on-road applications, with a partial intralogistics trajectory toward Low–Moderate as AGV/AMR adoption accelerates.
Figure 2.
Thailand’s C.A.S.E. mobility readiness positioning matrix. Bubble size is proportional to the sum of supply and demand readiness scores on the five-point ordinal scale (Electric: 4.5/5; Connected: 3.5/5; Shared: 3.0/5; Autonomous: 1.5/5). Trajectory arrows reflect directional momentum from current policy, investment, and market signals; they do not represent time-series projections.
4. Discussion
4.1. Interpretation of C.A.S.E. Readiness Within the Smart City Framework
The readiness assessment reveals a governance-readiness correlation central to interpreting Thailand’s C.A.S.E. mobility position. Dimensions with the most developed regulatory and policy architecture—Electric mobility, supported by the EV30@30 mandate, BOI incentive framework, and excise tax provisions—demonstrate the highest readiness scores. Conversely, Autonomous mobility, where Thai legislation remains entirely silent, occupies the lowest readiness position despite significant global technology advances. This pattern confirms that C.A.S.E. readiness asymmetry in Thailand is primarily a governance sequencing problem, not a technology availability problem, a finding with direct relevance to smart city policy design in emerging economies where institutional capacity constraints typically precede technology deployment challenges [1,48].
However, this correlation does not establish causation. Reverse causality is plausible: advances in industrial technological maturity and market scale may drive regulatory development rather than the reverse. This paper employs neither natural experiments nor temporal evidence to rule out this alternative explanation. The governance-readiness correlation is presented as a descriptive pattern consistent with the evidence, not as a causal claim.
Comparison with European and Chinese practices contextualises Thailand’s position and validates the sequenced, governance-led approach implied by the findings. Europe’s CCAM partnership demonstrates that phased regulatory architecture—establishing data governance, liability allocation, and interoperability standards before commercial deployment—is a prerequisite for sustained private sector investment in connected and autonomous mobility [36,38]. China’s state-directed strategy demonstrates that industrial policy anchored in a single dimension (NEV production) can create the economic and technological foundation for subsequent cross-dimensional C.A.S.E. integration [40,41,46]. Thailand’s trajectory most closely resembles China’s early-stage leapfrog model in the Electric dimension, while remaining significantly behind both comparators in Connected, Shared, and Autonomous governance maturity. This pattern is consistent with broader ASEAN Industry 5.0 readiness evidence, where institutional frameworks and policy sequencing consistently outperform economic endowment as predictors of technology adoption success [14].
The Electric dimension assessment is most robustly grounded in primary quantitative data (Monte Carlo simulation, EV registration statistics, BOI investment records), while the Connected and Shared dimension assessments rely to a greater extent on estimated ranges and modelled projections of unclear provenance. The epistemic asymmetry across dimensions should be borne in mind when interpreting the comparative readiness ratings; qualifying language has been added in the relevant results subsections.
Mapping the C.A.S.E. readiness positions onto Thailand’s smart city pillars reveals a structural alignment opportunity (see Figure 3). Electric readiness directly advances the Smart Energy pillar through vehicle-to-grid integration potential and the emerging photovoltaic-charging ecosystem. Connected readiness advances the Smart Mobility pillar through C-ITS corridor deployment. Shared mobility governance reform advances both Smart Mobility and Smart Governance pillars by establishing the MaaS regulatory authority and open API standards necessary for multimodal integration. The implication is that C.A.S.E. readiness improvement and smart city pillar advancement are not parallel agendas but the same institutional investment seen from two different analytical perspectives [1,2,49].
Figure 3.
Mapping of C.A.S.E. mobility dimensions to Thailand’s smart city pillars. Solid arrows denote primary alignment; dashed arrows denote secondary alignment. Each C.A.S.E. dimension activates one or more smart city pillars, demonstrating that C.A.S.E. readiness improvement and smart city pillar advancement are complementary institutional investments.
4.2. Strategic Implications for Smart City Mobility Governance
For smart city mobility governance, Electric and Connected mobility are the priority pillars for near-term investment, directly advancing the Smart Mobility and Smart Energy pillars of Thailand’s national smart city framework. Electrification of Bangkok’s BMTA public bus fleet (~2600 diesel buses) through public procurement mandates would deliver co-benefits in emissions, noise, and energy cost, directly replicating the 23–38% TCO savings demonstrated across the four northern Thailand pilot routes [13], consistent with broader evidence that logistics improvement initiatives in Northern Thailand deliver transformative efficiency gains across transportation, warehouse, and administrative operations [27]. Urban C-ITS corridor deployment in Bangkok and Chiang Mai should be developed as a designated corridor programme with measurable service-level targets. Shared mobility governance reform represents the highest-leverage near-term opportunity: mode choice evidence from 1239 Bangkok commuters confirms that introducing congestion charges and parking fees—and designating a MaaS regulatory authority within OTP with open API standards for public transit ticketing—could reduce Bangkok car trips by 24–36% through shared taxi deployment alone, without requiring electric or autonomous technology investment [25]. This finding elevates shared mobility governance reform from a medium-term aspiration to an immediate, evidence-based policy priority.
For smart city freight and last-mile mobility, the most immediate C.A.S.E. opportunity lies at the convergence of Electric and Connected dimensions. Urban freight operators are advised to pilot battery electric vehicle (BEV) adoption in urban delivery operations—where Monte Carlo analysis confirms the strongest economic and carbon returns—while simultaneously deploying connected fleet analytics platforms integrated with smart city IoT data infrastructure to enable subsequent autonomous and Logistics-as-a-Service (LaaS) applications. The 18.2% cost reduction and 20.4% fleet size reduction achievable through combined automation and electrification of urban freight fleets represent a compelling smart city sustainability and economic case [28].
At the policy level, four cross-cutting recommendations emerge. First, an integrated C.A.S.E. National Mobility Strategy should align policy actions across all four dimensions under a single cross-ministerial framework, replacing the current fragmented governance architecture. The sequencing and bundling of policy instruments—EV purchase subsidies, MaaS governance frameworks, AV regulatory sandbox programmes, and C-ITS corridor mandates—should be designed to maximise cross-dimensional adoption synergies. Second, PDPA supplementary provisions for connected vehicle data governance should be developed in dialogue with industry to provide regulatory certainty for V2X investment [20]. Third, the EEC should be positioned as Thailand’s C.A.S.E. innovation hub, attracting co-investment from European regulatory expertise and Chinese technology deployment capability [69]; the EECi Wang Chan Valley AV testing facility should be formalised within a dedicated AV regulatory sandbox framework, providing liability allocation provisions, safety certification protocols, and a public AV trust-building programme modelled on China’s structural assurance mechanism approach [33,56]. Fourth, TAM evidence confirming that dedicated operational environments and structural assurance instruments—rather than technology maturity alone—are the primary drivers of AV adoption intention in Thailand [58] implies that the government should sequence AV regulatory development ahead of commercial deployment timelines, rather than waiting for market pressure, to avoid repeating the demand suppression pattern observed in connected and shared mobility dimensions. Across all four recommendations, alignment with Thailand’s national smart city framework provides the cross-ministerial coordination architecture needed: embedding C.A.S.E. strategy within DEPA’s seven-pillar smart city governance structure would consolidate fragmented policy under the Smart Mobility and Smart Energy pillars, leverage existing DEPA certification incentives to accelerate private sector investment, and position Thailand’s C.A.S.E. transition as a measurable contribution to its smart city development commitments [1,50].
4.3. Limitations
This study has several limitations. First, the dual-axis readiness framework produces expert-informed evidence synthesis rather than a statistically replicable index; another researcher applying the same framework might arrive at adjacent but not identical quadrant placements, particularly for dimensions with sparse published evidence. A sensitivity analysis (varying one dimension’s supply or demand rating by one scale point) indicates that the Electric and Autonomous classifications are robust; the Connected and Shared classifications are sensitive to a single-step rating change. Second, the primary consumer survey evidence (TAM, n = 797) is geographically confined to Bangkok Metropolitan Region, limiting generalisability to provincial and rural Thailand; future multi-regional surveys are recommended to expand geographic scope. Third, the Electric dimension is most robustly grounded in primary quantitative data, while Connected and Shared assessments rely more heavily on estimated ranges and modelled projections; these epistemic asymmetries require cautious interpretation. Fourth, the governance-readiness correlation is descriptive; reverse causality cannot be ruled out with the available evidence. Fifth, no dedicated case studies are available for the Connected and Autonomous dimensions, as neither full MaaS platform integration nor on-road AV deployment has reached a commercially documentable stage in Thailand. Sixth, the seven-pillar smart city framework is proposed as a governance solution while its structural limitations are simultaneously documented; this tension between framework potential and implementation reality warrants ongoing monitoring.
5. Conclusions
A systematic assessment of C.A.S.E. mobility readiness in Thailand reveals a landscape of significant asymmetry across the four dimensions. Electric mobility is the most advanced, with Thailand positioned as a regional EV production hub supported by coherent government policy, Monte Carlo-verified TCO advantages for electric fleet adoption (23–38% savings per route; 236 million THB net fleet-wide savings over 10 years), and battery technology advancements spanning BMS optimisation, photovoltaic-integrated charging, second-life applications, and the approaching commercialisation of solid-state batteries. Connected mobility occupies a demand-led position driven by urban congestion pressure and logistics digitalisation, with lean digital infrastructure demonstrated to deliver substantial efficiency gains within existing Thai organisational systems. Shared mobility remains in early transition, constrained by car-centric cultural norms and absent MaaS governance, though mode choice evidence quantifying a 24–36% car trip reduction potential through shared taxi deployment—achievable through congestion pricing and governance reform without requiring advanced technology—and Grab’s established demand base provide a compelling, policy-actionable foundation for integration [25]. Autonomous mobility is the least mature dimension for on-road applications: TAM survey evidence from 797 Bangkok residents confirms that trust is the dominant adoption barrier, that dedicated AV operational environments are a prerequisite for demand activation, and that Thai AV users routinely deactivate autonomous functions in mixed-traffic conditions, while the EECi Wang Chan Valley testing facility in Rayong Province provides Thailand’s most viable near-term controlled development pathway [56,58].
From Europe, the critical importance of comprehensive regulation—AV legal frameworks, V2X interoperability standards, CCAM data governance, and MaaS governance authority—is evident as a pre-condition for sustained private sector investment. From China, the accelerating effect of technology leapfrog industrial policy, systemic EV-AV integration strategy, and structural assurance mechanisms for AV consumer trust offer directly transferable governance instruments. Thailand’s position as Southeast Asia’s automotive manufacturing hub—with established Japanese original equipment manufacturer (OEM) partnerships, aggressive Chinese EV market entry, and the EEC as a co-investment anchor—creates a distinctive opportunity to leverage both global C.A.S.E. models simultaneously within an integrated national strategy.
Situating these findings within the scope of the Smart Cities journal, this paper makes three distinct contributions. Empirically, it provides the first cross-dimensional C.A.S.E. readiness assessment for an ASEAN economy, integrating smart mobility, connected vehicle infrastructure, smart energy (EV and V2G), and urban governance evidence within a unified supply–demand framework. Methodologically, the dual-axis positioning matrix and readiness assessment protocol are directly transferable to other smart city mobility assessments in the Greater Mekong Subregion and broader Global South context. Policy-practically, the identification of Thailand’s seven-pillar smart city framework as the institutional architecture for C.A.S.E. integration offers a concrete, governance-grounded pathway that avoids creating parallel bureaucratic structures—a lesson directly applicable to other emerging economies pursuing simultaneous smart city and automotive transition agendas [1,2,48]. Future research should extend this assessment to primary empirical data collection with logistics operators and transport authorities, develop a quantitative composite readiness index for comparative ASEAN benchmarking, and investigate the specific net cost and carbon impacts of incremental C.A.S.E. adoption across Thai freight corridor types—urban last-mile, inter-provincial trunk, and Eastern Economic Corridor (EEC) industrial. The dual-axis supply–demand positioning framework, methodology, and summary table developed in this paper provide a replicable instrument for comparative and longitudinal smart city mobility assessments across the Greater Mekong Subregion and other rapidly urbanising emerging economies.
Future primary surveys should expand beyond Bangkok to include provincial Thai regions and neighbouring ASEAN economies, enabling multi-regional and cross-national validation of the demand readiness ratings currently derived from a Bangkok Metropolitan Region sample.
Author Contributions
Conceptualization, S.R., T.A. and A.S.; methodology, S.R., T.A., A.S. and J.J.; formal analysis, S.S., A.S., K.Y.T., P.C. and J.J.; investigation, S.R., S.S., K.Y.T., P.C. and J.J.; resources, S.S., K.Y.T., P.C. and J.J.; writing—original draft preparation, S.R. and J.J.; writing—review and editing, S.R., S.S., K.Y.T., P.C. and J.J.; visualization, S.R.; supervision, T.A. and A.S.; project administration, S.R., T.A. and J.J. All authors have read and agreed to the published version of the manuscript.
Funding
This research was funded by the Lancang-Mekong Cooperation Special Fund.
Data Availability Statement
The original contributions presented in this study are included in the article. Further inquiries can be directed to the corresponding author.
Acknowledgments
This work was supported by the Supply Chain and Engineering Management Research Unit, Chiang Mai University.
Conflicts of Interest
The authors declare no conflicts of interest.
Abbreviations
The following abbreviations are used in this manuscript:
| AGV | Autonomous Guided Vehicle |
| AMR | Autonomous Mobile Robot |
| API | Application Programming Interface |
| ASEAN | Association of Southeast Asian Nations |
| EU | European Union |
| LSP | Logistics Service Provider |
| NIA | National Innovation Agency (Thailand) |
| T-VER | Thailand Voluntary Emission Reduction |
| THB | Thai Baht |
| CCTV | Closed-Circuit Television |
| MHESI | Ministry of Higher Education, Science, Research and Innovation |
| NSTDA | National Science and Technology Development Agency |
| PRISMA | Preferred Reporting Items for Systematic Reviews and Meta-Analyses |
| RSU | Roadside Unit |
References
- Irvine, K.N.; Suwanarit, A.; Likitswat, F.; Srilertchaipanij, H.; Ingegno, M.; Kaewlai, P.; Boonkam, P.; Tontisirin, N.; Sahavacharin, A.; Wongwatcharapaiboon, J.; et al. Smart city Thailand: Visioning and design to enhance sustainability, resiliency, and community wellbeing. Urban Sci. 2022, 6, 7. [Google Scholar] [CrossRef] [Scilit]
- Hansen, M.M.; Koonsanit, K.; Kulmala, V. How can data contribute to smart city innovation: A study from Thailand’s smart city initiatives. Front. Sustain. Cities 2024, 6, 1473123. [Google Scholar] [CrossRef] [Scilit]
- Vermesan, O.; John, R.; Pype, P.; Daalderop, G.; Kriegel, K.; Mitic, G.; Lorentz, V.; Bahr, R.; Sand, H.E.; Bockrath, S.; et al. Automotive intelligence embedded in electric connected autonomous and shared vehicles technology for sustainable green mobility. Front. Future Transp. 2021, 2, 688265. [Google Scholar] [CrossRef] [Scilit]
- Hamid, U.Z.A. Autonomous, Connected, Electric and Shared Vehicles: Disrupting the Automotive and Mobility Sectors; Springer: Singapore, 2022. [Google Scholar]
- Kawahara, N. Automotive semiconductors in the CASE era. In Proceedings of the 2021 21st International Conference on Solid-State Sensors, Actuators and Microsystems (Transducers), Online, 20–25 June 2021. [Google Scholar]
- Kiraz, M.; Sivrikaya, F.; Albayrak, S. A survey on sensor selection and placement for connected and automated mobility. IEEE Open J. Intell. Transp. Syst. 2024, 5, 692–710. [Google Scholar] [CrossRef] [Scilit]
- Lampón, J.F.; Pérez-Moure, H. Connected, Autonomous, Shared, and Electric Vehicles in the New Age of Mobility; Springer: Cham, Switzerland, 2026. [Google Scholar]
- Bhasuran, B.; Ashwin Prabhu, G.; Karthik, S.; Prasanth, R. Strategic transformation and sustainability in CASE mobility. In Connected, Autonomous, Shared, and Electric Vehicles in the New Age of Mobility; Lampón, J.F., Pérez-Moure, H., Eds.; Springer: Cham, Switzerland, 2026. [Google Scholar]
- Pan, S.; Fulton, L.M.; Roy, A.; Jung, J.; Choi, Y.; Gao, H.O. Shared use of electric autonomous vehicles: Air quality and health impacts of future mobility in the United States. Renew. Sustain. Energy Rev. 2021, 149, 111380. [Google Scholar] [CrossRef] [Scilit]
- Dlugosch, O.; Brandt, T.; Neumann, D. Combining analytics and simulation methods to assess the impact of shared, autonomous electric vehicles on sustainable urban mobility. Inf. Manag. 2022, 59, 103428. [Google Scholar] [CrossRef] [Scilit]
- Beckers, J.; Cardenas, I.; Le Pira, M.; Zhang, J. Exploring Logistics-as-a-Service to integrate the consumer into urban freight. Res. Transp. Econ. 2023, 101, 101323. [Google Scholar] [CrossRef] [Scilit]
- Marotta, A.; Studer, L.; Marchionni, G.; Ponti, M.; Gandini, P.; Agriesti, S.; Arena, M. Possible impacts of C-ITS on supply-chain logistics system. Transp. Res. Procedia 2018, 30, 332–341. [Google Scholar] [CrossRef] [Scilit]
- Ramingwong, S.; Sampattagul, S.; Jintana, J. Economic viability of electric bus adoption for public transportation in Thailand: A Monte Carlo simulation approach. Logistics 2025, 9, 60. [Google Scholar] [CrossRef] [Scilit]
- Jangkrajarng, V.; Ramingwong, S.; Tippayawong, K.Y.; Santiteerakul, S.; Jintana, J. Industry 5.0 in EU and ASEAN: A comparative analysis of intelligent, sustainable, and human-centered manufacturing readiness. In Manufacturing 2030—A Perspective to Future Challenges in Industrial Production (ISIEA 2025); Lecture Notes in Networks and Systems; Springer: Cham, Switzerland, 2025; Volume 1605, pp. 15–26. [Google Scholar]
- Wattana, B.; Wattana, S. Implications of electric vehicle promotion policy on the road transport and electricity sectors for Thailand. Energy Strategy Rev. 2022, 42, 109001. [Google Scholar] [CrossRef] [Scilit]
- Choosakun, A.; Chaiittipornwong, Y.; Yeom, C. Development of the cooperative intelligent transport system in Thailand: A prospective approach. Infrastructures 2021, 6, 36. [Google Scholar] [CrossRef] [Scilit]
- Kanjina, K.; Ramingwong, S.; Charoenchai, N.; Jintana, J.; Sampattagul, S. Carbon footprint data flow process improvement for strawberry jam tube product by lean techniques. Sustainability 2026, 18, 2738. [Google Scholar] [CrossRef] [Scilit]
- Wang, J.; Topilin, I.; Feofilova, A.; Shao, M.; Wang, Y. Cooperative intelligent transport systems: The impact of C-V2X communication technologies on road safety and traffic efficiency. Sensors 2025, 25, 2132. [Google Scholar] [CrossRef] [Scilit]
- Sjöberg, K.; Andres, P.; Buburuzan, T.; Brakemeier, A. Cooperative intelligent transport systems in Europe: Current deployment status and outlook. IEEE Veh. Technol. Mag. 2017, 12, 89–97. [Google Scholar] [CrossRef] [Scilit]
- Andraško, J.; Hamuľák, O.; Mesančík, M.; Kerikmäe, T.; Kajander, A. Sustainable data governance for cooperative, connected and automated mobility in the European Union. Sustainability 2021, 13, 10610. [Google Scholar] [CrossRef] [Scilit]
- Čudina Ivančev, A.; Džambas, T.; Dragčević, V. The impact of autonomous vehicles on the transportation network with a focus on the physical road infrastructure. Infrastructures 2025, 10, 347. [Google Scholar] [CrossRef] [Scilit]
- Gerdsri, N.; Suksiri, P.; Somjaitaweeporn, T.; Sapsaman, T. Robotics and automation roadmap: Thailand perspectives. Int. J. Autom. Technol. 2024, 18, 754–763. [Google Scholar] [CrossRef] [Scilit]
- Chaianong, A.; Pharino, C.; Langkau, S.; Limthongkul, P.; Kunanusont, N. Pathways for enhancing sustainable mobility in emerging markets. Sustain. Prod. Consum. 2024, 45, 1–16. [Google Scholar] [CrossRef] [Scilit]
- Li, Y. Impact of smart logistics technology adoption on supply chain carbon efficiency: Evidence from digital transformation in the manufacturing sector. In Proceedings of the 2025 2nd International Conference on Digital Economy and Computer Science, Online, 10–11 April 2025. [Google Scholar]
- Ayaragarnchanakul, E.; Creutzig, F.; Javaid, A.; Puttanapong, N. Choosing a mode in Bangkok: Room for shared mobility? Sustainability 2022, 14, 9127. [Google Scholar] [CrossRef] [Scilit]
- Golinska-Dawson, P.; Sethanan, K. Sustainable urban freight for energy-efficient smart cities—Systematic literature review. Energies 2023, 16, 2617. [Google Scholar] [CrossRef] [Scilit]
- Ramingwong, S.; Sopadang, A.; Tippayawong, K.Y.; Jintana, J. Factory logistics improvement: A case study analysis of companies in Northern Thailand, 2022–2024. Logistics 2024, 8, 88. [Google Scholar] [CrossRef] [Scilit]
- Namchimplee, K.; Inohae, T.; Saengsathien, A. Multimodal transport efficiency in agricultural supply chains: A case study of rail-road integration in Thailand’s sugar logistics. Acta Logist. 2025, 12, 615–626. [Google Scholar] [CrossRef] [Scilit]
- Jarutirasarn, P.; Thirapatsakun, T. Supplier involvement enhanced the knowledge-processing capabilities of parts manufacturers. Int. J. Econ. Financ. Stud. 2024, 16, 212–234. [Google Scholar]
- Intarakumnerd, P. Technological upgrading and challenges in the Thai automotive industry. J. Southeast Asian Econ. 2021, 38, 207–222. [Google Scholar] [CrossRef] [Scilit]
- Isetti, G.; Ferraretto, V.; Stawinoga, A.E.; DellaValle, N. Is caring about the environment enough for sustainable mobility? Transp. Res. Interdiscip. Perspect. 2020, 7, 100196. [Google Scholar]
- Tu, G.; Zhang, R.; Morrissey, K. Cross-country perspectives on electrified mobility adoption. J. Transp. Geogr. 2025, 123, 103971. [Google Scholar]
- Buhmann, K.M.; Rialp-Criado, J.; Rialp-Criado, A. Predicting consumer intention to adopt battery electric vehicles: Extending the Theory of Planned Behavior. Sustainability 2024, 16, 1284. [Google Scholar] [CrossRef] [Scilit]
- Turienzo, J.; Cabanelas, P.; Lampón, J.F.; Parkhurst, G. The transformation of mobility in Europe: Technological change and social conditionings. Travel Behav. Soc. 2025, 39, 100896. [Google Scholar] [CrossRef] [Scilit]
- Yang, Y.; Wang, Y.; Liu, J.; Lee, K. An empirical study on the structural assurance mechanism for trust building in autonomous vehicles. Sustainability 2024, 16, 8258. [Google Scholar] [CrossRef] [Scilit]
- Wu, J.; Liao, H.; Wang, J.-W. Analysis of consumer attitudes towards autonomous, connected, and electric vehicles: A survey in China. Res. Transp. Econ. 2020, 80, 100849. [Google Scholar] [CrossRef] [Scilit]
- Lin, O.Z.; Juchelkova, D.; Štěpanec, L.; Aye, H.Y.; Plangklang, B. Decarbonizing ASEAN’s transport sector: A critical review of electric vehicle and biofuel policy pathways. WIREs Energy Environ. 2025, 14, e70017. [Google Scholar] [CrossRef] [Scilit]
- Zachäus, C.; Dreher, S. Innovation strategies and research trends for connected, cooperative and automated mobility in Europe. In Automated Road Transportation Symposium; Lecture Notes in Mobility; Springer: Cham, Switzerland, 2023. [Google Scholar]
- Li, S.; Edwards, S.; Isik, M.O.; Zhang, Y.; Blythe, P.T. Qualitative examination of cooperative-intelligent transportation systems in cities. Sensors 2022, 22, 8423. [Google Scholar] [CrossRef] [Scilit] [PubMed]
- Sierra-Noguero, E. Towards a European law on cooperative, connected and automated mobility (CCAM). In CEUR Workshop Proceedings; RWTH Aachen University: Aachen, Germany, 2022; Volume 3285. [Google Scholar]
- Coenegrachts, E.; Vanelslander, T.; Verhetsel, A.; Beckers, J. Analyzing shared mobility markets in Europe: A comparative analysis of shared mobility schemes across 311 European cities. J. Transp. Geogr. 2024, 118, 103793. [Google Scholar] [CrossRef] [Scilit]
- In der Heiden, P.T. China’s leapfrog to new electric vehicles. In Markets and Policy Measures in the Evolution of Electric Mobility; Lecture Notes in Mobility; Springer: Cham, Switzerland, 2016. [Google Scholar]
- Zhu, P.; Wang, Z.; Singh, R.; Tan, X. China’s model of technology leapfrog: A case study of electric vehicle policies and the development of green technology. Renew. Sustain. Energy Rev. 2026, 191, 114162. [Google Scholar] [CrossRef] [Scilit]
- Zhang, C.; Lian, J.; Min, H.; Li, M. Shanghai as a model: Research on the journey of transportation electrification and charging infrastructure development. Sustainability 2025, 17, 91. [Google Scholar] [CrossRef] [Scilit]
- Zhang, R.; Zhong, W.; Wang, N.; Sheng, R.; Wang, Y.; Zhou, Y. The innovation effect of intelligent connected vehicle policies in China. IEEE Access 2022, 10, 24738–24748. [Google Scholar] [CrossRef] [Scilit]
- Gao, J.; Qiu, Y.; Chen, Z. Systemic integration of EV and autonomous driving technologies: A study of China’s intelligent mobility transition. World Electr. Veh. J. 2025, 16, 574. [Google Scholar] [CrossRef] [Scilit]
- Feng, R.; Liu, Y.; Li, M.; Zhou, F. Research on autonomous vehicle technology innovation ecosystem in China based on system dynamics. Systems 2025, 13, 269. [Google Scholar] [CrossRef] [Scilit]
- Li, W.; Yang, Y.; Cheng, L.; Meng, X.; Zhang, F.; Ji, Y. Understanding adoption intent and behavioral response to shared electric bicycles: A survey in Ningbo, China. Transp. Res. Rec. 2023, 2677, 1311–1326. [Google Scholar] [CrossRef] [Scilit]
- Chen, Y.; Cao, Y.; Liu, Y. Development strategy of shared mobility enterprise for smart cities. In Society of Automotive Engineers (SAE)-China Congress; Lecture Notes in Electrical Engineering; Springer: Berlin/Heidelberg, Germany, 2023; Volume 950, pp. 112–122. [Google Scholar]
- Moolngearn, P.; Kraiwanit, T. Barriers to development of smart cities: Lessons learned from an emerging economy. Corp. Bus. Strategy Rev. 2024, 5, 255–262. [Google Scholar] [CrossRef] [Scilit]
- Aghaabbasi, M.; Sabri, S. Digital twin revolution: Envisioning the future of transport landscape in Bangkok, Thailand. In Future of Cities in Asia; Springer: Singapore, 2026. [Google Scholar]
- Taweesaengsakulthai, S.; Laochankham, S.; Kamnuansilpa, P.; Wongthanavasu, S. Thailand smart cities: What is the path to success? Asian Polit. Policy 2019, 11, 144–156. [Google Scholar] [CrossRef] [Scilit]
- Kitika, C.; Suwatcharapinun, S. Smart district with the comparison on urban studies of internet infrastructure and new digital activities: A case study of Chiang Mai old city, Thailand. Int. Rev. Spat. Plan. Sustain. Dev. 2024, 12, 200–217. [Google Scholar] [CrossRef] [Scilit] [PubMed]
- Tontisirin, N.; Anantsuksomsri, S. Economic development policies and land use changes in Thailand: From the Eastern Seaboard to the Eastern Economic Corridor. Sustainability 2021, 13, 6153. [Google Scholar] [CrossRef] [Scilit]
- Kiattikomol, V.; Nuangrod, L.; Rung-in, A.; Chuathong, V. Assessing infrastructure readiness of controlled-access roads in West Bangkok for autonomous vehicle deployment. Infrastructures 2025, 10, 270. [Google Scholar] [CrossRef] [Scilit]
- Limpasirisuwan, N.; Champahom, T.; Jomnonkwao, S.; Ratanavaraha, V. Promoting sustainable transportation: Factors influencing battery electric vehicle adoption across age groups in Thailand. Sustainability 2024, 16, 9273. [Google Scholar] [CrossRef] [Scilit]
- Thongmeensuk, S.; Wattanasit, Y.; Napatanapong, C. Reinforcing data privacy protection in Thailand in the age of the autonomous vehicle technology. In Proceedings of the 26th HKSTS International Conference, Hong Kong, China, 12–13 December 2022. [Google Scholar]
- Vangrattanachai, S. Infrastructure Readiness for Autonomous Vehicle Technology in Thailand. Master Dissertation, MBA Independent Study, Thammasat University, Bangkok, Thailand, 2023. [Google Scholar]
- Sithanant, T.; Chaiyasoonthorn, W.; Chaveesuk, S. Driving dilemmas: A qualitative exploration of autonomous vehicle use in Thailand. In International Congress on Information and Communication Technology; Lecture Notes in Networks and Systems; Springer: Berlin/Heidelberg, Germany, 2024; Volume 1035, pp. 234–244. [Google Scholar]
- Chalermpong, S.; Thaithatkul, P.; Ratanawaraha, A. Trust and intention to use autonomous vehicles in Bangkok, Thailand. Case Stud. Transp. Policy 2024, 16, 101185. [Google Scholar] [CrossRef] [Scilit]
- Thaithatkul, P.; Chalermpong, S.; Kenney, L.; Ratanawaraha, A. Understanding determinants of preferences for autonomous vehicles in the global south. Transp. Res. Interdiscip. Perspect. 2024, 28, 101290. [Google Scholar] [CrossRef] [Scilit]
- Ramjan, S.; Sangkaew, P. Understanding the adoption of autonomous vehicles in Thailand: An extended TAM approach. Eng. Manag. Prod. Serv. 2022, 14, 49–62. [Google Scholar] [CrossRef] [Scilit]
- Chaveesuk, S.; Chaiyasoonthorn, W.; Kamales, N.; Dacko-Pikiewicz, Z.; Liszewski, W.; Khalid, B. Evaluating the determinants of consumer adoption of autonomous vehicles in Thailand—An extended UTAUT model. Energies 2023, 16, 855. [Google Scholar] [CrossRef] [Scilit]
- Tran, D.V.; Le, C.T.Q. Developing a regulatory framework for autonomous vehicles: A proximal analysis of European approach and its application to ASEAN countries. TalTech J. Eur. Stud. 2022, 12, 165–188. [Google Scholar] [CrossRef] [Scilit]
- Means, C.Y.; Narupiti, S. Multi-level perspective analysis of the automobility regime and the implication to MaaS in Thailand. Asian Transp. Stud. 2025, 11, 100164. [Google Scholar] [CrossRef] [Scilit]
- Thaithatkul, P.; Chalermpong, S. New Mobility Services in Bangkok’s Urban Transport System; Japan Transport and Tourism Research Institute: Tokyo, Japan, 2025. [Google Scholar]
- Ratanawaraha, A.; Thaithatkul, P. Regulating ride-hailing application services in Southeast Asia. In Digital Transport Platforms and Urban Mobility; Springer: Singapore, 2024. [Google Scholar]
- Chou, C.-C.; Iamtrakul, P.; Yoh, K.; Miyata, M.; Doi, K. Determining the role of self-efficacy in sustained behavior change: An empirical study on intention to use community-based electric ride-sharing. Transp. Res. Part A 2024, 179, 103921. [Google Scholar] [CrossRef] [Scilit]
- Chalermpong, S.; Sanghatawatana, P.; Wongkaew, W.; Thaithatkul, P.; Anuchitchanchai, O. Challenges in climate action planning and implementation in developing countries: A case study of low-carbon urban mobility governance in Thailand. Transp. Res. Rec. 2026, 2680, 938–947. [Google Scholar] [CrossRef] [Scilit]
- Paudel, A.; Pinthurat, W.; Marungsri, B. Impact of large-scale electric vehicles’ promotion in Thailand considering energy mix, peak load, and greenhouse gas emissions. Smart Cities 2023, 6, 2619–2638. [Google Scholar] [CrossRef] [Scilit]
- Thammasiriroj, W.; Poompipatpong, C.; Khumpunja, P. The potential of Thailand in advancing the classic car EV conversion industry: A transition strategy. World Electr. Veh. J. 2025, 16, 122. [Google Scholar] [CrossRef] [Scilit]
- Habiburrahman, M.; Nurcahyo, R.; Ma’aRam, A.; Natsuda, K.; Techakanont, K.; Maulana, M.I.I.M. A comparative study of sustainable competitiveness in Southeast Asia’s electric vehicle manufacturing. Discov. Sustain. 2025, 6, 1293. [Google Scholar] [CrossRef] [Scilit]
- Tananuchittikul, W.; Chutima, P. Public charging station for electric vehicles in Thailand: A comprehensive practical roaming service model. Eng. J. 2025, 29, 37–66. [Google Scholar]
- Chonsalasin, D.; Champahom, T.; Limpasirisuwan, N.; Jomnonkwao, S.; Ratanavaraha, V. Urban-rural differences in electric vehicle adoption intentions: Integrated TAM, TPB, UTAUT with environmental identity. Civ. Eng. J. 2025, 11, 1891–1923. [Google Scholar] [CrossRef] [Scilit]
- Yindee, K.; Ketjoy, N.; Thanarak, P. Sustainable pathways for electric vehicle adoption in Chiang Mai, Thailand: Readiness assessment and key challenges. Environ. Res. Eng. Manag. 2025, 81, 33–49. [Google Scholar] [CrossRef] [Scilit]
- Duangekanong, S. Determining behavioral intention of logistic and distribution firms to use electric vehicles in Thailand. J. Distrib. Sci. 2023, 21, 31–41. [Google Scholar]
- Thainthadaphat, P.; Leeprechanon, N.; Chandarasupsang, T.; Tananchana, A. Electricity market restructuring in Thailand: Challenges and emerging policies. Util. Policy 2026, 92, 102141. [Google Scholar] [CrossRef] [Scilit]
- Chayutthanabun, A.; Chinda, T. Comprehensive review of end-of-life management of electric vehicle batteries in Thailand. In Proceedings of the ICBIR 2024, Bangkok, Thailand, 23–24 May 2024. [Google Scholar]
- Thananusak, T.; Punnakitikashem, P.; Tanthasith, S.; Kongarchapatara, B. The development of electric vehicle charging stations in Thailand: Policies, players, and key issues (2015–2020). World Electr. Veh. J. 2021, 12, 2. [Google Scholar] [CrossRef] [Scilit]
- DITP (Department of International Trade Promotion). Thailand EV Industry: BYD Investment and Market Update; Ministry of Commerce: Bangkok, Thailand, 2025. Available online: https://www.ditp.go.th (accessed on 1 January 2025).
- Krungsri Research. Industry Outlook 2026–2028: Electric Vehicles Thailand; Bank of Ayudhya: Bangkok, Thailand, 2026. Available online: https://www.krungsri.com/getmedia/a116caed-ff69-4ad1-9937-c1bcfab15442/IO_BEV_251202_EN_EX.pdf?ext=.pdf (accessed on 1 January 2026).
- Bangkok Post. Electric Tuk-Tuk Startup UMT Eyes National Expansion. Bangkok Post, 14 December 2023. Available online: https://www.bangkokpost.com (accessed on 1 January 2024).
- Samyan Smart City. Samyan Smart City Project Overview; Chulalongkorn University: Bangkok, Thailand, 2024; Available online: https://pmcu.co.th/samyan-smart-city/ (accessed on 1 June 2024).
- iTnews Asia. PTT MaaS’s Salesforce Automotive Cloud for EV Rental Service. iTnews Asia, 15 November 2024. Available online: https://www.itnews.asia/news/ptt-maas-salesforce-automotive-cloud-for-ev-rental-service-617474 (accessed on 1 December 2024).
- Thailand Now. Electric Canal Taxis Launch on Khlong Phadung Krung Kasem; National News Bureau of Thailand: Bangkok, Thailand, 2026. Available online: https://www.thaigov.go.th (accessed on 1 January 2026).
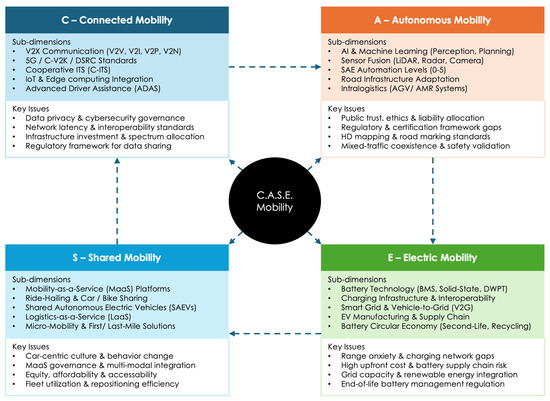
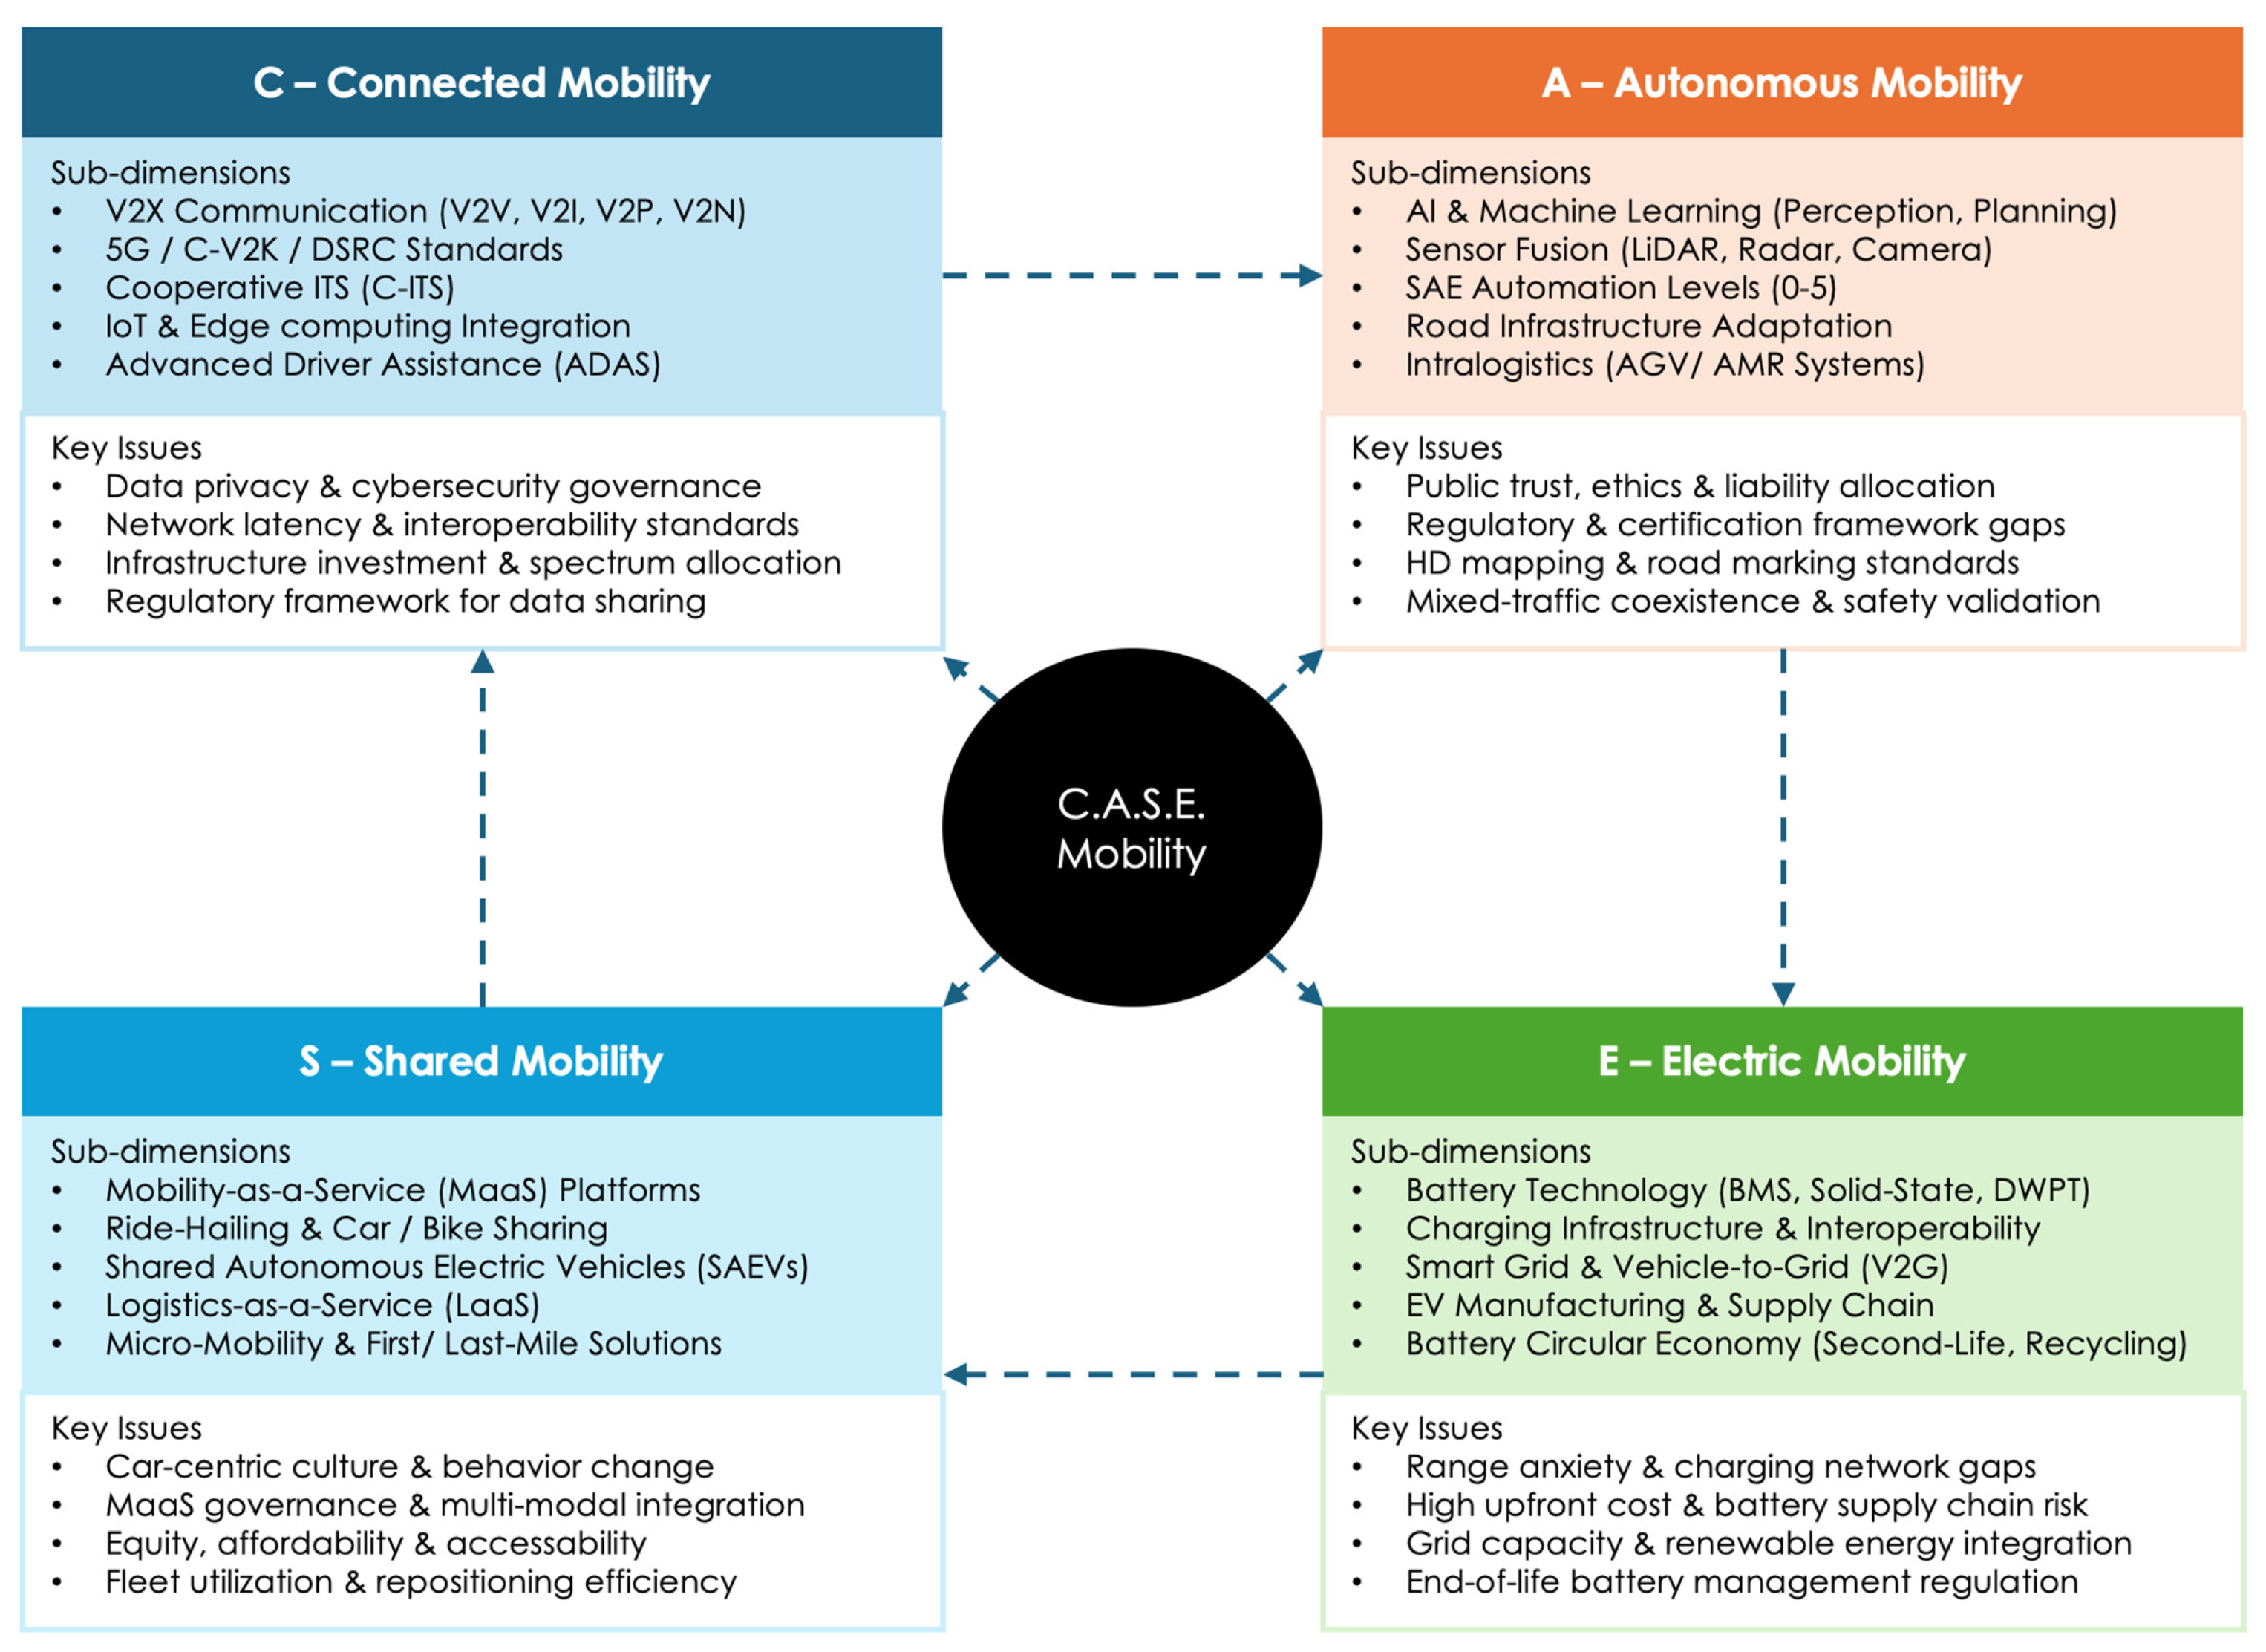
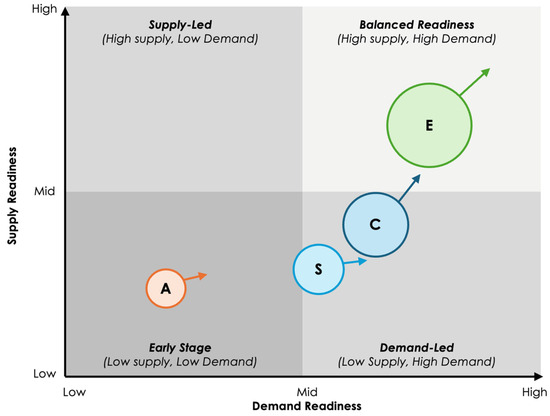
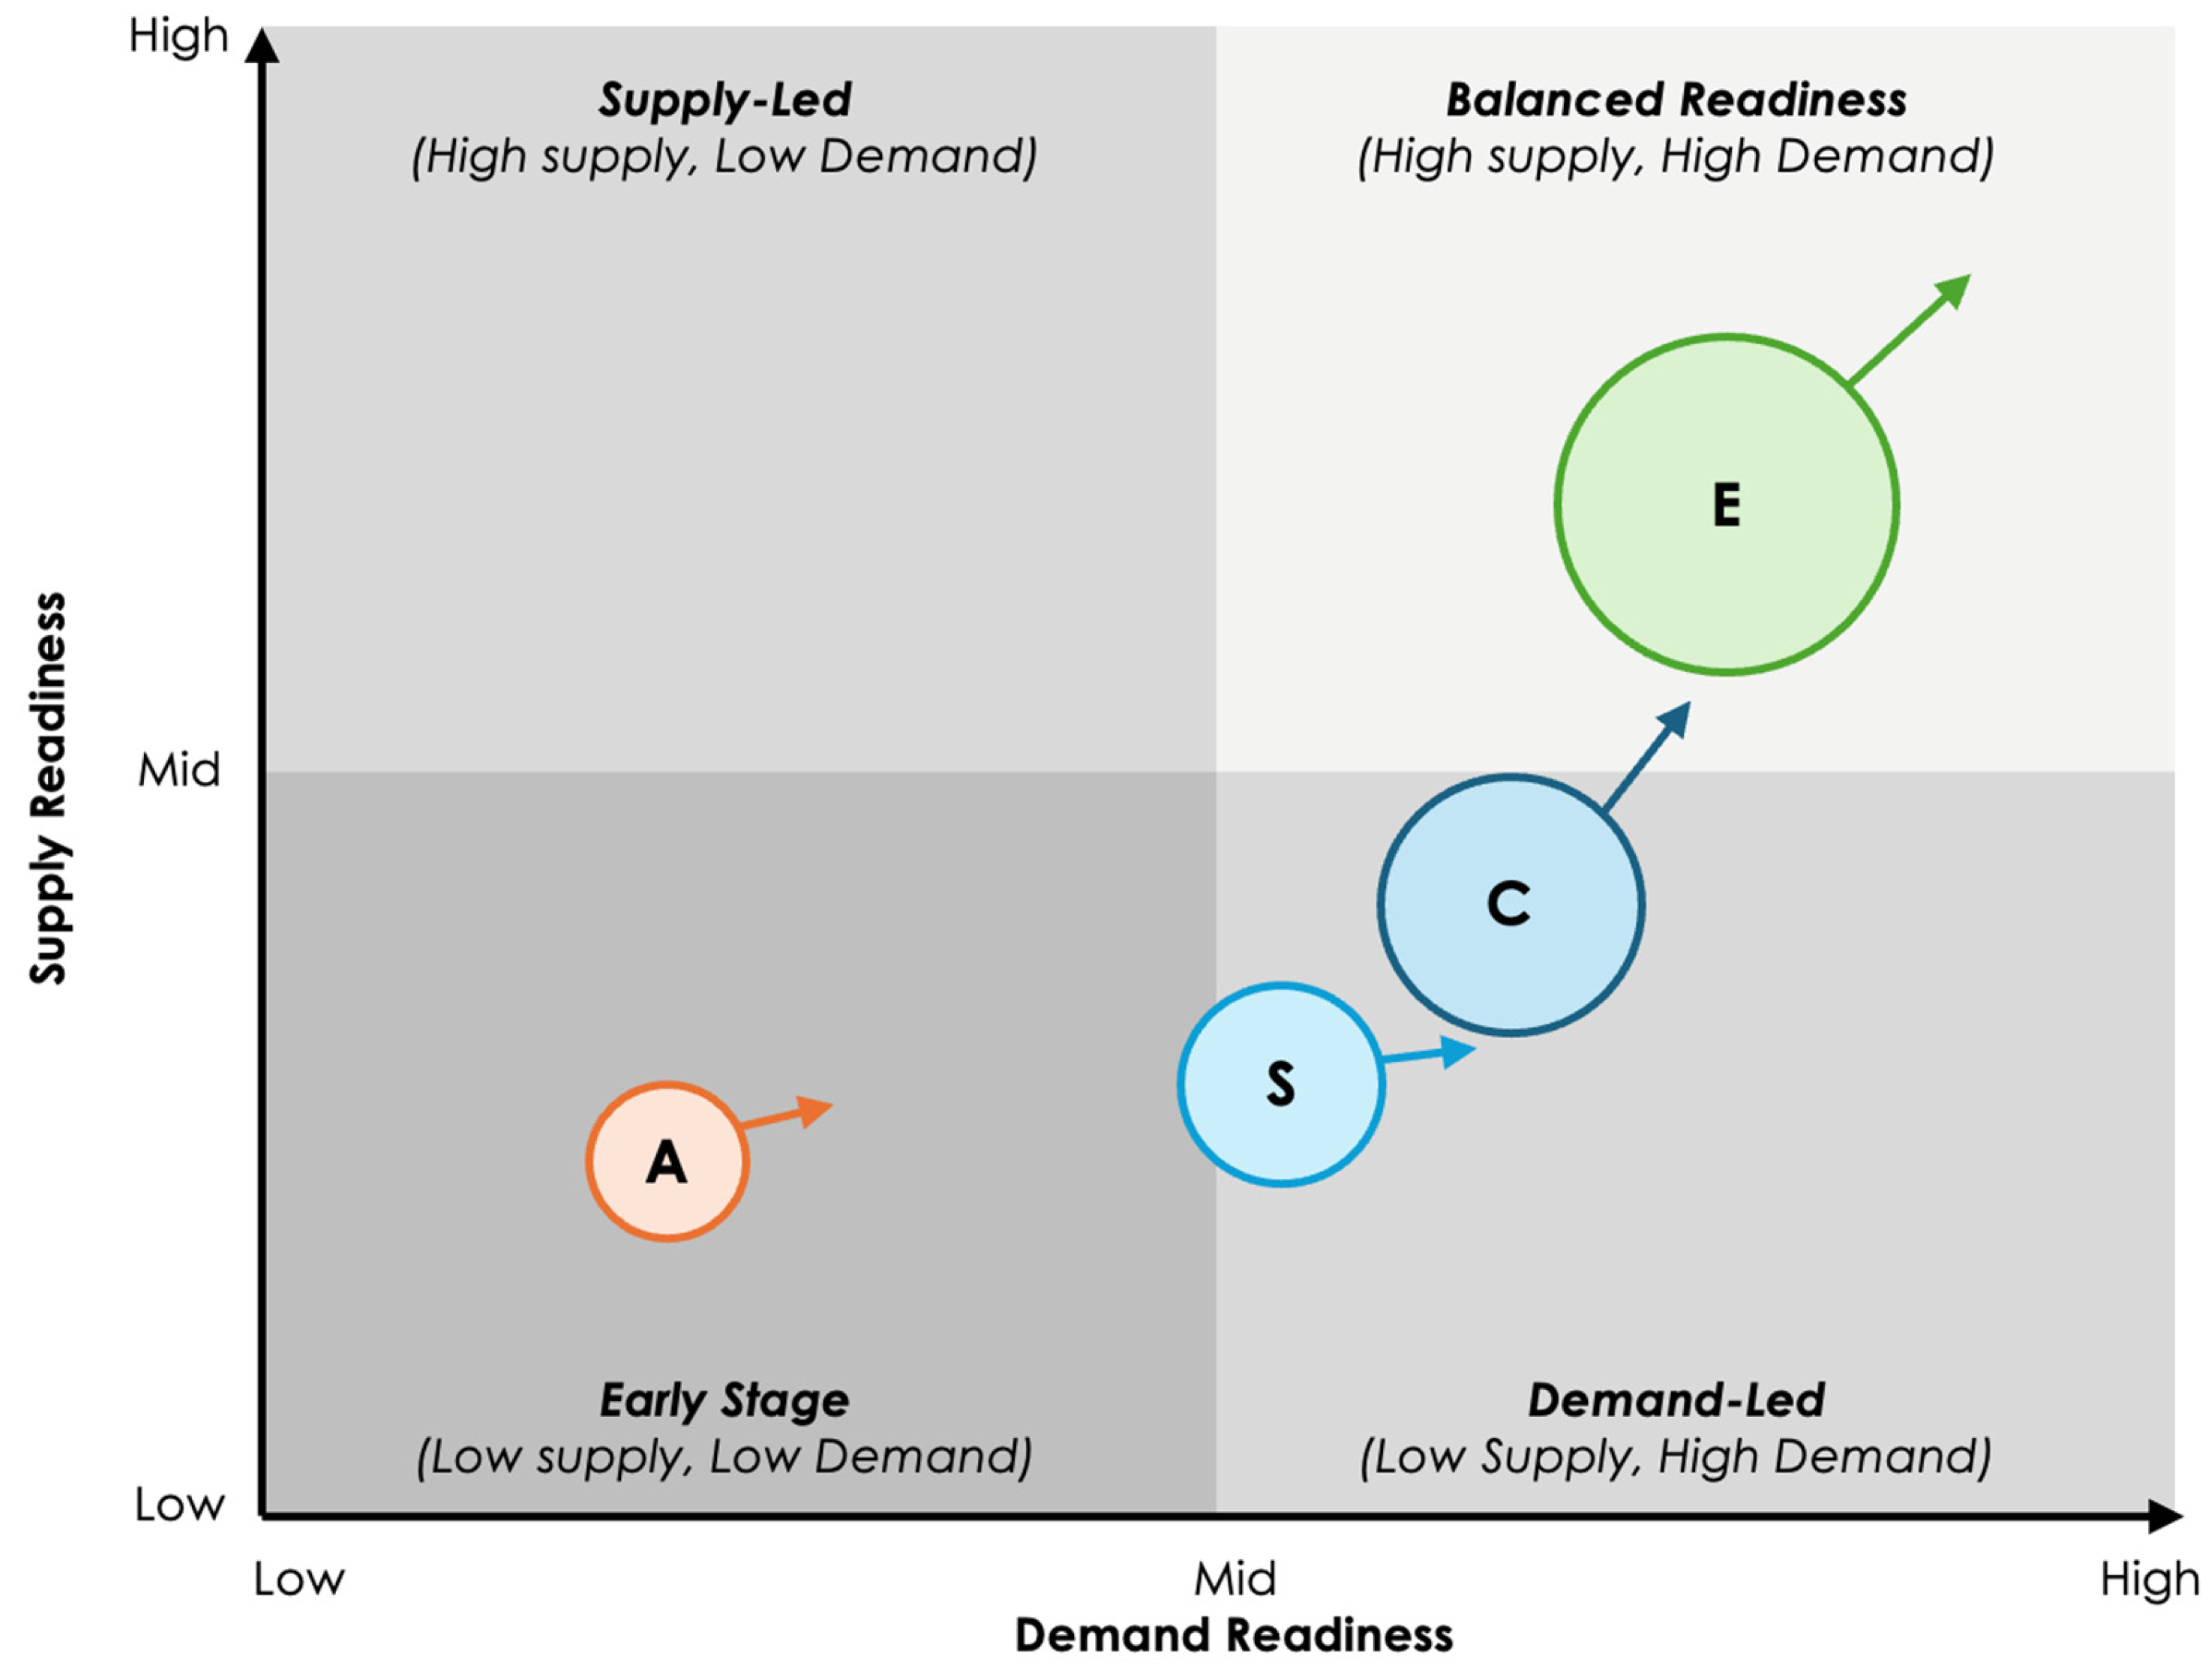
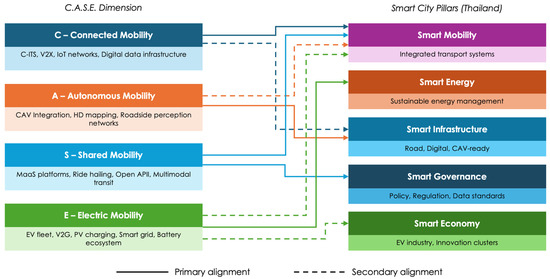
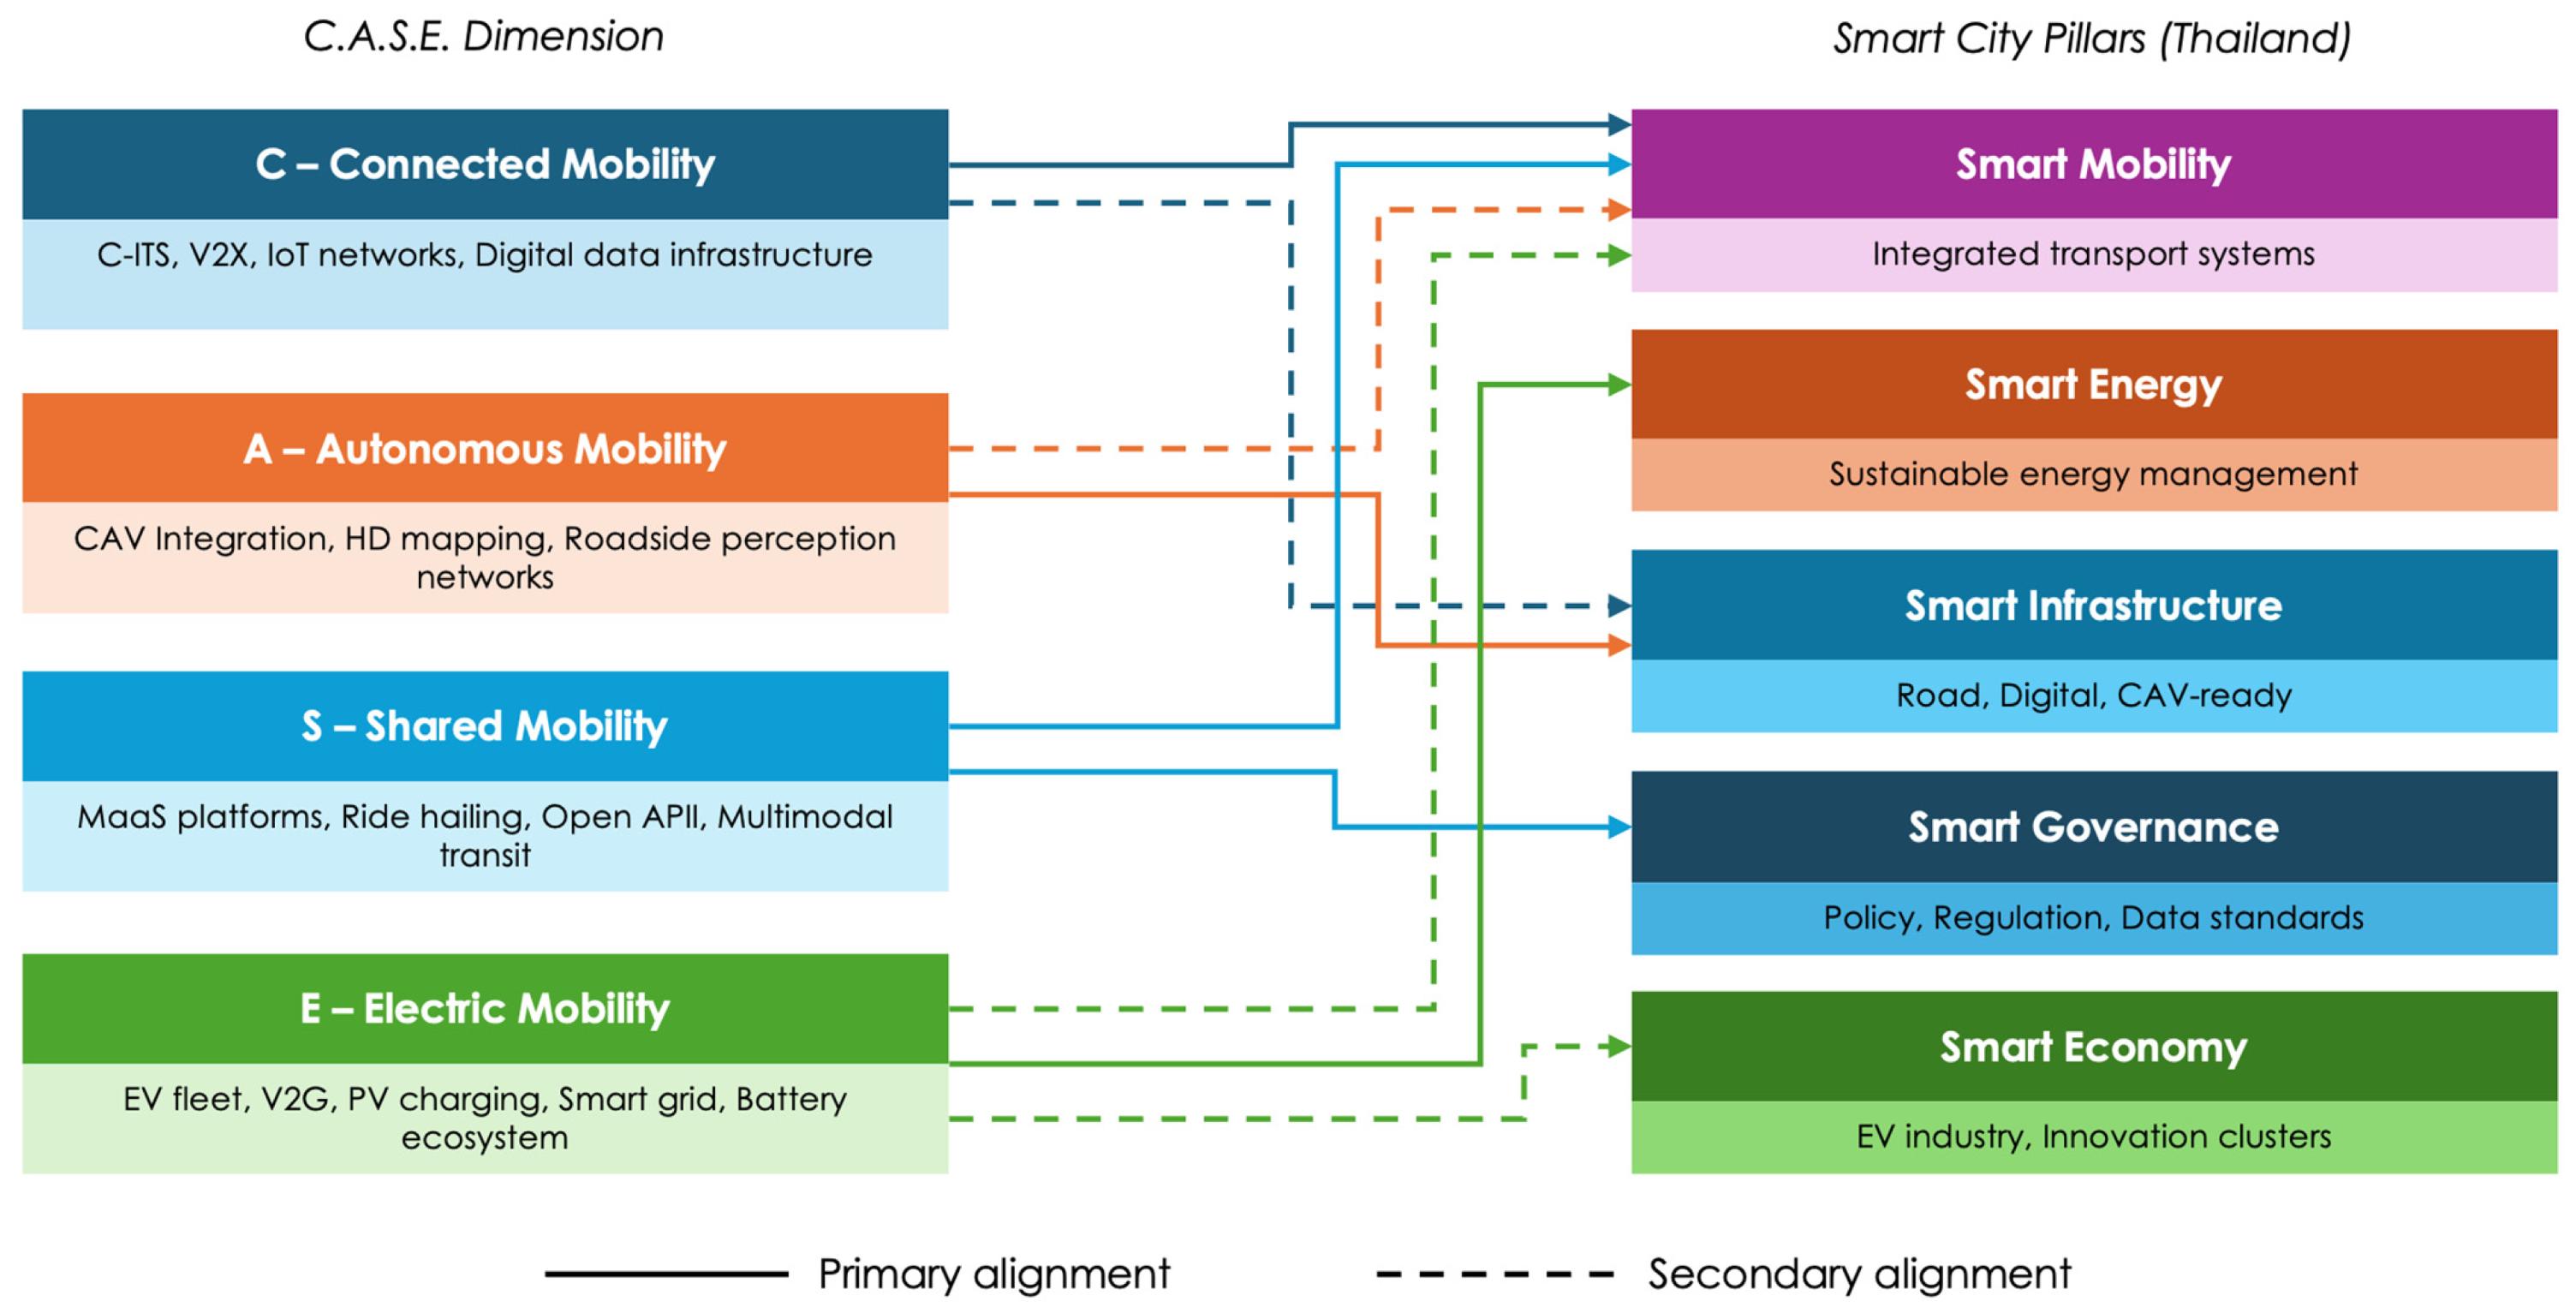

Disclaimer/Publisher’s Note: The statements, opinions and data contained in all publications are solely those of the individual author(s) and contributor(s) and not of MDPI and/or the editor(s). MDPI and/or the editor(s) disclaim responsibility for any injury to people or property resulting from any ideas, methods, instructions or products referred to in the content. |
© 2026 by the authors. Licensee MDPI, Basel, Switzerland. This article is an open access article distributed under the terms and conditions of the Creative Commons Attribution (CC BY) license.