1. Introduction
Digital Twins (DTs) [
1] are revolutionizing urban governance by creating precise digital replicas of physical entities, enabling enhanced analysis, monitoring, and optimization of complex systems. In the field of smart mobility, DT technology is proving to be a game-changer, offering a virtual laboratory to improve urban transportation, making cities more efficient, sustainable and responsive to evolving demands. However, it is essential to distinguish between a fully operational real-time DT and the strategic simulation-based framework proposed in this work. While a standard mobility DT is typically defined as a live representation connected to continuous real-time data feeds, our proposal MobiCugat focuses on a high-fidelity virtual environment driven by real data. Although it does not operate in strict real-time it is classified as a Digital Shadow [
2,
3], and it functions as a Policy-testing Digital Twin, designed specifically for scenario experimentation and evidence-based long-term planning.
By integrating multi-source data (including ANPR camera logs, geospatial road network data, and AI-based traffic models), the MobiCugat framework reproduces the intricate dynamics of vehicle traffic, with a modular design extensible to public transport and micromobility. This virtual city serves as a risk-free testing ground where urban planners can evaluate structural changes, such as:
Infrastructure modifications: Simulating pedestrianization projects, the deployment of new bike lanes, or the reversal of traffic flow on specific streets to mitigate congestion in the urban core.
Traffic management: Testing traffic signal timing optimization and access restrictions, such as the implementation of LEZ.
Environmental impact: Estimating pollutant emissions and travel time variations prior to the physical implementation of changes in the urban layout.
While traditional traffic simulations often rely on static or hypothetical scenarios, our approach bridges the gap toward a Digital Twin by utilizing a continuous data pipeline—the Datamart pipeline developed by HoundLine [
4]—which integrates empirical data from LEZ cameras to calibrate the urban environment. This calibration is powered by the AI-based RUTGe [
5] model, developed by the SISCOM [
6] research group at the Universitat Politècnica de Catalunya (UPC). The result is a ‘living’ model of the city that, while executed offline to ensure computational depth and precision, provides the predictive power and spatial visualization necessary for informed decision-making in modern urban mobility.
1.1. Main Contributions
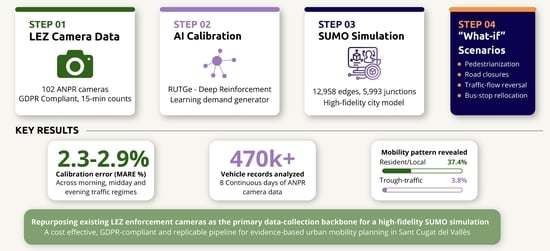
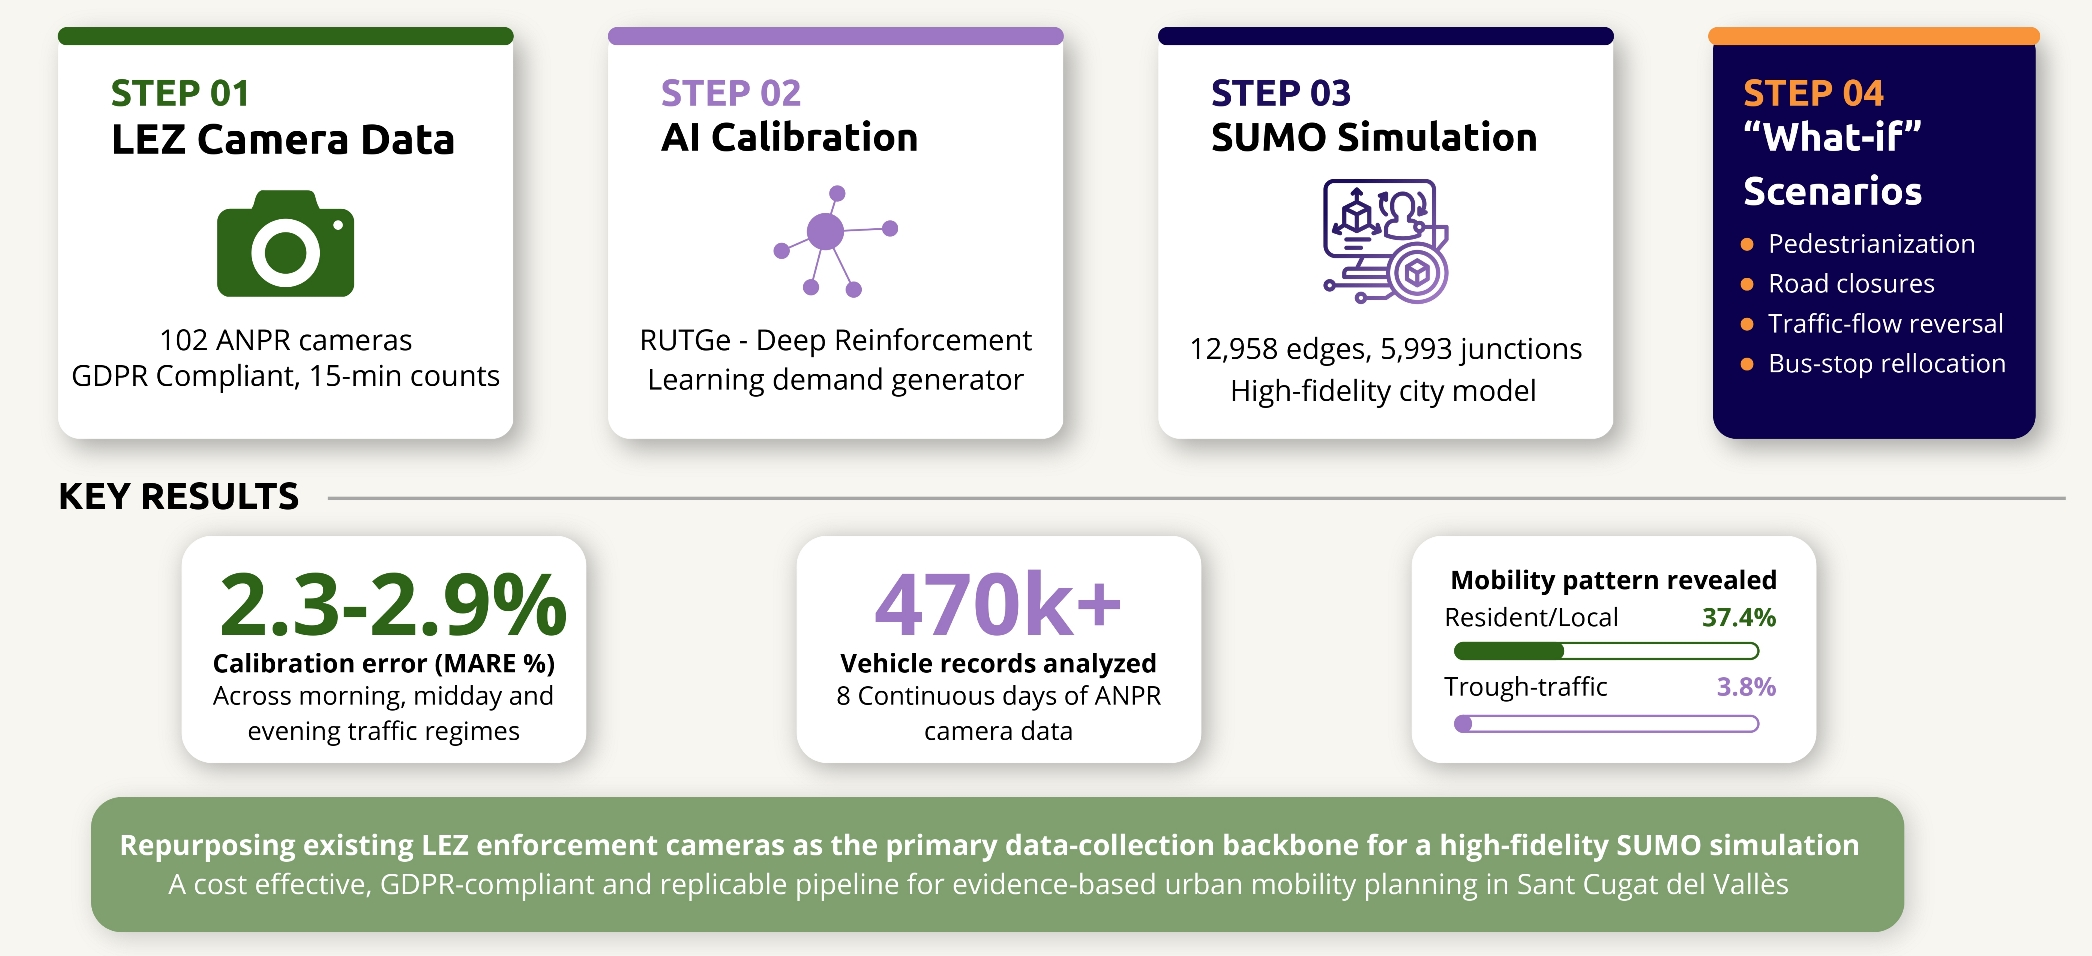
The main contributions of this work support its central claim: LEZ enforcement infrastructure can serve as a viable, GDPR-compliant calibration backbone for city-scale microscopic traffic simulation, and are the following:
- C1
Repurposing of LEZ Infrastructure for Strategic Planning. We demonstrate the technical feasibility of repurposing automatic number plate recognition (ANPR) data (originally designed for LEZ enforcement) as a high-fidelity calibration backbone for city-scale traffic modeling. This approach maximizes the public value of legacy sensor networks, offering a cost-effective alternative to dedicated traffic-sensing deployments.
- C2
A GDPR-Compliant Data-to-Simulation Pipeline. We present a robust, end-to-end methodological framework (MobiCugat) that integrates a privacy-aware data pipeline with AI-driven traffic generation (RUTGe) and microscopic simulation (SUMO) that is based on a data minimization principle. The proposed pipeline reproduces detector-level traffic intensities with high empirical accuracy across representative morning peak, midday off-peak, and evening peak traffic conditions, achieving values ranging between and in a complex urban network comprising more than 12,000 edges.
- C3
Validation of a Policy-Testing Digital Twin for Evidence-Based Governance. Through the case study of Sant Cugat del Vallès, we validate the use of a strategic policy-testing Digital Twin to quantify “what-if” scenarios, such as traffic evaporation, pedestrianization, and infrastructure modifications. This provides municipal planners with a validated, risk-free laboratory to evaluate long-term mobility policies and their systemic impacts before physical implementation.
- C4
A data-driven revision of prior mobility-pattern assumptions for the study area. Through trajectory classification of 470,344 vehicle records collected over eight continuous days, we show that resident and local traffic accounts for of all detected movements, while pure through-traffic represents only . This empirical finding substantially refines previous survey-based estimates and has direct implications for the design of access-control and pedestrianization policies.
1.2. Operational vs. Strategic Digital Twins
To clarify the scientific positioning of MobiCugat, it is essential to distinguish between Operational Digital Twins and Policy-testing Digital Twins. While both share the goal of creating a virtual representation of the city, they differ fundamentally in their temporal scales, target users, and primary objectives.
Operational Digital Twins are designed for real-time monitoring and immediate control. They operate with extremely low latency—typically in the range of milliseconds to seconds—to provide traffic operators with the data necessary for rapid reaction to live events, such as accidents or sudden congestion. There are several proposals for urban mobility digital twins, such as FlowTwin [
7], a methodology validated in Bologna that integrates real-world mobility data to enable continuous city-scale monitoring and simulation.
In contrast, MobiCugat is categorized as a Policy-testing Digital Twin. This framework prioritizes strategic simulation and prediction over immediate intervention. By processing data in longer cycles—ranging from minutes and hours to days—it allows for higher computational depth and more complex model calibration. This approach is specifically tailored for urban planners and policymakers, shifting the focus from day-to-day operations to robust “What-if” scenario analysis.
Ultimately, while operational twins serve as tools for reactive management, the MobiCugat framework acts as a strategic laboratory, enabling the evaluation of long-term mobility policies before they are implemented in the physical urban environment.
1.3. Context and Motivation
The motivation of this study is to address an underexplored gap in urban mobility research: although ANPR camera networks deployed for Low Emission Zone (LEZ) enforcement are now operational in hundreds of European municipalities, their volumetric data—already funded, and continuously generated—have not been systematically repurposed as the calibration backbone for city-scale microscopic traffic simulation. MobiCugat is designed to close this gap by providing a reproducible pipeline that turns this sensing infrastructure into a decision-support instrument for ex-ante evaluation of mobility interventions.
The accelerating pace of global urbanization presents cities with an increasingly complex array of mobility challenges. As urban populations grow, so do the demands placed on city transport networks, leading to traffic congestion, declining air quality, and mounting socioeconomic costs. According to the European Environment Agency, road transport remains one of the largest contributors to greenhouse gas (GHG) emissions and air pollution in urban areas; these effects are disproportionately felt in densely populated city centers [
8]. To mitigate these impacts, municipalities across Europe have adopted a range of policy instruments aimed at reducing vehicle emissions and improving urban livability, among which LEZs have emerged as one of the most widely deployed regulatory tools [
9].
LEZs restrict or deter the access of high-polluting vehicles to defined urban areas, typically enforced through a network of ANPR cameras installed at zone perimeters and key access points. While the primary purpose of such camera infrastructure is regulatory enforcement, the volumetric and positional data these sensors continuously generate represent a significantly underutilized asset. Each camera captures vehicle flows, directional movements, and temporal patterns that, if properly used, could offer a rich empirical basis for understanding and modeling urban mobility. Yet, to date, the exploitation of LEZ camera data for purposes beyond enforcement—most notably for dynamic traffic modeling—has received limited systematic attention in the literature.
The design of effective urban interventions requires a deep understanding of complex behavioral responses, such as traffic evaporation. Beyond the well-known phenomenon of induced demand, traffic evaporation [
10] is gaining recognition as a crucial element in urban restructuring. This concept, defined as the net reduction in vehicle volume when road capacity is reduced, is essential to designing effective and sustainable mobility policies. However, predicting the extent of this evaporation remains a significant challenge for local authorities. Our simulation framework addresses this gap by serving as a proactive decision-support tool. Using a validated Sant Cugat simulation tool, municipal technicians can perform ex-ante simulations to quantify the systemic impact of measures, such as lane removals or LEZ expansions. This capability allows for the estimation of potential traffic evaporation effects, ensuring that mobility policies are not only based on theoretical expectations but on evidence-based projections that balance urban livability with network efficiency.
The Smart City paradigm offers a compelling conceptual framework for addressing this gap. By treating urban infrastructure not only as a collection of single-purpose assets but as an interconnected ecosystem of data-generating nodes, smart city approaches enable cross-domain reuse of sensor data to support evidence-based governance and service optimization [
11]. Integration of existing sensor networks into decision-support workflows, including traffic planning, emergency response, and environmental monitoring, is a central tenet of this vision. In this context, re-purposing already-deployed LEZ camera infrastructure to feed data-driven traffic simulations represents a concrete, cost-effective manifestation of smart city principles: extracting additional public value from legacy infrastructure without incurring the costs associated with dedicated sensing deployments.
1.4. Traffic Simulation and SUMO
Traffic simulation has long been recognized as a powerful method for evaluating transportation policies, testing infrastructure modifications, and projecting the outcomes of mobility interventions prior to their physical implementation. Microscopic simulation tools model the behavior of individual vehicles and pedestrians as they navigate a road network, enabling the analysis of complex phenomena, such as congestion, spillback, and the distributional effects of access restrictions. This level of fidelity is particularly valuable when evaluating pedestrianization schemes or the addition of new roads. In such cases, the displacement of traffic flows often triggers secondary effects on surrounding streets—dynamics that aggregate-level models are inherently unable to capture.
Among the open-source platforms available to researchers and practitioners, the Simulation of Urban MObility (SUMO) [
12] suite has established itself as a leading tool for microscopic traffic simulation. SUMO enables the modeling of individual vehicle movements across complex road networks and supports the integration of diverse data sources, heterogeneous vehicle types, public transport, and traffic signal logic, making it particularly well-suited to the analysis of mixed urban traffic environments. Its open-source nature, great scalability and active community have made it the platform of choice in a wide range of urban traffic studies [
13,
14].
Despite its strengths, SUMO’s fidelity is ultimately constrained by the quality of the input data used to calibrate it. Generating realistic Origin–Destination (OD) matrices—specifying where trips start, where they end, and when—requires spatially disaggregated, time-resolved traffic counts. Tools such as SUMO’s native
dfrouter and
RouteSampler can approximate demand from partial sensor data, but they tend to under-represent residual traffic between detector locations and can yield significant errors when coverage is sparse [
5]. Access to spatially precise, real-world traffic counts has historically been a barrier for many municipalities, typically requiring the deployment of dedicated induction loops, Bluetooth sensors, or floating car data collection campaigns. To overcome this limitation, the Realistic Urban Traffic Generator for Urban Environments (RUTGe) [
5] was developed. RUTGe employs a data-driven demand-generation approach based on deep reinforcement learning that uses observed traffic intensities at fixed sensor locations to generate SUMO-compatible traffic demand whose simulated detector counts match the target measurements.
1.5. The MobiCugat Project
MobiCugat is a collaborative project involving HoundLine [
4] (a technology company specializing in data analytics for urban mobility), the SISCOM research group [
6] of the Network Engineering Department at the Universitat Politècnica de Catalunya (UPC), and the Mobility Department of the Sant Cugat del Vallès City Council [
15]. The project’s central research question was:
“Can the ANPR camera data generated by Sant Cugat’s LEZ enforcement network be repurposed as the primary data-collection backbone for a high-fidelity SUMO simulation of the city’s road network?”The policy motivation was concrete. The Sant Cugat City Council was evaluating proposals to use simulation tools to inform day-to-day decisions on city-wide mobility. The Council sought evidence-based simulation studies to compare traffic impacts before committing to physical interventions.
This paper presents the methodology and results of this collaboration, demonstrating that the full pipeline—from raw LEZ camera detections to scenario-based SUMO policy evaluation—is both technically feasible and practically effective.
1.6. Structure of the Paper
The remainder of this paper is organized as follows.
Section 2 summarizes the related work.
Section 3 describes the materials and methods used in this work: the study area, data sources, data processing pipeline, road network construction, traffic demand generation using RUTGe, simulation setup, and description of the scenario of evaluation.
Section 4 presents the results, including the camera-based mobility pattern analysis, baseline simulation validation and the resulting traffic heatmaps.
Section 5 discusses the implications of the findings for policy and methodology, including limitations and scalability considerations.
Section 6 summarizes the key conclusions.
Section 7 outlines directions for future work.
2. Related Work
In this section, we review prior work related to the MobiCugat pipeline, which repurposes LEZ/ANPR sensing infrastructure to calibrate a microscopic traffic simulation and support scenario-based mobility assessment. We first summarize studies on data-driven traffic demand modeling, including origin–destination (OD) and zonal flow representations derived from partial observations, which are commonly used to structure demand without necessarily aiming at full OD reconstruction. We then discuss SUMO-based urban traffic studies and calibration practices in open-source simulation environments [
12,
14]. Finally, we briefly connect this work to the broader context of LEZ deployment and evaluation in Europe [
8,
9], which motivates the need for realistic, reproducible simulation tools to assess the mobility impact of regulatory and infrastructural interventions.
OD matrix estimation from sensor data. Estimating origin–destination (OD) demand from partial traffic observations is a long-standing topic in transportation research [
16], motivated by the need to infer trip patterns from measurements collected at a limited set of locations. Beyond fixed sensors, a substantial body of work has shown that large-scale mobility traces—for example, from mobile-phone records—can reveal recurrent aggregate mobility patterns that are informative for demand modeling [
17]. Several articles model the reconstruction of path flow from license plate scans, and try to find the optimal placements of detection cameras [
16,
18,
19]. However, said articles focus on theoretical modeling and are exclusively evaluated on graph networks of small size compared to a city. A number of studies have been conducted on the use of ANPR data for OD matrix estimation in highways. Asakura et al. [
20] and Fu et al. [
21] use ANPR cameras, traffic flow monitoring cameras, supersonic vehicle detectors, and toll gate sensors to generate OD matrices in the Kobe-Osaka corridor line expressway and the China expressway, respectively. In typical municipal deployments, sensing coverage remains sparse and heterogeneous, which makes OD inference fundamentally ill-posed: multiple OD configurations can be consistent with the same set of link counts unless additional assumptions or regularizations are introduced. However, several studies focus on OD matrix estimation in urban environments. Rao et al. [
22] use ANPR data to reconstruct complete trajectories to estimate the path flows and construct an OD matrix. This approach uses complete trajectories that may leak sensitive users’ information [
23], and although the proposed method was tested using data from a traffic network in Kunshan (China), we have not found any application of this method to apply policies in a real-world scenario. Liu et al. [
24] present an OD matrix prediction using ANPR data and a supervised machine learning approach, extrapolating a future OD matrix given an observed series, rather than creating an OD matrix consistent with the intensity counts at every timestep. Zargari et al. [
25] use data from ANPR cameras, smart fare cards, loop detectors, GPS of navigation software, and socioeconomic and demographic characteristics to generate OD matrices in the city of Tehran. However, they use supervised learning to infer said OD matrices, while in our context this is not feasible.
Many practical pipelines aimed at microscopic simulation adopt coarser abstractions instead of directly working with OD matrix estimation, such as zonal flow models and count-based calibration, focusing on reproducing observed intensities at detectors rather than recovering a unique, fully specified OD matrix [
12,
14]. This perspective aligns with the objectives of MobiCugat, where detector-aware targets are used to drive demand generation and route synthesis in SUMO under realistic municipal sensing constraints.
SUMO-based urban traffic studies. SUMO is one of the most widely used open-source microscopic traffic simulators for urban-scale experimentation, supporting detailed vehicle interactions, infrastructure elements (e.g., intersections and traffic lights), and the extraction of traffic and emissions indicators for policy analysis [
12]. A key practical challenge in SUMO-based studies is that results are highly sensitive to how traffic demand is specified and calibrated. In this regard, Barbecho Bautista et al. [
14] systematically compared several SUMO traffic demand generation tools (including
dfrouter,
activitygen, and random-demand generators) and showed that different demand generators can produce substantially different traffic dynamics even on the same network, thereby motivating calibration procedures grounded in empirical measurements.
Overall, this line of work confirms that realistic urban simulation requires not only an accurate network model but also a demand generation workflow informed by real traffic data—precisely the type of requirement addressed in the MobiCugat calibration pipeline.
Camera and ANPR data for traffic modeling and calibration. Fixed camera networks—including ANPR systems—are widely deployed in cities for traffic monitoring and enforcement, and their data have increasingly been studied as a source for mobility analytics (e.g., vehicle counting, classification, and link-level performance indicators) [
26,
27,
28,
29]. However, reusing ANPR infrastructures for simulation calibration raises specific data-protection constraints, since raw plate-level records may reveal private information of real users. In this work, the Sant Cugat pipeline follows a privacy-by-design approach: the municipality discards vehicle identifiers at source and provides only aggregated traffic counts over fixed time intervals, which are sufficient to calibrate a SUMO-based model while remaining aligned with the principles of data protection by design and by default (Article 25 GDPR) [
30].
LEZ deployment in Europe and the need for scenario-based evaluation. The rapid expansion of LEZ across Europe reflects a broader policy shift toward reducing transport-related emissions and improving urban livability. A recent systematic review by Delgado-Lindeman et al. [
9] highlights both the diversity of LEZ designs (e.g., scope, enforcement mechanisms, exemptions) and the heterogeneity of observed effects across cities. From a mobility-systems perspective, such measures can induce network-wide changes (e.g., rerouting, temporal displacement, and boundary effects) that are not fully captured by local measurements alone. In parallel, European environmental assessments emphasize that achieving more sustainable mobility systems requires robust, data-driven decision support capable of evaluating interventions before deployment [
8]. This context motivates reproducible traffic simulation workflows that can be calibrated with the data streams already available to municipalities—such as LEZ camera counts—and then used to test alternative street configurations and access-control policies under realistic demand assumptions.
3. Materials and Methods
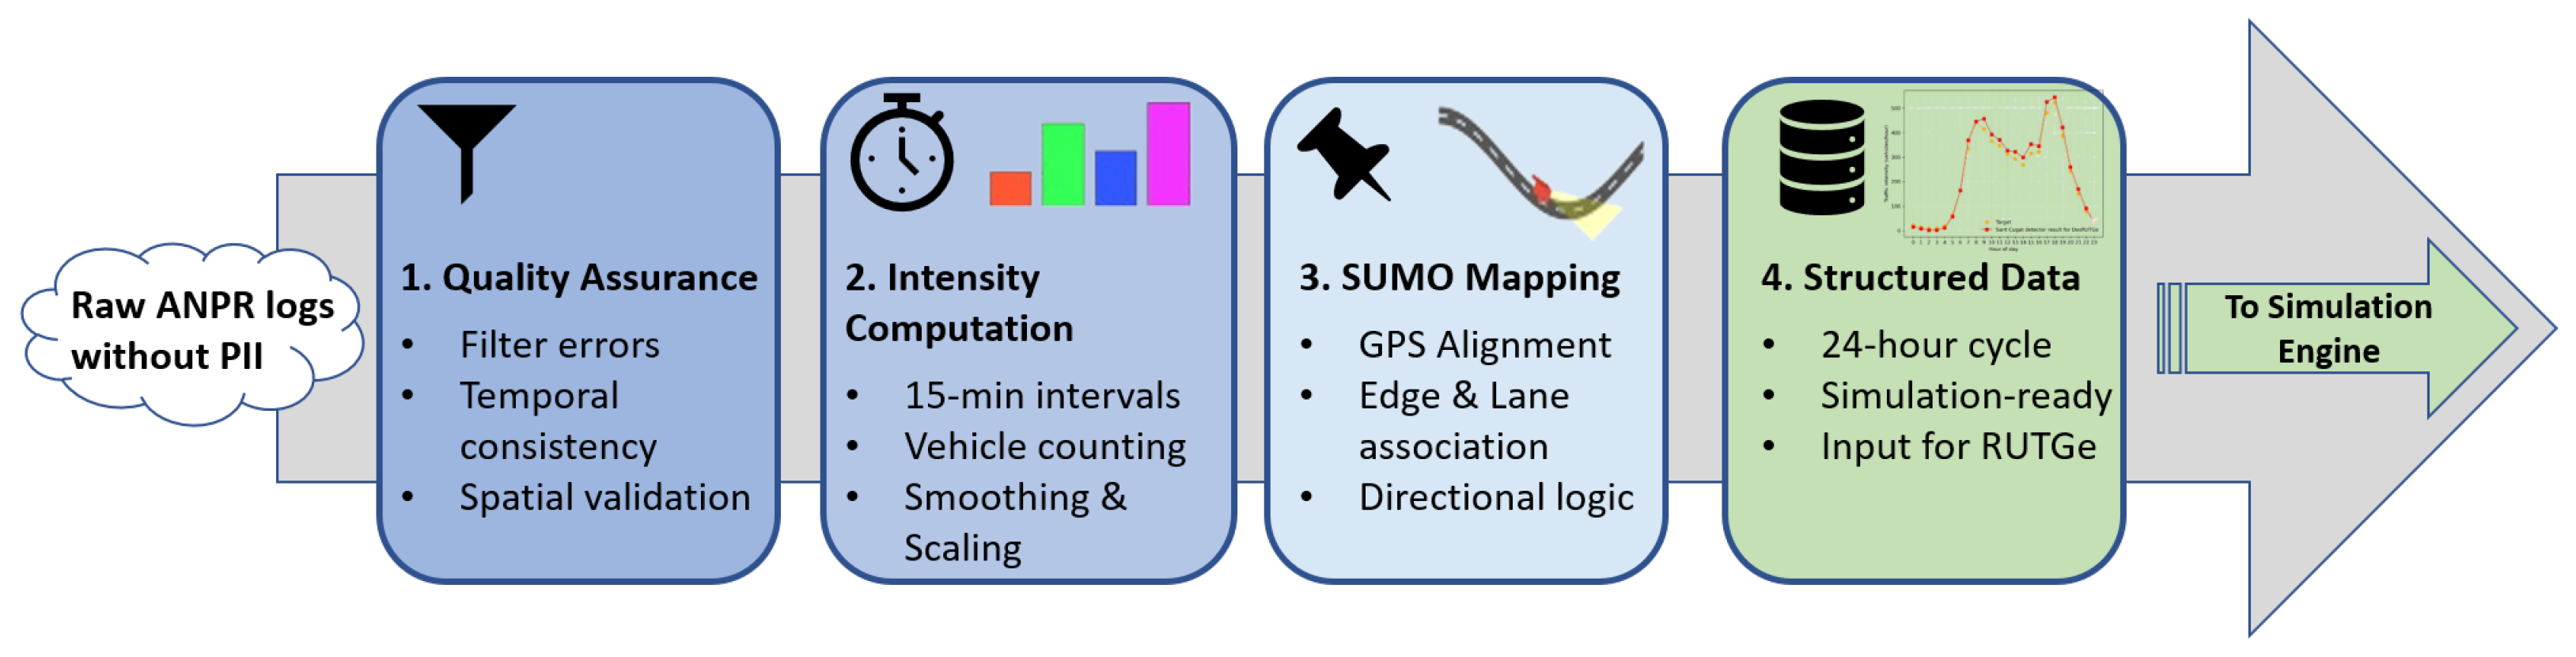
To carry out this study, we first examined the road network of Sant Cugat and evaluated the available data sources. Subsequently, we designed a methodology to process these data and generate the necessary inputs for our SUMO-based framework, as illustrated in
Figure 1. Additional key tasks, such as road network refinement and the generation of realistic traffic profiles using the RUTGe tool [
5], were also performed. The following sections detail each of these phases in detail.
3.1. Study Area: Sant Cugat del Vallès
The study focuses on the municipality of Sant Cugat del Vallès, located approximately northwest of Barcelona in Catalonia, Spain. With a population of roughly 98,000 inhabitants distributed across , Sant Cugat is characterized by a complex road network that serves both local residential traffic and significant commuter flows connecting to the broader Barcelona metropolitan area. The municipality’s historical center, defined by narrow streets and heritage landmarks, contrasts with expanding residential and commercial zones linked by major arterial roads. This urban duality presents unique challenges for traffic management, as the City Council seeks to balance economic vitality and heritage preservation with environmental sustainability.
In 2021, the Sant Cugat del Vallès City Council established a LEZ as part of a regional strategy to mitigate air pollution and improve urban air quality in accordance with European Union directives. The LEZ enforcement framework is supported by an extensive network of ANPR cameras, strategically deployed at key entry and exit points, as well as critical internal intersections. This infrastructure enables the continuous monitoring of vehicle flows, capturing time-stamped detections and high-resolution classification data—such as engine type and emissions labels—retrieved through cross-referencing license plates with national vehicle registries.
The primary focus of this study encompasses a diverse urban fabric, including the historical city center, consolidated residential districts, and several peripheral industrial zones. This area is characterized by a multimodal mobility landscape, featuring high pedestrian density, an extensive bus network, and key points of interest, such as the local marketplace and heritage landmarks.
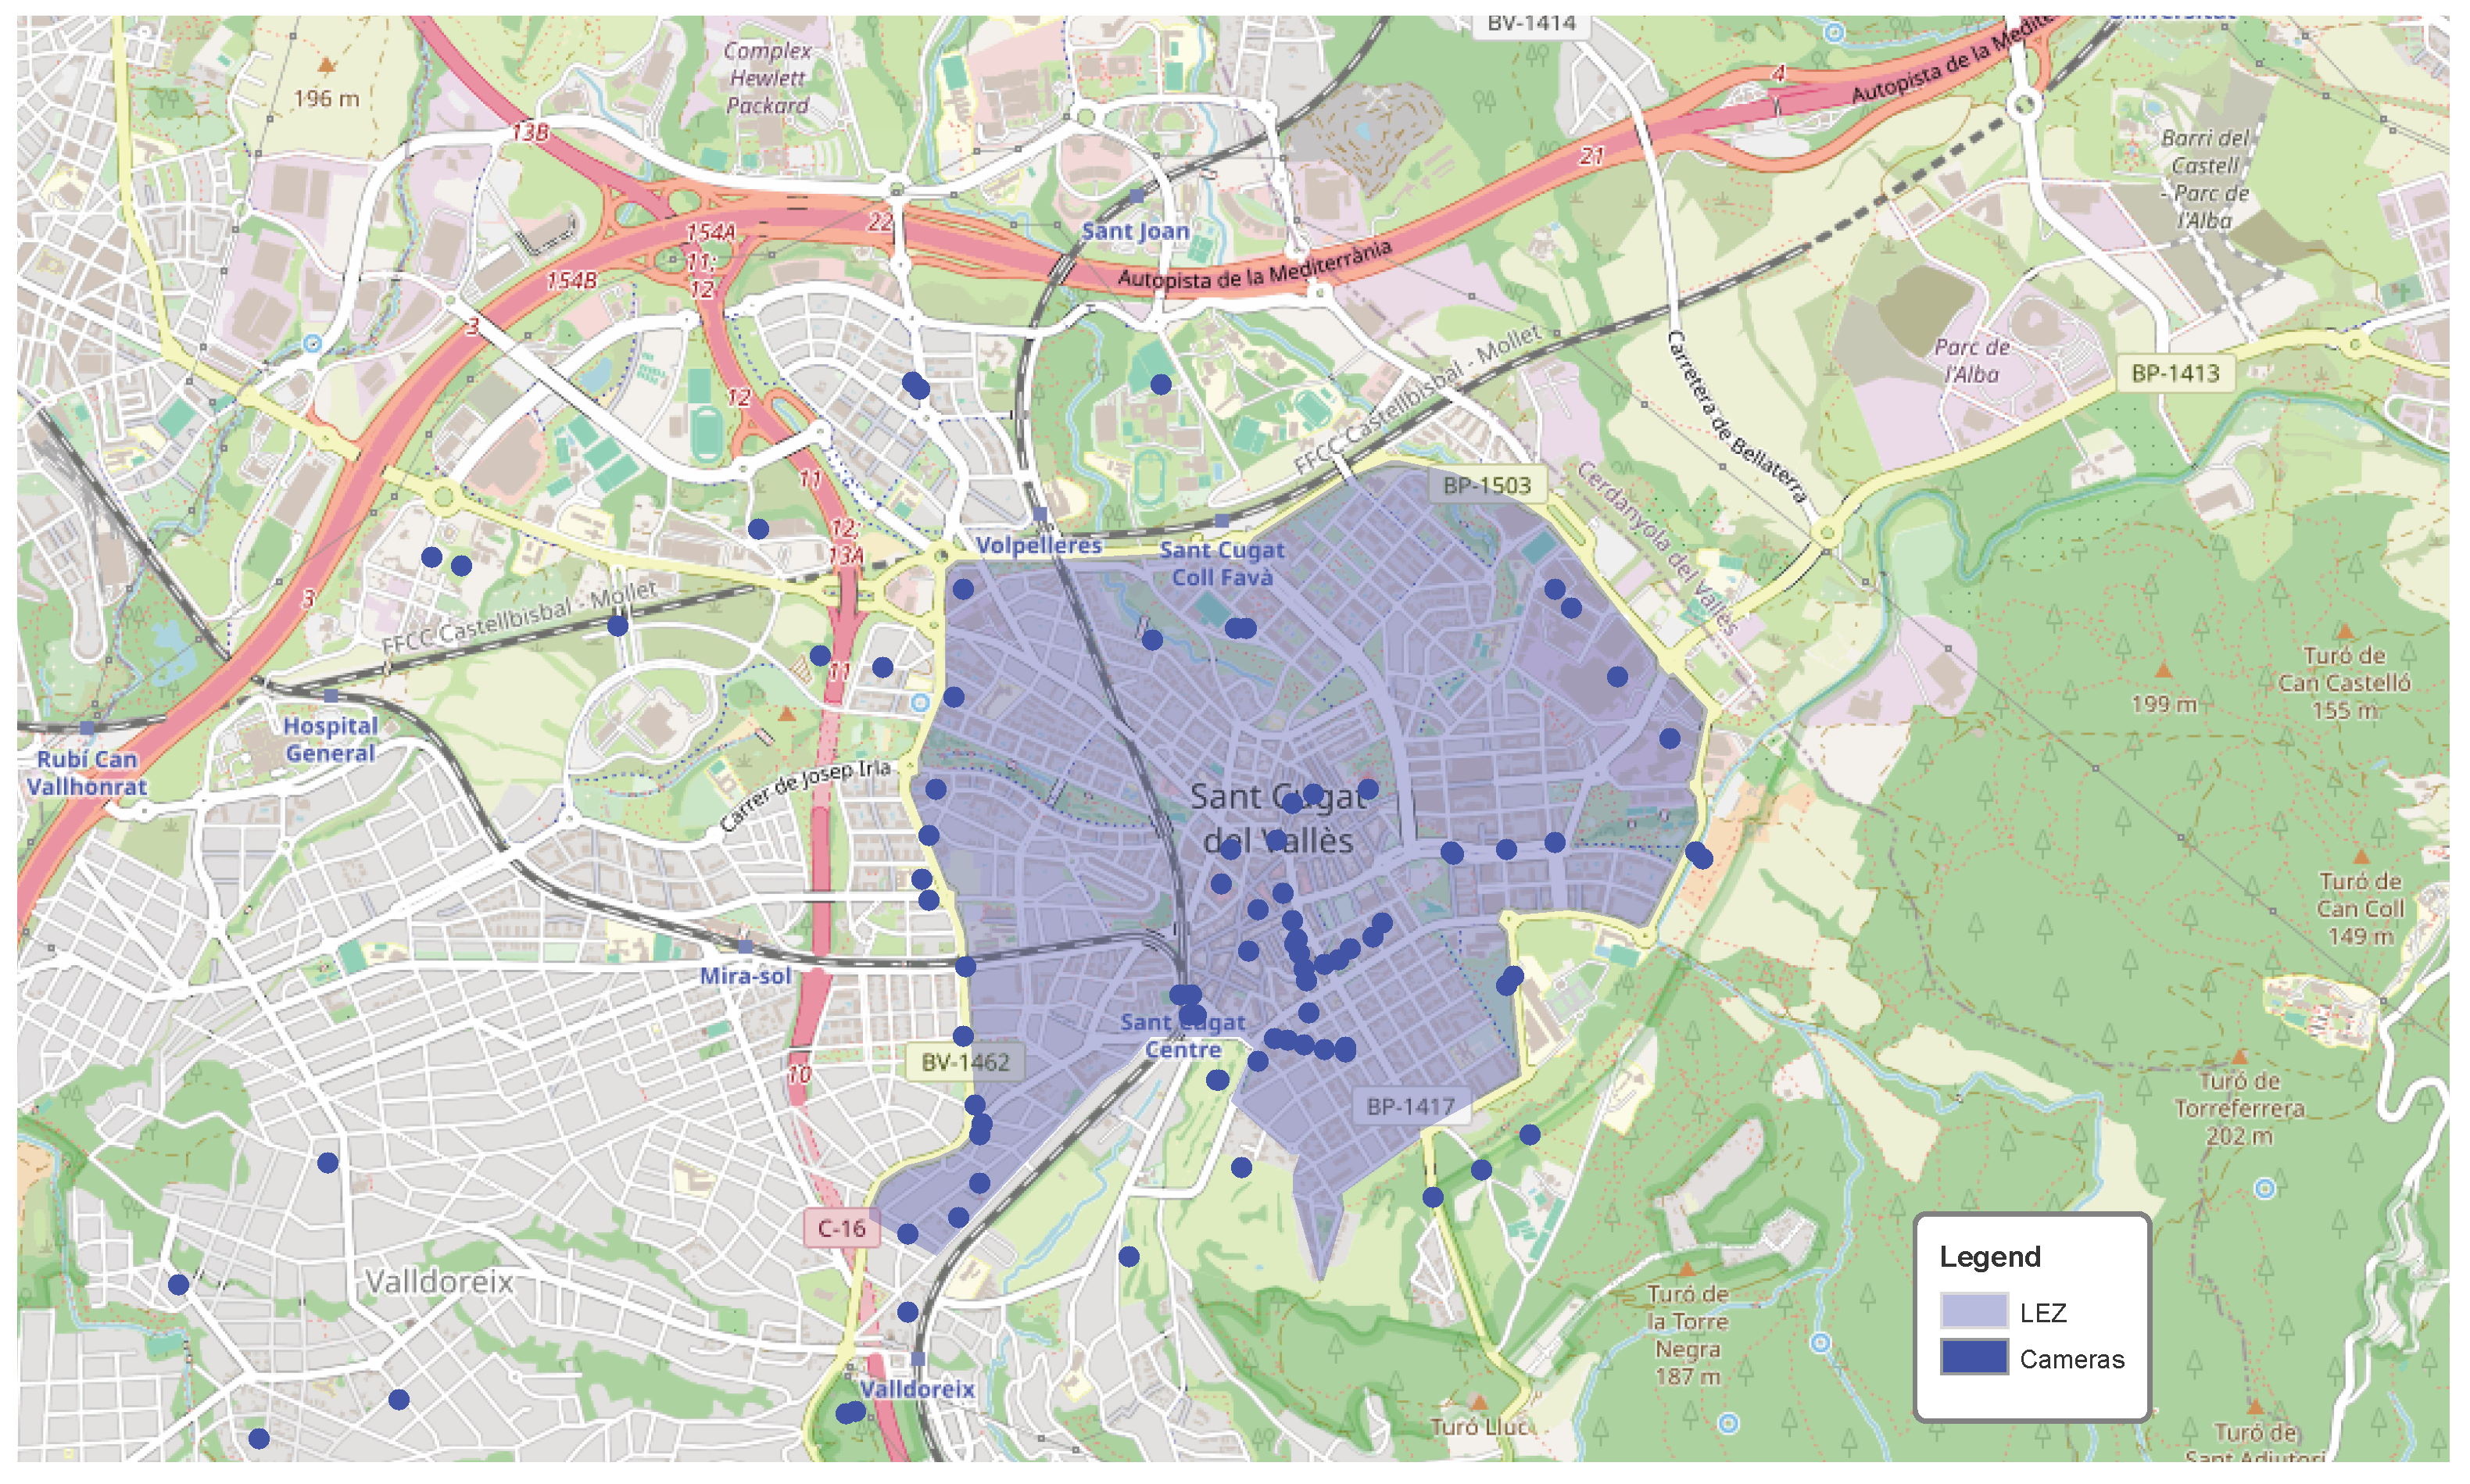
Figure 2 provides a geospatial overview of the study area, highlighting the LEZ perimeter and the strategic deployment of the 102 ANPR camera network.
3.2. Data Sources
The proposed framework integrates two main data sources: (i) ANPR camera data; and (ii) road network data, as described below.
ANPR Camera Data. The primary data source for this study was the vehicle detection records generated by the LEZ ANPR camera network operated by the Sant Cugat City Council. Two datasets were used: a single-day dataset covering Thursday 9 October 2025 (combining both camera types), and a one-week dataset covering the period 10–16 November 2025. Together, these datasets captured vehicle movements across over 100 camera locations distributed throughout the municipality.
Two distinct camera types are deployed in Sant Cugat’s LEZ infrastructure and play complementary roles in the data collection framework. TM cameras are positioned at the LEZ boundary and principal entry corridors, recording vehicles crossing the zone perimeter. AVM cameras are located within the pedestrian center and manage resident access, recording movements at controlled internal access points. The combination of both camera types provides broad spatial coverage spanning both the outer boundary and the internal road network of the study area.
In this study, we use TM cameras as the primary source for calibration targets, since they monitor boundary crossings and main access corridors and provide stable flow measurements suitable for demand calibration. A data-quality screening was applied in collaboration with the City Council’s mobility specialists to exclude camera streams affected by systematic issues (e.g., inconsistent counting, misclassification, or malfunctioning periods). As a result, the baseline calibration and validation were conducted on the subset of TM camera locations with reliable time series, which corresponds to 37 detector locations mapped to SUMO induction loops for the selected analysis window. This filtering is only applied to the SUMO calibration workflow; the mobility-pattern analysis uses both TM and AVM cameras.
For each detected vehicle event, the LEZ-based dataset includes: (i) timestamp (date and time at second-level precision); (ii) camera identifier; and (iii) vehicle direction (approach or away from the camera). Crucially, to ensure compliance with the General Data Protection Regulation (GDPR) [
30], individual vehicle identifiers (license plate numbers) were removed at source, and only aggregated counts and flow patterns were retained. This privacy-by-design approach is a cornerstone of the pipeline and enables the data to be used for research and planning purposes without the legal and ethical risks associated with tracking individual vehicles.
Road Network Data. The base road network geometry and topology were obtained from OpenStreetMap (OSM) [
31], a collaborative mapping platform providing open-access geospatial data. OSM data includes information on road types, lane counts, speed limits, and topological connectivity. However, as detailed in
Section 3.4, the raw OSM data required substantial enrichment and validation to ensure accuracy for traffic simulation purposes. Although Sant Cugat maintains an official GIS-based road inventory, these data was not available for integration during the present collaboration. Consequently, the simulation network was constructed from OpenStreetMap and subsequently refined with the support of municipal mobility specialists.
3.3. Data Processing Pipeline
HoundLine developed an automated data processing pipeline to transform the raw ANPR camera detection logs into structured traffic intensity data suitable for simulation input. The pipeline comprised the following four steps, also illustrated schematically in
Figure 1. It should be noted that the Raw ANPR logs do not contain Personally Identifiable Information (PII). Any sensitive data, such as license plate numbers, was removed at the source before the dataset was transferred from the LEZ camera network.
- 1.
Data cleaning and quality assurance: Raw detection records were subjected to automated quality control procedures to identify and filter erroneous or duplicate entries. Temporal consistency checks ensured that timestamps fell within the expected ranges, and spatial validation confirmed that camera identifiers corresponded to known deployment locations. Records flagged as anomalous (e.g., implausible detection sequences, missing metadata) were excluded from subsequent processing. This step also included a sensor-level screening to exclude camera locations with systematic measurement anomalies, yielding the final subset of reliable TM-based targets used for calibration.
- 2.
Temporal aggregation and intensity computation: Clean detections were aggregated into 15-min intervals to generate time series of vehicle counts per camera location. This temporal resolution balances the granularity in traffic dynamics with downstream simulation costs and is commonly used in operational traffic monitoring practice (
https://rosap.ntl.bts.gov/view/dot/4491, FHWA, Travel Time Data Collection Handbook, accessed on 13 May 2026).
- 3.
Geospatial and directional referencing: Each camera location was georeferenced onto the SUMO road network using GPS coordinates provided by the City Council. This alignment associated each camera-derived time series with a specific road segment (edge), and when needed, with its driving direction and lane-level coverage. This step is essential to (i) deploy virtual detectors at the corresponding network positions and (ii) define detector-aware calibration targets used by the demand-generation stage (
Section 3.5).
- 4.
Output dataset: The pipeline generated a structured dataset of time-indexed traffic intensities per camera location. These intensities are recorded in 15-min intervals and aggregated hourly, spanning full 24-h cycles across different day profiles (e.g., weekdays and weekends). This dataset serves as the empirical basis for the subsequent traffic demand generation and calibration workflow.
3.4. Road Network Construction
The digital representation of the Sant Cugat road network was developed through a hybrid approach, combining automated extraction from OSM with manual refinement informed by the local expertise of the municipal Mobility Services Department. The initial network geometry was obtained by querying the OSM database for all road segments within the municipal boundary of Sant Cugat del Vallès using the osmWebWizard tool, native to the SUMO environment. OSM data includes detailed information on road types (motorway, primary, secondary, residential, etc.), lane counts, speed limits, topological connectivity, and traffic light periodicity, making it a valuable starting point for simulation network construction.
However, while OSM data is comprehensive, it often contains inaccuracies or omissions regarding recent infrastructure updates, local traffic regulations, and fine-grained geometric details. To address these limitations, the raw OSM-derived network underwent a thorough manual review and refinement process in close collaboration with the Sant Cugat City Council’s Mobility Department. Working alongside municipal expert staff, we identified and corrected connectivity errors, updated speed limits and lane configurations to reflect current conditions, and verified the placement of traffic signals and stop signs. Furthermore, we incorporated local traffic management measures often absent from OSM, such as turn restrictions, bus-only lanes, one-way designations, and temporary road closures. The role of municipal specialists was restricted to validating and correcting the road-network representation and local traffic-management attributes, not to manually generating or tuning traffic demand.
The network was encoded in SUMO’s native XML format and modified using the
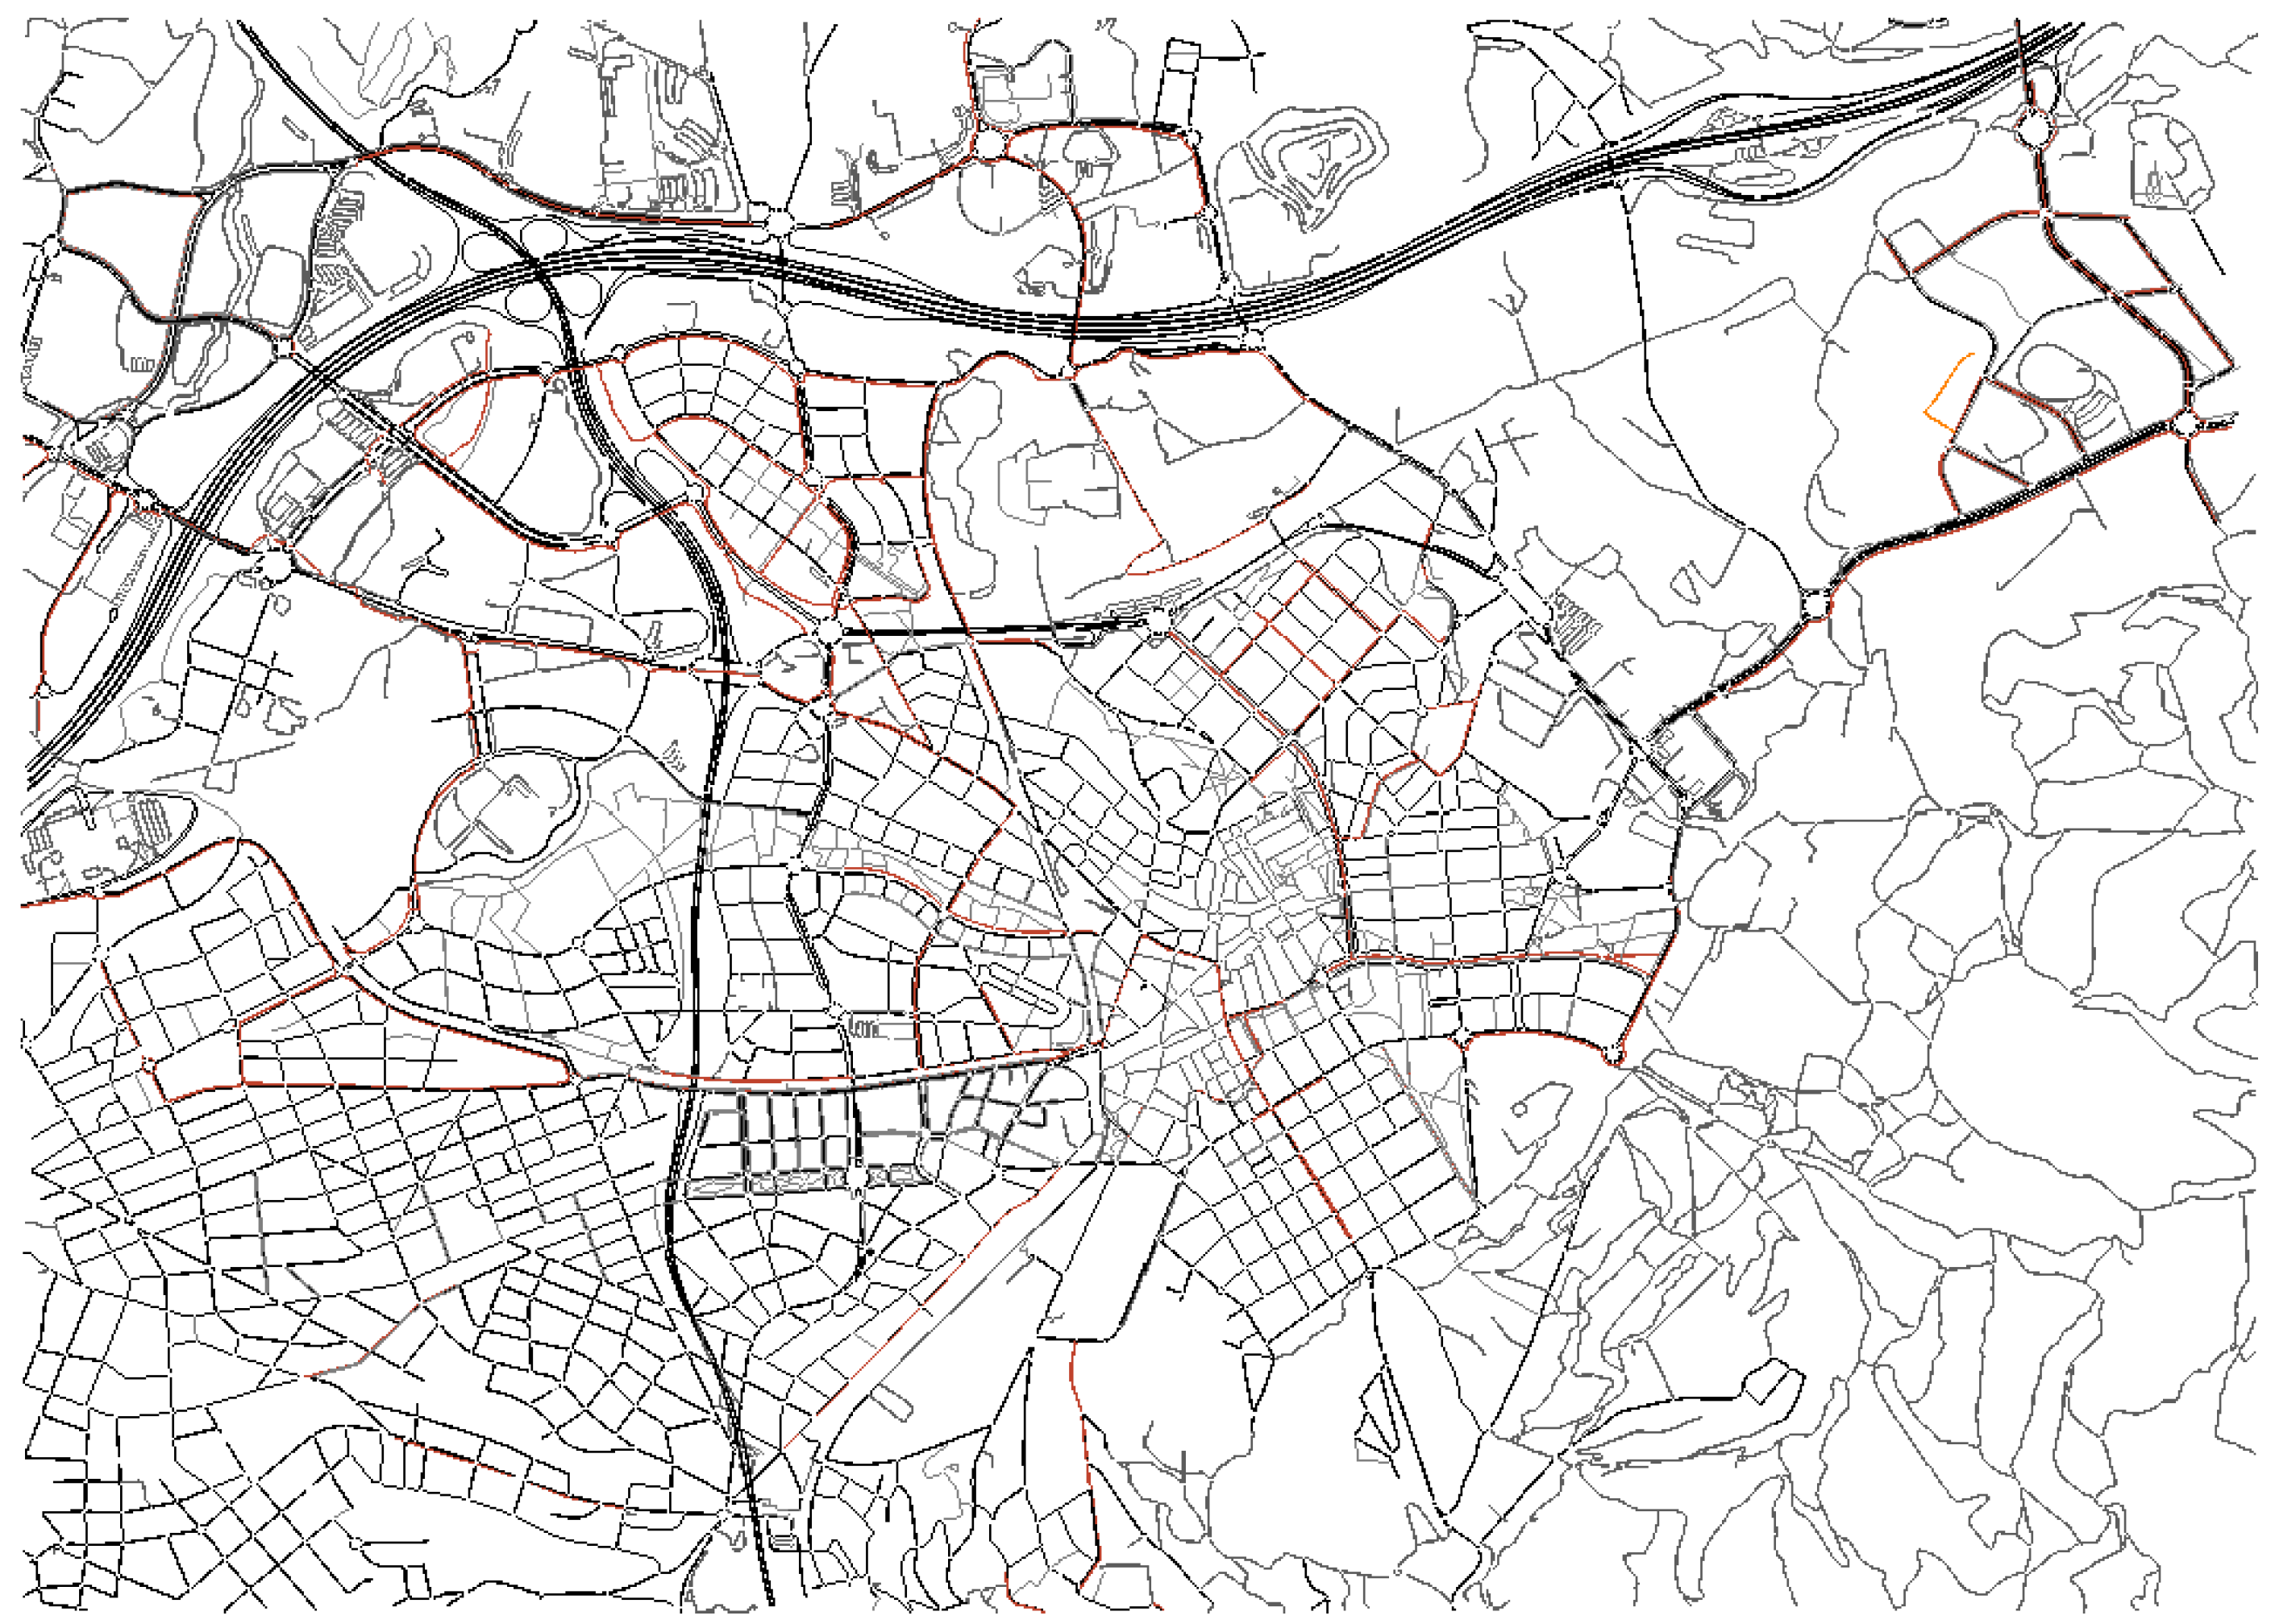
netedit graphical editor distributed with the SUMO software suite. The final validated network model comprised 5993 junctions (intersections) and 12,958 edges (road segments), covering a surface of roughly 29.5 km
2. Edge attributes included the number of lanes, maximum speed, road type, and junction control type (priority-controlled, traffic-light-controlled, or roundabout). Traffic signal timings were encoded based on the data obtained from OSM.
Figure 3 shows an overview of the validated SUMO road network for Sant Cugat.
It should be noted that despite the manual review, OSM data may still exhibit minor discrepancies when compared to the authoritative ground truth maintained in the City Council’s official Geographic Information System (GIS). Consequently, replacing the OSM-derived network with a direct GIS integration to enhance topological fidelity is a primary objective of our forthcoming research, as detailed in
Section 7.
3.5. Traffic Demand Generation Using RUTGe
This project relies on a data-driven traffic demand generation pipeline that transforms aggregated ANPR camera counts into a SUMO-compatible route set for the selected analysis horizon. The objective is not to reconstruct individual trajectories from enforcement data, but to generate a synthetic yet realistic traffic demand that reproduces the observed intensity patterns at the monitoring locations and supports scenario-based experimentation on the municipal road network. To this end, we build upon the methodology of the Realistic Urban Traffic Generator (RUTGe) [
5], adapting its practical use to the characteristics of the Sant Cugat dataset and to the availability of multiple detector-level calibration targets.
3.5.1. From ANPR Counts to Detector-Aware Targets at 15-min Resolution
The LEZ infrastructure provides time-stamped vehicle detections at each camera location. After the data aggregation (
Section 3.3), detections are discretized into fixed 15-min intervals to obtain per-camera intensity targets for the baseline day. These targets are then mapped to the simulation environment by deploying virtual induction-loop detectors on the corresponding road segments in SUMO. In this way, each real camera location is paired with a simulated detector that reports traffic counts over the same 15-min windows, enabling direct, quantitative comparison between observed and simulated intensities.
Although the full day is processed to characterize demand patterns, we select three representative validation windows covering distinct traffic regimes.
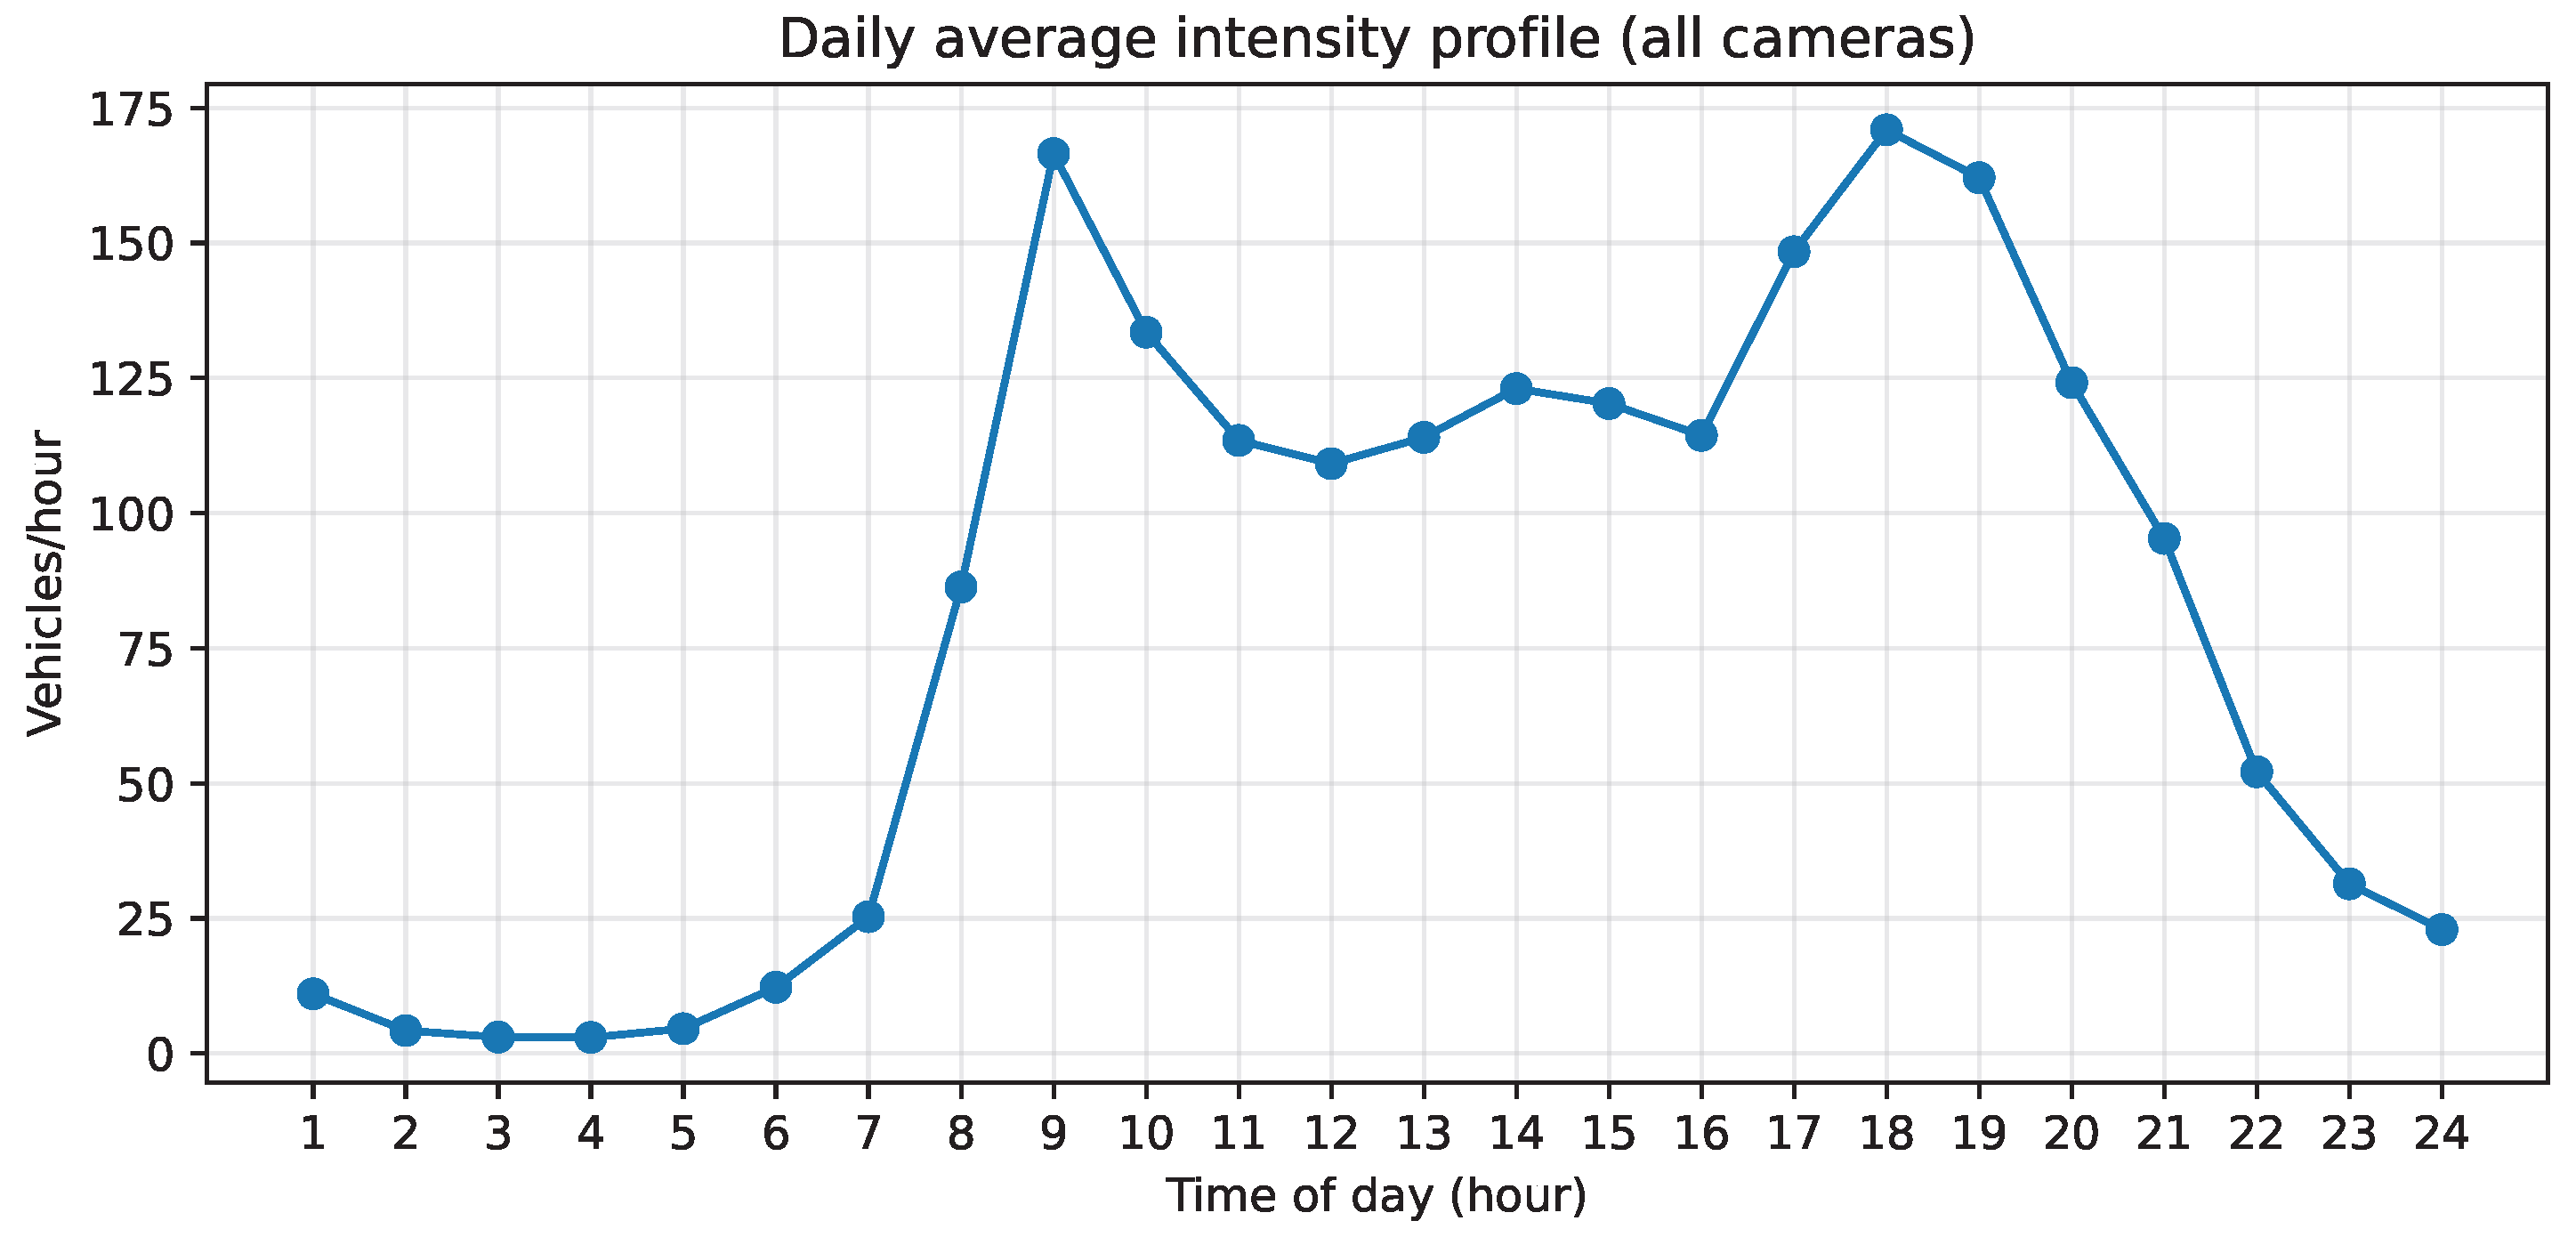
Figure 4 shows the mean hourly intensity aggregated over all monitoring locations, highlighting a pronounced morning peak, a lower inter-peak period around midday, and a second peak during the evening. Accordingly, the validation considers: (i) the morning peak hour (09:00–10:00); (ii) the midday off-peak hour (12:00–13:00); and (iii) the evening peak hour (18:00–19:00). This selection allows the calibration quality to be assessed under high-demand and lower-demand operating conditions.
3.5.2. Detector-Level Calibration Targets and Iterative Demand Adjustment
The use of RUTGe in the MobiCugat project differs from the original Barcelona case study [
5] in one key aspect: rather than calibrating traffic against a single city-wide average target, the objective here is to reproduce as closely as possible the observed vehicle counts at each detector location. Concretely, the 15-min intensity time series obtained from the LEZ camera network (
Section 3.3) were mapped to their corresponding virtual induction loops in SUMO, so that each detector defines an independent calibration target. This detector-aware formulation is aligned with the operational goal of the Sant Cugat Local Council: obtaining a realistic baseline simulation that matches measured traffic volumes at the specific streets where sensors are deployed and where policy interventions are evaluated.
Matching many detector targets simultaneously is inherently a coupled calibration problem: improving the fit at one location can alter counts elsewhere due to network interactions and route choice effects. For this reason, the calibration is carried out as an iterative demand-adjustment process, where a candidate route file is generated, simulated, and compared against the detector targets, and then the demand inputs are updated accordingly. The next subsection describes the RUTGe demand-generation framework used to implement this iterative calibration process and to produce the SUMO-compatible route set used in the baseline scenario.
3.5.3. RUTGe Traffic Demand Generation Framework
The traffic demand generation process in MobiCugat is based on the Realistic Urban Traffic Generator (RUTGe) framework proposed in [
5]. RUTGe is a data-driven traffic generation methodology designed to produce synthetic yet realistic SUMO-compatible traffic demand from sparse detector measurements distributed across an urban road network.
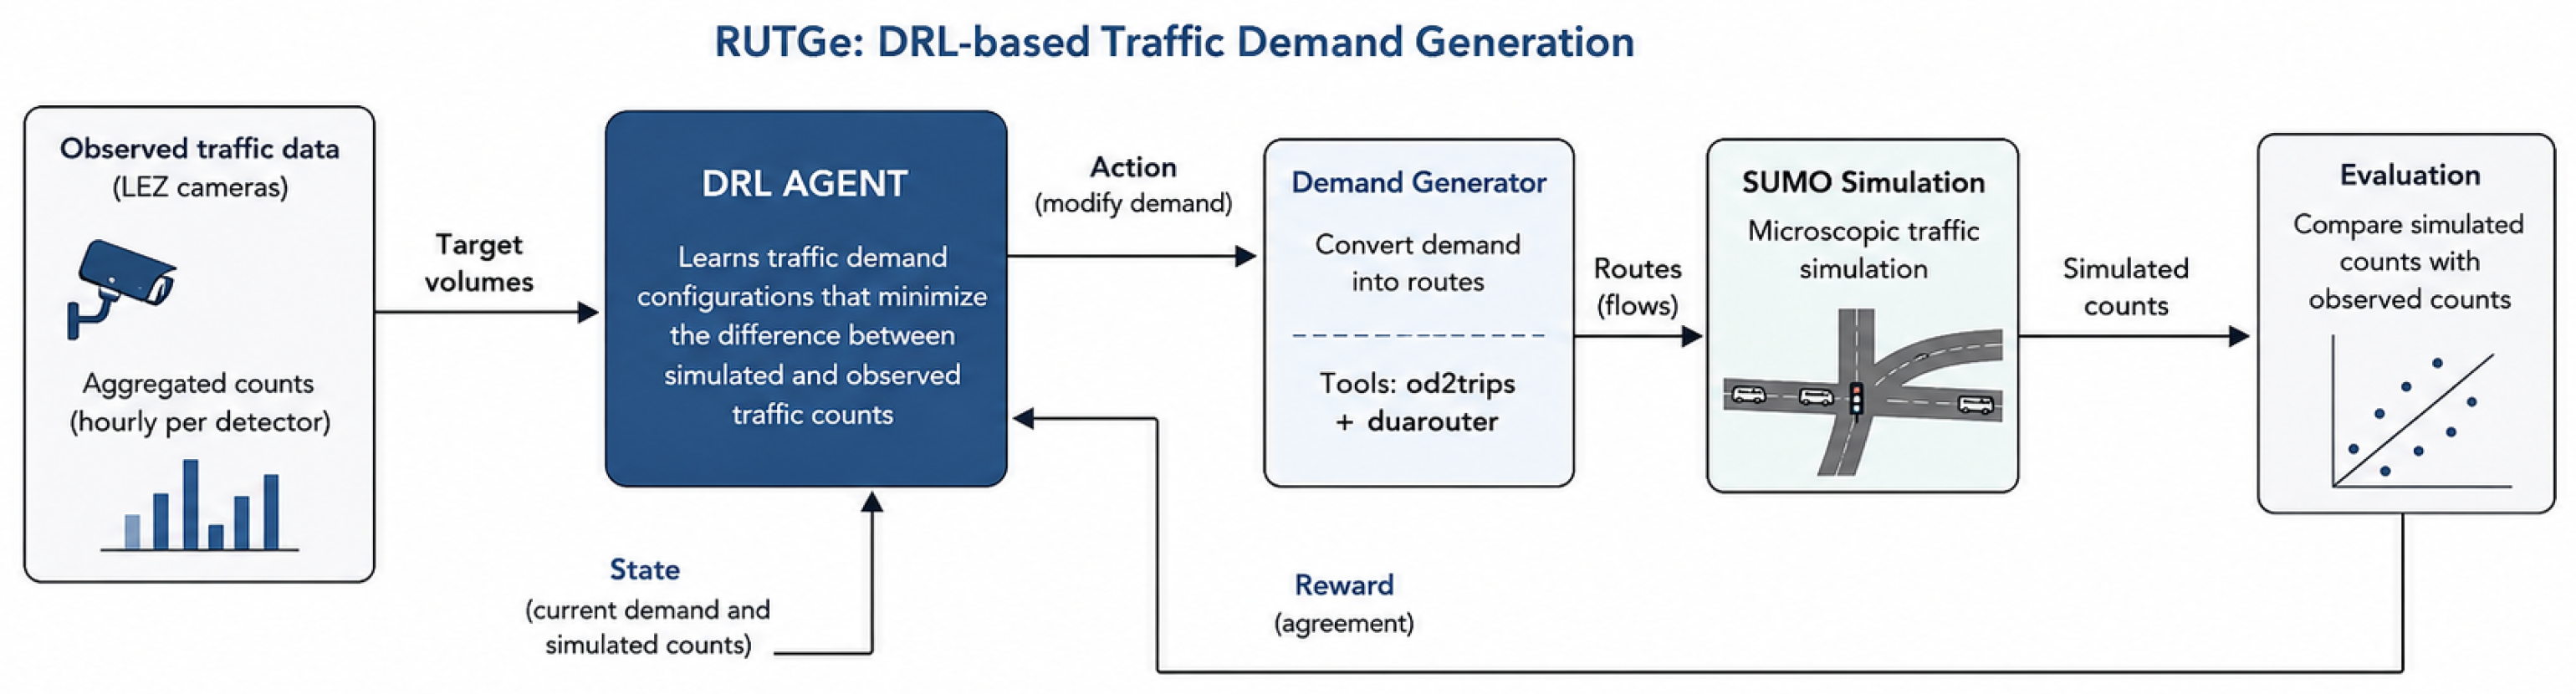
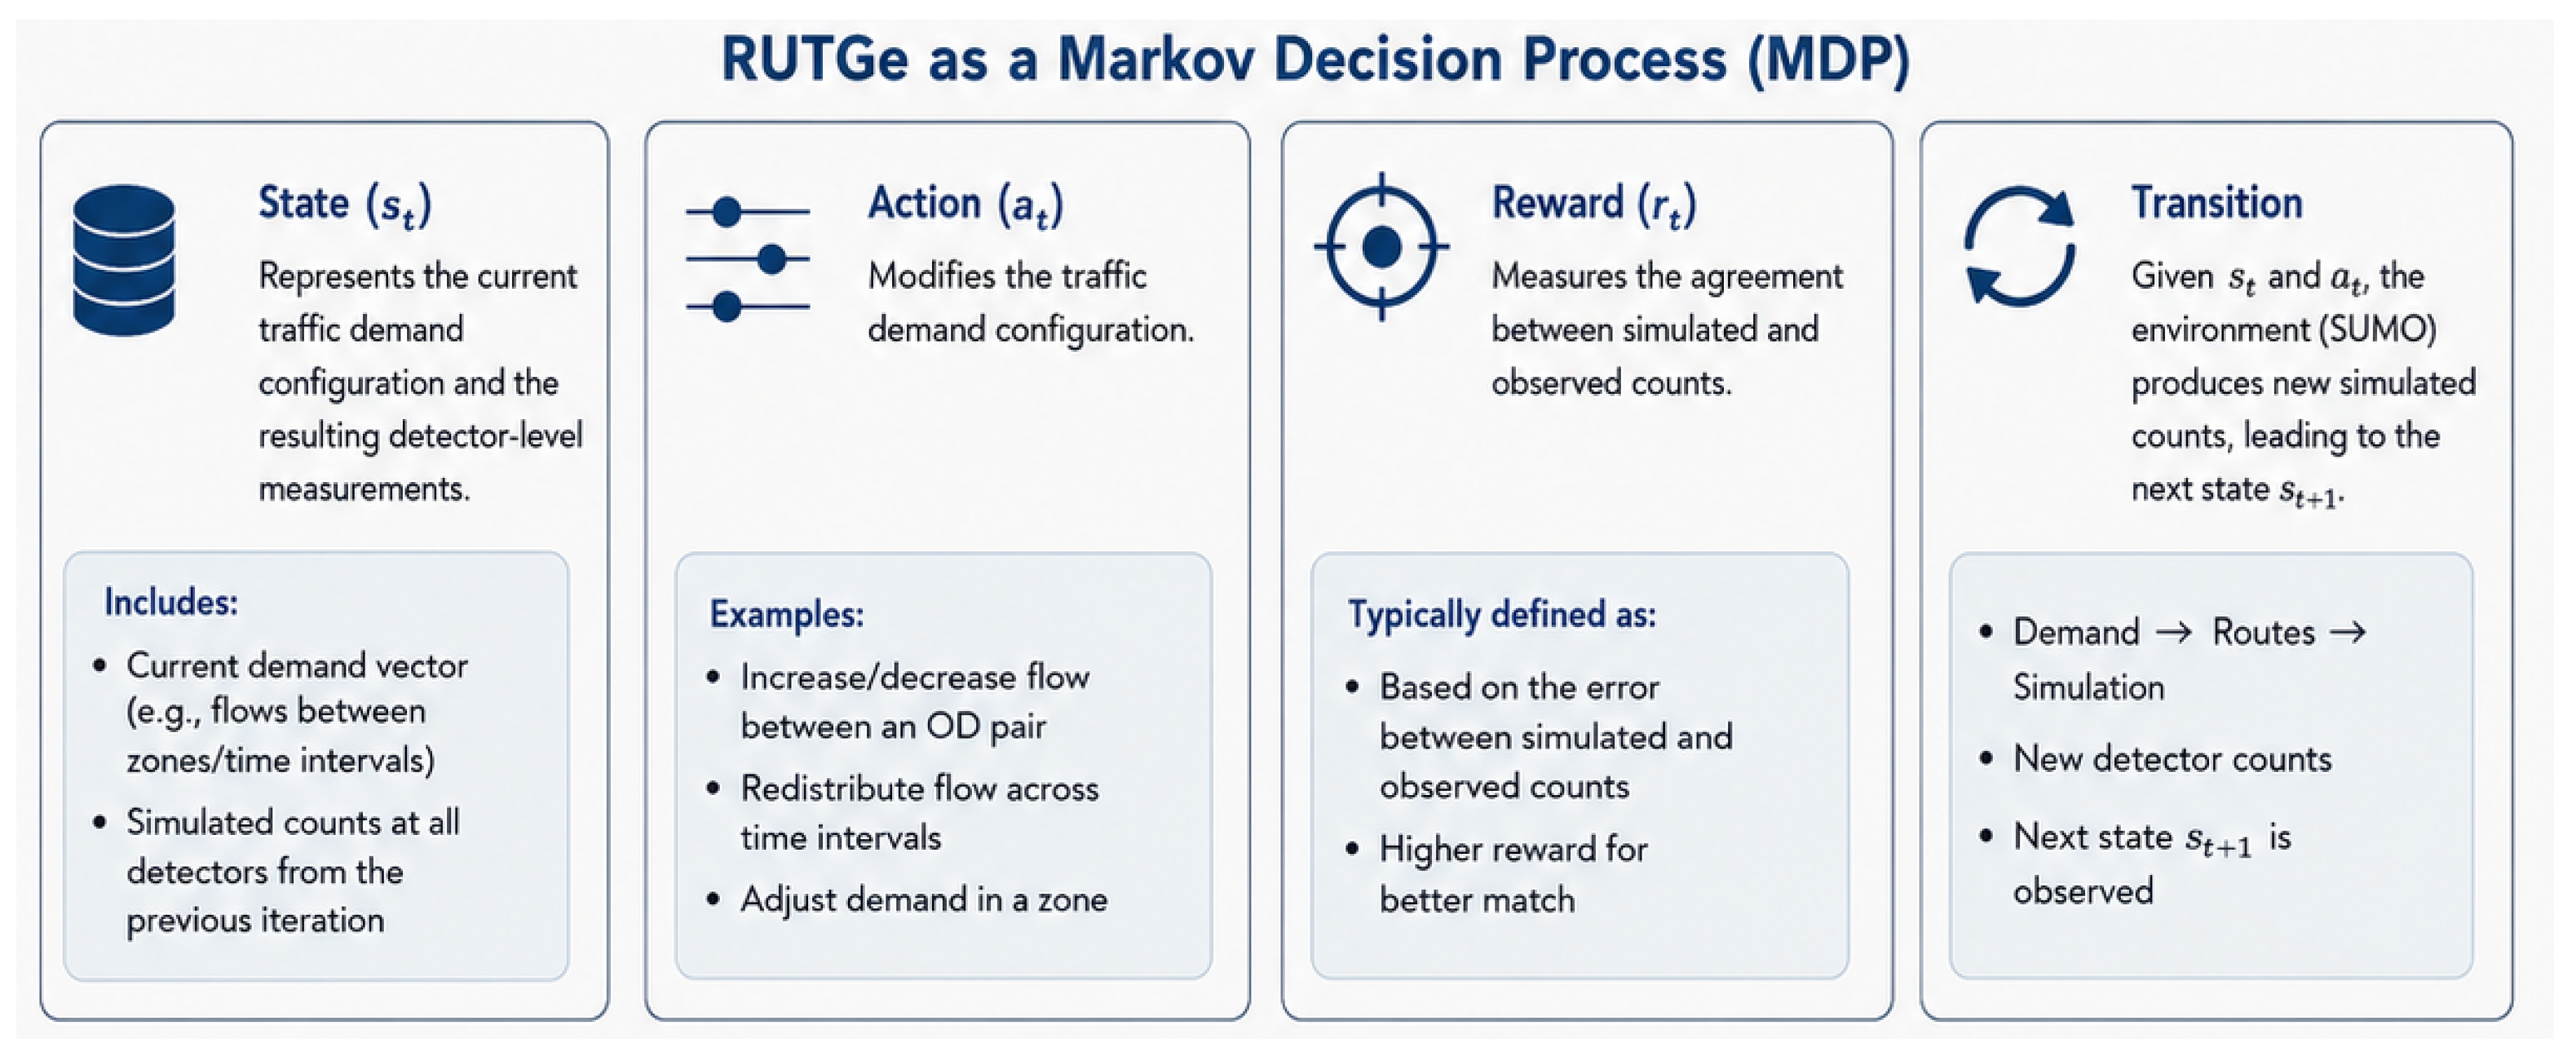
Figure 5 summarizes the overall RUTGe workflow adopted in this study. Aggregated detector measurements are used as calibration targets for a DRL agent, which iteratively adjusts the generated traffic demand. The resulting demand is transformed into SUMO-compatible routes and evaluated according to the agreement between simulated and observed traffic counts.
Rather than reconstructing individual vehicle trajectories, the objective of RUTGe is to generate traffic flows that reproduce the observed spatial and temporal traffic intensity patterns measured at the available monitoring locations. This approach is particularly suitable in urban environments where detector coverage is partial and where the available data consist primarily of aggregated traffic counts.
From a methodological perspective, RUTGe formulates traffic demand generation as a Deep Reinforcement Learning (DRL) optimization problem. The traffic generation process is modeled as a Markov Decision Process (MDP), where an agent iteratively adjusts the generated traffic demand in order to minimize the discrepancy between simulated and observed detector counts.
Figure 6 illustrates the simplified MDP formulation used by RUTGe, including the definition of states, actions, rewards, and environment transitions.
In this formulation:
The state represents the current traffic demand configuration and the resulting detector-level traffic measurements obtained from the SUMO simulation.
The actions correspond to modifications in the generated traffic demand, including adjustments to injected traffic volumes and their temporal distribution.
The reward function is defined according to the agreement between simulated and observed traffic intensities at the detector locations, penalizing deviations from the target measurements.
At each iteration, the generated demand is converted into SUMO routes using the standard SUMO toolchain (e.g., od2trips and duarouter), simulated over the road network, and evaluated against the detector targets. The DRL agent progressively learns traffic demand configurations that improve the agreement between simulation outputs and real-world observations.
A key advantage of RUTGe is that the generated traffic is spatially distributed across the complete road network rather than being concentrated only around detector locations. This produces realistic congestion propagation and route dispersion patterns throughout the city. As reported in the original RUTGe study [
5], this methodology achieves substantially lower calibration errors than standard SUMO demand-generation tools such as
RouteSampler under sparse sensing conditions.
In the MobiCugat deployment, RUTGe is used to generate the baseline traffic demand from the aggregated ANPR detector counts provided by the Sant Cugat LEZ camera infrastructure. The resulting calibrated traffic demand constitutes the reference mobility state used throughout the subsequent simulation analyses.
3.5.4. Outcome and Role Within the Overall Study
The final output of this procedure is a SUMO-compatible route file representing realistic traffic demand for the chosen baseline day (and, in particular, for the peak-hour analysis window). This calibrated demand is then used as the reference input for the scenario evaluation tasks described later in the paper, where street closures and other structural interventions are applied to the network and their impact is assessed under consistent demand assumptions.
In summary, RUTGe provides the methodological backbone for demand generation in MobiCugat. In the Sant Cugat deployment, its practical use is adapted to detector-aware calibration targets at 15-min resolution and to the need to generate SUMO-compatible route sets that reproduce observed traffic intensities under real municipal sensing constraints.
3.5.5. Calibration Error Metric
To quantify calibration fidelity at the monitoring locations, we evaluate the discrepancy between the target vehicle counts derived from the LEZ cameras and the simulated counts produced by colocated SUMO induction loops. Let
be the target count for detector
during the
k-th 15-min sub-interval of hour
h (with
), and let
be the corresponding simulated count. We first aggregate counts to an hourly value per detector:
The absolute hourly error at detector
d is then defined as:
To report a scale-free measure, we compute an aggregated mean absolute relative error in percentage for hour
h as:
In the context of this work, the detector-level
metric is used as the primary validation criterion, while the realism of the generated traffic dispersion patterns across the network is inherited from the RUTGe demand-generation framework validated in [
5].
This absolute-error formulation avoids cancellation between over- and underestimation and provides a robust indicator of how closely the simulated demand matches measurements at the locations of interest. The normalization in (
3) expresses the error relative to the total observed volume across all detectors, yielding an interpretable percentage while avoiding per-detector division issues when some detectors record zero flow.
3.6. Simulation Setup and Baseline Calibration
To support both quantitative calibration and qualitative, stakeholder-oriented validation, we produced spatial visualizations of the simulated traffic using SUMO’s
plot_net_dump.py utility. This tool generates color-coded heatmaps over the road network by overlaying per-edge values of (i) traffic intensity (vehicles per hour, veh/h) and (ii) traffic occupancy (fraction of time a segment is occupied), as described in
Section 4.3. Rendered on a logarithmic color scale from green (low) to red (high), these maps provide an intuitive representation of congestion formation and load distribution across the municipality.
Importantly,
plot_net_dump.py outputs constitute a core
project deliverable in the MobiCugat workflow: beyond serving as an internal diagnostic, the resulting intensity and occupancy maps are the primary instruments used to communicate the baseline traffic state and the impact of alternative mobility interventions to municipal stakeholders. Consequently, these heatmaps are explicitly incorporated into the Results section (
Section 4), where they are used to: (i) visually validate that the simulated traffic reproduces known congestion corridors and critical intersections; and (ii) compare baseline and intervention scenarios under a common spatial representation.
In addition, we computed an aggregated daily traffic intensity curve by averaging measured counts across the full set of available camera locations.
Figure 4 shows a representative baseline day, where two pronounced demand peaks can be observed: a morning peak around 09:00 and an evening peak around 18:00, separated by a lower-demand midday period. Based on this profile, three representative time windows were selected for validation and analysis: the morning peak hour (09:00–10:00), the midday off-peak hour (12:00–13:00), and the evening peak hour (18:00–19:00). This selection enables the simulation to be evaluated under different operating conditions, including both recurrent congestion periods and an intermediate lower-demand regime.
Finally, the baseline configuration established in this section is used as the reference point for subsequent intervention tests. The quantitative fit between simulated and observed detector counts is evaluated for three representative validation windows—the morning peak hour (09:00–10:00), the midday off-peak hour (12:00–13:00), and the evening peak hour (18:00–19:00)—and reported in
Section 4.2. Complementarily, the qualitative inspection of simulation replays and
plot_net_dump.py intensity and occupancy heatmaps by the City Council’s transport and traffic specialists is reported in
Section 4.3. This expert-based assessment focuses on whether the spatial distribution of congestion and the temporal evolution of flows are consistent with practitioners’ empirical knowledge of the network, particularly around recurrent congestion hotspots in the town center and along the C-58/B-30 corridor.
3.7. Scenario Definition
A baseline traffic scenario was established to (i) evaluate the synthetic routes generated by RUTGe (
Section 3.5) and (ii) provide a calibrated reference state of the road network against which policy interventions can be compared. The baseline objective is to reproduce, as closely as possible, the empirical vehicle counts observed by the ANPR camera infrastructure at each monitored location, ensuring that subsequent scenario analyses are grounded on a representative approximation of real traffic conditions in Sant Cugat del Vallès.
Based on the aggregated daily intensity curve across detectors (
Figure 4), the baseline simulations were evaluated over three representative traffic regimes: the morning peak hour (09:00–10:00), the midday off-peak hour (12:00–13:00), and the evening peak hour (18:00–19:00). These windows were selected to test the calibrated demand under both congested and lower-demand conditions. In the data preprocessing stage, days showing atypical demand patterns (e.g., substantially lower volumes) were excluded to avoid calibrating the model to non-representative conditions.
Once baseline calibration is achieved, the resulting model acts as a flexible testbed for rapid mobility prototyping. Network modifications can be encoded directly in SUMO’s XML files (e.g., via netedit), enabling the evaluation of interventions such as access restrictions (through vehicle classes, vclass), edge-level speed-limit adjustments, turn restrictions, and topological changes (e.g., street closures or dedicated bus lanes). This enables a practical, simulation-based decision-support workflow—often framed as a digital-twin instrument in smart-city practice—to quantify the system-wide impact of candidate interventions prior to physical deployment.
Finally, the baseline configuration established in this section is used as the reference point for all subsequent intervention tests. The quantitative fit of simulated versus observed detector counts for the selected validation windows (09:00–10:00, 12:00–13:00, and 18:00–19:00), together with the qualitative inspection of
plot_net_dump.py heatmaps by municipal mobility specialists, is reported in the Results section (
Section 4).
4. Simulation Results
In this section, we present the primary outputs of our work. First, we provide an analysis and classification of mobility patterns derived from the data gathered by LEZ cameras. Next, we validate the MobiCugat framework against observed traffic intensities across three representative periods: the morning peak, the midday off-peak hour, and the evening peak. Finally, we analyze network-wide traffic intensity and occupancy through spatial heatmaps for these representative periods.
4.1. Camera Data Analysis: Mobility Pattern Classification
While ANPR cameras are primarily deployed as enforcement tools for environmental compliance, they represent a high-value source of urban mobility market data. Beyond their regulatory function, these infrastructures provide a continuous, real-time stream of empirical observations that can be re-purposed for advanced transportation planning. By transforming raw license plate captures into structured trajectory insights—complying with local data regulations—, city planners can gain a deeper understanding of urban flow dynamics. Leveraging this data allows for the design of more effective, evidence-based mobility schemes that promote sustainability and efficiency, moving beyond simple access control toward a comprehensive management of the urban ecosystem. In this section, we present an initial example of camera data analysis, demonstrating how these LEZ-based datasets facilitate an accurate and robust classification of mobility patterns.
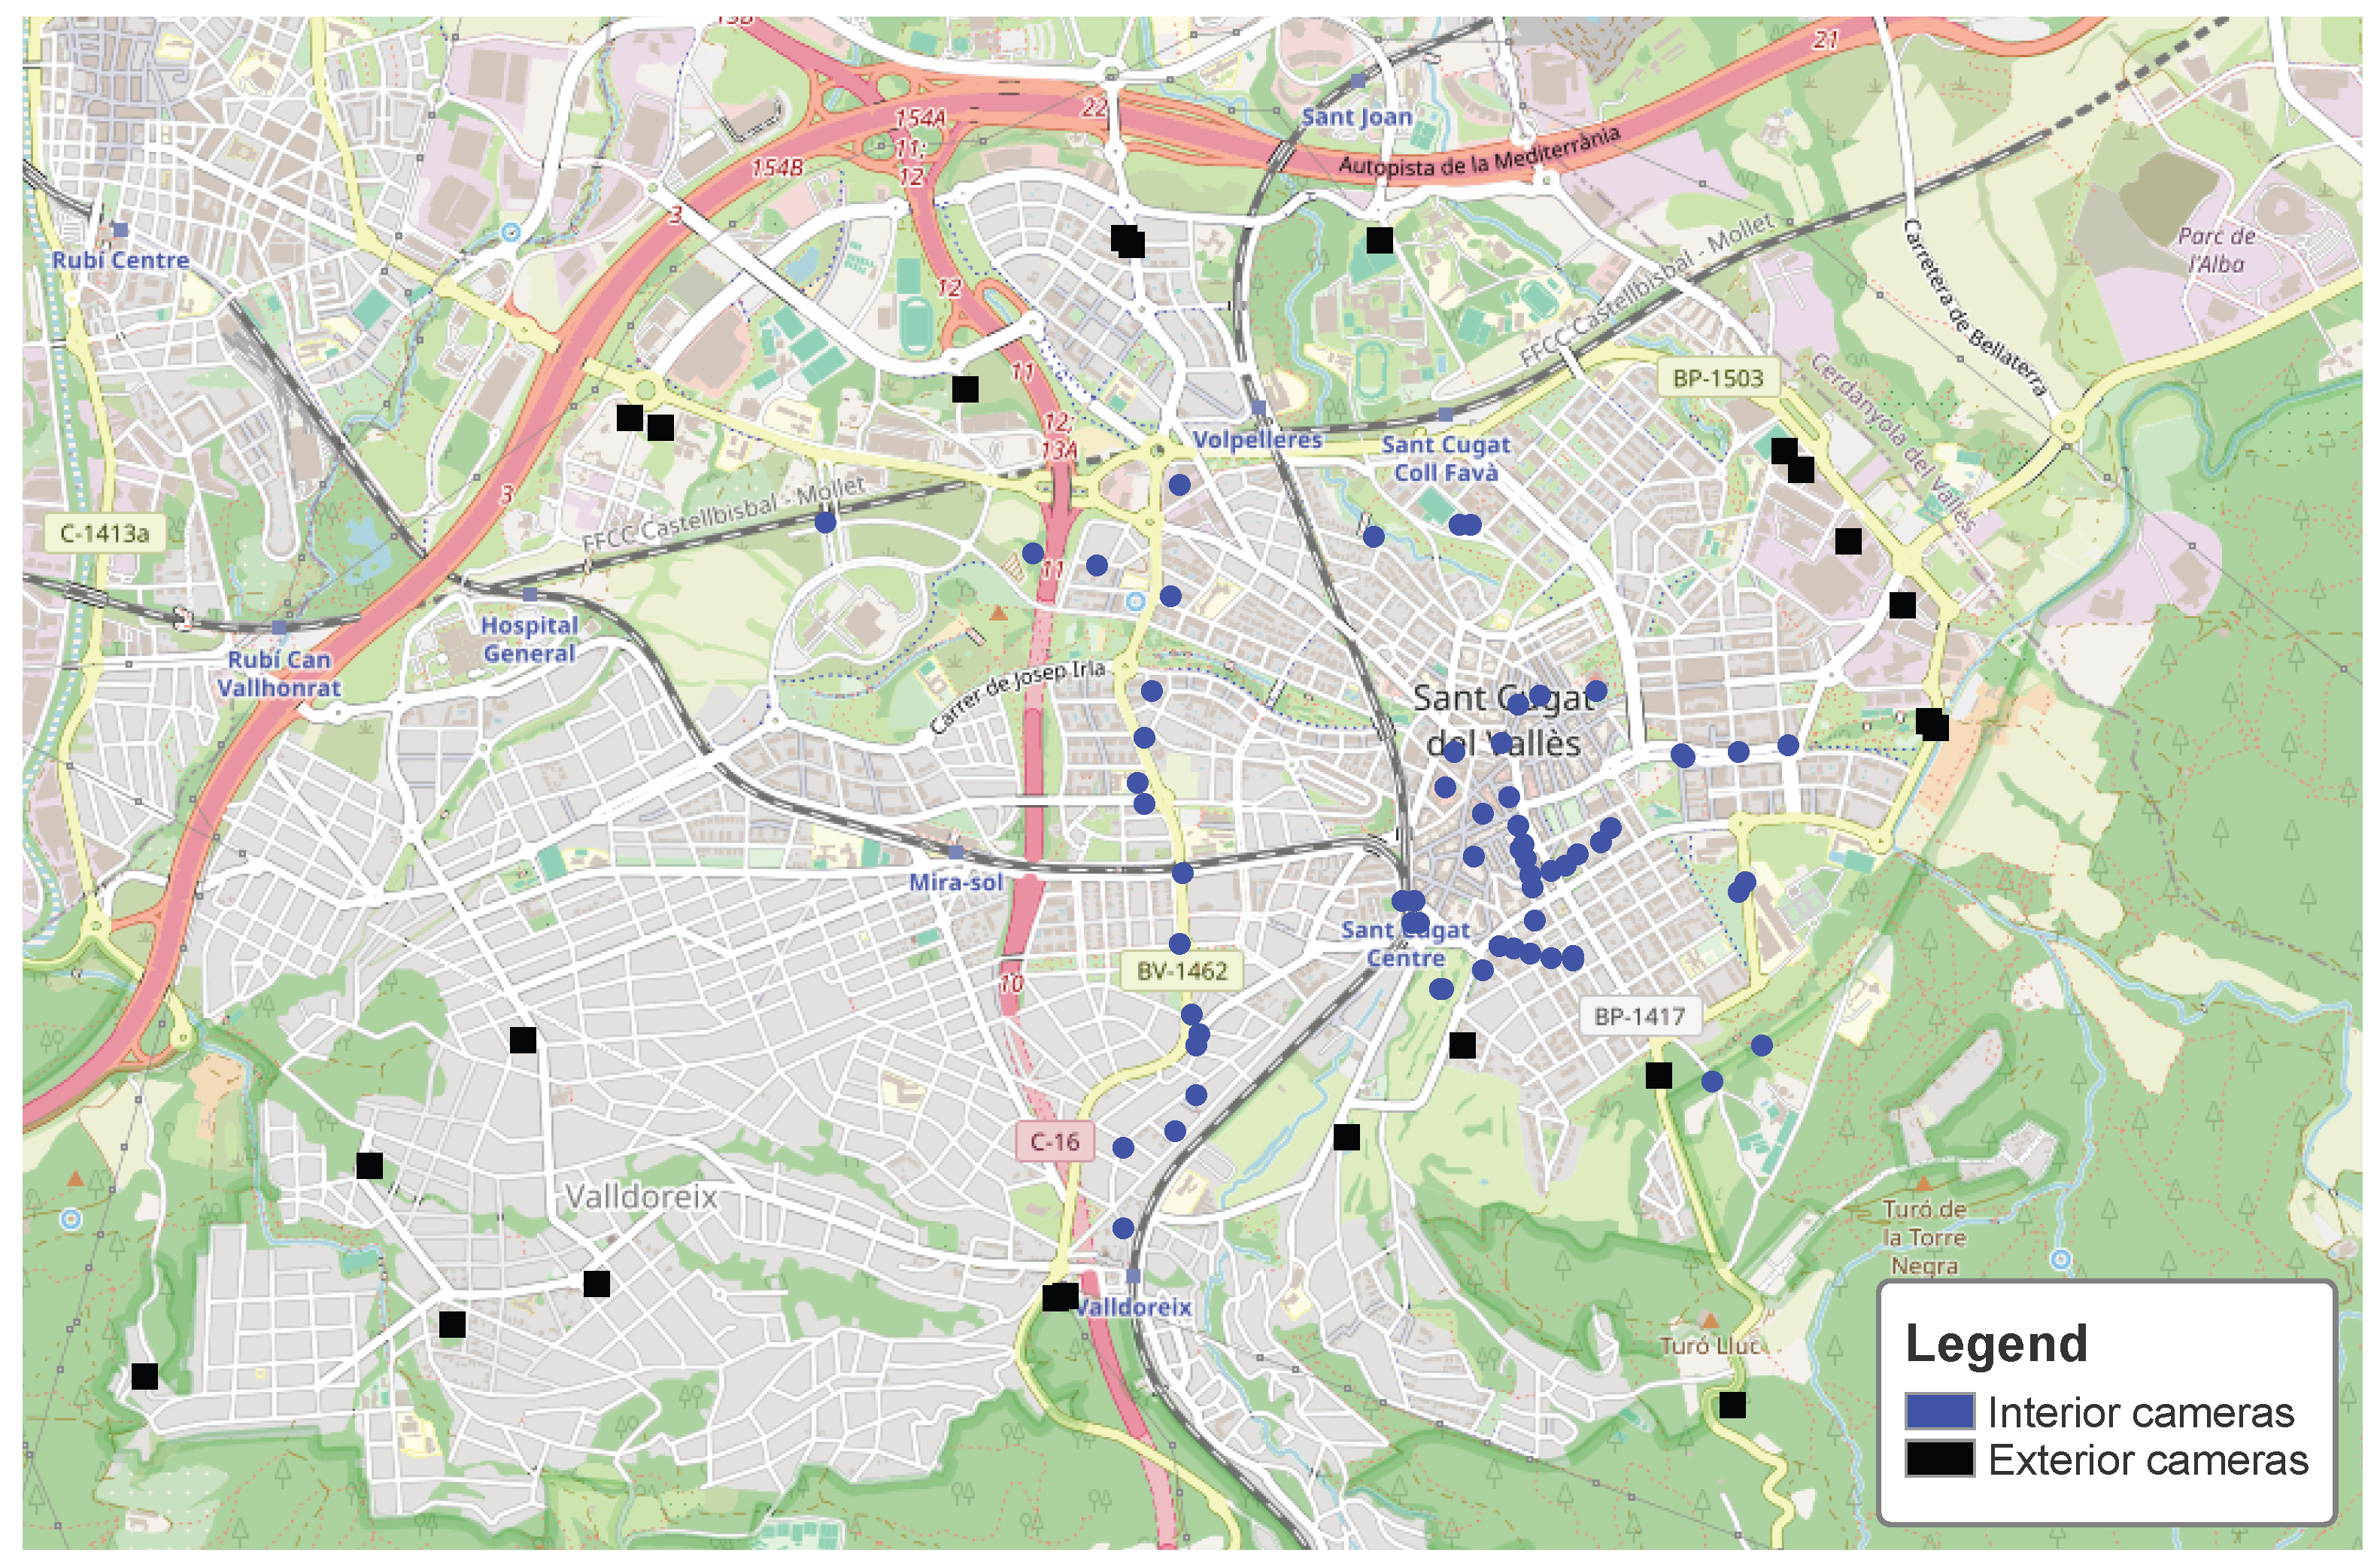
To characterize the mobility patterns within the Sant Cugat LEZ camera network, a trajectory analysis was conducted over the entire eight-day observation period (integrating the available One-Day and One-Week datasets). Although trips were analyzed on a daily basis, those involving overnight activities could not be categorized. Cameras were first classified as either interior camera (located within the LEZ boundary) or exterior camera (situated at the LEZ perimeter or outer access points), as illustrated in
Figure 7. For each vehicle detected, the complete sequence of camera observations was used to assign the trip to one of the seven mutually exclusive mobility pattern groups defined in
Table 1.
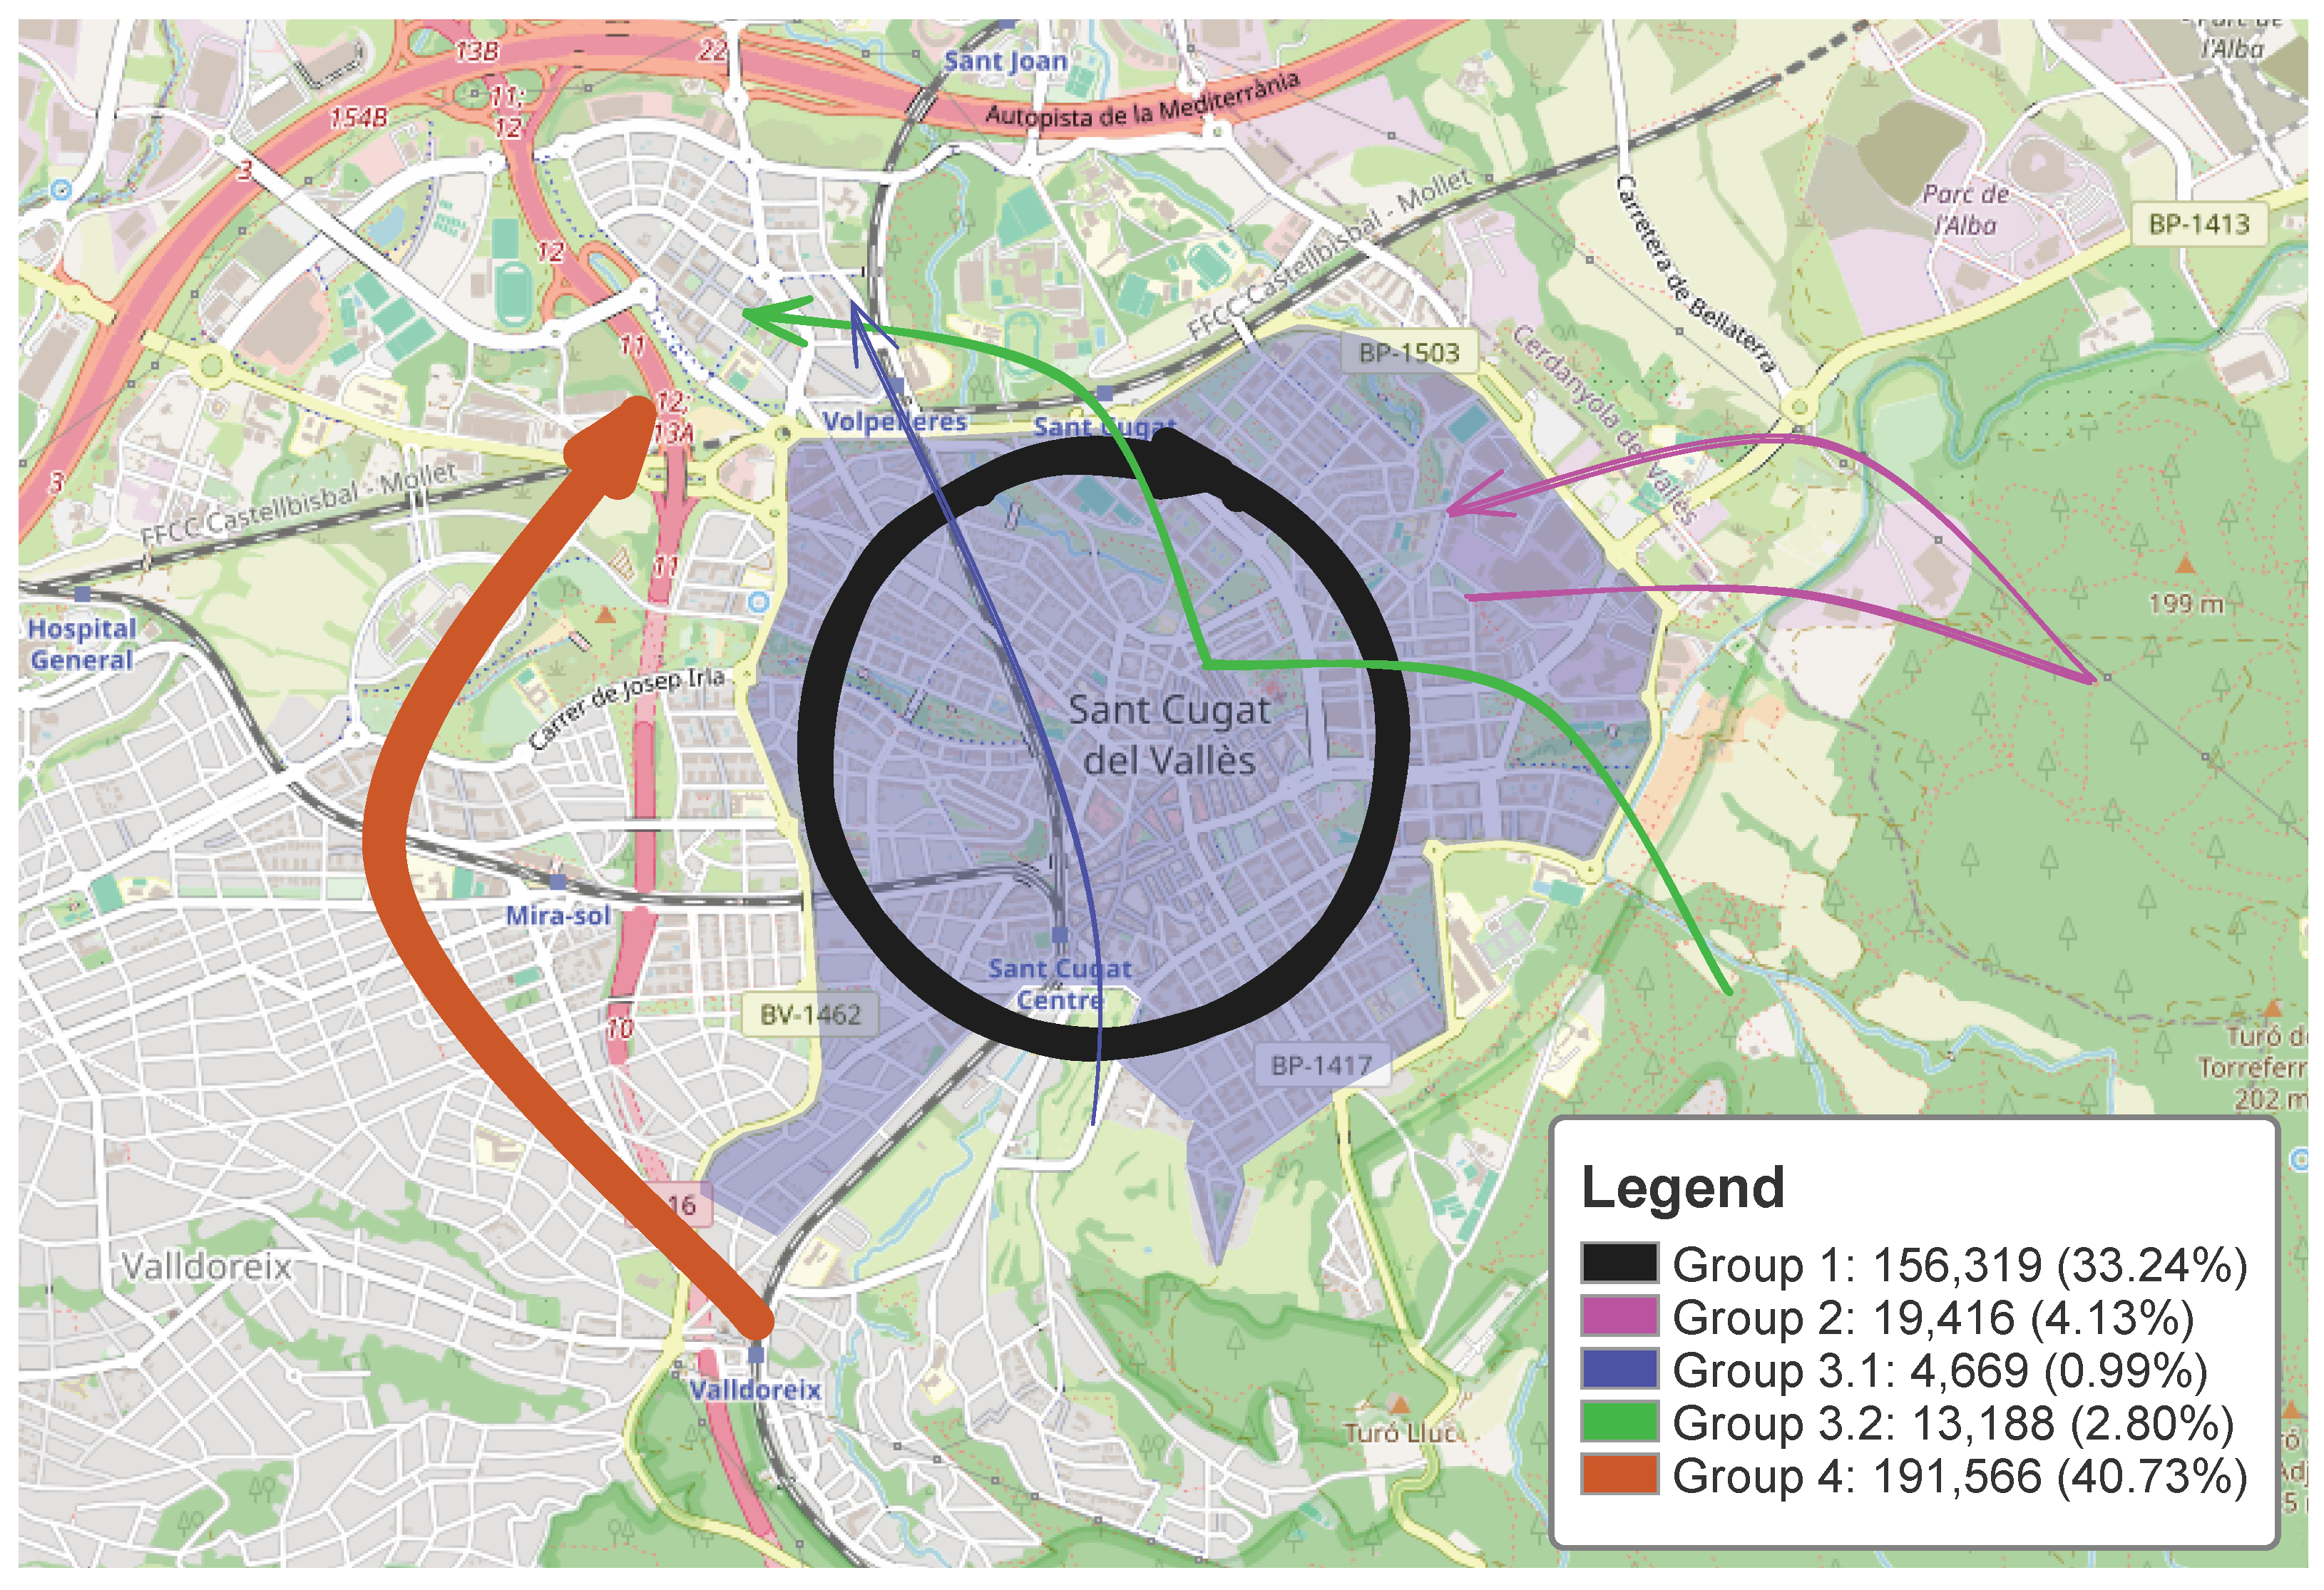
The results of the trajectory classification over the eight-day observation period are presented in
Table 2 and
Figure 8. A total of 470,344 vehicle records were classified. The most frequently observed pattern was Group 4 (exterior-only movements; 40.7%), representing vehicles that circulate in areas monitored by boundary cameras without entering the LEZ interior—a population dominated by commuters accessing peripheral business parks via arterial roads. Group 1 (interior movements; 33.2%) was the second largest category, representing resident trips entirely within the zone.
The key finding from this analysis is that resident and local traffic (Groups 1 and 2 combined) accounts for 37.37% of total observed flows, significantly exceeding pure through-traffic (Groups 3.1 and 3.2 combined, 3.79%). This result represents a substantial refinement of findings reported in prior private mobility studies of the area, which (based on manual roadside surveys of 1255 drivers) had estimated through-traffic and destination traffic to be approximately equal in volume during the morning peak. The camera-based analysis, drawing on a continuous eight-day sample more than 370 times larger than previous surveys, provides a more robust and statistically reliable characterization of mobility patterns. The dominance of resident and local traffic has direct implications for the design of new mobility schemes, as discussed in
Section 5.
4.2. Baseline Simulation Validation
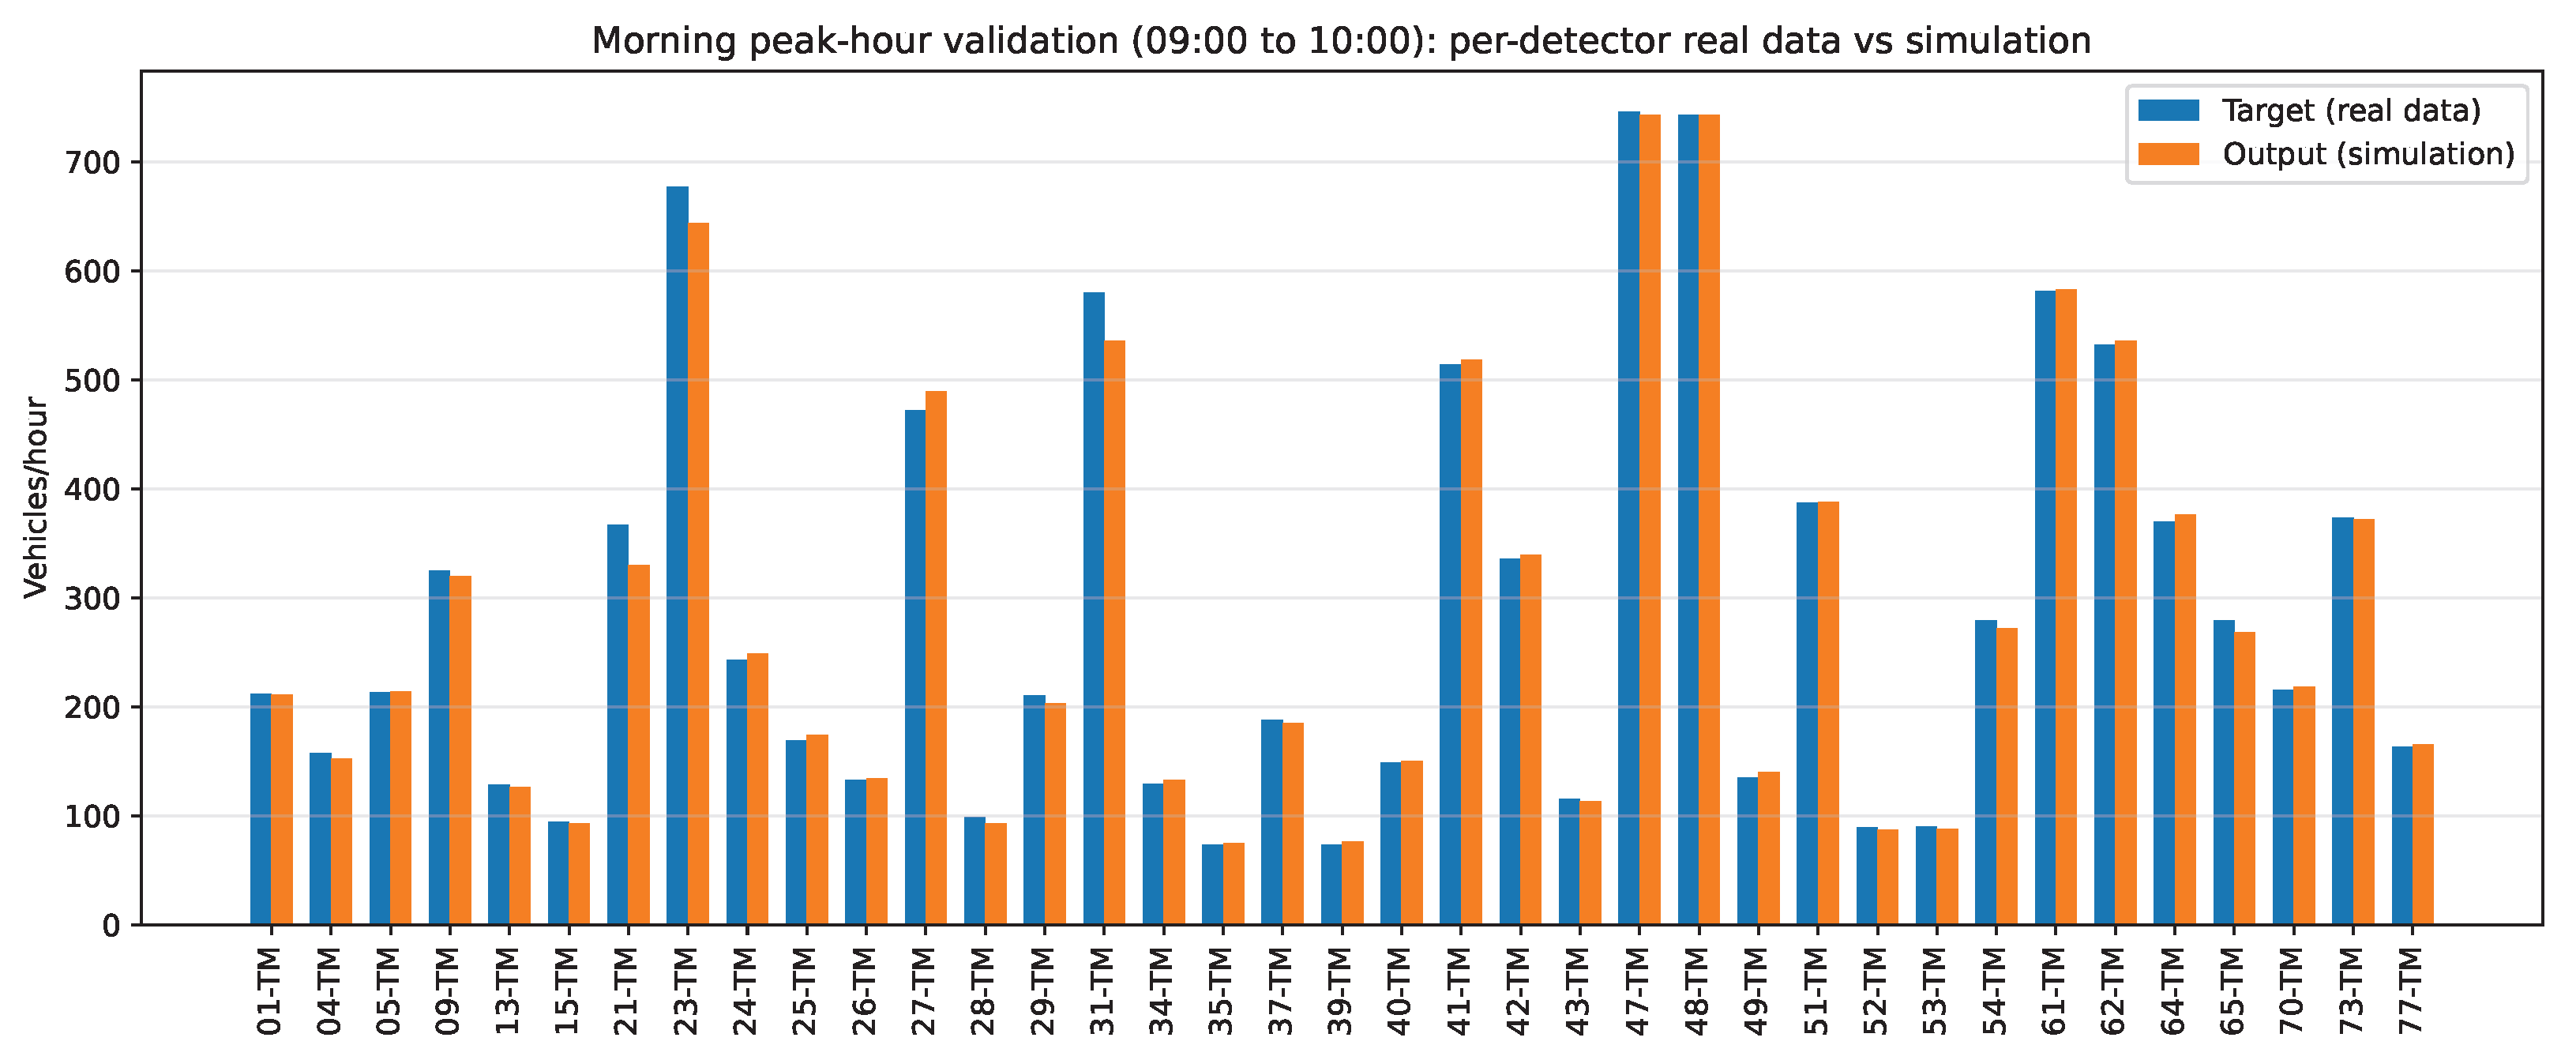
The baseline scenario was used to validate the full pipeline—from ANPR data processing through RUTGe demand generation to SUMO simulation—against real camera measurements. For each detector location replicated as a virtual induction loop in the SUMO model, the simulated traffic counts (aggregated at 15-min resolution) were compared with the corresponding camera-derived counts for three representative validation windows: the morning peak hour (09:00–10:00), the midday off-peak hour (12:00–13:00), and the evening peak hour (18:00–19:00).
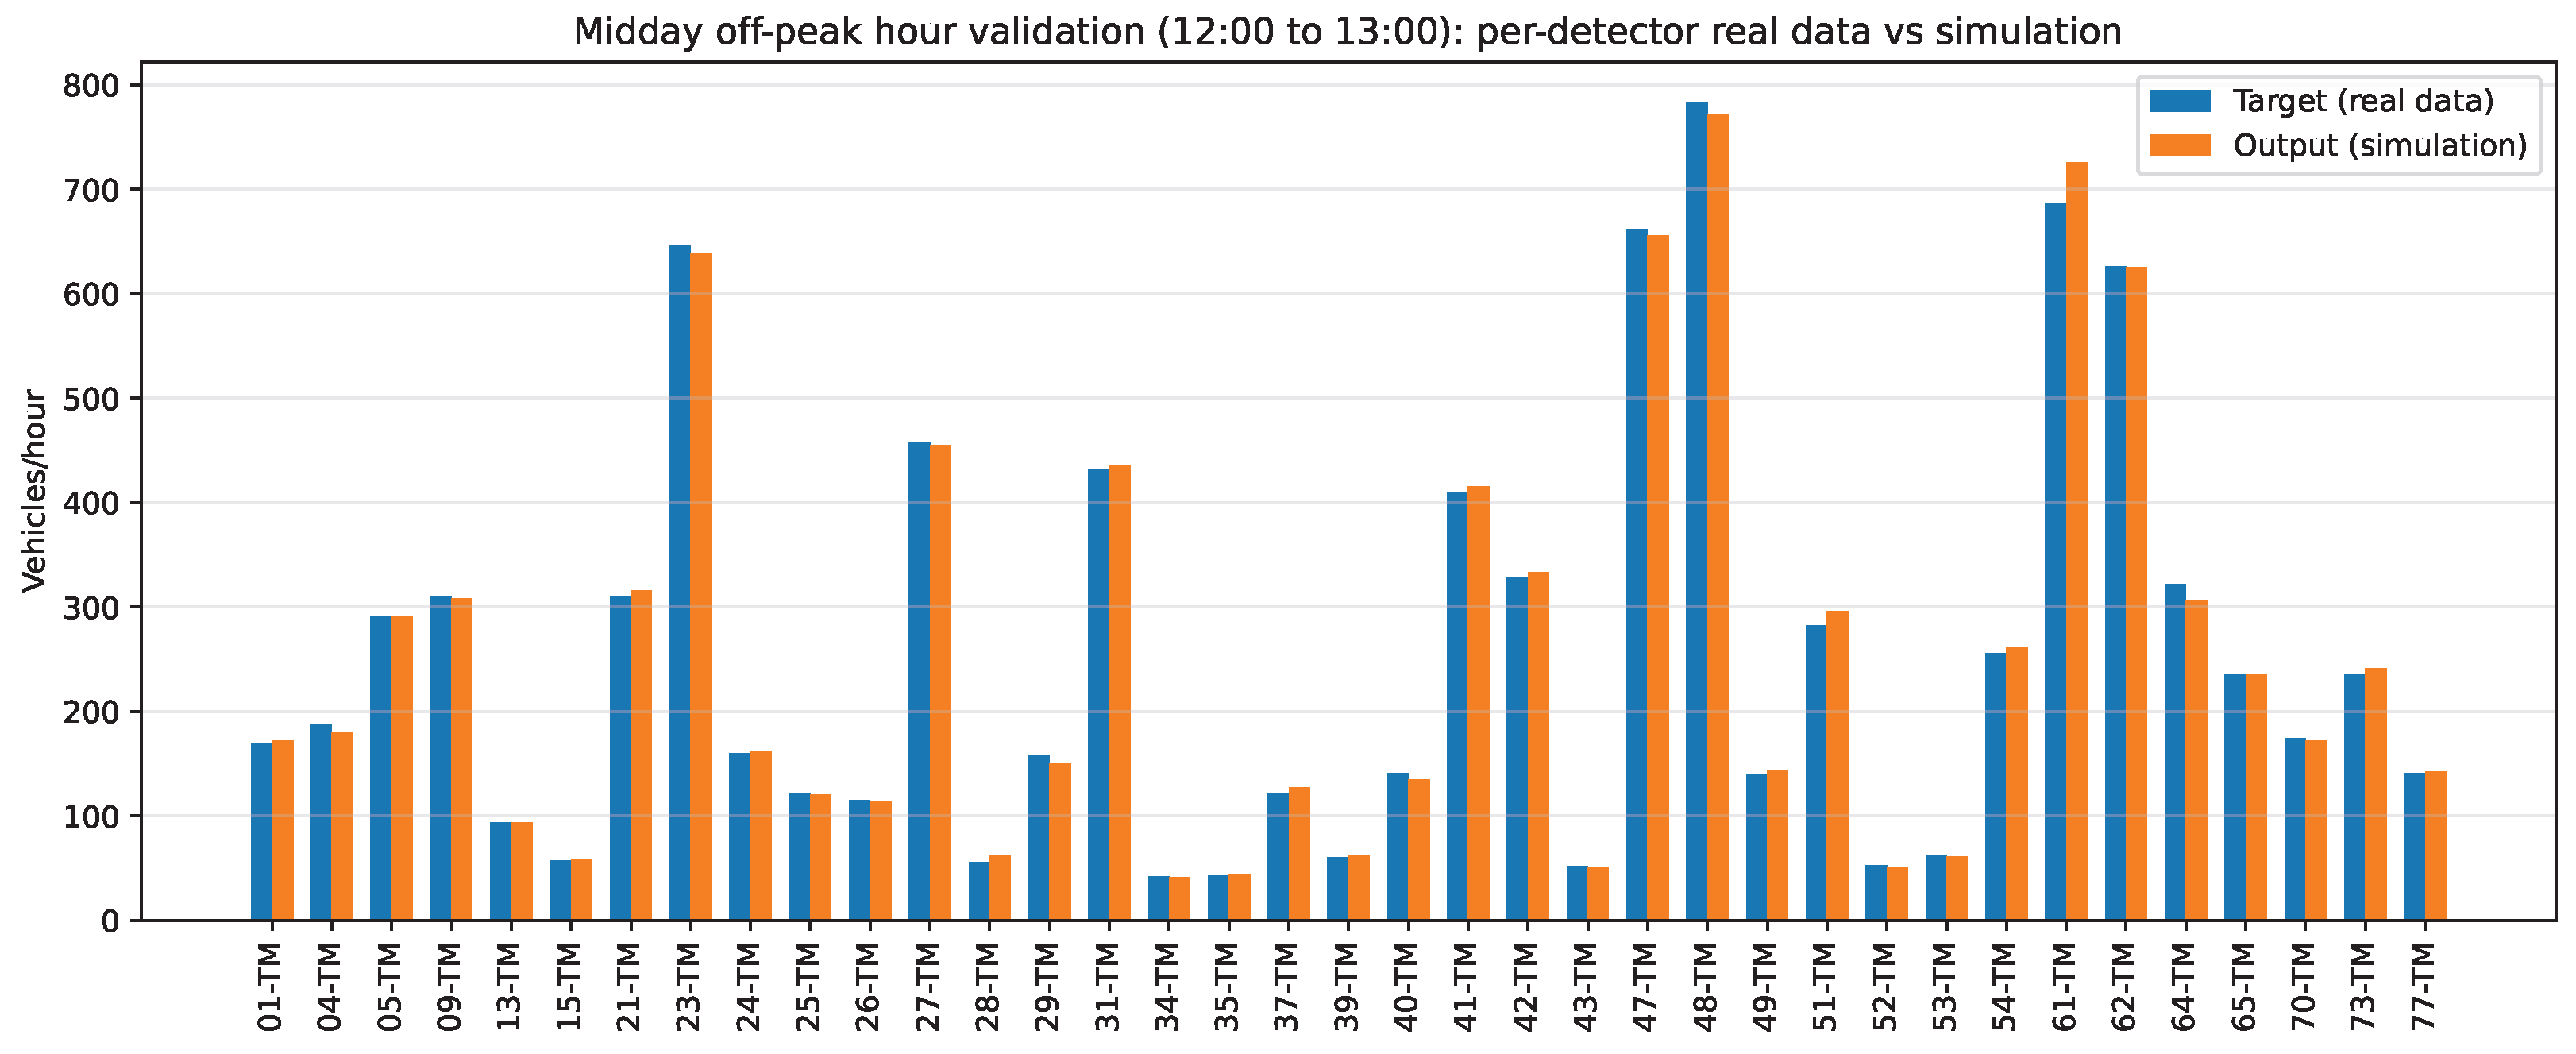
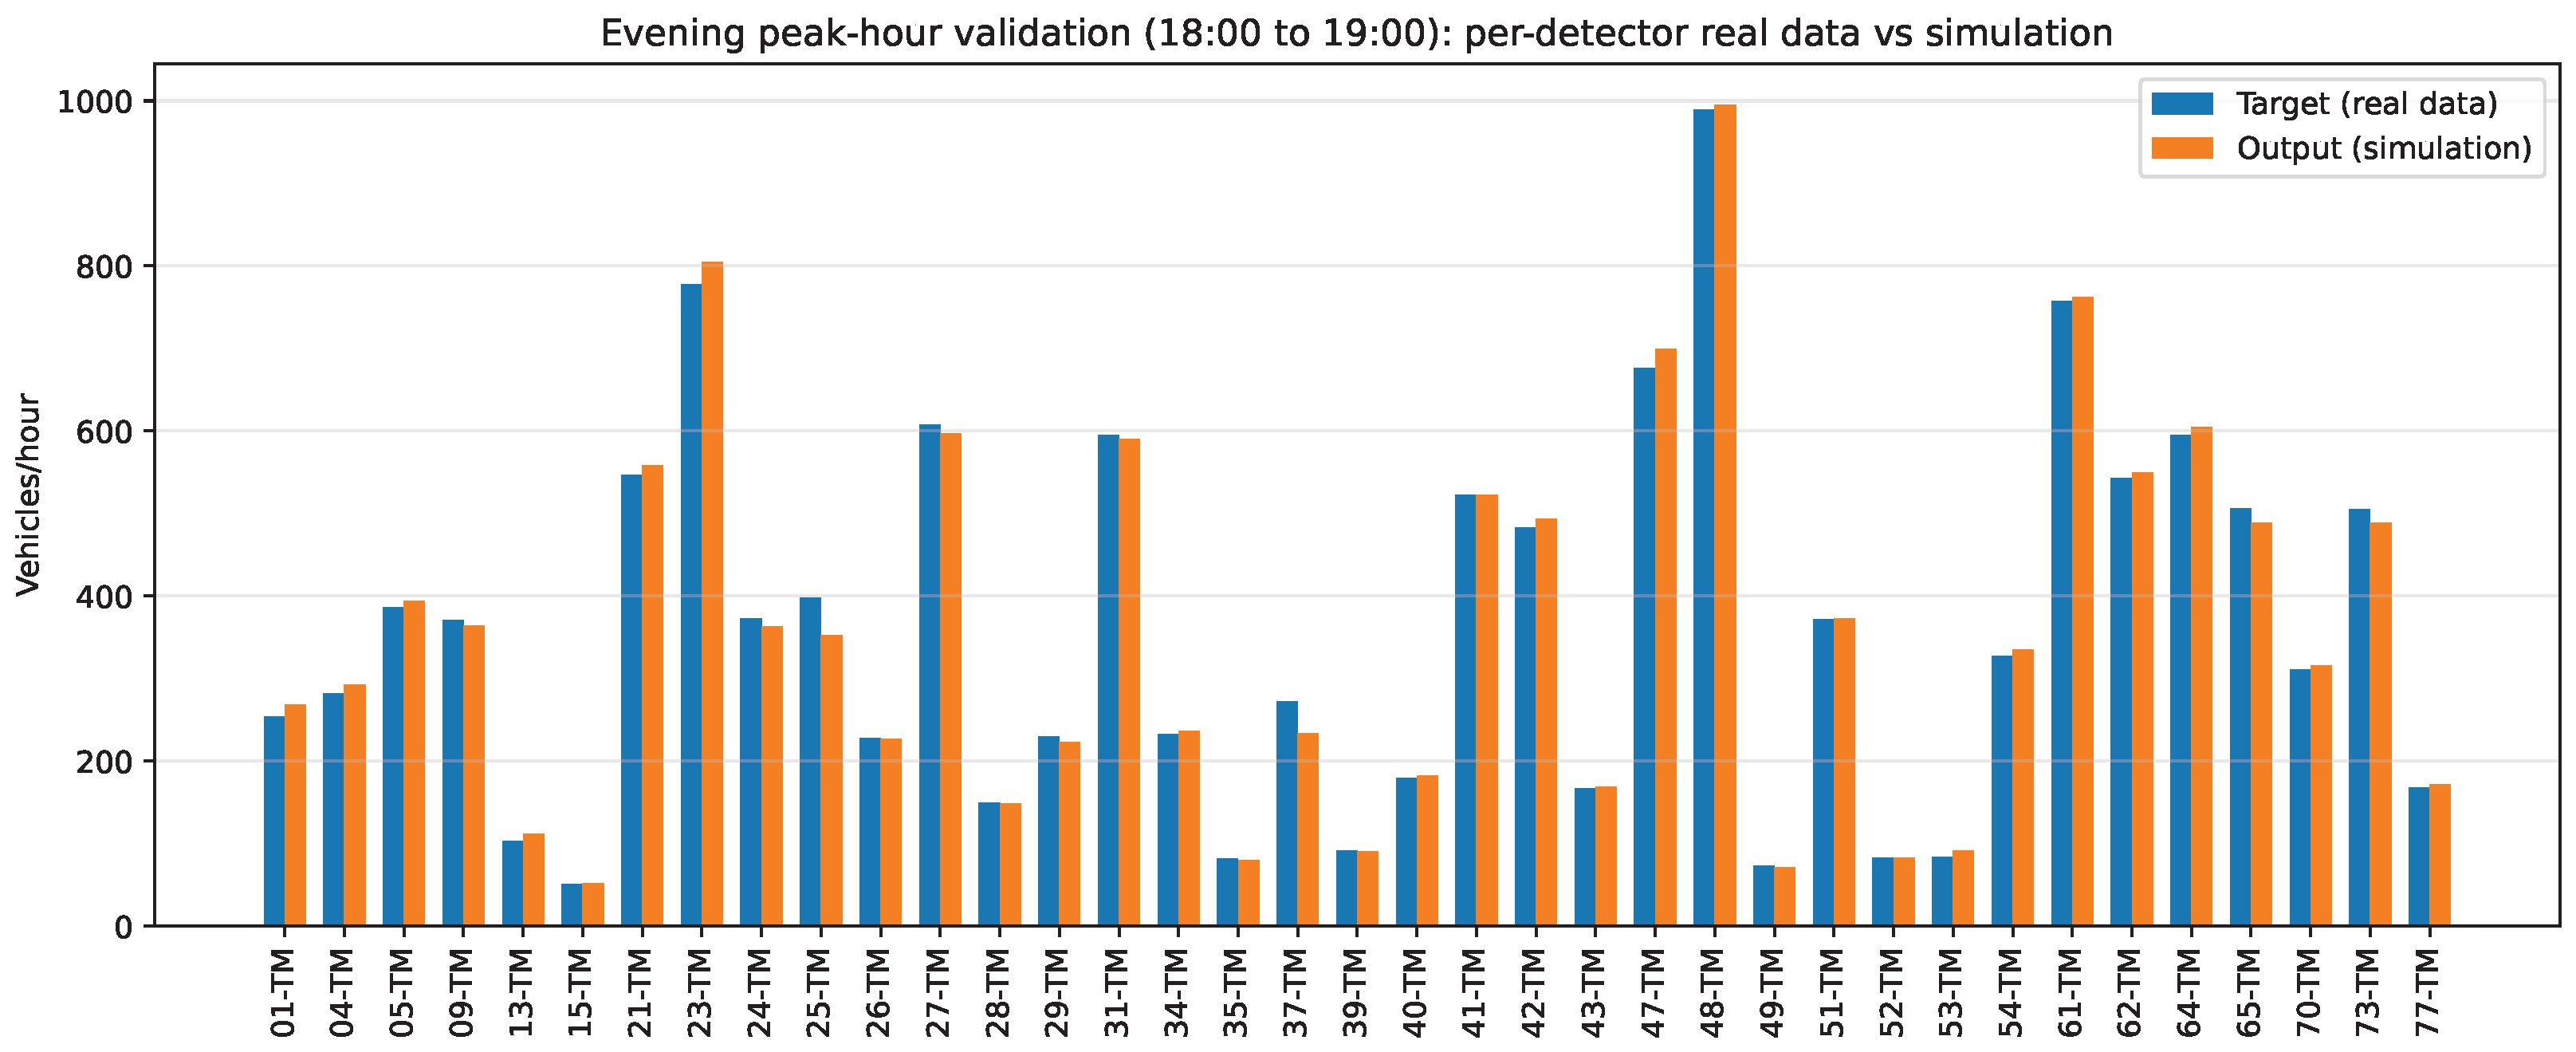
Figure 9,
Figure 10 and
Figure 11 report the per-detector comparison between observed and simulated traffic intensities for the three representative validation windows. Overall, close agreement was consistently achieved across the detector set for all three representative traffic conditions. The resulting percentage mean absolute relative error,
, was
for the morning peak hour (09:00–10:00),
for the midday off-peak hour (12:00–13:00), and
for the evening peak hour (18:00–19:00). These results indicate that the RUTGe-based calibration workflow remains stable across both congested and lower-demand traffic regimes. This level of accuracy is consistent with the calibration capabilities reported for RUTGe in [
5]. These results were obtained through the detector-aware calibration process based on RUTGe described in
Section 3.5.3. These results confirm that the calibrated baseline reproduces the observed traffic volumes with high fidelity at the specific monitoring locations relevant for municipal analysis, and therefore provides a credible reference state for the counterfactual scenario evaluations presented next.
The consistency of the detector-level agreement across the three validation windows supports the robustness of the proposed demand-generation and calibration workflow under different traffic conditions. In particular, the low error values obtained during both peak and off-peak periods indicate that the calibrated simulation reproduces the observed traffic dynamics with stable accuracy throughout the day.
Beyond the aggregated values, the detector-level results also show a strong spatial consistency across the monitored network. During the morning peak hour (09:00–10:00), only three out of the 37 detectors presented local relative deviations above . Similarly, during the midday off-peak period (12:00–13:00), only two detectors exceeded this threshold, while during the evening peak hour (18:00–19:00), five detectors showed deviations above despite the higher congestion levels. These results indicate that the reported calibration accuracy is representative of the overall detector set and is not dominated by isolated locations or compensation effects between detectors.
4.3. Traffic Heatmaps: Intensity and Occupancy
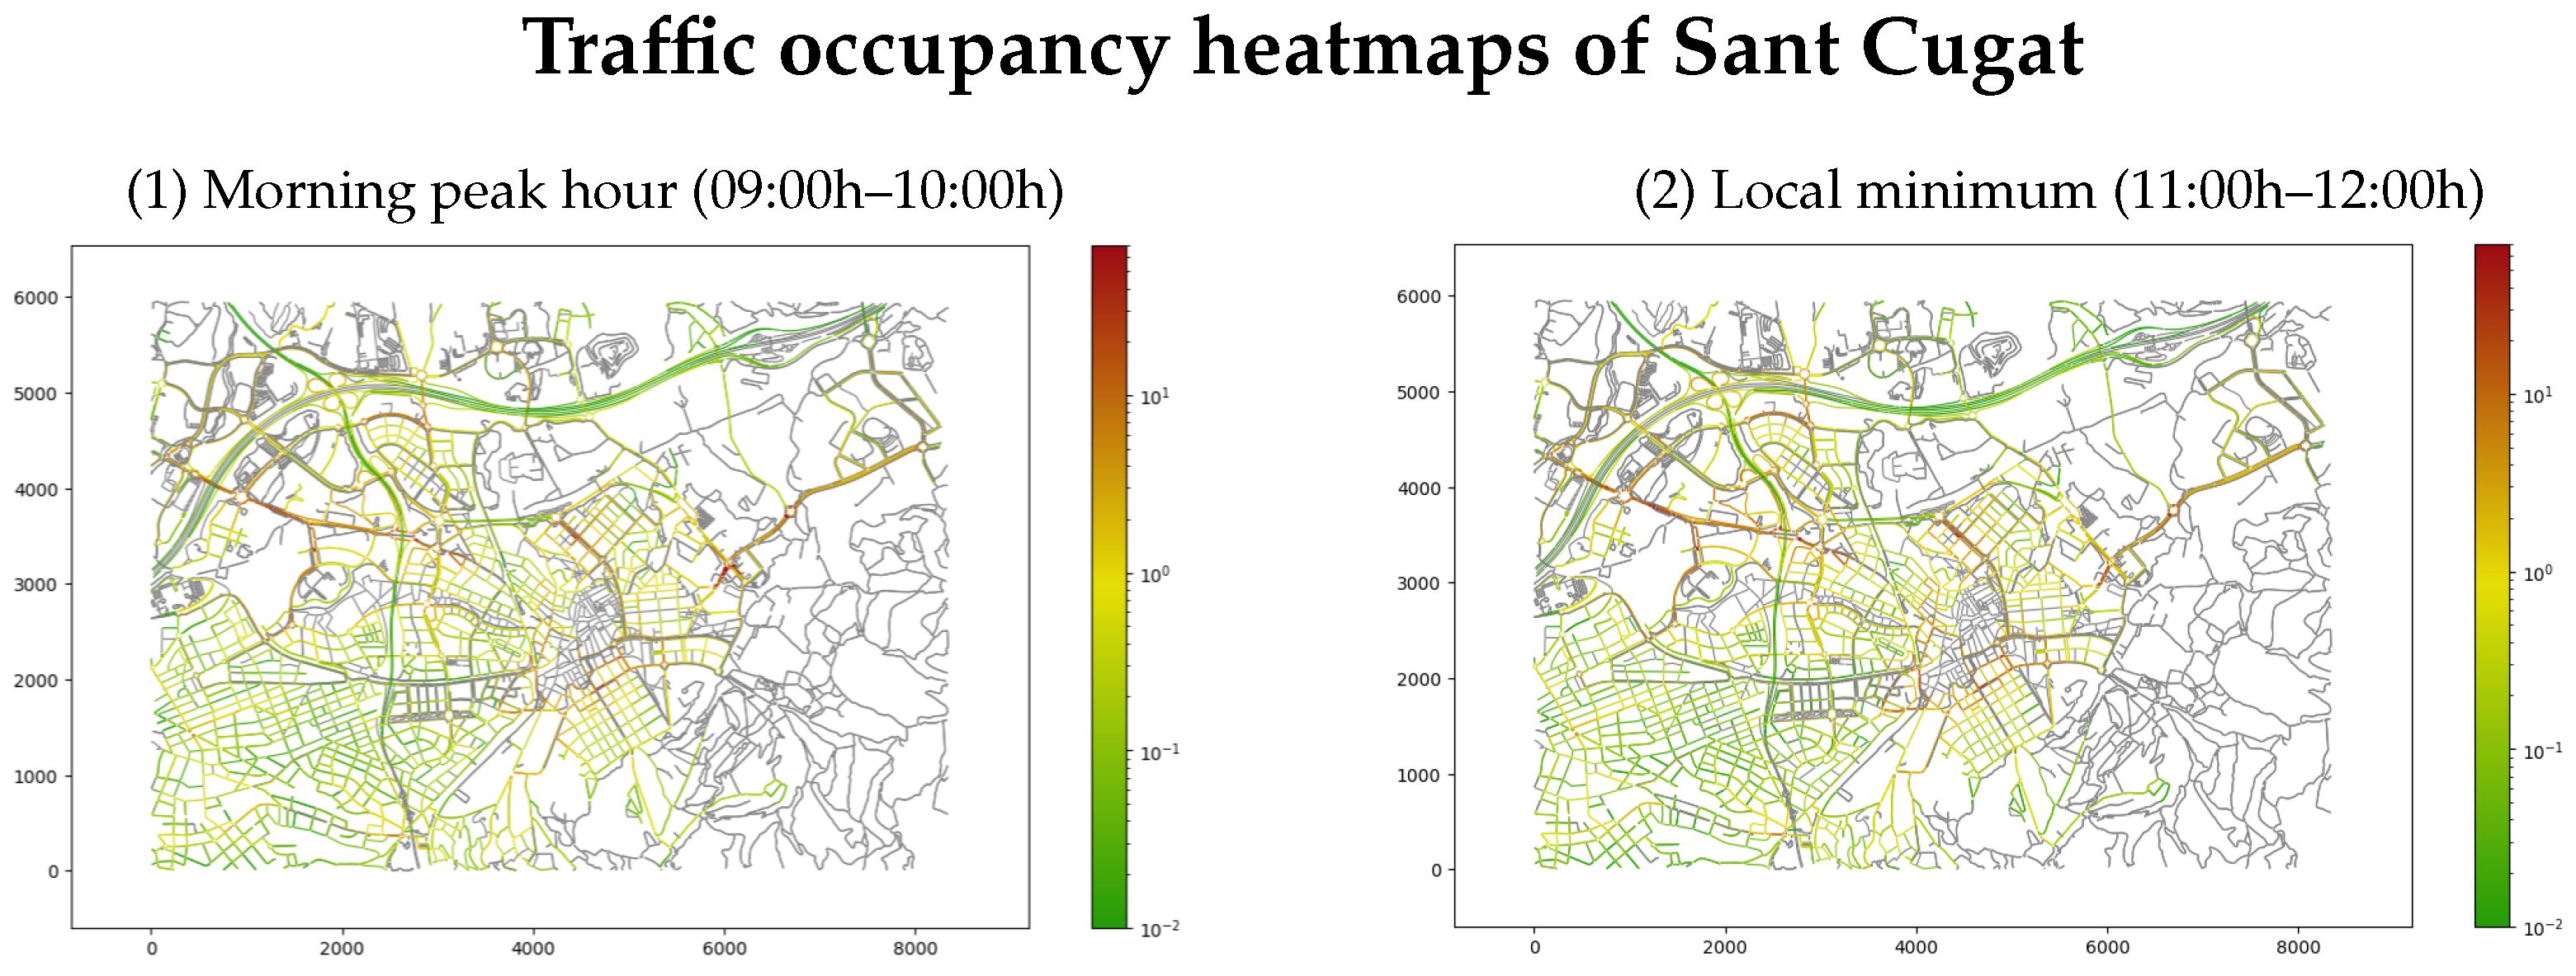
Following baseline calibration and peak-hour validation, we generated network-wide heatmaps using SUMO’s
plot_net_dump.py utility for three representative periods. These time windows were selected based on the aggregated daily intensity curve in
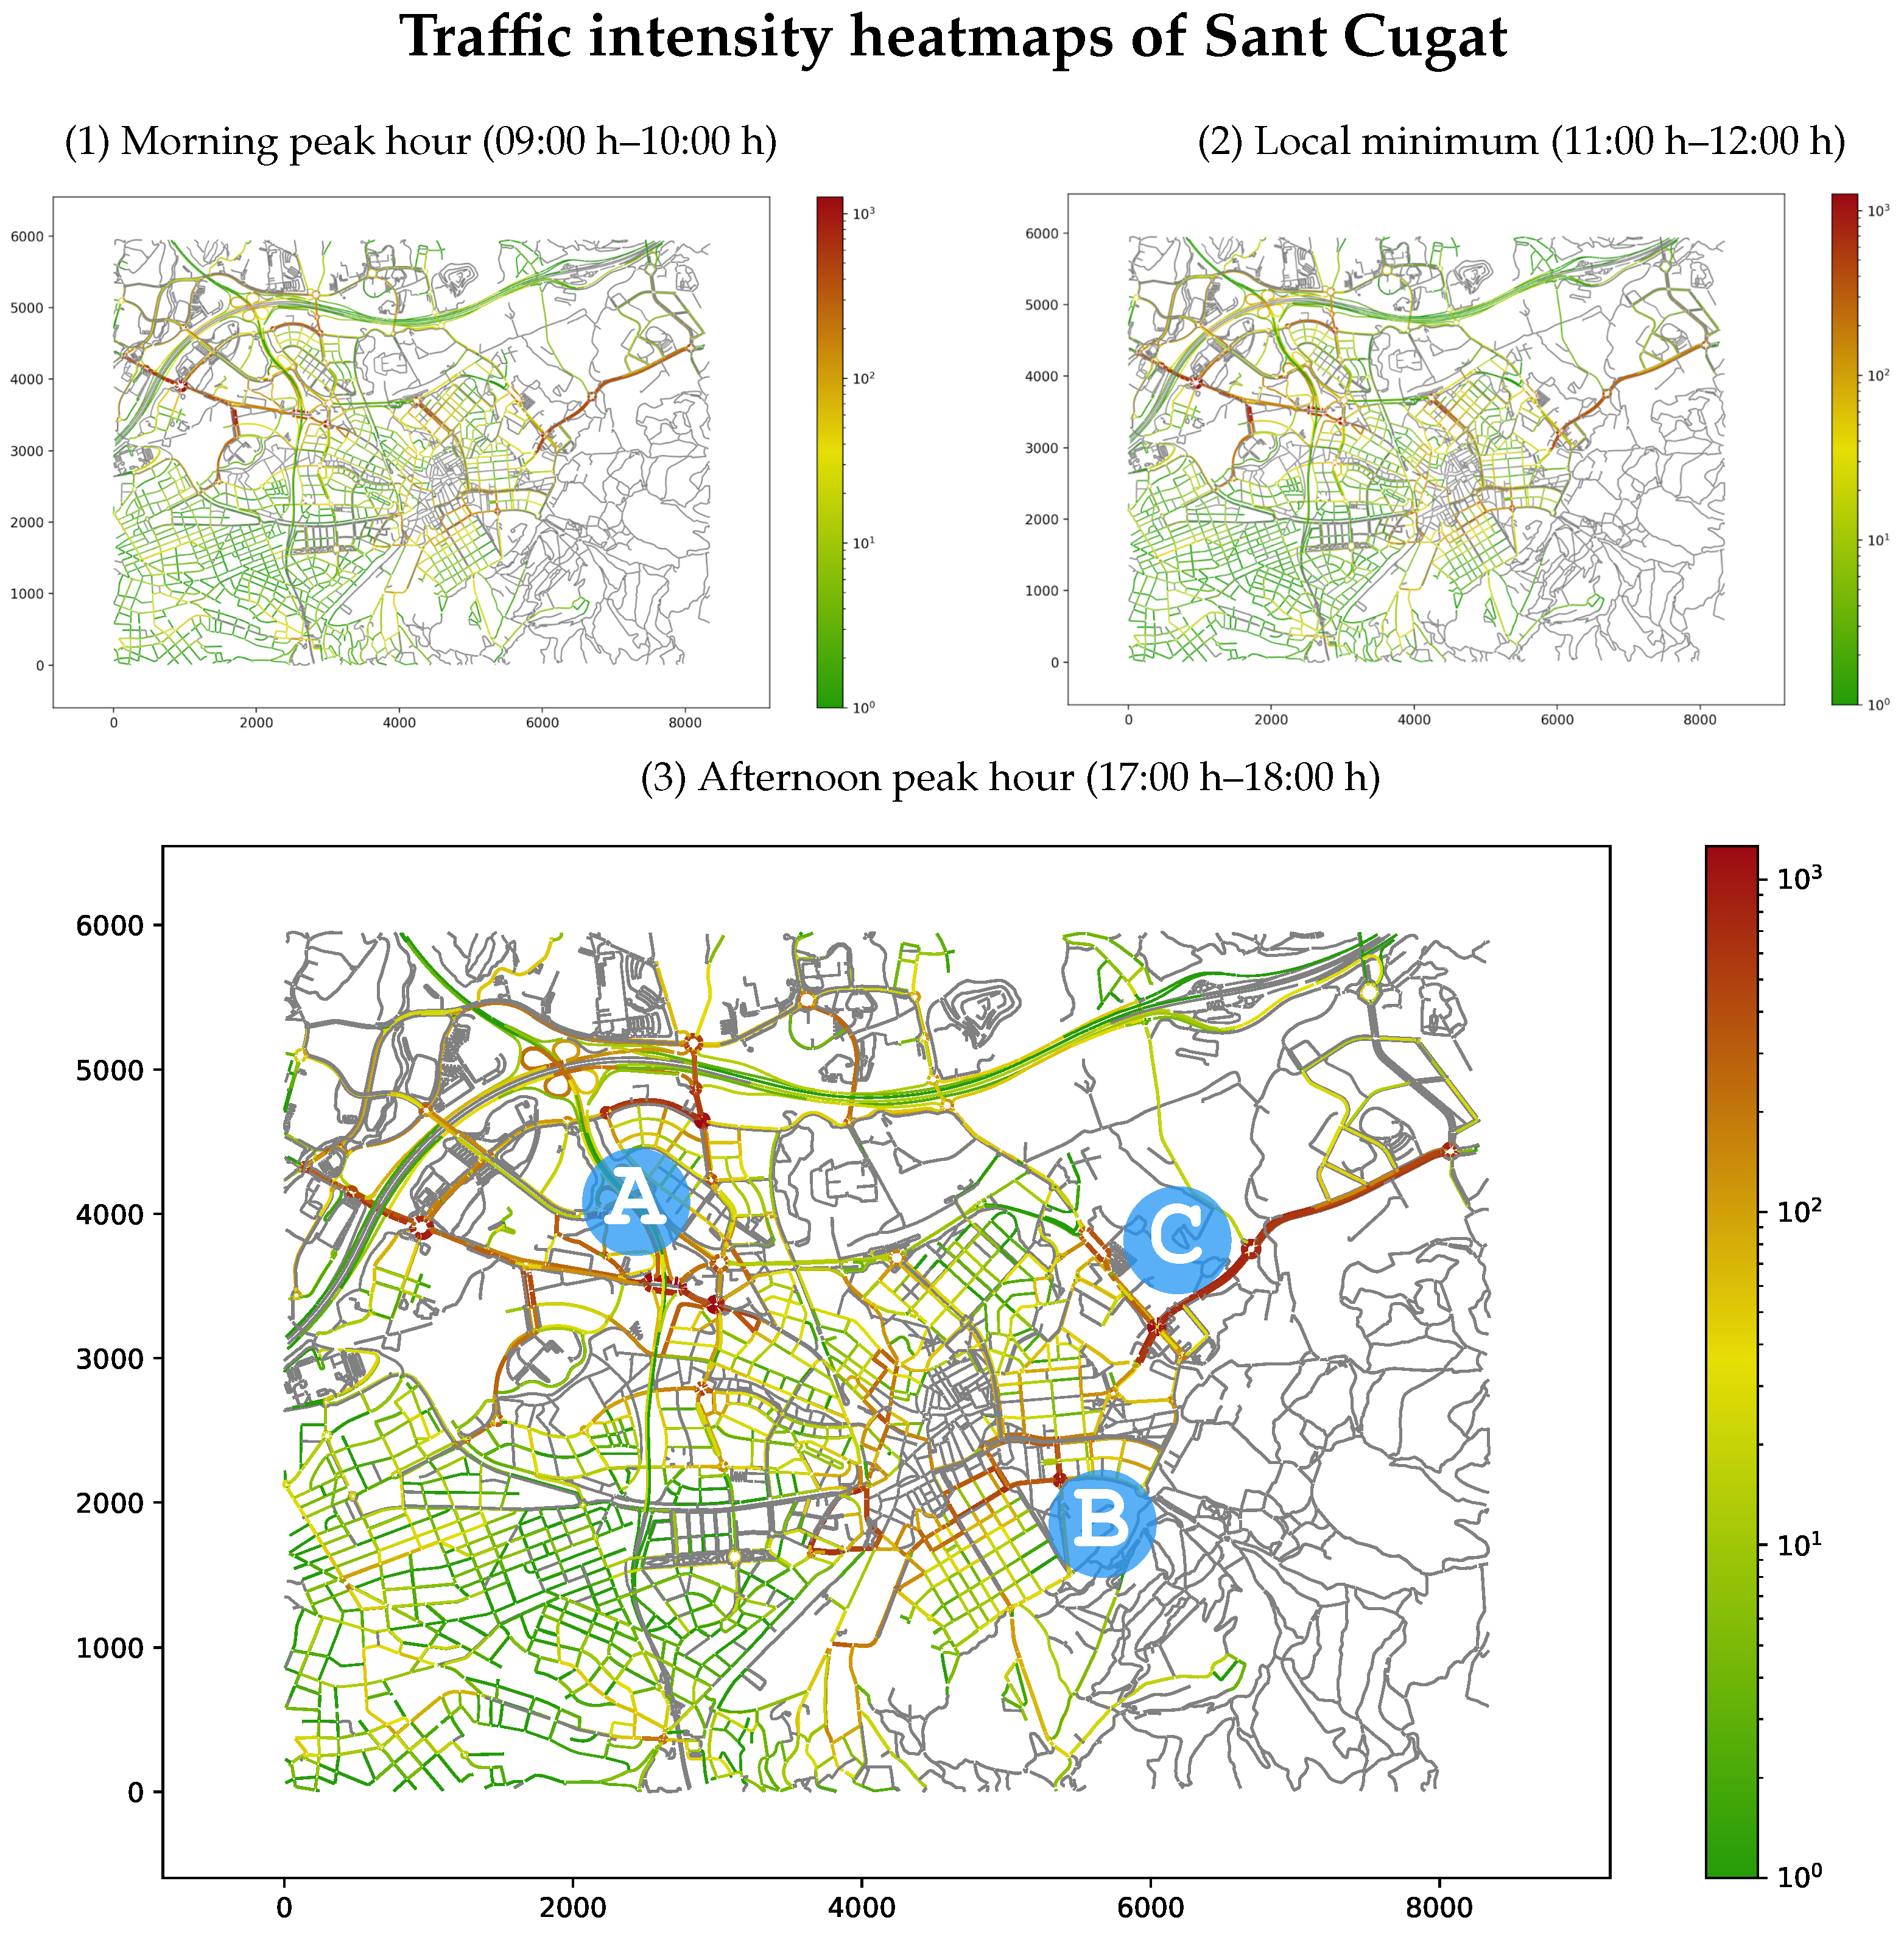
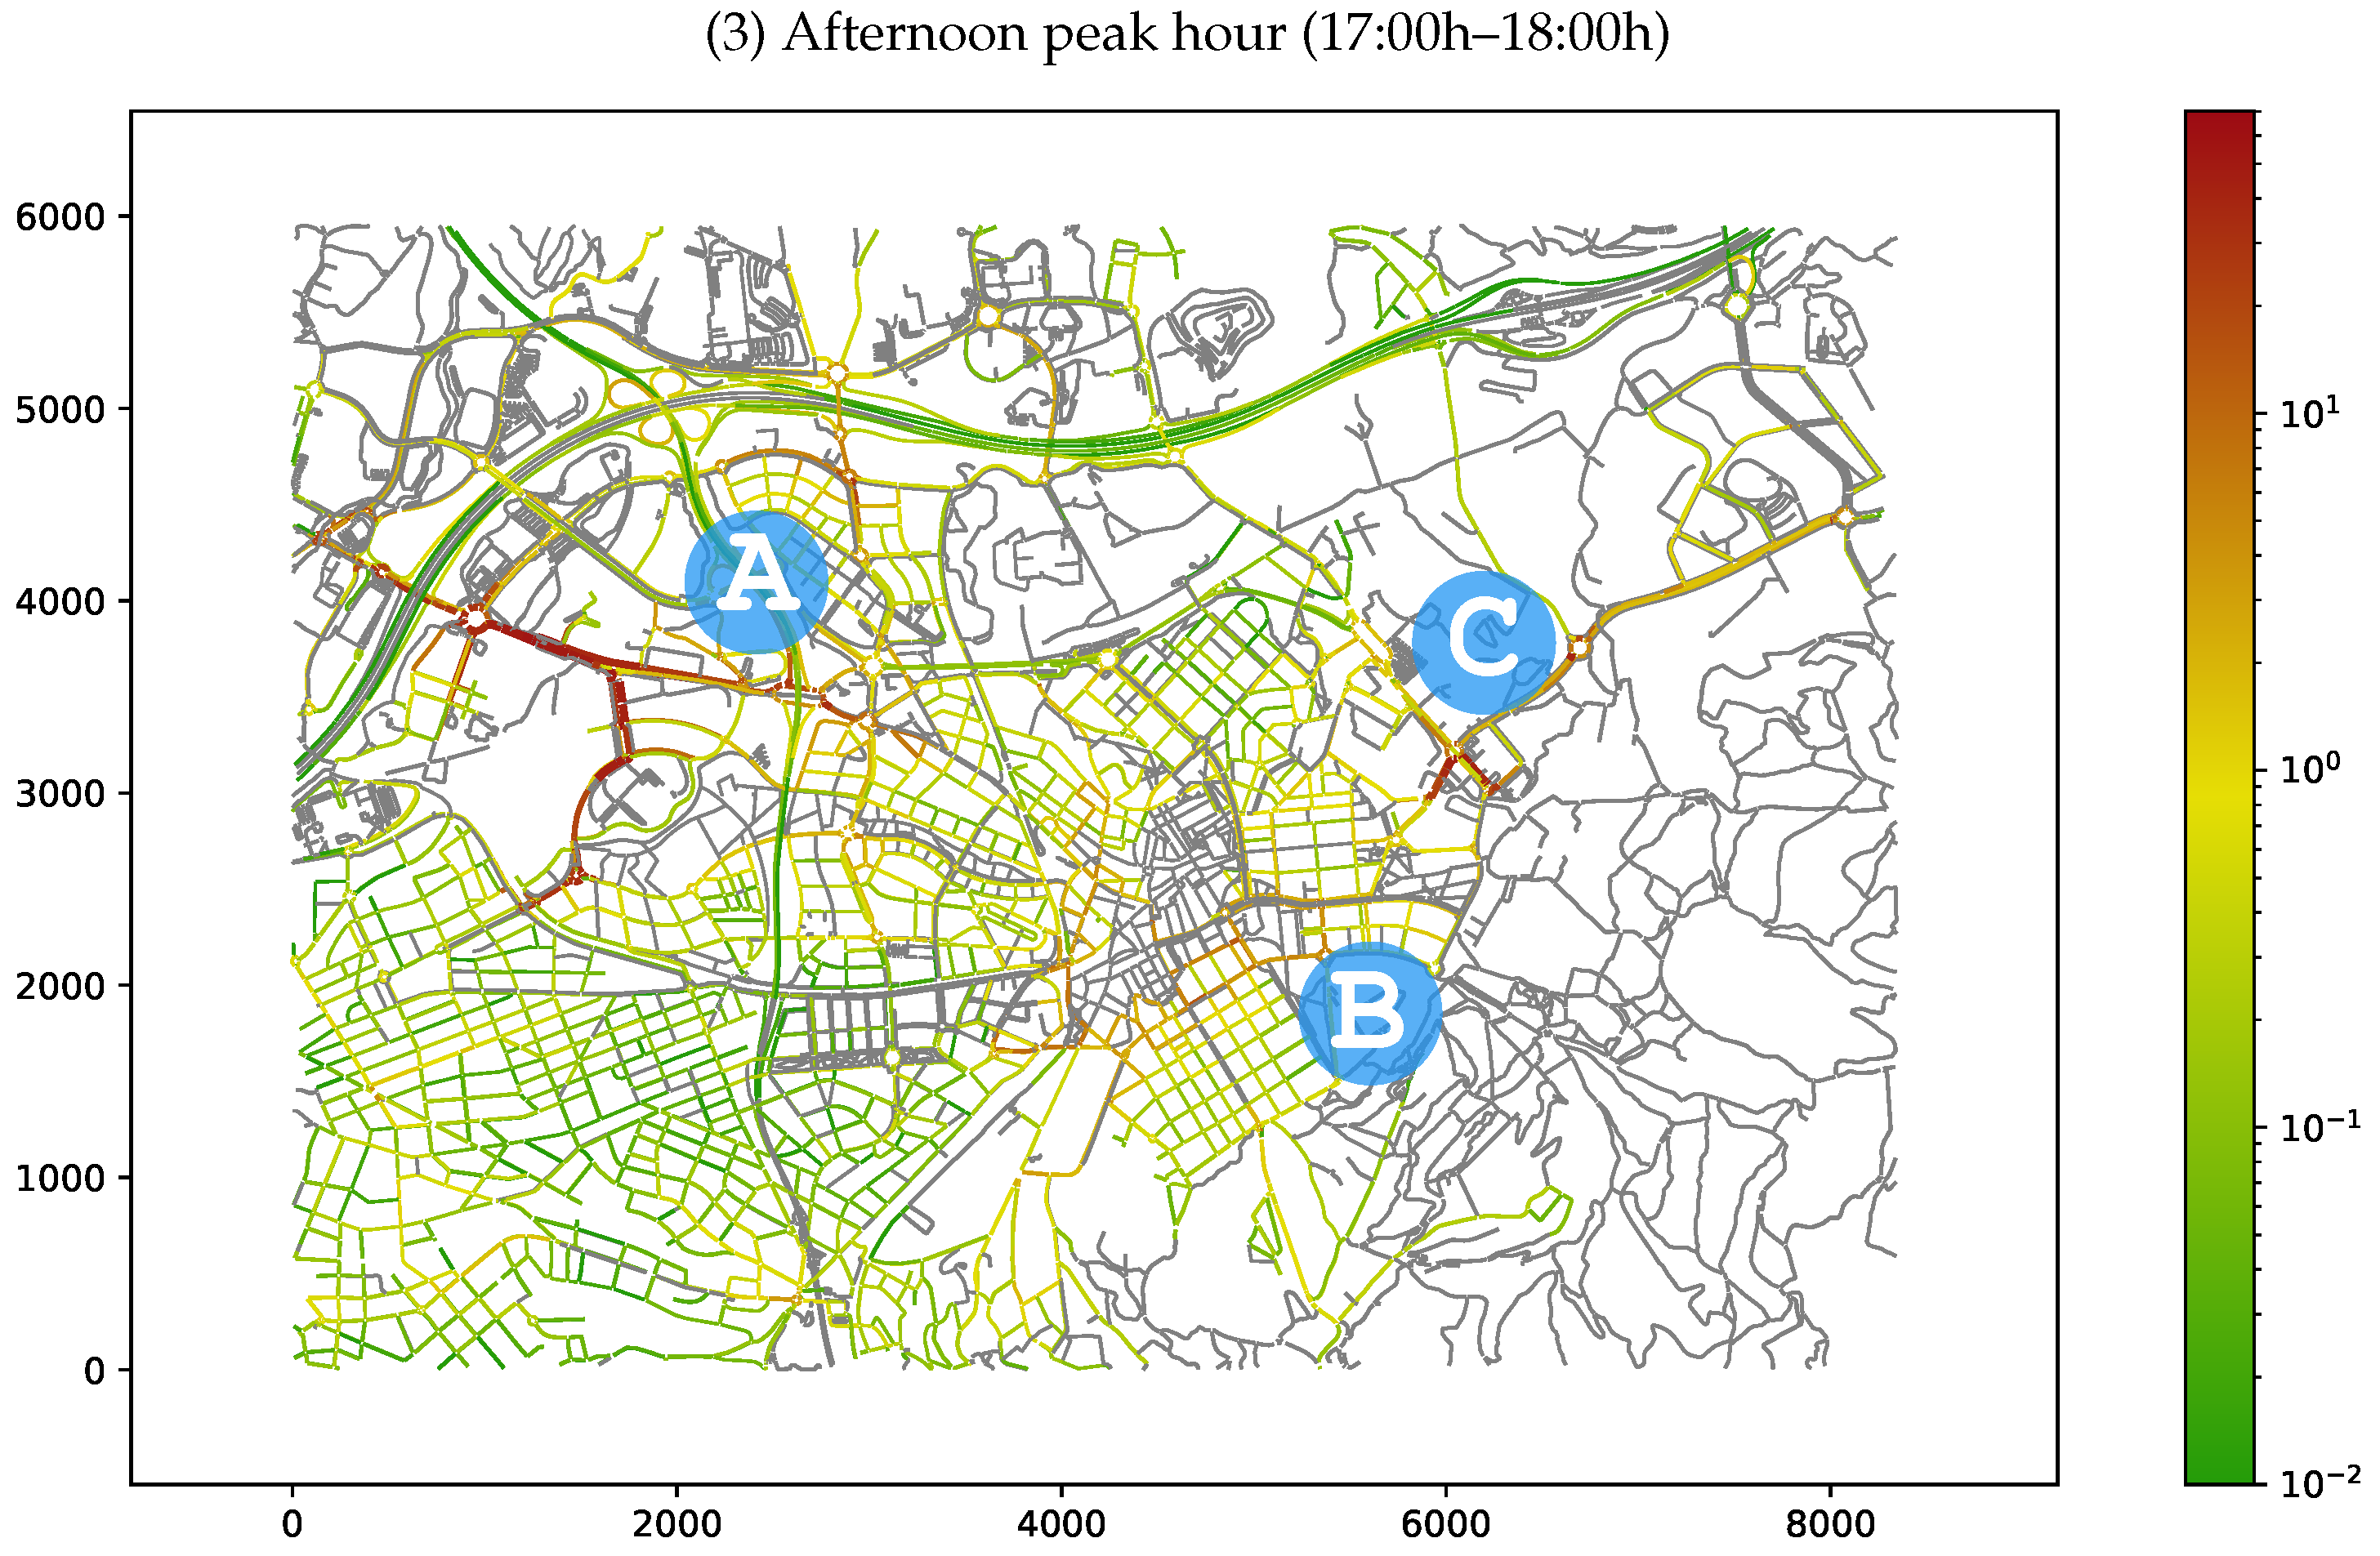
Figure 4, which exhibits two pronounced demand peaks separated by a mid-day trough. Accordingly, we report results for: (i) the morning peak hour (09:00–10:00); (ii) the local minimum between peaks (11:00–12:00); and (iii) the afternoon peak hour (17:00–18:00). The two heatmaps analyzed are:
Traffic intensity(veh/h per edge, logarithmic color scale): A color gradient from green (low intensity) to red (high intensity), providing a spatial overview of traffic load across the network.
Traffic occupancy (percentage of time the infrastructure is occupied by vehicles, logarithmic scale): A complementary measure of congestion and saturation at the link level, where high occupancy values indicate near-saturated or stop-and-go conditions.
The dual use of intensity and occupancy allows for a clear distinction between high-volume free-flow conditions and saturated traffic states, ensuring a robust characterization of urban mobility bottlenecks.
At this stage of the project, the resulting heatmaps were also reviewed in joint sessions with the City Council’s transport and traffic specialists (co-authors of this article). The experts assessed whether the spatial distribution of intensity and occupancy across the network—particularly around the historical center and the main arterial corridors—was consistent with their operational knowledge of a regular working day. This qualitative validation complemented the detector-level quantitative calibration by confirming that the simulated congestion patterns matched the expected real-world behavior at the analyzed hours.
Figure 12 and
Figure 13 present the intensity and occupancy heatmaps, respectively, for the baseline scenario defined in
Section 3.7. These maps confirm the expected high concentration of traffic along the main arterial corridors (see zones (A), (B), and (C) in
Figure 12) throughout all observed periods, with peak congestion levels occurring during the afternoon. Furthermore, these heatmaps effectively identify critical bottlenecks within the historical center, where high occupancy values correlate with reduced network performance.
This spatial distribution of traffic saturation supports the necessity of the LEZ access restrictions, as the highest occupancy levels coincide with the most vulnerable areas of the historical center, where reducing vehicle throughput is critical for both environmental quality and urban livability.
5. Discussion of Results
In this section, we discuss the principal findings of our work, highlighting the gains in accuracy achieved by leveraging large-scale datasets compared to traditional survey-based methods. We also examine the advantages of integrating our cost-effective Houndline Data Mart methodology into the real-time data flow of LEZ cameras to derive precise mobility patterns. Finally, we outline the current limitations of the framework and our roadmap for future enhancements.
5.1. Evidence-Based Refinement of Prior Studies
The camera trajectory analysis presented in
Section 4.1 provides a data-driven counterpoint to a previous mobility study conducted throughout 2025. That study, commissioned by a private firm, characterized traffic in Sant Cugat’s center through manual roadside intercept surveys of 1255 drivers during specific peak periods. Its findings suggested that through-traffic and destination-focused traffic were roughly equal in magnitude—approximately 499 vehicles/g of pure transit versus 431 vehicles/h of destination traffic. Such a characterization carries significant policy implications, as it implies that a substantial portion of central traffic could be intercepted and redirected without affecting local residents.
However, the camera-based analysis fundamentally revises this outlook. By processing 470,344 vehicle records over eight days, the data reveals that pure through-traffic (Groups 3.1 and 3.2 combined) accounts for only 3.8% of total movements, while resident and local traffic (Groups 1 and 2 combined) represents 37.37%. This discrepancy likely stems from the broader spatial and temporal scope of the automated analysis. Furthermore, manual surveys conducted at specific roadside points often over-sample arterial transit flows at the expense of more diffuse resident patterns.
Beyond mere estimation, these results underscore the critical value of integrating such high-granularity streams into a real-time data mart. Unlike static, periodic surveys, a continuous data mart of empirical data serves as a “living” foundation for informed decision-making. By providing a longitudinal and immediate view of urban dynamics, it allows municipal authorities to transition from reactive planning to proactive, evidence-based management of urban mobility, ensuring that policies are tailored to the actual behavior of the network rather than snapshots prone to sampling bias.
The MobiCugat approach demonstrates a significant methodological advantage over traditional survey-based traffic studies: the camera-based methodology is continuous, automated, and repeatable at a near-zero marginal cost. In contrast, roadside surveys are inherently localized, labor-intensive, and prone to sampling variability. By integrating these high-resolution streams into the real-time Houndline Data Mart, the system transforms raw vehicle counts into an actionable longitudinal record of urban dynamics. This centralized data architecture allows municipal planners to move beyond periodic “snapshots” toward a data-driven decision-making framework. As LEZ camera networks become ubiquitous across European municipalities, this pipeline offers a scalable, cost-effective alternative to conventional traffic census methods, providing the empirical foundation necessary for responsive and informed urban mobility management.
5.2. Scalability of the Methodology
The methodology presented in this paper is explicitly engineered for replicability and seamless integration into municipal workflows. The framework requires three primary inputs: (i) ANPR camera detections, anonymized by location, time, and vehicle category to ensure GDPR compliance; (ii) geospatial coordinates of camera installations; and (iii) an OSM road network to serve as the simulation substrate. These data streams are already available at near-zero marginal cost in hundreds of European cities operating LEZ enforcement systems —a infrastructure base that continues to grow as urban sustainability policies accelerate across the continent.
By centralizing these high-resolution streams into our real-time Houndline Data Mart, the RUTGe framework’s DRL model provides a powerful layer of scalability. Once pre-trained on diverse traffic datasets, the model can be rapidly adapted to new urban topologies. The entire pipeline—from raw sensor ingestion to a validated SUMO scenario—is computationally efficient enough to run on standard workstations. This accessibility ensures that high-fidelity simulation and informed decision-making are within reach for municipal planning teams, even those with limited computational or budgetary resources.
The cost-effectiveness of this approach is a decisive advantage for public administration. Since LEZ cameras are already funded and maintained for enforcement purposes, no additional sensing infrastructure is required. The marginal cost of the mobility planning application is restricted to automated data extraction and processing within the data mart. This stands in sharp contrast to bespoke traffic sensing campaigns—such as manual counts, induction loops, or proprietary GPS studies—which typically demand substantial public investment and recurring operational costs.
Beyond its technical and economic advantages, the integration of this real-time data mart facilitates a higher standard of public accountability and transparency. By providing a continuous and verifiable record of urban traffic dynamics, municipal authorities can ground their mobility policies—such as the implementation of LEZ or pedestrianization schemes—in objective, empirical evidence. This data-driven approach allows for transparent communication of policy impacts to the public, fostering trust through measurable results. Ultimately, the transition from fragmented manual surveys to a centralized automated data mart enables a more responsive governance model, where urban interventions are informed by real-world behavior and easily auditable by the community.
5.3. Limitations
Several limitations of the current study should be acknowledged when interpreting the results. Although there still may be minor inaccuracies compared to the real-world road network, this initial stage of the MobiCugat project has proven to be very successful in establishing a robust data mart of empirical traffic data derived from the City Council’s LEZ camera network. This methodology has demonstrated significant benefits for feeding the MobiCugat platform integrated with the SUMO simulator and our AI-driven traffic model, RUTGe. The result is a realistic simulation environment of Sant Cugat that allows urban planners to ’play’ with the city map: testing measures such as street closures or relocating bus stops to analyze their systemic impact on mobility under various scenarios. Moving forward, as pointed out in
Section 7, we intend to continuously refine the precision and realism of the simulator, evolving it into a high-fidelity simulation tool capable of supporting real-time operational decisions. The following points represent the key areas targeted for further improvement within the MobiCugat project:
Map accuracy: The road network used in this study is derived from OSM. Despite extensive manual review and correction, minor inaccuracies may persist compared to the official GIS maintained by the City Council. The future integration of the official GIS-based network (
Section 7) is expected to enhance simulation fidelity, particularly in the historical center, where street-level geometry and connectivity are notably complex.
Camera coverage: Although the ANPR camera network is extensive, it does not monitor every road segment within Sant Cugat. This partial coverage introduces uncertainty in the inferred traffic demand on unmonitored segments, as traffic flows on unmonitored segments must be inferred by RUTGe rather than directly observed. The reliability of these inferences is inherently tied to the density and spatial distribution of the available detectors. Furthermore, some cameras are strategically positioned to monitor restricted-access streets and detect traffic violations rather than to track general flow. Consequently, a systematic review of the camera inventory—conducted in collaboration with the Local Council—is key to filtering and selecting the most suitable devices for mobility analysis, as detailed in
Section 3.6. In this regard, the City Council counts on portable traffic counters that can be temporarily deployed at strategic locations to monitor specific traffic flows of interest.
Temporal scope: The simulations presented in this article cover a complete week. Although variations within a week occur, many municipalities exhibit significant seasonal and periodic variations—such as tourism-driven fluctuations or distinct contrasts between weekdays and weekends—that may not be fully captured within a single-week simulation span. Once the automated online mechanism for feeding the Houndline Data Mart with the LEZ camera data stream is fully implemented, the entire procedure can be replicated across a wider variety of scenarios, including public holidays, long weekends, festive periods (such as Christmas), vacation seasons, and local market days, among other specific events of interest.
Vehicle diversity: Current simulation scenarios incorporate flow data for cars, buses, and delivery vehicles. Due to the project’s initial scope, it was not possible to include waste collection trucks; however, these routes significantly influence urban traffic, particularly in single-lane streets where overtaking is impossible. Future iterations of MobiCugat will incorporate these heavy vehicles to better capture their systemic impact on mobility. Furthermore, we aim to include micro-mobility modes, such as bicycles, which will necessitate the integration of dedicated bike lane geometries and specific cycling behavior models into the simulator.
Behavioral response: The current simulations model the road network topology under alternative access configurations but do not account for long-term driver adaptation. Behavioral shifts—such as route learning, modal split changes (mode switching), and the emergence of induced or suppressed demand—typically manifest over weeks or months after real-world interventions. Capturing these evolutionary effects would require the integration of agent-based behavioral models or advanced dynamic traffic assignment (DTA) frameworks, which remain as a future objective for the MobiCugat platform as discussed in
Section 7.
6. Conclusions
This paper has presented MobiCugat, a project where we have designed a complete methodology for re-purposing LEZ ANPR camera data as the calibration backbone for a city-scale microscopic traffic simulation using SUMO. Applied to the municipality of Sant Cugat del Vallès in Catalonia, the approach demonstrates that high-quality, city-scale traffic simulations suitable for municipal policy evaluation can be produced from LEZ enforcement infrastructure already deployed and funded for regulatory purposes, at marginal additional cost and without the collection of any individual-level personal data.
The key technical contribution of the work is the end-to-end pipeline linking raw ANPR detections—aggregated into 15-min traffic intensities per camera location—to RUTGe-generated SUMO-compatible traffic demand and subsequently to a validated traffic simulation using SUMO. Across three representative traffic conditions—morning peak (09:00–10:00), midday off-peak (12:00–13:00), and evening peak (18:00–19:00)—the pipeline achieved low detector-level calibration errors, with values ranging between and against real camera measurements. These results confirm the robustness of the proposed methodology under different traffic conditions and support its validity as a decision-support tool for urban mobility planning.
An important finding with direct policy implications is that camera trajectory analysis of 470,344 vehicle records over eight days reveals resident and local traffic (37.37%) to be the dominant mobility pattern in the study area, far exceeding pure through-traffic (3.8%). This result substantially revises the characterization from prior survey-based studies in the city and redefines previous assumptions through a data-driven approach.
More broadly, this work demonstrates that the LEZ enforcement infrastructure now deployed across hundreds of European municipalities represents an underutilized strategic asset for urban mobility intelligence. As municipalities face growing pressure to comply with the EU Zero Pollution Action Plan, revised Urban Mobility Package, and related environmental legislation, demand for cost-efficient, data-driven decision-support tools will intensify. This pipeline offers a scalable, reproducible template for meeting this need, applicable to any city with an ANPR camera network regardless of size.
Beyond the methodological contribution, the MobiCugat framework yields several practical implications for the stakeholders responsible for urban mobility management. The most direct takeaway is that LEZ enforcement infrastructure—already funded, deployed, and operated for regulatory compliance—can be re-used as the backbone of a city-scale mobility planning system at near-zero marginal cost. For municipalities currently operating or planning LEZ deployments, this represents a substantial return-on-investment opportunity: the same sensors that enforce vehicle access regulations can, with appropriate data-processing pipelines, also support evidence-based evaluation of pedestrianization, traffic-flow reversals, bus-route optimization, and other infrastructure interventions, without additional procurement of dedicated traffic-sensing equipment. Furthermore, mobility interventions that alter daily routines—street closures, lane reductions, traffic-flow reversals, or pedestrianization—frequently encounter public resistance when residents perceive them as arbitrary or politically motivated. Grounding such decisions in a reproducible simulation provides citizens with an empirical basis for the proposed intervention. This may shift public discourse from contesting the legitimacy of the decision itself toward a more substantive debate on its expected impacts and trade-offs, and mitigate the perception that mobility changes are introduced on a discretionary basis.
Ultimately, MobiCugat transcends traditional static modeling to function as a policy-testing Digital Twin. By maintaining a continuous link between real-world LEZ infrastructure and the virtual environment, the framework provides a robust ’what-if’ sandbox for urban planners. This allows for the risk-free simulation of complex interventions—such as street pedestrianization, signal timing adjustments, or the expansion of low-emission boundaries—ensuring that municipal decisions are backed by high-fidelity, data-driven predictions before physical implementation.
7. Future Work
Continuous improvement of the MobiCugat project is currently focused on replacing the OSM-derived road network with the official GIS map maintained by the Sant Cugat City Council. This transition will provide an authoritative ground truth for street geometry, lane configurations, and traffic regulations, significantly reducing modeling uncertainties.
A high-priority objective for future development is the integration of a real-time data ingestion layer into the pipeline. By connecting the simulation model directly to the live output of the ANPR camera network, the platform will enable dynamic traffic management applications, such as adaptive signal control and incident response routing. This capability would allow simulation-based predictions to be continuously updated as traffic conditions evolve throughout the day. Moreover, in the future we plan to incorporate additional types of urban vehicles by deploying mobile traffic flow monitoring stations at key junctions to measure vehicle-specific (such as waste collection trucks and micro-mobility like bicycles) traffic intensity.
A compelling future direction involves incorporating route learning and mode-switching analysis to integrate behavioral responses into the simulation framework. This will enable mobility experts to evaluate both the transitional and long-term implications of urban interventions on commuter behavior.
On the methodological side, the RUTGe framework has been extended to support Federated Deep Reinforcement Learning (FDRL), enabling collaborative model training across multiple cities without the need to centralize or share raw traffic data [
32]. This federated approach allows municipalities to train more robust and general-purpose traffic demand models using edge-computing while preserving local data privacy. Although this decentralized architecture may increase initial deployment costs (as it requires processing power near the ANPR cameras), it significantly lowers the barriers to cross-municipal cooperation and data protection compliance.
Finally, future work will extend the analysis to include additional mobility metrics, such as per-zone CO
2 emission mapping derived from SUMO’s HBEFA-based models, the evaluation of alternative bus network configurations, and the assessment of Mobility Hubs as a long-term strategy for managing resident access to the pedestrianized center. Furthermore, the publication of aggregated mobility Key Performance Indicators (KPIs) from the LEZ network as Open Data is currently under consideration. Following the precedent established by the Barcelona Metropolitan Area (AMB) with the ”ZBE Rondes” dataset [
33], this initiative aims to enhance transparency and foster third-party research and innovation.
Beyond municipal boundaries, the Houndline Data Mart is designed to easily be integrated into sovereign Data Spaces, enabling cross-border collaboration between different local authorities. By adopting data space governance frameworks, municipalities can securely share insights and best practices without compromising the underlying raw data of their citizens. This ecosystem facilitates the deployment of advanced Artificial Intelligence models—trained collectively across multiple city datasets—while ensuring absolute data sovereignty and regulatory compliance. Such a collaborative environment accelerates regional learning, allowing cities to adapt to emerging mobility trends more rapidly through shared intelligence while maintaining the highest standards of privacy and trust. This approach aligns with the European Strategy for Data and the EU Green Deal, providing a practical implementation for the creation of a common European Green Deal Data Space (GDDS). By fostering the exchange of mobility intelligence, this framework supports the transition toward climate neutrality and the digital transformation of urban governance across the Union [
34].
Author Contributions
Conceptualization, A.B.-G., V.R.-J., M.A.I., J.M., M.V.i.P. and A.M.i.C.; methodology, A.B.-G. and V.R.-J.; software, A.B.-G. and V.R.-J.; validation, A.B.-G., V.R.-J., J.M., M.V.i.P. and A.M.i.C.; formal analysis, A.B.-G. and V.R.-J.; investigation, A.B.-G., V.R.-J. and J.M.; resources, J.M., M.V.i.P. and A.M.i.C.; data curation, J.M.; writing—original draft preparation, A.B.-G. and V.R.-J.; writing—review and editing, M.A.I., J.M., M.V.i.P. and A.M.i.C.; visualization, A.B.-G. and V.R.-J.; supervision, M.A.I.; project administration, J.M. and M.V.i.P.; funding acquisition, M.A.I. All authors have read and agreed to the published version of the manuscript.
Funding
This work was supported by the project “MobiCugat: Estudi de mobilitat urbana per l’Ajuntament de Sant Cugat” (C-13469); by the project “DISCOVERY: DIstributed Smart Communications with Verifiable EneRgy-optimal Yields” PID2023-148716OB-C32 (Agencia Estatal de Investigación, Ministerio de Ciencia e Innovación); by the project “MultiMO: Datos MultiSectoriales para la Movilidad Obligada” TSI-100123-2024-60 (Ministerio de transformación digital y de la función pública, NextGenerationEU); also by doctoral scholarship PRE2021-099830 funded by the Ministerio de Ciencia, Innovación y Universidades; and by doctoral scholarship Joan Oró “2024 FI-1 00762” funded by the Agència de Gestió d’Ajuts Universitaris i de Recerca (AGAUR).
Institutional Review Board Statement
Not applicable. This study did not involve human subjects. All vehicle detection data was processed in aggregate by HoundLine’s pipeline in compliance with the General Data Protection Regulation (GDPR); no individual-level personal data was accessed or retained by the research team.
Informed Consent Statement
Not applicable. Individual vehicle identifiers (license plate numbers) were removed at source prior to data access by the research team; only aggregated traffic counts and flow patterns were used in this study.
Data Availability Statement
Aggregated traffic intensity data from the Sant Cugat LEZ camera network is subject to the data governance policies of the Ajuntament de Sant Cugat del Vallès and is not publicly available. The SUMO road network file and simulation configuration scripts used in this study are available upon reasonable request to the corresponding author. RUTGe is available as open-source software at
https://gitlab.com/siscom-upc/rutge (accessed on 19 May 2026 ).
Acknowledgments
The authors thank the Mobility Department of the Ajuntament de Sant Cugat del Vallès for their expert review of the simulation outputs, their guidance on local traffic management conditions, and their provision of camera GPS coordinates and GIS data. During the preparation of this manuscript, AI-based language tools were used to assist with the review and refinement of wording and grammar. All outputs generated by these tools were critically reviewed, verified, and edited by the authors prior to inclusion in the final manuscript. The authors bear full responsibility for the content and conclusions presented in this work.
Conflicts of Interest
Author Joaquim Montal was employed by the company HoundLine S.L. Marta Vives and Albert Muratet were employed by the City Council Ajuntament de Sant Cugat. The remaining authors declare that the research was conducted in the absence of any commercial or financial relationships that could be construed as a potential conflict of interest.
Abbreviations
The following abbreviations are used in this manuscript:
| AI | Artificial Intelligence |
| AMB | Àrea Metropolitana de Barcelona/Barcelona Metropolitan Area |
| ANPR | Automatic Number Plate Recognition |
| DTA | Dynamic Traffic Assignment |
| DRL | Deep Reinforcement Learning |
| DT | Digital Twin |
| FDRL | Federated Deep Reinforcement Learning |
| GDDS | Green Deal Data Space |
| GDPR | General Data Protection Regulation |
| GHG | Greenhouse Gas |
| GIS | Geographic Information System |
| KPI | Key Performance Indicator |
| LEZ | Low Emission Zone |
| MARE | Mean Absolute Relative Error |
| OD | Origin–Destination |
| OSM | OpenStreetMap |
| PII | Personally Identifiable Information |
| PPO | Proximal Policy Optimization |
| RUTGe | Realistic Urban Traffic Generator |
| SUMO | Simulation of Urban Mobility |
| UPC | Universitat Politècnica de Catalunya |
| ZBE | Zona de Baixes Emissions/Low Emission Zone |
References
- Tao, F.; Xiao, B.; Qi, Q.; Cheng, J.; Ji, P. Digital twin modeling. J. Manuf. Syst. 2022, 64, 372–389. [Google Scholar] [CrossRef]
- Iliuţă, M.E.; Moisescu, M.A.; Pop, E.; Ionita, A.D.; Caramihai, S.I.; Mitulescu, T.C. Digital Twin—A Review of the Evolution from Concept to Technology and Its Analytical Perspectives on Applications in Various Fields. Appl. Sci. 2024, 14, 5454. [Google Scholar] [CrossRef]
- Kritzinger, W.; Karner, M.; Traar, G.; Henjes, J.; Sihn, W. Digital Twin in manufacturing: A categorical literature review and classification. IFAC-PapersOnLine 2018, 51, 1016–1022. [Google Scholar] [CrossRef]
- HoundLine. Data Services and Advanced Analytics for Urban Mobility. 2026. Available online: https://www.houndline.com (accessed on 5 March 2026).
- Bazán-Guillén, A.; Barbecho Bautista, P.A.; Igartua, M.A. RUTGe: Realistic Urban Traffic Generator for Urban Environments Using Deep Reinforcement Learning and SUMO Simulator. In Proceedings of the 11th International Conference on Vehicle Technology and Intelligent Transport Systems—VEHITS; SciTePress: Setúbal, Portugal, 2025; pp. 557–564. [Google Scholar] [CrossRef]
- SISCOM Research Group. Smart Services for Information Systems and Communication Networks. Department of Network Engineering. 2026. Available online: https://siscom.upc.edu (accessed on 5 March 2026).
- Napolitano, M.; Somma, A.; De Benedictis, A.; Mazzocca, N. FlowTwin: A Digital Twin for Traffic Flow Monitoring. IEEE Open J. Intell. Transp. Syst. 2025, 6, 1551–1568. [Google Scholar] [CrossRef]
- European Environment Agency. Sustainability of Europe’s Mobility Systems; Publications Office of the European Union: Luxembourg, 2024. [Google Scholar]
- Delgado-Lindeman, M.; Cordera, R.; Moura, J.L.; Rodriguez, A. Characteristics and effects of low emission zones in Europe. A systematic literature review. Eur. Transp. Res. Rev. 2025, 17, 54. [Google Scholar] [CrossRef]
- Deakin, S.N. Exploring traffic evaporation: Findings from tactical urbanism interventions in Barcelona. Case Stud. Transp. Policy 2022, 10, 2430–2442. [Google Scholar] [CrossRef]
- Huzzat, A.; Anpalagan, A.; Khwaja, A.S.; Woungang, I.; Alnoman, A.A.; Pillai, A.S. A comprehensive review of Digital Twin technologies in smart cities. Digit. Eng. 2025, 4, 100040. [Google Scholar] [CrossRef]
- Lopez, P.A.; Wiessner, E.; Behrisch, M.; Bieker-Walz, L.; Erdmann, J.; Flotterod, Y.P.; Hilbrich, R.; Lucken, L.; Rummel, J.; Wagner, P. Microscopic Traffic Simulation using SUMO. In Proceedings of the 2018 21st International Conference on Intelligent Transportation Systems (ITSC); IEEE: New York, NY, USA, 2018; pp. 2575–2582. [Google Scholar] [CrossRef]
- Guin, A.; Bazán Guillén, A.; Kannan, P.; Aguilar Iguartua, M. Simulation under Stress: A Comparative Benchmarking of Large-Scale Traffic Simulators. In Proceedings of the 2025 International Conference on Modeling, Analysis and Simulation of Wireless and Mobile Systems (MSWiM 2025); IEEE: New York, NY, USA, 2025. [Google Scholar] [CrossRef]
- Barbecho Bautista, P.; Urquiza Aguiar, L.; Aguilar Igartua, M. How does the traffic behavior change by using SUMO traffic generation tools. Comput. Commun. 2022, 181, 1–13. [Google Scholar] [CrossRef]
- Ajuntament de Sant Cugat del Vallès. Official Website of the Sant Cugat del Vallès City Council. 2026. Available online: https://www.santcugat.cat (accessed on 5 March 2026).
- Castillo, E.; Menéndez, J.M.; Jiménez, P. Trip matrix and path flow reconstruction and estimation based on plate scanning and link observations. Transp. Res. Part B Methodol. 2008, 42, 455–481. [Google Scholar] [CrossRef]
- González, M.C.; Hidalgo, C.A.; Barabási, A.L. Understanding individual human mobility patterns. Nature 2008, 453, 779–782. [Google Scholar] [CrossRef] [PubMed]
- Castillo, E.; Gallego, I.; Menéndez, J.M.; Rivas, A. Optimal Use of Plate-Scanning Resources for Route Flow Estimation in Traffic Networks. IEEE Trans. Intell. Transp. Syst. 2010, 11, 380–391. [Google Scholar] [CrossRef]
- Mínguez, R.; Sánchez-Cambronero, S.; Castillo, E.; Jiménez, P. Optimal traffic plate scanning location for OD trip matrix and route estimation in road networks. Transp. Res. Part Methodol. 2010, 44, 282–298. [Google Scholar] [CrossRef]
- Asakura, Y.; Hato, E.; Kashiwadani, M. Origin-destination matrices estimation model using automatic vehicle identification data and its application to the Han-Shin expressway network. Transportation 2000, 27, 419–438. [Google Scholar] [CrossRef]
- Fu, X.; Yang, H.; Liu, C.; Wang, J.; Wang, Y. A hybrid neural network for large-scale expressway network OD prediction based on toll data. PLoS ONE 2019, 14, e0217241. [Google Scholar] [CrossRef]
- Rao, W.; Wu, Y.J.; Xia, J.; Ou, J.; Kluger, R. Origin-destination pattern estimation based on trajectory reconstruction using automatic license plate recognition data. Transp. Res. Part C Emerg. Technol. 2018, 95, 29–46. [Google Scholar] [CrossRef]
- Miranda-Pascual, A.; Guerra-Balboa, P.; Parra-Arnau, J.; Forné, J.; Strufe, T. SoK: Differentially Private Publication of Trajectory Data. Proc. Priv. Enhancing Technol. 2023, 2023, 496–516. [Google Scholar] [CrossRef]
- Liu, J.; Zheng, F.; Van Zuylen, H.J.; Li, J. A dynamic OD prediction approach for urban networks based on automatic number plate recognition data. Transp. Res. Procedia 2020, 47, 601–608. [Google Scholar] [CrossRef]
- Zargari, S.A.; Memarnejad, A.; Mirzahossein, H. Hourly origin–destination matrix estimation using intelligent transportation systems data and deep learning. Sensors 2021, 21, 7080. [Google Scholar] [CrossRef]
- Robinson, A.; Venter, C. Validating traffic models using large-scale Automatic Number Plate Recognition (ANPR) data. J. S. Afr. Inst. Civ. Eng. 2019, 61, 45–57. [Google Scholar] [CrossRef]
- Hadavi, S.; Rai, H.B.; Verlinde, S.; Huang, H.; Macharis, C.; Guns, T. Analyzing passenger and freight vehicle movements from automatic-Number plate recognition camera data. Eur. Transp. Res. Rev. 2020, 12, 37. [Google Scholar] [CrossRef]
- Tang, J.; Wan, L.; Schooling, J.; Zhao, P.; Chen, J.; Wei, S. Automatic number plate recognition (ANPR) in smart cities: A systematic review on technological advancements and application cases. Cities 2022, 129, 103833. [Google Scholar] [CrossRef]
- Van de Vyvere, B.; Colpaert, P. Using ANPR data to create an anonymized linked open dataset on urban bustle. Eur. Transp. Res. Rev. 2022, 14, 17. [Google Scholar] [CrossRef]
- EU. Regulation (EU) 2016/679; General Data Protection Regulation (GDPR); Official Journal of the European Union: Brussels, Belgium, 2016; pp. 1–78. Available online: https://eur-lex.europa.eu/eli/reg/2016/679 (accessed on 5 March 2026).
- OpenStreetMap Contributors. OpenStreetMap. 2012. Available online: http://www.openstreetmap.org (accessed on 3 March 2026).
- Bazán-Guillén, A.; Beis-Penedo, C.; Cajaraville-Aboy, D.; Barbecho-Bautista, P.; Díaz-Redondo, R.P.; de la Cruz Llopis, L.J.; Fernández-Vilas, A.; Igartua, M.A.; Fernández-Veiga, M. Realistic Urban Traffic Generator Using Decentralized Federated Learning for the SUMO Simulator. IEEE Open J. Commun. Soc. 2025, 6, 6627–6649. [Google Scholar] [CrossRef]
- Number of Vehicles Circulating Within the Barcelona Ring Roads LEZ According to Environmental Label. ZBE Rondes Barcelona. 2025. Available online: https://www.amb.cat/en/web/area-metropolitana/dades-obertes/cataleg/detall/-/dataset/evolucio-dels-vehicles-dins-la-zbe-rondes-de-barcelona/10107517/11692 (accessed on 10 March 2026).
- European Commission. Green Deal Data Space (GDDS). 2025. Available online: https://environment.ec.europa.eu/law-and-governance/green-data_en (accessed on 10 March 2026).
Figure 1.
Schematic of the data processing pipeline, from raw ANPR camera detections to SUMO simulation input. Note that the Raw ANPR logs exclude PII, such as license plate numbers, which were appropriately anonymized beforehand.
Figure 1.
Schematic of the data processing pipeline, from raw ANPR camera detections to SUMO simulation input. Note that the Raw ANPR logs exclude PII, such as license plate numbers, which were appropriately anonymized beforehand.
Figure 2.
Map of the Sant Cugat del Vallès municipality, showing the LEZ perimeter and the locations of the 102 ANPR cameras deployed.
Figure 2.
Map of the Sant Cugat del Vallès municipality, showing the LEZ perimeter and the locations of the 102 ANPR cameras deployed.
Figure 3.
Overview of the validated SUMO road network for Sant Cugat del Vallès, comprising 5993 junctions and 12,958 edges, covering a surface of roughly .
Figure 3.
Overview of the validated SUMO road network for Sant Cugat del Vallès, comprising 5993 junctions and 12,958 edges, covering a surface of roughly .
Figure 4.
Aggregated daily traffic intensity curve across all camera locations for a representative baseline day. Two demand peaks are observed around 09:00 and 18:00, separated by a lower-demand midday period. The validation considers three representative windows: 09:00–10:00, 12:00–13:00, and 18:00–19:00.
Figure 4.
Aggregated daily traffic intensity curve across all camera locations for a representative baseline day. Two demand peaks are observed around 09:00 and 18:00, separated by a lower-demand midday period. The validation considers three representative windows: 09:00–10:00, 12:00–13:00, and 18:00–19:00.
Figure 5.
Overview of the RUTGe traffic demand generation workflow used in MobiCugat. Aggregated detector measurements are used to iteratively calibrate SUMO-compatible traffic demand through a DRL-based optimization process.
Figure 5.
Overview of the RUTGe traffic demand generation workflow used in MobiCugat. Aggregated detector measurements are used to iteratively calibrate SUMO-compatible traffic demand through a DRL-based optimization process.
Figure 6.
Simplified Markov Decision Process (MDP) formulation used in RUTGe for DRL-based traffic demand generation. The agent iteratively modifies traffic demand according to the agreement between simulated and observed detector measurements.
Figure 6.
Simplified Markov Decision Process (MDP) formulation used in RUTGe for DRL-based traffic demand generation. The agent iteratively modifies traffic demand according to the agreement between simulated and observed detector measurements.
Figure 7.
Classification of the ANPR cameras according to their location group: interior camera (blue), and exterior camera (black).
Figure 7.
Classification of the ANPR cameras according to their location group: interior camera (blue), and exterior camera (black).
Figure 8.
Distribution of vehicle mobility patterns over an eight-day observation period (n = 470,344 vehicle records). Resident and local traffic (Groups 1 and 2 combined: 37.37%) substantially outnumbers short- and long-stay through-traffic (Groups 3.1 and 3.2 combined: 3.79%). Group 4 (40.73%) represents the largest share of the sample, consisting of vehicles detected only by external cameras with trajectories that remain outside the LEZ boundary. Groups 5, 6, and 7 are excluded from this figure.
Figure 8.
Distribution of vehicle mobility patterns over an eight-day observation period (n = 470,344 vehicle records). Resident and local traffic (Groups 1 and 2 combined: 37.37%) substantially outnumbers short- and long-stay through-traffic (Groups 3.1 and 3.2 combined: 3.79%). Group 4 (40.73%) represents the largest share of the sample, consisting of vehicles detected only by external cameras with trajectories that remain outside the LEZ boundary. Groups 5, 6, and 7 are excluded from this figure.
Figure 9.
Per-camera comparison of observed (blue) and simulated (orange) traffic intensities (veh/h) at 37 detector locations during the morning peak hour (09:00–10:00). The resulting percentage mean absolute relative error () is .
Figure 9.
Per-camera comparison of observed (blue) and simulated (orange) traffic intensities (veh/h) at 37 detector locations during the morning peak hour (09:00–10:00). The resulting percentage mean absolute relative error () is .
Figure 10.
Per-camera comparison of observed (blue) and simulated (orange) traffic intensities (veh/h) at 37 detector locations during the midday off-peak hour (12:00–13:00). The resulting percentage mean absolute relative error () is .
Figure 10.
Per-camera comparison of observed (blue) and simulated (orange) traffic intensities (veh/h) at 37 detector locations during the midday off-peak hour (12:00–13:00). The resulting percentage mean absolute relative error () is .
Figure 11.
Per-camera comparison of observed (blue) and simulated (orange) traffic intensities (veh/h) at 37 detector locations during the evening peak hour (18:00–19:00). The resulting percentage mean absolute relative error () is .
Figure 11.
Per-camera comparison of observed (blue) and simulated (orange) traffic intensities (veh/h) at 37 detector locations during the evening peak hour (18:00–19:00). The resulting percentage mean absolute relative error () is .
Figure 12.
Traffic intensity heatmaps for the baseline scenario: (1) morning peak hour (09:00–10:00); (2) local minimum (11:00–12:00); and (3) afternoon peak hour (17:00–18:00). Color scale: green (low intensity) to red (high intensity) on a logarithmic scale.
Figure 12.
Traffic intensity heatmaps for the baseline scenario: (1) morning peak hour (09:00–10:00); (2) local minimum (11:00–12:00); and (3) afternoon peak hour (17:00–18:00). Color scale: green (low intensity) to red (high intensity) on a logarithmic scale.
Figure 13.
Traffic occupancy heatmaps for the baseline scenario: (1) morning peak hour (09:00–10:00); (2) local minimum (11:00–12:00); and (3) afternoon peak hour (17:00–18:00). Color scale: green (low occupancy) to red (high occupancy) on a logarithmic scale.
Figure 13.
Traffic occupancy heatmaps for the baseline scenario: (1) morning peak hour (09:00–10:00); (2) local minimum (11:00–12:00); and (3) afternoon peak hour (17:00–18:00). Color scale: green (low occupancy) to red (high occupancy) on a logarithmic scale.
Table 1.
Classification and definition of mobility patterns for camera trajectory analysis.
Table 1.
Classification and definition of mobility patterns for camera trajectory analysis.
| Group | Pattern | Description |
|---|
| 1 | Interior | Local movement entirely within interior cameras; predominantly resident trips. |
| 2 | Int. → Ext. → Int. | Residents who leave the zone and subsequently return during the observation window (24 h). |
| 3.1 | Ext. → Int. → Ext., <2 h | Short-stay through-traffic or destination visits of less than 2 h. |
| 3.2 | Ext. → Int. → Ext., >2 h | Longer-stay visitors remaining in the zone for more than 2 h (e.g., workers, shoppers). |
| 4 | Exterior only | Vehicles detected only by exterior cameras; do not enter the LEZ (e.g., business park commuters). |
| 5 | Int. → Ext. | Outbound trips: vehicles departing the zone without a return are observed during the observation window. |
| 6 | Ext. → Int. | Inbound trips: vehicles entering the zone without a prior departure observed during the observation window. |
| 7 | Unclassified | Partial sequences due to overnight stays, camera gaps, or data quality issues. |
Table 2.
Mobility pattern classification results over the eight-day observation period (n = 470,344 vehicle records).
Table 2.
Mobility pattern classification results over the eight-day observation period (n = 470,344 vehicle records).
| Group | Pattern | Vehicles | % of Total |
|---|
| 1 | Interior | 156,319 | 33.24% |
| 2 | Interior → Exterior → Interior | 19,416 | 4.13% |
| 3.1 | Through-traffic (<2 h) | 4669 | 0.99% |
| 3.2 | Longer-stay visitors (>2 h) | 13,188 | 2.80% |
| 4 | Exterior only | 191,566 | 40.73% |
| 5 | Int. → Ext. | 20,693 | 4.40% |
| 6 | Ext. → Int. | 46,277 | 9.84% |
| 7 | Unclassified | 18,216 | 3.87% |
| | Total | 470,344 | 100% |
| Disclaimer/Publisher’s Note: The statements, opinions and data contained in all publications are solely those of the individual author(s) and contributor(s) and not of MDPI and/or the editor(s). MDPI and/or the editor(s) disclaim responsibility for any injury to people or property resulting from any ideas, methods, instructions or products referred to in the content. |




 ,
,