1. Introduction
Commercial Service Facilities systems (CSFs)—characterized by diverse functional types and strong relevance to residents’ daily activities—constitute a vital component of the public service system [
1]. The 14th Five-Year Plan for Public Services, jointly issued by the National Development and Reform Commission and other ministries, explicitly states that China’s public service system is transitioning from maximizing coverage to prioritizing quality and service excellence [
2]. In this context, one of the key challenges facing megacities is how to achieve precise assessment and refined planning of public service resources under complex spatial structures and increasingly diverse population needs. However, existing urban planning and public service evaluation frameworks often overlook the rapid renewal and spatial flexibility of CSFs, making them insufficient for capturing demand differences arising from more complex commuting patterns and heterogeneous population profiles at fine spatial scales. As a result, a significant mismatch frequently emerges between residents’ perceived service accessibility and the actual supply capacity of CSFs [
3,
4]. Therefore, developing a refined evaluation system capable of integrating the three-dimensional spatial morphology of CSFs, accurately simulating residents’ dynamic behaviors, and effectively revealing multi-scale supply–demand coupling relationships has become an urgent need for promoting the high-quality development of urban public services. Meanwhile, under the guidance of national policies, accurately identifying residents’ diverse needs, optimizing spatial configurations, and achieving precise supply–demand matching have increasingly become key directions for enhancing urban governance capacity and service equity [
5].
Facing this challenge, existing research has primarily focused on describing the status quo of supply and demand, as well as conducting large-scale matching analysis [
6]. On the supply side, research primarily focuses on measuring commercial service elements and identifying spatial structures. Previous studies suggest that commercial activities exhibit significant hierarchy and agglomeration within urban space, progressively forming a multi-level, functionally complementary commercial service system, which is also widely observed in Western retail systems [
7,
8,
9]. Building on this, research typically employs methods such as POI data and commercial center identification models to determine the hierarchical structure and spatial distribution of urban commercial centers, revealing the structural characteristics of municipal, district, and community-level commercial centers [
10,
11,
12]. In recent years, the integration of multi-source data has further expanded research perspectives from traditional supply-side analysis toward consumer behavior analysis. Through questionnaires, heat maps, mobile signaling data, and other multi-source datasets, researchers have identified the functional positioning, vitality levels, and population characteristics of commercial areas [
13,
14,
15]. These studies consistently find that CSFs display a clear polycentric spatial structure, while differences in center hierarchy lead to functional differentiation [
16]. Regarding spatial scale, supply-side studies have predominantly focused on the entire city or central urban areas, emphasizing the hierarchical evolution and functional distribution of commercial systems [
17,
18].
On the demand side, studies mainly draw on demographic data, commuting flows, and behavioral proxy variables to reveal residents’ service needs and spatial preferences using dynamic datasets. Early research relied largely on static population data. In recent years, with advances in big data technologies, commuting OD data, traffic flow, passenger flow, and information flow have been widely used to depict functional linkages and activity patterns within cities [
19,
20,
21]. Among these, commute data has become a key data type for measuring the strength of urban functional connectivity and residents’ service demand preferences, owing to its advantages in spatial coverage and behavioral directivity, which is consistent with recent international studies based on large-scale behavioral data [
22]. Methodologically, scholars often employ tools such as centroid shift analysis, flow maps, and network-based indicators to characterize urban spatial structures and population mobility. These approaches help uncover the spatial differentiation of residents’ needs and their relationships with urban functional zones.
To describe the state of supply–demand matching, scholars have developed a variety of quantitative evaluation models, while international studies have also emphasized the vulnerability and resilience of retail systems under shifting demand conditions [
6]. Some studies reconstruct demand distribution using mobility data (e.g., signaling data, travel trajectories) or treat behavioral frequency as a weighting factor to more accurately estimate residents’ demand responses to service facilities [
23]. Common approaches include accessibility models, shortest-path matching, and supply–demand ratio analysis, which qualitatively assess inequalities in service resource allocation across different areas. Other studies apply machine learning and data-driven methods to conduct pattern recognition and demand prediction based on multi-source datasets, introducing development coefficient models, the CRITIC model, dimension-unified regression analysis, and hierarchical coefficient models [
23,
24,
25,
26,
27]. Related research spans macro, meso, and micro scales. At the macro scale, studies emphasize the evolution of spatial structures in urban agglomerations and the mechanisms underlying polycentric development, highlighting regional network coordination and functional division of labor [
28,
29]. At the meso scale, research often focuses on the spatial distribution and optimization of service facilities within entire cities or core urban areas [
30,
31]. At the micro scale, studies concentrate on streets and various types of isochrone-based community life circles, examining the rationality of service resource allocation within residents’ daily activity ranges and the behavioral mechanisms shaping their responses [
32,
33,
34].
In summary, existing research in supply–demand coupling assessments faces several critical limitations. (1) On the supply side, most studies identify commercial centers using 2D spatial indicators, overlooking the 3D physical characteristics of buildings as service carriers. Consequently, the hierarchical structure of building volumes and their 3D service potential are insufficiently represented, making it difficult to capture the comprehensive supply capacity of CSFs. (2) On the demand side, analyses often rely on static demographic data or commuting distance parameters, neglecting behavioral heterogeneity across age groups and job-residence structures. Moreover, models of resident behavior rarely integrate actual road networks or dynamic traffic conditions, limiting their ability to reflect real accessibility and the nuanced route-choice mechanisms of diverse residents. Heavy reliance on traditional accessibility-based spatial methods further constrains the resolution of service attractiveness and behavioral decision modeling. Furthermore, many studies apply mathematical modeling approaches without fully considering their applicability to urban contexts or the potential for non-stationary processes. (3) Most analyses focus on large-scale regions or representative communities, making it difficult to capture dynamic interactions across scales and lacking multi-agent perspectives on matching patterns. Notably, service facility accessibility varies significantly at the community scale, and examining the supply–demand matching of commercial services from a micro-scale perspective has increasingly become essential for functional optimization [
32]. This calls for the integration of more refined analytical scales and the development of a spatial–temporal process estimation scheme.
In response to the growing demand for precision urban governance, this study moves beyond the unilateral assessment of commercial quantity to propose a new “form–flow” integrated framework for evaluating supply–demand matching in megacities. The core of this framework lies in transitioning from static, linear estimations to a multi-dimensional process description of hierarchical capacity and dynamic performance network. In terms of the supply hierarchy, we redefine the measurement of CSFs from a planar density perspective to a 3D structural perspective. By introducing the Building Coupling Entropy (BCE) model—incorporating building footprint, height, and functional adjustment coefficients—we establish a capacity-potential logic. This allows for a more accurate representation of the physical supply capacity and its spatial complexity within high-density environments. In terms of the spatial interaction process, this study integrates a “flowing space” perspective to capture the dynamic temporal characteristics of resident demand. By incorporating actual road networks and multi-group commuting behaviors, we construct a performance relationship network. This approach enables the detection of spatiotemporal non-stationary phenomena—such as behavioral shifts following major social events—that are often obscured by global constants in traditional static models. Consequently, by analyzing 163 sub-districts in Guangzhou, this framework provides a research paradigm for the multi-scale evolution of urban services. It effectively bridges the gap between “fixed physical form” and “dynamic service demand,” offering a scientific foundation for identifying spatial mismatch targets and implementing elastic management strategies.
2. Data and Methods
2.1. Study Area and Data
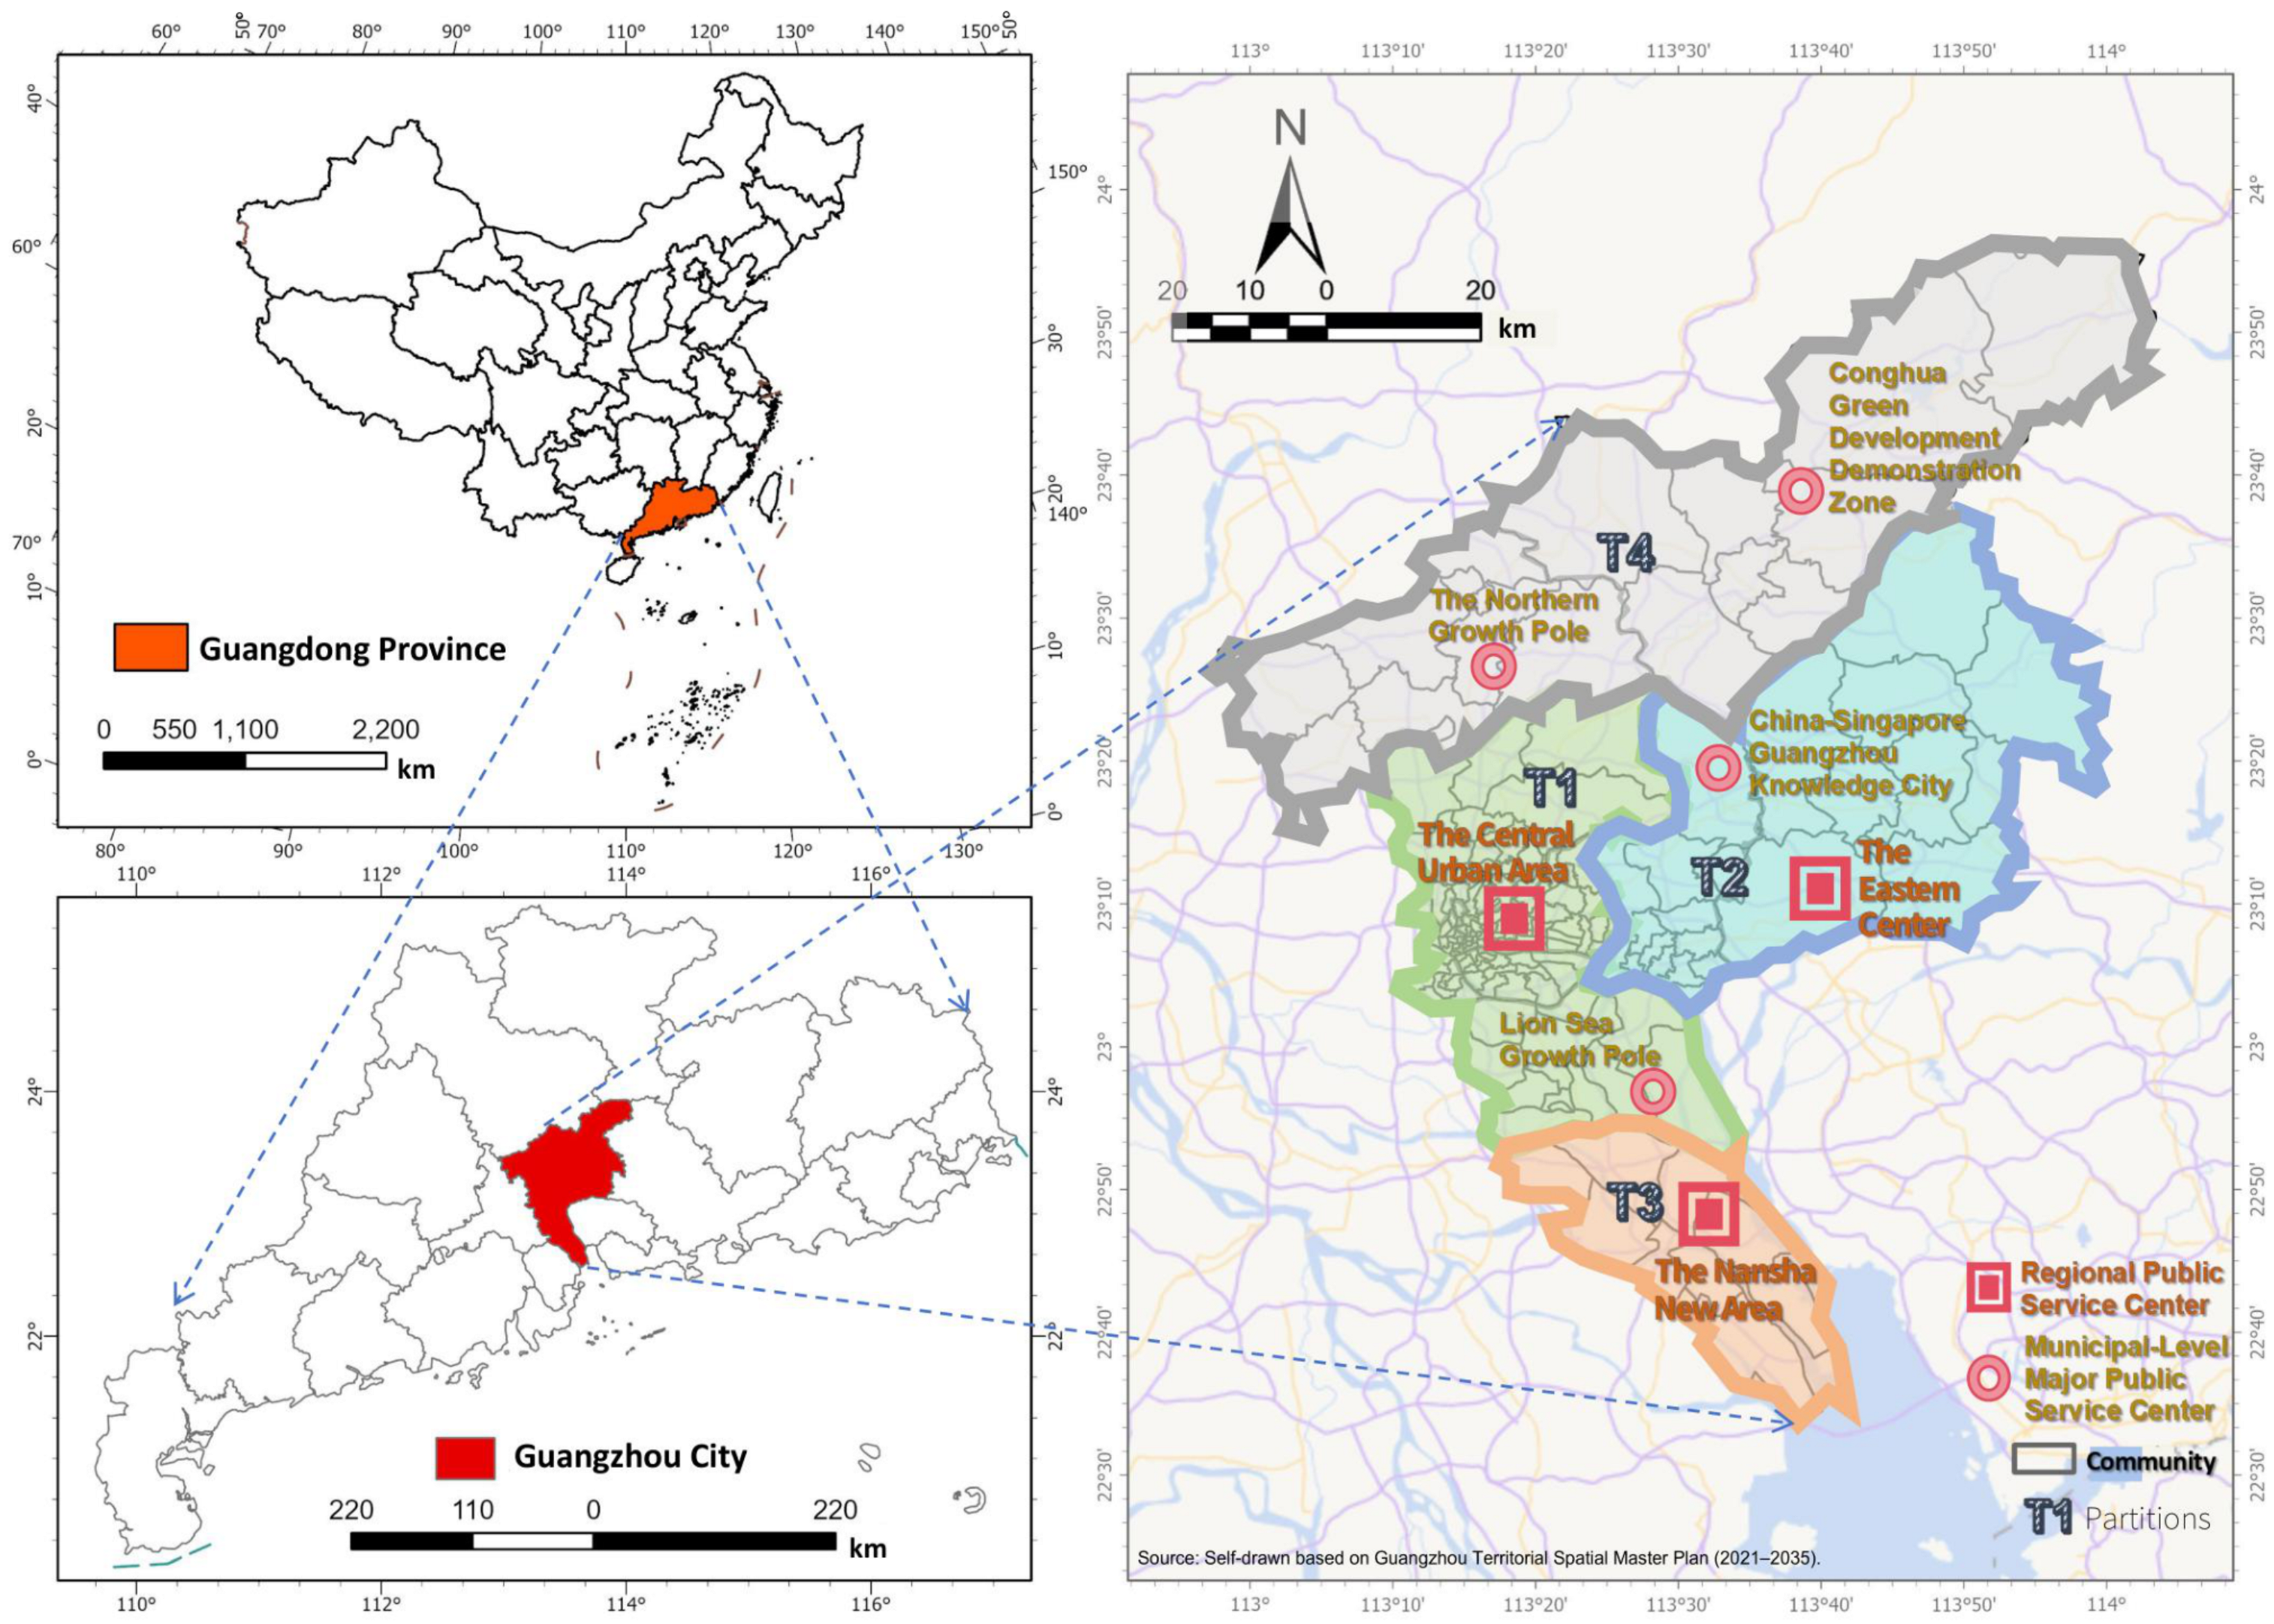
As a national central city and a core node of the Guangdong–Hong Kong–Macao Greater Bay Area, Guangzhou is characterized by a highly concentrated population, intensive industrial clusters, and rapid spatial expansion (
Figure 1) [
35]. These features give rise to significant structural tensions and spatial heterogeneity in the matching between service facility supply and commuting-based demand. In the context of an evolving polycentric urban structure and ongoing regional integration, Guangzhou exhibits complex building-scale characteristics, diverse daily activity patterns, and heterogeneous community needs—conditions well suited for constructing a multi-scale, multi-agent coupling analysis framework.
In alignment with the spatial framework defined in the Guangzhou Territorial Spatial Master Plan (2021–2035) and the functional roles of administrative divisions, this study covers all 11 administrative districts of Guangzhou, encompassing a total of 163 sub-districts and towns.
The Urban Core (T1) includes Liwan, Yuexiu, Haizhu, Baiyun, Tianhe, and Panyu districts, totaling 106 sub-districts. This zone comprises both highly mature, function-dense central blocks—such as Shipai in Tianhe and Beijing Road in Yuexiu—and secondary centers like Shiqiao in Panyu, which absorb population overflow from the core.
The Eastern Center (T2) covers Huangpu and Zengcheng districts, with 28 sub-districts. As the heart of the “Guangzhou Eastward Expansion” strategy, this area exhibits prominent industry–city integration, featuring high-tech clusters like Luogang in Huangpu and vital transit hubs and residential clusters like Xintang in Zengcheng.
Nansha New Area (T3) encompasses the entire Nansha District (9 sub-districts). Serving as a demonstration zone for comprehensive cooperation within the Guangdong–Hong Kong–Macao Greater Bay Area, its spatial development is characterized by distinct cluster-based expansion and policy-driven growth.
The Northern Growth Pole (T4) includes Huadu and Conghua districts, totaling 20 sub-districts. This region functions as an ecological barrier and a gateway hub, containing mature residential areas like Xinhua in Huadu and ecological functional towns like Liangkou in Conghua.
This study integrates multi-source data collected within the Guangzhou metropolitan area, specifically utilizing nine categories of Points of Interest (POIs) for CSFs scraped in 2019 and 2023, 3D building profile data (including building vector outlines and building height data), Origin–Destination (OD) commute data for specific working and non-working days, population diversity structure data, and urban road network data. These datasets were sourced from the Amap API (
https://lbs.amap.com/), Baidu Maps
https://map.baidu.com/), official district-level Guangzhou Seventh National Population Census Bulletins, and the OpenStreetMap (OSM) website (
https://www.openstreetmap.org/). The administrative division data was obtained from the National Geographic Information Center.
The selection of 2019 and 2023 as the study periods is strategically designed to capture the structural evolution of Guangzhou’s CSFs across the pre- and post-pandemic eras. The year 2019 serves as a stable baseline representing traditional urban service patterns before the global health crisis. Conversely, 2023 marks the first full year of comprehensive recovery and the establishment of a ‘New Normal’ in resident behavior, characterized by shifts in commuting frequency and a heightened reliance on localized community services. By comparing these two distinct temporal nodes, the model can effectively capture ‘spatiotemporal non-stationary phenomena’—behavioral shifts that are often obscured by short-term anomalies but reflect long-term structural resilience and path dependency in megacities. This longitudinal approach allows for a controlled observation of how the urban service system adapted to major social shocks while maintaining its functional core.
2.2. Research Design
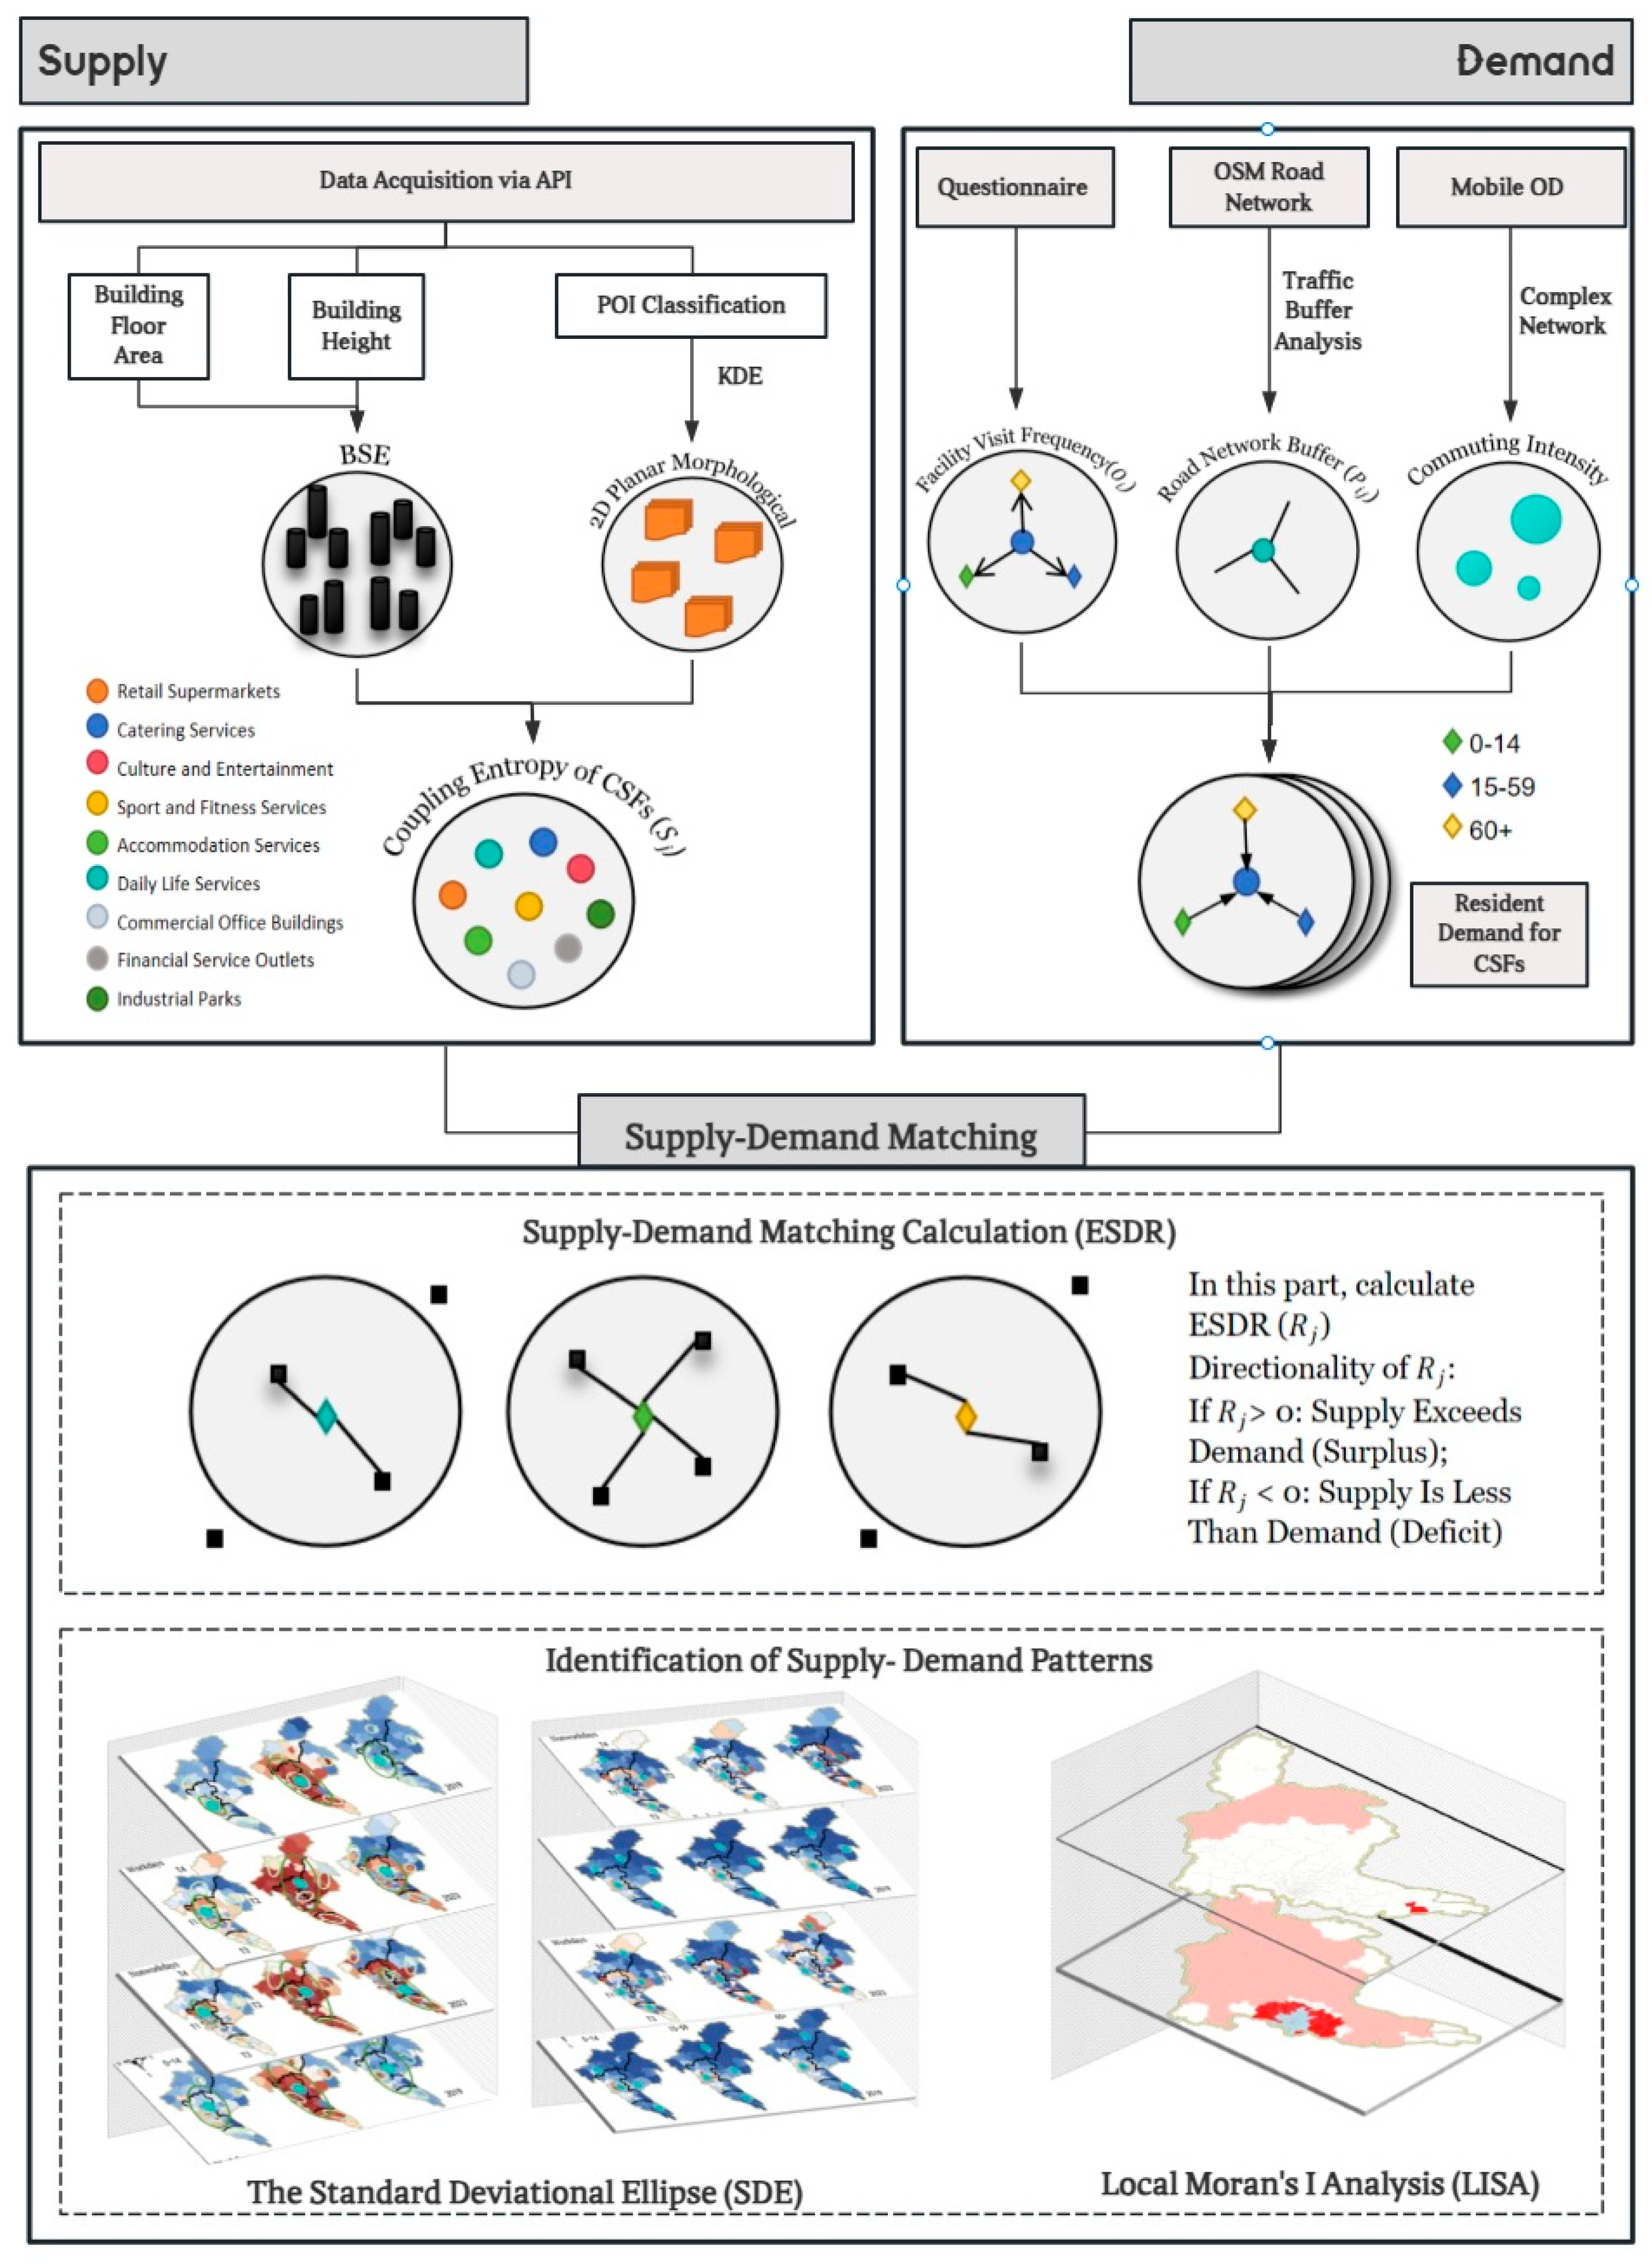
This study establishes a refined analytical framework based on the Supply–Demand–Matching logic (
Figure 2). On the supply side, by integrating 3D building data with 2D kernel density, a Building Coupling Entropy (BCE) model is constructed through the weighting of scale entropy and morphological entropy to characterize the spatial volume and morphological complexity of facilities. On the demand side, a community-scale spatial demand measurement model for commercial and service facilities system is developed by synthesizing behavioral variables, including travel networks, transportation accessibility, and frequency of visits. For the supply–demand matching phase, Entropy-modified Spatial Disparity Ratio (ESDR) model is employed to identify supply–demand deviations. Combined with the Gini coefficient, Standard Deviational Ellipse (SDE), and Local Indicators of Spatial Association (LISA), the logic of resource mismatch and its response mechanisms are revealed from the dual dimensions of spatial distribution patterns and social equity.
2.3. Precise Measurement of CSFs Spatial Supply Capacity Based on 3D Entities
2.3.1. Data Selection and Cleaning
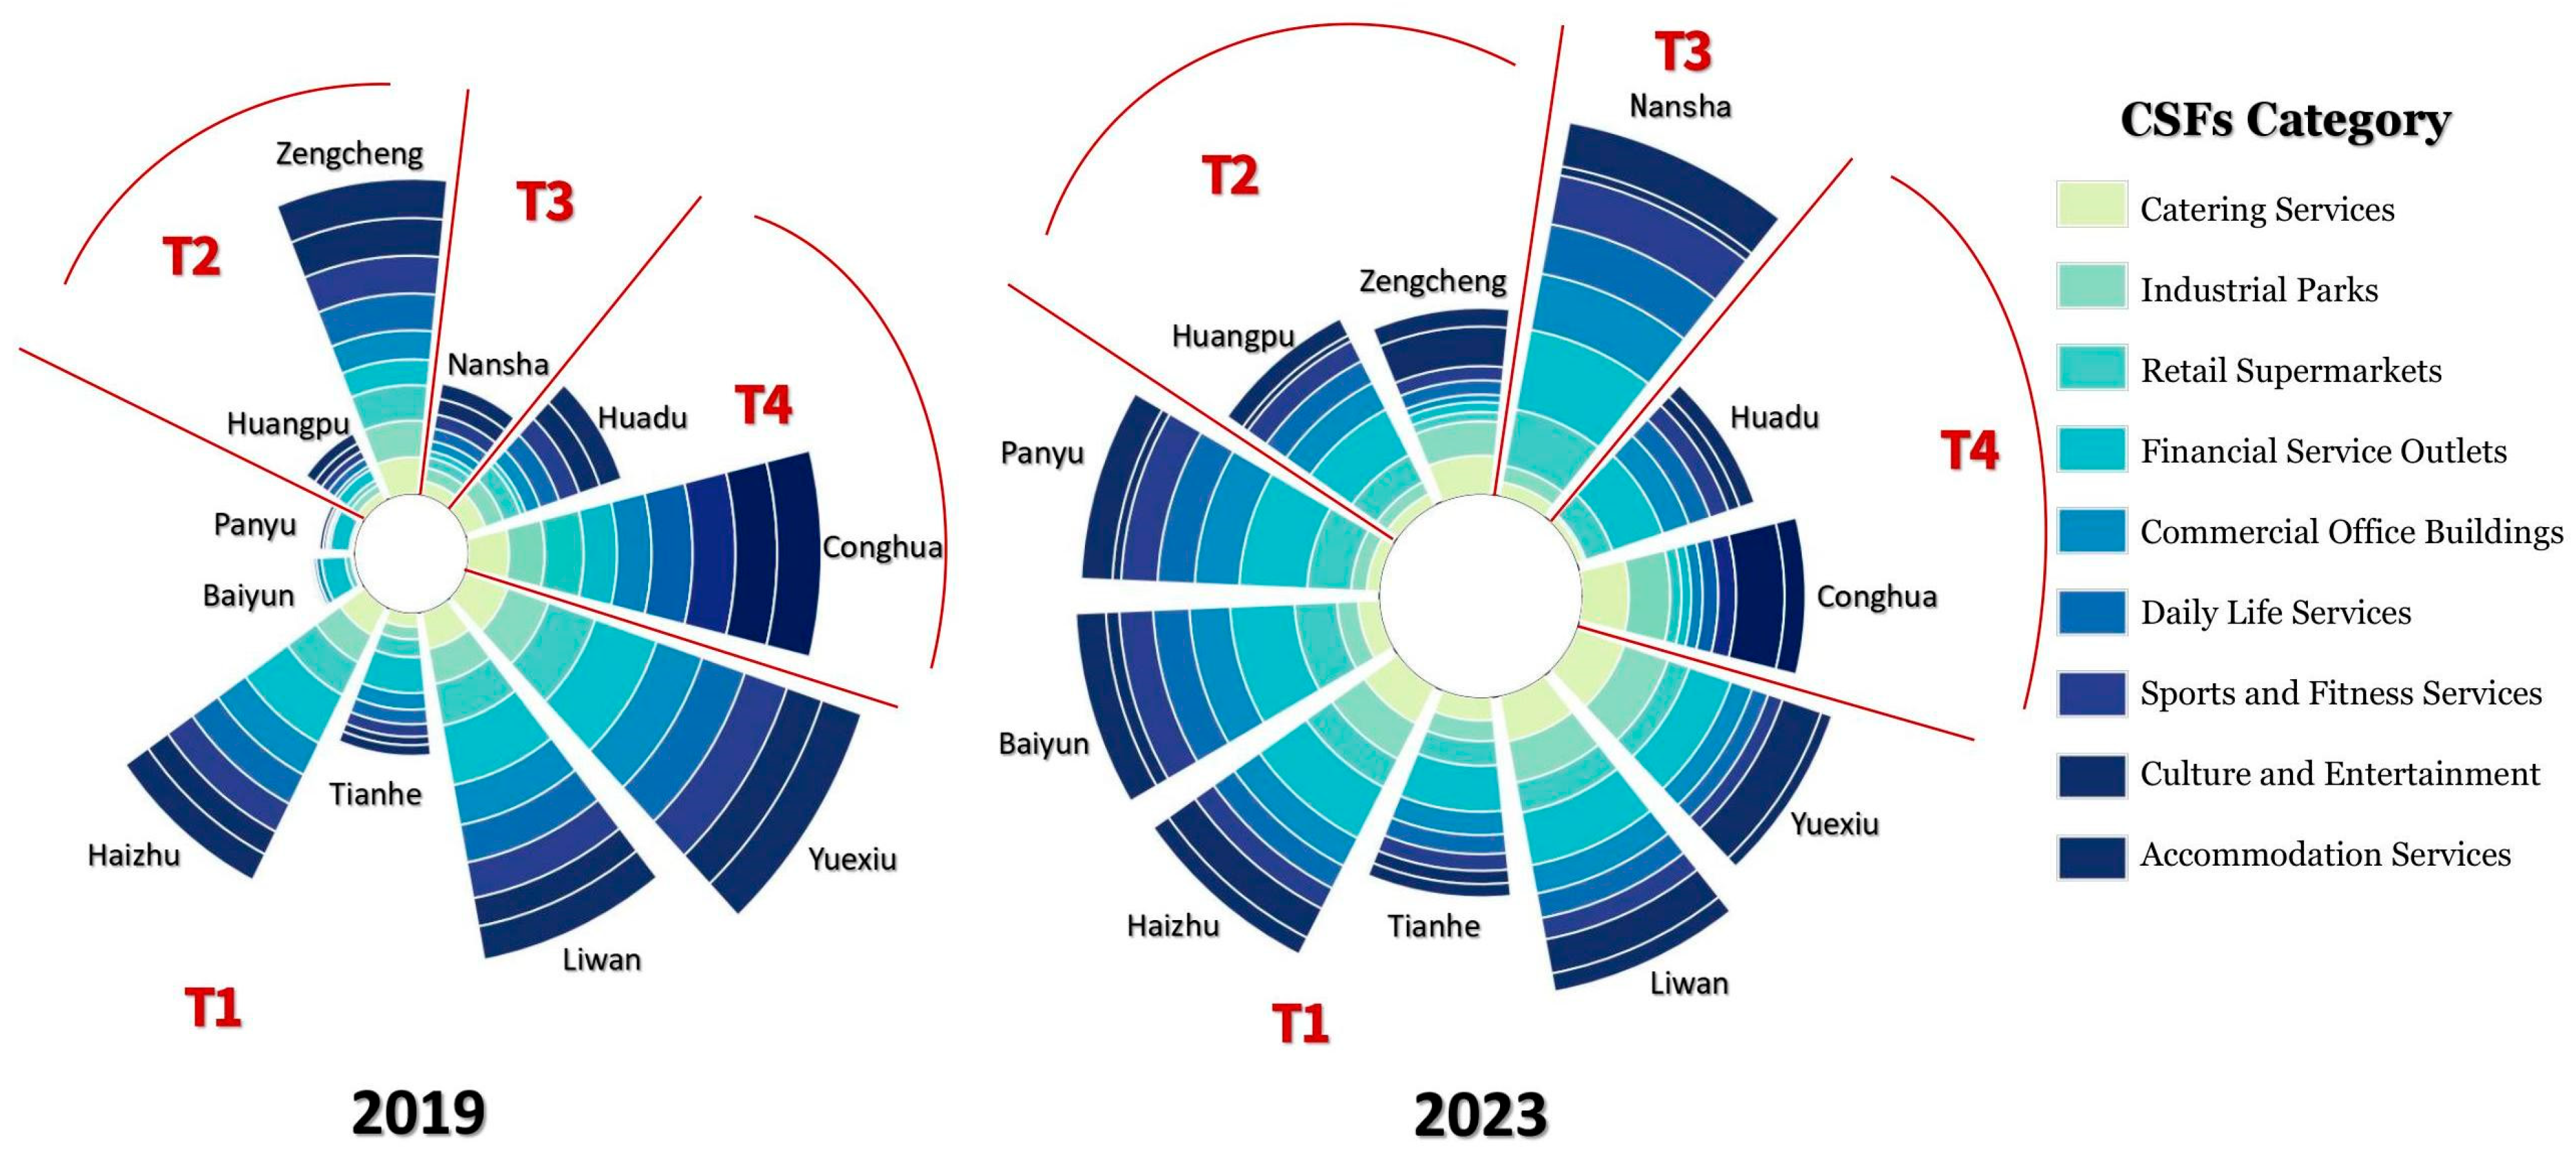
This study selects CSFs as the primary analysis objects. After classification and identification against the partitioned 3D building profile data, and subsequent invalid point removal, a total of 462,012 POI points were retained for 2019, and 648,895 POI points for 2023.
Subsequently, following the framework of the National Economic Industry Classification (GB/T 4754—2017) [
36], and also based on the current planning standards, including the Planning Standards for Urban Public Service Facilities (GB50442) [
37] and the Classification of Retail Formats (GB/T18106-2021) [
38], nine core categories of CSFs were selected and reclassified: Catering Services, Retail Supermarkets, Industrial Parks, Commercial Office Buildings, Financial Service Outlets, Daily Life Services, Culture and Entertainment, Sports and Fitness Services, and Accommodation Services.
The selection of these nine categories aims to transcend the limitations of traditional public center studies, which often focus solely on residential supporting services. Instead, this research shifts its focus to the comprehensive supply of production and daily life service elements carried by CSFs, thereby providing a more holistic reflection of the complex functions and economic value of contemporary urban public centers.
Specifically, these categories not only represent the capacity of urban public centers to satisfy residents’ demands for consumption, leisure, health, and daily support, forming the basis of CSFs’ daily life service function, but also crucially introduce production supporting facilities that represent modern economic activities and are intensive in knowledge and technology elements, namely Industrial Parks, Commercial Office Buildings, and Financial Service Outlets. These facilities embody high-end CSFs, carrying the core functions of industrial agglomeration, high-end producer services, and capital allocation, respectively.
2.3.2. Calculation of 3D-BCE
Based on Guangzhou’s 3D building data, this study extracts the core structural characteristics of various facilities at the building entity level, including building floor area and building height, to construct the scale dimension of service facilities. Concurrently, the KDE method is used to capture the degree of facility distribution and aggregation in planar space, extracting information for the morphological dimension. The building scale entropy () and building morphological entropy () are calculated separately to characterize the spatial complexity of the facilities across dual dimensions: volume (scale) and form (morphology).
Subsequently, the Information Entropy theory is introduced to construct the BCE model. This model integrates and uses a weighted normalization function, reflecting the coupling coordination level of the supply system at the building entity layer.
The formula for
is as follows:
where
represents the comprehensive service capacity value of the
-th building, calculated as
. In this formula,
denotes the building footprint area,
signifies the building height, and
is the functional adjustment coefficient of the building. To ensure the rigor of the supply capacity measurement,
is utilized as a calibration weight based on the specific category of the POI and the primary land-use type. This coefficient addresses the vertical distribution heterogeneity of services within high-rise structures, ensuring that the volume
reflects the effective service potential contributed by the facility rather than a simple aggregation of raw physical volume.
The formula for
is as follows:
where
is the KDE value of the POI at the
-th location; and
is the total number of partitioned regions in the study area.
The formula for BCE (
) is as follows:
This formula not only comprehensively reflects the joint effect of the two indicators but also strengthens the sensitivity to their coordination level by introducing a difference constraint term. This ensures a high response of the model to the differentiation in building entity supply capacity. To ensure mathematical interpretability and facilitate cross-regional comparison, the calculated results are normalized using a Min-Max scaling method, constraining the BCE index within a closed interval of [0, 1]. A higher coupling entropy value indicates that the spatial volume and configuration of the building entities in that area are more matched and coordinated, implying a stronger public service potential.
2.4. Modeling the Spatial Demand of CSFs Based on Community Resident Behavior
2.4.1. Behavioral Model of Community Resident Visits
In the spatial context of megacities, which is dominated by residents’ daily activities, the spatial demand of community residents for CSFs exhibits significant dynamism, structural complexity, and population heterogeneity.
To more accurately characterize the spatial demand features from the resident perspective, this study introduces community-scale complex commuting network modeling, traffic accessibility potential estimation, and an improved Huff model based on behavioral feedback. These elements are comprehensively integrated to construct the spatial demand measurement model for CSFs based on community residents. This approach systematically fuses the structural role of community nodes within the commuting network, actual traffic accessibility constraints, and resident behavioral preference feedback. Under the joint influence of multi-dimensional spatial and behavioral factors, it precisely characterizes residents’ comprehensive demand intensity for CSFs at the micro scale.
- (1)
Measurement of Travel Intensity
The Origin–Destination (OD) data for this study were derived from cellular signaling data covering the entirety of Guangdong Province. To ensure a high-resolution comparative analysis, representative weekdays from the same periods in 2019 and 2023 were selected, as these dates represent the peak intervals of urban population mobility.
The raw dataset, reaching the Terabyte scale, was processed using Python 3.12 scripts to extract records exclusively within Guangzhou’s administrative boundaries. Residents’ locations were identified based on temporal stay thresholds: the “Home” location was defined as the administrative district with the longest cumulative stay between 23:00 and 07:00, while the “Work” location was identified between 09:00 and 18:00. This logic effectively isolates stable commuting flows from transient social activities.
Using ArcGIS, the WGS-84 coordinates were batch-processed through Spatial Join and Point in Polygon operations to map individual points to the vector boundaries of Guangzhou’s 163 sub-districts (streets/towns). The resulting trajectories were aggregated into a community-scale commuting flow matrix, comprising over 40,000 “street-pair” records for each year.
Complex networks possess distinct spatial topological characteristics, with small-world and scale-free networks being the most representative types [
39]. The urban commuting system functions as a quintessential human–environment coupled complex network, whose structural features effectively reflect spatial phenomena such as job–housing separation, polycentric organization, and the aggregation of commuting flows.
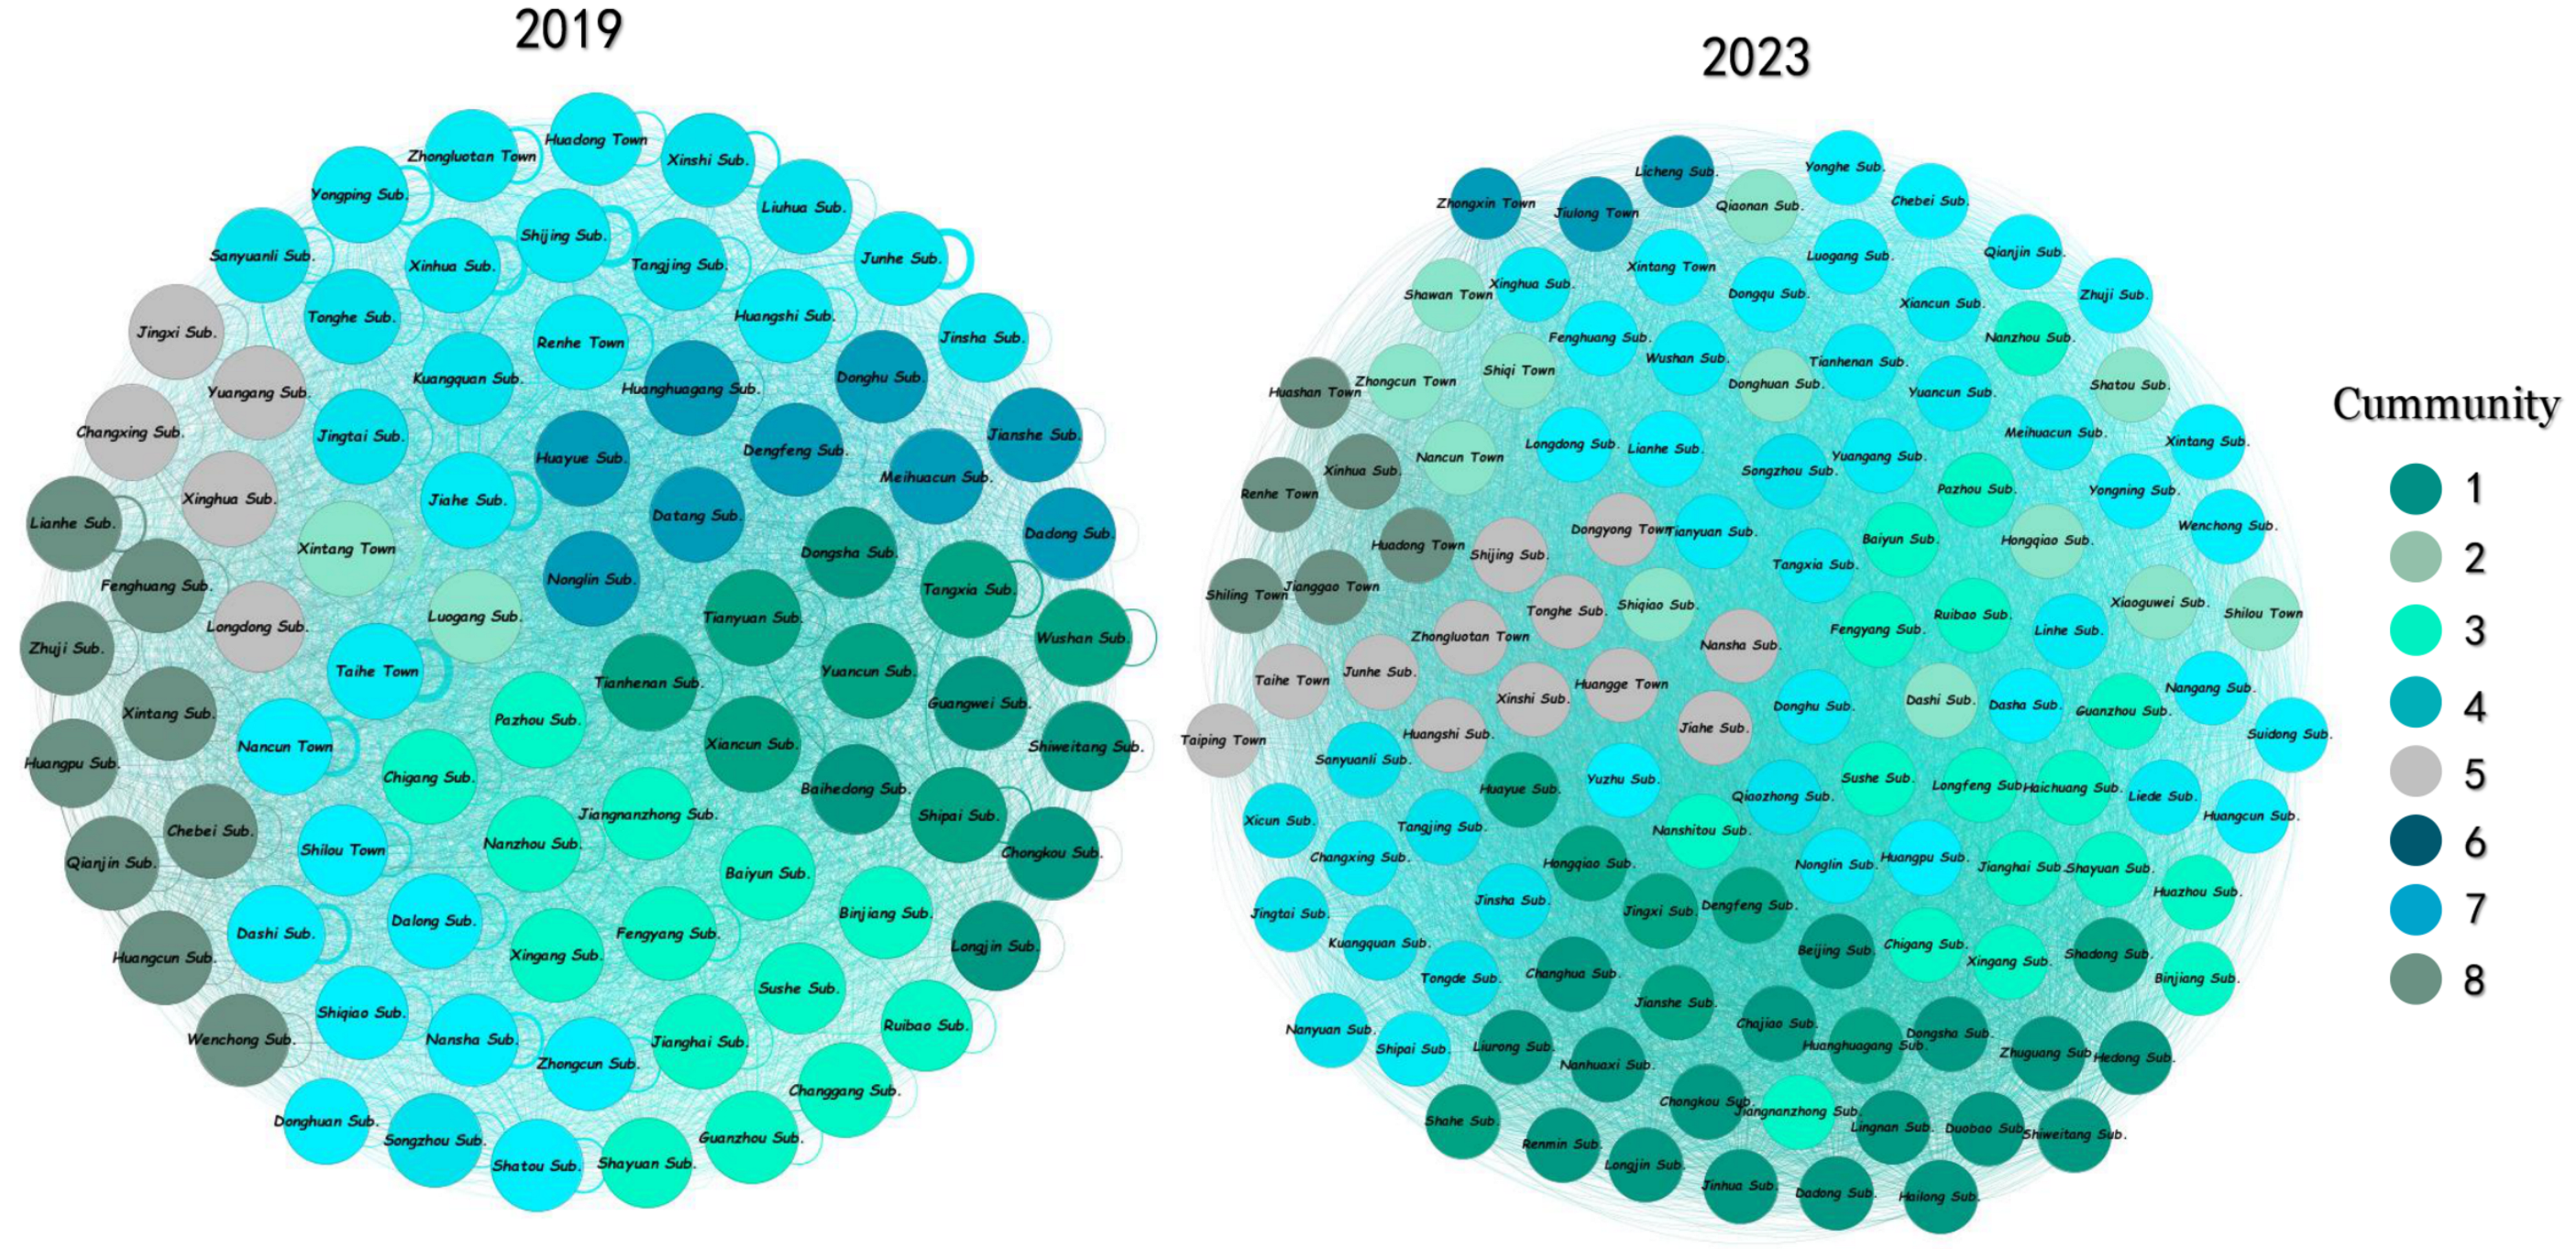
The urban commuting system is treated as a quintessential human–environment coupled complex network, where community units serve as nodes and commuting flows constitute the edges. Within this network, network centrality measures—including degree centrality, closeness centrality, and betweenness centrality—are utilized to characterize the strength of inter-community linkages and their hierarchical status within the polycentric framework. Degree centrality reflects the local interaction capacity of a cluster; closeness centrality measures the ease of connection between a cluster and all others in the network; and betweenness centrality represents the cluster’s control over the overall flow across the entire network (
Figure 3) [
40].
The formulas are as follows:
represents the degree centrality of cluster ; and represent the in-degree and out-degree, respectively; denotes the number of nodes connected to cluster i; indicates the volume of inward and outward linkages between nodes and . is the shortest path distance between clusters and ; represents the total number of linkages between clusters and ; is the number of linkages between clusters and that pass through cluster .
To further enhance measurement precision, this study introduces transportation accessibility as a constraint factor to calibrate the raw travel intensity extracted from the complex network. Traditional models often overlook the integrated impact of transportation network conditions, road service capacities, and population heterogeneity in megacities. Existing research indicates that consumers exhibit lower sensitivity toward long-distance travel [
41]. Therefore, this study utilizes OSM road data and establishes a comprehensive index based on road hierarchy to represent differences in service capacity. Combined with road radiation density and average influence width, a linear buffer model tailored to different road grades is constructed.
By merging road buffers of various levels in ArcGIS Pro 3.0.2, the Transportation Accessibility Coverage () index is derived. This index serves as a constraint coefficient to adjust commuting intensity: a coverage rate closer to 1 indicates a denser community transportation network, which more effectively supports and stimulates residents’ travel responses to surrounding CSFs. Conversely, a lower rate exerts an inhibitory effect on potential travel intensity. Through this integration of structural features and spatial constraints, this study constructs a travel intensity measurement model that more accurately reflects real-world spatial interactions.
- (2)
Measurement of Visit Frequency
In this study, a behavior-oriented facility demand weight matrix is constructed based on resident visit frequencies and integrated into the supply–demand matching model. It should be noted that the visit frequency measured in this section is not strictly equivalent to the actual demand; rather, it serves as an observable variable of behavioral preferences, reflecting the relative response of different demographic groups to various facilities during commuting or daily travel.
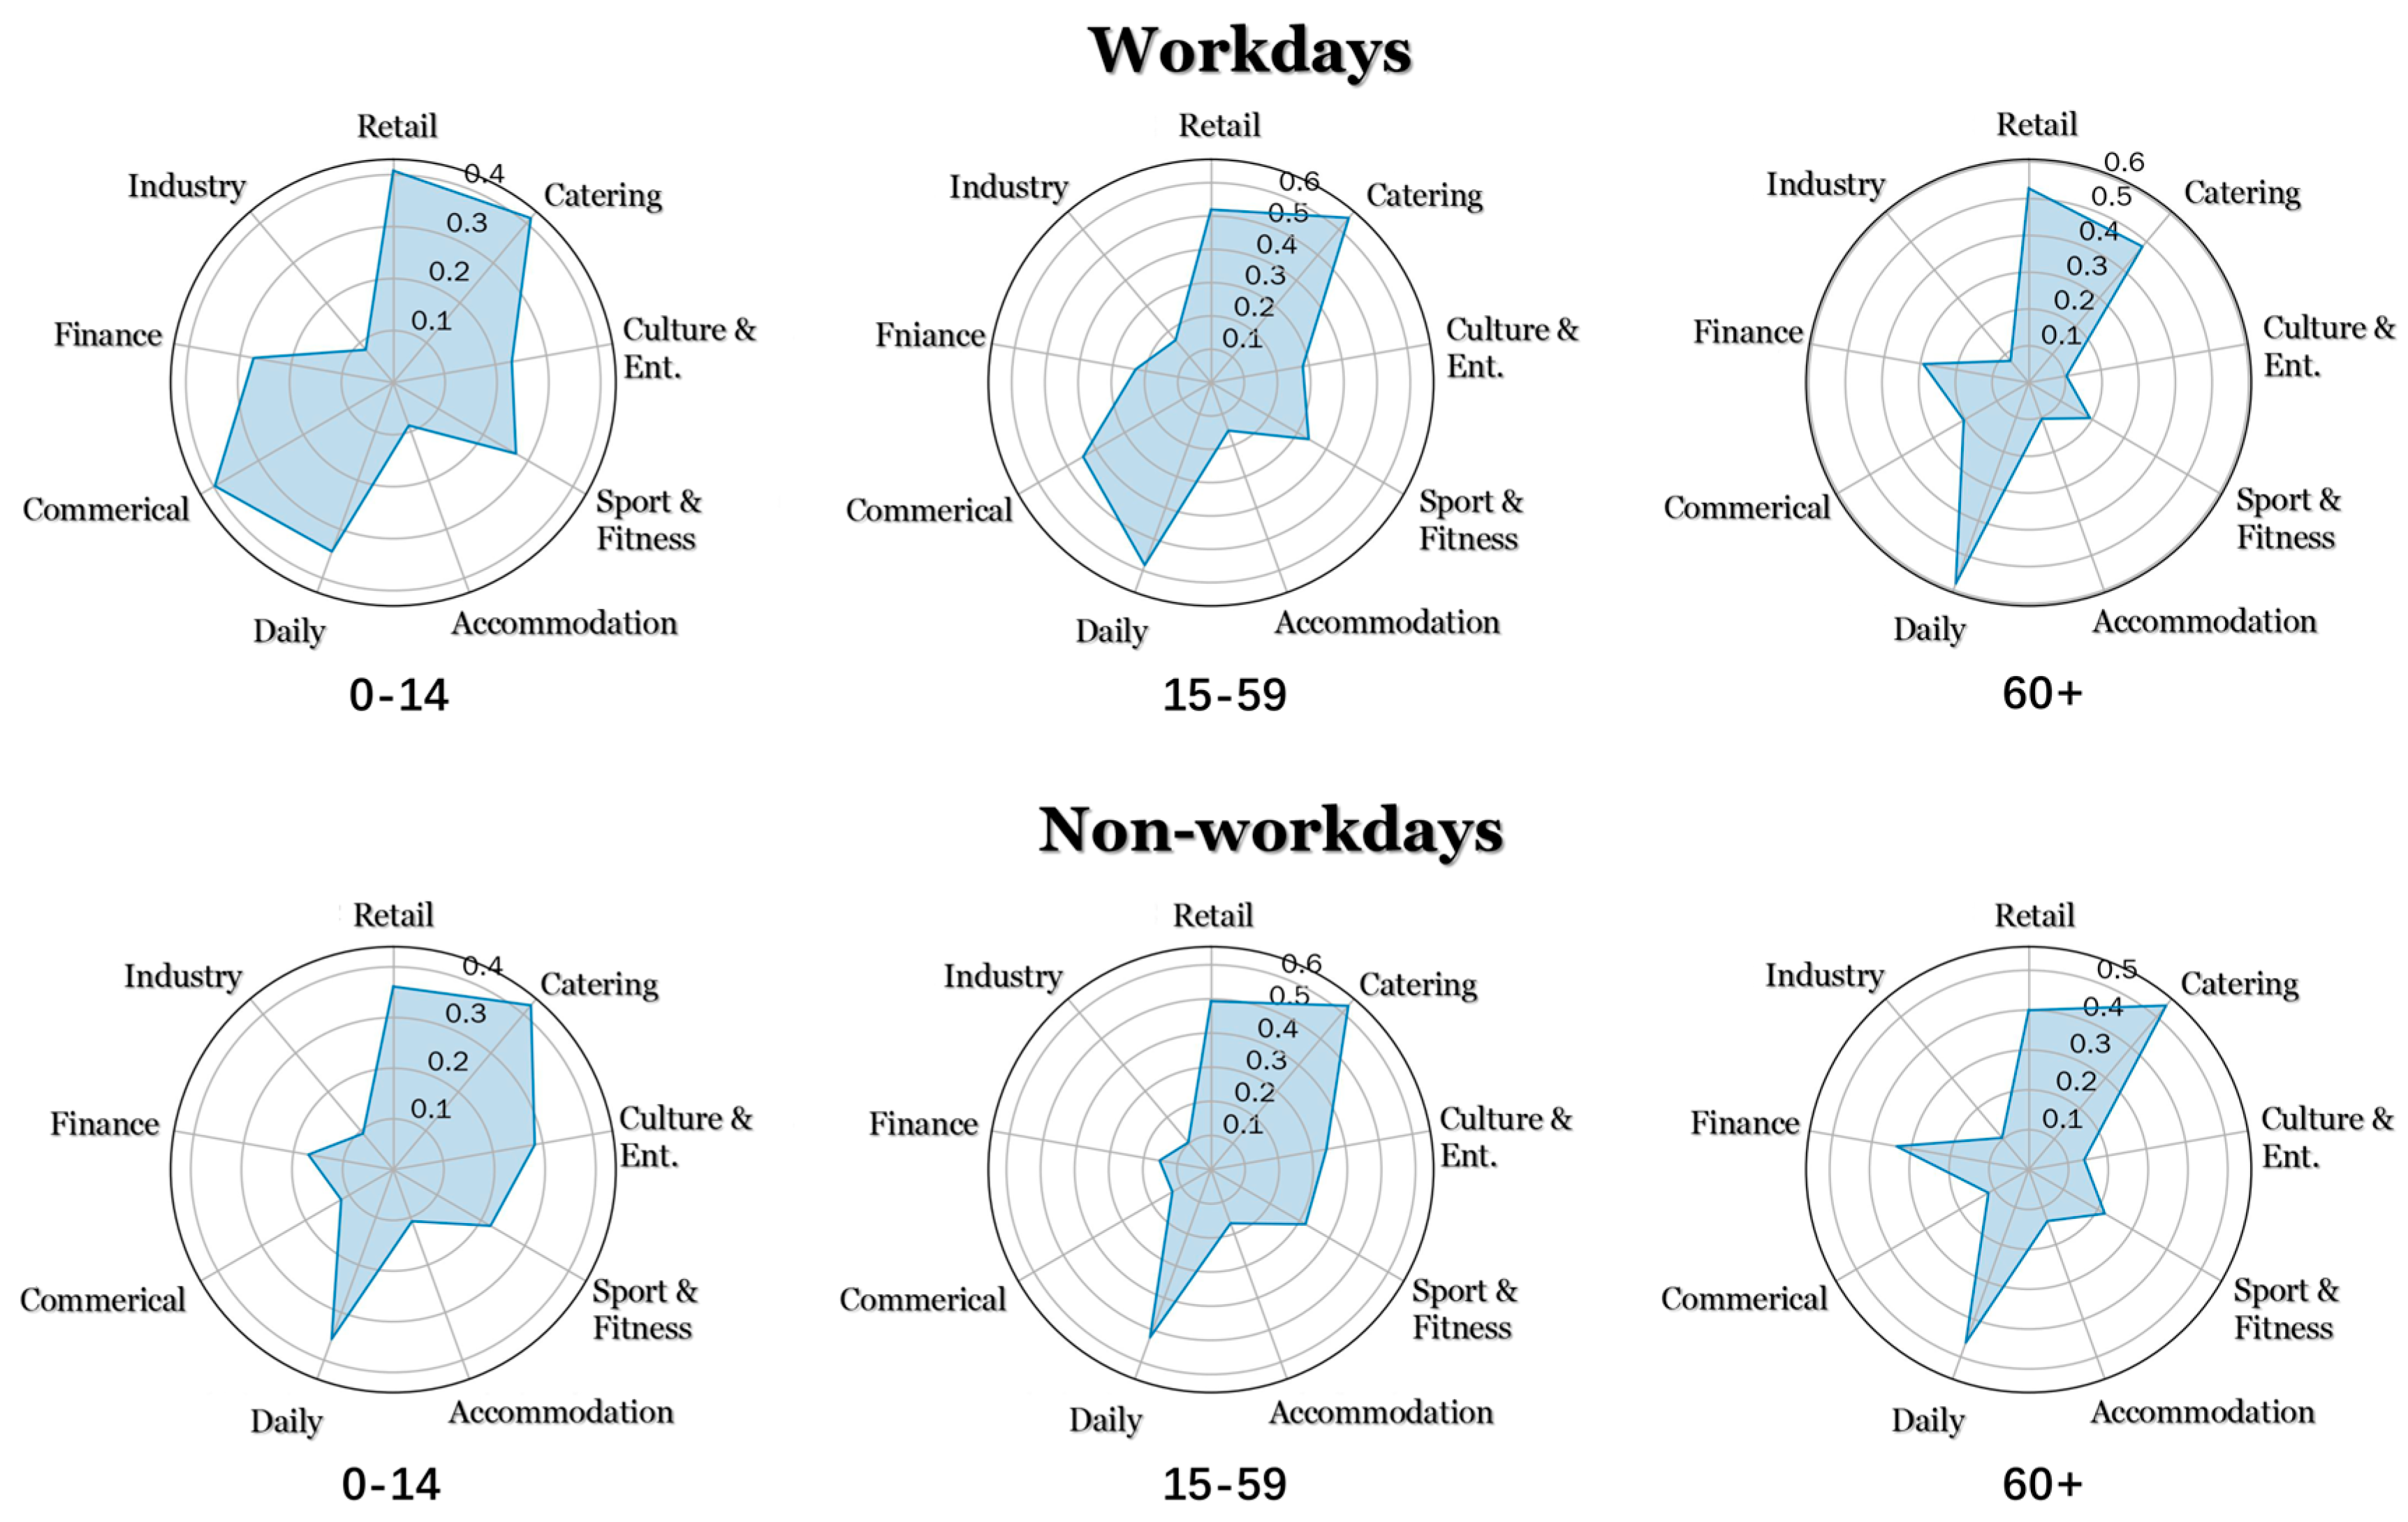
The visit frequencies are derived from questionnaire data, which record the visitation patterns of residents across different facility categories—standardized for this study—during both workdays and non-workdays. The frequency is categorized into six levels and assigned numerical values to construct a behavioral response matrix. To eliminate the influence of sample size variations across different groups and to highlight the internal preference structure of each group, the matrix is normalized. After normalization, the sum of response weights for each population group across all facility categories equals 1. These normalized frequencies represent the relative visitation propensity of different groups toward specific CSFs.
2.4.2. Calculation of Demand Based on Visit Behavior and Accessibility Calibration
Integrating the elements described above, the improved Huff model constructed in this study no longer relies solely on distance or static population density. Instead, it estimates the weighted demand response intensity of community-scale residents for different service facilities, centered on a weighted selection response mechanism jointly driven by accessibility, population characteristics, and facility capacity. Specifically, the demand side incorporates three categories of population characteristics (as proxy variables for heterogeneity). On the supply side, the BCE () is utilized to measure the facility’s scale, morphology, and functional density, thereby quantifying the service capacity. By integrating these elements, the improved model employs accessibility, population characteristics, and facility capacity to collectively drive the resident selection probability, thus more genuinely characterizing the service demand response at the community scale.
The formula is as follows:
The traffic accessibility factor, denoted by , is calculated from the traffic buffer analysis, replacing the traditional distance decay function. The denominator of the core probability fraction, , represents the total attractiveness of all facilities to the residents at origin . The core output, , measures the probability that the Mn-th population group at origin selects facility j. To capture behavioral heterogeneity, the model introduces , which denotes the population share of the -th group; this study specifically divides the population into 0–14 years, 15–59 years, and 60+ years. , collected via questionnaire survey, reflects the actual resident choice probability for various facilities. , derived from network analysis, quantifies the functional importance of the origin in the urban commuting system, often used to refine the demand calculation.
2.5. Evaluation of Supply–Demand Matching and Pattern Recognition for Community-Scale CSFs
2.5.1. Precise Evaluation
To quantify the coordination relationship between CSFs supply capacity and resident demand in Guangzhou, and to identify various development patterns, this study employs the Entropy-modified Spatial Disparity Ratio (ESDR) model, which is an adaptation based on the local Gini coefficient. This model is utilized to isolate the surplus component from the raw supply–demand ratio, which is then used to mark the direction of spatial distribution imbalance. This process enables the identification of local spatial supply–demand coupling deviations. Furthermore, to evaluate the spatial equity of CSFs allocation, the Gini Coefficient is used to quantify the disparities in the actual service accessibility obtained by community residents.
The specific calculation methods are as follows:
represents the Local Gini Coefficient for the i-th unit. It is used to reflect the degree of imbalance in supply and demand levels among adjacent units. and represent the supply and demand index for the -th unit. The magnitude and sign of the ESDR value provide a direct measure of the supply–demand status: a value greater than zero signifies a condition where supply exceeds demand; a value equal to zero indicates perfect balance; and a scenario where demand exceeds supply.
2.5.2. Pattern Recognition
The final analysis step calculates the Comprehensive Accessibility Index (
) for each age group, which represents their overall supply–demand matching level across all facility categories. This index serves as the output of the second layer of weighting. This yields the Comprehensive Accessibility Index for location i. The study further identifies the characteristics of the CSFs spatial supply–demand relationship based on community resident behavioral preferences. To provide supplementary interpretation and validation of the model’s output, two key dimensions are examined: spatial distribution pattern and spatial equity.
quantifies the local supply–demand status (e.g., surplus or deficit) for a specific facility type, . reflects the subjective importance of that facility type to the specific population group based on their visit frequency.
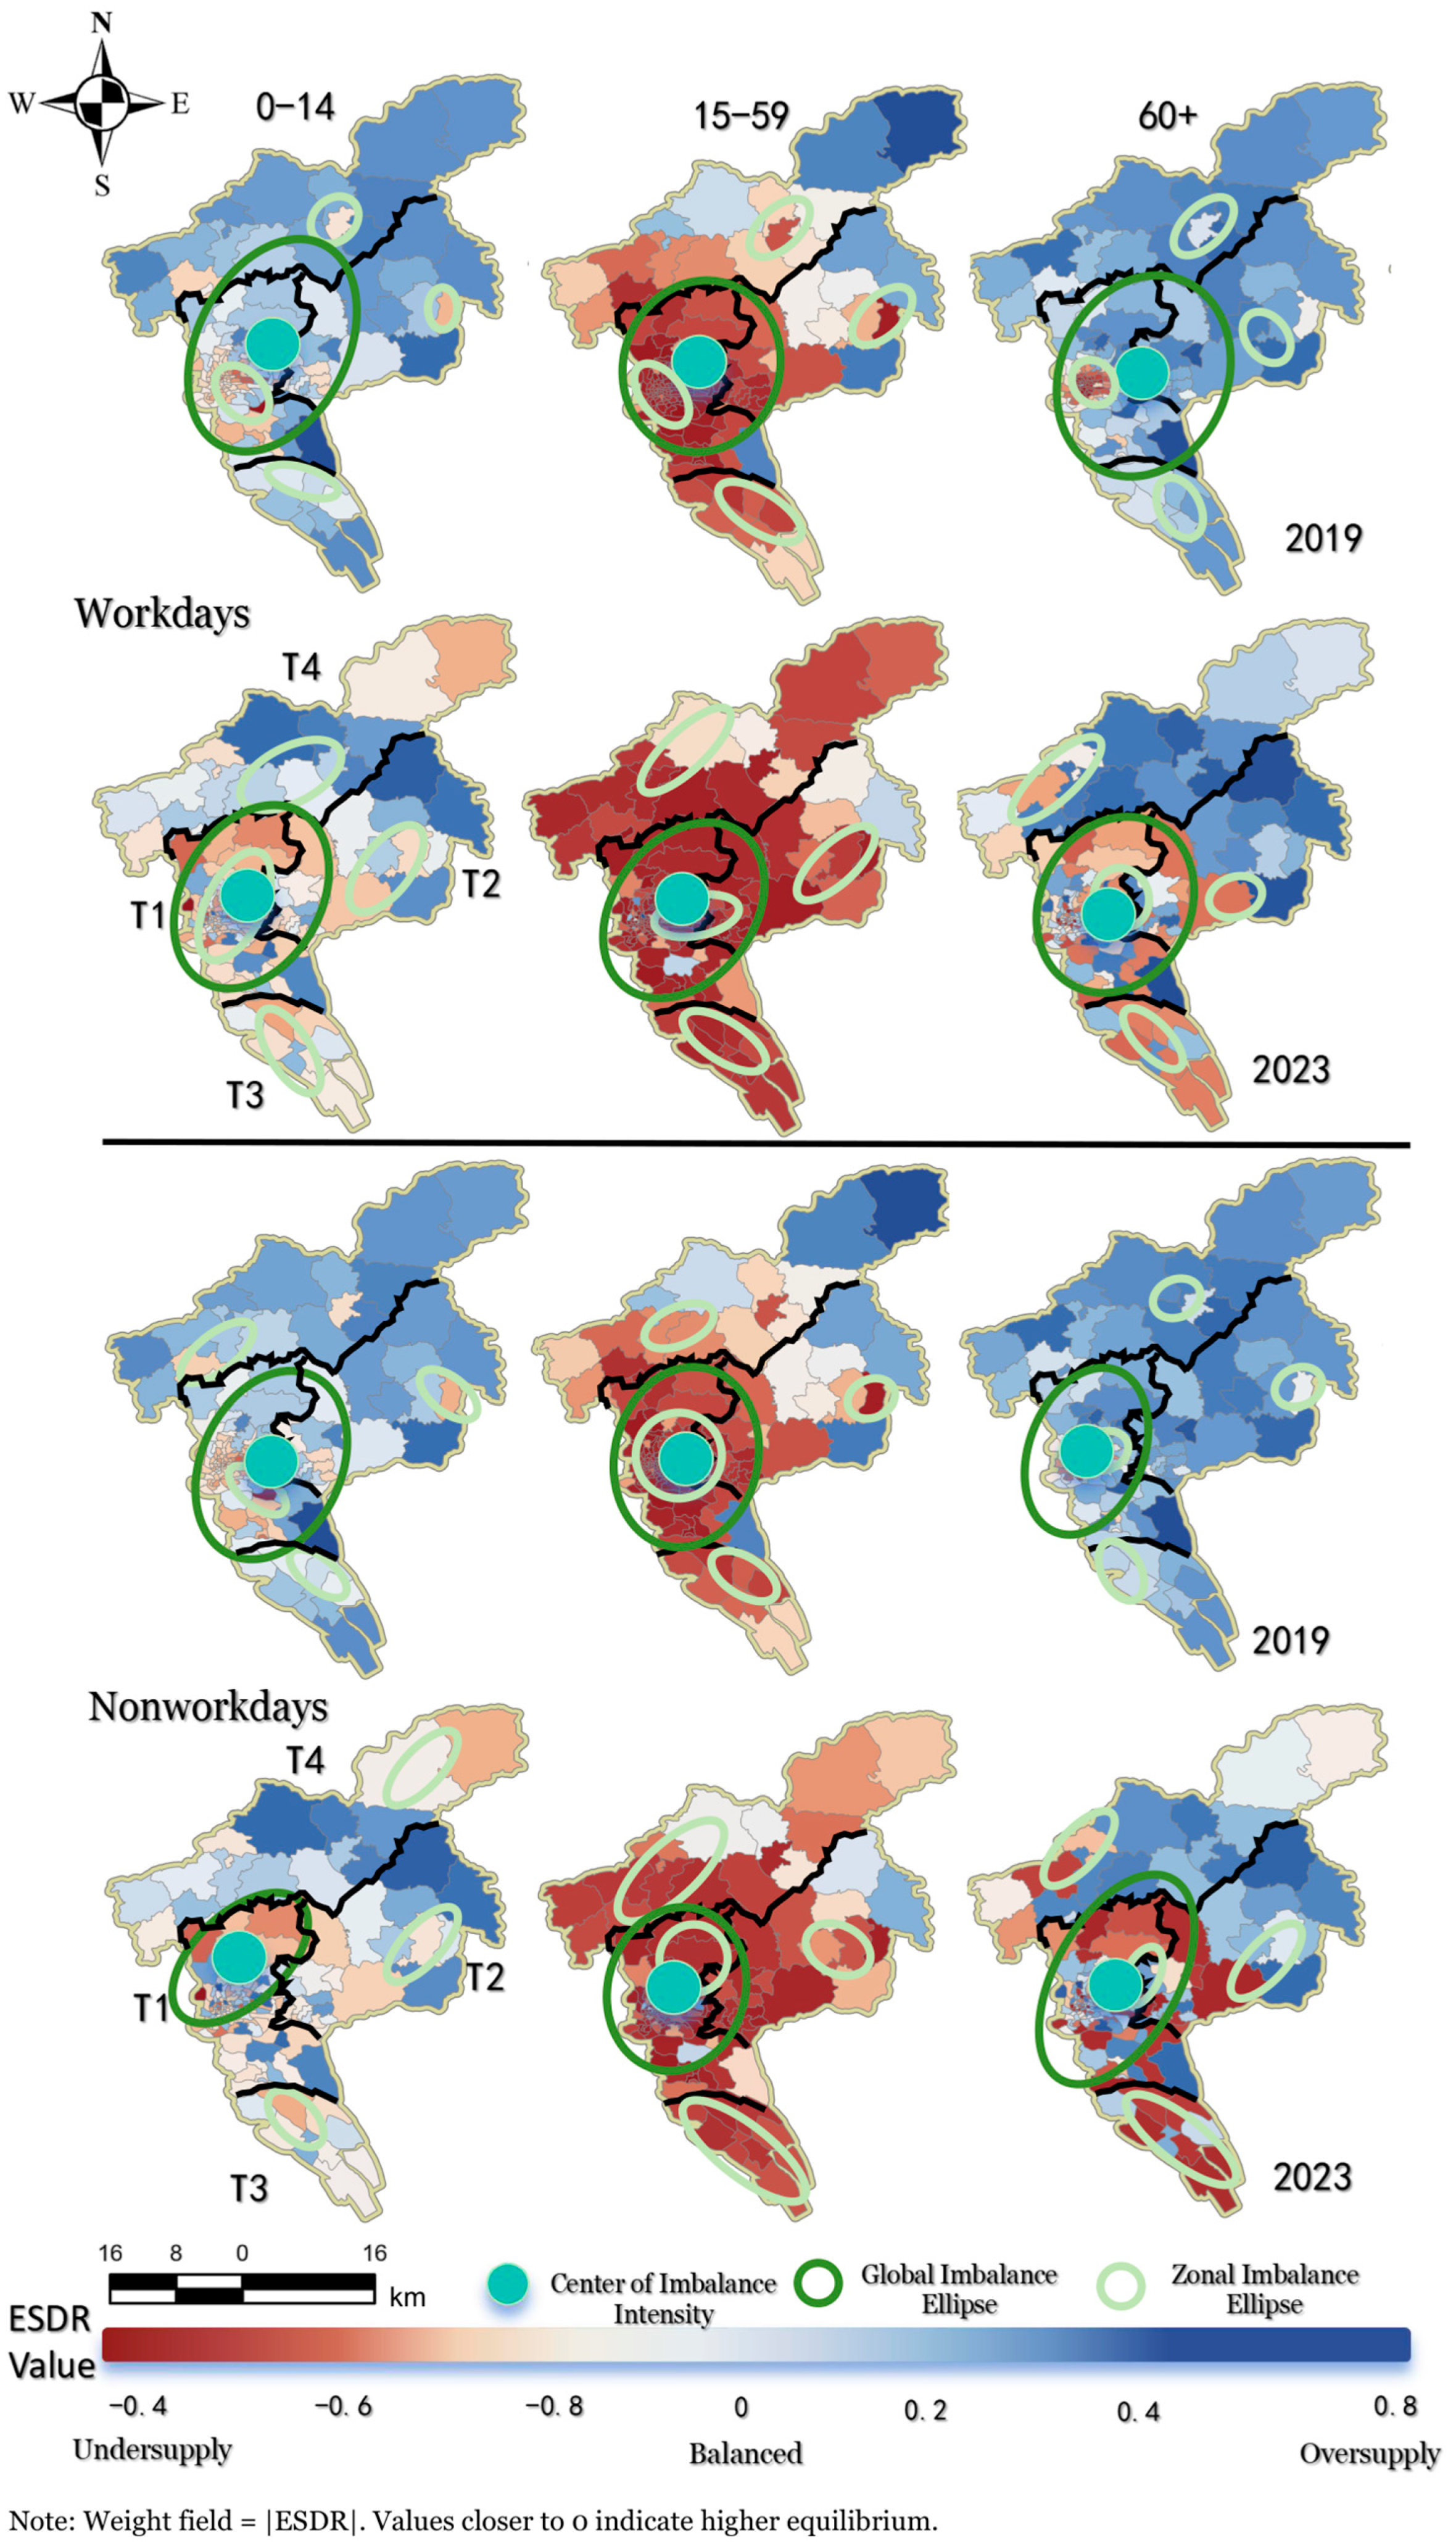
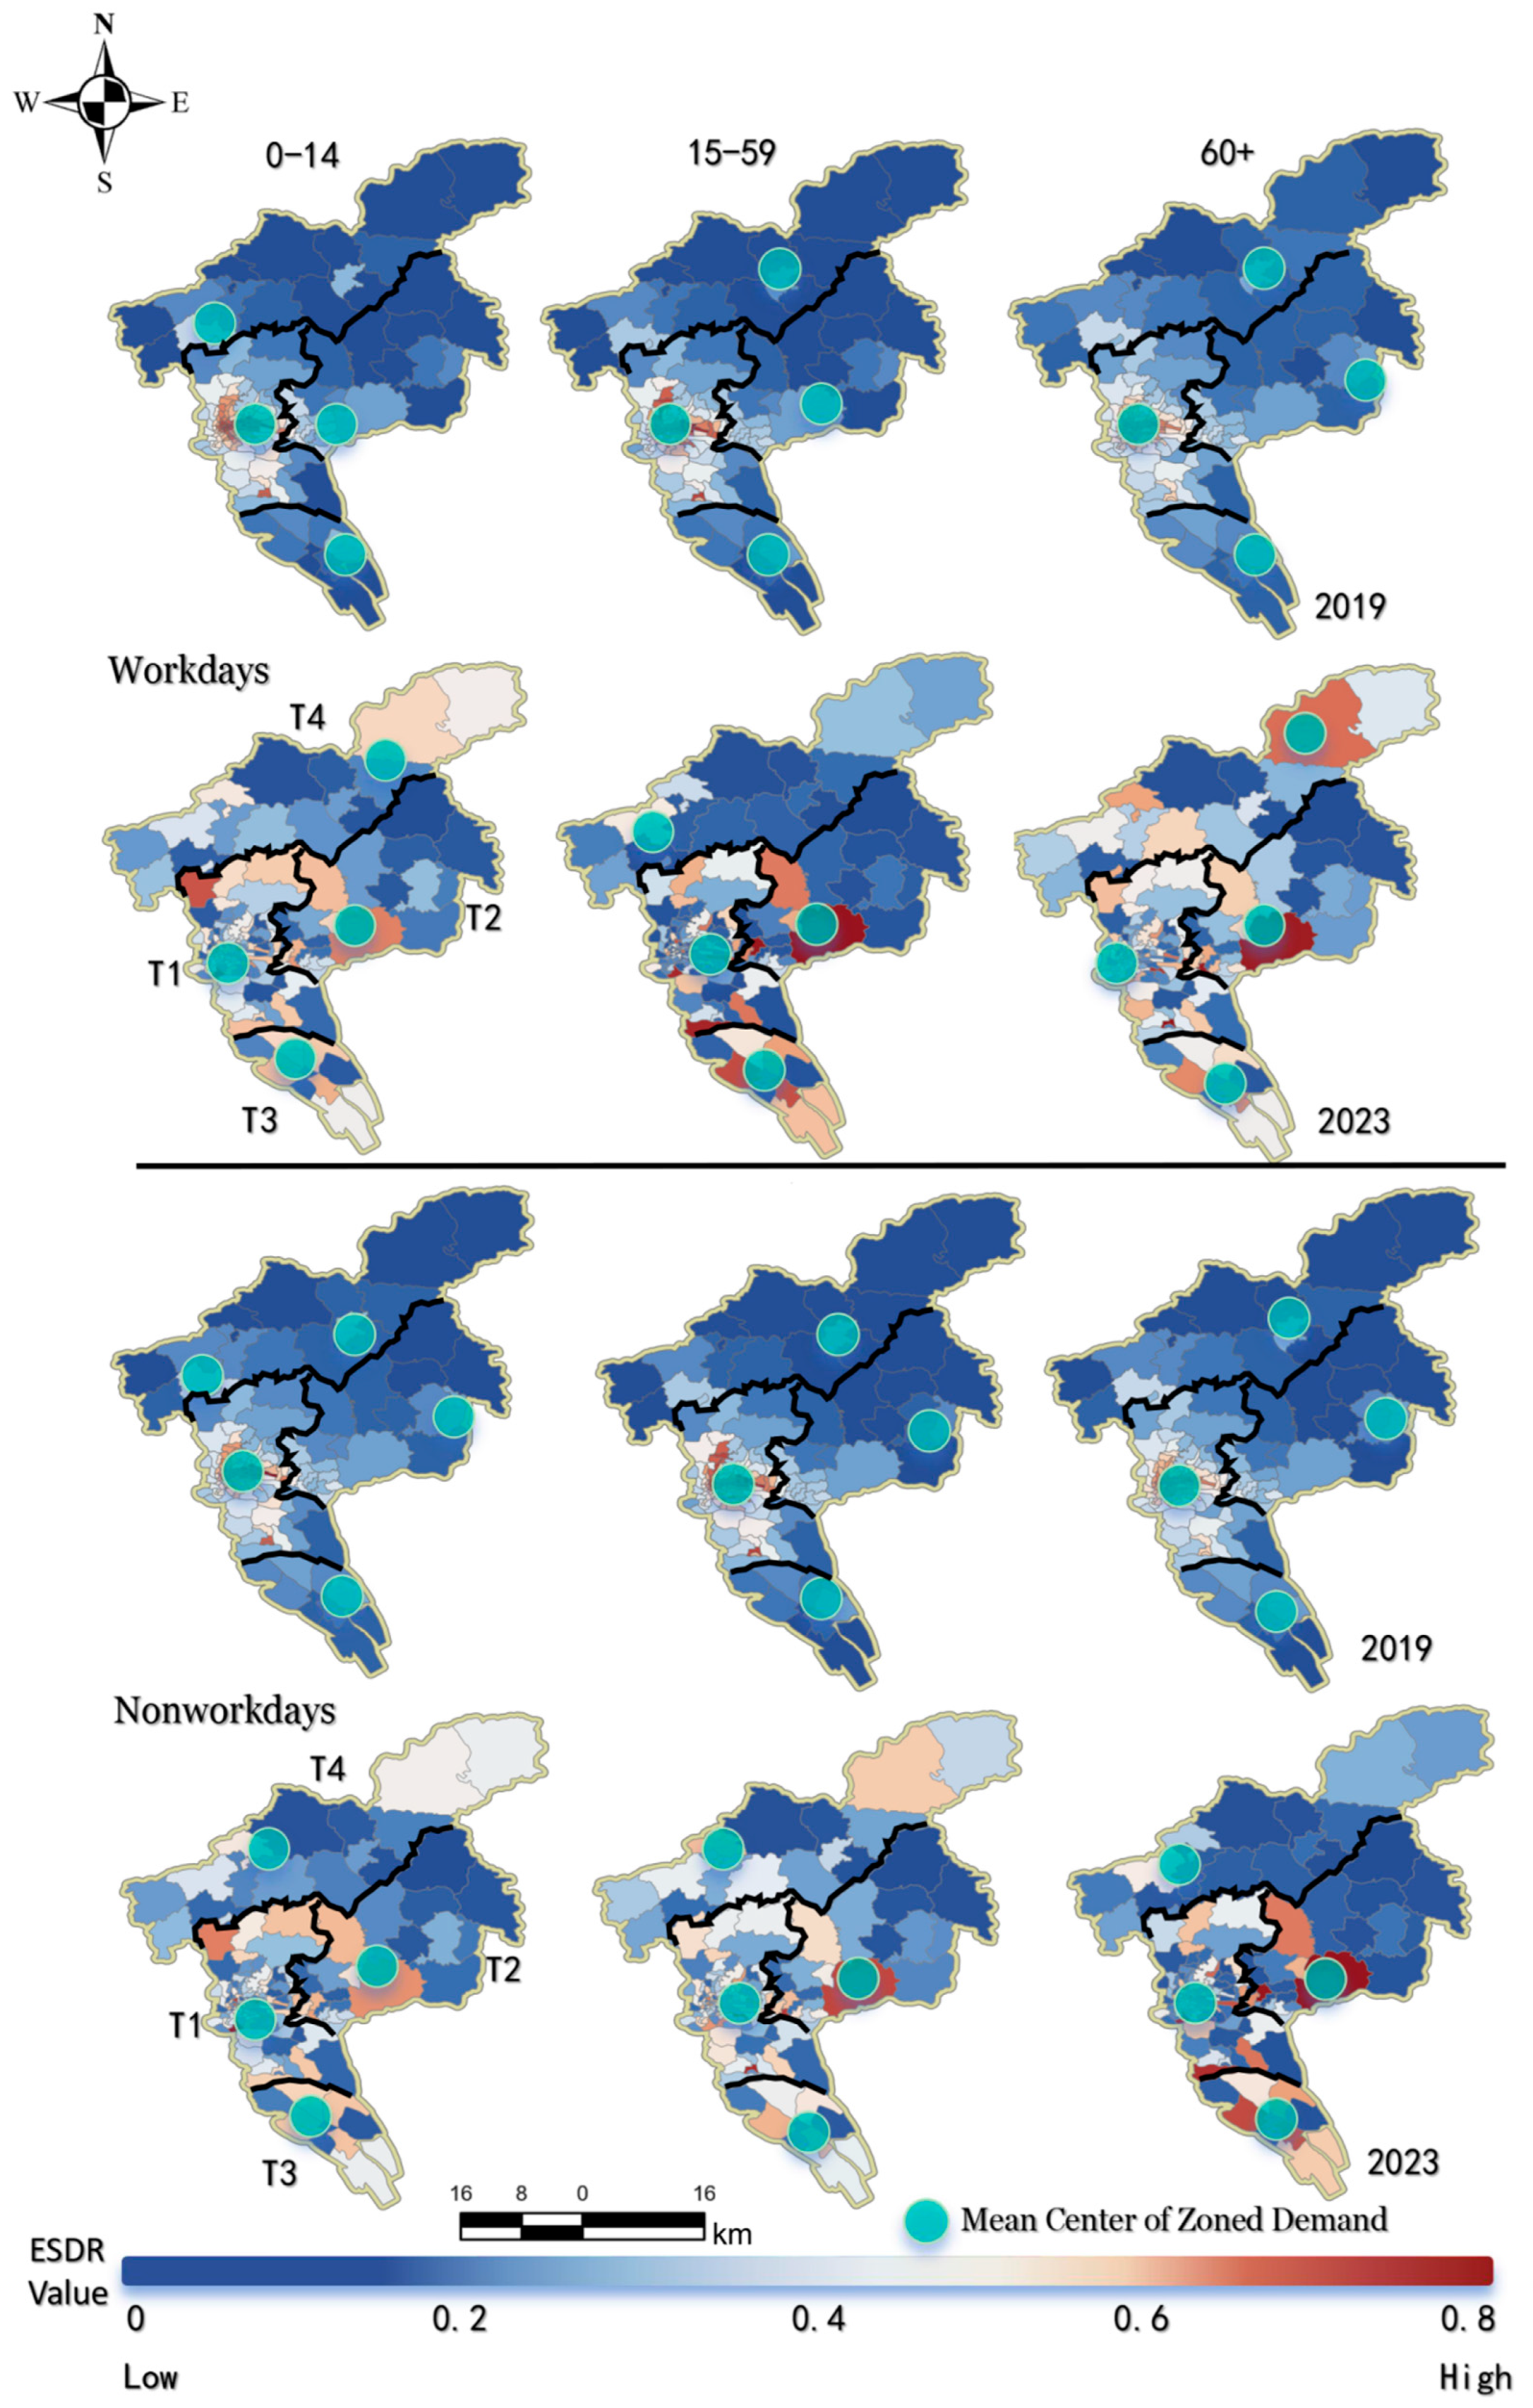
Specifically, the Mean Center method identifies the average location of a set of geographical features, reflecting the central tendency of the ESDR spatial distribution. By calculating the Mean Center of both the overall ESDR values and specific supply/demand deficit clusters, the evolution of the central location of the coupling imbalance can be tracked over time.
The calculation formula for the Mean Center (
,
) is:
and are the spatial coordinates of the i-th community unit (or feature). is the weight associated with the i-th unit, typically represented by the ESDR value for that unit. is the total number of community units.
Also, the Standard Deviational Ellipse (SDE) is a comprehensive method used to measure the central tendency, dispersion, and directional trend of the spatial distribution of a set of features. By fitting an ellipse to the ESDR values, the SDE can visually represent the main orientation and coverage area of the supply–demand imbalance patterns.
The SDE calculation involves three primary components: the center, the dispersion (long and short axes), and the orientation angle (
).
and are the deviations of the coordinates from the Mean Center. is the weight.
Standard Deviations along the Axes (
and
):
(Major Axis) measures the dispersion in the direction of maximum spread. (Minor Axis) measures the dispersion in the direction of minimum spread. The ratio of to indicates the directionality of the ESDR distribution.
4. Discussion
4.1. Evolutionary Logic of Supply–Demand Zoning for CSFs
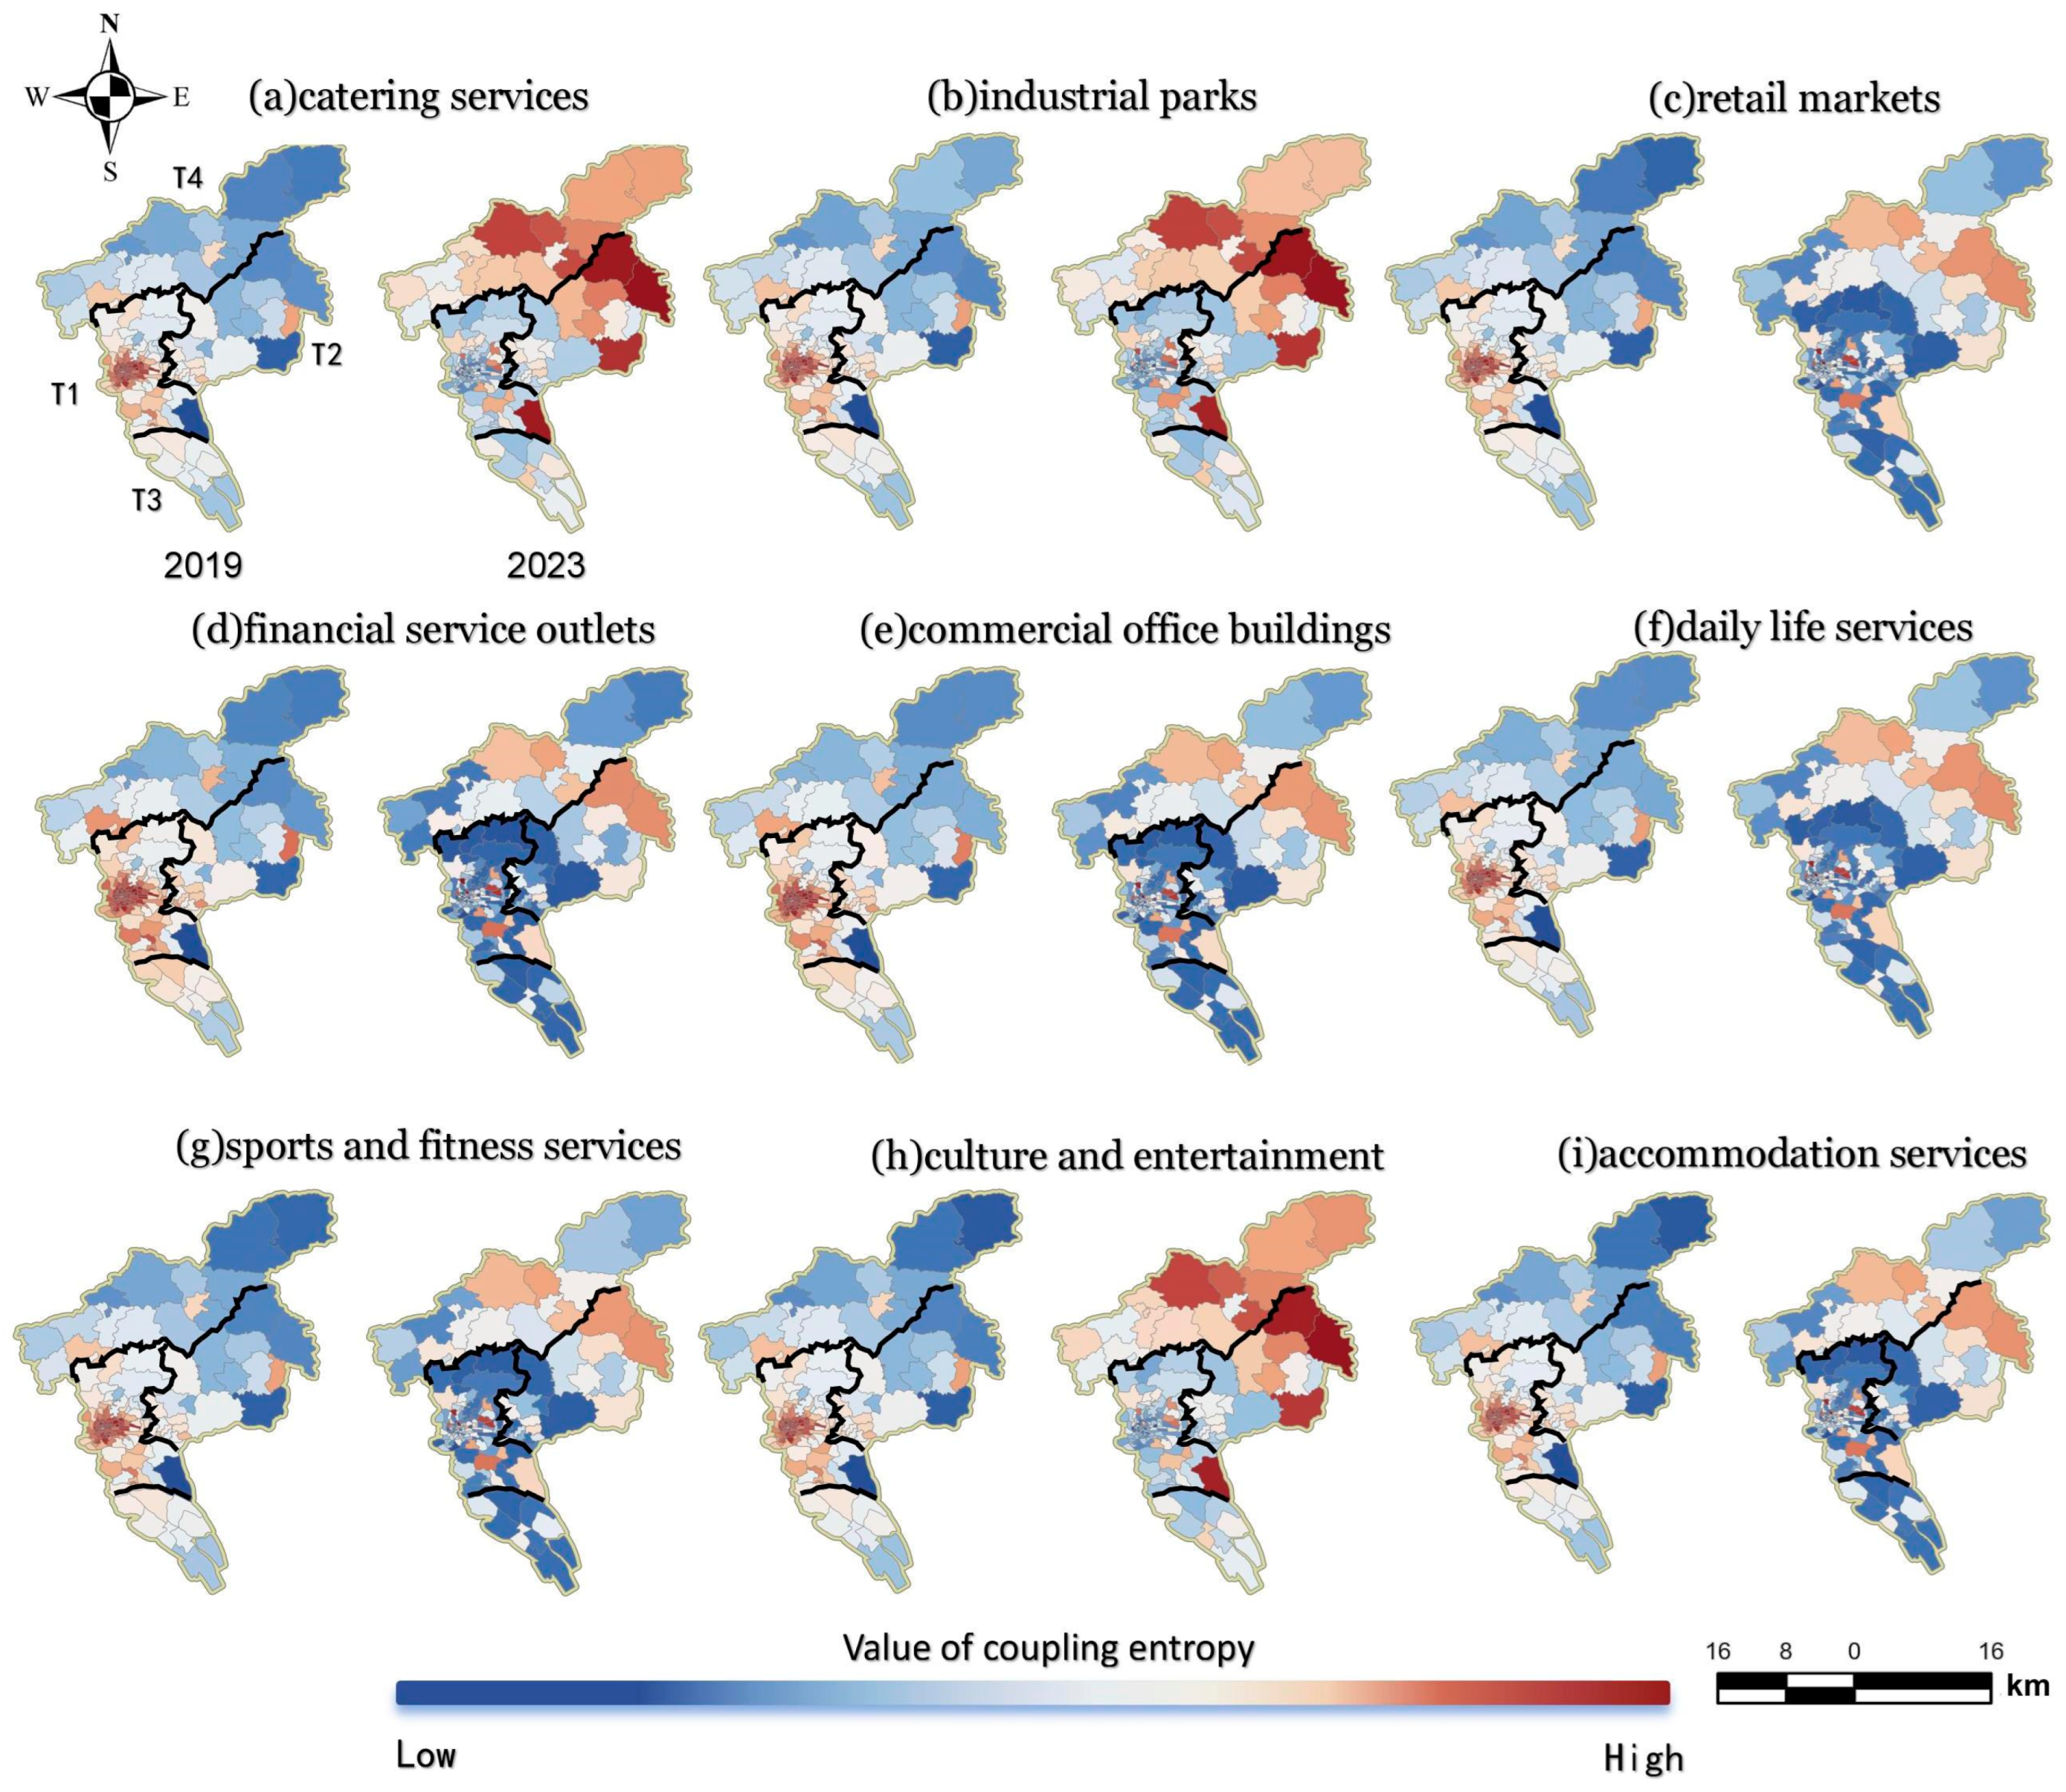
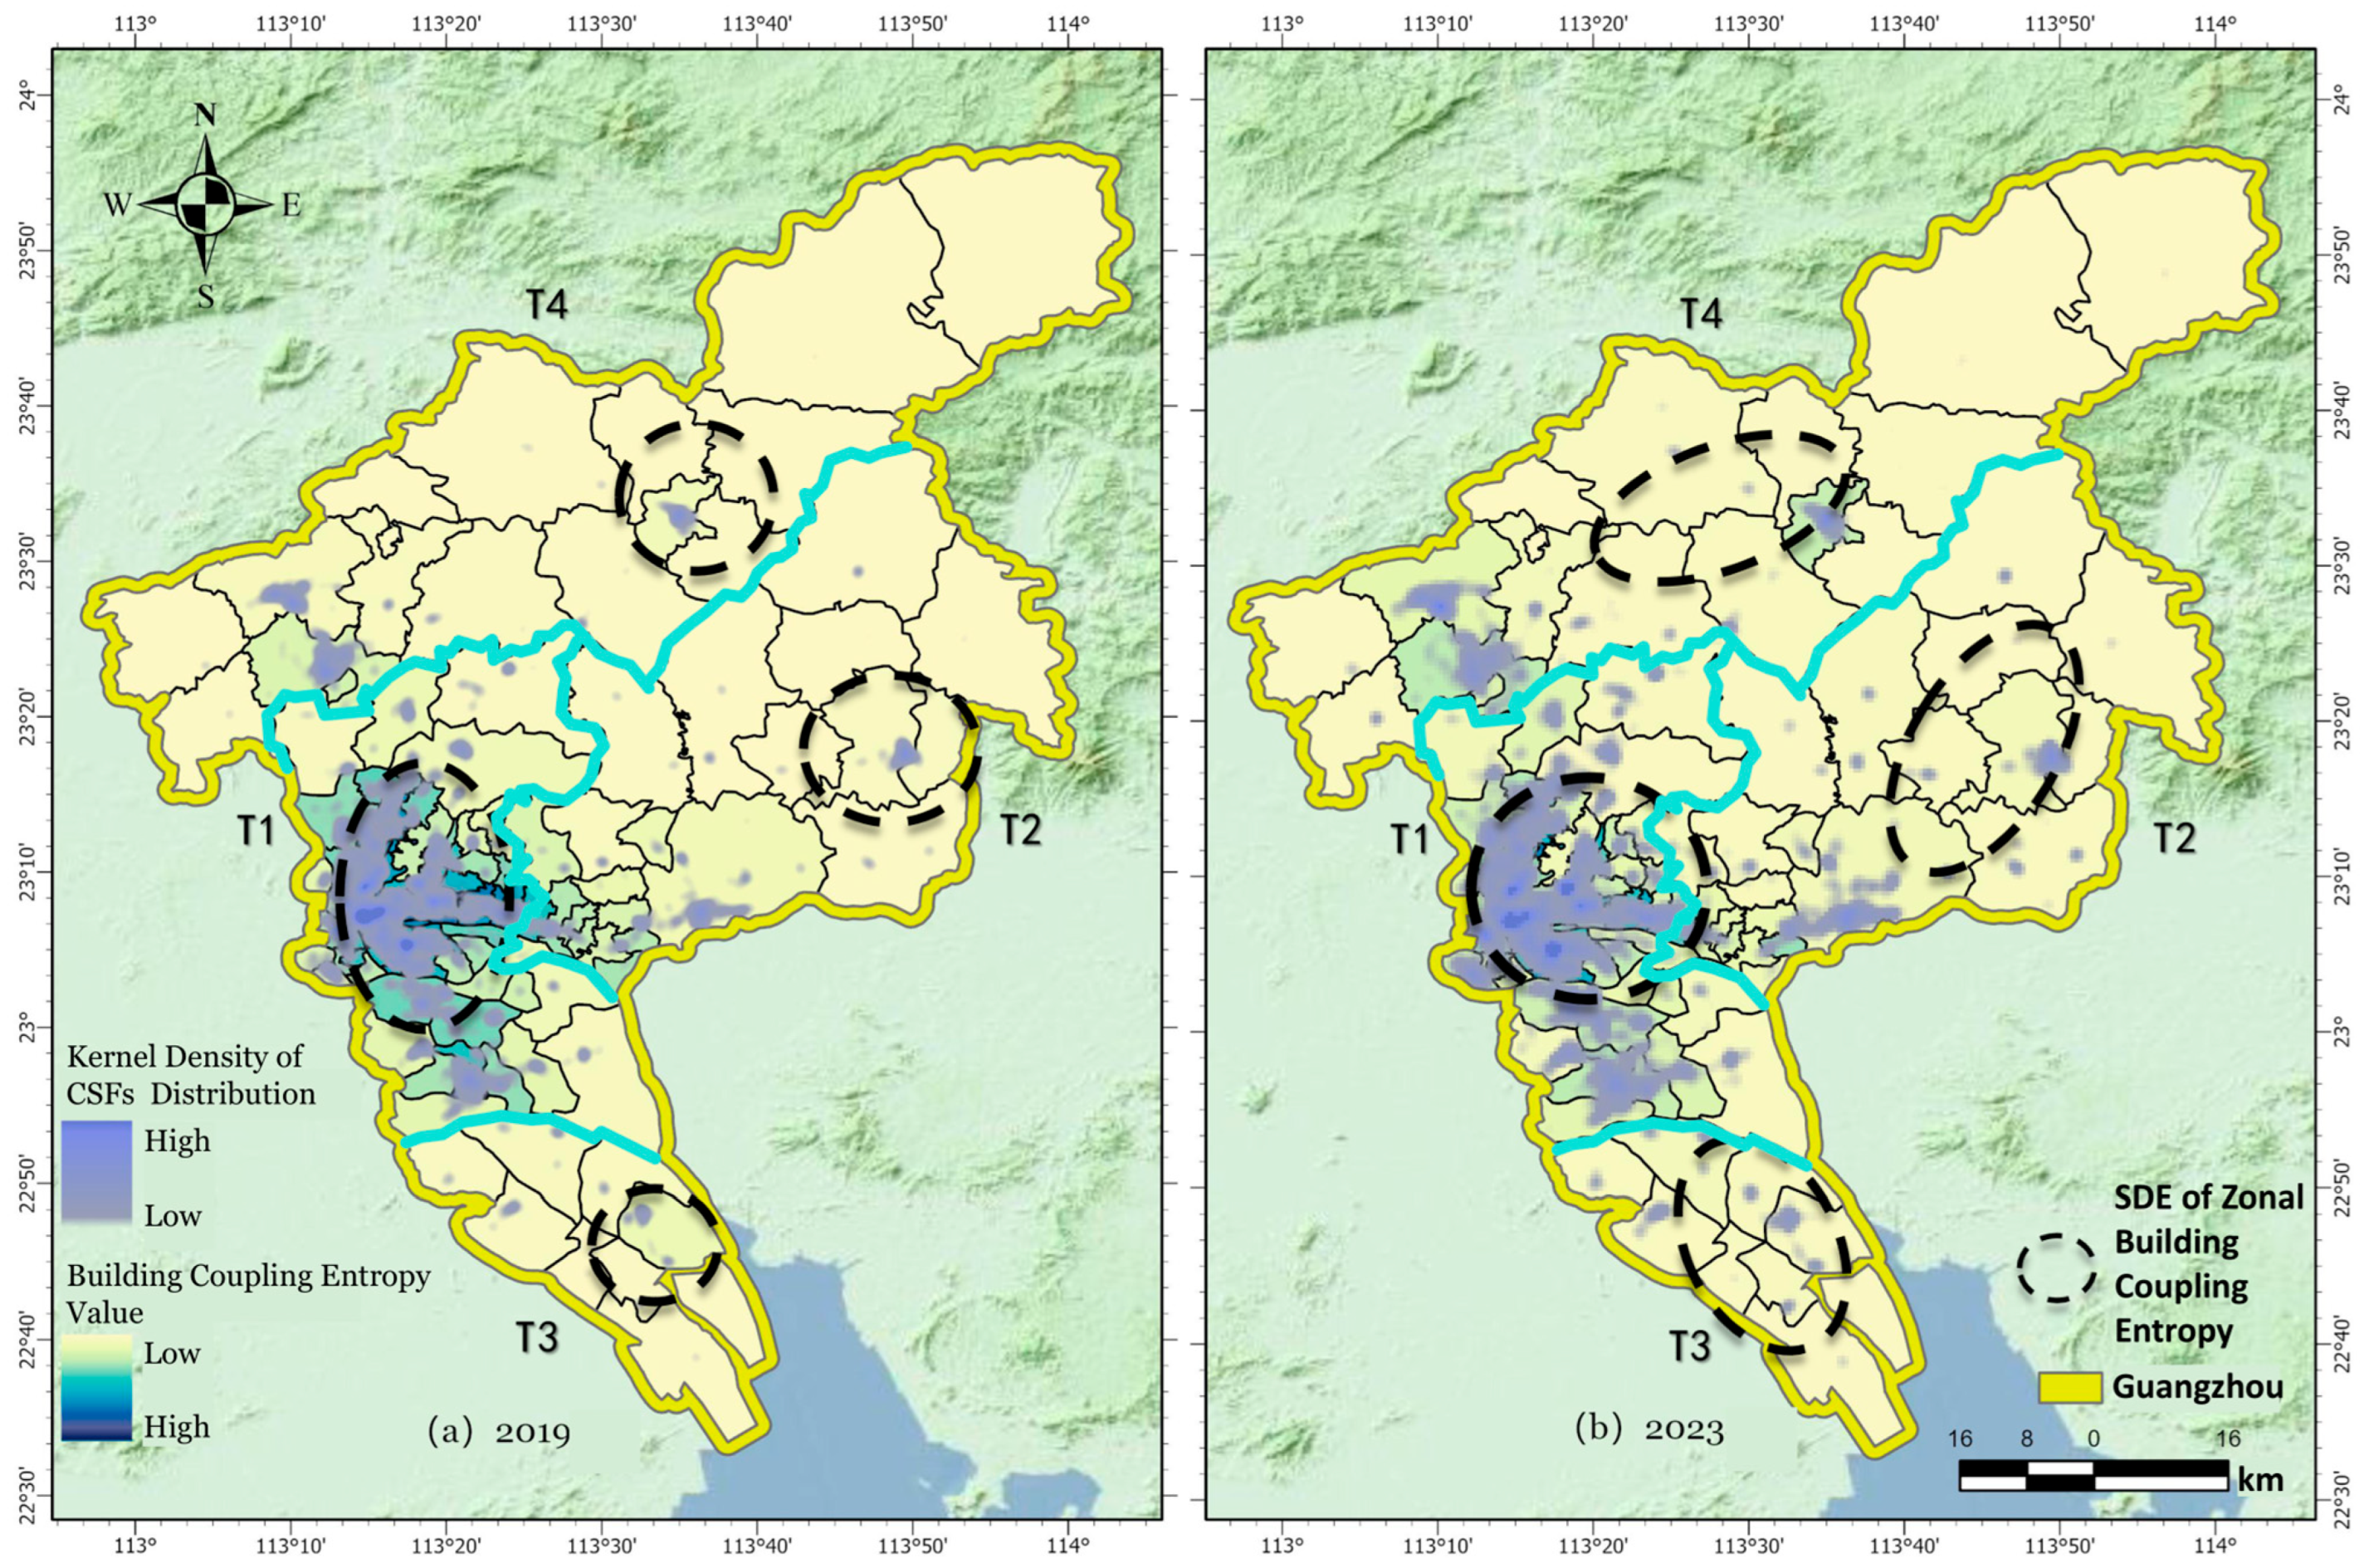
Based on the national territorial spatial planning framework, this study integrates the physical BCE and the supply–demand equilibrium index to reveal the differentiated logic underlying the evolution of facility distribution. These findings collectively constitute the spatial structural evolution of a megacity. By applying the Jenks Natural Breaks method to the ESDR values of 2019 and 2023, this study identifies four core mismatch patterns: High-level Surplus, Stock Equilibrium, Elastic Deficit, and Structural Vacuum. Observations at the community and district scales reveal that the evolution of Guangzhou’s CSFs involves both intense micro-level shifts in individual units and the formation of significant macro-phenomena (
Table 3).
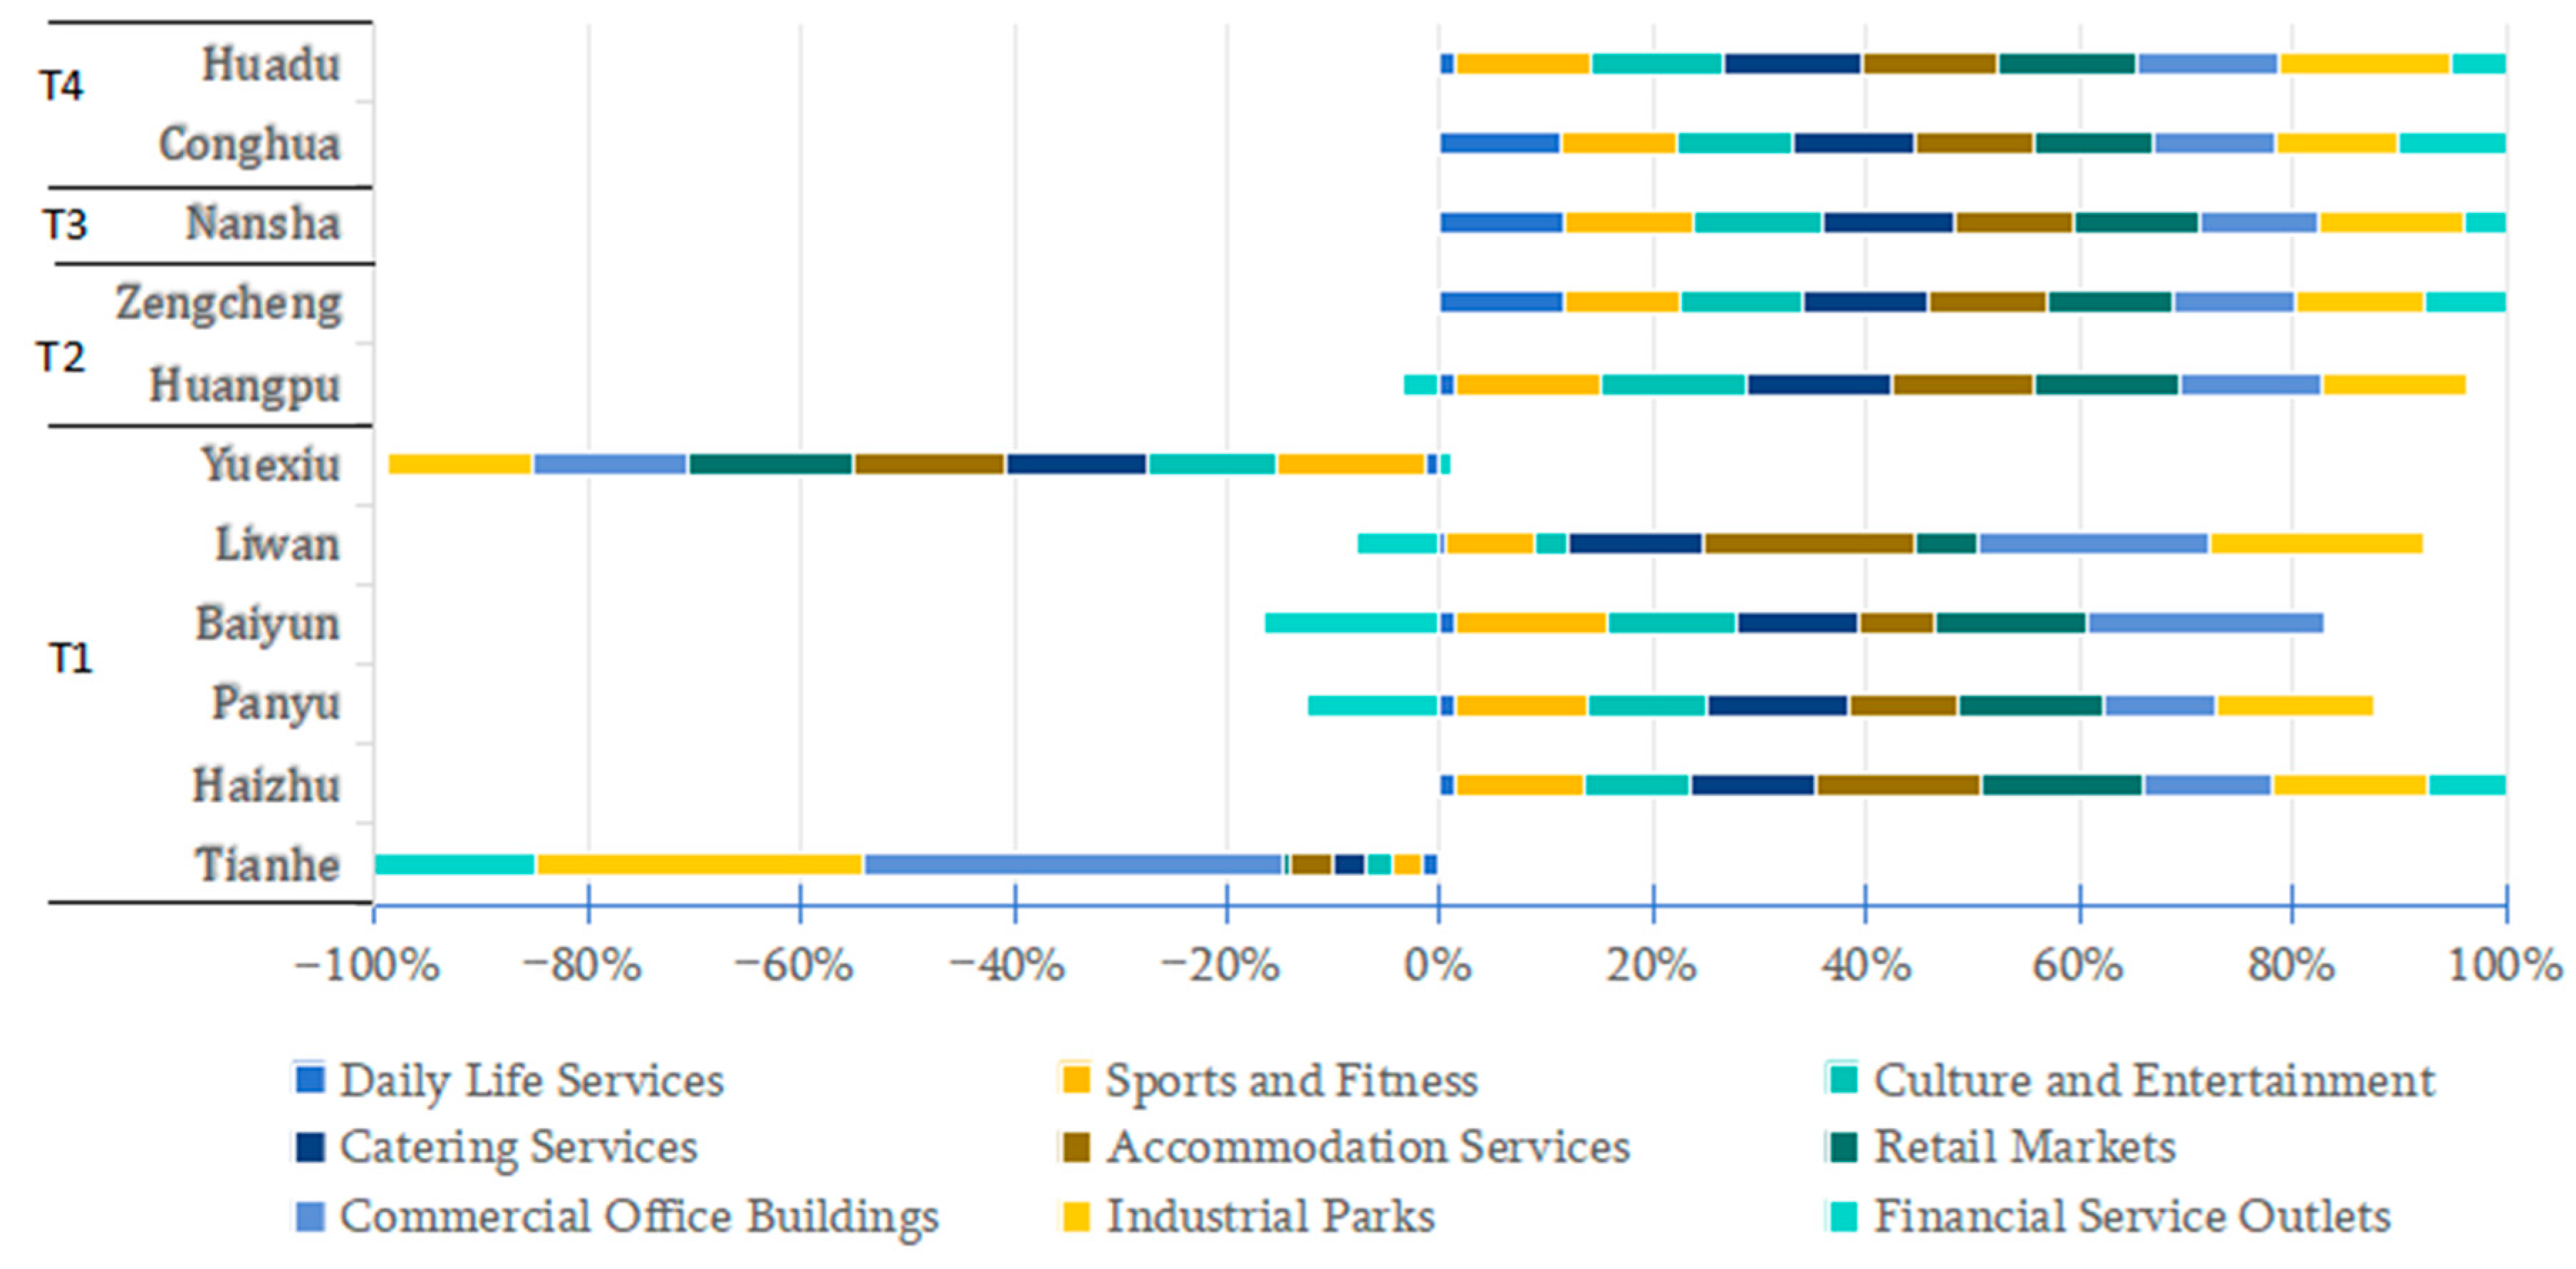
The evolution of the T1 region is driven by the lock-in of core functions and the reallocation of stock space. The upward shift in “Hyper-Redundancy” sub-districts (from 48 to 51) confirms that urban renewal has reinforced the absolute dominance of high-value producer services. Conversely, a significant precise response is observed in traditional urban areas (Yuexiu and Liwan), where service shortages for the elderly plummeted by nearly 80%. This reflects that micro-regeneration policies have successfully secured the basic livelihood bottom line despite the constraints of existing architectural space.
Driven by a policy–industry–population–demand chain, the T2 and T3 regions exhibit a collective slide from “Stock Equilibrium” toward “Elastic Deficit”. This logic serves as quantitative evidence of Guangzhou’s transformation toward a polycentric networked model. A typical mismatch is seen in the Nansha Free Trade Zone, where the configuration speed of living services lags behind the massive influx of high-tech talent—a phenomenon of “fast production, slow urbanism”. Meanwhile, sub-centers like Zengcheng have rapidly satisfied basic needs through large-scale incremental allocation during early construction phases.
The T4 region’s logic is characterized by administrative intervention to forcefully remediate structural vacuums. Large-scale infrastructure investment in Conghua and Huadu has effectively reduced the number of “Structural Vacuum” sub-districts (from 38 to 34), particularly improving matching for the 0–14 and 60+ age groups. However, this “gap-filling” approach now faces a transition from quantitative growth to efficiency optimization, as uneven population density has led to localized low utilization of new facilities.
4.2. Mechanisms of Supply–Demand and Path Dependency in CSFs
Through multi-population and cross-period behavioral analysis from 2019 to 2023, this study finds that the evolution of Guangzhou’s commercial system is not a simple linear growth (
Figure 9). Instead, it is a complex process driven by urban development strategies, functional layouts, and residential habits. This mismatch manifests in distinct ways across different zones (
Table 4):
In the T1 urban core, the layout of commercial facilities demonstrates strong inertia. Data shows that the facility surplus for the working-age group rose from 95.8% to 97.4% over four years, with ESDR values locked at extreme levels.
Within the limited space of the core area, because high-end office and business development offer higher returns, spatial resources are occupied by functions like banking and corporate headquarters. This high functional concentration creates a “squeezing effect,” making it hard for low-profit but essential facilities (e.g., public gyms, convenience stores, social spaces) to survive near office buildings. This creates a paradox: while white-collar workers are in the most facility-dense areas, it remains difficult for them to find a place for exercise or daily shopping near work. This inconvenience caused by functional homogenization is the primary reason why the core area has low matching levels despite a high total volume of facilities.
As the frontier of urban expansion, the T2 and T3 strategic zones exhibit the most unstable matching patterns. The core contradiction here is the mismatch between completed infrastructure and actual movement patterns.
In their early stages, new zones often prioritize industrial capacity over urban living. While large industries are introduced quickly, surrounding dining, shopping, and entertainment facilities often lag behind. Data from 2023 shows that due to severe job–housing separation, the facility shortage on weekdays is 12.4% higher than on weekends.
As many young and middle-aged people move into these areas, the sparse commercial points are suddenly overwhelmed by massive daily needs. During the day, these areas are like islands of factories and offices, while at night or on weekends, the few existing malls become overloaded. This extreme temporal imbalance reflects the growing pains of transforming from an industrial park to a livable urban district.
In the T4 northern peripheral areas, the mismatch manifests as a diffusion of shortages. Despite government efforts to fill gaps, the results are suboptimal.
Infrastructure expansion lags significantly behind the speed of population migration to the suburbs. Over four years, the shortage rate for medical and cultural facilities serving the elderly and children actually rose by about 10%.
Younger, highly mobile groups can solve their needs by traveling further, using cars or apps. This mobility masks the actual lack of resources within the community, making it seem like shortage hotspots have disappeared while average ESDR values remain high. The real victims are the elderly and children who rely heavily on local space; they have become the marginalized groups in the process of spatial expansion.
To further validate these mechanistic observations,
Table 5 provides a detailed statistical comparison of supply–demand characteristics across the four years, while
Table 6 presents the transition probability matrix of spatial hotspots. These quantitative datasets reflect the underlying stability in the spatial evolution of Guangzhou’s CSFs.
4.3. Optimization Strategies for Supply–Demand Matching Patterns of CSFs
Based on the four pattern hierarchies identified through the Natural Breaks (Jenks) method, the optimization of Guangzhou’s CSFs should follow a multi-scale governance logic of community-level driving and district-level coordination. This hierarchical framework aims to resolve the structural contradictions of “flow space” by integrating regional strategic planning with precision micro-interventions.
At the macro-district level, governance must prioritize regional synergy to balance the strategic gravity center drift of commercial demand toward the east and south (
Figure 10). In T2 and T3 strategic growth poles, such as Huangpu and Nansha, planning should transition from fragmented “point-by-point” gap-filling to “District-level Hub-driven Development.” By centrally constructing integrated cross-community shared service hubs at transit-oriented development (TOD) nodes, the city can leverage scale effects to support the rapidly growing workforce and bridge the resource islands created by rapid industrial expansion. In the T1 core area, district-level coordination should focus on the functional softening of inventory spaces. This involves the guided reduction in redundant productive functions and the strategic diversion of headquarters or financial services to peripheral nodes, thereby alleviating the high-intensity spatial pressure that currently squeezes essential living services.
At the micro-community scale, the focus shifts toward precision identification and age-appropriate urban acupuncture. For communities in T1 and high-density residential zones, governance should prioritize the awakening of underutilized assets, such as old factory ground floors or vacant retail shops, to safeguard the basic living standards of localized vulnerable groups. To resolve the masking effect where high commuter mobility obscures the deprivation of the elderly and children, specific interventions like embedding health micro-stations for the elderly (repurposed from redundant booths) and child-friendly reading spaces into the 15 min life circle are essential. Furthermore, addressing the tidal mismatches in T2 and T3 necessitates an elastic supply mechanism. By deploying mobile service modules (e.g., modular dining cars) and encouraging the time-shared use of commercial office buildings, allowing office plazas and cafeterias to serve residents during off-peak periods, so that planners can achieve a seamless coupling of productive and living spaces without increasing land consumption.
Finally, a scale-linking monitoring system should be established to ensure the long-term applicability of these strategies. By integrating dynamic ESDR indicators into the city’s routine smart-governance platforms, Guangzhou can transition from static configuration to flow-responsive supply. This system would allow for real-time identification of structural vacuum zones and provide early-warning responses at the district level, ensuring that CSF provision remains resilient to the evolving mobility-driven demand of the workforce and the strong spatial dependence of the elderly and children.
5. Conclusions
5.1. Theoretical and Practical Contributions
This study advances the field of supply–demand matching for CSFs by transitioning from a static, binary framework to a structural dynamic evolution model. By attributing deep-seated imbalances to the structural mismatch between fixed facility forms and dynamic human flow demand, the research reveals how functional specialization, residential behavioral heterogeneity, and planning lags normalize these discrepancies in megacities.
Methodologically, the introduction of the BCE index provides a fine-grained tool to measure functional composition and quality, effectively replacing the limitations of single-quantity indicators. On the demand side, the Dynamic Demand Model integrates behavioral big data to overcome the biases of static census records, allowing the ESDR to capture multi-group and multi-temporal patterns.
Furthermore, by identifying the 15–59 core labor force as the focal point of supply–demand contradictions, the research clarifies the demand patterns and minimum matching degrees that urban planning must prioritize. These findings provide precise quantitative evidence for implementing elastic management and time-sharing strategies within polycentric urban networks, offering a valuable decision-support framework for megacities aiming to enhance governance elasticity and build people-centric service systems.
5.2. Research Limitations
Despite its innovations, this research faces constraints regarding data precision, parameter settings, and behavioral profiling. Minor discrepancies in statistical standards and update frequencies among multi-source data, such as POI, building vectors, and OD flows, may lead to spatial generalization errors at the micro-street scale. Furthermore, the BCE model primarily utilizes physical attributes like area and height, potentially overlooking non-physical variables such as actual business turnover, rent levels, and operating hours that influence supply efficiency. The study has also yet to conduct deep-dive analyses into the behavioral fluctuations of specific vulnerable groups, such as persons with disabilities, during extreme weather or major holidays. Finally, because findings are rooted in Guangzhou’s specific “Eastward Industry, Southward Population” structure, the ESDR thresholds may vary in cities with different topographical or morphological constraints.
5.3. Future Research Directions
To further refine megacity service systems, future research should explore the integration of higher-frequency data and advanced predictive tools. Integrating real-time anonymous signaling or social media check-in data could shift “flow space” analysis from the sub-district level down to the community micro-grid level, allowing for a more dynamic monitoring of urban system pressure.
Leveraging Digital Twin technology could further refine assessments by incorporating interior layouts and vertical business distribution into the coupling entropy model, moving beyond mere building envelopes. Additionally, developing machine learning-based predictive models to simulate behavioral responses under various urban renewal scenarios can provide intelligent decision support for community life circle optimizations.
Future studies should also transition toward longitudinal panel data and cross-city comparisons to verify the robustness of the BCE and ESDR framework across diverse urban morphologies.