Article

Spatial Analysis of Economic Activities as a Tool for Effective Urban Policies

Department of Planning and Regional Development, University of Thessaly, 38334 Volos, Greece
*
Author to whom correspondence should be addressed.
Smart Cities 2022, 5(1), 276-293; https://doi.org/10.3390/smartcities5010017
Submission received: 31 December 2021 / Revised: 16 February 2022 / Accepted: 24 February 2022 / Published: 4 March 2022
(This article belongs to the Topic Sustainable Smart Cities and Smart Villages)

Abstract

:
The economic activities of each city greatly shape and predict their development as well as make them more competitive both locally and globally. In the last two decades, as part of the international economic crisis, Greece has been at the center of changes that have resulted in the closure of thousands of businesses. This significantly affected Greek cities by changing their economic profile and robustness via the spatial distribution of their economic activities. Economic geography, as a sector that examines the geographical distribution of economic activities, is an important methodological base for analysing business locations and urban spatial processes. This paper aims to analyse, through a combination of economic geography theories and spatial analysis methods, the spatial patterns of economic activities and to identify urban areas that are resilient in difficult times of crisis. Thus cities that have the ability, via the proposed analysis/methodological framework, to control and evaluate their economic profile and prospects, can be transformed into smart cities by adopting ad hoc urban renaissance and resilient policies.

1. Introduction

Economic geography is a vibrant field [1] which via parameters stemming from a methodological and epistemological point of view [2] proceed to the study of the spatial variation of economic activities, recognizing the fact that the spatial scale of the analysis influences the economic results [3] and merits, now more than ever, the attention of political scientists [4], urban planners and policymakers. Not only it is an important tool for analysing and understanding modern economies and societies, but it also contributes to the description and analysis of spatial patterns by creating new concepts of refiguration of spaces [5]. Economic geography is an art [6], a subdivision of geography focused on economic activities and a variety of issues related to the location of companies and industries, as well as their interactions in space, usually under the rubric of the cultural turn [7] and has been subject to new and promising developments [8]. In addition, economic geography studies the flows that develop between people and goods, along with the spatial fingerprint of the economic interactions of their relationships, and builds up constantly to new forms and key concepts, such as co-evolution [9]. In this way, economic geography contributes to the study and analysis of the spatial organisation of transportation networks or economic activities, and to the development of proposals for strengthening economic activity and/or giving new morphological types of land uses concentration, such as zoning [10] or clustering [11], thereby contributing significantly to urban development.
At the same time, the use of spatial patterns is a spatial statistical method that contributes to the analysis of economic activities within the urban fabric [12] and different assumptions about firms’ decisions lead to different spatial configurations [13]. Their importance and decisive role are attributed to the fact that each spatial pattern within a specific space and time is the result of many processes which influence compact development. Parameters commonly used to understand compact development include among others patterns of the urban population and internal migration [14,15], economic activities, and land use [16]. Thus, spatial patterns help us to understand the relationships or interactions of phenomena in a particular spatial unit [17,18]. It is a fact that days of civil disorder—a riot [19] or during a long period of the financial crisis [20], or quarantine measures [21,22] economic activities face various transformations. The spatial patterns of companies that remain unchanged during such periods can provide important information about the ‘resilience’ of these companies; that is, to approach the spatial advantages within the urban space of specific economic activities over some others. The location of a company is important both for the company itself and for the environment in which it operates. Their study and analysis are therefore necessary for the sustainable development of the city.
Economic geography is not solely about what economic activity causes in the geographical area: it means also what geographical area causes in economic activity. Thus, according to the above, it is understood that economic geography, in combination with the spatial patterns of economic activities, is a tool that will strengthen urban resilience and smartness. In addition, the combination of economic geography and spatial standards can create new types of analysis regarding the economic identity of the city, and contribute to a more effective analysis and identification of the spatial and economic characteristics that can lead to its smart development.
It seems that there is a significant positive relationship between the smartness of a city and its resilience [23] while the urban resilience pillars influence economic well-being [24]. Urban resilience is an important goal of modern cities, as it allows them to become more flexible to emerging challenges and to maintain their continuity. It is an urban concept describing the city’s ability to recover and thrive after stress. It seems that there is a strong relationship between economic resilience and entrepreneurship, while every crisis calls cities to re-consinder and re-evaluate their economic structure [25] and retail district resilience is crucial in the context of promoting the sustainability of cities [26] given that several special conditions, such as the intense suburbanization of retail, can affect urban space and especially city centers [27]. This relationship can also be captured through a procedure for assessing the higher value as a result of urban change or the urban variant [28].
But, on the other hand, according to Zhou (2021) [29] the development of smart cities has no obvious effect on economic resilience. Strengthening the development of the economy is proposed to further promote smart and resilient urban development [23]. In parallel, strengthening the driving force of innovation [30,31], or the public infrastructure and service [32,33] can continuously improve the rapid resilience of smart cities. As city conditions are constantly changing, it is important to be able to detect changes in a city’s financial strength as automatically as possible. A better and automatic ‘reading’ of the city can be the background for the efficient adoption and formulation of urban policies. The more automatic and dynamic this process is, the closer we are to characterising a city as smart.
For all these reasons this paper aims to analyze the change of the economic robustness of the city over time in the whole urban fabric as well as in urban areas. Furthermore, aims to highlight spatial patterns and spatial transformations of economic activities and to distinguish trade routes with the greater concentration of businesses. So, the research hypotheses (H) are:
Hypothesis 1 (H1).
Which are the spatial patterns of economic activities within the urban fabric?
Hypothesis 2 (H2).
Which urban economic areas are more resilient in difficult times of crisis?
Finally, this paper proposes directions for sustainable urban development and ways to encourage new businesses to improve the city’s economic identity. These characteristics are the parameters on which we can base or even choose urban policies.

2. Methodology

The methodology is based on the measurement of average nearest neighbour, the kernel density estimation method and the network-based kernel density estimation method.

2.1. Average Nearest Neighbour

The nearest neighbour method measures the distance between each central element and the position of the nearest element. More specifically, this method is used to determine whether the data are random, scattered, or grouped within the study area [34], if they exhibited a tendency to cluster [35]. If the average distance is less than the average for a hypothetical random distribution, then the distribution of the characteristics analysed is considered grouped. If the mean distance is greater, then the characteristics are considered scattered. Finally, if they are equal, then the characteristics are random. According to the equations, Average Nearest Neighbor [36]:
A N N = D ^ o D ^ E
where D ^ o is the observed mean distance of each characteristic and the nearest neighbor, and D ^ E is the expected mean distance for each attribute in a random pattern.
D ^ o = i = 1 n d i n
D ^ E = 0.5 n A
In Equation (2), d i is the distance between attribute i and the nearest neighbour, n corresponds to the total number of attributes and A (Equation (3)) is the area of a frame or a defined value of the area [36].
Average Nearest Neighbor z-score:
z = D ^ o D ^ E S E
where:
S E = 0.26136 n 2 A
If the Average Nearest Neighbour index (1) is less than 1, then the pattern shows grouping; if the index is greater than 1, then the trend tends to disperse [37]. According to Equations (4) and (5) the z-score represents the standard deviation and can indicate the statistical significance of the data as well as if they are cluster, random, or scatter in space. This method is very important as it can determine whether the businesses are grouped in the area (i.e., they are concentrated in areas where there are already other companies), whether there is no spatial pattern (given that the choice of the location of the company can be random) or whether the companies are scattered within the urban fabric simply by covering vacant areas where businesses no longer exist.

2.2. Kernel Density Estimation Method

Kernel density estimation (KDE) is an important method for analysing the spatial distribution of points as well as their linear characteristics at the 2D space level [38]. KDE calculates the point density value at each position as the average value within a spatial window (i.e., bandwidth). The kernel function is a continuous normalised function that is centred at a specific point and summarises the values within a given bandwidth (h), as shown by the Equation (6) [39]:
f ^ ( x ) = 1 h 2   i = 1 n K     ( x x i h )
where h is the bandwidth, and x x i indicate the distance between the centre of the nucleus x and the position x i . There are several kernel estimation methods in different GIS. ESRI and ArcGIS allow only one kernel estimation method for point and line density, (Equations (7) and (8)) known as square or Epanechnikov [40]:
K ( x i ) = { 1 3 π ( 1 t i 2 ) 2 α ν   t i 2 < 1 0   o t h e r w i s e
where:
t i = d i j h
Here we must mention that the choice of bandwidth is very important. In the present work, Silverman’s Rule of Thumb is used, where the only condition is that the distribution is normal. Silverman’s Rule of Thumb is used because it is the first estimator in multi-stage bandwidth options.
Usually, KDE uses grid elements as a unit of analysis and Euclidean distance as a distance metre, since urban space is not homogeneous due to mixed land use and road network structure [39].

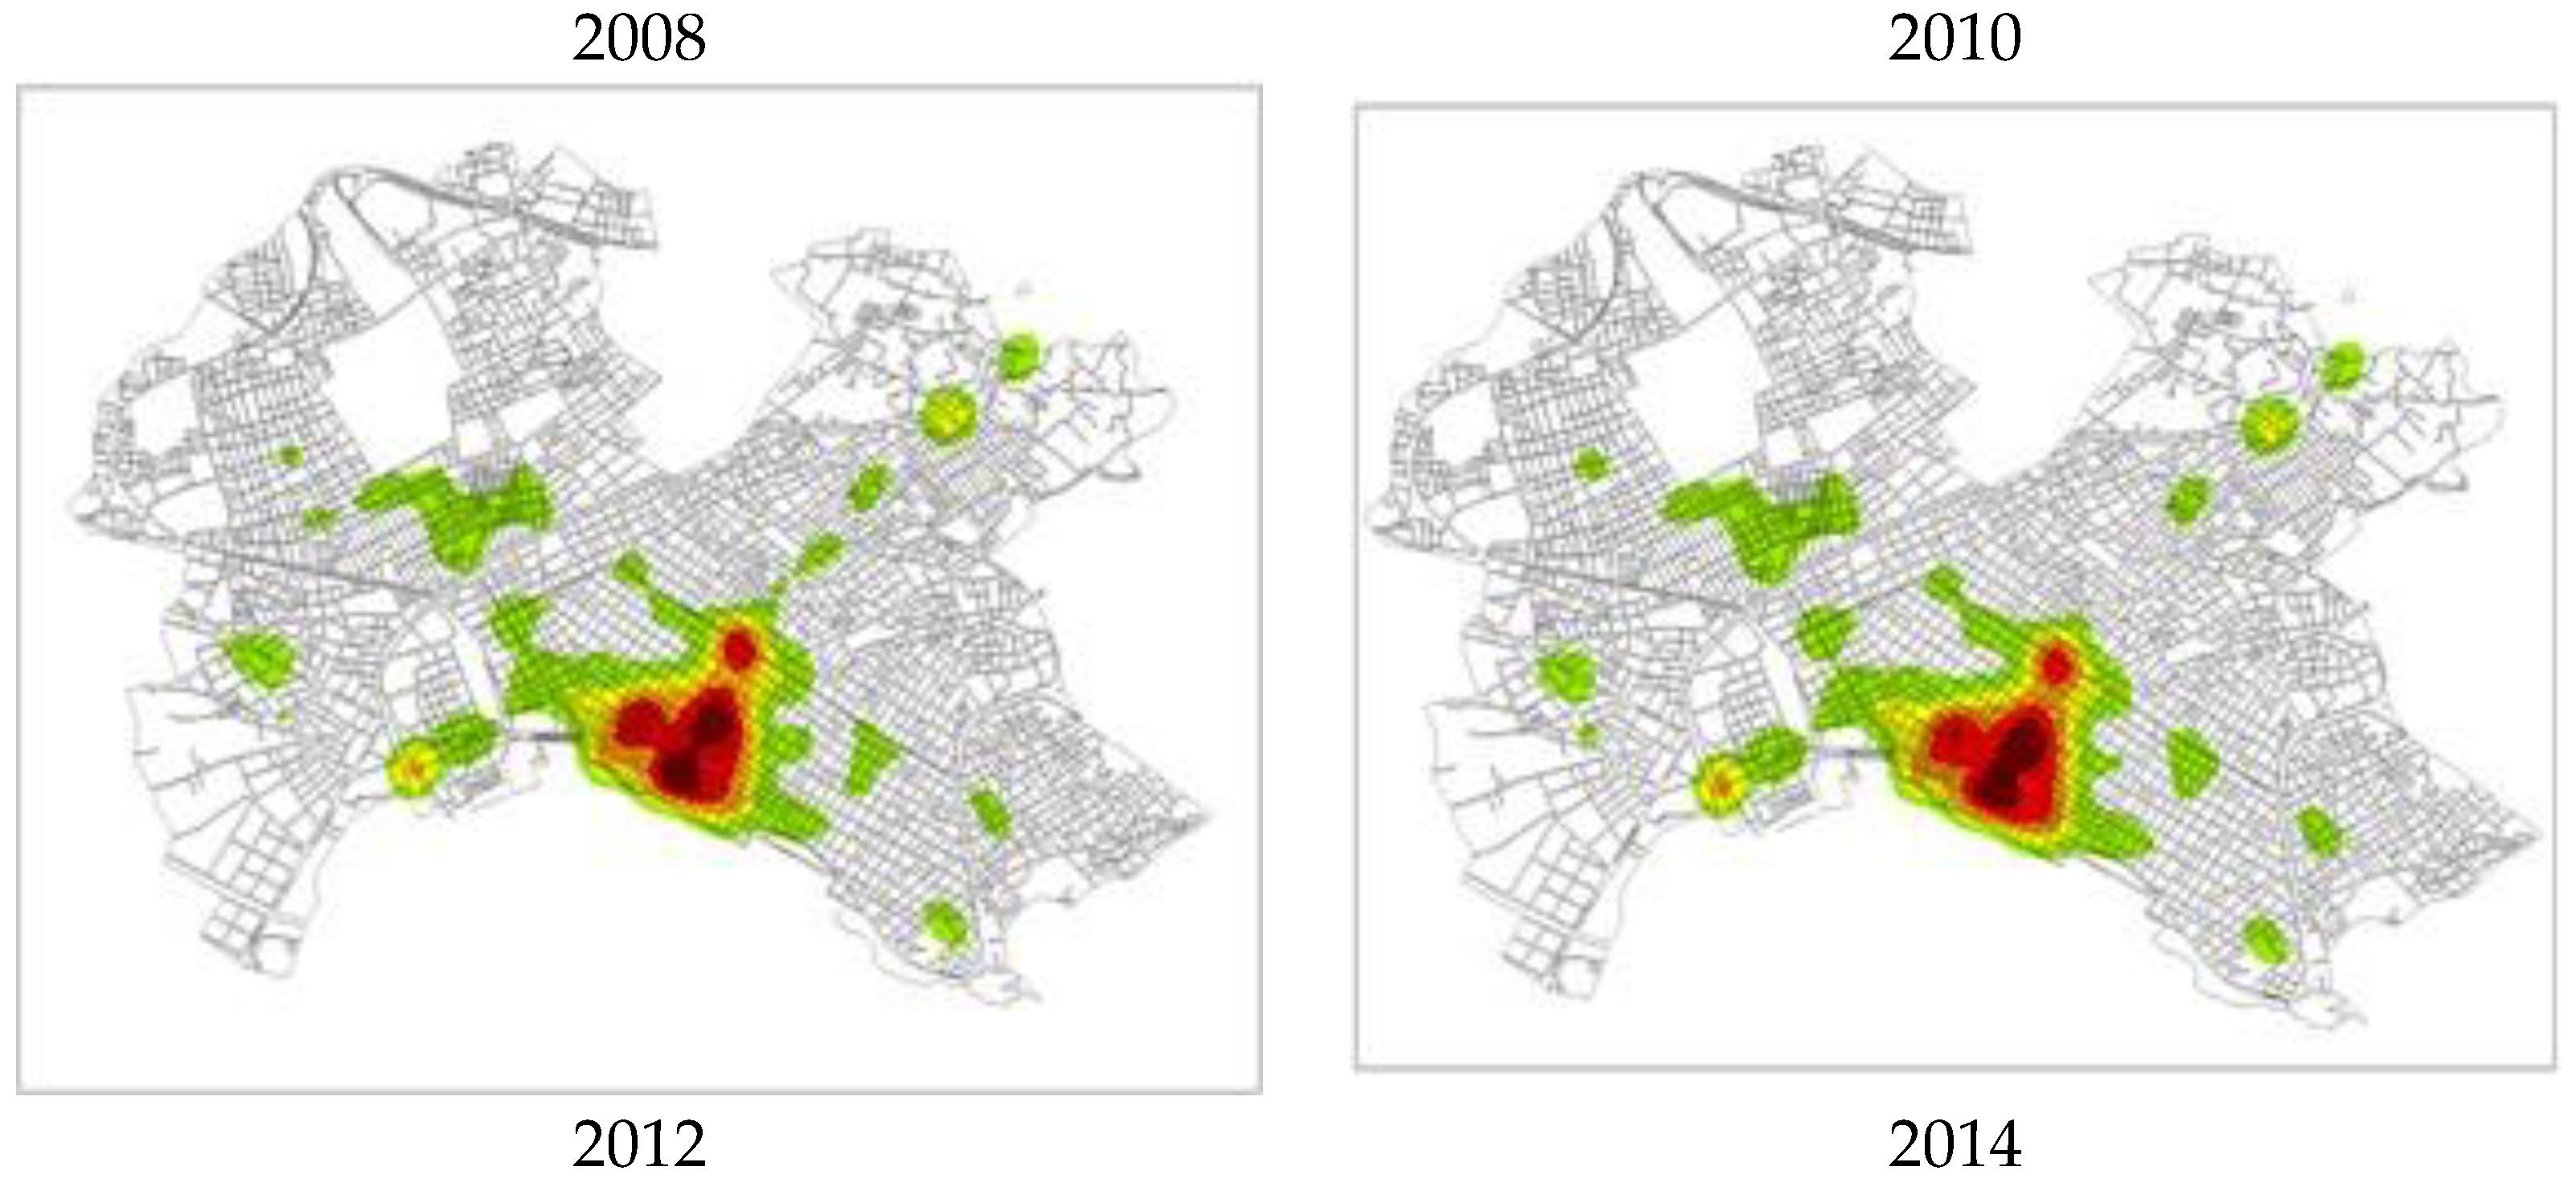
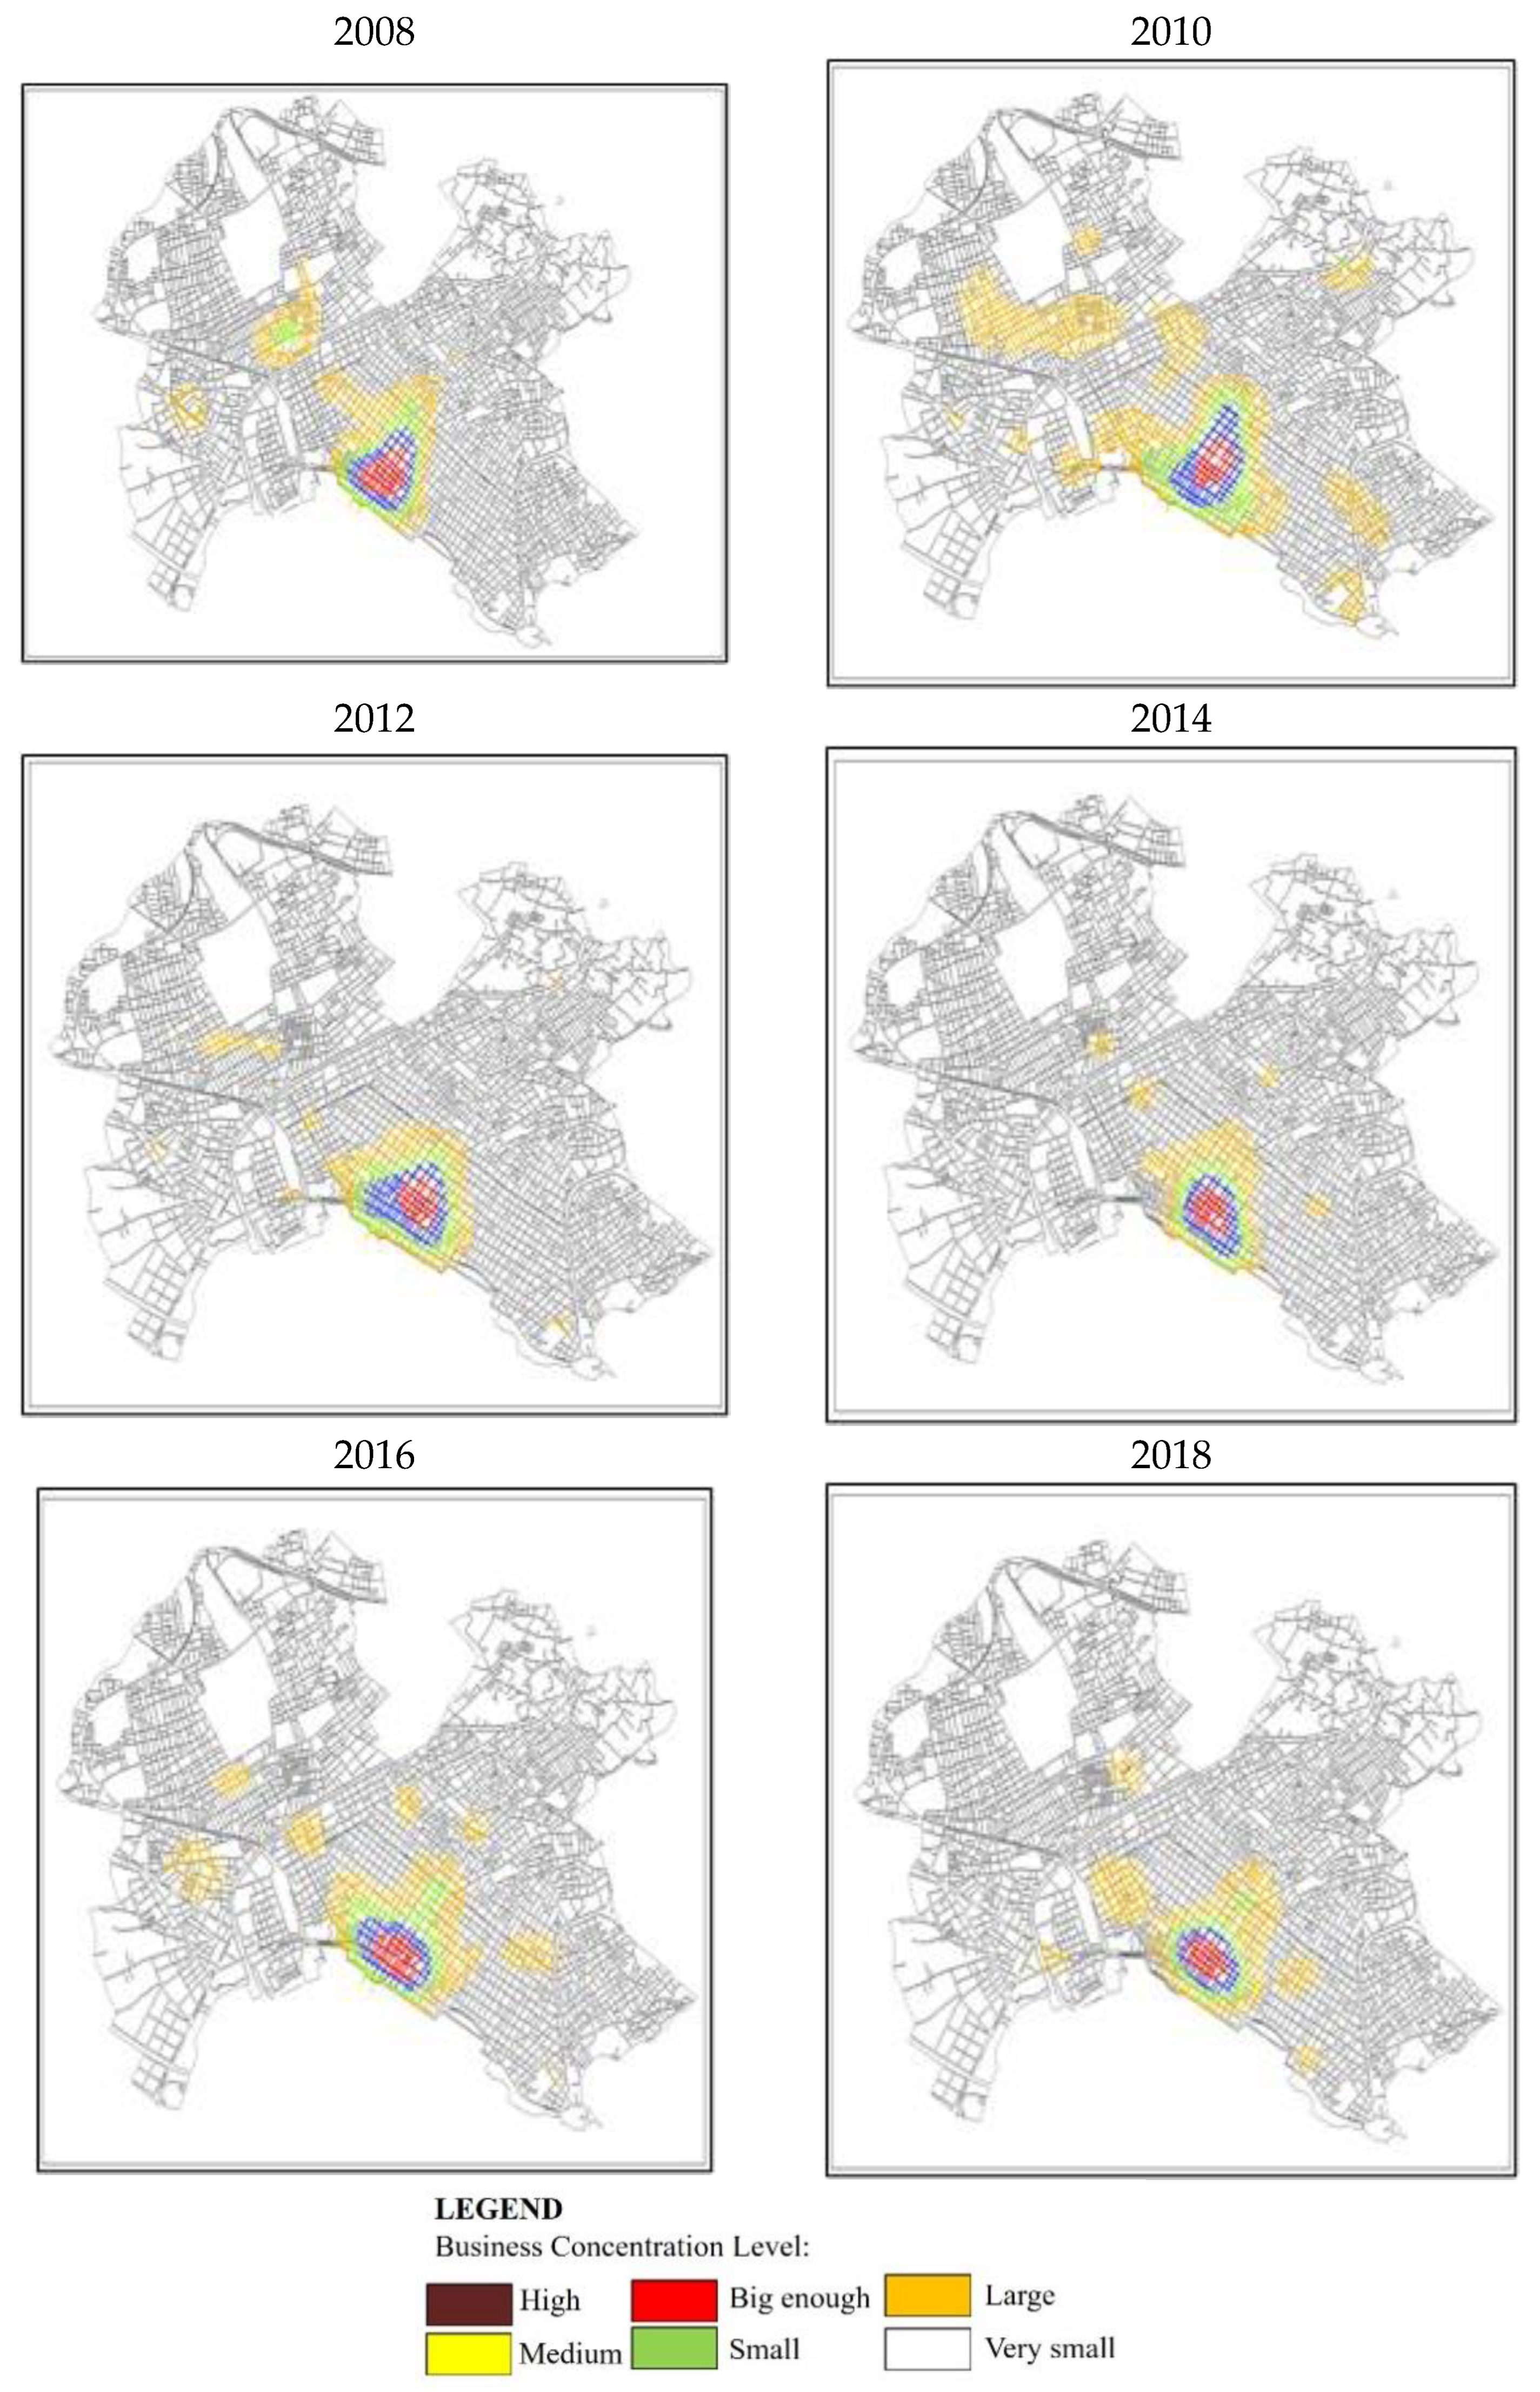
2.3. Network-Based Kernel Density Estimation Method

The network-based kernel density estimation (NKDE) method is an extension of KDE. This method estimates the intensity of points in a network according to a density function in each bandwidth (h). Instead of a planar Euclidean distance measure, bandwidth represents the shortest path distance [41].
This topological relationship of the line elements in the network is examined to avoid overestimation of the density. It can also help to improve computational efficiency. For this reason, KDE is introduced to normalise the evaluation results [38]. Thus, the network density estimation based on the network is defined by the Equation (9):
k ( x ) = { K ( x x i h ) / ( ( n 1 1 )   ( n 2 1 ) ( n s 1 ) ) ,   x x i h ,   0 , x x i > h
It is necessary to emphasise that when it comes to choosing the bandwidth ( h ) between the network density estimation method based on network (NKDE) and the kernel density estimation method (KDE), there is a difference in how the NKDE method is based on the network distance—i.e., the distance of the shortest path in a network—while the KDE method is based on the Euclidean distance [42].
In this paper, this method is mainly based on KDE, as its results are used to categorise roads based on the concentration of economic activities in the area. Because human activities within urban areas are constrained by the layout of the road network, this particular variant of KDE based on network distance (i.e., KDE network) is more suitable for calculating economic activities [43].

3. Study Area

The city of Volos is in the centre of Greece, close to and of equal distance from the two major urban centres of the country, Athens and Thessaloniki, and is a small-to-medium sized urban centre. Geographically, it belongs to central mainland Greece, in the region of Thessaly, while also representing the largest urban centre of Magnesia. The main features that distinguish it from other urban centres are the existence of a port, intense industrial activity (which was even more intense in the past), the presence of the University of Thessaly, and tourist development due not only to the rich natural and cultural heritage of the wider area, but also of Pelion in particular.
The economic identity of Volos is reflected through the GDP index/resident of the regional unit of Magnesia. According to the Figure 1., the regional unit of Magnesia follows a downward trend from 2009 until 2014, and then has a small increase, after which it remains relatively stable until 2017. Still, compared to the corresponding index, the regional unit of Magnesia appears to be almost €5000/inhabitant below the whole country.
Thus, the selection of Volos was based on three criteria:
  • The city of Volos is characterised by the typical morphology of modern Greek cities, a result of the patterns of housing development that prevailed in post-war Greece; andis arranged based on the Hippodamian or grid plan.
  • Volos is of an average population size vis-à-vis the Greek data, with a permanent population equal to 86,046, whilethe entire Urban Complex of Volos (including Nea Ionia) amounts to 118,707 inhabitants according to the 2011 census [44], a city thus representing the largest number of Greek cities except for Athens, Thessaloniki and Piraeus.
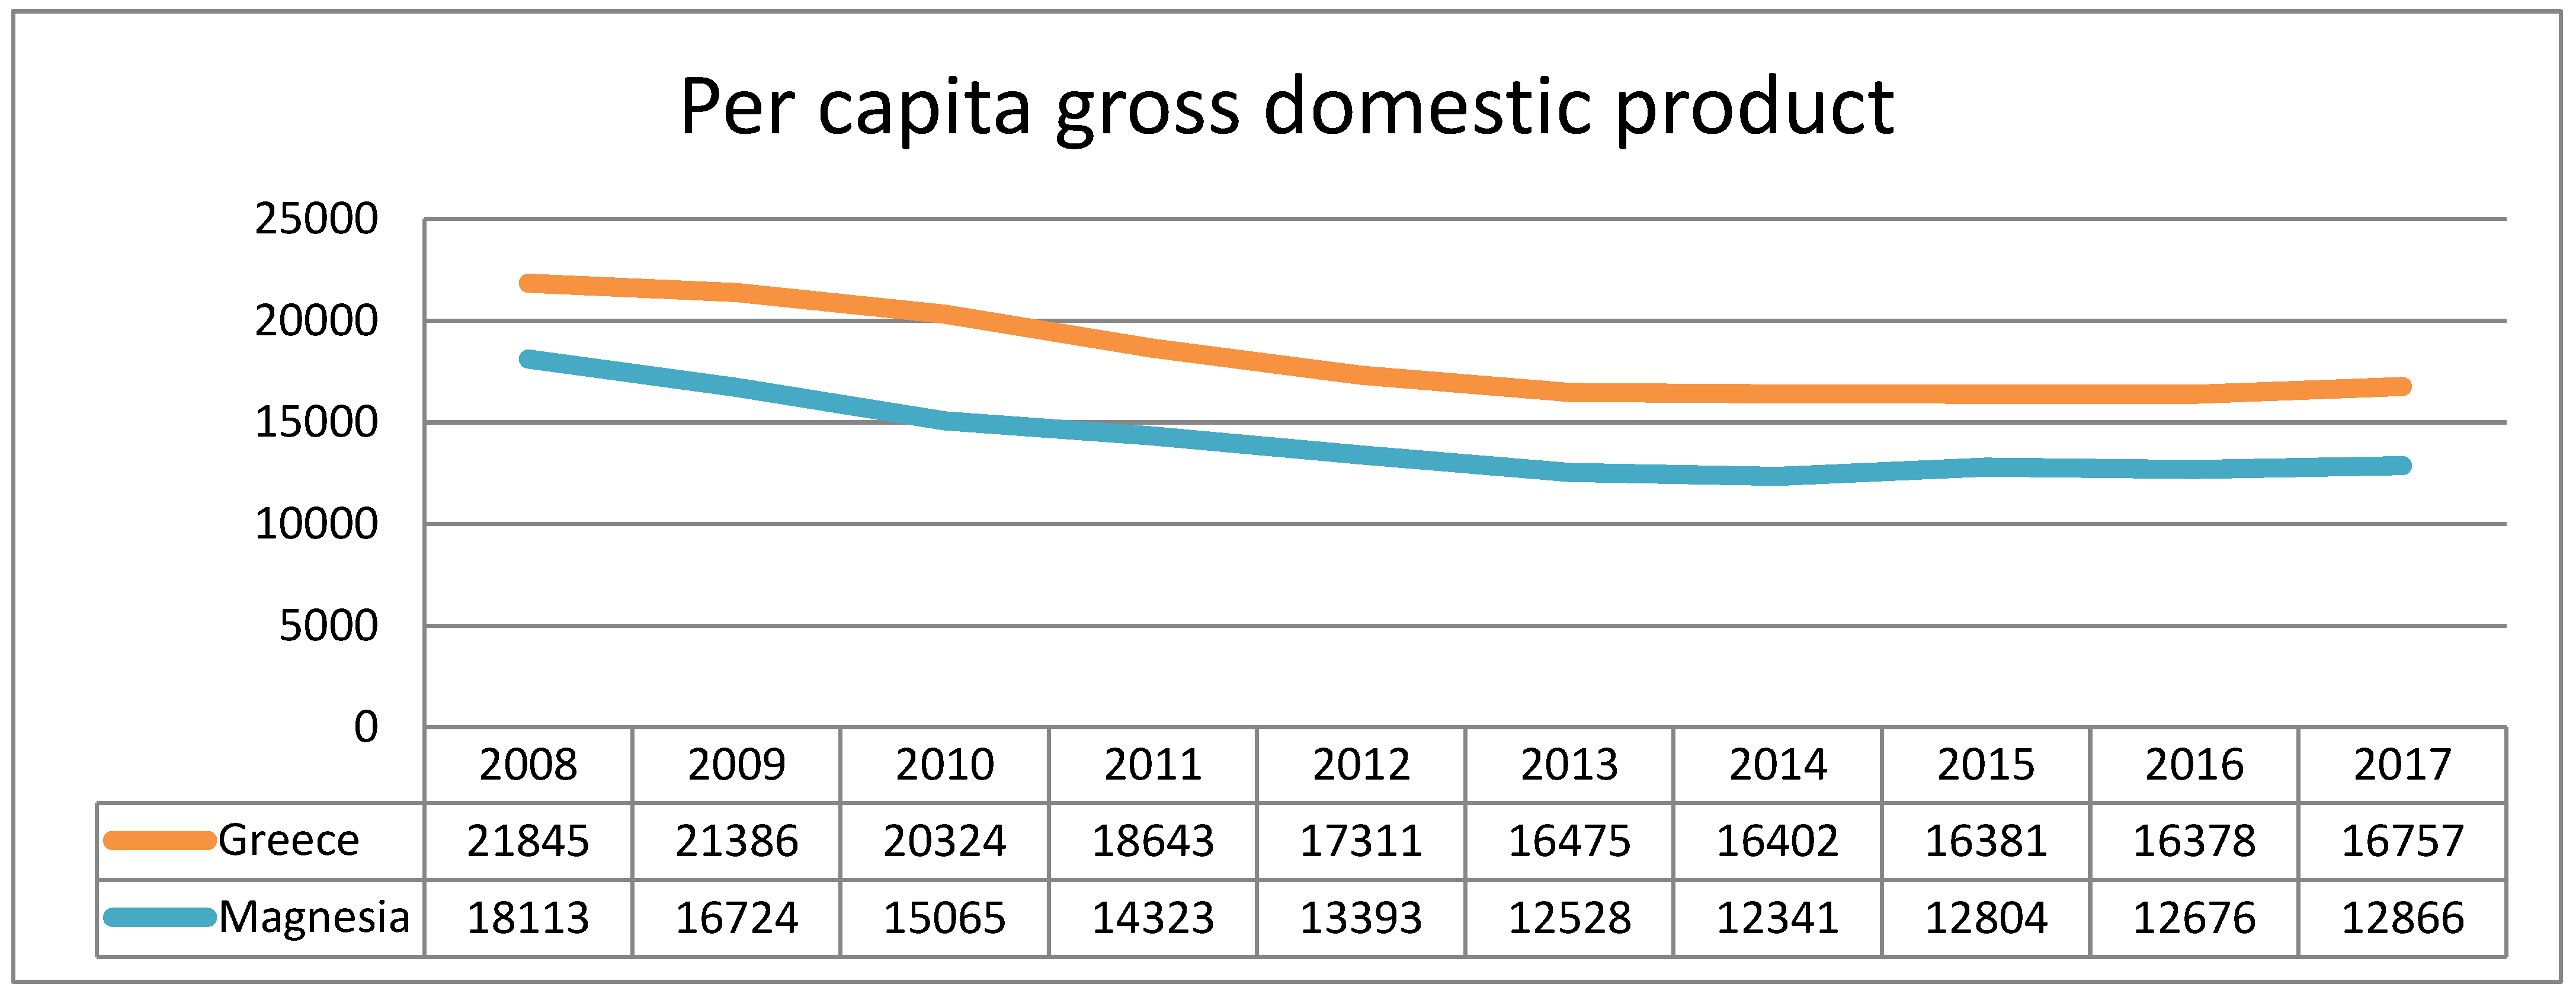
  • The economic crisis left its spatial footprint on the municipality of Magnesia and caused transformations in the economic field. More specifically, 40% of businesses established in this Regional Unit in the decade 2008–2018 have not survived [45]. This highlights the need to investigate the spatial behavior of businesses.

4. Data Sources and Data Categorization

Our data comes from the Chamber of Magnesia in Volos. Chamber of Magnesia is a chamber of commerce located in the city of Volos in the country of Greece. The data concern companies that were based in the settlement of Volos during the period from 1 January 2008 to 31 December 2018. Because 2008 is the year when the effects of the financial crisis were not yet visible in the commercial landscape of the city, as shown in the previous diagram, the picture of this year (financially) can be the basis for time monitoring and comparison.
Data regarding land use was categorised based on the Statistical Classification of the Sectors of Economic Activity (STAKOD) that has been valid since 2008. According to the working hypotheses, the companies operating within the city of Volos had been selected and also possessed a specific legal status (e.g., individual, anonymous, limited liability, general partnership, cooperatives). The companies of the branches presented in Table 1 (Branches that either present to a very small extent in the study area, therefore do not need to be studied, or branches that depend on the state so have a different approach in choosing their location), as well as those characterised by the legal statuses presented in Table 2 (businesses of legal status which are special and rarer), are excluded from the set of primary data.

5. Results

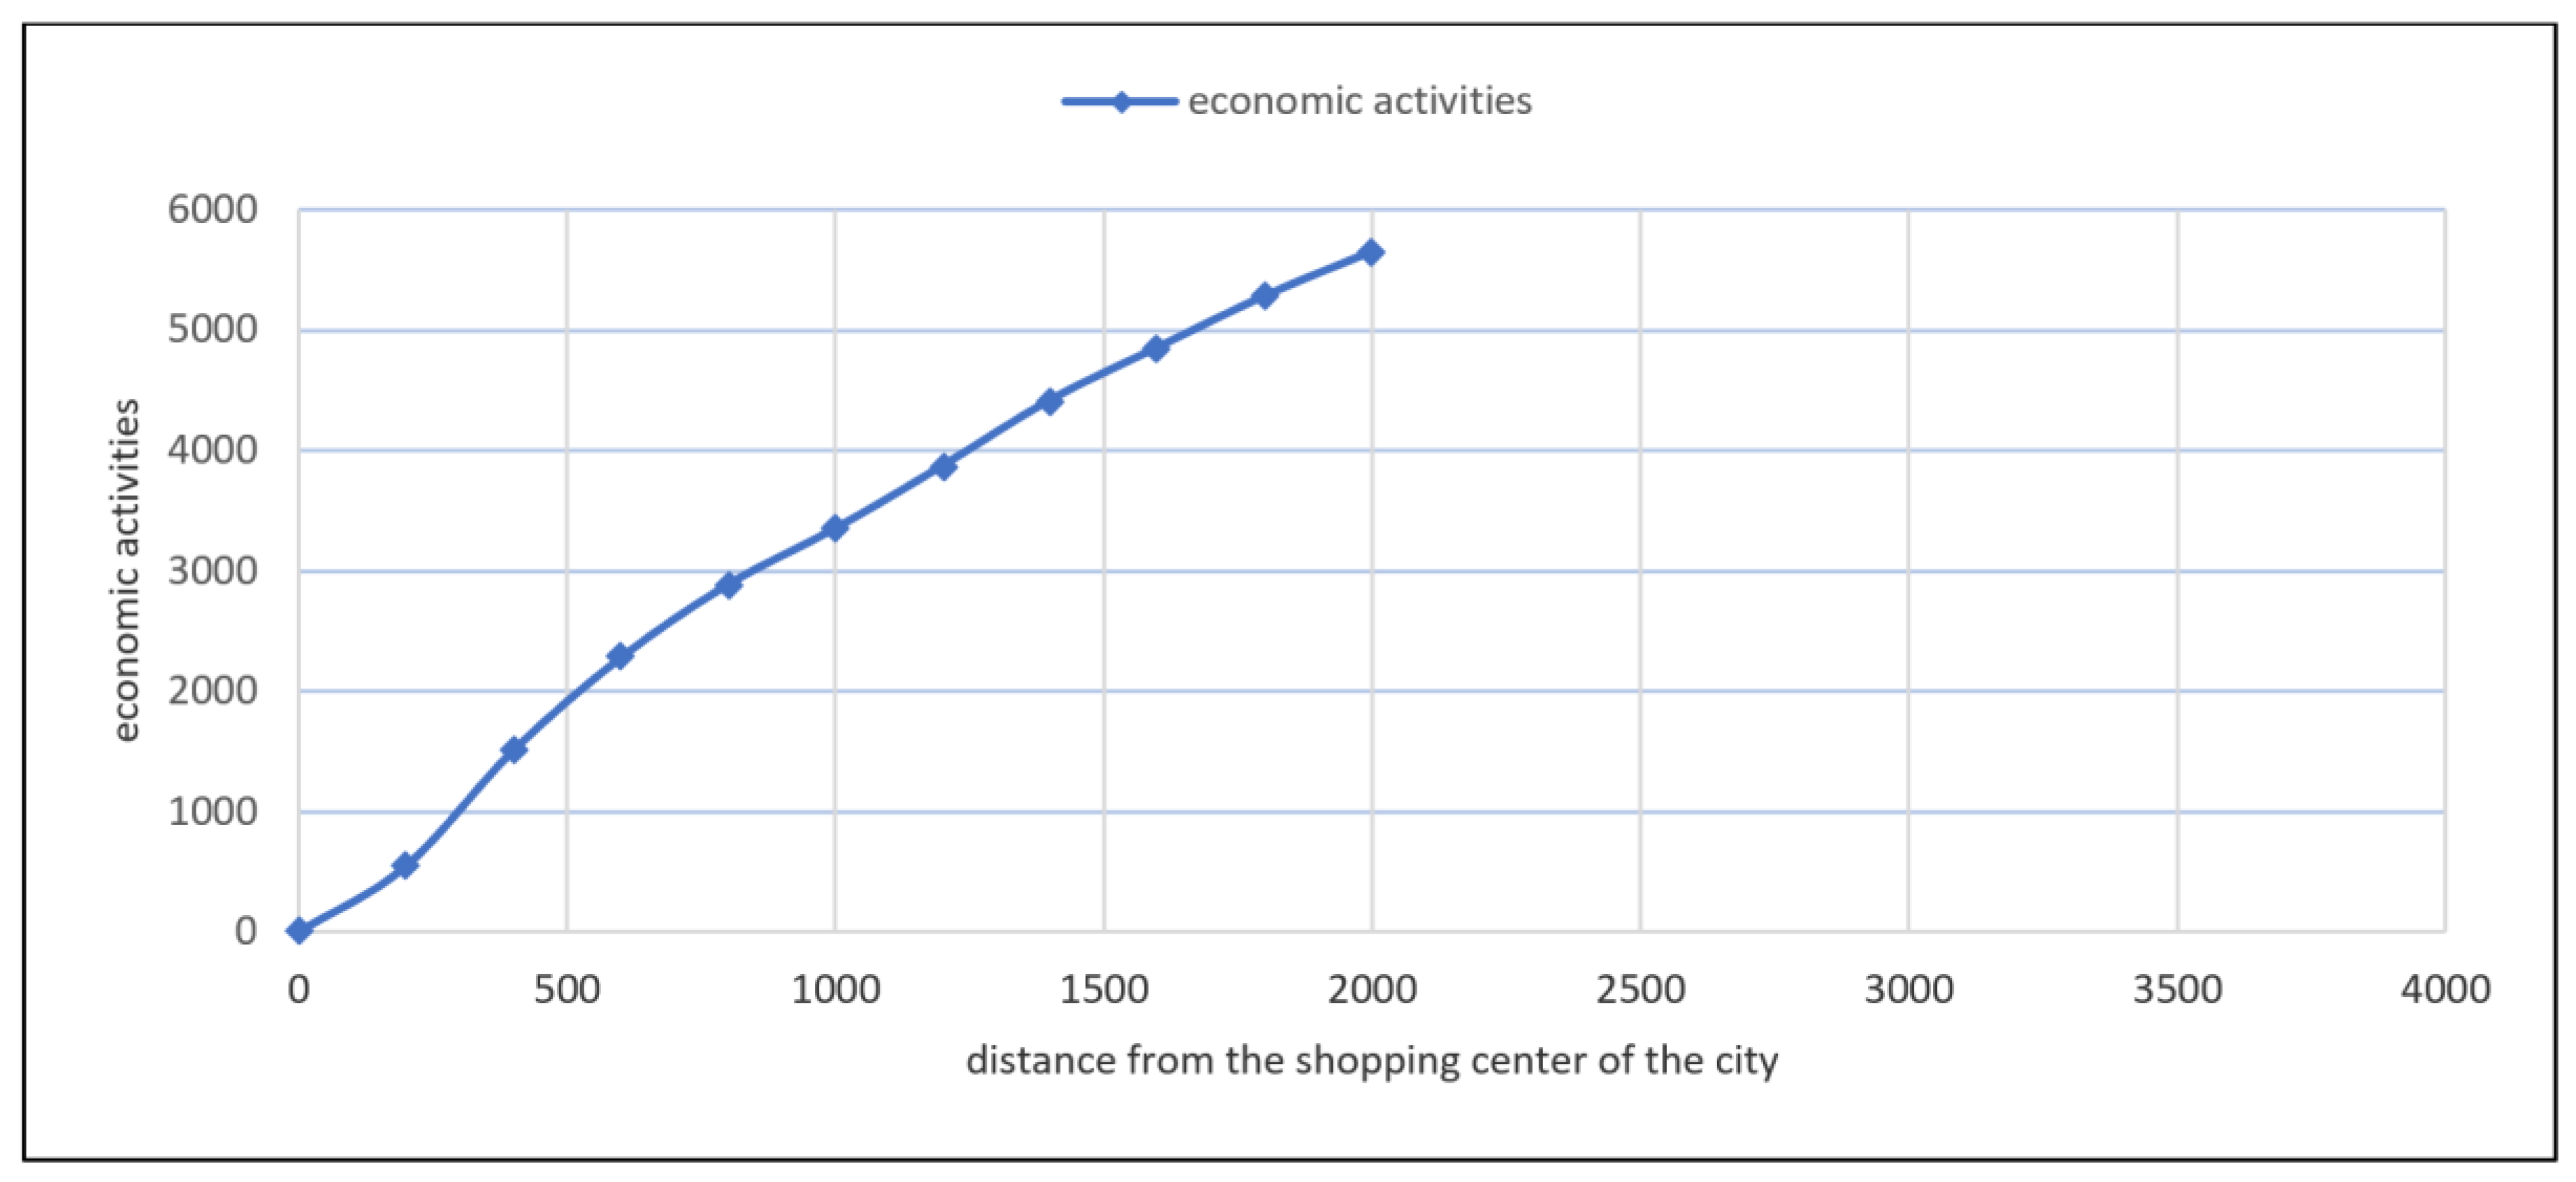
5.1. Cumulative Frequency of Points

The choice of bandwidth (h) is crucial to applying the core estimation methods as mentioned in Section 2. In this paper, we will use Silverman’s Rule of Thumb [37] to select the bandwidth, where the only requirement is that the distribution is normal. To show that the distribution is normal, we will use the cumulative frequency of points in order to define the point where the shopping centre of the city is located (Agios Nikolaos), and we will measure every 200 m the total points that are in this range. This will be done for 2 km from the centre area, as shown in Figure 2.
According to the above (and Figure 3), it is clear that since the points in the city of Volos follow the normal distribution, it is possible to use Silverman’s Rule of Thumb to select the bandwidth.

5.2. Method of Average Nearest Neighbour

According to what was mentioned in Section 5.1, the method of the nearest neighbour will help to answer the question of whether the economic activities in Volos are distributed randomly, scattered or grouped. It is observed that the economic activities are grouped in Volos because the Nearest Neighbour Ratio is less than 1 (z-score = −107,09). Also, the p-value is below 0.05 which means that we can reject the null hypothesis (random distribution) and except that the economic activities are grouped. Moreover, this also means that economic activities are not scattered within the urban fabric, and thus concentration economies are created (Figure 4, Figure 5 and Figure 6). Where they occur, concentration economies create many businesses of the same or different industries, as well as high employment. There is therefore a pattern that leads economic activities to be concentrated both in specific places.

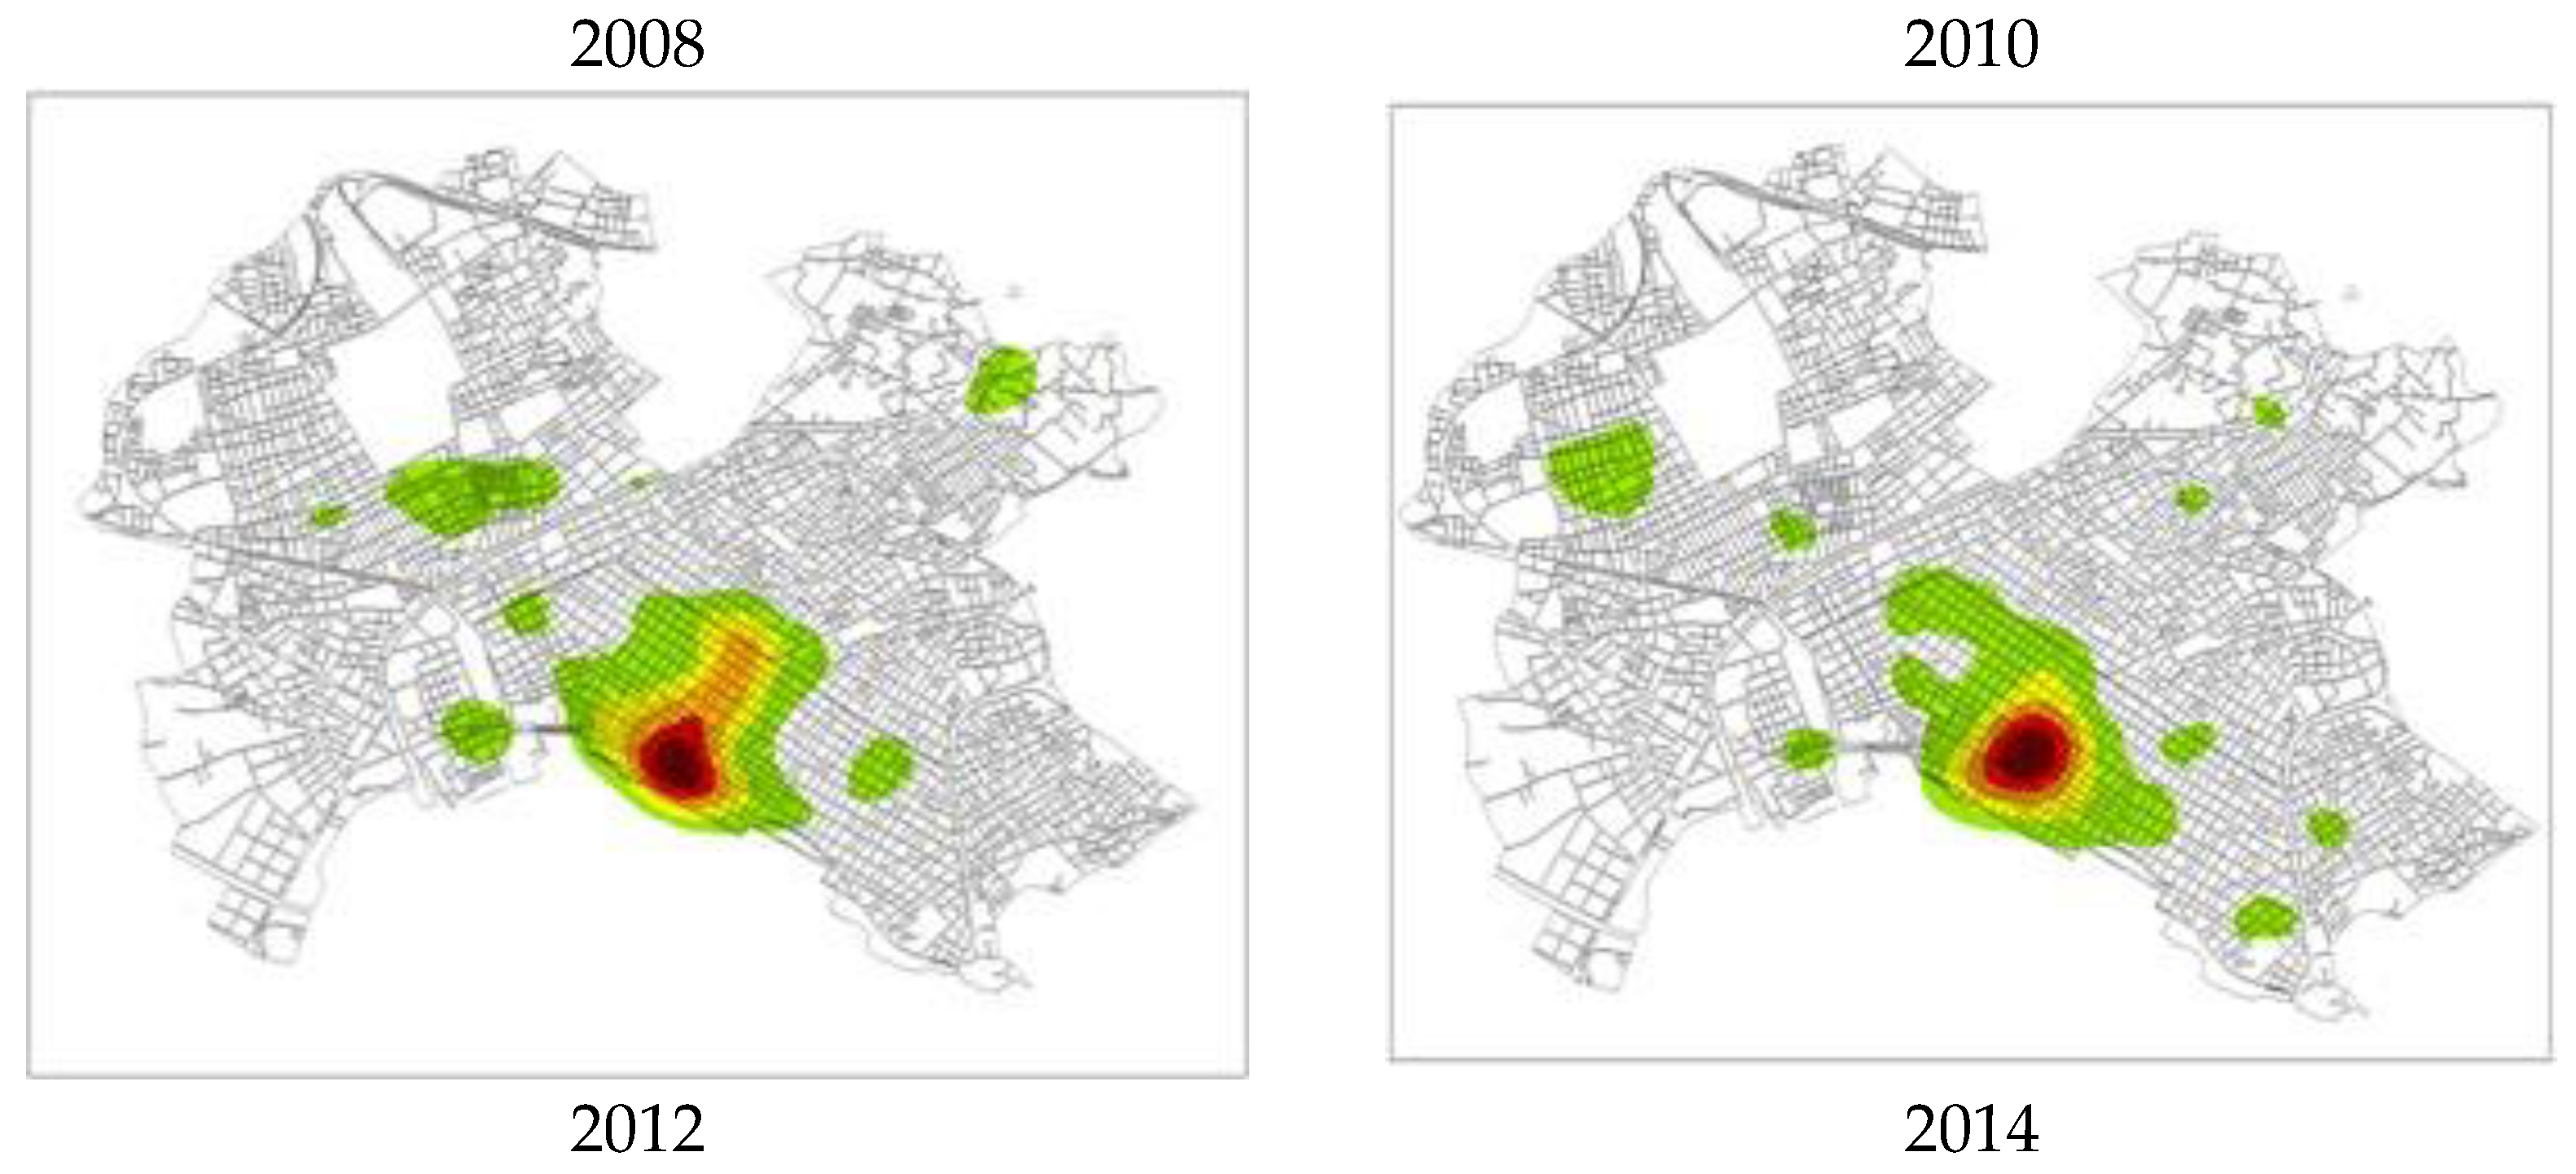
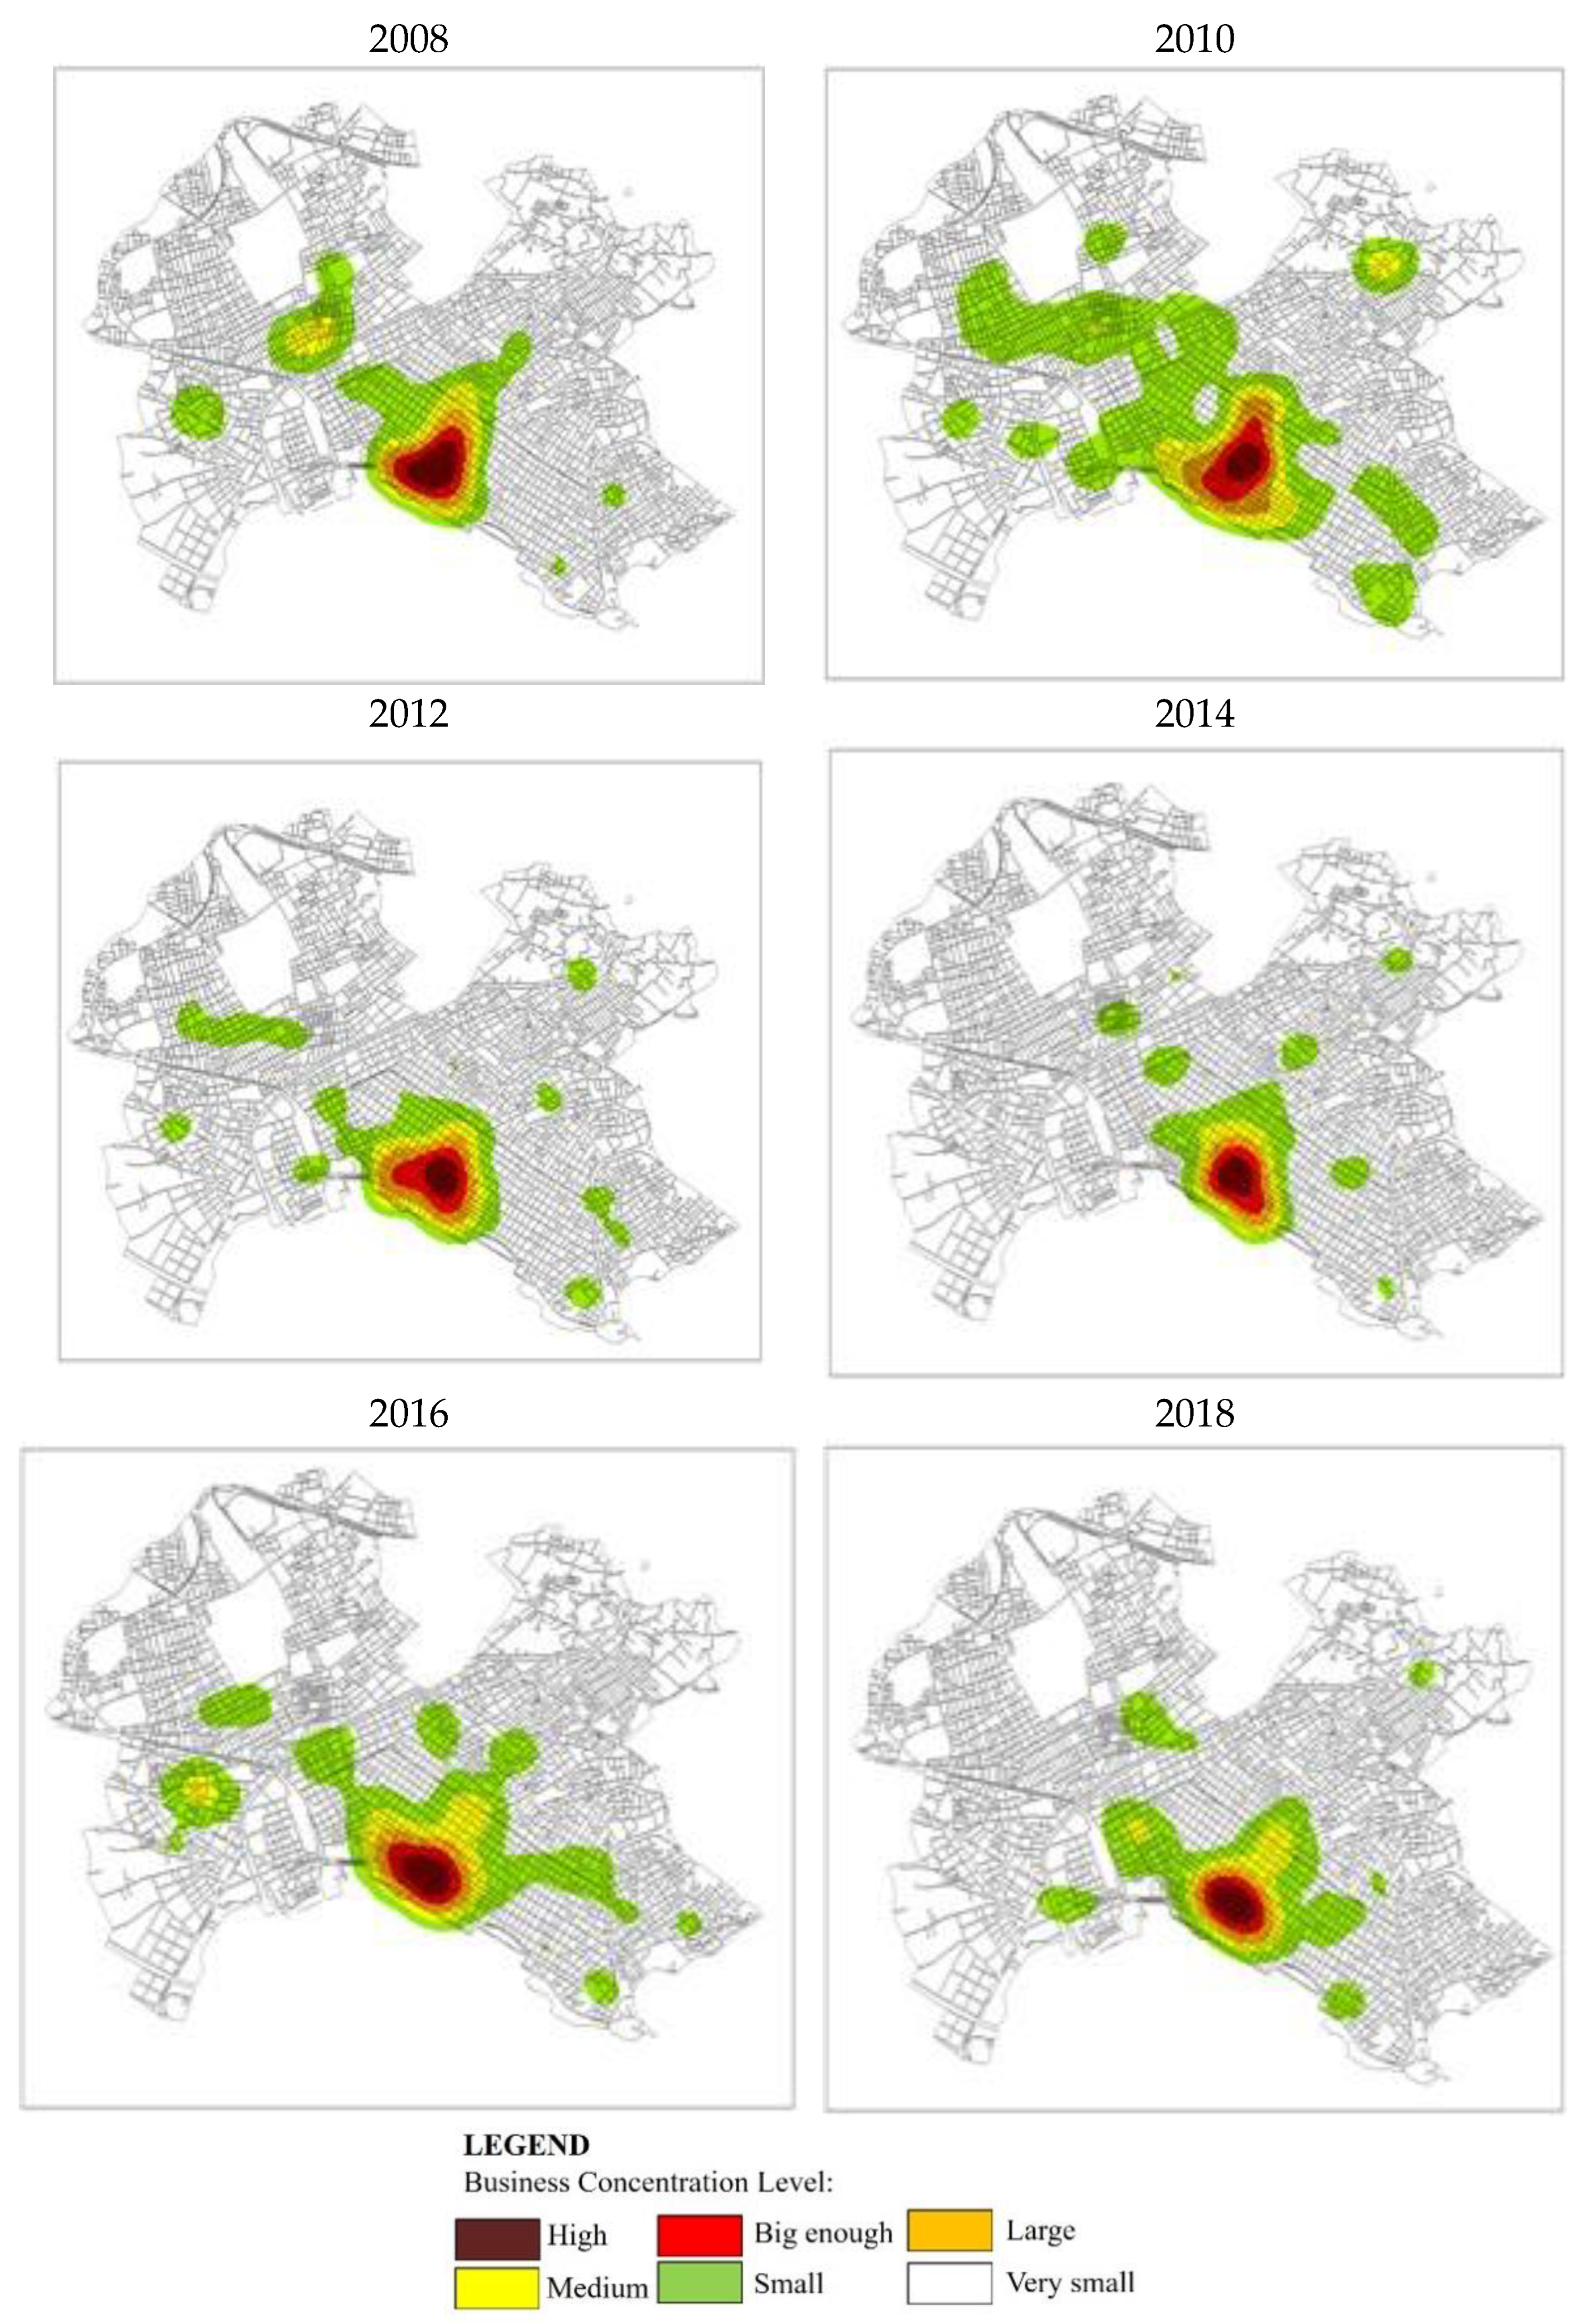
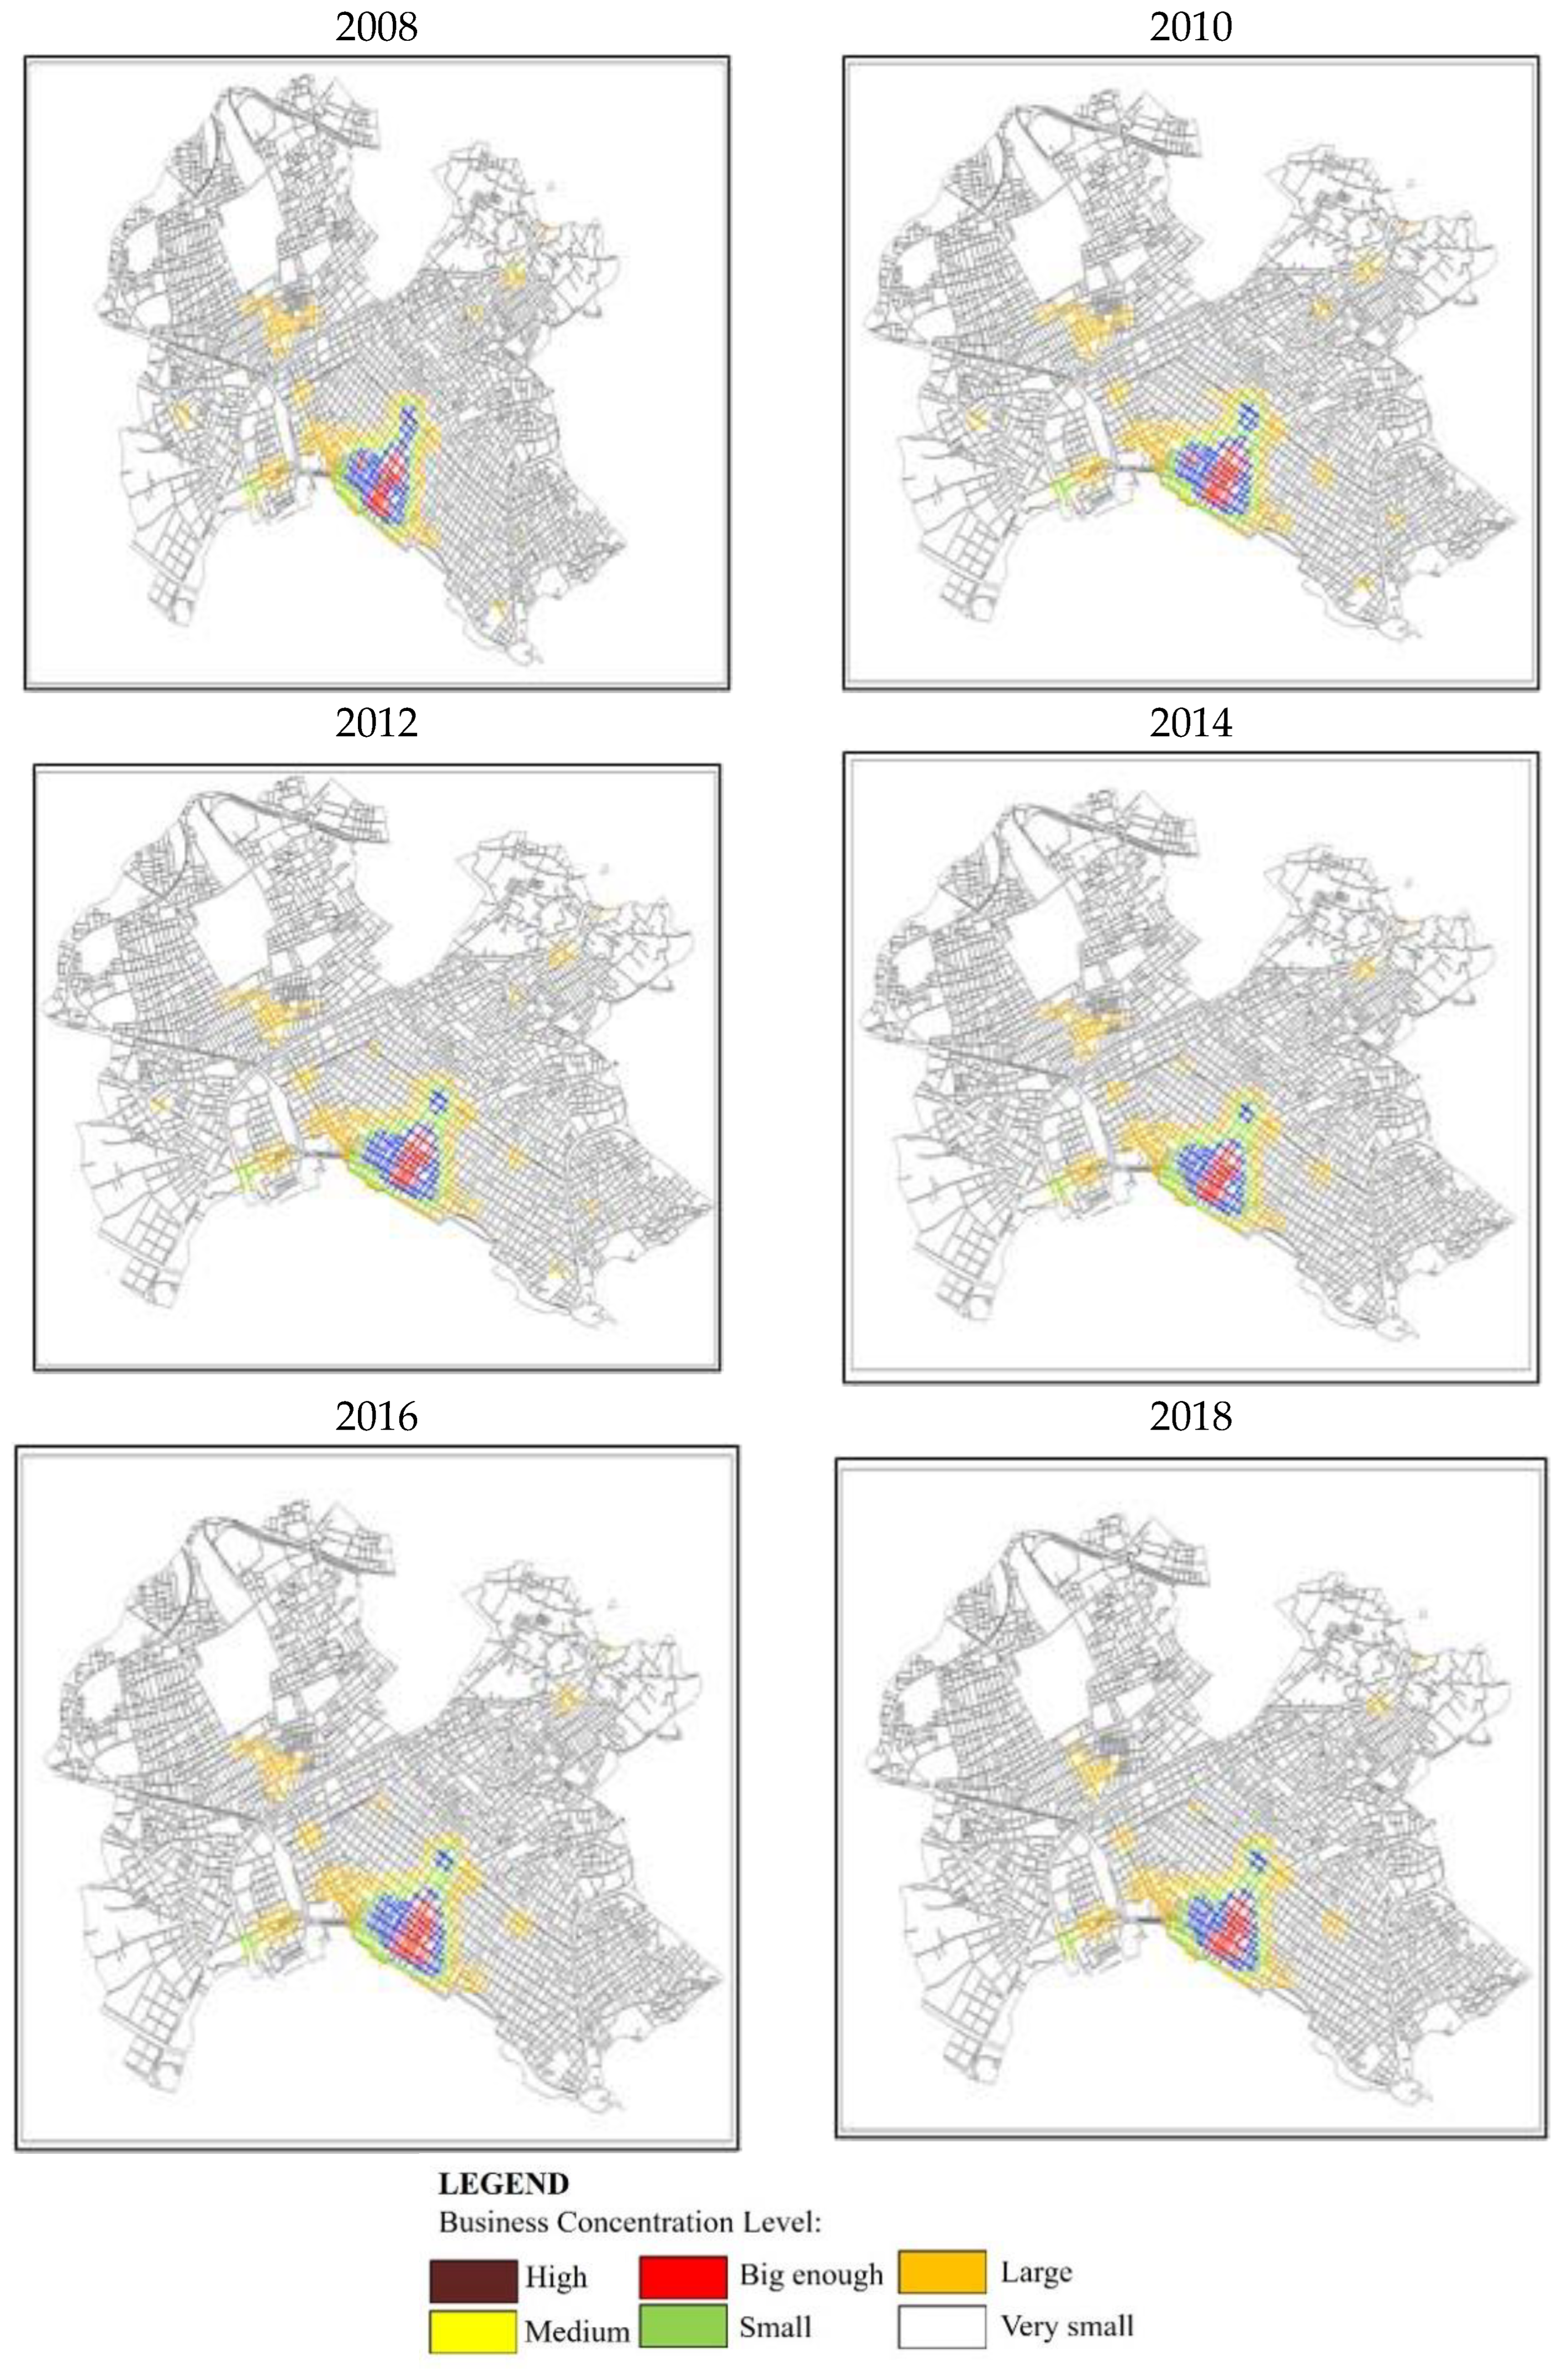
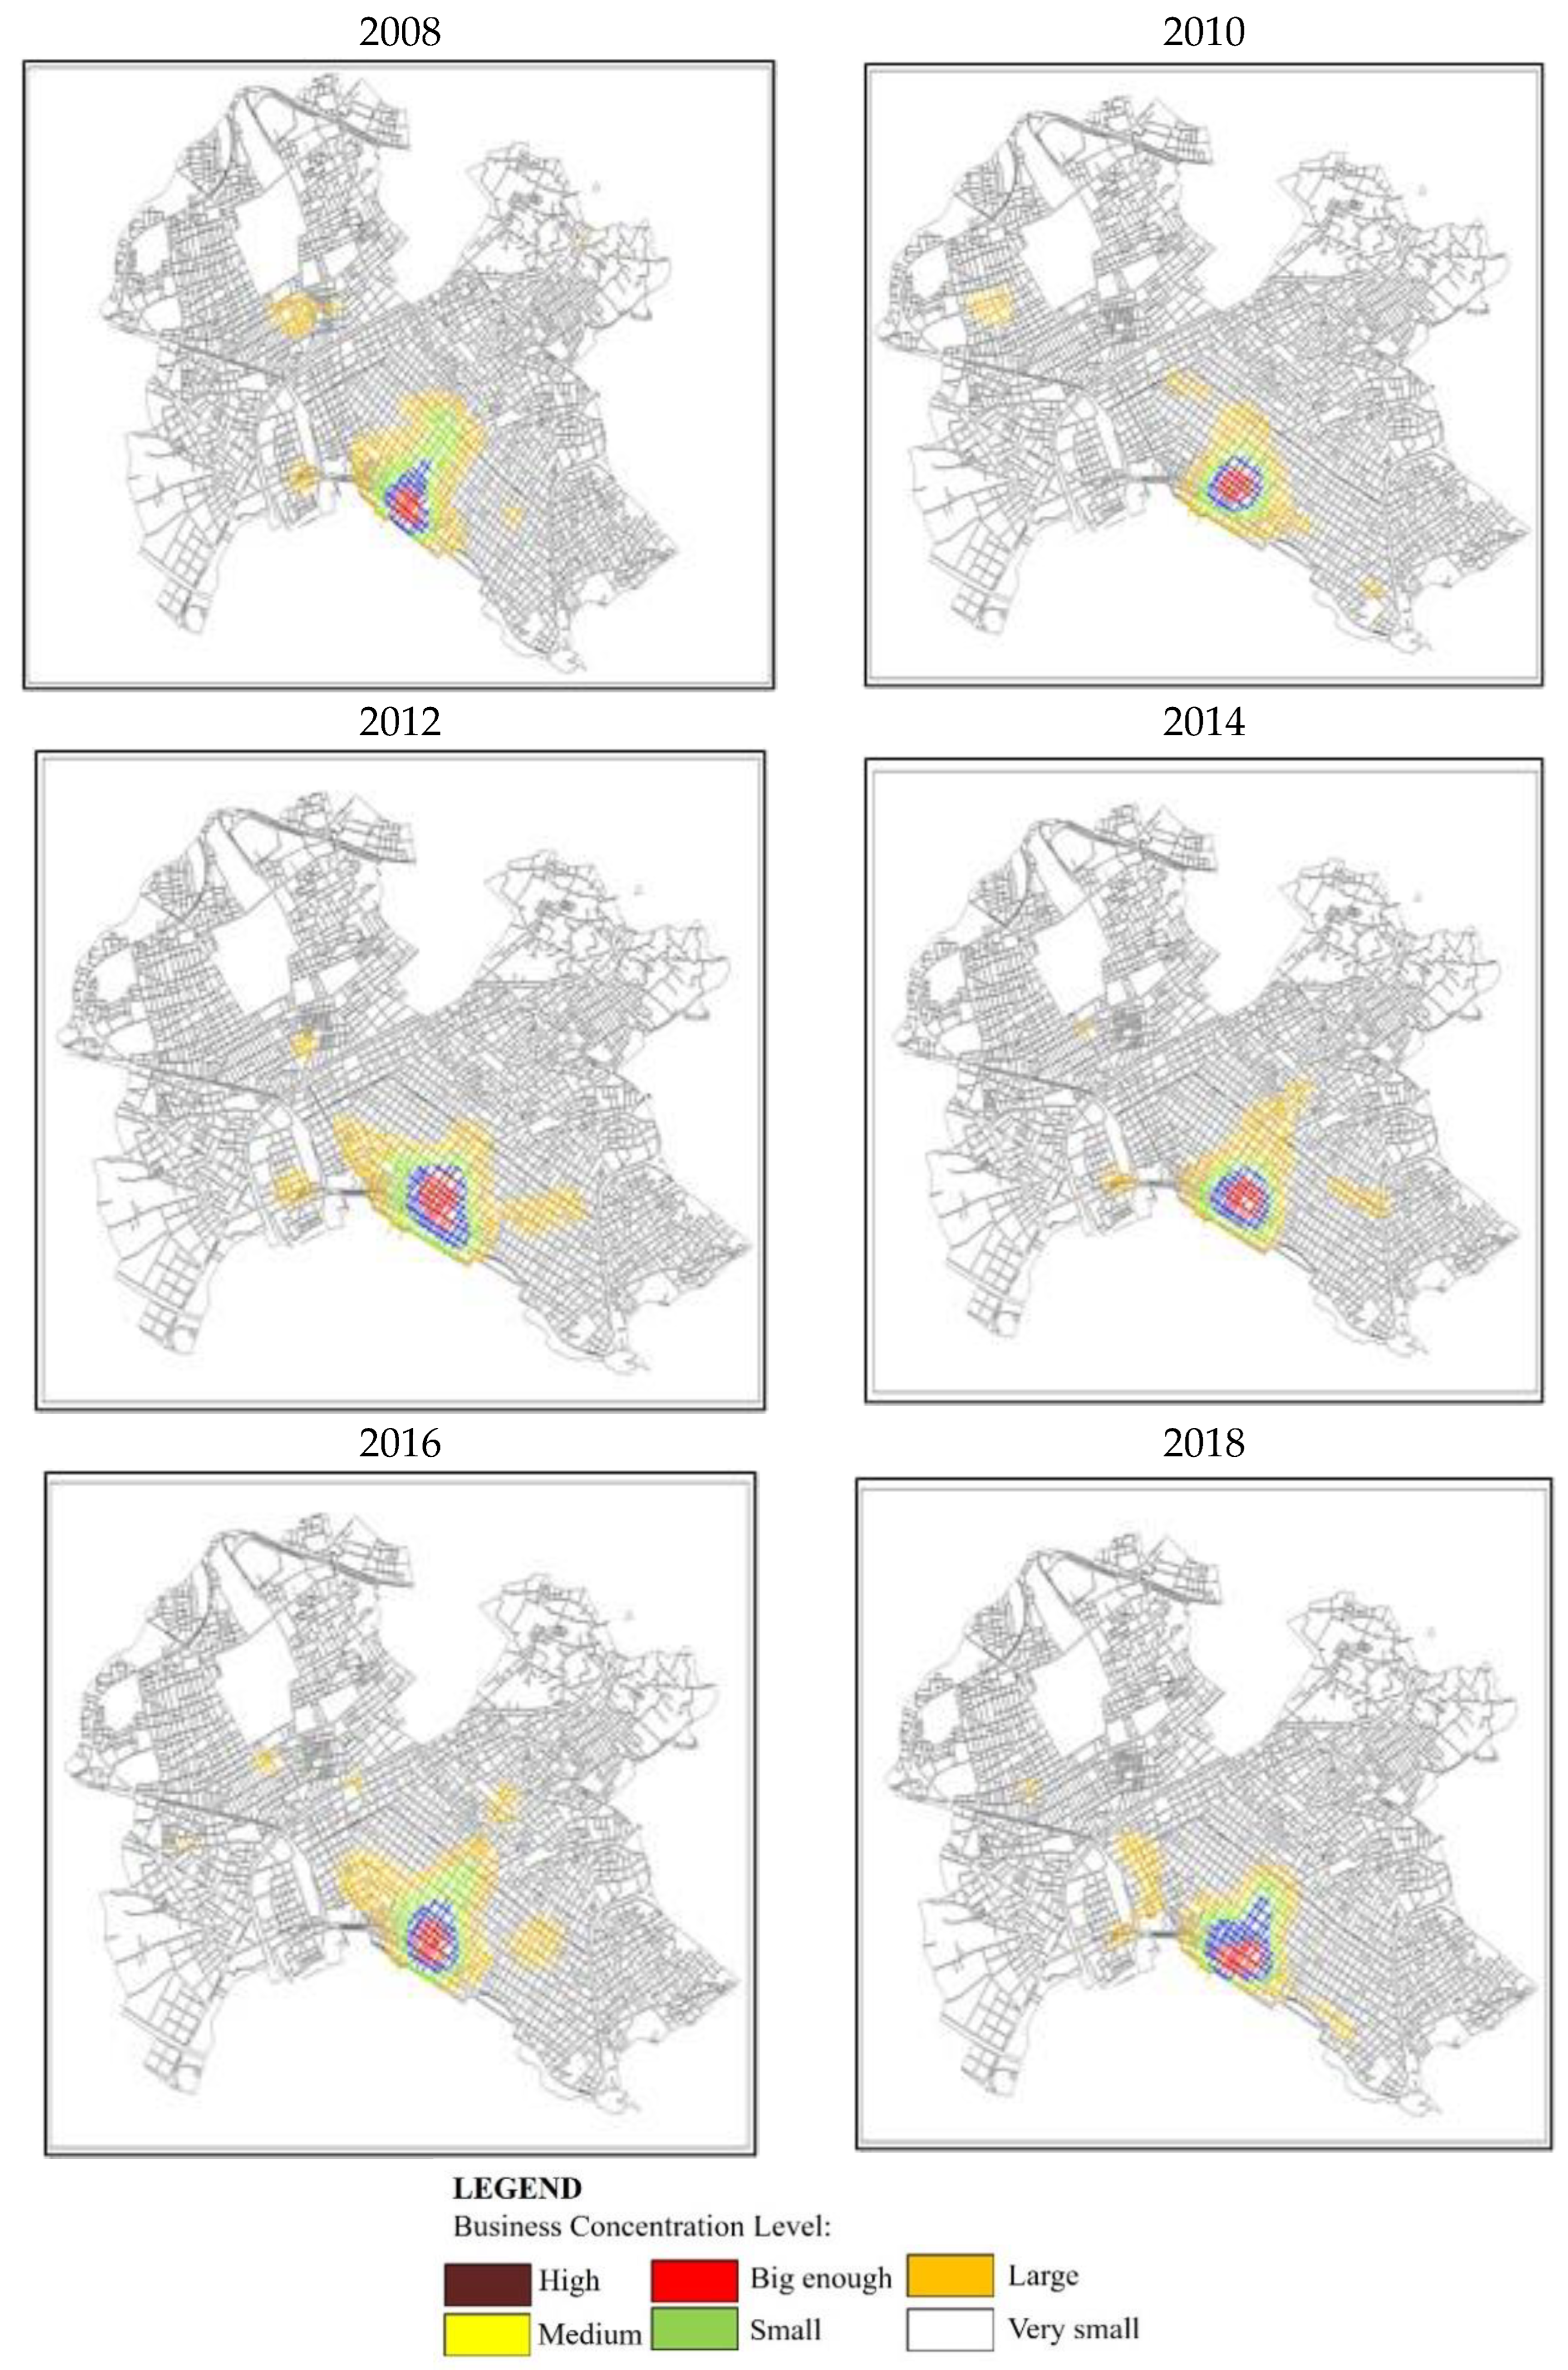
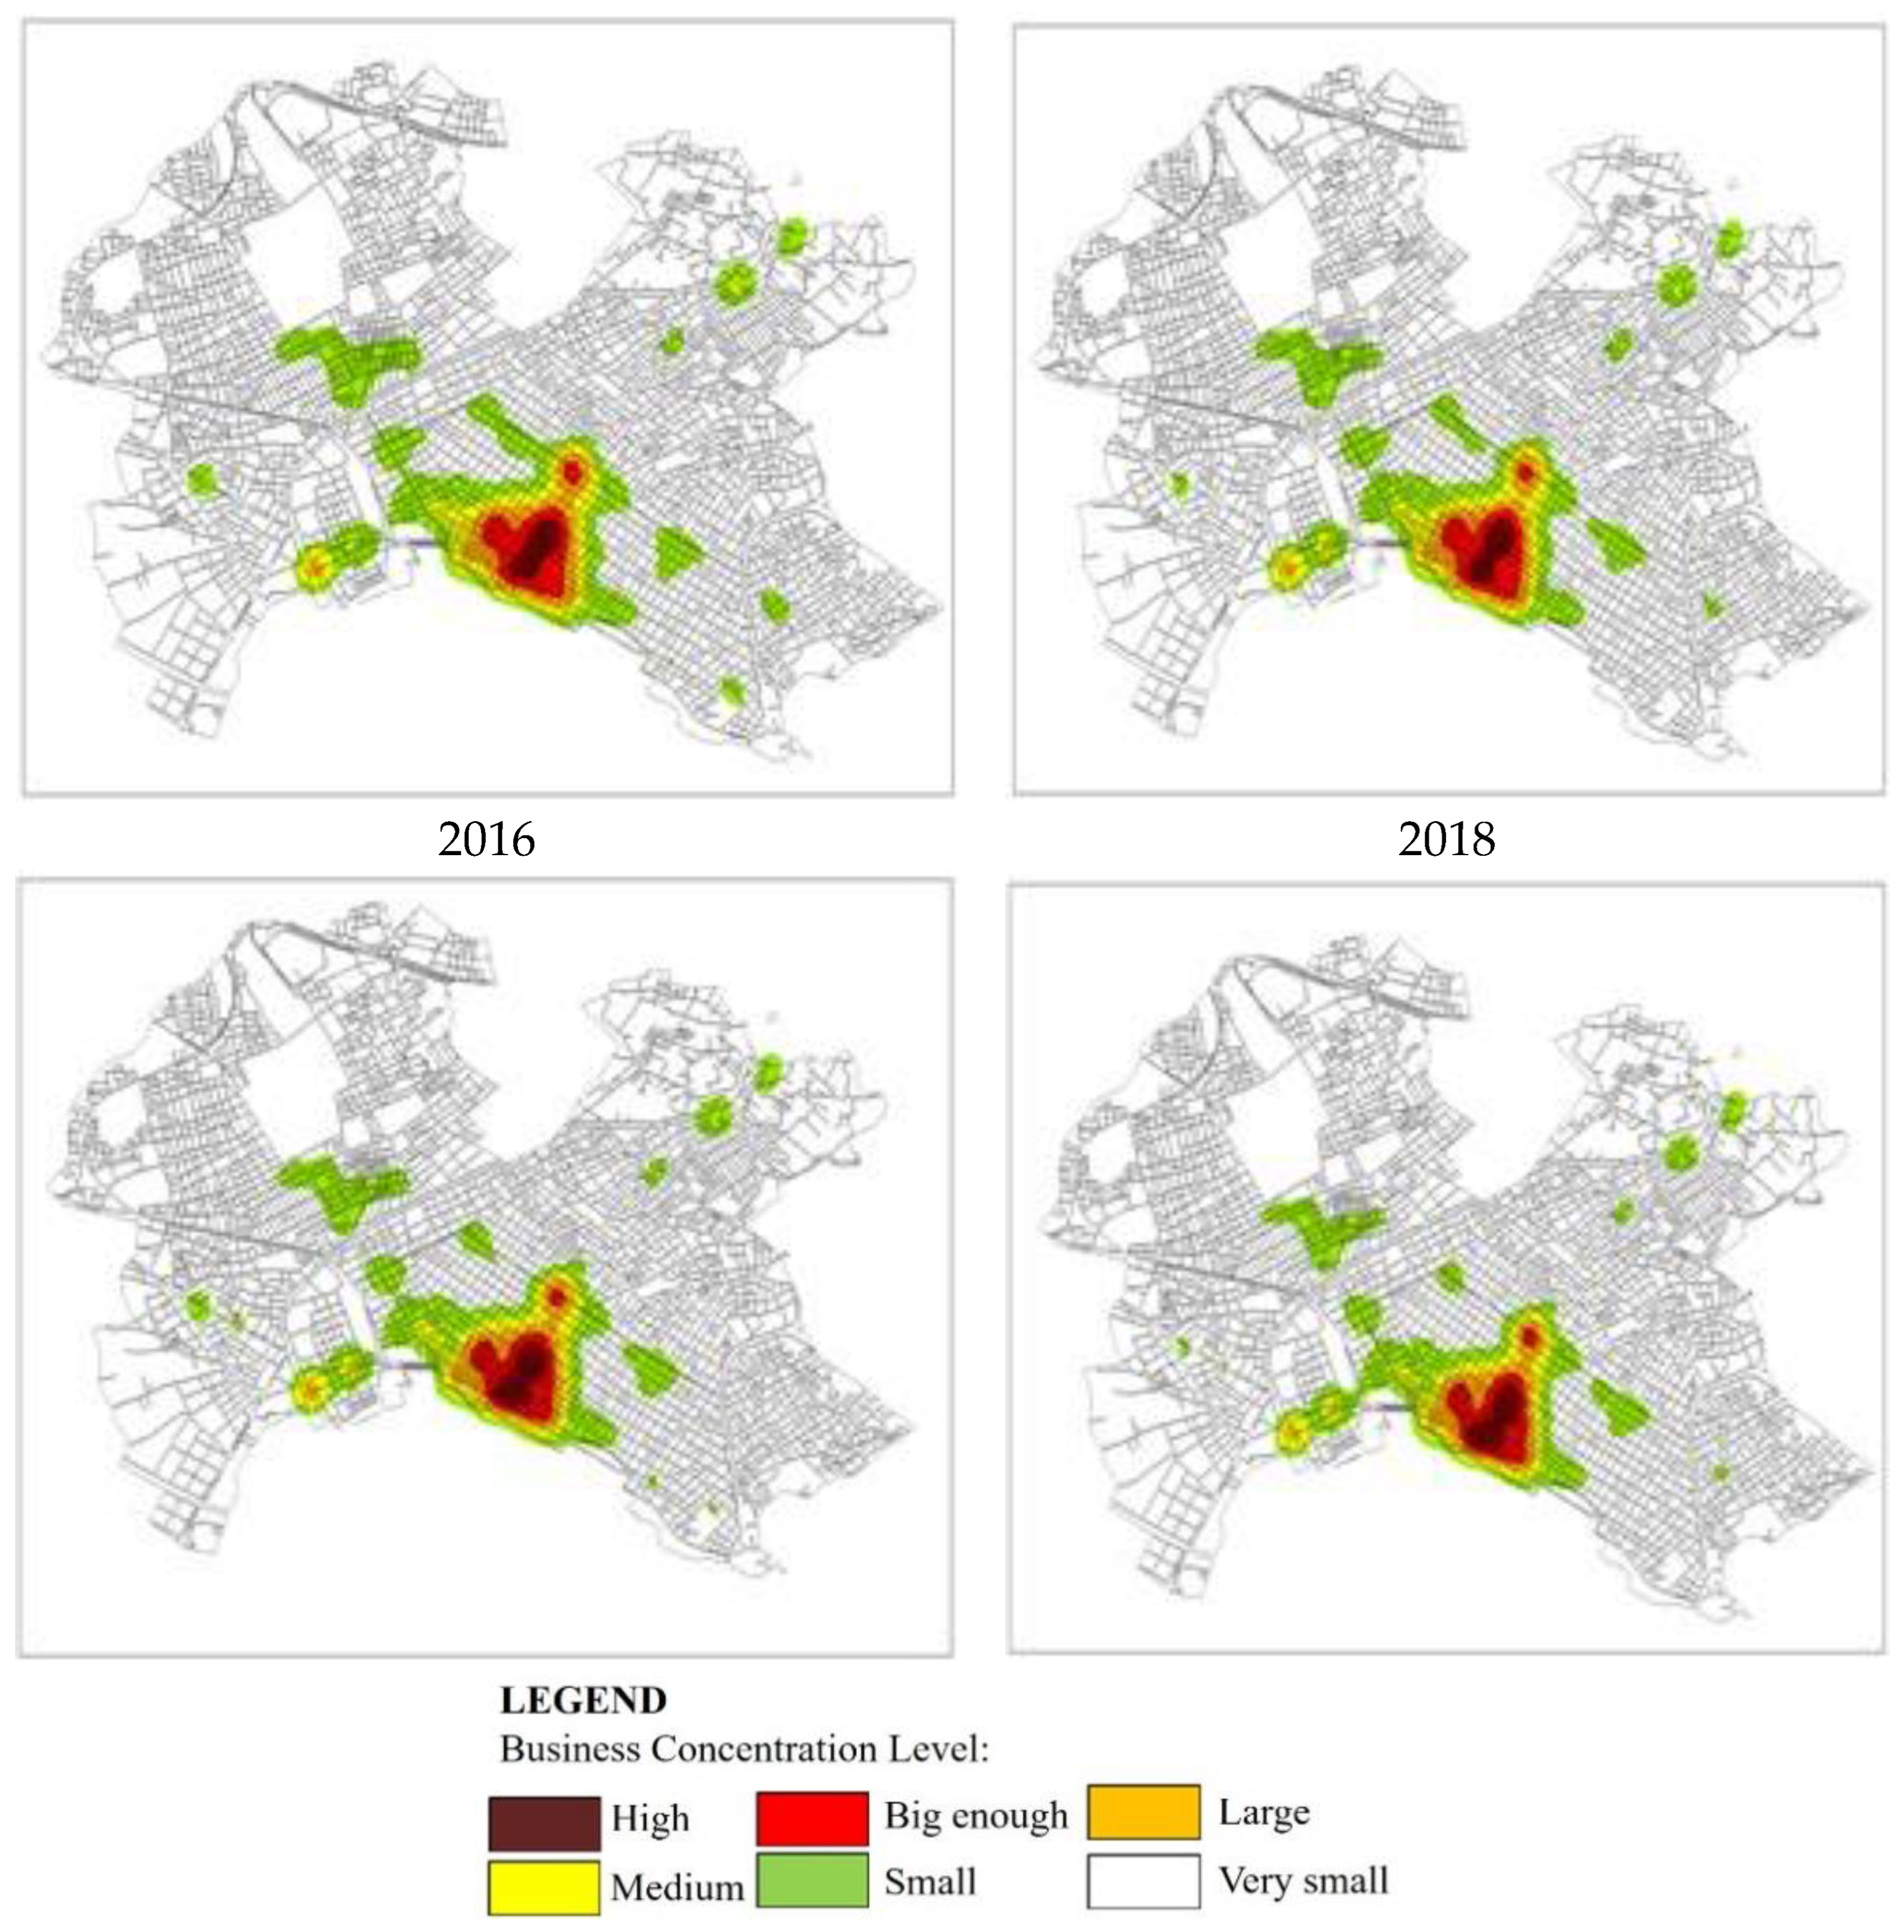
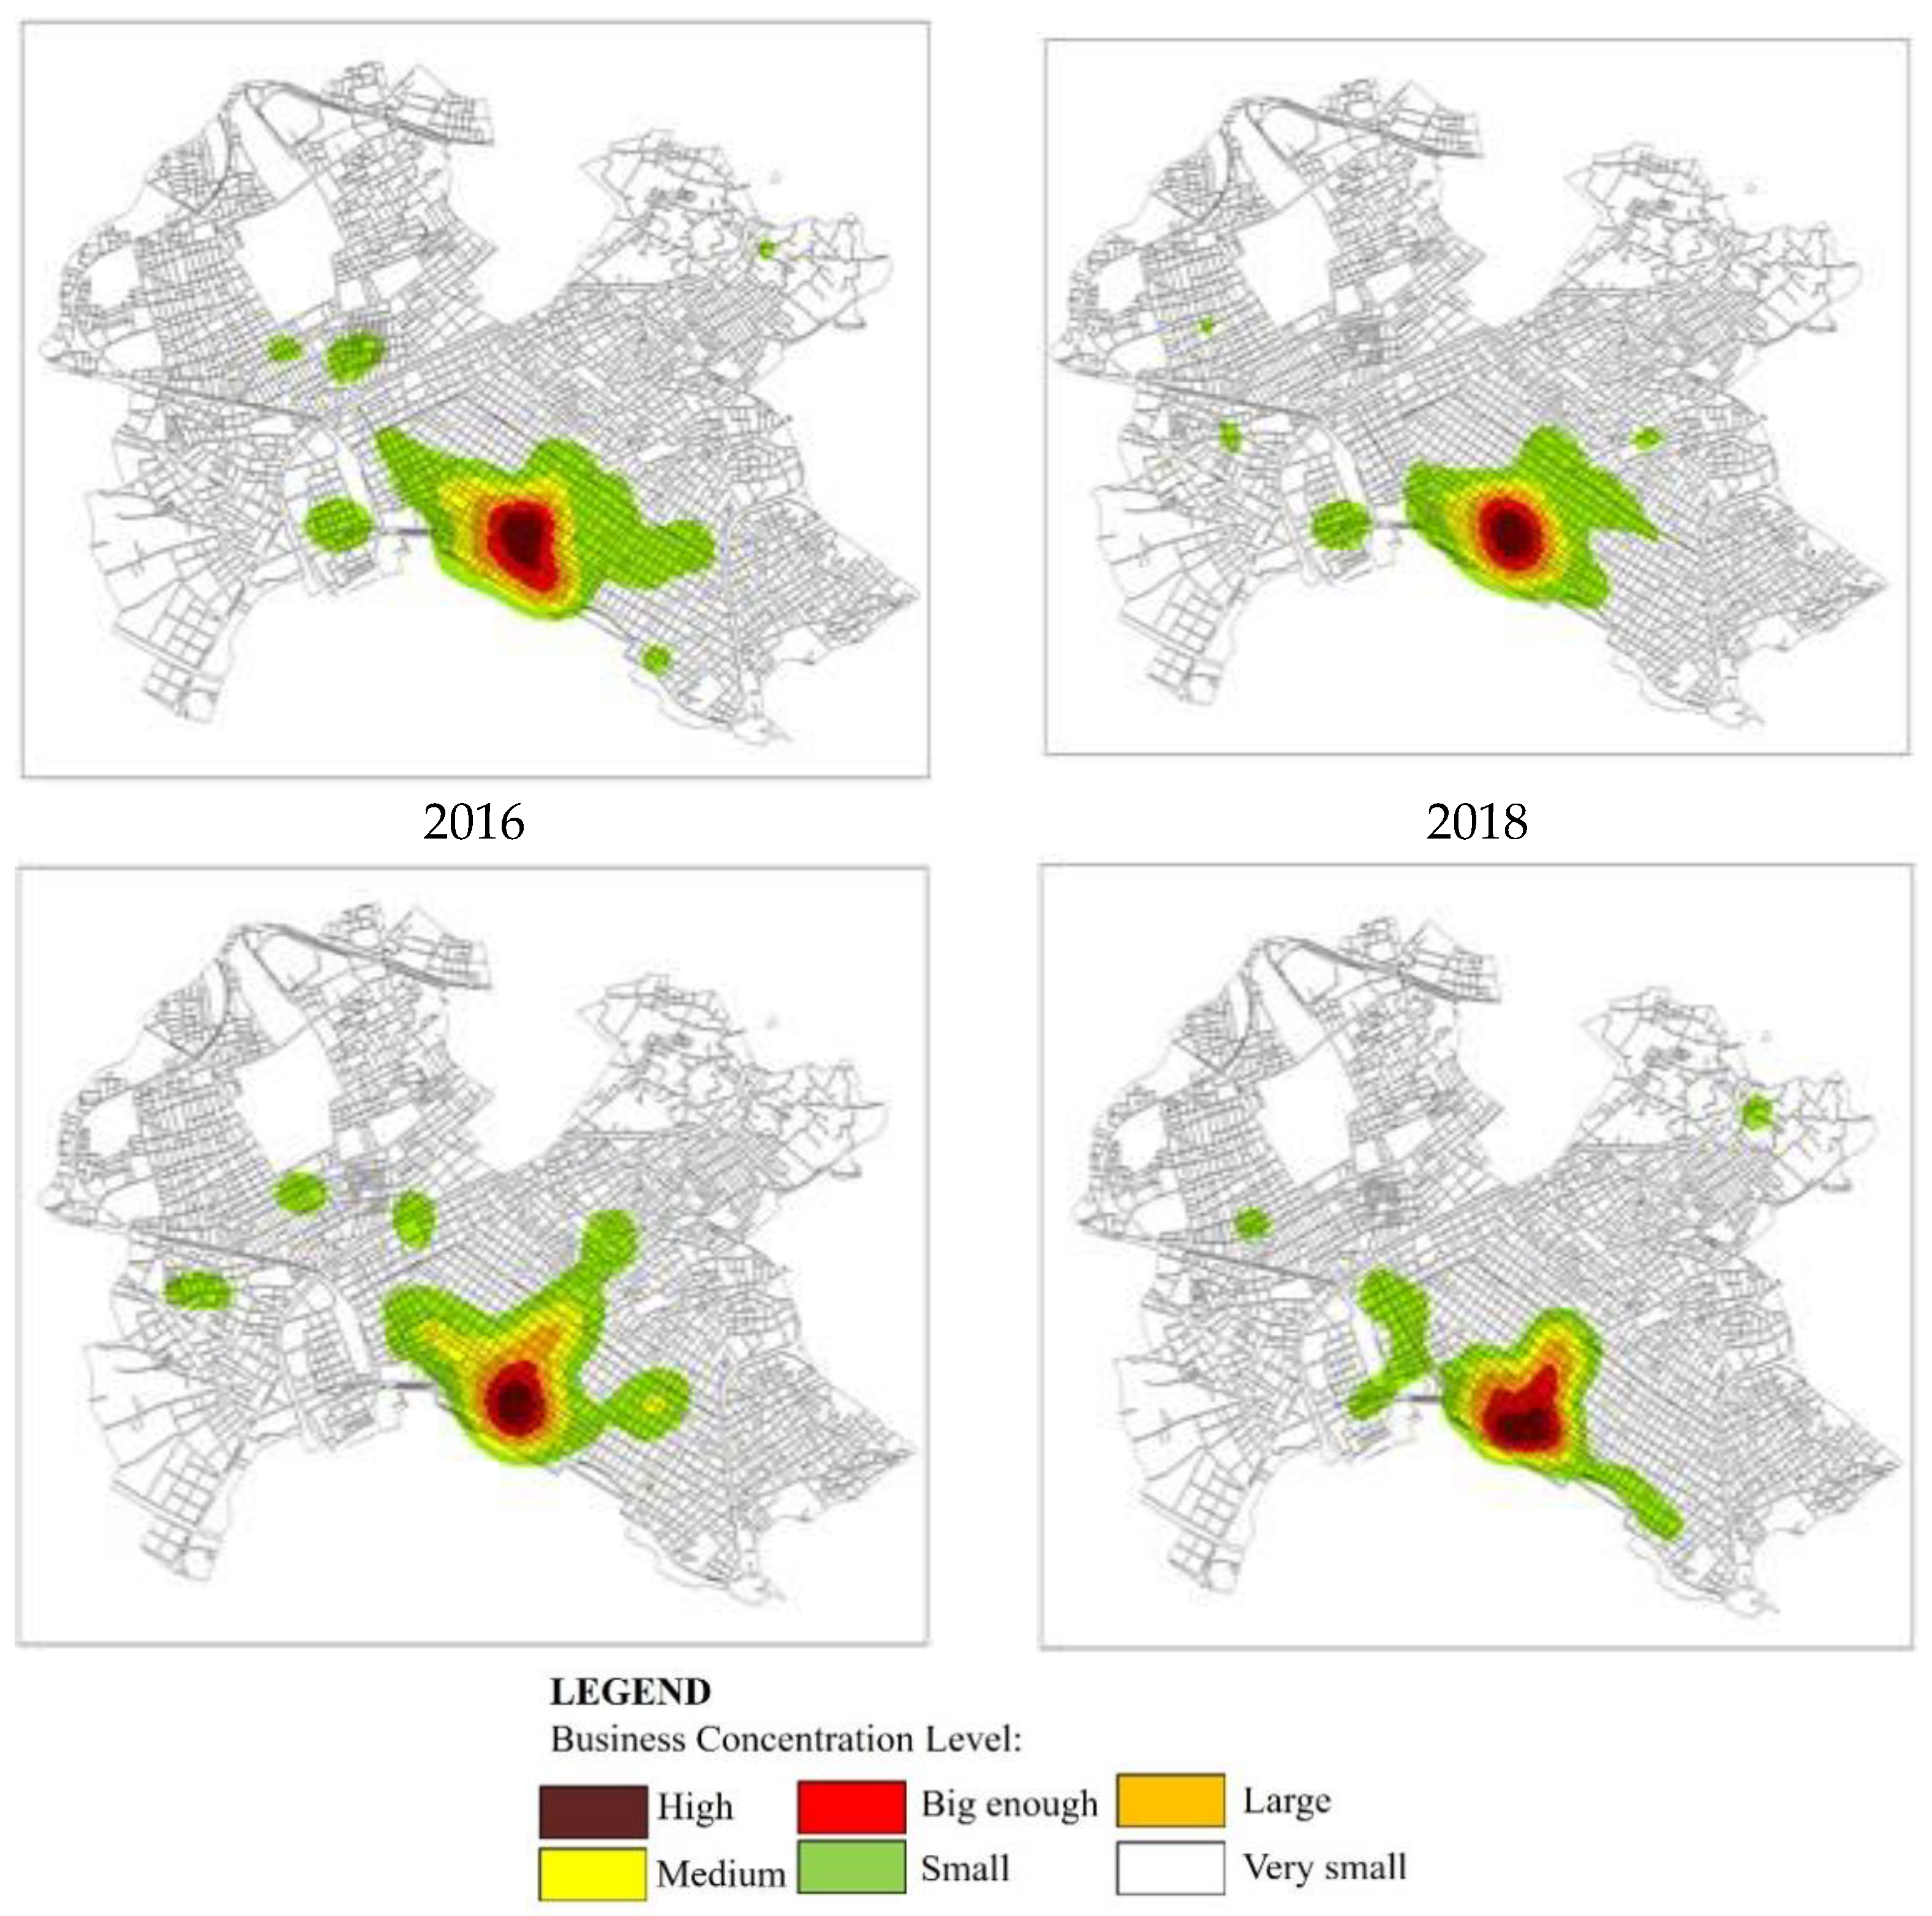
5.3. Kernel Density Estimation Method

The kernel density estimation method analyses the concentration of economic activity over the years. This is an analysis of point events and concerns the spatial concentration of these events. The surface thereby produced highlights the intensity of events in this area, as shown by Figure 4, Figure 5 and Figure 6. This method was applied to all existing economic activities as well as to new and closed businesses.
The network-based kernel density estimation method was then performed, which analyses the concentration of point events located on or near road axes andhighlights the intensity of events in the specific period, as shown by Figure 7, Figure 8 and Figure 9. As with the previous maps, this method refers to the existing, new and closed companies in the period 2008–2018.
The data selected in the present work are based, regards companies, in the private sector with a specific legal status (e.g., individual, anonyme, limited liability companies, private capital companies) in the city of Volos. After the separation of economic activities, appropriate digital backgrounds (e.g., roads and building blocks), as well as point databases of economic activities, were created.
As can be seen from the maps below, the economic activities tend to concentrate in-side or around the business center all over the years. That means that through the years the business center remains a place of concentration of economic activities even in time of economic crisis. Moreover, the economic activities that opened between 2008 and 2018 were also inside or through the business center which means that the business center had many empty spaces, or many economic activities had closed resulting in this vacancy be-ing filled by new economic activities.
Furthermore, Figure 7, Figure 8 and Figure 9 show the streets where the economic activities are concentrated. It is evident that the streets that are near or inside the business center had high concentration of economic activities and as we move away from the business center there are fewer and fewer economic activities. In addition, as can be seen from the Figure 8 and Figure 9 even though many economic activities are closed due to economic crisis the stores do not stay vacant for long time due to the high interest of the business center.
Finally, all the maps show that the business center has crucial impact to the place of establishment of the economic activities and this can be seen from the fact that even though many economic activities were closed in this area, many chosed to establish there.

6. Discussion

The implementation of the methodological framework is an important tool both for the analysis and identification of economic and spatial transformations and for the emergence of new ways of implementation in other cities. In the present work, the aim of the methodological framework was the identification and evaluation of economic activities, and the analysis of their spatial patterns, as well as the emergence of new ways of analysis of economic activities and their application in other cities.
The effects of the economic crisis can be reflected in various ways, depending on the economic and social composition of each city. Undoubtedly, the recent economic downturn has pressured organizations to adapt [46] while the small- and medium-sized enterprises—i.e., the construction sector as well as the manufacturing sector—were the ones that received the biggest blow and, as a result, significantly affected the urban area as well. The rapid increase in vacancies, shops, and industrial facilities created tendencies to abandon areas, combined with the absence of new projects and constructions, which degraded significant parts of cities [47]. Furthermore, there was a decrease in investment because of the uncertainty that arose in this economic situation. These problems are due to two main factors: on the one hand, they relate to the reduced approvals of loans by banks for the creation of new businesses or for the maintenance of existing ones, and on the other, to the fall in demand for products and services. Complementary the unequal spatial and temporal distribution of public expenditure in Greece during the economic crisis played a key role to that situation [48].
It is worth noting that location influences the success of many businesses. Finding the right position for economic activity has been long-term goal of both business and urban planning. More specifically, urban sprawl depends, among others, on the operation of that city as a consumer hub. Understanding the spatial distribution of commercial premises is essential for the future design of urban commercial systems because it contributes to the efficient design of urban commercial space. Focusing on the sustainable development of the city, this improved understanding can help to avoid wasting planning resources that could be better allocated to other needs [39]. The modern approach of older scientific fields such as economic geography seems capable of providing a new perspective on the possibilities of urban planning, especially when the emphasis is on specific sectors of the economy such as the creative industries [49]. At the same time, its combination with frequently used statistical tools, such as those of statistical spatial analysis, can better reflect its rapidly evolving character.

7. Conclusions

Determining spatial business models is valuable for understanding a city’s land use and the types and forms of business opportunities. Further analysis shows that high correlation stores tend to be distributed downtown or near the commercial centre. The economic activities located on these roads have a relative location advantage. These findings can provide suggestions for optimising the spatial standards of commercial facilities and are valuable for transforming a city into a smart one (especially focused on the smart economy as a pillar of the smart city) by adopting ad hoc urban renaissance and resilient policies and for promoting the sustainable development of the city.
Finally, the methodological framework in the present work can lead to the identification and quantification of phenomena such as economic activities over time and can serve as a portal for:
(1)
Policies for better organization and management of economic activities in the urban web.
(2)
Investors who do not know the area where their business will be more profitable and resilient in difficult times, and
(3)
Young entrepreneurs who do not know the financial profile of the city and are trying to establish themselves in its market.
In addition, the study of how economic activities interact with space and between them can help each city understand its economic identity and to create policies and projects to evolve them. Finally, other studies can benefit through the analysis of economic activities, contributing significantly to the improvement of the quality of life of the inhabitants of the city as well as for its visitors. The limitations of this article stem from the choice of the study area, which although it can reflect the situation in Greece, can not accurately reflect the business trends in all Greek cities.

Author Contributions

Conceptualization, S.M., K.K. and A.G.; Data curation, K.K.; Formal analysis, S.M. and K.K.; Investigation, S.M. and K.K.; Methodology, S.M., K.K. and A.G.; Resources, S.M., K.K. and A.G.; Software, K.K.; Validation, K.K.; Visualization, S.M. and K.K.; Writing—original draft, S.M. and K.K.; Writing—review and editing, S.M., K.K. and A.G. All authors have read and agreed to the published version of the manuscript.

Funding

This research received no external funding.

Institutional Review Board Statement

Not applicable.

Informed Consent Statement

Not applicable.

Conflicts of Interest

The authors declare no conflict of interest.

References

  1. Bathelt, H.; Li, P. Building Better Methods in Economic Geography. Z. Wirtschgeogr. 2021, 64, 103–108. [Google Scholar] [CrossRef]
  2. Cockayne, D. What is a startup firm? A methodological and epistemological investigation into research objects in economic geography. Geoforum 2019, 107, 77–87. [Google Scholar] [CrossRef]
  3. Behrens, K.; Thisse, J.F. Regional economics: A new economic geography perspective. Reg. Sci. Urban Econ. 2007, 37, 457–465. [Google Scholar] [CrossRef]
  4. Rickard, S.J. Economic Geography, Politics, and Policy. Annu. Rev. Political Sci. 2020, 23, 187–202. [Google Scholar] [CrossRef]
  5. Suwala, L. Concepts of Space, Refiguration of Spaces, and Comparative Research: Perspectives from Economic Geography and Regional Economics. Forum Qual. Sozialforsch./Forum Qual. Soc. Res. 2021, 22, 11. [Google Scholar] [CrossRef]
  6. Barnes, T.J.; Sheppard, E. Introduction: The Art of Economic Geography. In A Companion to Economic Geography; Blackwell Publishing Ltd.: Hoboken, NJ, USA, 2002; pp. 1–8. [Google Scholar] [CrossRef]
  7. Bagchi-Sen, S.; Smith, H.L. (Eds.) Economic Geography Past, Present and Future; Routledge: New York, NY, USA, 2017; Available online: www.tandfebooks.com (accessed on 8 November 2021).
  8. Boschma, R.; Frenken, K. The emerging empirics of evolutionary economic geography. J. Econ. Geogr. 2011, 11, 295–307. [Google Scholar] [CrossRef] [Green Version]
  9. Gong, H.; Hassink, R. Co-evolution in contemporary economic geography: Towards a theoretical framework. Reg. Stud. 2018, 53, 1344–1355. [Google Scholar] [CrossRef]
  10. Shertzer, A.; Twinam, T.; Walsh, R.P. Zoning and the economic geography of cities. J. Urban Econ. 2018, 105, 20–39. [Google Scholar] [CrossRef]
  11. Akkoyunlu, Ş. The potential of rural–urban linkages for sustainable development and trade. Int. J. Sustain. Dev. World Policy 2015, 4, 20–40. [Google Scholar] [CrossRef]
  12. Manika, S. Transforming Vacant Commercial Spaces: From Localized Hotspots of Urban Shrinkage to “Smart” Co-Working Places. Open J. Soc. Sci. 2020, 8, 86–97. [Google Scholar] [CrossRef]
  13. Yang, J.H.; Ettema, D. Modelling the emergence of spatial patterns of economic activity. J. Artif. Soc. Soc. Simul. JASSS 2012, 15, 6. [Google Scholar] [CrossRef]
  14. Anastasiou, E. Changes in human geography: Scenarios of counter-urbanization in the context of economic crisis. Reg. Sci. Inq. 2020, 12, 75–86. [Google Scholar]
  15. Anastasiou, E. Modelling population shifts to the rural: Resilience, attractiveness and revitalization issues in the era of crisis. Reg. Peripher. 2020, 10, 5–25. [Google Scholar] [CrossRef]
  16. Li, Z.; Jiao, L.; Zhang, B.; Xu, G.; Liu, J. Understanding the pattern and mechanism of spatial concentration of urban land use, population and economic activities: A case study in Wuhan, China. Geo-Spat. Inf. Sci. 2021, 24, 678–694. [Google Scholar] [CrossRef]
  17. Manika, S. Portraying and Analysing Urban Shrinkage in Greek Cities—The Case of Larissa. Curr. Urban Stud. 2020, 8, 284–304. [Google Scholar] [CrossRef]
  18. Manika, S.; Karalidis, K.; Gospodini, A. Mechanism for the Optimal Location of a Business as a Lever for the Development of the Economic Strength and Resilience of a City. Urban Sci. 2021, 5, 70. [Google Scholar] [CrossRef]
  19. Doern, R. Entrepreneurship and crisis management: The experiences of small businesses during the London 2011 riots. Int. Small Bus. J. 2014, 34, 276–302. [Google Scholar] [CrossRef]
  20. Manika, S. Economic Crisis, Shrinking Greek Cities and Urban Regeneration Policies; University of Thessaly: Volos, Greece, 2018. [Google Scholar]
  21. Zemtsov, S. New technologies, potential unemployment and ‘nescience economy’ during and after the 2020 economic crisis. Reg. Sci. Policy Pract. 2020, 12, 723–743. [Google Scholar] [CrossRef]
  22. Manika, S. Fostering preparedness for COVID-19 in cities: How cities can support the healthcare system by efficiently managing emergency funding. Town Plan. Rev. 2021, 92, 293–300. [Google Scholar] [CrossRef]
  23. Zhu, S.; Li, D.; Feng, H. Is smart city resilient? Evidence from China. Sustain. Cities Soc. 2019, 50, 101636. [Google Scholar] [CrossRef]
  24. da Silva, C.A.; dos Santos, E.A.; Maier, S.M.; da Rosa, F.S. Urban resilience and sustainable development policies: An analysis of smart cities in the state of São Paulo. Rev. Gestão 2019, 27, 61–78. [Google Scholar] [CrossRef]
  25. Williams, N.; Vorley, T.; Ketikidis, P. Economic resilience and entrepreneurship: A case study of the Thessaloniki City Region. Local Econ. 2013, 28, 399–415. [Google Scholar] [CrossRef]
  26. Barata-Salgueiro, T.; Erkip, F. Retail planning and urban resilience—An introduction to the special issue. Cities 2014, 36, 107–111. [Google Scholar] [CrossRef] [Green Version]
  27. Fernandes, J.R.; Chamusca, P. Urban policies, planning and retail resilience. Cities 2014, 36, 170–177. [Google Scholar] [CrossRef]
  28. Morano, P.; Tajani, F.; Anelli, D. Urban planning variants: A model for the division of the activated “plusvalue” between public and private subjects. Valori Valutazioni 2021, 28, 31–47. [Google Scholar] [CrossRef]
  29. Zhou, Q.; Zhu, M.; Qiao, Y.; Zhang, X.; Chen, J. Achieving resilience through smart cities? Evidence from China. Habitat Int. 2021, 111, 102348. [Google Scholar] [CrossRef]
  30. Manika, S. Mechanisms for Innovative-Driven Solutions in European Smart Cities. Smart Cities 2020, 3, 527–540. [Google Scholar] [CrossRef]
  31. Avramidou, M.; Manika, S. Interaction of modern architectural design with the environment: Evaluation and application in urban open spaces for developing resilient cities. IOP Conf. Ser. Earth Environ. Sci. 2021, 899, 12011. [Google Scholar] [CrossRef]
  32. Andreou, M.; Manika, S. Citizen opinions on the organization of a smart city for housing, urban structures, and quality of life: The case of Kos Island, Greece. IOP Conf. Ser. Earth Environ. Sci. 2021, 899, 012050. [Google Scholar] [CrossRef]
  33. Manika, S. Encouraging sustainability of European Smart Cities through green and sustainable public procurement. Int. J. Adv. Res. 2020, 8, 668–675. [Google Scholar] [CrossRef]
  34. Almohamad, H.; Knaack, A.L.; Habib, B.M. Assessing Spatial Equity and Accessibility of Public Green Spaces in Aleppo City, Syria. Forests 2018, 9, 706. [Google Scholar] [CrossRef] [Green Version]
  35. Hagadone, T.A.; Grala, R.K. Business clusters in Mississippi’s forest products industry. For. Policy Econ. 2012, 20, 16–24. [Google Scholar] [CrossRef]
  36. How Average Nearest Neighbor Works—ArcGIS Pro|Documentation. Available online: https://pro.arcgis.com/en/pro-app/latest/tool-reference/spatial-statistics/h-how-average-nearest-neighbor-distance-spatial-st.htm (accessed on 27 January 2022).
  37. Andersson, B.; von Davier, A.A. Improving the Bandwidth Selection in Kernel Equating. J. Educ. Meas. 2014, 51, 223–238. [Google Scholar] [CrossRef]
  38. Tang, L.; Kan, Z.; Zhang, X.; Sun, F.; Yang, X.; Li, Q. A network Kernel Density Estimation for linear features in space–time analysis of big trace data. Int. J. Geogr. Inf. Sci. 2015, 30, 1717–1737. [Google Scholar] [CrossRef]
  39. Han, Z.; Cui, C.; Miao, C.; Wang, H.; Chen, X. Identifying Spatial Patterns of Retail Stores in Road Network Structure. Sustainability 2019, 11, 4539. [Google Scholar] [CrossRef] [Green Version]
  40. Timothée, P.; Nicolas, L.-B.; Emanuele, S.; Sergio, P.; Stéphane, J. A Network Based Kernel Density Estimator Applied to Barcelona Economic Activities. In International Conference on Computational Science and Its Applications; Taniar, D., Gervasi, O., Murgante, B., Pardede, E., Apduhan, B.O., Eds.; Springer: Berlin/Heidelberg, Germany, 2010; pp. 32–45. [Google Scholar]
  41. Rui, Y.; Yang, Z.; Qian, T.; Khalid, S.; Xia, N.; Wang, J. Network-constrained and category-based point pattern analysis for Suguo retail stores in Nanjing, China. Int. J. Geogr. Inf. Sci. 2016, 30, 186–199. [Google Scholar] [CrossRef]
  42. Xie, Z.; Yan, J. Kernel Density Estimation of traffic accidents in a network space. Comput. Environ. Urban Syst. 2008, 32, 396–406. [Google Scholar] [CrossRef] [Green Version]
  43. Yu, W.; Ai, T.; Shao, S. The analysis and delimitation of Central Business District using network kernel density estimation. J. Transp. Geogr. 2015, 45, 32–47. [Google Scholar] [CrossRef]
  44. Hellenic Statistical Authority. Available online: https://www.statistics.gr/en/home (accessed on 27 January 2022).
  45. Manika, S.; Anastasiou, E. Regional Economics in Greece: A Spatial Analysis of Business and Population Dynamics. Int. J. Bus. Econ. Sci. Appl. Res. 2020, 13, 70–82. [Google Scholar] [CrossRef]
  46. Psychogios, A.; Nyfoudi, M.; Theodorakopoulos, N.; Szamosi, L.T.; Prouska, R. Many Hands Lighter Work? Deciphering the Relationship between Adverse Working Conditions and Organization Citizenship Behaviours in Small and Medium-sized Enterprises during a Severe Economic Crisis. Br. J. Manag. 2019, 30, 519–537. [Google Scholar] [CrossRef] [Green Version]
  47. Gospodini, A.; Manika, S. Conceptualising ‘smart’ and ‘green’ public open spaces; Investigating redesign patternsfor Greek cities. Civ. Eng. Archit. 2020, 8, 371–378. [Google Scholar] [CrossRef]
  48. Anastasiou, E.; Theodossiou, G. The geography of economic inequality: A spatial and intertemporal analysis of public expenditure in Greece. Int. J. Soc. Sci. Econ. Res. 2020, 5, 886–905. [Google Scholar] [CrossRef]
  49. Flew, T. Toward a Cultural Economic Geography of Creative Industries and Urban Development: Introduction to the Special Issue on Creative Industries and Urban Development. Inf. Soc. 2010, 26, 85–91. [Google Scholar] [CrossRef] [Green Version]
Figure 1. Per capita gross domestic product. Source: [44], Own editing.
Smartcities 05 00017 g001
Figure 2. Cumulative frequency of points. Source: Chamber of Magnesia, Own editing.
Smartcities 05 00017 g002
Figure 3. Number of economic activities and distance from the shopping center of the city. Source: Chamber of Magnesia, Own editing.
Smartcities 05 00017 g003
Figure 4. Kernel density for the years 2008–2018 for all companies, Source: Chamber of Magnesia, Own processing.
Smartcities 05 00017 g004aSmartcities 05 00017 g004b
Figure 5. Kernel density for the years 2008–2018 for the companies that opened in the respective years, Source: Chamber of Magnesia, Own processing.
Smartcities 05 00017 g005aSmartcities 05 00017 g005b
Figure 6. Kernel density for the years 2008–2018 for companies closed in the respective years, Source: Chamber of Magnesia, Own processing.
Smartcities 05 00017 g006
Figure 7. Network-based kernel density for the years 2008–2018 for all companies, Source: Chamber of Magnesia, Own processing.
Smartcities 05 00017 g007
Figure 8. Network-based kernel density for the years 2008–2018 for the companies that opened, Source: Chamber of Magnesia, Own processing.
Smartcities 05 00017 g008
Figure 9. Network-based kernel density for the years 2008–2018 for the closed companies, Source: Chamber of Magnesia, Own processing.
Smartcities 05 00017 g009
Table 1. Exempt branches.
Branches
SectorsName
AAgriculture, forestry and fisheries
ΒMines and quarries
DSupply of electricity, gas, steam and air conditioning
ΕWater supply, wastewater treatment, waste management and recovery activities
NPublic administration and defense, mandatory social security
ΤHousehold activities as employers, non-differentiated household activities concerning the production of goods—and services—for their own use
UActivities of non-governmental organizations and bodies
Table 2. Business categories excluded.
Legal StatusΝumber of Companies
Sole Shareholder75
Limited Liability Company183
Private Capital Company122
Agricultural collaboration/cooperation2
Legacy4
Joint Venture26
Society12
Sole Shareholder Company124
IKE branch8
Branch Ltd.7
Branch only foreign1
IIKE sole shareholder branch3
Sole shareholder branch Ltd.1
Total568
Source: Chamber of Magnesia, Own editing.
Publisher’s Note: MDPI stays neutral with regard to jurisdictional claims in published maps and institutional affiliations.

