Article

From a Comprehensive Pool to a Project-Specific List of Key Performance Indicators for Monitoring the Positive Energy Transition of Smart Cities—An Experience-Based Approach

by
Komninos Angelakoglou
1,*,
Konstantinos Kourtzanidis
1,
Paraskevi Giourka
1,
Vasilis Apostolopoulos
1,
Nikos Nikolopoulos
1 and
Julia Kantorovitch
2
1
Chemical Process and Energy Resources Institute, Centre for Research and Technology Hellas, Thermi, GR-57001 Thessaloniki, Greece
2
Technical Research Centre of Finland, Smart Industry, Vuorimiehentie 3, 02044 Espoo, Finland
*
Author to whom correspondence should be addressed.
Smart Cities 2020, 3(3), 705-735; https://doi.org/10.3390/smartcities3030036
Submission received: 10 June 2020 / Revised: 10 July 2020 / Accepted: 12 July 2020 / Published: 14 July 2020
(This article belongs to the Special Issue Feature Papers for Smart Cities)

Abstract

:
As cities grow rapidly and energy needs increase, shaping an effective energy transition is a top priority towards urban sustainability and smart development. This study attempts to answer three key research questions that can help city authorities, planners and interested agents simplify and increase the transparency of Key Performance Indicators (KPIs) selection for smart city and communities (SCC) projects focusing on energy transition and creation of Positive Energy Districts (PEDs): Question 1: “What resources are available for extracting such KPIs?”; Question 2: “Which of those KPIs are the most suitable for assessing the energy transition of smart city projects and PED-related developments?” and Question 3: “How can a project-specific shortlist of KPIs be developed?”. Answering these questions can also serve as a major first step towards a “universal” KPI selection procedure. In line with this purpose, an experiential approach is presented, capitalizing on knowledge and lessons learned from an ongoing smart city project in Europe (POCITYF) that focuses on PED deployment. Under this framework, a) a review of smart city KPI frameworks has been conducted, resulting in a pool of 258 indicators that can potentially be adopted by smart city projects; b) eight key dimensions of evaluations were extracted, setting a holistic performance framework relevant to SCCs; c) a detailed evaluation process including pre-determined criteria and city-needs feedback was applied to shortlist the KPI pool, leading to a ready-to-be-used, project-specific list of 63 KPIs and d) KPIs were sorted and analyzed in different granularity levels to further facilitate the monitoring procedure. The experiential procedure presented in this study can be easily adapted to the needs of every smart city project, serving as a recommendation guide.

1. Introduction

Cities account for two-thirds of global energy consumption and about 75% of worldwide CO2 emissions [1]. Air pollution and traffic congestion as well as climate change contribute to detrimental effects and pose a huge stress on cities. Air pollution is responsible for an estimated 7 million premature deaths a year, while over 90% of the world’s population is exposed to toxic air [2]. Traffic congestion in cities has also recorded a global rise during the last decade [3]. As a consequence, in the last decade, several targets in terms of cutting greenhouse gases and pollutant emissions were set worldwide, aiming at tackling climate change and achieving better ambient air quality in cities, e.g., The Paris Agreement, 2015 [4], and the recent European Green Deal, 2019 [5]. The European Green Deal provides a holistic framework for resource efficiency, clean and circular economy, low environmental impact and pollution reduction towards climate neutrality by 2050 in EU, while also giving recommendations for investments and funding mechanisms available enabling a just transition.
In order to combat these challenges, smart city projects can greatly contribute towards a sustainable urbanization aligned with global targets but also with each city’s vision and strategic needs. Cities around the world leverage smart city projects to demonstrate novel solutions, initiatives and activities required to support the operation of a sustainable, smart and resilient city in terms of climate change and safety risks, digital services, and smart energy and transport management and better quality of life in urban places [6]. Advancements in information and communication technologies (ICT) facilitate the transformation of local energy systems and the transportation sector and the provision of novel services for the benefit of the citizens. Due to the increasing energy needs and deriving concerns (e.g., local grid stability, energy system flexibility, etc.) a smart city is evolved into a well-performing city that can leverage and connect ICT, energy and mobility with the physical infrastructure, the citizenry and businesses to enhance its smartness, livability, sustainability and prosperity.
In Europe, the smart city concept is based to a large extent on innovation and green investment opportunities, whereas a special emphasis has been given, during the last years, to the deployment of Positive Energy Districts (PEDs). A transition of the urban environment based on the deployment of PEDs, regarded as the instruments for the intersection among the ICT, local energy and mobility systems, will facilitate energy transition in smart cities. These demonstrations at the district scale should be enabled by technological as well as citizen-driven innovation, integrated planning and management as well as policy and decision-making, considering economic, environmental and social aspects. Europe attempts to exploit the progress made in technology pertaining to decarbonization, decentralization and digitalization of energy systems as a great opportunity to facilitate energy transition [7]. However, supporting the development of smart cities requires more than demonstrating solutions in order to deliver benefits for cities from positive energy transformation projects. Research methods and assessments are required in view of monitoring measures, evaluating contributions and focusing on achieving results from the solutions and activities, optimizing the potential for scalability, benchmarking, replication and dissemination of good practices and solutions on a wider scale.
The ability to evaluate a positive energy transformation project facilitates the successful tracking of its progress and outcomes but also allows determining the overall value of the smart solution implemented and marks whether the solution has made a difference [8]. This is crucial in smart city projects where a multitude of heterogenous solutions are applied in different spatial scales (building, block, district, and city levels). Smart city projects, as the instruments of stakeholder perspectives and decision-making in a city, should showcase the progress made in key sectors related with city needs and contribute actively to the priorities and objectives set by cities. For this purpose, the development and selection of indicators for measuring the smartness of a city and the effectiveness of a project are critical [9].
Key Performance Indicators (KPIs) can act as a universal instrument to evaluate the progress of strategies towards positive energy transformation supporting the monitoring of relevant solutions and projects [10]. According to the Oxford dictionary, the definition of a KPI is “a quantifiable measure used to evaluate the success of an organization, employee, etc. in meeting objectives for performance”. The key difference between KPIs and other indicators is that KPIs are always tied to a goal, a target or an objective [11]. The development of smart city projects generates considerable interest in establishing novel smart city assessment frameworks and schemes measuring, monitoring and evaluating performance and impacts and addressing possible challenges, before and during the whole life-cycle and after the project implementation [12]. In this context, several initiatives propose different monitoring and assessment KPI frameworks for smart city solutions promoting the cooperation and exchanging of know-how among smart cities (described in detail in Section 2). The selection of the most appropriate KPIs for smart city projects remains difficult though, as it requires expert knowledge [13]. Hundreds of KPIs are available, and the choice of the most suitable ones for each case is a challenging task. Given the fact that the smart city concept entails numerous interrelated dimensions, the process of evaluation through KPIs is challenging because, on the one hand, it should satisfy city needs, while on the other hand, it should allow an effective comparison on a national or international level with other cities or smart city projects. In the end, every smart city project adopts its own KPI list, which makes the inter-comparison of the outcomes among different projects and solutions problematic, indicating the need for a uniform monitoring of the energy smartification and smart city solutions [14].
With a view to address the above-mentioned challenges, this study attempts to answer three key research questions that can help city authorities, planners and interested agents simplify and increase the transparency of KPI selection for smart city projects having as a core focus the energy transition: Question 1: “What resources are available for extracting such KPIs?”; Question 2: “Which of those KPIs are the most suitable for assessing the energy transition of smart city projects and PED-related developments?” and Question 3: “How can a project-specific shortlist of KPIs be developed?”. Answering these questions can also serve as a major first step towards the unification of the KPI selection procedure. In line with this purpose, an experiential approach is presented, capitalizing on knowledge and lessons learned from POCITYF [15], a European H2020 recently funded smart city project, which orchestrates the demonstration activities towards energy transition at two Lighthouse cities (LHs)—Evora in Portugal and Alkmaar in the Netherlands; as well as the replication of this list in six Fellow Cities (FCs)—Bari in Italy, Celje in Slovenia, Granada in Spain, Hvidovre in Denmark, Ioannina in Greece and Ujpest in Hungary. POCITYF brings together 53 partners (54% of which are industries and SMEs) from 13 European countries to demonstrate 73 individual innovative elements (technologies, tools, methods) in more than 20 building complexes covering a total floor area of 87,480 m2 with current energy needs of 13.25GWh/year. The positive energy transformation of buildings (Positive Energy Buildings—PEBs) and districts (see below) based on innovative solutions to be integrated therein, is a core goal of POCITYF which pertains to all Lighthouse (especially Evora) and Fellow cities. The focus on PEDs is essential for POCITYF but also for any smart city vision and requires integration and interaction among various stakeholders and technologies, taking into account spatial, social, economic and regulatory perspectives. PEDs can be seen as districts with annual net-zero energy imports, and net-zero CO2 emission working towards an annual local surplus production of renewable energy [16]. The creation of PEDs in POCITYF includes interventions such as advanced solar energy technologies, flexible electrical and thermal grids, energy management and peer-to-peer (P2P) transactions, ICT integration, e-mobility and citizen engagement towards an open-innovation ecosystem. Moreover, Evora LH and most of the Fellow Cities present a unique challenge: cultural heritage buildings and districts require further innovations towards their energy transition. As a result, ensuring a functional and efficient monitoring procedure for POCITYF is a challenge and of critical importance.
The rest of this paper is organized as follows: Section 2 provides a detailed analysis of available smart city KPI frameworks. The aim of the specific section is twofold: a) examine and assess existing KPI frameworks relevant to smart cities and extract valuable ideas, lessons learned and suggestions; b) develop an extensive and comprehensive pool of potential KPIs that could be utilized in smart cities projects building upon the recommendations of these frameworks. Outcomes in Section 2 answer the research question no 1. Section 3 presents a step-by-step process for evaluating and selecting KPIs in a transparent way, building upon the experiences of POCITYF and capitalizing the results from the analysis performed in Section 2. Outcomes in Section 3 answer the research question no 2. Section 4 presents the results of implementing the proposed process in the case of POCITYF, serving as a potential “ready-to-be-used” set of KPIs. This can also serve as an extra step towards utilizing common KPIs in smart city projects thus facilitating their inter-comparison. Further analysis is performed in Section 4 providing insights on how the KPI selection and implementation can be improved. Outcomes in Section 4 answer the research question no 3.

2. A Review of Smart City KPI Frameworks

As smart city projects are in bloom around the world, supported by relevant policies and initiatives, there is need to monitor the performance of smart city solutions implemented in order to verify whether the targets set are being achieved and to what extent. Monitoring of smart city projects would then facilitate an informed reflection towards optimizing solutions and increasing the levels of their efficiency. Many initiatives are proposing different monitoring and assessment frameworks for smart city solutions promoting the cooperation and exchanging of know-how among smart cities. This study explores different monitoring frameworks proposed by a variety of sources. The Smart Cities Information System (SCIS) and the CITYkeys project have both created platforms of interaction and propose lists of KPIs for evaluating systems and technologies demonstrated specifically for smart city projects in the EU. Several Smart Cities and Communities Lighthouse projects as well as international and European standards (e.g., ISO 37120:2018, ISO 37123:2019) and strategic plans and initiatives e.g., UN’s Sustainable Development Goals, are also providing indicators for assessing the performance of smart city solutions. Finally, there are several assessment frameworks available in scientific journals that attempt to evaluate smart city performance of solutions at different levels. The sources presented in the paper have been chosen based on their scientific merit and publishing date (for scientific publications) in order to include recent studies in this theme. In terms of KPI frameworks and SCC projects, the criteria for selecting the presented databases were the wide usage, acceptance and diffusivity of frameworks and success as well as relevance (to energy transition) of the SCC projects. Literature documents with duplicated or very similar information to another source have been excluded from the final (presented) list of references.
The rest of Section 2 below, provides a comprehensive summary of these various sources offering a versatile set of assessment frameworks and KPIs.

2.1. Smart Cities Information System (SCIS) and CITYkeys

The SCIS KPI framework (2018) [17] focuses on indicators which assess technical and economic aspects of energy, mobility and ICT-related measures applicable in projects such as Smart Cities and Communities (SCC), Energy-Efficient Buildings (EeB) and designated projects funded under the calls for Energy Efficiency (EE). Due to the complexity and variety of the projects in scope, the indicators are proposed to be calculated for different granularity levels (building, set of buildings, energy supply unit, set of energy supply units, neighborhood). Some of the KPIs at the upper levels can be calculated from simple addition of the lower levels, while some other KPIs are specific to each level. The SCIS KPI guide provides a description of Key Performance Indicators and their application to the different objects of assessment, it identifies the data requirements for their calculation and describes the methodology for the calculation of these indicators. The SCIS framework focuses on demonstration projects and not on entire cities and consists of 36 indicators.
The CITYkeys evaluation framework [11] is primarily a performance-oriented framework and supports Smart Cities in evaluating the success of smart city projects. The framework indicates the difference the project has made by offering the opportunity to compare the situation before and after a smart city project is implemented. As such, it can also serve to benchmark projects against each other. It also helps monitor the progress of the city as a whole towards smart city goals, taking into account the time component—“development over the years”. It focuses on the city as well as the project level while establishing a link between the two. The city indicators show to what extent overall policy goals have been reached or are within reach. In addition, city-level indicators may be used to compare cities with each other. It also assesses how the project has contributed to the objectives at city level. This requires connecting outcomes of a project evaluation with corresponding indicators on the city level, while it also assesses the possibility to replicate the (successful) projects in other contexts. A complete project assessment includes an extensive description of the context of the project, the activities and technologies in the project, financing and the business model, and the implementation process. CITYkeys framework supports the identification of indicators in various areas in smart cities i.e., health, education, etc. The framework consists of 99 project indicators and 76 city-level indicators.

2.2. Other Positive Energy Transformation Projects

Other smart city projects also provide comprehensive community knowledge and stakeholder perceptions for the evaluation of smart city projects. Until recently, there are 17 SCC lighthouse (LH) projects in Europe [18], with a total of 44 LH Cities and 70 Fellow Cities that demonstrate solutions in the three (3) main fields of a) secure, affordable and clean energy; b) smart e-mobility and c) smart ICT tools and services.
In the context of city performance measurement and assessment, 10 projects were identified out of the 17 that were examined that capitalize on a complete evaluation process of smart city solutions with a detailed list of KPIs publicly available (the rest of the projects have either not completed this process or made their KPIs publicly available yet). To this end, the KPI frameworks of those projects were examined thoroughly and are also taken into account in our analysis in order to serve as potential sources for POCITYF’s KPI list. Each of them adopts a special assessment framework to evaluate smart city performance and expected impacts. Emphasis should be given to the fact that, despite their differences, those frameworks also have similarities in their approaches, taking various definitions or units resulting in numerous common-adopted KPIs. Table 1 summarizes the key characteristics of these assessment frameworks, developed to evaluate and monitor performance of smart city projects.

2.3. Scientific Publications

Apart from relevant projects, scientific studies are also available introducing various assessment frameworks that attempt to evaluate smart city performance at various levels. The scientific search engines and online databases indexed in Hellenic Academic Library Link (HEAL-Link) were utilized for identifying relevant works. HEAL-Link provides access to various scientific databases (i.e., Scopus, Science Direct), covering a significant range of journals in this field. Initially, a quick search was performed with the application of keywords regarding the scope of the paper, i.e., “smart cities” AND “KPI”, “smart cities” AND “assessment” and so forth. The abstracts of the most relevant papers based on their title were further examined. Table 2 lists the relevant frameworks selected. In order to narrow down the vast number of potential frameworks that could be included in this table, only holistic frameworks that can assess various aspects of smartness were included e.g., papers only dealing with mobility or ICT were excluded from the analysis, whereas specific KPIs should be clearly presented. The methods that passed the initial filtering process were further reviewed (full paper review).
KPIs included in the above-mentioned frameworks (375 KPIs in total) can further help the population of the energy-related smart city KPI pool. The authors are aware that this list is not exhaustive and that there are several other potential scientific publications that could be included in this analysis. It was imperative though, to keep the KPI pool in a level that is both comprehensive and analyzable.

2.4. Other Relevant Frameworks and Initiatives

A versatile pool of other sources, such as international strategic planning initiatives, agreements and reviews as well as international and European standards also propose relevant frameworks for monitoring and evaluation of smart city solutions.

2.4.1. UN’s Global Indicator Framework for the Sustainable Development Goals

The Inter-Agency and Expert Group on SDG Indicators (IAEG-SDGs) developed the UN’s Global indicator framework, refined March 2017, for assessing the Sustainable Development Goals [36] and targets of the 2030 Agenda for Sustainable Development. Adopted by all United Nations Member States in 2015, the SDGs are a call for action by all countries to promote prosperity while protecting the environment. The framework includes 232 indicators, and the indicators are categorized in relation to the 17 Sustainable Development Goals (SDGs)—the world’s plan to build a better world for people and our planet by 2030. All EU countries have adopted the SDGs, and as such the framework provides an interesting database of KPIs relevant to smart city solutions. In this respect, 61 KPIs in total, related to the SDGs Goals 7—“Ensure access to affordable, reliable, sustainable and modern energy for all” (6 KPIs), Goal 8—”Promote sustained, inclusive and sustainable economic growth, full and productive employment and decent work for all” (17 KPIs), Goal 9—“Build resilient infrastructure, promote inclusive and sustainable industrialization and foster innovation” (12 KPIs), Goal 11—“Make cities and human settlements inclusive, safe, resilient and sustainable” (15 KPIs) and Goal 12—“Ensure sustainable consumption and production patterns” (11 KPIs) are linked to the energy transition of smart cities and are therefore taken into consideration.

2.4.2. United for Smart Sustainable Cities (U4SSC) Initiative

The “United for Smart Sustainable Cities” (U4SSC) is a UN initiative coordinated by ITU, UNECE and UN-Habitat to achieve Sustainable Development Goal 11—”Make cities and human settlements inclusive, safe, resilient and sustainable”. A set of 91 KPIs under U4SSC [37] have been developed to establish the criteria to evaluate ICT’s contributions in making cities smarter and more sustainable, and to provide cities with the means for self-assessments. The indicators are categorized into three dimensions: Economy, Environment, and Society and Culture. Within each dimension, sub-dimensions provide focus on more specific areas of performance and progress. Intelligent use of ICT (through innovative City Information Platforms, Energy/mobility management, DSM, smart monitoring, etc.) is a core element of Smart City objectives linked to energy considerations.

2.4.3. ISO/FDIS 37122—Indicators for Smart Cities

ISO, the International Organization for Standardization, is a worldwide federation of national standards bodies (ISO member bodies). The indicators detailed in ISO 37120 have become the international reference point for sustainable cities. ISO/TC 268/WG2 experts have identified the need for additional indicators for smart cities. ISO 37122 [38] complements ISO 37120 (see 2.4.4) and establishes indicators considering aspects and practices that dramatically increase the pace at which cities improve their social, economic and environmental sustainability outcomes. The 80 KPIs identified are clustered under 23 categories: Economy, Education, Energy, Environmental and Climate Change, Finance, Governance, Health, Housing, Population and Social Conditions, Recreation, Safety, Solid Waste, Sport and Culture, Telecommunications, Transportation, Urban/local Agriculture and Food Security, Urban Planning, Wastewater and Water. Concerning energy transition of Smart Cities, the relevant KPI categories studied are Economy/Finance (6 KPIs), Energy (10 KPIs), Environment and Climate Change (3 KPIs), Governance (4 KPIs), Housing (2 KPIs), Solid Waste (6 KPIs), Telecommunication (3 KPIs), Transportation (14 KPIs) and Urban planning (4 KPIs), summing up to a total number of 52 KPIs to be studied within this work.

2.4.4. ISO/FDIS 37120—Indicators for City Services and Quality of Life

The indicator framework of ISO 37120 [39] focuses on city services and quality of life as a contribution to the sustainability of the city. In more detail, the indicators included in ISO 37120 have been developed to help cities a) measure performance management of city services and quality of life over time, b) learn from one another by allowing comparison across a wide range of performance measures and c) support policy development and priority setting. The 111 Key Performance Indicators identified by the framework are clustered under the same 23 themes as in ISO 37122: Economy, Education, Energy, Environmental and Climate Change, Finance, Governance, Health, Housing, Population and Social Conditions, Recreation, Safety, Solid Waste, Sport and Culture, Telecommunications, Transportation, Urban/local Agriculture and Food Security, Urban Planning, Wastewater and Water. Similarly to ISO 37122, the relevant categories are Economy (9 KPIs), Energy (8 KPIs), Environment and Climate Change (9 KPIs), Finance (5 KPIs), Governance (4 KPIs), Housing (5 KPIs), Solid Waste (10 KPIs), Telecommunication (2 KPIs), Transportation (8 KPIs) and Urban planning (5 KPIs), summing up to a total number of 65 KPIs to be studied within this work.

2.4.5. ETSI Technical Specification on KPIs for “Sustainable Digital Multiservice Cities”

In Europe, the standardization activities on Smart sustainable cities are coordinated by a joint effort between CEN, CENELEC and ETSI on the Sector Forum on Smart and Sustainable Cities and Communities (SF-SSCC), created in January 2017, and following the work of a similar coordination group [40,41]. There is one set of smart sustainable city indicators that has been published by ETSI in the form of a technical specification on Key Performance Indicators for “Sustainable Digital Multiservice Cities” [42,43]. These indicators were originally defined by the European CITYkeys initiative, together with European cities, based on the analysis of 20 cities’ needs, 43 existing indicator frameworks and feasibility testing by approximately 50 cities and other stakeholders. The indicators are arranged in an extended triple bottom line sustainability framework, including the themes people, planet, prosperity, governance and propagation, and completed with specific smart city indicators. Under the main themes, subthemes conforming to major policy ambitions have been identified. Under these subthemes, in total, 73 city indicators in different categories have been selected. The selection has been based on an inventory of 43 existing indicator frameworks for cities indicators. The majority of the indicators in the ICT have been derived from existing indicator frameworks, while new indicators have been suggested to fill gaps in existing frameworks. The relevant categories for this work are related to Planet (energy and mitigation, climate resilience, pollution and waste), Prosperity (jobs creation, green economy, innovation) and Governance (organization and community involvement).

3. Proposed Evaluation Methodology for Selecting KPIs

The research methodology applied in this study builds upon an extended variety of frameworks and initiatives identified and presented in Section 2, with a view to capitalize on experiences and lessons learned but also to further increase the transparency and objectivity of the selection process. An iterative approach is adopted in this study, requiring the active involvement of various stakeholders during the development of the final KPI list. Additionally, a solid KPI evaluation process is applied, including specific criteria and a scoring system to achieve having a shortlist of KPIs. The experiential procedure presented below reflects the needs of lighthouse cities to meet their energy efficiency goals but can be easily adapted to the needs of every smart city project. The following sections present the procedure followed for identifying the POCITYF KPIs in a more generic way, serving as a recommendation guide. This section further aims to answer the second research question “Which of the KPIs used in the reviewed frameworks are the most suitable for assessing the energy transition of smart city projects?” as well as the third research question “How can a project-specific shortlist of KPIs be developed?”. The authors understand though, that not all cities have the capacity and the resources to conduct such detailed analyses. For that reason, detailed results deriving from the implementation of the recommended methodology in POCITYF (relating again to the third research question as a project-specific use case), are presented in Section 4 and can potentially be used as a “ready-to-be-used” set of KPIs. This can also serve as an extra step towards utilizing common KPIs in smart city projects, thus facilitating their benchmarking.

3.1. Dimensions Definition for Indicator Analysis

Before proceeding with the identification of potential indicators that can serve the needs of a smart city, there is a need to define which are the most prevalent dimensions— parameters that need to be considered for efficiently assessing and monitoring energy-efficiency targeting solutions. This process helps to ensure that relevant KPIs, which cover all aspects affecting the sustainable energy transition of smart cities, will be selected. Table 3 summarizes the different dimensions identified during the analysis conducted in Section 2. It should be mentioned that for similar-oriented dimensions (e.g., planet, environmental, carbon, and climate change; prosperity and economic; social, society, culture, living, people, and human capital), clustering was applied to provide a more concise overview of the most frequent dimension. Based on the analysis conducted in Section 2, eight (8) dimensions are most frequently presented in the inventory of the KPI relevant framework sources identified (Table 3). The most intensively appearing dimensions are: technical, environmental, economic, ICT, mobility, social, governance and propagation.
The dimensions of “governance” and “propagation” are the least appearing when compared to other dimensions in relevant frameworks but are of equal importance in the authors’ opinion since they seem to be catalyzing the energy transition process. Governance is connected to the current EU legislative framework, which is not uniform but fragmented across the various EU countries, reflecting the capacity of the local governments to manage and valorize energy transition opportunities. The dimension of “propagation” seems to be also of significant importance in smart city projects for evaluating the potential of scaling-up, dissemination and replication to other locations, other contexts and other cities while depending on the inherent characteristics of the project but also on external factors such as market conditions. ICT is also not so frequently presented, but this is mostly due to the fact that ICT KPIs are embedded within other dimensions.
POCITYF has adopted all eight dimensions towards setting a holistic performance framework, corresponding with the type of solutions and actions to be implemented. This set of KPI dimensions allows measuring and to assessing the positive energy transformation achieved by cities while implementing energy efficiency interventions. We opted to rename the Technical dimension to Energy as KPIs included under this specific dimension were mostly reflecting energy-related aspects. Table 4 presents the eight dimensions adopted in POCITYF along with a short description and some examples of relevant KPIs.

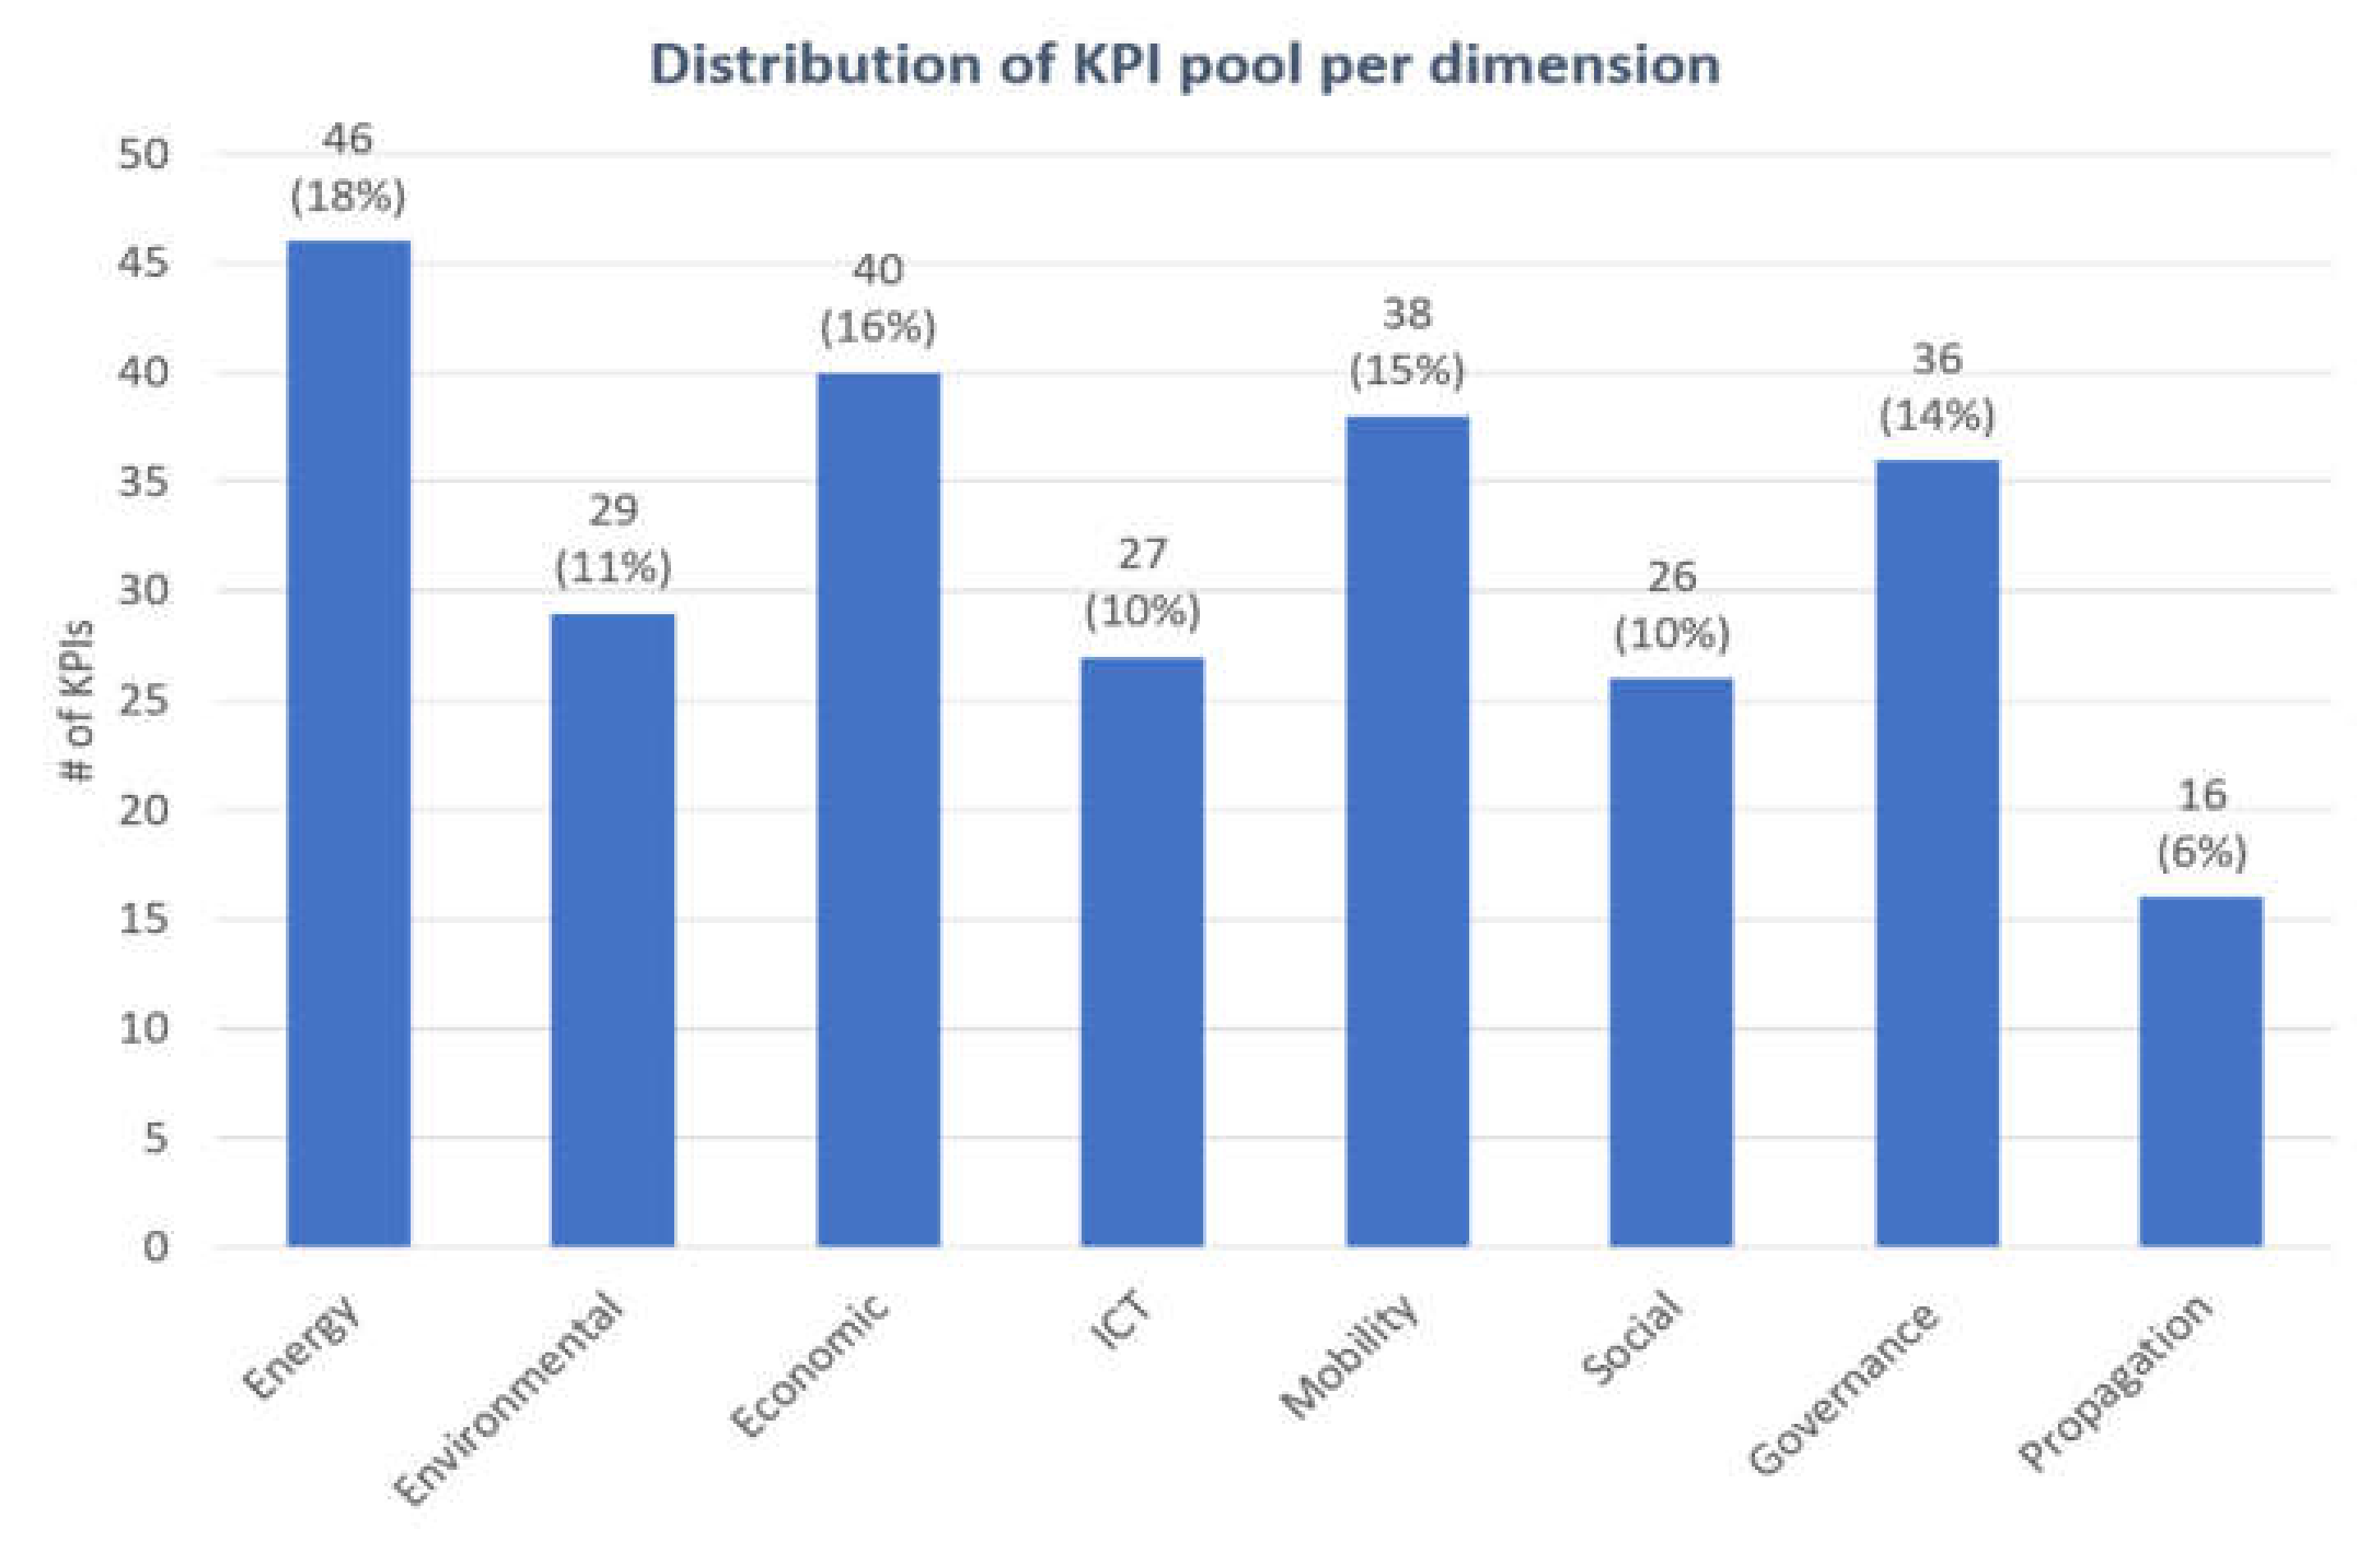
3.2. Screening Process—Development of an Indicator Pool

As a next step, all 1928 indicators included in the KPI frameworks presented in Section 2 were analyzed and assigned to one of the eight defined dimensions. Indicators that: a) had an unavailable or unclear definition, b) address issues that cannot be significantly and directly affected by the implementation of the positive energy transformation project (e.g., employment at a national level) and c) are too technology- or site-specific (e.g., efficiency of a defined type of heat pump) were excluded from the analysis. The reason for applying this “screening” process is to facilitate the next step, which includes the detailed evaluation of each indicator by a panel of experts for ensuring that a filtered pool, including only highly relevant indicators, will be assessed. Moreover, similar indicators (e.g., using different terminology and/or utilizing different units of measurement) were included only once in the pool. This highly reduced the total number of indicators included in the pool, since it was observed that a lot of frameworks were building upon previous frameworks (and especially SCIS), thus repeating relevant information.
This initial screening process resulted in a pool of 258 indicators that can potentially be adopted by smart city projects covering the selected dimensions. A more detailed breakdown of the number of indicators included in each category, as well as further discussion and analytics, is provided in Section 4. The complete indicator pool is available as Supplementary Material (Table S1).

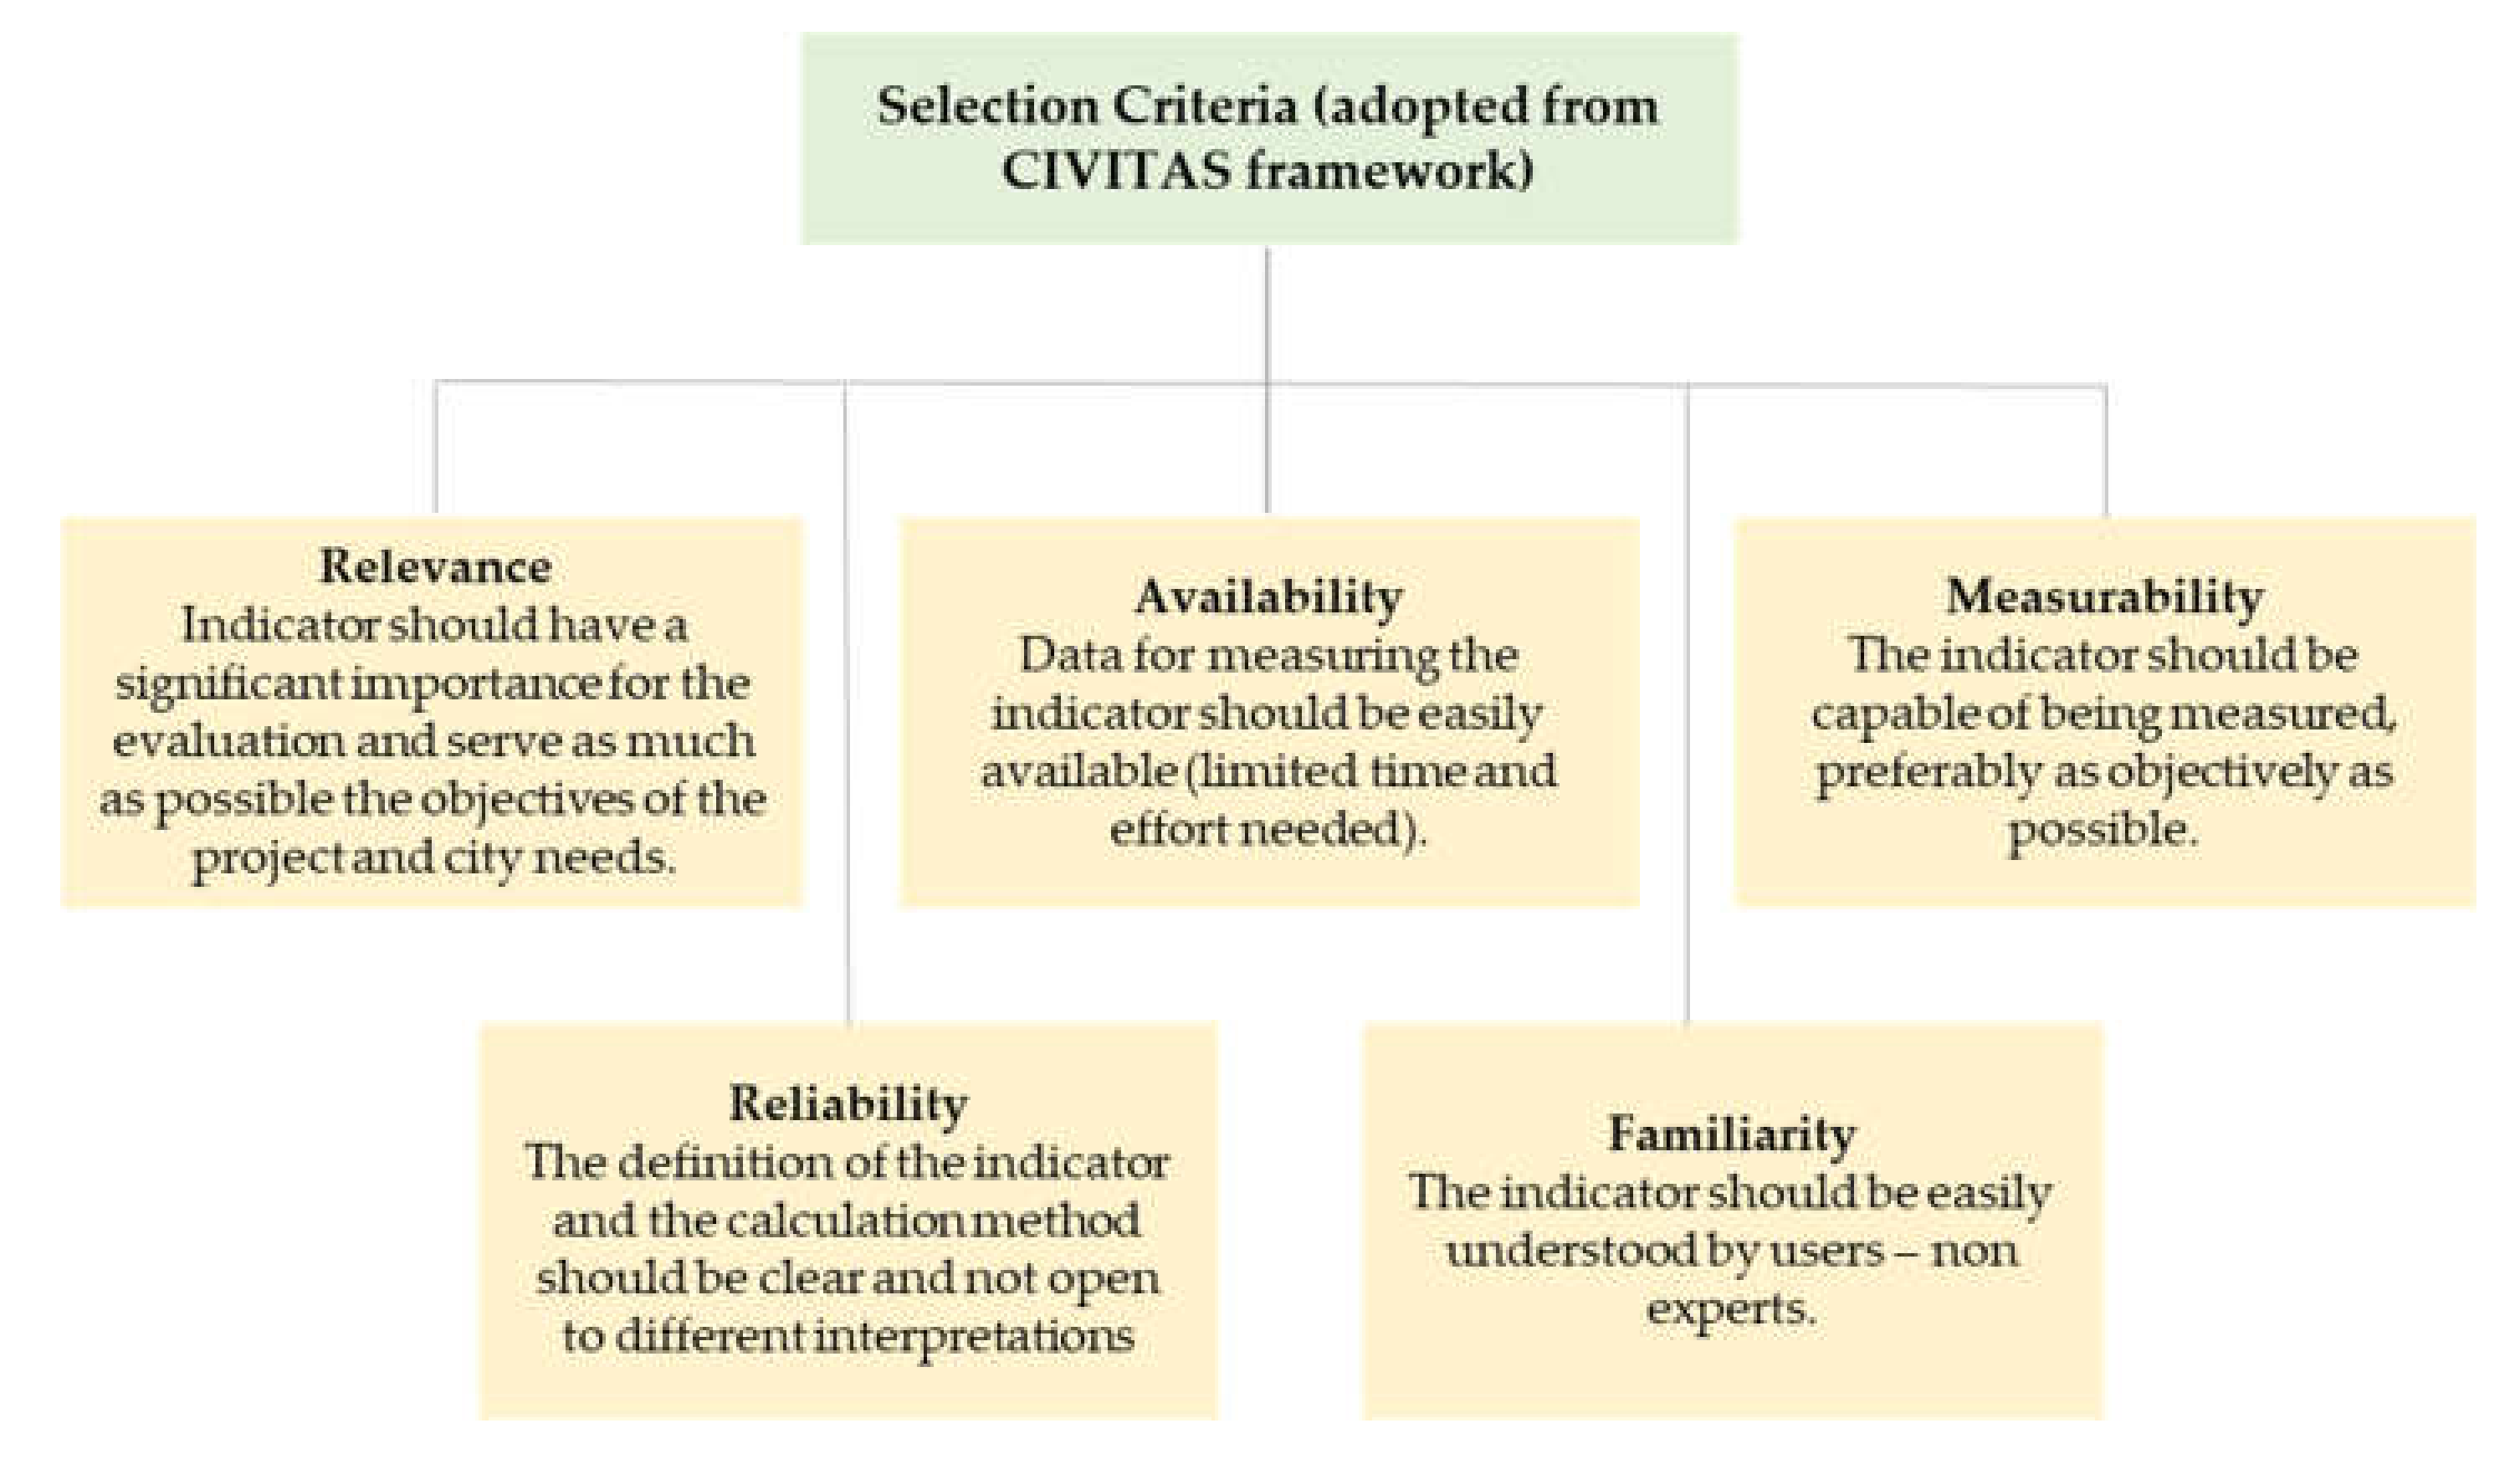
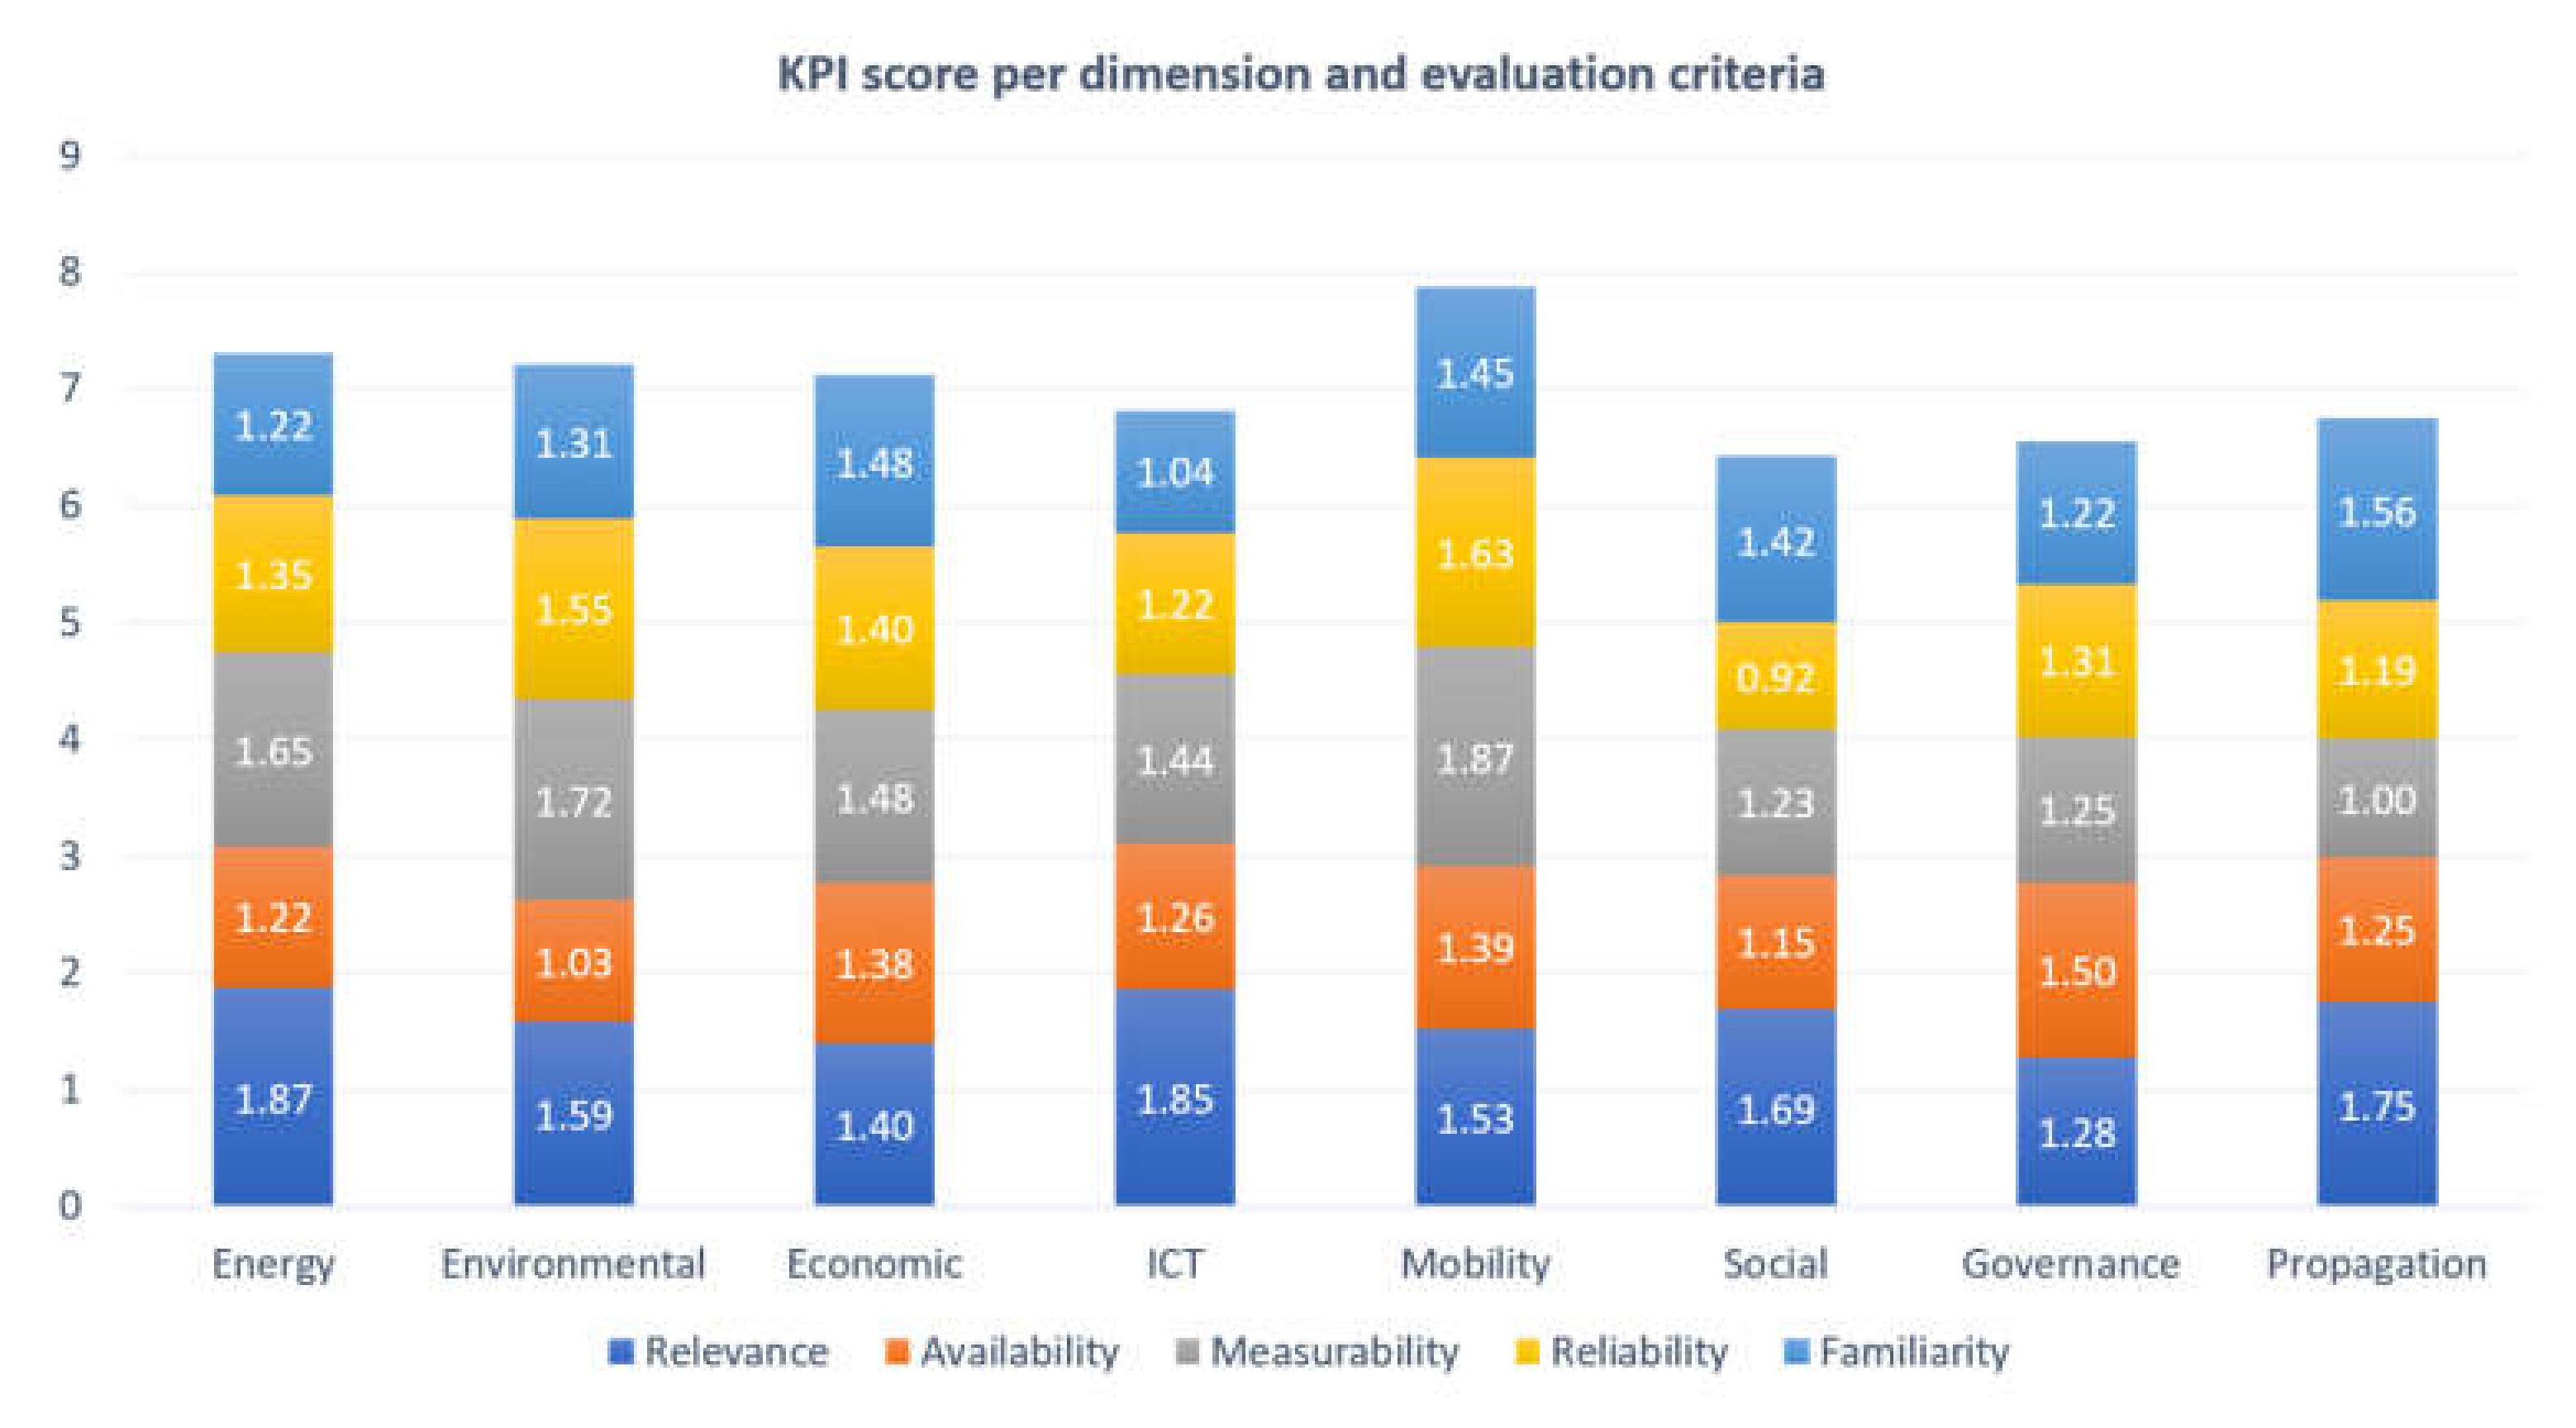
3.3. Evaluation Process—Towards a Final KPI List

Adopting all the KPIs included in the defined pool would make their monitoring process quite overwhelming and nearly impossible to be applied in practice. As a result, there is a need to define a concrete process to narrow down the most appropriate KPIs for inclusion into the final KPI list. To address this issue, we suggest building upon the selection criteria proposed by the CIVITAS framework [44] (also adopted by several other projects like CITYkeys, IRIS, etc.) to achieve a shortlist of indicators. More specifically, the following iterative evaluation process was adopted in the POCITYF project and is described below.
Initially, every potential KPI included in the pool was assessed using a three-point scoring system per criterion (0 points: The indicator does not satisfy this criterion adequately; 1 point: The indicator satisfies this criterion sufficiently; 2 points: The indicator fully satisfies this criterion). The evaluation was performed by a carefully selected panel of experts (see acknowledgments) who are members of the POCITYF consortium and have extensive experience and expertise in technology and in the design of positive energy transformation developments while they also oversee POCITYF implementation. The criteria applied are presented in Figure 1.
The process of applying the evaluation criteria to the KPI pool resulted in each indicator receiving a score from 0 (minimum score) to 10 (maximum score). As a second step, the indicators with the highest score were selected. A cut-off rule of a minimum score of 7 points was set for all indicators in order to be considered for selection. In case two indicators served the same purpose, the one with the highest score was selected, whereas in case of equal scores, the indicator with the highest score in relevance was selected. The following criteria were further taken into account while selecting indicators:
  • Completeness: The set of indicators should consider all aspects of the implementation of smart city projects. In that respect, indicators had to be selected to cover all defined dimensions as described in Section 3.1.
  • Non-redundancy: The set of indicators should not measure the same aspect of a subtheme. Extra care was given as to not include indicators that assess the same parameter (double counting) even if the score was higher in comparison with other indicators.
  • Independence: Small changes in the measurements of an indicator should not influence preferences assigned to other indicators in the evaluation.
Resulting from this process, the number of indicators to be included in the final POCITYF KPI list was reduced to 68 from the initial 258. During this step, the scope and the unit of measurement of indicators were configured, if necessary, in order to improve the effectiveness of evaluation and comply with the principles of sustainable development. In many cases, absolute units (e.g., kWh consumed) had to be altered into relative ones (e.g., kWh consumed per m2) to better serve the aim of supporting decision making and for comparison purposes. Finally, an iteration with various stakeholders (16 in total, which refers to entities and not necessarily number of persons), including POCITYF technology providers (13), city planners/authorities (2) and energy agencies (1), was necessary for the final KPI list. Although the above-mentioned criteria are especially important for KPIs prioritization, it is also of major significance that these KPIs reflect the opinion and needs of the POCITYF ecosystem and especially city needs. To ensure this, outcomes from the above-described steps were shared and iteratively discussed with city site managers and key technology providers of POCITYF for their review. In this way, indicators that presented an interest for the cities were integrated or excluded by the framework, leading to the finalized POCITYF’s KPI list. The finalized list includes a total of 63 indicators. Detailed results from this evaluation process and the final KPI list for the case of POCITYF are presented in Section 4.1.

3.4. Clustering and Granularity Evaluation Levels

Once the final list of KPIs has been defined, the KPIs can be clustered according to their special characteristics (type of indicator) and the scale of evaluation (spatial and temporal) they address. This step, although it can be considered as optional, is important as it facilitates the monitoring procedure and further increases the transparency of the assessment to be performed. Additionally, the detailed analysis of KPIs clusters can lead to the identification of critical omissions at an early stage (e.g., KPIs included in the list do not adequately cover the evaluation of different spatial scales).

3.4.1. Orientation—Type of KPIs

KPIs defined through the aforementioned process target both the technologies to be implemented as well as the impact goals of each smart city project. KPIs focusing on the implementation of solutions are essential towards proper monitoring and evaluation of each integrated technology’s effectiveness and progress. Additionally, in the core of SCC projects’ vision and planned actions are their expected impacts. Chosen KPIs are obliged to provide metrics on these impacts, which should assess the benefits deriving from the solutions’ implementation. Thus, the selected KPIs can be categorized into two (2) levels based on their orientation:
  • Output-oriented KPIs: These KPIs are simple concrete indicators for monitoring the progress and effectiveness of implementation (e.g., number of smart meters, charging points, users of apps).
  • Impact (outcome) oriented KPIs: These indicators should assess the benefits of interventions as well as the higher-level goals to which energy transition projects will contribute (e.g., savings in greenhouse gas (GHG) emissions, improved air quality, increased replicability etc.). The KPIs assessing the impact-oriented evaluation level are extremely important as they can be considered as the end-result which positive energy transition development projects are pursuing through their implementation activities.
Multiple output-oriented KPIs can monitor the contribution towards one impact target, to be assessed by the impact-oriented KPI.

3.4.2. From a Building to a City Level—Spatial Scale

The energy transition project undertaken by the city should aim to create positive-energy mixed-used building blocks and districts while advancing on issues such as integrated planning, social engagement, circular economy and green financing. The solutions developed need to be not only replicated but also gradually scaled up to city level. Scalability is of utmost importance and a key requirement for the wide-scale rollout of the innovative solutions. It refers to the possibility of increasing the size of the project without compromising its efficiency and effectiveness. Cities that can apply and scale-up smart solutions will become more attractive in terms of living conditions, contributing to novel business models and eventually more local jobs creation towards sustainable growth. In this light, the envisioned interventions must be assessed in different spatial granularity levels in order to properly monitor their progress and performance and comply with the aforementioned scalability requirement. Therefore, KPIs should include a spatial scaling component and they should be selected, keeping always in mind the necessary expanding character of the smart solutions. In this study, four (4) spatial levels of evaluation have been determined, based on SCIS and are suggested: a) building level, b) building block (set of buildings level), c) district level and d) city level. The scaling to a city level is a complicated procedure as many smart city solutions target building blocks and districts. Nevertheless, a generalized evaluation on city level can be performed by focusing on the previous granularity levels and projecting impact on a city level. For district and city levels of evaluation, the respective boundaries and corresponding energy flows must be defined properly, including all dimensional indicators. Aggregation and averaging methods can be used towards this evaluation.

3.4.3. From Present to Future—Temporal Scale

Smart energy efficiency solutions should aim to stand the test of time and provide ground for replication activities in other cities. To make sure that the project delivers long-term impact to the cities, projects should focus on citizen needs and embrace citizen-centric design. As most projects last for a certain period of time (several years), the assessment of the innovative solutions’ performance and main impact in the local societies cannot be exclusively determined during their duration. Each city is a dynamic ecosystem with evolving needs and continuous development, and thus KPIs need to take this time component into account when assessing the technologies implemented. From an economic/business-related perspective, the performance of solutions in different timeframes is also extremely important for lowering financial risks and promoting long-term investment. Moreover, smart city projects should aim towards developing bold city visions covering urban planning, technical, financial and social aspects. Towards this goal, indicators should provide the required temporal perspective to help cities determine optimal solutions. Expected strategic impact should also be structured in different temporal granularity levels. In this light, we define three (3) temporal frames:
  • In-project (short-term): In this temporal level, indicators should be evaluated during the development project duration. This temporal level of evaluation provides important information on the progress of a solution/service during the project and its performance relative to the main objectives of the project. The energy transition of the LH cities during the project’s lifetime can be easily assessed by evaluation in such short-term intervals.
  • End-of-project (mid-term): The assessment of technologies at the end of the project provides information on the project’s overall performance and impact in the local societies. Aggregation of the short-term level can be used to calculate the indicators by summation, averaging, etc. whenever this is applicable.
  • Post-project (long-term): The post-project assessment falls outside of the projects’ duration. Nevertheless, cities can continue monitoring the performance of solutions and their impact on their bold city visions. The solutions to be implemented during a smart city project are not static, and their interaction with other city solutions as well as performance in the long run should be evaluated in such a temporal scale to assess their long-standing success and provide feedback for future projects.

4. Results

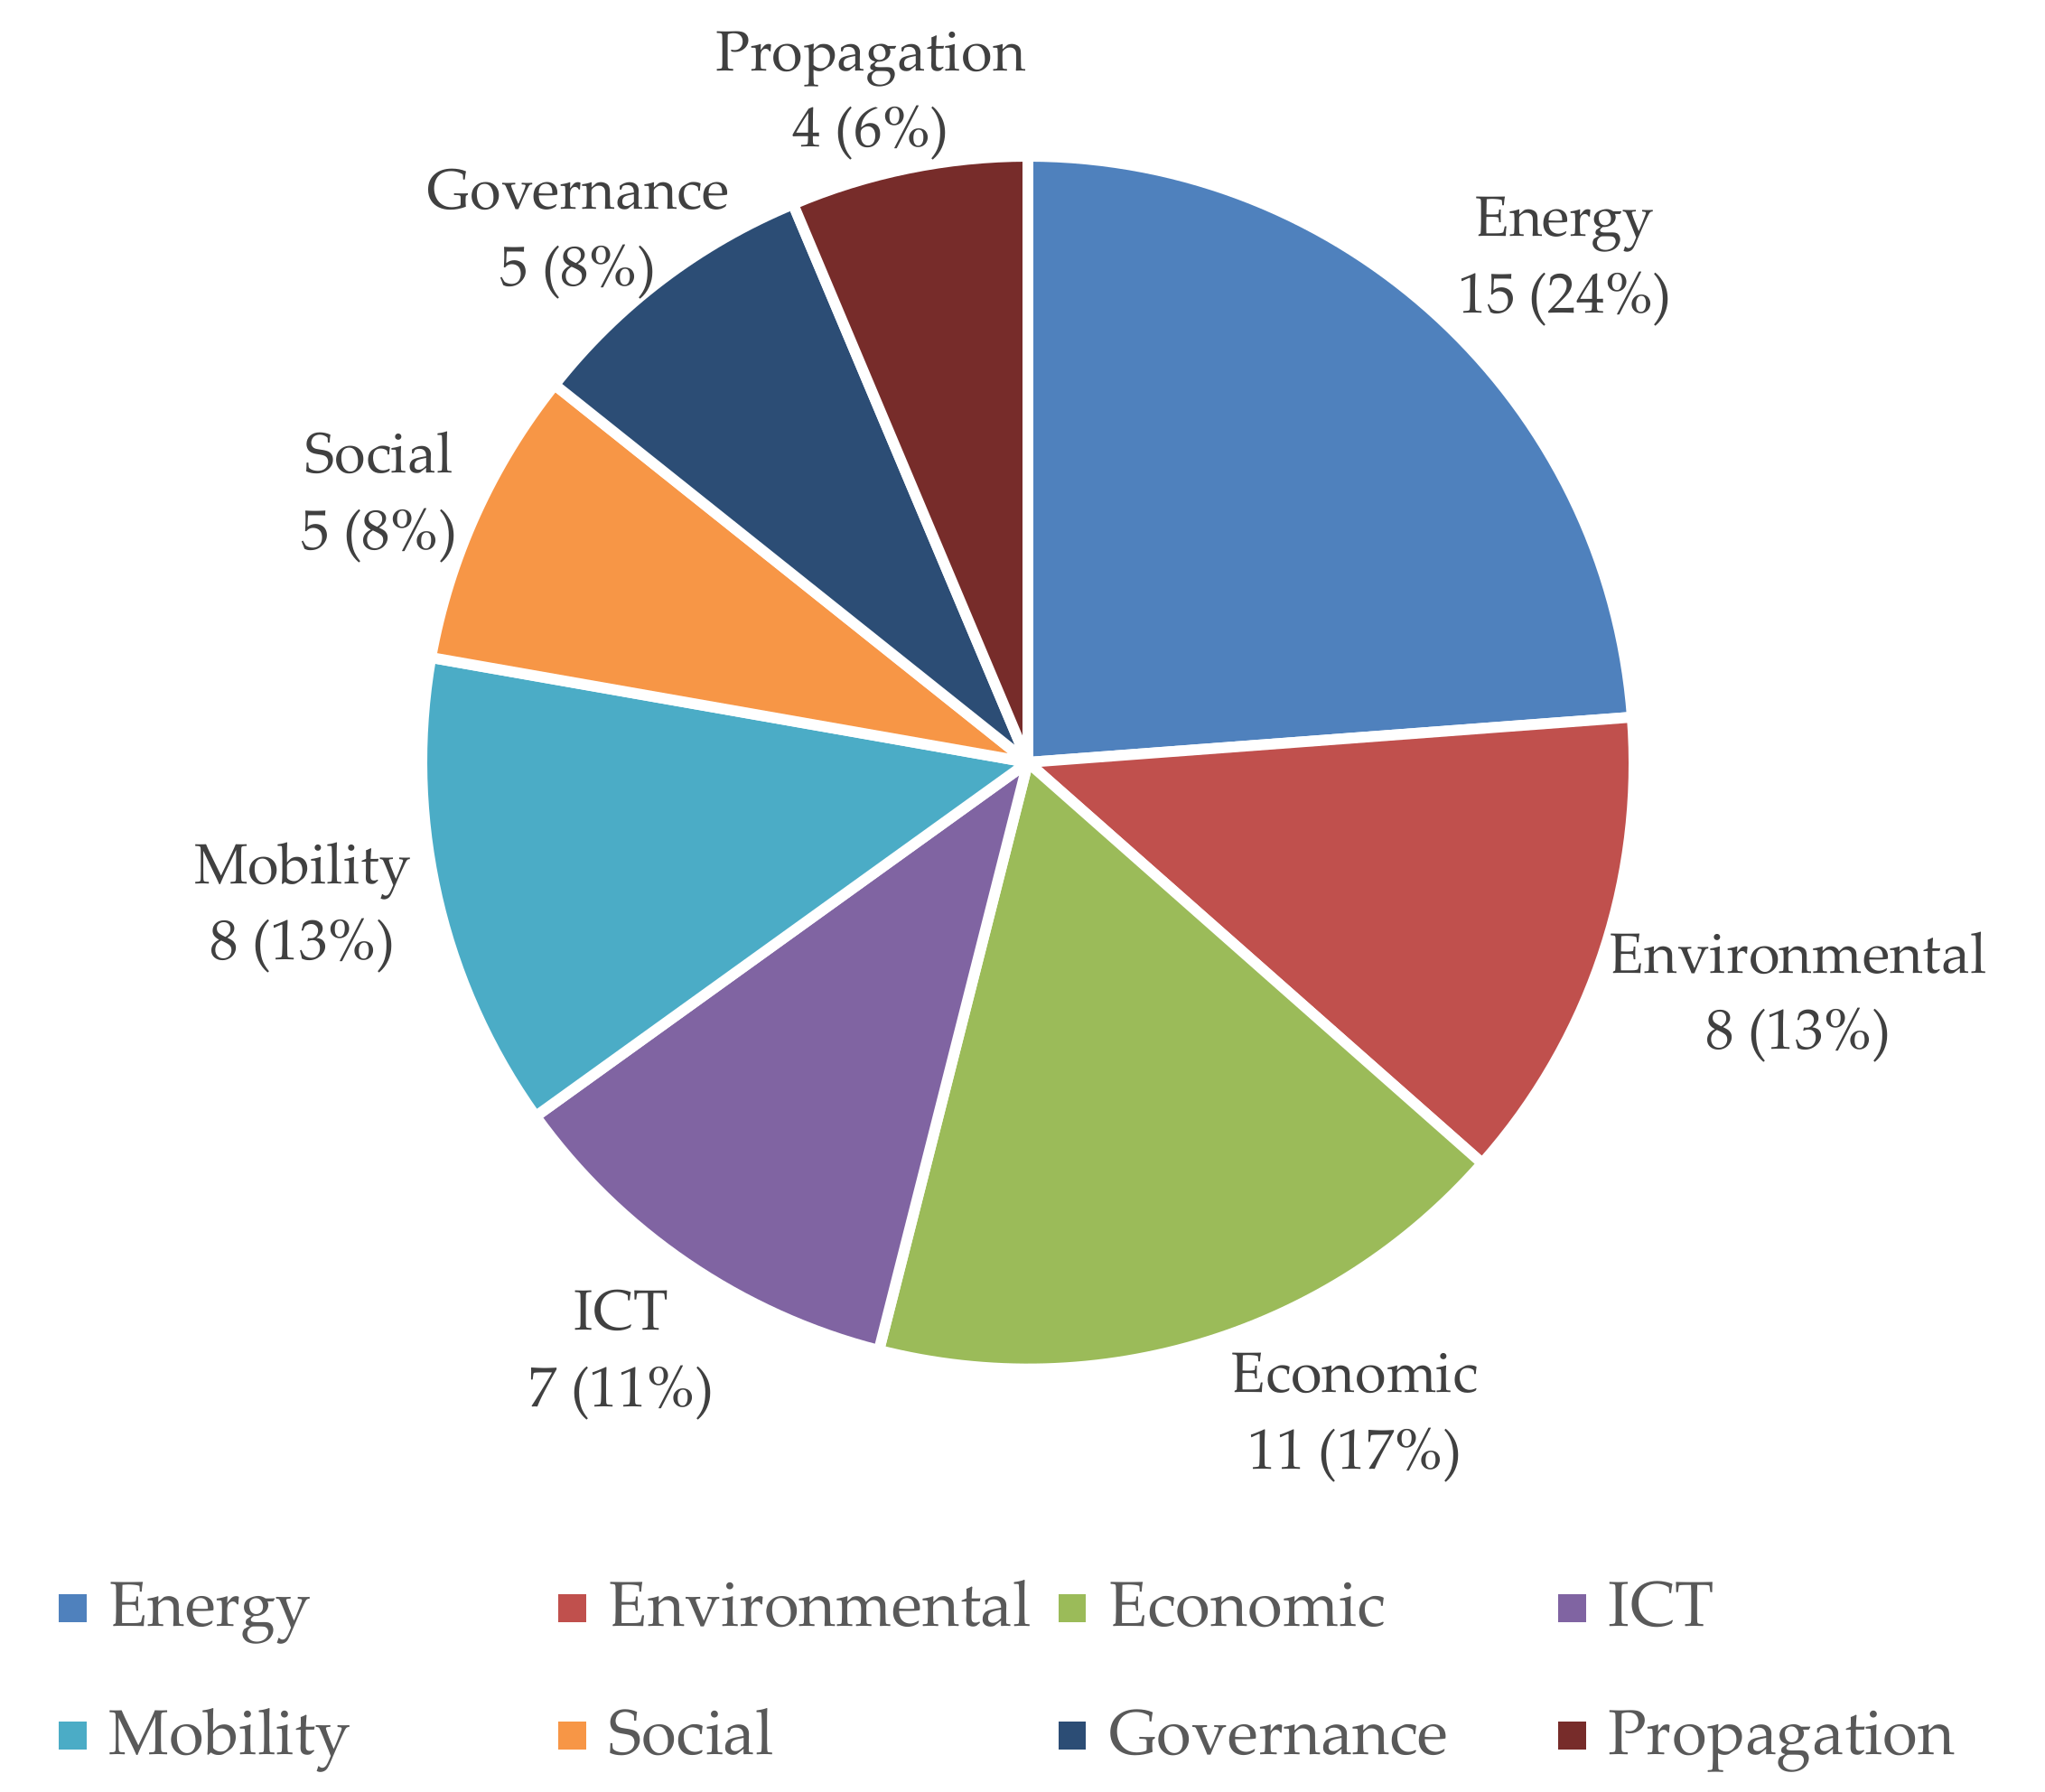
4.1. Evaluation Results—Final KPI List of POCITYF Project

The initial screening process of the 1928 indicators presented in Section 3.2 resulted in a pool of 258 indicators which can potentially be adopted by smart city projects covering the dimensions Energy, Environmental, Economic, ICT, Mobility, Social, Governance, and Propagation. A breakdown of the percentage of indicators reflecting each dimension is presented in Figure 2. The Energy dimension included the highest number of indicators (46), followed by the Economic (40), Mobility (38), Governance (36), Environmental (29), ICT (27), Social (26) and Propagation (16). The Energy dimension has central importance as technology is the motor towards achieving the ambitious goals of smart cities and energy transition is at the core of EU strategy for climate change mitigation. Then, technology-driven economic development can be supported by the Smart City paradigm if seen as the top of a hierarchy that includes versatile benefits, such as cost savings, security, livability, convenience, satisfaction and citizen involvement, all of which can be associated with economic prosperity [45], the reason why many indicators are scored as important in this dimension. Mobility also has a central role as it has always been important for moving people and goods. Especially nowadays, traffic and communication are of increased importance for facilitating the optimization of existing systems, as well as for finding alternative means of transport [46]. Finally, the smart cities’ potential to meet climate and sustainability goals make Governance the necessary catalyzer for realizing smart city projects and the Environmental dimension as the next two most important ones, followed by ICT as the backbone for collecting and delivering information at different end users [47]; the Social dimension, which reflects how individual behaviors can assist in embracing the concept of smart city; and Propagation, seen as the catalyst for successful exploitation and roll-out of smart city solutions.
The 258 indicators were then evaluated by means of the five assessment criteria reflected in the CIVITAS framework (Figure 1) in conjunction with the criteria of completeness, non-redundancy and independence, aiming to reach a final KPI shortlist of the most proper and tailored KPIs (included in the pool) for monitoring smart and sustainable cities towards energy transition. As stated before, the process followed, was to assess and score each KPI using a 3-point scale from 0 to 2, where 0 represented no satisfaction and 2 represented full satisfaction per criterion. The evaluation process of the KPIs in the pool against the criteria Relevance, Availability, Measurability, Reliability, Familiarity showed that the Energy and the ICT dimensions scored high in the Relevance criterion (1.8-1.9) as both have an increased role in the realization of smart city projects and they can both demonstrate a clear change mainly in the outputs and the optimization of the energy systems. In terms of the Availability criterion, the dimensions that scored high were Governance (1.5), Mobility (1.39), and Economic (1.38) as the data for calculating indicators in these three dimensions were considered relatively easily obtainable. The dimension of Mobility (1.87), Energy (1.65) and Environmental (1.72) scored high in terms of the criterion Measurability as all of them can be measured quantitively. In terms of the criterion Reliability, the Mobility dimension scored the highest (1.63), whereas in terms of the Familiarity criterion, the highest scores were observed in the dimension of Propagation (1.56). The lowest score (0.92) was related to the Social dimension against the criterion of Reliability, and this is explained by the fact that most KPIs in the Social dimension are measured with a Likert scale, which may reduce reliability in the measurements. Finally, ICT has scored low (1.04) on familiarity since the integration and cross-functional operation of the systems can raise the difficulty in aggregating the measurements. The results are illustrated in Figure 3.
After the above thorough analysis and evaluation through the assessment criteria as well as taking into account more horizontal reasons like the existence of an indicator in the SCIS platform, as previously mentioned, a representative number of the most appropriate indicators related with smart city projects towards energy transition and PEDs was decided to be included in POCITYF’s KPI Repository. Typically, KPIs that have a total score of 7 out of 10, satisfying also common city needs and targeted objectives and impacts, have been selected. Figure 4 depicts a detailed breakdown of the KPIs.
Table 5 illustrates the final set of KPIs adopted. The list contains 63 indicators categorized per dimension (E: Energy, EN: Environmental, EC: Economic, ICT: ICT, M: Mobility, S: Social, G: Governance, P: Propagation) providing also relevant information for each KPI about the various sources pertaining to monitoring and evaluation frameworks for smart cities in which the indicator was identified, as well as a short KPI description. It should be noted that for the analysis carried out, some KPIs were modified accordingly to express in a more meaningful way and for an exact purpose the project-specific needs. For instance, some KPIs with similar measuring or monitoring targets were grouped together and merged into one indicator, resulting in amending also the KPI name, whereas others were customized in the KPI formula or in the measurement unit, in order to be able to reflect most accurately the expected metrics, impacts and outcomes. In addition, a number of KPIs can be quantified capitalizing on a KPI formula, whereas other specific KPIs are based on a qualitative measuring and assessment process.

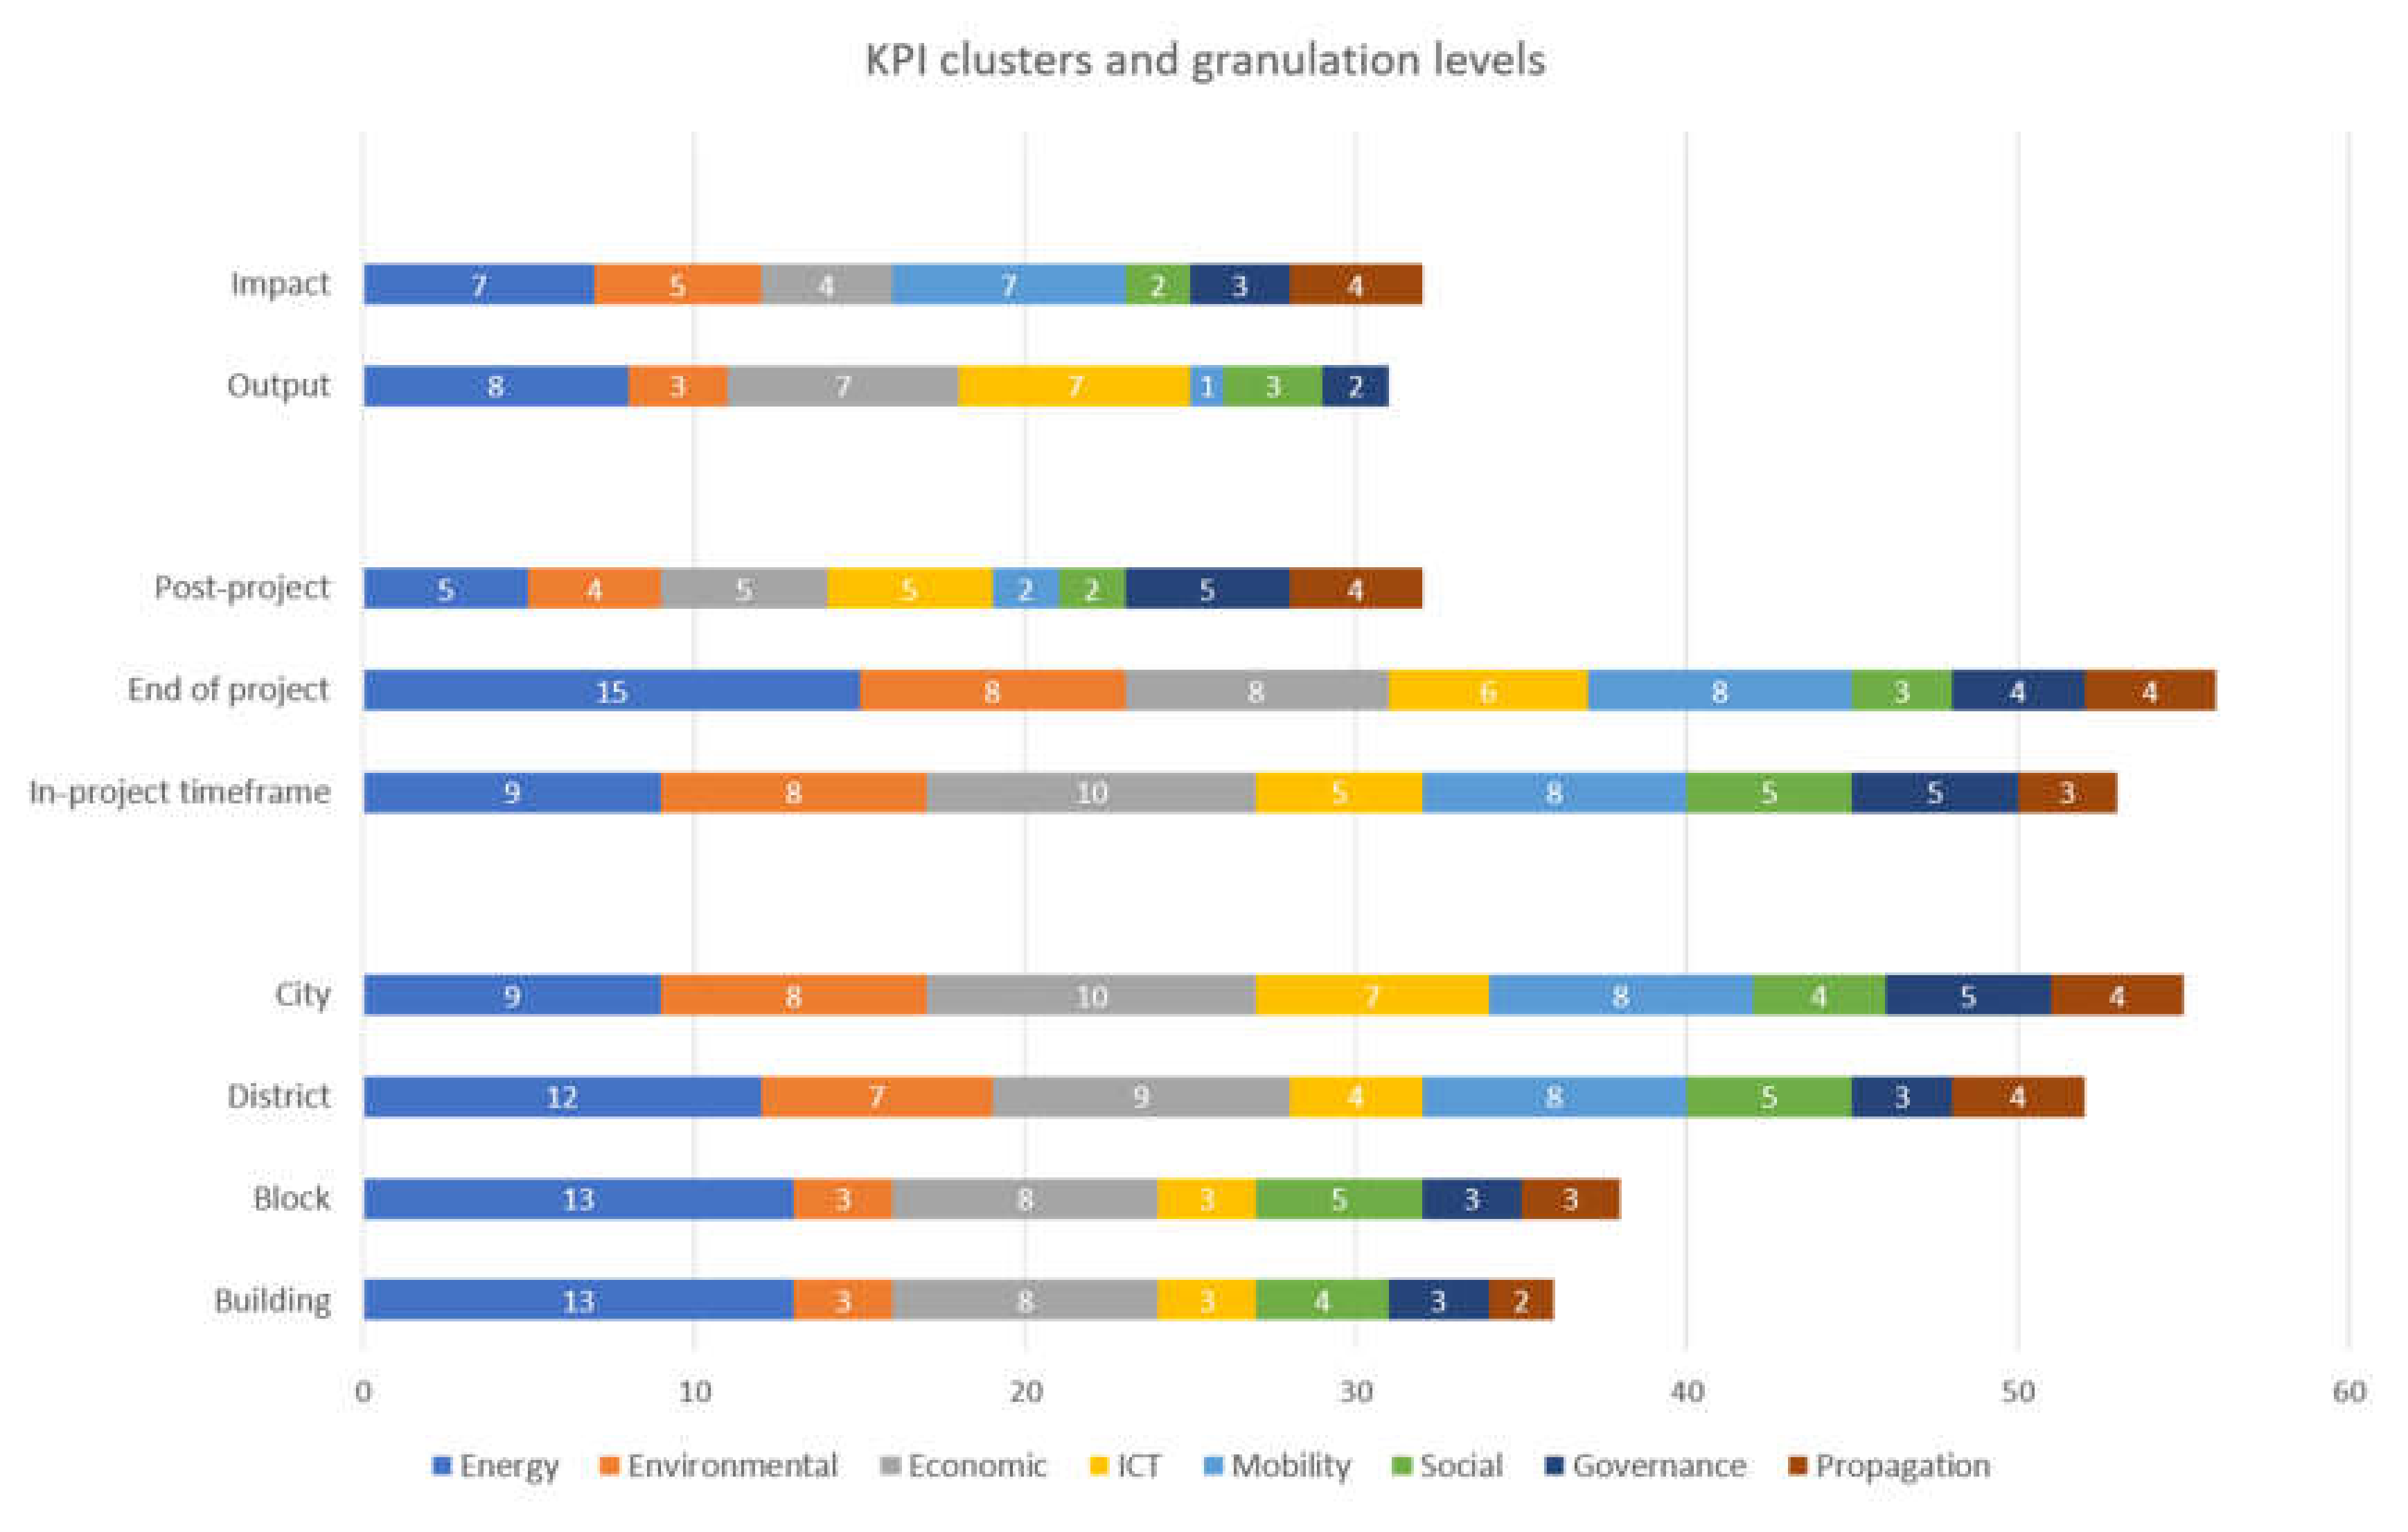
4.2. Clustering and Granularity Analytics

The POCITYF KPI list includes indicators that pertain to various levels of granularity as well as orientation as previously described in detail (Section 3.4). The clustering procedure has been performed by the authors and selected POCITYF partners in order to aggregate KPIs into the different evaluation levels necessary for a transparent, all-inclusive and properly defined monitoring and evaluation process. Each KPI has been assessed individually in order to specify the following:
  • Is it oriented towards the positive energy transformation project impact or is it focused on the output (progress and performance) of a specific action? A binary choice has been made.
  • Should it be evaluated multiple times during the project lifetime, only once at the end of the project or should evaluation be performed in the years following the project end? Multiple (more than one) choices for this temporal scale of evaluation were possible.
  • Does it apply on a building, block, district or city level? Multiple (more than one) choices for this spatial scale of evaluation were possible.
Figure 5 shows the evaluation levels and clusters along with the number of KPIs belonging to each dimension. From the total of 63 KPIs, 32 are impact-oriented while 31 are output-oriented. We note thus a great balance between KPIs that showcase POCITYF’s global impact and KPIs that assess progress and performance. This balance is greatly pronounced in the Technical (seven impact-oriented vs. eight output-oriented), Environmental (five vs. three), Social (two vs. three) and Governance (three vs. two) dimensions. KPIs dealing with Propagation are all impact-oriented (four vs. zero) as they assess compatibility, scalability and diffusion potential of solutions. These KPIs are balanced by ICT ones which are purely output-oriented (zero vs. seven) as they focus on ICT progress and performance while the impact of ICT is mainly assessed indirectly under other dimensions (e.g., resulting energy savings).
In the temporal scale of evaluation, 53 KPIs are to be evaluated during the project, 56 at the end of the project and 32 after the end of the project. The post-project evaluation level contains the least number of KPIs but all KPIs under the Governance (100%) and Propagation (100%) dimensions as these dimensions deal with important indicators that should be projected in time. Twenty-six (41%) KPIs are to be evaluated on all three temporal levels, 26 (41%) on two out of three while 11 (17%) KPIs on only one temporal level. For example, KPI—E.1 Energy Demand and Consumption is to be continuously evaluated during the positive energy transformation project, at the end of the project to reflect its success and post-project in order to adjust and evaluate the performance of interventions as demand might change. On the other hand, KPI—E.15 Percentage of street lighting managed by a light performance management system should be evaluated only once at the end of the project as it reflects the successful installations due to the project.
In the spatial scale of evaluation, 36 (57%) KPIs are to be evaluated on a building level, 38 (60%) on a PEB level, 52 (82%) on a PED level and 55 (87%) on a city level. We note that KPIs dealing with Mobility are to be evaluated only on a Positive Energy District and city level, owing to their broader granularity of application. Twenty-nine (46%) KPIs are to be evaluated on all four spatial levels, 7 (11%) on three out of four, 17 (27%) on two out of four and 10 (16%) KPIs on only one spatial level. For example, KPI—E.4 Energy Savings applies to all spatial granules as energy related interventions might be applicable to a building (e.g., BMS), PEB (e.g., PV systems), PED (e.g., DHC) or city (e.g., V2G). Contrarily, KPI—EN.5 Climate Resilience Strategy can and should be evaluated only on a city level as it assesses to what extent the city has a resilience strategy and action plan.

5. Conclusions

Smart City projects incorporate a multitude of solutions that will accelerate the energy transition of cities. This variety of solutions circulates around the citizens’ needs, which causally relate to city needs. Positive energy buildings and districts, grid flexibility, circular economy, e-mobility and citizen-driven innovation are all an integral part of smart city projects. Therefore, the projects’ success can only be evaluated through specific, tailored KPIs which need to be defined according to the scope of the specific city interventions and the stakeholders’ needs but also provide comparability through established evaluation frameworks and monitoring databases.
The core objective of this paper was thence to provide a complete list of KPIs using scientifically proven methods and procedures that takes into account the needs of the cities, the technologies to be implemented and the existing literature on KPI frameworks in order to promote comparability. These KPIs need to be inclusive, specific, transparent to misinterpretations and assess all levels of impact that a positive energy transformation project can bring forward.
The approach followed in this study differentiates from other similar frameworks in the KPI selection process for smart city projects having as a core focus the energy transition, providing (a) an extensive pool of KPIs developed after a deep review of relevant KPI frameworks (through this study, the reader can have a wide overview of the relevant literature to build upon); (b) a final set of KPIs that have been selected based on a solid evaluation procedure for increasing replicability and adaptability of results; (c) various levels of granularity and KPIs grouping which have been defined and analyzed aiming to facilitate the evaluation and monitoring procedure of SCC projects and (d) a holistic approach that can also be insightful to help the readers and stakeholders understand unfamiliar or difficult concepts related to smart city performance. Compared to the KPI reference databases studied in this work, the final list of 63 indicators lies very close to the average number (approx. 77 KPIs—see Table 3) used in the literature. This number provides an excellent balance between monitoring feasibility/facilitation and inclusion of the most important and relevant indicators. Therefore, the proposed approach can result in a comprehensive yet concise list of KPIs.
Despite our efforts to increase objectivity of the KPI selection as much as possible, there is still a level of subjectivity involved, since the scoring was performed by a panel of experts reflecting mostly the POCITYF needs. However, since most of the smart city projects that focus on the energy transition share common targets, we expect that most of the proposed KPIs are highly relevant to all these projects. The KPI list can serve as a backbone for the monitoring and evaluation activities in smart city projects, not only in terms of technological performance but also at the level of social engagement, acceptance of positive energy transformation and diffusion towards scalable and replicable innovations.

Supplementary Materials

The following is available online at https://www.mdpi.com/2624-6511/3/3/36/s1, Table S1: Indicator pool and evaluation according to pre-defined criteria.

Author Contributions

The present article is addressed by the six authors mentioned, each of whom was responsible for various aspects of the work. Specifically, conceptualization, K.A., K.K., P.G. and J.K.; methodology, K.A., K.K. and P.G.; validation, K.A., K.K. and J.K.; formal analysis, K.A., K.K, P.G. and V.A.; investigation, K.A., K.K., P.G. and V.A.; resources N.N.; data curation, K.A., K.K., P.G. and V.A.; writing—original draft preparation, K.A., K.K., P.G. and V.A.; writing—review and editing K.A., K.K., P.G., N.N. and J.K.; supervision, N.N. and J.K.; funding acquisition, N.N, K.A. All authors have read and agreed to the published version of the manuscript.

Funding

This research was funded by the POCITYF project (A positive energy city transformation framework), Grant agreement number 864400, which received funding from the European Union’s framework program Horizon 2020 for research and innovation. This APC is free of charge after the cordial invitation of Traey Wu to Komninos Angelakoglou.

Acknowledgments

The authors would like to thank the following partners from the POCITYF project for their contribution towards the final KPI list included in this work: Panagiotis Tsarchopoulos (CERTH), Aapo Huovila (VTT), José Miguel Costa (EDP), Rui Lopes (UNINOVA), Joao Formiga (EDP), Hainoun Ali (AIT), Luis Miranda (INESCTEC), João Peixoto (UW), Joep Sanderink (NEC), Martijn de Vries (NEC), Mente Konsman (TNO) and Vasiliki Georgiadou (TNO).

Conflicts of Interest

The authors declare no conflict of interest.

References

  1. REN21. Renewables in Cities Global Status Report; Paris: REN21 Secretariat; REN21: Paris, France, 2020; ISBN 978-3-948393-00-7. [Google Scholar]
  2. AirVisual. World’s Most Polluted Cities in 2019—PM2.5 Ranking. Available online: https://www.iqair.com/world-most-polluted-cities (accessed on 3 June 2020).
  3. TomTom. Traffic Index 2019—Live Congestion Statistics and Historical Data. Available online: https://www.tomtom.com/en_gb/traffic-index/ (accessed on 3 June 2020).
  4. UNFCCC. The Paris Agreement. 2015. Available online: https://unfccc.int/process-and-meetings/the-paris-agreement/the-paris-agreement (accessed on 3 June 2020).
  5. European Commission. The European Green Deal. COM (2019) 640 Final; EC: Brussels, Belgium, 11 December 2019. [Google Scholar]
  6. Bifulco, F.; Tregua, M.; Amitrano, C.C.; D’Auria, A. ICT and sustainability in smart cities management. Int. J. Public Sect. Manag. 2016. [Google Scholar] [CrossRef]
  7. Di Silvestre, M.L.; Favuzza, S.; Sanseverino, E.R.; Zizzo, G. How Decarbonization, Digitalization and Decentralization are changing key power infrastructures. Renew. Sustain. Energy Rev. 2018, 93, 483–498. [Google Scholar] [CrossRef]
  8. Hemment, D.; Woods, M.; Appadoo, V.; Bui, L. Community Key Performance Indicators (Community KPIs) for the IoT and Smart Cities; FutureEverything: Manchester, UK, 2016. [Google Scholar]
  9. Kitchin, R.; Lauriault, T.P.; McArdle, G. Knowing and governing cities through urban indicators, city benchmarking and real-time dashboards. Reg. Stud. Reg. Sci. 2015, 2, 6–28. [Google Scholar] [CrossRef] [Green Version]
  10. Dameri, R.P. Smart city definition, goals and performance. In Smart City Implementation; Springer: Berlin/Heidelberg, Germany, 2017; pp. 1–22. [Google Scholar]
  11. Bosch, P.; Jongeneel, S.; Rovers, V.; Neumann, H.-M.; Airaksinen, M.; Huovila, A. CITYkeys indicators for smart city projects and smart cities. CITYkeys Rep. 2017. [Google Scholar] [CrossRef]
  12. Sharifi, A. A typology of smart city assessment tools and indicator sets. Sustain. Cities Soc. 2020, 53, 101936. [Google Scholar] [CrossRef]
  13. Huovila, A.; Bosch, P.; Airaksinen, M. Comparative analysis of standardized indicators for Smart sustainable cities: What indicators and standards to use and when? Cities 2019, 89, 141–153. [Google Scholar] [CrossRef]
  14. Angelakoglou, K.; Nikolopoulos, N.; Giourka, P.; Svensson, I.-L.; Tsarchopoulos, P.; Tryferidis, A.; Tzovaras, D. A Methodological Framework for the Selection of Key Performance Indicators to Assess Smart City Solutions. Smart Cities 2019, 2, 269–306. [Google Scholar] [CrossRef] [Green Version]
  15. A Positive Energy CITY Transformation Framework | POCITYF Project | H2020 | CORDIS | European Commission. Available online: https://pocityf.eu/ (accessed on 10 July 2020).
  16. European Commission. SET-Plan Action 3.2, Implementation Plan, Europe to Become A Global Role Model in Integrated, Innovative Solutions for the Planning, Deployment, and Replication of Positive Energy Districts; European Commission: Brussels, Belgium, June 2018. [Google Scholar]
  17. SCIS Essential Monitoring Guides. Smartcities Information System. Available online: https://smartcities-infosystem.eu/library/resources/scis-essential-monitoring-guides (accessed on 3 June 2020).
  18. Smart Cities and Community Lighthouse Projects. Smartcities Information System. Available online: https://smartcities-infosystem.eu/scc-lighthouse-projects (accessed on 3 June 2020).
  19. Tsarchopoulos, P. IRIS D1.1: Report on the List of Selected KPIs for Each Transition Track. Available online: https://irissmartcities.eu/public-deliverables (accessed on 9 June 2020).
  20. REPLICATE-D10.2: Report on Indicators for Monitoring at City Level. Available online: https://replicate-project.eu/newsroom/downloads/ (accessed on 9 June 2020).
  21. MatchUp-D1.1: Indicators Tools and Methods for Advanced City Modelling and Diagnosis. Available online: https://www.matchup-project.eu/technical-insights/ (accessed on 9 June 2020).
  22. SmartEnCity-D7.2: Monitoring and Evaluation: KPIs Definition. Available online: https://www.smartencity.eu/ttps://smartencity.eu/news/detail/?rx_call=114 (accessed on 9 June 2020).
  23. MySMARTLife: D5.1-Integrated Evaluation Procedure. Available online: https://www.mysmartlife.eu/publications-media/public-deliverables/ (accessed on 9 June 2020).
  24. SHARING CITIES-D8.1: Common Monitoring and Evaluation Framework. Available online: http://www.sharingcities.eu/sharingcities/deliverables (accessed on 9 June 2020).
  25. TRIANGULUM-D2.1: Common Monitoring and Impact Assessment Framework. Available online: https://www.triangulum-project.eu/?page_id=119 (accessed on 9 June 2020).
  26. GrowSmarter: Publications-D5.1: Evaluation Plan. Available online: https://grow-smarter.eu/inform/publications/ (accessed on 9 June 2020).
  27. +CityxChange, D7.1-Approach and Methodology for Monitoring and Evaluation. Available online: https://cityxchange.eu/article-categories/deliverables/ (accessed on 9 June 2020).
  28. STARDUST-D7.3: Business Models and KPIs Analysis and Validation for Lighthouse Cities Interventions. Available online: https://stardustproject.eu/resources/ (accessed on 9 June 2020).
  29. Akande, A.; Cabral, P.; Gomes, P.; Casteleyn, S. The Lisbon ranking for smart sustainable cities in Europe. Sustain. Cities Soc. 2019, 44, 475–487. [Google Scholar] [CrossRef]
  30. Tan, S.; Yang, J.; Yan, J.; Lee, C.; Hashim, H.; Chen, B. A holistic low carbon city indicator framework for sustainable development. Appl. Energy 2017, 185, 1919–1930. [Google Scholar] [CrossRef]
  31. Girardi, P.; Temporelli, A. Smartainability: A methodology for assessing the sustainability of the smart city. Energy Procedia 2017, 111, 810–816. [Google Scholar] [CrossRef]
  32. Dall’O, G.; Bruni, E.; Panza, A.; Sarto, L.; Khayatian, F. Evaluation of cities’ smartness by means of indicators for small and medium cities and communities: A methodology for Northern Italy. Sustain. Cities Soc. 2017, 34, 193–202. [Google Scholar] [CrossRef]
  33. Li, Y.; O’Donnell, J.; García-Castro, R.; Vega-Sánchez, S. Identifying stakeholders and key performance indicators for district and building energy performance analysis. Energy Build. 2017, 155, 1–15. [Google Scholar] [CrossRef]
  34. Hara, M.; Nagao, T.; Hannoe, S.; Nakamura, J. New key performance indicators for a smart sustainable city. Sustainability 2016, 8, 206. [Google Scholar] [CrossRef] [Green Version]
  35. Lombardi, P.; Giordano, S.; Farouh, H.; Yousef, W. Modelling the smart city performance. Innov. Eur. J. Soc. Sci. Res. 2012, 25, 137–149. [Google Scholar] [CrossRef]
  36. United Nations. Global SDG Indicators Database. Available online: https://unstats.un.org/sdgs/indicators/database/ (accessed on 4 June 2020).
  37. ITU. Collection Methodology for Key Performance Indicators for Smart Sustainable Cities; UNECE: Geneva, Switzerland, 2017. [Google Scholar]
  38. International Organization for Standardization. ISO 37122: Sustainable Development in Communities-Indicators for Smart Cities; International Organization for Standardization: Geneva, Switzerland, 2017. [Google Scholar]
  39. International Organization for Standardization. ISO 37120: Sustainable Cities and Communities-Indicators for City Services and Quality of Life; International Organization for Standardization: Geneva, Switzerland, 2018. [Google Scholar]
  40. CEN, C. SSCC-CG final report. Smart and Sustainable Cities and Communities Coordination Group; ETSI: Sophia Antipolis, France, 2015. [Google Scholar]
  41. CEN-CENELEC. Making Standards for Europe-Smart Cities. Available online: https://www.cencenelec.eu/standards/Sectorsold/SmartLiving/smartcities/Pages/default.aspx (accessed on 4 June 2020).
  42. ETSI. TS 103 463 V1.1.1 Access, Terminals, Transmission and Multiplexing (ATTM); Key Performance Indicators for Sustainable Digital Multiservice Cities; ETSI: Sophia Antipolis, France, 2017. [Google Scholar]
  43. ETSI. GS OEU 019 V1.1.1 Operational Energy Efficiency for Users (OEU); KPIs for Smart Cities; ETSI: Sophia Antipolis, France, 2017. [Google Scholar]
  44. Rooijen, T.; Nesterova, N. Deliverable 4.10: Applied framework for evaluation in CIVITAS PLUS II, WP4, May 31 2013; CivitasWiki Project; Grant Agreement No.: 296081; CIVITAS Secretariat, EC: Brussels, Belgium, 2013. [Google Scholar]
  45. Chordant-ABI Research. Role of Smart Cities for Economic Development. White Paper. 2018. Available online: https://www.chordant.io/white_papers/abi-research-role-of-smart-cities-for-economic-development (accessed on 9 June 2020).
  46. Mobility. Center for Smart Cities. Available online: https://www.ict-smart-cities-center.com/en/smart-cities/mobilitaet/ (accessed on 9 June 2020).
  47. Dameri, R.P. Using ICT in Smart City. In Smart City Implementation: Creating Economic and Public Value in Innovative Urban Systems; Dameri, R.P., Ed.; Progress in IS.; Springer International Publishing: Cham, Switzerland, 2017; pp. 45–65. ISBN 978-3-319-45766-6. [Google Scholar]
  48. Luthander, R.; Widén, J.; Nilsson, D.; Palm, J. Photovoltaic self-consumption in buildings: A review. Appl. Energy 2015, 142, 80–94. [Google Scholar] [CrossRef] [Green Version]
Figure 1. Evaluation criteria applied to the Key Performance Indicator (KPI) pool.
Smartcities 03 00036 g001
Figure 2. Percentage of indicators (%) included in the eight dimensions of the proposed pool.
Smartcities 03 00036 g002
Figure 3. Scores of KPIs included in the pool against evaluation criteria.
Smartcities 03 00036 g003
Figure 4. Number of selected indicators (%) included in the 8 dimensions of the finalized KPI list.
Smartcities 03 00036 g004
Figure 5. KPI evaluation levels and clusters.
Smartcities 03 00036 g005
Table 1. Indicative assessment frameworks by EC-funded LH projects.
Project NameAssessment Framework
IRIS
Integrated and Replicable Solutions for Co-Creation In Sustainable Cities
Ref. [19]
The assessment framework uses an agile and holistic approach defining a set of 75 KPIs categorized in six (6) dimensions—technical, environmental, economic, social, ICT and legal—along with a targeted clustering of solutions in five (5) Transition Tracks as follows: TT#1-Smart renewables and closed-loop energy-positive districts, TT#2- Smart Energy Management and Storage for Grid Flexibility, TT#3-Smart e-Mobility Sector, TT#4-City Innovation Platforms (CIP) and TT#5-Citizen Engagement and Co-Creation. Indicative calculated thresholds for scalar quantification and monitoring performance of the solutions through the assessment criteria are also proposed.
REPLICATE Renaissance of Places with Innovative Citizenship and Technologies
Ref. [20]
The proposed KPI framework contains a total of 56 KPIs classified under seven (7) dimensions covering as a whole city performance; City description (5 indicators), Energy and Environment (14 indicators), Mobility and Transport (14 indicators), Infrastructure (6 indicators), Governance (5 indicators), Social (5 indicators), and Economy and Finance (7 indicators). The indicators are further analyzed into three evaluation/applicability levels; a) National/ Regional, b) Local / City, c) District.
MATCHUP Maximizing the Upscaling and replication potential of high-level urban transformation strategies.
Ref. [21]
MatchUp’s evaluation framework is based on the concept of sustainable development, including two (2) evaluation levels (city level and project level) and a total of 188 indicators. The indicators have been classified under three (3) dimensions, namely environment, economy and social, and grouped into four (4) fields of implementation activities: a) Energy Efficiency in Buildings and Districts, b) Mobility/Transport, c) ICT and Urban Platforms and d) Citizens and Society, along with some additional indicators related to Governance.
SMARTEnCITY Towards Smart Zero CO2 Cities across Europe
Ref. [22]
The evaluation framework was developed considering the type of implemented solutions within the project; district renovation, urban mobility and citizen engagement; adopting indicators grouped into four (4) categories—technical, environmental, social and economic—and determining five (5) evaluation protocols—Energy Assessment, ICT, LCA, Mobility and Cross-Cutting. A list of KPIs for each category (technical, environmental, social, and economic) and by type of intervention (district renovation, mobility and citizen engagement) is provided, with a total of 149 indicators.
MySMARTLIFE Smart Transition of EU cities towards a new concept of Smart Life and Economy
Ref. [23]
The presented evaluation framework defines a total of 151 KPIs classified across six (6) fields—Energy and Environment, Mobility and Transport, Urban Infrastructure, Citizens, Economy and Governance—while at the same time adopting the five (5) major themes of CITYkeys (People, Planet, Prosperity, Governance and Propagation). Expected impacts are grouped into five (5) specific categories: energy, environmental, economic, social and policy impacts. The framework adopts a twofold evaluation approach in order to measure the demonstration activities: project level (i.e., demonstration areas) and city level. City-level evaluation is strongly related to the overall smart city concept, aiming to identify the main challenges of the cities with city indicators and audits, while at the project level, the target is to assess the effects of the project actions in the demo sites with regards to project pillars.
SHARINGCITIES Building Smart Cities Together
Ref. [24]
The proposed framework attempts to deliver the effects of the People/Place/Platform (PPP) measures in this project, setting evaluation targets categorized into six (6) domains: a) technical performance; b) attitudes and behaviors; c) wider systemic and environmental impacts; d) security, safety and sustainability; e) institutional and business consequences and f) economic and social implications. Key targets concern the “Place” demonstrations, which consist of four different fields: Building Retrofit and Local RES Generation, Sustainable Energy Management Systems, Shared e-Mobility, Smart Lampposts. In this context, the framework is structured around a final set of 127 KPIs.
TRIANGULUM The Three Point Project / Demonstrate. Disseminate. Replicate.
Ref. [25]
The project introduces a monitoring and impact assessment framework based on a seven-stage methodology for defining expected impacts, resulting in a total of 79 indicators relevant to the following five (5) impact domains: Energy, Transport, Citizen Engagement, Socio-economic/financial and ICT deployment; aligned also well with both the preferred metrics and the respective commitments of the cities. The framework of this project provides an extensive background as to how cities gather data on energy and transport.
GROWSMARTER Transforming Cities for a Smart, Sustainable Europe
Ref. [26]
The assessment framework of the project is grounded on three (3) main dimensions which are the categories of the project interventions—better quality of life, environmental and economic–including also various sub-domains and agreed-upon relevant goals, leading to the definition of 104 indicators to measure and evaluate project/city performance. The first category, Low Energy Districts, is divided also into two sub-categories: Building Evaluation and Local Evaluation.
+CityxChange
Positive City ExChange
Ref. [27]
The specific evaluation framework builds upon a holistic approach including KPIs from SCIS focusing on technical and economic aspects of energy-related measures, as well as KPIs specifically defined for the project to measure unique interventions and social impact of the project on citizens. The KPI framework is divided into the three (3) core themes: a) Integrated Planning and Design (IPD), including KPIs measuring the impact of larger interventions to set up tools and regulations for planning purposes; b) Common Energy Market (CEM), regarding aspects of interventions changed due to ongoing roll-out or evolution of the project and c) CommunityxChange (CxC), measuring the effect on public participation in energy efficiency initiatives. The evaluation framework process results in a sum of 33 KPIs.
STARDUST Enlightening European Cities
Ref. [28]
The framework structure proposes a set of 17 indicators to monitor and assess the performance of the project solutions across five (5) diverse clusters; Building and Energy, e-Mobility, ICT, Common City Level and Long-Term Effects. The monitoring of the project is based on i) Immediate progress evaluated through concrete output indicators; ii) Achieved impacts assessed by impact indicators and iii) Long-term effects evaluated through scalability of the solutions implemented based in the LH cities, Fellow Cities and their replication potential in other cities in Europe.
Table 2. Indicative KPI frameworks assessing positive energy transformation intervention actions from scientific sources.
SourceAssessment Framework
Angelakoglou et al. (2019) [14]Angelakoglou et al. introduce a smart city KPI framework after applying a six (6)-step approach for determining the KPI repository. The 75 KPIs identified are able to evaluate both business-as-usual and novel technologies and services related to smart city solutions. The repository is categorized into six (6) dimensions (technical, environmental, economic, social, ICT and legal KPIs) and provides indicative thresholds for monitoring performance. This framework was built upon the experiences gained during the implementation of the IRIS SCC project and integrates relevant stakeholder points of view concerning the deployment of smart city solutions.
Akande et al. (2019) [29]Akande et al. propose a framework for assessing and ranking cities based on how smart and sustainable they are. Hierarchical clustering and principal component analysis (PCA) are applied to select and cluster 32 KPIs into three (3) thematic areas: a) Economy (7 KPIs) b) Environment (12 KPIs) and c) Society and Culture (13 KPIs). KPIs included in this framework are mostly fitted to assess smartness aspects on a city level.
Huovila et al. (2019) [13]Huovila et al. compare seven recently published indicator standards for smart and sustainable cities (ISO 37120:2018, ISO/DIS 37122:2018, ETSI TS 103463, ITU-T Y.4901, 4902, 4903, SDG 11+ monitoring framework). A taxonomy was developed to evaluate 413 indicators against five conceptual urban focuses (types of urban sustainability and smartness), ten sectoral application domains (energy, transport, ICT, economy, etc.) and five indicator types (input, process, output, outcome, impact). The results clearly discriminate between indicator standards suited for evaluating the implementation of predominantly smart city approaches versus standards more focused on sustainability assessment. As within this study most of the KPI frameworks identified by Huovila et al. are already examined, and emphasis was mostly on ITU-T KPIs and the taxonomy developed.
Tan et al. (2017) [30]Tan et al. propose an indicator framework for the assessment of smart cities putting emphasis on low-carbon city aspects. A total of 20 KPIs are separated into seven (7) assessment categories: a) Energy pattern, b) Water, c) Social and living, d) Carbon and environment, e) Solid waste, f) Urban mobility and g) Economic. The framework also provides benchmarking values that allow intercomparisons among cities’ performance.
Girardi and Temporelli (2017) [31]Girardi and Temporelli propose a new methodological approach, called Smartainability, that is able to estimate using quantitative and qualitative KPIs the extent to which smart cities are more sustainable (and smart) due to the deployment of innovative technologies. The assessment is performed prior to the application of the respective technologies. The methodology was built upon the Guidelines for conducting a cost–benefit analysis of Smart Grid projects, a study made by European Commission JRC, and Smart Cities—Ranking of European medium-sized cities, realized by Vienna University of Technology, University of Ljubljana and Delft University of Technology. Four (4) dimensions of analysis are applied: a) Environment, b) Economy, c) Energy and d) Living. The methodology was validated at a district level (Expo Milano 2015 site). Further recommendations are available for the implementation at a city level, including a set of 28 KPIs and a new dimension—People—which evaluates the community life improvement.
Dall’O et al. (2017) [32]Dall’O et al. provide a method for assessing the smartness of a city through a set of indicators focusing on small and medium-sized cities and communities. The KPIs selected are consistent with the ISO 37120 standard and are inspired by the environmental indicators included in Sustainable Energy Action Plans under the Covenant of Mayors Initiative. A total of 70 KPIs are structured around seven (7) evaluation areas: a) smart economy (7 KPIs), b) smart energy (12 KPIs), c) smart environment (6 KPIs), d) smart governance (12 KPIs), e) smart living (17 KPIs), f) smart people (8 KPIs) and g) smart mobility (8 KPIs).
Li et al. (2017)
[33]
Li et al. propose a systematic approach, utilizing a bi-index method, to identify stakeholders and KPIs for multi-level (from building to district) energy performance analysis. KPIs are analyzed into three (3) levels: strategic, tactical and operational. The strategic KPI is aggregated and designed for the district level. The tactical KPI can be associated with the building and system level. The operational KPIs represent the operational performance of basic energy units. Although this study does not focus directly on smart city projects, it offers 35 specific performance indicators that can serve the goals of smart city solutions focusing on energy performance.
Hara et al. (2016) [34]Hara et al. propose a set of KPIs for smart cities based on the Gross Social Feel-Good Index. The KPIs are structured upon four (4) layers: a) the 1st layer includes the triple bottom line (Environment, Economy, Society) and Satisfaction generic categories; b) in the 2nd layer, the Society category is further split into safety, health and comfort; c) the 3rd layer includes a total of 16 KPIs utilized to assess the 2nd layer (environment/natural resource, energy, cost performance, accident, natural disaster, crime, information security, health management, prevention of illness, medical treatment, stress, diverse opportunities, barrier-free, simplicity, ubiquitous, and citizen’s degree of satisfaction) and d) the 4th layer includes the data needed (52 sub-KPIs) to calculate the KPIs in the 3rd layer.
Lombardi et al. (2012) [35]Lombardi et al. introduce a framework for classifying smart city performance indicators building upon the quadruple helix model (Civil society, University, Government and Industry) and utilizing the Analytic Network Process. A total of 63 KPIs are proposed, organized into five (5) clusters: a) smart governance (related to participation)—7 KPIs, b) smart human capital (related to people)—12 KPIs; c) smart environment (related to natural resources)—19 KPIs; d) smart living (related to quality of life)—13 KPIs and e) smart economy (related to competitiveness)—12 KPIs.
Table 3. Total KPIs and key dimensions adopted by smart city KPI frameworks.
Source / KPI DimensionsEnvironmentalEconomicTechnicalSocialMobilityGovernancePropagationICTSupportingLegalCity DescriptionLCAUrban PlanningTotal KPIs
SCIS******36
CITYKeys******101
*****76
UN’s SDGs*****61
U4SSC**91
ISO/FDIS 37122*******52
ISO/FDIS 37120*******65
ETSI*******73
IRIS******75
REPLICATE*******56
MATCHUP***188
SMARTenCITY***149
MYSMARTLIFE*******151
SHARING CITIES*****127
TRIANGULUM*****79
GROWSMARTER****104
+CityxChange*****33
STARDUST*****17
Akande et al. (2019)***32
Huovila et al. (2019) ITU-T Y4901/ Y.4902 / Y.4903*****130
Tan et al. (2017)*****20
Girardi and Temporelli (2017)****28
Dall’O et al. (2017)*******70
Li et al. (2017)*35
Hara et al. (2016)*******16
Lombardi et al. (2012)****63
Total KPIs1928
* dimensions adopted by the KPI framework.
Table 4. Dimensions definition for indicator analysis.
KPI DimensionDescriptionKPI Examples
EnergyEnergy performance is focusing mainly on the interventions facilitating energy transition.Energy demand and consumption; RES generation ratio; Peak load reduction
EnvironmentalEnvironmental performance is increasingly important for smart cities striving to identify environmental risks and factors that are essential for humans and natural resources and special for smart city planning and operation.CO2 emissions reduction;
Air quality, Noise pollution
EconomicEconomic performance refers to the business efficiency and cost of each application and usage scenario from a market perspective.Average cost of energy consumption; Cost savings; Return on investment
ICTICT performance is regarded as a key pillar for technology advancements in the smart city concept, enabling data management, privacy and security and data monitoring for the development of new innovative services.Cybersecurity; Data privacy; Improved interoperability
MobilityMobility performance is appropriate for smart city projects concerning the convergence of energy and transport sectors, the global EV market uptake and the increasing citizens’ needs for sustainable mobility and e-mobility services.EVs charging points; Clean mobility utilization; E-vehicle sharing solutions
SocialSocial performance is crucial to estimate the extent to which the project and its designed collaborative action model facilitate the involvement of citizens and social actors in the planning, decision-making and implementation activities through social citizen-driven innovation mechanisms.Citizen participation in co-creation processes and online decision making; Degree of users’ satisfaction
GovernanceGovernance performance refers to the city governance from the side of the municipality administration, planning and evaluation mainly, but also includes aspects of the legal domain regarding the regulatory framework and its compatibility with the proposed solutions and implemented policies at project or city level.Involvement of the city administration;
Legal framework compatibility; New rules/regulations due to the project
PropagationPropagation performance assesses the potential for wider scalability and replicability of the solutions and actions demonstrated.Social compatibility of solutions; Market demand; Diffusion potential
Table 5. Final KPI list of POCITYF project.
KPI NameKPI UnitKPI SourcesKPI Description
Energy
E.1 Energy Demand and ConsumptionkWh/(m2∙month
kWh/(m2∙year)
kWh/year
SCIS [17]; REPLICATE [20]; MATCHUP [21];
Angelakoglou et al. (2019) [14];
Hara at al. (2016) [34]; Lombardi et al. (2012) [35]; ETSI [40]; U4SSC [37]
This indicator assesses the energy efficiency of a system for each sector of buildings, transport, industry, public services (e.g., lighting), ICT, etc., also broken down into energy sources (electricity, heating, natural gas, etc.) The energy demand and consumption correspond to the energy entering the system in order to keep operation parameters (e.g., comfort levels).
E.2 Degree of energetic self-supply by RES%SCIS [17]; Angelakoglou et al. (2019) [14]; Li et al. (2017) [33]; Lombardi et al. (2012) [35]; mySMARTLIFE [23]; U4SSC [37]; SDG [36]The degree of energetic self-supply by RES is defined as the ratio of locally produced energy from RES and the energy consumption over a period of time (e.g., month, year).
E.3 Self-Sufficiency Ratio%Luthander et al. (2015) [48]The degree to which the on-site generation is sufficient to fill the final energy needs of the building/system.
E.4 Energy SavingskWh/ (m2∙year);
MWh/(year); %
SCIS [17]; mySMARTLIFE [23]; ITU-T [37]; Angelakoglou et al. (2019) [14]; Li et al. (2017) [33]This KPI determines the reduction of energy consumption to reach the same services (e.g., comfort levels) after the interventions.
E.5 Reduced energy curtailment of RES and DER%SCIS [17]; Angelakoglou et al. (2019) [14]; +CityxChange [27]The indicator assesses the reduction of energy curtailment due to technical and operational problems such as over-voltage, over-frequency, local congestion, etc.
E.6 kWp photovoltaic installed per 100 inhabitantskWp/100 inhabitantsDall’O et al. (2017) [32]Installed capacity of photovoltaic interpolated to 100 inhabitants.
E.7 Smart Storage Capacity%; MWhAngelakoglou et al. (2019) [14]; +CityxChange [27]The KPI includes all the energy storage technologies integrated in the city smart grid containing electricity, heating and mobility, presenting the impact of the project on the use of smart energy storage systems.
E.8 Heat Recovery Ratio%GrowSmarter [26]The KPI refers to the percentage ratio of the total thermal energy output of the system (MWh) to the thermal energy recovered through a waste heat recovery technology (MWh).
E.9 Integrated Building Management Systems (BMS)%; [number]U4SSC / ITU-T [37]Percentage of buildings using integrated ICT systems to automate building management and create flexible, effective, comfortable and secure environment.
E.10 Percentage of buildings in the city with smart energy meters%ISO/FDIS 37122: 2019 [38]Percentage of buildings using smart energy meters to record and display the consumption of energy in real time, thus providing energy providers data to better plan and conserve energy.
E.11 Specific YieldW/kWp; W/m2SmartEnCity [22]Metered output energy of a supply system related to the size (capacity) of the system.
E.12 Storage Energy Losses%Angelakoglou et al. (2019) [14]; Li et al. (2017) [33]This KPI illustrates the energy losses because of battery storage, including the added voltage transformations.
E.13 Thermal Load ReductionWLi et al. (2017) [33]Reduction of heating/cooling load caused by envelope insulation in specific thermal zone.
E.14 Peak Load reduction%Li et al. (2017) [33]The indicator compares the peak demand before the aggregator implementation (baseline) with the peak demand after; per final consumer, per feeder, per network.
E.15 Street lighting management%ISO/FDIS 37122: 2019 [38]Percentage of street lighting managed by a light performance management system.
Environmental
EN.1 Greenhouse Gas EmissionskgCO2eq/(m2*year); kgCO2eq/(kWh*year); %SCIS [17]; Lombardi et al. (2012) [35]; Hara et al. (2016) [34]; MATCHUP [21]; U4SSC [37]; ETSI [40]; +CityxChange [27]The KPI calculates the amount of emissions for six major GHGs: carbon dioxide (CO2), methane (CH4), nitrous oxide (N2O), hydrofluorocarbons (HFCs), perfluorocarbons (PFCs), and sulphur hexafluoride (SF6).
EN.2 Carbon Dioxide Emission Reductiontons/year; tons/capita/year; %SCIS [17]; CITYkeys [11]; Angelakoglou et al. (2019) [14]; Li et al. (2017) [33]; Tan et al. (2017) [30]; Dall’O et al.(2017) [32]; IRIS [19]; SmartEnCity [22]; REPLICATE [20]; +CityxChange [27]CO2 emissions can be considered a useful indicator to assess the contribution of urban development on climate change. The main sources are processes related to energy generation and transport.
EN.3 Air Quality IndexIndex (no unit) of PM10, PM2.5, NOX, SO2 Ozone & Benzene.CITYkeys [11]; MATCHUP [21]; U4SSC [37]; ETSI [40]The indicator provides a relative measure of the annual average air quality in relation to the European limit values (annual air quality standards and objectives from EU directives).
EN.4 Primary Energy Demand and ConsumptionkWh/(m2*month; kWh/(m2*year)SCIS [17]; MATCHUP [21]; mySMARTLIFE [23]The indicator of the primary energy demand/consumption of every metered system encompasses all the naturally available energy that is consumed in the supply chain of the used energy carriers.
EN.5 Climate Resilience StrategyLikert Scale (1-7)CITYkeys [11]; ETSI [40]This indicator assesses to what extent the city has a resilience strategy and action plan to adapt/respond to climate change, by providing a qualitative measure.
EN.6 Noise Pollution%CITYkeys [11]; Angelakoglou et al. (2019) [14]; Akande et al. (2019) [29]; IRIS [19]; REPLICATE [20]; MATCHUP [21]; ISO 37120: 2018 [39]; U4SSC [37]; ETSI [40];This KPI refers to the measurement of noise in level of decibels (dB) before and after the activities of the project.
EN.7 Municipal Solid Wastetons/capita/month
tons/capita/year
CITYkeys [11]; Tan et al. (2017) [30]; Dall’O et al. (2017) [32]; Hara et al. (2016) [34]; REPLICATE [20]; ISO 37120: 2018 [39]; ETSI [40]This indicator provides a measure of how much waste a city is producing and the level of service a city is providing for its collection.
EN.8 Recycling Rate of Solid Waste%CITYkeys [11]; Tan et al. (2017) [30]; Dall’O et al. (2017) [32]; Lombardi et al. (2012) [35]; REPLICATE [20]; ISO 37120: 2018 [39]; ETSI [40]; U4SSC [37]This KPI estimates the percentage of city’s solid waste that is recycled, calculated as the total amount of the city’s solid waste that is recycled in tons divided by the total amount of solid waste produced.
Economic
EC.1 Total Investments€/m2, € (total)SCIS [17];
Angelakoglou et al. (2019) [14]; +CityxChange [27]
The KPI is defined as the number of cumulated payments relevant to the energy aspects of the systems (e.g., highly efficient envelope in a building), including also business-as-usual case investments.
EC.2 Total Annual Costs€/yearSCIS [17];
Angelakoglou et al. (2019) [14]
The total annual costs are defined as the sum of capital-related annual costs (e.g., interests and repairs caused by the investment), requirement-related costs (e.g., power costs), operation-related costs (e.g., costs of using the installation) and other costs (e.g., insurance).
EC.3 Payback PeriodYearsSCIS [17]; CITYkeys [11];
Angelakoglou et al. (2019) [14]; +CityxChange [27]
The payback period is the time it takes to cover investment costs. It can be calculated from the number of years elapsed between the initial investment and the time at which cumulative savings offset the investment.
EC.4 Return on Investment (ROI)%SCIS [17]; Angelakoglou et al. (2019) [14]; +CityxChange [27]The return on investment (ROI) is defined as the ratio between the total incomes/net profit and the total investment of the project/product, etc.
EC.5 Average Electricity Price for Companies and Consumers€/kWhTRIANGULUM [25]The indicator represents the average minimum cost at which electricity must be sold so as to balance the costs with profits.
EC.6 Percentage of the Total Distributed Energy Resources Capacity Traded%+CityxChange [27]This KPI measures the amount of Distributed Energy Resources (DERs) capacity traded as a percentage of the total DERs capacity available.
EC.7 Local Job Creation# of jobsCITYkeys [11]; MATCHUP [21]; +CityxChange [27]; mySMARTLIFE [23]; Angelakoglou et al. (2019) [14];This indicator assesses the creation of direct jobs from the implementation and operation of smart city project solutions.
EC.8 Energy Poverty%CITYkeys [11]; REPLICATE [20]; ETSI [40]; Angelakoglou et al. (2019) [14]The KPI evaluates the extent to which households are at risk of poverty or deprivation by calculating the change in percentage points of (gross) household income spent on energy bills.
EC.9 Carbon Dioxide Reduction Cost Efficiency€/(ton CO2 saved/year)CITYkeys [11];
mySMARTLIFE [23]
Angelakoglou et al. (2019) [14];
The specific KPI estimates the costs in euros per ton of CO2 saved per year. This KPI can be estimated capitalizing on information already available in other KPIs (carbon dioxide emission reduction and total annual costs).
EC.10 New Business Creation#/100.000 population; %CITYkeys [11]; ETSI [40]The indicator assesses the number of new businesses created (including start-ups) as one point of overall business climate in a jurisdiction and entrepreneurship.
EC.11 Expenditures by the municipality for a transition towards a smart city€/capita; €; %CITYkeys [11];
REPLICATE [20]; MATCHUP [21];
ETSI [40]; ITU-T [37]
Smart city expenditures include process-relevant expenditures and findings. Estimates should also include the percentage of municipal budget allocated to the ICT facilities.
ICT
ICT.1 Increased System Flexibility for Energy Players%; W/€SCIS [17];
Angelakoglou et al. (2019) [14]
The indicator determines the increased system flexibility for the energy utilities as an effective way to exploit all resources to respond to a set of diversions (e.g., demand changes in a specific time interval) and maintain the power balance in terms of load or cost.
ICT.2 Increased hosting capacity for RES, electric vehicles and other new loads%SCIS [17];
Angelakoglou et al. (2019) [14]
The indicator determines the improvement of hosting capacity with regards to additional loads and installations in the network when R&I solutions are applied and also compared to the baseline scenario.
ICT.3 Improved Data Privacy5-point Likert scale (No Unit)CITYkeys [11];
Angelakoglou et al. (2019) [14];
ETSI [40]; ITU-T [37]
This indicator refers to the level of improvement of data privacy and safety, analyzing the extent to which data collected by the project are protected, for instance, by following regulations on data protection and implementing proper procedures to protect personal or private data.
ICT.4 Quality of Open Data%Angelakoglou et al. (2019) [14]Percentage of data that use DCAT standards.
ICT.5 ICT Response Timems/byte; sec/byte; min/byte - Depends on the systemSmartEnCity [22]; mySMARTLIFE [23]The response time of ICT infrastructure is related to the services developed and the payload (information exchanged) between them, applicable to the various ICT actions and services in the project.
ICT.6 Improved Cybersecurity5-point Likert scale (No Unit)CITYkeys [11]; MATCHUP [21];
ETSI [40]
The indicator refers to the extent to which the project ensures cybersecurity of its systems.
ICT.7 Platform DowntimeMinutes / (h, d, w, m)Angelakoglou et al. (2019)The indicator quantifies the platform downtime per selected timeframe.
Mobility
M.1 Electric Vehicles &
Low-Carbon Emission Vehicles deployed in the area
[number]; %SCIS [17]; U4SSC [37];
Angelakoglou et al. (2019) [14];
ISO/FDIS 37122: 2019 [38];
MATCHUP [21]; REPLICATE [20]
Number of electric vehicles (EV) and low-carbon vehicles (PHEV and hydrogen) registered in the area in relation to the total number of motorized vehicles (four and two wheels).
M.2 Number of EV charging stations and solar powered V2G charging stations deployed in the area[number]; %Angelakoglou et al. (2019) [14];
SCIS [17];
Dall’O et al. (2017) [32];
REPLICATE [20]
Number of e-charging and V2G stations, public and private and fast chargers. The indicator refers to the following measurements: number of total stations deployed, along with their locations; e-charging stations deployed and V2G stations deployed. They could also be expressed as a percentage compared to total number of stations.
M.3 Annual Energy delivered by charging pointsKWh/yearMATCHUP [21]; SmartEnCity [22]; mySMARTLIFE [23]The KPI refers to the level of use of the EV charging infrastructure implemented in the city, calculating the total kWh recharged by all types of EVs during a year in the public charging stations.
M.4 Annual number of passengers using the new vehicles and/or infrastructure#of passengers/yearmySMARTLIFE [23]The level of utilization of the new vehicles or infrastructure should be expressed by the number of passengers or users traveling during a year with the new vehicles (e.g., EVs and e-buses) or on the new infrastructure deployed.
M.5 Shared Electric Vehicles Penetration Rate[number]; %mySMARTLIFE [23]Number of e-vehicles that operate in the platform and in the community car-sharing concept.
M.6 Clean mobility utilizationKm; # of tripsSCIS [17]; +CityxChange [27]The indicator assesses the number of km in clean vehicles and number of trips in clean vehicles as a means of sustainable mobility.
M.7 Modal Split (Passengers/Vehicles/Trips)% of vkm; % of passenger.km; % of tripsSCIS [17]The indicator determines the distribution of transport over the modalities of public and collective transport, private vehicles, biking and walking.
M.8 Yearly km of Shared VehiclesKm/yearU4SSC [37];
Angelakoglou et al. (2019) [14]
The indicator assesses the yearly km made through the e-car sharing system instead of private conventional cars.
Social
S.1 People Reached%CITYkeys [11]; Angelakoglou et al. (2019) [14]; mySMARTLIFE [23]Percentage of people in the target group that have been reached and/or are activated by the project.
S.2 Connection to the existing cultural heritage5-point Likert scale (No Unit)CITYkeys [11]; mySMARTLIFE [23]The extent to which making a connection to the existing cultural heritage was considered in the design of the project.
S.3 Local community involvement in the implementation and planning phase5-point Likert scale (No Unit)Angelakoglou et al. (2019) [14]The extent to which residents/users have been involved in the implementation process.
S.4 Degree of satisfaction5-point Likert scale (No Unit)mySMARTLIFE [23];
Hara et al. (2016) [34]
The level of satisfaction and acceptance of people affected by the actions in the project, from a technical point of view; perceived adequateness, benefit (e.g., comfort), usefulness, ease of use and aesthetics; economic point of view; and cost, risk and benefit.
S.5 Percentage of citizens’ participation in online decision-making%MATCHUP [21];The indicator assesses the percentage of citizens that take part in online decision-making.
Governance
G.1 Online visits to the municipal open data portal#/100 000ISO/FDIS 37122: 2019 [38]Number of visits to the municipal open data portal in a year per 100,000 population.
G.2 Percentage of city services accessible and that can be requested online (e-Governance)%ISO/FDIS 37122: 2019 [38]; U4SSC [37]; Lombardi et al. (2012) [35];
Dall’O et al. (2017) [32]
The total number of city services offered to people and businesses through a centralized Internet interface compared to the total number of city services offered by the city.
G.3 Monitoring and evaluation5-point Likert scale (No Unit)CITYkeys [11]; ETSI [40]The extent to which the progress towards a smart city and compliance with requirements is being monitored and reported.
G.4
Legal Framework Compatibility
5-point Likert scale (No Unit)Angelakoglou et al. (2019) [14]The level of suitability of the legal framework for the integration of a) RES generation, b) symbiotic waste-heat, c) energy flexibility, d) private and public EV penetration and e-mobility and e) CIPs for energy management and citizen engagement; policies
G.5
Open government dataset
#/100,000MATCHUP [21]; mySMARTLIFE [23];
U4SSC [37]; ETSI [40]
The indicator measures the number of open government datasets per 100,000 inhabitants, showing how involved the local government is in building a smart city.
Propagation
P.1 Social compatibility5-point Likert scale (No Unit)CITYkeys [11];
Angelakoglou et al. (2019) [14]
The extent to which the project’s solution fits with people’s “frame of mind” and does not negatively challenge people’s values or the ways they are used to do things.
P.2 Technical compatibility5-point Likert scale (No Unit)CITYkeys [11]The extent to which the smart city solution fits with the current existing technological standards/infrastructures.
P.3 Market demand5-point Likert scale (No Unit)CITYkeys [11]The extent to which there is a general market demand for the solution. An important characteristic is if the innovation meets the needs of its potential adopters.
P.4 Diffusion to other locations5-point Likert scale (No Unit)CITYkeys [11]The extent to which the project is copied in other cities and regions.

