Shortening the Last Mile in Urban Areas: Optimizing a Smart Logistics Concept for E-Grocery Operations


School of Economics and Management, Leibniz University Hannover, 30167 Hannover, Germany
*
Author to whom correspondence should be addressed.
Smart Cities 2020, 3(3), 585-603; https://doi.org/10.3390/smartcities3030031
Submission received: 28 May 2020
/
Revised: 18 June 2020
/
Accepted: 19 June 2020
/
Published: 2 July 2020
(This article belongs to the Special Issue Smart Cities and Data-driven Innovative Solutions)
Abstract
:Urbanization, the corresponding road traffic, and increasing e-grocery markets require efficient and at the same time eco-friendly transport solutions. In contrast to traditional food procurement at local grocery stores, e-grocery, i.e., online ordered goods, are transported directly to end customers. We develop and discuss an optimization approach to assist the planning of e-grocery deliveries in smart cities introducing a new last mile concept for the urban food supply chain. To supply city dwellers with their ordered products, a network of refrigerated grocery lockers is optimized to temporarily store the corresponding goods within urban areas. Customers either collect their orders by themselves or the products are delivered with electric cargo bicycles (ECBs). We propose a multi-echelon optimization model that minimizes the overall costs while consecutively determining optimal grocery locker locations, van routes from a depot to opened lockers, and ECB routes from lockers to customers. With our approach, we present an advanced concept for grocery deliveries in urban areas to shorten last mile distances, enhancing sustainable transportation by avoiding road traffic and emissions. Therefore, the concept is described as a smart transport system.
1. Introduction
The progressing urbanization leads to an increasing demand for all kinds of goods in cities over the entire world. In addition, e-commerce grows steadily, resulting in a rising number of delivery activities and increasing road traffic on the last mile to satisfy customer needs [1]. Politicians aim for a mitigation of global warming by enacting appropriate laws to reduce the emissions of greenhouse gases. As an example, the European Commission defines the objectives of excluding conventionally powered vehicles by 2050 and achieving “essentially CO2-free city logistics in major urban centres by 2030” [2] (p. 9). Recent discussions are about national emission ceilings for different pollutants (PM10, NOX, etc.) to increase the air quality for inhabitants. If such limits are exceeded, city authorities are forced to ban certain vehicles from urban traffic. For example, those driving bans can cover outdated diesel cars (e.g., Hamburg in 2018), vehicles with even/uneven-numbered registration plates (e.g., Paris in 2016), and similar actions. Despite potential vehicle bans, city dwellers need to be supplied with various goods. As one result, the number of electric cars, light-duty vans, and other transport vehicles, such as cargo bi- and tricycles, is rising in urban areas.
As one part of e-commerce, the delivery of online ordered groceries to end-customers (e-grocery) is a steadily increasing market. Sorted by the market size, Figure 1 shows the e-grocery channel share for selected countries in 2018 and 2023 (forecast) illustrating the substantial rise of this industry. Today, China has by far the largest online grocery market size with $50.9 bn, followed by the United States with $23.9 bn. In 2023, South Korea is expected to have the highest e-grocery share worldwide (14.2%). In Europe, e-grocery is mainly done in the Western countries, whereas the United Kingdom exhibits the biggest European market size ($14.6 bn), resulting in a share of 6.0% in 2018 [3].
At present, our society is becoming increasingly aware of environmental, economic and social sustainability [4]. Regarding the context of smart cities, logistics concepts using alternative low-emission delivery vehicles and modern information and communication technologies (ICT) are understood as smart transport systems that improve urban traffic as well as the inhabitants’ quality of life [5]. Concerning sustainable ways of home deliveries in urban areas, new logistics concepts are mainly tested in the parcel industry. For instance, UPS places micro depots at locations within cities to conduct last mile deliveries (LMD) with electric cargo bicycles (ECBs) and on foot resulting in a reduction of the inner-urban road traffic [6]. Besides supply-sided changes in the home delivery process, the parcel recipient can be integrated in the last mile of the supply chain. As an example, pickup points can be established where customers collect their ordered goods by themselves [7]. In both cases, the last mile is shortened to deploy eco-friendly transport vehicles while remaining effective and profitable. However, concepts that balance economic profit, environmental protection and social wellbeing are rather rare in today’s e-grocery industry. To tackle the interconnected challenges of increasing urbanization, the related rising grocery demand and the need for more sustainable transportation concepts, we investigate the following research question:
How can an optimization model support the efficient design of a sustainable logistics concept for last mile deliveries of online ordered groceries?
To address this question, we present a novel logistics concept that shortens the last mile to the customers by operating an urban network of refrigerated grocery lockers. On the one hand, these decentral transshipment points enable customers to pick up their orders themselves. On the other hand, home deliveries of e-grocery providers can be conducted by means of ECB. As a result, the conventionally driven distances as well as the corresponding emissions can be reduced compared to a traditional delivery. To determine the grocery locker locations, the routes from the grocery lockers to the customers, as well as the routes from a depot to the grocery lockers, we propose a multi-echelon optimization model minimizing costs over three consecutive stages: we present (1) a Location Routing Problem (LRP), (2) a Vehicle Routing Problem (VRP) with time windows, and (3) a VRP considering multiple products, compartments, time windows and split delivery. The three problems are implemented in a modelling software to permit the application of use cases and sensitivity analyses. Exemplary benchmarks are provided to demonstrate the functionality of the developed model, which addresses (e-)grocery retailers, parcel delivery services and city authorities. Afterwards, we discuss the proposed approach and draw conclusions.
2. Theoretical Background
Along with the trend of urbanization itself, the increased consumption habits of people are a major problem for the environment within cities. These habits are intensified by the prospering e-commerce as city dwellers order required goods online and make use of parcel delivery services directly to their homes or to pickup points [8]. For people, this means the possibility of shopping independent of business hours or location, significant time savings, greater flexibility, a larger product variety and ICT-related tracking of shipments. Such services are no longer limited to non-perishable goods as groceries are also available online nowadays. Groceries include food and household items as well as other fast-moving consumer goods. The mentioned deliveries are part of the domain city logistics which is defined as “the process for totally optimising the logistics and transport activities by private companies in urban areas while considering the traffic environment, traffic congestion and energy savings within the framework of a market economy” [9].
Enabled through digitalization and its increased possibilities offered by the application of modern ICT, the proposed logistics concept can be depicted as an e-grocery delivery concept contributing to the development of smart cities. Smart cities are known as urban development policy in applying different kinds of ICT to city infrastructures connecting people, services, things and data [10]. The overall goal is to improve the inhabitants’ lives and in consequence urban growth based on data, connectivity and resulting knowledge flows. For the term ‘smart city’, there is no general agreement on an exact definition. Yet, six core elements are widely accepted in literature: smart governance, smart economy, smart people, smart living, smart environment, and smart mobility [11]. The proposed logistics concept mainly contributes to smart mobility as “logistics” and “infrastructures” are related aspects of this component [11]. Following Rehm et al. [12], crucial success factors for the use of smart mobility concepts are, besides others, unlimited participation for consumers, cost-efficiency and low emissions. Therefore, the proposed e-grocery concept aims at achieving long-term sustainability in a smart city context, while it can be classified as a smart transport system [5,13].
Grocery delivery services are offered by a growing number of food retailers evolving from a typical single-channel to a multi- or even omni-channel retailer, or by pure online players [14]. Thus, a distinction is made between the picking process (in-store, fulfilment center, or warehouses) as well as the delivery process. The virtual shopping basket of a website gets delivered as a package to the front door or at specialized pickup points [7]. Thereby, the e-grocery suppliers either have their own fleets for regional delivery or ship nationwide via parcel delivery services. Delivery with an own fleet has the advantages of a specialized vehicle fleet complying with different temperature requirements and offering small time windows but the disadvantages of local narrowness [7]. As one result, some (online) providers are not delivering any refrigerated food, making additional grocery shopping necessary. As already presented in Figure 1, the e-grocery share is rather small, but these values will continue to increase in the coming years. This depends heavily on the costs and the service experiences of the customers regarding punctual delivery within the desired time windows, correctness, completeness, and quality of the ordered goods [14].
The delivery of goods to customers is defined as last mile distribution, which is the final section and the most cost-intensive part of the supply chain [15]. As a result, there is a growing interest in solutions that comprise optimization approaches. Van Audenhove et al. [16] identify four different areas of action (1. regulatory, 2. infrastructure, 3. incentives, 4. technology) to reduce the traffic induced by urban logistics. To achieve a positive effect, it is not enough to electrify the fleets, as road traffic is not avoided [16]. New business models are entering the market, with most of them piloted within projects. Within the parcel sector, some of the providers rely on solutions that consist of a network of a distinct number of inner-city micro-depots. Customers are then supplied from these locations or can pick up their goods there. This concept is now also used by suppliers in the e-grocery sector who make use of specialized collection points [17]. The subject of this paper is the planning of a network consisting of refrigerated grocery lockers where customers can either collect their goods themselves or the goods are delivered via ECB.
In scientific literature, the topic of e-grocery has not been intensively investigated so far. Overviews of relevant research topics are presented by Martín et al. [18] as well as Mkansi et al. [19]. Among others, the aspects of “logistics”, “concepts”, “delivery”, and “consequences” are listed as main topics of e-grocery research [18]. Various studies examine the strategic planning of multi- and omni-channel systems for grocery distribution, e.g., [7,14,20]. Market and provider analyses, price dispersions, as well as customers’ perceptions of e-grocery retail are also conducted, e.g., [17,21,22]. In contrast with traditional grocery planning, route-related operations regarding e-grocery deliveries to end-customers are quite rare. Fikar [23] presents a decision support system to investigate food losses by an agent-based simulation to estimate delays and inefficiencies within e-grocery deliveries. As a result, inventory and transport strategies are presented, highlighting the trade-off between food quality and travelled distances. A similar approach is presented by Waitz et al. [24]. The resulting decision support system allows users to jointly evaluate the influence of altering service offers and logistics processes. Regarding VRP optimization in the field of e-grocery operations, several mathematical models and heuristic solution approaches address food quality in terms of perishability depending on routing decisions, e.g., [25,26]. Emeç et al. [27] present an optimization model as well as a heuristic for an e-grocery delivery routing problem. Their approach is based on a distribution network where premium goods are acquired from a set of external retailers at multiple locations and then delivered to the customers in a single visit. The generation of an urban e-grocery network consisting of inner-city depots in form of refrigerated grocery lockers is part of the LRP optimization approach of Leyerer et al. [28]. Customers can collect their ordered goods by themselves or have them supplied by ECB. The approach serves as a basis for this paper and is improved in terms of an enhanced optimization method (3-echelon vs. 2-echelon) and corresponding assumptions, the consideration of an adjustable share of self-collection customers modelled directly within the mathematical models, a more realistic computational study, as well as a comparison of the proposed concept to conventional delivery of online ordered groceries. A general overview of scientific VRP and LRP approaches is presented by Eksioglu et al. [29], stating the extensive body of various applications in this field. As a rather novel research topic, the 2-echelon VRP has gained considerable attention in recent years. A wide range of 2-echelon optimization approaches (heuristic and exact methods) is presented in the context of city logistics, e.g., [30,31,32]. However, very few articles cover a multi-echelon approach combined with heterogeneous vehicle fleets, including the use of ECBs, in the field of city logistics. In this context, Enthoven et al. [33] present an example of a 2-echelon VRP with two delivery options. On the one hand, parcels are delivered in a van from a depot to parcel stations, from where customers can pick up their parcels themselves. On the other hand, vans deliver parcels to satellite depots in urban areas, from where the parcels are then delivered by ECB on the last mile to the customers. Especially with regard to the presented approach, no literature combines LMD in a multi-echelon optimization approach in connection with ECB deliveries and self-collection by customers at grocery lockers in the context of e-grocery.
In general, the last mile distribution of e-groceries is still less focused. In their literature review, Mkansi et al. [19] recommend intermodal transportation with bicycles, electric cars, and vans, as well as the integration of customers within the delivery processes to address the problems of road traffic, congestion and potential legal fines. By combining an eco-friendly and road traffic avoiding fleet together with an intelligent infrastructure in the form of refrigerated lockers to a new last mile concept, we tackle the present research gap.
3. Optimization Approach
3.1. Logistics Concept for Urban E-Grocery Operations
To supply a demand area with groceries, we propose a network of refrigerated grocery lockers to enable deliveries with ECBs and customer self-collection. We aim at determining optimal grocery locker locations, optimized routes for direct locker-to-customer deliveries and optimized routes for the locker supply from a central depot. Regarding location decisions, the consideration of the vehicles’ mileage provides better long-term results compared to a sole facility location problem [34]. Therefore, we formulate an LRP for the grocery locker location optimization in the first stage. Afterwards, the optimal ECB routes are determined with a VRP with time windows (VRPTW). To reduce the problem’s complexity, van route optimization is executed in another separate model. Figure 2 illustrates the described logistics concept and our corresponding 3-stage optimization approach. As “logistics” and “infrastructures” are related aspects of smart mobility, the concept contributes to the smart city domain [11].
In a first step, a specific LRP based on the warehouse-LRP formulation of Perl and Daskin [35] determines the optimal number, sizes and locations of grocery lockers among the sets of available locker types and potential locker locations. The wide range of groceries implies different requirements concerning the cooling and dimensions of the ordered products. Hence, different locker types (e.g., temperature zones frozen, refrigerated, and dry) and sizes need to be considered. In addition, the first model allocates customers to established grocery lockers. Those customers can either pick up their ordered products themselves or request a delivery by means of ECB. In both cases, the grocery lockers serve as temporary storage space. For those customers who favor home delivery, the grocery lockers enable eco-friendly LMD, as ECBs can be used for the rather small distances from the lockers to the customers. To consider the grocery locker supply in the first stage, the van routes from the depot are included at this network generation phase. The LRP addresses the tactical decision level (e.g., monthly evaluation of locker network planning) and minimizes the sum of locker operating and transport costs.
In a second step, the ECB routes from the opened grocery locker locations to the customers who demand home delivery are determined daily, minimizing the transport costs which are linear related to the total travel distance of the utilized ECB. In view of an ECB’s limited capacity, the distance from the grocery lockers to the customers must be restrictable to comply with cooling chain requirements by use of cooling boxes. As usual for e-grocery home deliveries, time windows for all customers must be considered.
In a third step, the grocery lockers are supplied with the ordered products each day, taking the unequal product requirements and incompatibilities into account, e.g., frozen food must not be stored together with dry goods. Time windows must also be considered to ensure punctual locker supply. For this purpose, we develop an adjusted VRP, derived from the formulation of El Fallahi et al. [36]. Routing decisions for the grocery locker supply are modelled in an operational context considering compartmentalized vehicles originating from the central depot, product-compartment incompatibilities, time window constraints and split-deliveries (SP-VRPMPCTW) to minimize transportation costs. Split deliveries do not have a negative impact on the quality of service in the given context where no customer needs to be present to receive the goods [37]. As the distance and costs of the vans which supply the grocery lockers are already included in the first step, the van tours are updated in the third stage to account for detailed routing decisions considering the described conditions.
To enable efficient and eco-friendly e-grocery deliveries, we formulate three consecutive mixed integer linear programs (MILP). The underlying assumptions, notations, and mathematical problem formulations for the three models are given in the following section.
3.2. Multi-Echelon Optimization Model
Before the notation is explained, we present the underlying assumptions of our optimization approach:
- Customer locations are given and characterized by a distinct demand level for the different product types. This demand must be fulfilled while the product types differ in terms of cooling chain requirements, which have to be met within the whole delivery process.
- Potential locations for grocery lockers are given. Regarding their storage capacity, grocery lockers vary in terms of dimensions resulting in a set of different locker sizes. Further, these lockers are subdivided into compartments to store each product type at its appropriate bearing temperature. Operation is secured by an existing electricity connection and a screen for storage as well as collection processes. Each established grocery locker has a power socket for ECB recharging. For the establishment of a grocery locker operating costs incur varying according to location.
- If the ordered products are not picked up by the customers, the goods are delivered by a given number of ECBs with identical specifications. Each trip starts and ends at the same grocery locker. Different product types are delivered simultaneously to supply each customer only one time. As the storage capacity of an ECB is limited, resulting trips can be restricted in terms of length to meet the cooling chain requirements by use of cooling boxes.
- The grocery lockers are supplied with the desired goods from a given depot. All trips start and end at the same depot where all offered groceries are stored in a sufficient amount.
- The transport vehicles for the grocery locker supply, further referred to as vans, are given and identical in its specifications. The load area is subdivided into the number of product types which are stored in special compartments complying with cooling chain restrictions. The supply of different grocery lockers can be served in different tours, as partial supply is not a critical element. For the timely delivery of groceries to customers, the grocery locker supply is restricted through time windows for the latest storage with requested goods.
In the following, the multi-echelon optimization approach is presented. After stating the underlying notations including sets, parameters, and decision variables for each optimization stage, the corresponding mathematical models are introduced and explained.
Stage 1: LRP
First, Table 1 contains the applied indices, parameters, and decision variables of the Location Routing Problem (LRP).
The objective function in (1) minimizes the accumulated costs of operating grocery lockers and supplying those with the requested products from the depot location. By including the van costs in the first stage, the location decisions can be optimized regarding the overall costs [38]. In (2), the distance between an opened grocery locker and its assigned customers is restricted to be smaller than a predetermined distance. This formulation serves two purposes: for the case of self-collection by customers, the space around an opened locker with a radius α represents the area of customer responsibility, constituting the intended service level. Further, the α in constraint (2) is used to keep the travel distance by ECB low so that the cooling chain requirements can be met using cooling boxes. As a result, a low (high) -value leads to a dense (sparse) network of grocery lockers. Constraint (3) guarantees that each customer is assigned to exactly one opened grocery locker. Constraint (4) ensures that at each recommended locker location, a grocery locker must be established to serve the assigned customers. Constraint (5) imposes the establishment of only one locker per potential grocery locker location across all possible locker sizes. Constraint (6) is necessary for multiple issues: first, the cumulated demand of customers must not exceed the capacity of their assigned grocery locker; second, it ensures that no customer is assigned to a non-existent locker; third, the grocery locker location and its size are chosen based on the existing demand level. Equations (7) and (8) define the variables’ value ranges.
Stage 2: VRPTW
Table 2 contains the notation including indices, parameters, and decision variables of the Vehicle Routing Problem with Time Windows (VRPTW).
The objective function (9) minimizes the total transport costs of the ECB visiting the customers who demand home delivery. Transport costs are linear to the ECB’s travel distance, thereby as many customers as possible are combined into tours to minimize the mileage. Constraint (10) ensures that each customer node is included in exactly one ECB tour. Representing the usual tour flow, constraint (11) guarantees that an ECB visiting a customer location must also leave it. Each executed ECB tour must be assigned to one grocery locker preventing split deliveries from multiple locations (12). Constraint (13) represents the subtour elimination to prevent short trips between customer nodes. Constraint (14) ensures the adherence to the ECB’s available capacity, which must be considered at each ECB tour. With (15), an ECB tour length can be restricted with the parameter . This is important because of the assumption that ECBs do not have an onboard cooling system. Thus, cooling chain requirements must be met using cooling boxes equipped on the ECB. Constraint (16) illustrates the capacity utilization of each established grocery locker, which must exceed the assigned demand arising from both the home delivery customers as well as the self-collection customers. Whereas is a decision variable in the first optimization stage, its values serve as input parameters in this second optimization step renamed and introduced as . Constraint (17) guarantees that customers and ECB tours are assigned to the appropriate grocery locker preventing deliveries from other locations. Constraint (18) ensures that each customer is assigned to exactly one grocery locker location. Constraints (19)–(22) constitute the temporal conditions for the customers who demand home delivery. Constraints (19) and (20) ensure a punctual supply for each customer, so that the arrival of the assigned ECB occurs after the respective time window’s start and before the time window’s end considering the service time . When supplying the first customer on each ECB tour, the arising handling time for the loading of the ECB as well as the resulting travel time must be considered to ensure a punctual delivery within the corresponding time window (21). As the handling time does not occur for the subsequent customers on each tour, considering the travel and service time is appropriate to comply with the time windows (22). Constraints (23) and (24) define the decision variables’ value ranges.
Stage 3: SP-VRPMPCTW
Table 3 contains the notation including indices, parameters and decision variables of the Split Delivery Vehicle Routing Problem with Multiple Products Compartments and Time Windows (SP-VRPMPCTW).
The objective function (25) minimizes the total transport costs, which incur for the supply of the opened grocery lockers by vans. As in the second optimization stage, the transport costs are linear to the travel distance. Constraint (26) states that every locker is visited at most once within a vehicle’s tour. According to the developed VRPTW, constraint (27) ensures the tour flow of the vans and constraint (28) represents the subtour elimination to prevent short trips. Constraint (29) ensures the delivery of products in existing tours and (30) guarantees that the locker supply with one product type cannot take more than one tour. However, the established locker locations generally can be supplied by more than one vehicle, because split deliveries are allowed in the third stage (31). Constraint (32) imposes that the van’s load of a particular product type must not exceed the associated compartment’s capacity. With (33), the tour length of a van can be restricted by parameter (33). Constraints (34)–(37) secure the time-window compliance of the grocery lockers. The earliest arrival time for a locker is secured by constraint (34) and the latest department time including the handling time for the storage of groceries is set by constraint (35). Constraint (36) describes that the earliest arrival time at the first grocery locker must exceed the departure time at the depot plus the handling time for van storage and the driving time between both locations. Similar to (36), constraint (37) defines the earliest arrival time at a subsequent grocery locker that must exceed the arrival time at a previous locker plus the handling time for grocery locker storage and the driving time between both lockers. Equations (38) and (39) define the decision variables’ value ranges.
4. Computational Study
To evaluate our developed multi-echelon optimization approach for an exemplary day, we provide benchmark calculations based on the city of Hannover (Germany). Hannover is a medium-sized city with more than 500,000 inhabitants living in an area of around 20,413 hectares (≙50,442 acres). Regarding transport-relevant infrastructures, the number of public car charging stations (currently approximately 40) and unattended parcel pickup points (currently approximately 50) is continuously growing, reflecting the increasing relevance of electric vehicles and alternative LMD concepts.
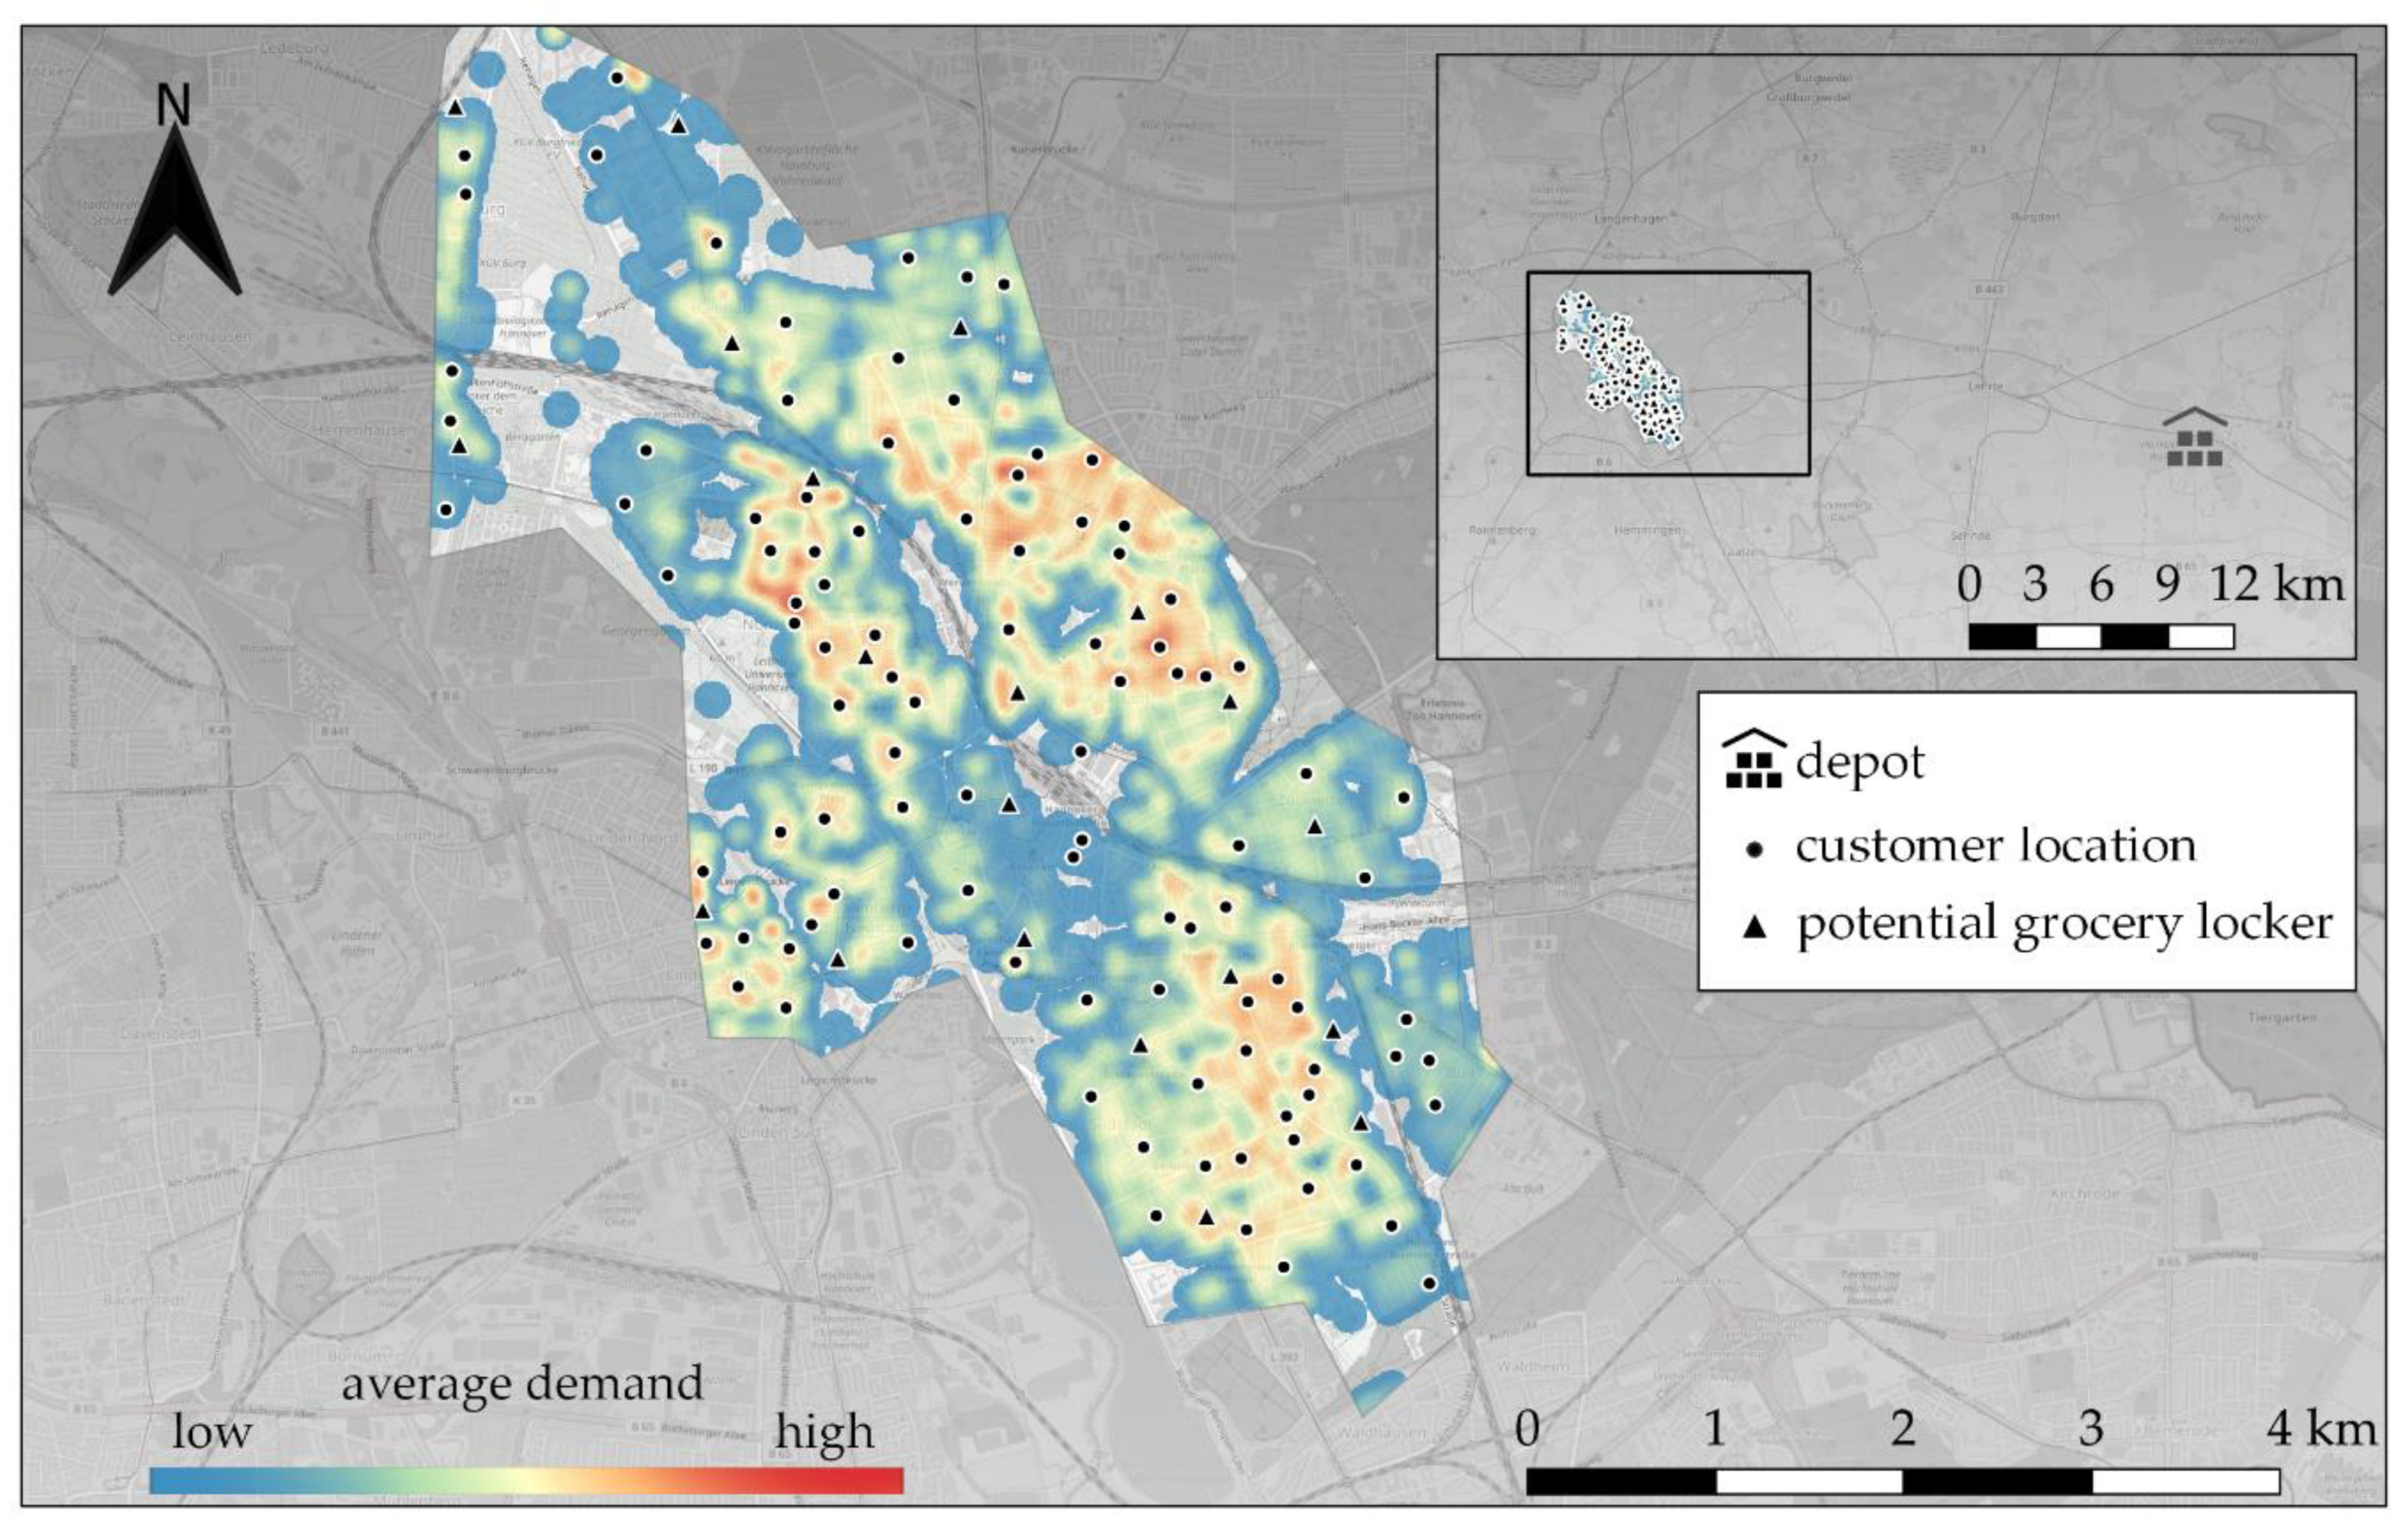
To perform benchmarks for crucial model parameters, it is necessary to define an initial set of all input values at the beginning, varying selected parameters for each calculation ceteris paribus. The corresponding data setup is presented in Figure 3. It depicts the locations of 25 potential grocery lockers (marked by triangles), 100 customer locations (represented by dots), as well as the depot which is placed about 26 km outside the city area. The potential grocery locker locations are the result of data collection from available open spaces and suitable locations for the necessary infrastructure (tendered commercial sites, public parking lots, and parking lots of supermarkets). Regarding the definition of the customer locations, empirical data of a nationwide operating provider for e-grocery were evaluated and serve as average demand for an exemplary day. The heatmap presented in Figure 3 shows the interpolated demand based on the data. Regarding the 100 customer locations, a sampling was drawn from the database of residential buildings in the investigation area based on the average daily e-grocery demand (heatmap). The 100 customer locations thus represent actual residential building positions.
The initial case comprises 100 customers with an equally divided share of 50 home delivery and 50 self-collection customers resulting in a ratio of 50% each. Customer locations are characterized by a distinct demand level for three product types (frozen, refrigerated, and dry products). For each customer, we define a demand between one and six bags (0–1 bag of frozen products; 0–2 bags of refrigerated products; 1–3 bags of dry products). This demand must be fulfilled and customers have to be served within individual time windows between 6:00 a.m. and 8:00 p.m. As usual in e-grocery delivery, the goods are packed in standardized transport cases such as boxes or bags. Hence, the capacity specifications of the transport vehicles, as well as the different locker sizes, are indicated as limit of storable bags. Regarding grocery locker concepts, there already exist several systems and suppliers of compartmentalized pickup points, such as emmasbox or BentoBox [39]. We assume three possible locker sizes with the associated operating costs: small (50 bags; 10 €/day), medium (100 bags; 19 €/day) and large (150 bags; 27 €/day). The maximum distance between customer and locker locations is set to 1.25 km. Time windows for the planned delivery of grocery lockers are between 3:00 a.m. and 6:00 a.m. A utilized ECB is expected to transport up to 20 bags per trip and causes average travel costs of 0.1 €/km. Further, each ECB tour must not exceed 30 km due to cooling chain requirements. As described above, travel times as well as driving distances between all relevant nodes (depot, grocery lockers, customers) are automatically generated considering actual traffic conditions by using the Google Distance Matrix API for both deliveries to grocery lockers by vans and deliveries to customers by ECB. For the van route distances and travel durations a query was made every full hour during the time window for the planned delivery of grocery lockers between 3:00 a.m. and 6:00 a.m. The average travel times for this period was then determined from the corresponding travel times. The same procedure was applied for the ECB routes in the corresponding timeframe from 6:00 a.m. to 8:00 p.m. with the travel mode of bicycling. A service time of 10 min per customer and a handling time for grocery storage of lockers and the loading of vans and ECBs of 15 s per bag is applied. The vans for the grocery locker supply have a determined range of 300 km/day and cause average travel costs of 0.3 €/km. The benchmarks represent a selection of input variations calculated using the three described MILP, which are considered useful to explain the functionalities and interdependencies.
The following benchmarks were calculated with the described parameter settings and the results are presented in the tables below. They show the output variables with a decisive effect on the costs and the network structure. The locker network and the corresponding costs result from the first optimization stage, the ECB distance with corresponding costs from the second, and the van distance as well as the corresponding costs result from the third optimization stage. The total costs result from the multi-echelon optimization as the sum of all consecutive stages. The benchmarks were calculated by implementing the developed multi-echelon approach into the modelling software GAMS (General Algebraic Modeling System) 24.5.6 using the solver IBM ILOG CPLEX 12.6.1 and a standard computer (Intel Core i5-6200U CPU 2.30 GHz, 8 GB RAM, Windows 10, 64-bit).
First, we vary the ratio of home delivery and self-collection customers to demonstrate the resulting scale effects on the decision variables. Depending on the characteristics, a customer set of the same size is either more cost-intensive or more cost-effective to supply. The composition of customers in the following Table 4 varies between 100% home delivery combined with 0% self-collection and vice versa.
An increased customer share with a demand for home delivery influences the process of LMD. With a higher proportion of home delivery, deliveries are primarily made by the supplier. With a higher proportion of self-collection, the last mile is covered by the customers. Whereas home delivery causes LMD, self-collection does not require the necessary LMD by the e-grocery supplier. Accordingly, with a share of 100 customers with self-collection demand (100%), there is no ECB tour and no distance driven. Considering the scenario of rising home delivery demand starting from a demand of 0%, the number of ECB tours and mileage increase steadily. The changing ratio does not affect the locker network, or the van tours because self-collection customers generate the same capacity and transport needs at the grocery lockers as home delivery customers do. Although an increase in the proportion of customers with a home delivery demand has a significant effect on the ECB distance travelled, the impact on total costs is marginal. If the distance travelled by the ECB rises from 0 km/day (0% home delivery) to 111.82 km/day (100% home delivery), the total costs rise from 179.79 €/day to 190.98 €/day by only 6.22%. With every increase of 25% points in the share of home delivery customers, the total costs increase on average by 1.5%. Starting from a 0% share of home delivery customers, the total ECB distance rises by an average of 27.95 km/day with each 25%-pts increase. The computing times solving the three model stages consecutively vary, depending on the preset optimization gap, the maximum computing time and the parameter setting. In our case, the first model stage (LRP) is almost instantly solved with a relative gap of 0%. The optimization of the second stage (VRPTW) was stopped after one hour and the solutions entail a relative gap of at least 22%. The third stage (SP-VRPMPCTW) was stopped after one hour and relative gaps of at least 36% were the result.
In addition, the parameter (maximum distance between a grocery locker and its assigned customers) is a crucial factor for the network generation of grocery lockers as already evidenced by Iwan et al. [40] for parcel delivery services. Table 5 illustrates the resulting decision variable outputs for the applied -values between 0.5 and 2.0 km.
The results show that distance restrictions with lower -values increase the number of established grocery lockers, the number of ECB tours and overall costs. With the lowest implied α-value of 0.5 km, the total costs are 320.10 €/day with 25 opened lockers and resulting locker costs of 250.00 €/day, demonstrating that the number of opened grocery lockers must be minimized from an economic perspective. On the other hand, the total distance travelled by ECBs is shortened by opening more grocery lockers, which contributes to a reduction of last mile traffic in urban areas. However, van distances rise when deploying additional lockers. When opening 25 grocery lockers (250.00 €/day, with = 0.5 km), only small ones are used. Establishing eight lockers ( = 1.25 km), a mixed setup of four small and four medium versions is optimal. With only four grocery lockers in total ( = 2.0 km), one medium and three large versions are recommended which are placed at centralized locations within the investigation area. The locker network and the total costs do not change above a certain α-value (here: 2.0 km), as in the underlying case all customers can be supplied within the radius of the set of minimally required lockers. Investigating the relative optimization gaps, the first model stage (LRP) is almost instantly solved with a relative gap of 0%. The gaps of the second stage depend on the number of established grocery lockers. With 25 locker locations ( = 0.5 km), the result is a relatively low gap of 27% because the number of customers per tour and locker is small as 50 home delivery customers are assigned to 25 grocery lockers. With rising maximum distance between customers and grocery lockers, increasing gaps are noticed due to higher complexity. In contrast, the gaps of the third stage are higher at lower α-values. Here, the problem complexity rises with a higher number of grocery lockers as there exist more potential routes compared to the cases with a high .
In addition to the presented benchmark calculations on different network structures of the proposed logistics concept, the results can be compared to a conventional delivery of online ordered groceries. In that case, the products are delivered directly from the depot to the customer locations using delivery vans. To ensure appropriate comparability with the presented benchmarks, the third model stage is used to calculate results for a conventional delivery. Instead of the opened grocery lockers, the vans visit the customer locations directly. Apart from the prevention of split deliveries, all other constraints and input parameters remain identical. The following Table 6 contrasts the economic and ecological effects of two scenarios of the proposed logistics concept with the effects of a conventional delivery.
Regarding the conventional home delivery, the supply of 100 customers causes a van travel distance of 293.27 km/day and total costs of 87.97 €/day. The local CO2 emissions of each scenario are calculated assuming an emission factor of 192 gCO2 per driven van kilometer. Compared to the conventional delivery, the following differences occur: the proposed logistics concept, with 100% home delivery, 0% self-collection, and α = 1.25 km, causes additional costs of 103.01 €/day (+117.1%), requires additional 48 m2 of space (four small grocery lockers with 4 m2 and four medium grocery lockers with 8 m2), but reduces the van distances by 80.62 km/day (−27.5%). The scenario with 50% home delivery, 50% self-collection, and = 2.0 km leads to additional costs of 77.82 €/day (+88.5%), requires 44 m2 more space (one medium grocery locker with 8 m2 and three large grocery lockers with 12 m2), but reduces the travel distance of the vans by 90.95 km/day (−31.0%). As a result, the proposed logistics concept requires more space and leads to increased operating costs. Yet, the travel distances of the vans and the associated emissions can be significantly reduced. When assessing the travel distances and the resulting emissions, the self-collection customers’ mode of transport must be considered.
5. Discussion, Contributions, and Limitations
The proposed logistics concept contributes to enhanced sustainability in smart cities. The developed multi-echelon optimization approach enables efficient planning of the smart transport system. First, environmental sustainability is addressed. As illustrated by the comparison of the proposed logistics concept with the conventional delivery of online ordered groceries, negative LMD-related externalities of urban road traffic and corresponding vehicle emissions can be reduced. The extent of emissions savings depends on the grocery locker network density, the distance from the depot to the city, and the transport mode of the customers picking up their ordered goods. Since no driving license is required, the use of ECBs enlarges the set of potential employees contributing to the social dimension of sustainability. In addition, the possibility of self-collection by customers can increase people’s awareness of eco-friendly goods transportation. By implementing a maximum distance between a grocery locker and its assigned customers, the density of the grocery locker network can be controlled, which is a decisive factor in customer acceptance as well as their mode of transport.
With the proposed logistics concept, we address the identified research gap by Mkansi et al. [19] who recommend intermodal transportation and the integration of customers within the delivery processes to address the problems of road traffic, congestion, and potential legal fines. The developed MILP supports e-grocery retailers, parcel delivery services, and city authorities in finding appropriate solutions for the efficient and sustainable distribution of goods in urban areas. However, these stakeholders pursue different objectives. While city authorities usually prioritize the environmental and social dimensions of sustainability (e.g., minimizing the amount of harmful emissions and the number of road accidents), retailers and delivery services are efficiency-driven and need to minimize costs to achieve a profitable business [41]. By applying the proposed concept, alternative low-emission delivery vehicles and modern ICT are incorporated as a smart transport system to counteract the described conflict of objectives. Further, city authorities can financially support retailers and delivery services by setting up special purpose areas to promote the use of pickup and transshipment points.
Nevertheless, there are limitations and enhancement opportunities to be considered. The optimization approach is based on several assumptions to simplify real-world conditions. As companies are mainly profit-driven, minimizing costs constitutes the objective of the developed problem formulation. To focus even more on environmental sustainability, the routing can be executed regarding emission minimization [42]. Due to the high amount of decision variables and constraints, we choose a multi-echelon optimization approach to divide the planning process into sub-problems to reduce the overall complexity of the model. However, comparatively long computing times occur because LRP and VRP are nondeterministic polynomial-time (NP) hard combinatorial optimization problems [43]. To be practicable, results must be available within a few hours to enable the optimization of the next working days’ operation. The presented implementation can handle moderate problem sizes which are realistic for medium-sized cities concerning today’s e-grocery share. To reduce high computing times and to enable the fast solution of large instances, a heuristic or metaheuristic approach should be implemented for the proposed multi-echelon optimization model. Beyond that, the model’s appropriate time horizon must be evaluated in detail. Depending on spatial demand fluctuations and varying demand levels, it must be examined whether it is preferable to change the actual grocery locker locations on a monthly, weekly, or even daily basis. Our approach to circumventing the problem of varying demand levels was to compute a daily average from a data series of one month. To resolve this issue in a more realistic manner, variable demands must be considered in future works. A possible way to incorporate variable demand levels in a model is shown by Musolino et al. [41]. Further, the optimization problem can become unfeasible in the different stages. For instance, the -value can be set too low, so that one or more customers are located out of the potential locker locations’ range. Regarding the estimation of driving distances and travel times, alternative approaches could be chosen which do not base on the applied Google Distance Matrix API. As a potential extension, the user of the model could choose whether the average traffic situation at a certain time or the current traffic situation should be the basis for calculating the distances as well as the travel times between the given nodes.
Further research on e-grocery distribution problems using a network of pickup points and electric vehicles must concentrate on location selection regarding economic aspects. Taking these into account, a sparse distribution network is suggested based on the operating costs of lockers as a decisive factor. On the other hand, a dense network is crucial for the customer acceptance regarding self-collection. For the parcel industry, the study of Iwan et al. [40] identifies locations close to customers’ homes and on their way to work as most favorable. Similarly, customer acceptance for the e-grocery sector must be investigated as well. In general, the applied parameter values in the computational study, especially the cost factors, must be assessed by an industry expert. To finally analyze its added value and downsides, the proposed logistics concept and the optimization approach should be validated in a field test.
6. Conclusions and Outlook
We develop and present a multi-echelon optimization model to give computer-assisted recommendations for optimal grocery locker positioning in urban areas as well as the corresponding transport vehicle deployment. On the one hand, refrigerated grocery lockers serve as pickup points for customers to collect their ordered goods. On the other hand, the lockers enable home deliveries by ECB as the last mile distances to customers are significantly reduced. With the proposed logistics concept, we address the research gap identified by Mkansi et al. [19] while further integrating social and environmental sustainability with the main objective of cost minimization. As a result, road traffic is avoided and emissions are decreased. The social dimension is addressed by giving customers the opportunity to participate in eco-friendly goods transportation. Further, the number of potential employees is increased.
With our approach, we address e-grocery retailers, parcel delivery services and city authorities who should implement more sustainable concepts for the urban last mile distribution. We provide benchmarks to evaluate the created MILP and to demonstrate its applicability. Results indicate that increasing the service level (decreasing the grocery locker radius) leads to higher costs, whereby the operation of grocery lockers as well as the touring of vans constitute the main cost elements. Future research must focus on a refinement of the underlying mathematical models and on the development or rather an adaptation of suitable heuristic framework in the discussed ways. We suggest a field test of the proposed logistics concept to ensure further validation. If the approach proves to be advantageous compared to present business practices, it should be fine-tuned and applied on a large scale. By integrating economic, social, and environmental aspects, the described logistics concept contributes to the city logistics domain and fosters society’s shift towards sustainable operating modes.
Author Contributions
Conceptualization, M.L. and M.-O.S.; methodology, M.-O.S.; software, M.L. and M.-O.S.; validation, M.L., M.H. and M.-O.S.; formal analysis, M.L., M.H. and M.-O.S.; writing—original draft, M.L., M.-O.S. and M.H.; writing—review and editing, M.H.B.; visualization, M.L. and M.H.; supervision, M.H.B.; project administration, M.L. All authors have read and agreed to the published version of the manuscript.
Funding
This research received no external funding.
Conflicts of Interest
The authors declare no conflict of interest.
References
- Van Duin, R.; De Goffau, W.; Wiegmans, B.; Tavasszy, L.; Saes, M. Improving Home Delivery Efficiency by Using Principles of Address Intelligence for B2C Deliveries. Transp. Res. Procedia 2016, 12, 14–25. [Google Scholar] [CrossRef] [Green Version]
- European Commission. White Paper on Transport-Roadmap to a Single European Transport Area - Towards a Competitive and Resource-Efficient Transport System; Publications Office of the European Union: Luxemburg, 2011; Available online: https://eur-lex.europa.eu/legal-content/EN/TXT/PDF/?uri=CELEX:52011DC0144&from=EN (accessed on 15 March 2020).
- Leading Global Online Grocery Markets to Create a $227bn Growth Opportunity by 2023. Available online: https://www.igd.com/about-us/media/press-releases/press-release/t/leading-global-online-grocery-markets-to-create-a-227bn-growth-opportunity-by-2023/i/20396 (accessed on 18 March 2020).
- Dedrick, J. Green IS: Concepts and Issues for Information Systems Research. Commun. Assoc. Inf. Syst. 2010, 27, 173–184. [Google Scholar] [CrossRef]
- Lombardi, P.; Giordano, S.; Farouh, H.; Yousef, W. Modelling the Smart City Performance. Innov. Eur. J. Soc. Sci. Res. 2012, 25, 137–149. [Google Scholar] [CrossRef]
- UPS Launches Sustainable Deliveries in Frankfurt. Available online: https://pressroom.ups.com/pressroom/ContentDetailsViewer.page?ConceptType=PressReleases&id=1511885876172-705 (accessed on 18 March 2020).
- Hübner, A.; Kuhn, H.; Wollenburg, J. Last Mile Fulfilment and Distribution in Omni-Channel Grocery Retailing: A Strategic Planning Framework. Int. J. Retail Distrib. Manag. 2016, 44, 228–247. [Google Scholar] [CrossRef]
- Savelsberg, M.; Van Woensel, T. 50th Anniversary Invited Article—City Logistics: Challenges and Opportunities. Transp. Sci. 2016, 50, 579–590. [Google Scholar] [CrossRef]
- Taniguchi, E.; Thompson, R.G.; Yamada, T.; van Duin, R. City Logistics: Network Modelling and Intelligent Transport Systems; Pergamon: Oxford, UK, 2001. [Google Scholar]
- Khatoun, R.; Zeadally, S. Smart Cities: Concepts, Architectures, Research Opportunities. Commun. Acm 2016, 59, 46–57. [Google Scholar] [CrossRef]
- Albino, V.; Berardi, U.; Dangelico, R.M. Smart Cities: Definitions, Dimensions, Performance, and Initiatives. J. Urban Technol. 2015, 22, 3–21. [Google Scholar] [CrossRef]
- Rehm, S.; Faber, A.; Goel, L. Visualizing Platform Hubs of Smart City Mobility Business Ecosystems. In Proceedings of the 38th International Conference on Information Systems, Seoul, Korea, 10–13 October 2017. [Google Scholar]
- Ahvenniemi, H.; Huovila, A.; Pinto-Seppä, I.; Airaksinen, M. What are the Differences Between Sustainable and Smart Cities? Cities 2017, 60, 234–245. [Google Scholar] [CrossRef]
- Wollenburg, J.; Hübner, A.; Kuhn, H.; Trautrims, A. From Bricks-and-Mortar to Bricks-and-Clicks: Logistics Networks in Omni-Channel Grocery Retailing. Int. J. Retail Distrib. Manag. 2018, 48, 415–438. [Google Scholar] [CrossRef]
- Gevaers, R.; Van de Voorde, E.; Vanelslander, T. Characteristics of Innovations in Last-Mile Logistics - Using Best Practices, Case Studies and Making the Link with Green and Sustainable Logistics. In Proceedings of the European Transport Conference, Leiden, The Netherlands, 5–7 October 2009. [Google Scholar]
- Van Audenhove, F.-J.; De Jongh, S.; Durance, M. Urban Logistics: How to Unlock Value from Last Mile Delivery for Cities, Transporters and Retailers; Arthur, D. Little: Brussels, Belgium, 2015; Available online: https://www.adlittle.com/sites/default/files/viewpoints/ADL_Urban_Logistics.pdf (accessed on 8 March 2020).
- Seidel, S.; Mareï, N.; Blanquart, C. Innovations in E-Grocery and Logistics Solutions for Cities. Transp. Res. Procedia 2016, 12, 825–835. [Google Scholar] [CrossRef]
- Martín, J.C.; Pagliara, F.; Román, C. The Research Topics on E-Grocery: Trends and Existing Gaps. Sustainability 2019, 11, 321. [Google Scholar] [CrossRef] [Green Version]
- Mkansi, M.; Eresia-Eke, C.; Emmanuel-Ebikake, O. E-Grocery Challenges and Remedies: Global Market Leaders Perspective. Cogent Bus. Manag. 2018, 5, 1–28. [Google Scholar] [CrossRef]
- Holzapfel, A.; Hübner, A.; Kuhn, H.; Sternbeck, M.G. Delivery Pattern and Transportation Planning in Grocery Retailing. Eur. J. Oper. Res. 2016, 252, 54–68. [Google Scholar] [CrossRef]
- Fedoseeva, S.; Herrmann, R.; Nickolaus, K. Was the Economics of Information Approach Wrong all the Way? Evidence from German Grocery R(E)tailing. J. Bus. Res. 2017, 80, 63–72. [Google Scholar] [CrossRef]
- Seitz, C.; Pokrivčák, J.; Tóth, M.; Plevný, M. Online Grocery Retailing in Germany: An Explorative Analysis. J. Bus. Econ. Manag. 2017, 18, 1243–1263. [Google Scholar] [CrossRef] [Green Version]
- Fikar, C. A Decision Support System to Investigate Food Losses in E-Grocery Deliveries. Comput. Ind. Eng. 2018, 117, 282–290. [Google Scholar] [CrossRef]
- Waitz, M.; Mild, A.; Fikar, C. A Decision Support System for Efficient Last-Mile Distribution of Fresh Fruits and Vegetables as Part of E-Grocery Operations. In Proceedings of the 51st Hawaii International Conference on System Sciences, Maui, HI, USA, 3–6 January 2018. [Google Scholar]
- Amorim, P.; Almada-Lobo, B. The Impact of Food Perishability Issues in the Vehicle Routing Problem. Comput. Ind. Eng. 2014, 67, 223–233. [Google Scholar] [CrossRef]
- Hsu, C.-I.; Chen, W.T. Optimizing Fleet Size and Delivery Scheduling for Multi-Temperature Food Distribution. Appl. Math. Model. 2014, 38, 1077–1091. [Google Scholar] [CrossRef]
- Emeç, U.; Çatay, B.; Bozkaya, B. An Adaptive Large Neighborhood Search for an E-Grocery Delivery Routing Problem. Comput. Ind. Eng. 2016, 69, 109–125. [Google Scholar] [CrossRef]
- Leyerer, M.; Sonneberg, M.-O.; Breitner, M.H. Decision Support for Urban E-Grocery Operations. In Proceedings of the 24th Americas Conference on Information Systems, New Orleans, LA, USA, 16–18 August 2018. [Google Scholar]
- Eksioglu, B.; Vural, A.V.; Reisman, A. The Vehicle Routing Problem. A Taxonomic Review. Comput. Ind. Eng. 2009, 5, 1472–1483. [Google Scholar] [CrossRef]
- Hemmelmayr, V.C.; Cordeau, J.-F.; Crainic, T.G. An Adaptive Large Neighborhood Search Heuristic for Two-Echelon Vehicle Routing Problems Arising in City Logistics. Comput. Oper. Res. 2012, 39, 3215–3228. [Google Scholar] [CrossRef] [PubMed] [Green Version]
- Liu, R.; Tao, Y.; Hu, Q.; Xie, X. Simulation-based Optimisation Approach for the Stochastic Two-echelon Logistics Problem. Int. J. Prod. Res. 2017, 55, 187–201. [Google Scholar] [CrossRef]
- Zhou, L.; Baldacci, R.; Vigo, D.; Wang, X. A Multi-depot Two-echelon Vehicle Routing Problem with Delivery Options Arising in the Last Mile Distribution. Eur. J. Oper. Res. 2018, 265, 765–778. [Google Scholar] [CrossRef]
- Enthoven, D.L.J.U.; Jargalsaikhan, B.; Roodbergen, K.J.; uit het Broek, A.J.M.; Schrotenboer, A.H. The Two-Echelon Vehicle Routing Problem with Covering Options: City Logistics with Cargo Bikes and Parcel Lockers. Comput. Oper. Res. 2020, 104919. [Google Scholar] [CrossRef]
- Papadimitriou, D.; Colle, D.; Demeester, P. Mixed Integer Optimization for the Combined Capacitated Facility Location-Routing Problem. Ann. Telecommun. 2018, 73, 37–62. [Google Scholar] [CrossRef]
- Perl, J.; Daskin, M.S. A Warehouse Location-Routing Problem. Transp. Res. Part B Methodol. 1985, 19, 381–396. [Google Scholar] [CrossRef]
- El Fallahi, A.; Prins, C.; Wolfler Calvo, R. A Memetic Algorithm and a Tabu Search for the Multi-Compartment Vehicle Routing Problem. Comput. Oper. Res. 2018, 35, 1725–1741. [Google Scholar] [CrossRef]
- Archetti, C.; Savelsbergh, M.V.P.; Speranza, M.G. Worst-Case Analysis for Split Delivery Vehicle Routing Problems. Transp. Sci. 2014, 40, 226–234. [Google Scholar] [CrossRef] [Green Version]
- Salhi, S.; Rand, G. The Effect of Ignoring Routes when Locating Depots. Eur. J. Oper. Res. 1989, 39, 150–156. [Google Scholar] [CrossRef]
- Dell’Amico, M.; Deloof, W.; Hadjidimitriou, N.S.; Vernet, G.; Schoenewolf, W. CityLog – Sustainability and Efficiency of City Logistics: The M-BBX (Modular BentoBox System). In Proceedings of the IEEE Forum on Integrated and Sustainable Transportation Systems, Vienna, Austria, 29 June–1 July 2011. [Google Scholar]
- Iwan, S.; Kijewska, K.; Lemke, J. Analysis of Parcel Lockers’ Efficiency as the Last Mile Delivery Solution – The Results of the Research in Poland. Transp. Res. Procedia 2016, 12, 644–655. [Google Scholar] [CrossRef] [Green Version]
- Musolino, G.; Rindone, C.; Polimeni, A.; Vitetta, A. Planning Urban Distribution Center Location with Variable Restocking Demand Scenarios: General Methodology and Testing in a Medium-size Town. Transp. Pol. 2019, 80, 157–166. [Google Scholar] [CrossRef]
- Figliozzi, M. Vehicle Routing Problem for Emissions Minimization. Transp. Res. Rec. 2010, 2197, 1–7. [Google Scholar] [CrossRef] [Green Version]
- Prodhon, C.; Prins, C. A Survey of Recent Research on Location-Routing Problems. Eur. J. Oper. Res. 2014, 238, 1–17. [Google Scholar] [CrossRef]
Figure 1.
Share of e-grocery by country in 2018 and 2023 [3].
Figure 1.
Share of e-grocery by country in 2018 and 2023 [3].
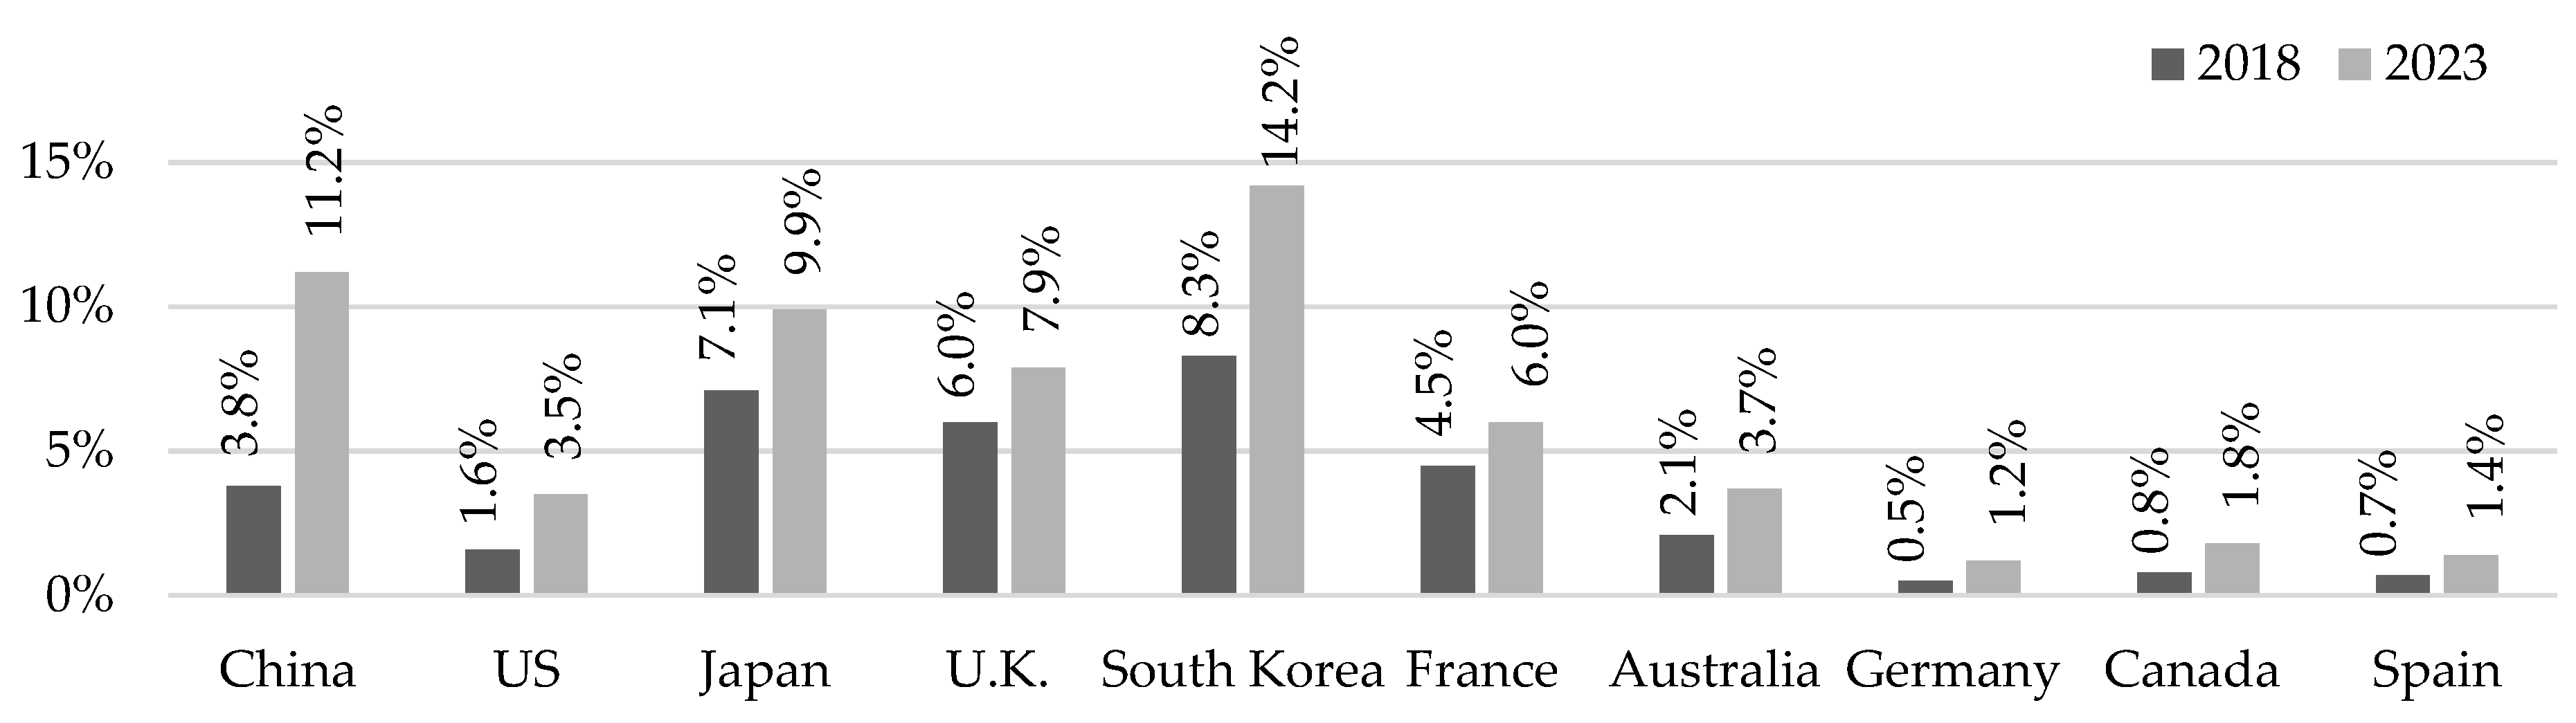
Figure 2.
Overview of the proposed e-grocery logistics concept.
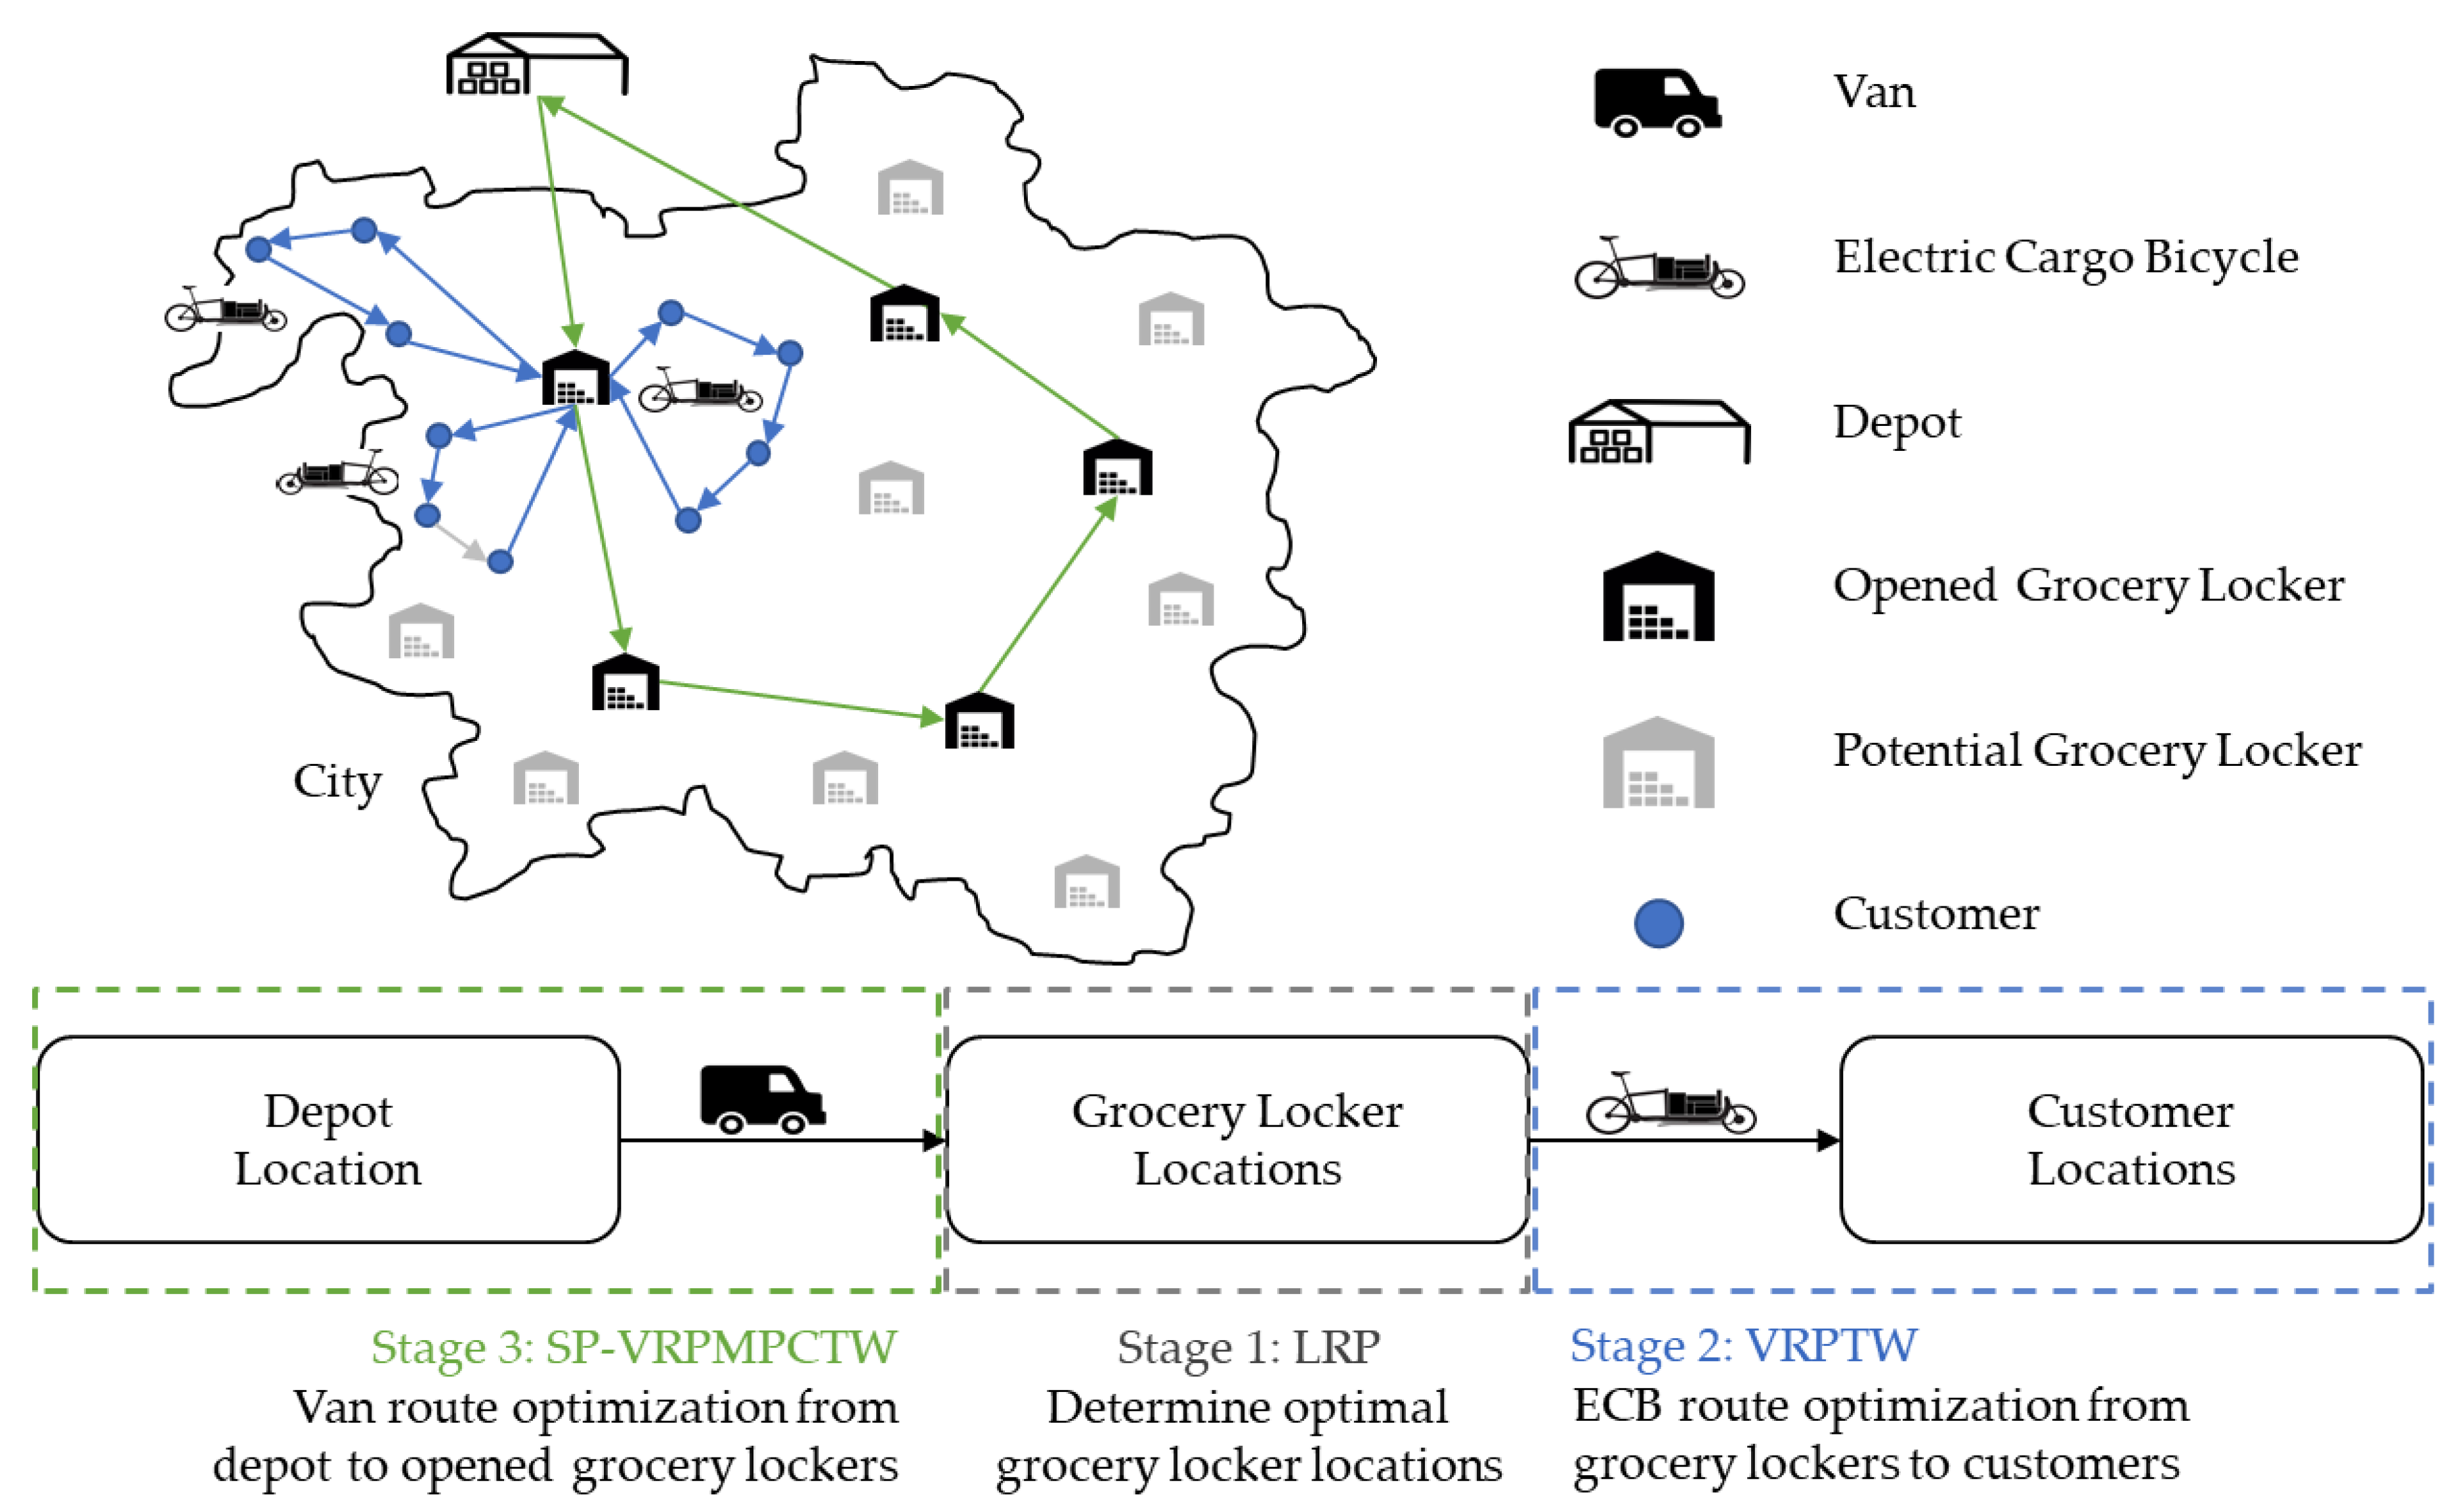
Figure 3.
Considered investigation area including relevant locations and interpolated average demand.
Figure 3.
Considered investigation area including relevant locations and interpolated average demand.

Table 1.
Applied indices, parameters, and decision variables of the LRP.
| Notation | Description |
|---|---|
| Indices: | |
| Parameters: | |
| Variables: | |
Table 2.
Applied indices, parameters, and decision variables of the VRPTW.
| Notation | Description |
|---|---|
| Indices: | |
| Parameters: | |
| Variables: | |
Table 3.
Applied indices, parameters and decision variables of the SP-VRPMPCTW.
| Notation | Description |
|---|---|
| Indices: | |
| Parameters: | |
| Variables: | |
Table 4.
Benchmark results for different ratios of home delivery and self-collection.
| Home del./Self-Coll. (%) | Number of Lockers | Distance | Costs | |||||||
|---|---|---|---|---|---|---|---|---|---|---|
| Small (#) | Medium (#) | Large (#) | ∑ (#) | ECB (km/day) | Vans (km/day) | Grocery Locker (€/day) | ECB Travel. (€/day) | Van Travel. (€/day) | ∑ (€/day) | |
| 100/0 | 4 | 4 | 0 | 8 | 111.8 | 212.65 | 116.00 | 11.18 | 63.79 | 190.98 |
| 75/25 | 4 | 4 | 0 | 8 | 64.36 | 212.65 | 116.00 | 6.44 | 63.79 | 186.23 |
| 50/50 | 4 | 4 | 0 | 8 | 38.81 | 212.65 | 116.00 | 3.88 | 63.79 | 183.68 |
| 25/75 | 4 | 4 | 0 | 8 | 18.55 | 212.65 | 116.00 | 1.85 | 63.79 | 181.65 |
| 0/100 | 4 | 4 | 0 | 8 | 0.00 | 212.65 | 116.00 | 0.00 | 63.79 | 179.79 |
Table 5.
Benchmark results for different distances from lockers to customers.
| Max. Distance (km) | Number of Lockers | Distance | Costs | |||||||
|---|---|---|---|---|---|---|---|---|---|---|
| Small (#) | Medium (#) | Large (#) | ∑ (#) | ECB (km/day) | Vans (km/day) | Grocery Locker (€/day) | ECB Travel. (€/day) | Van Travel. (€/day) | ∑ (€/day) | |
| 0.50 | 25 | 0 | 0 | 25 | 24.30 | 225.56 | 250.00 | 2.43 | 67.67 | 320.10 |
| 0.75 | 19 | 0 | 0 | 19 | 32.55 | 223.87 | 190.00 | 3.26 | 67.17 | 260.42 |
| 1.25 | 4 | 4 | 0 | 8 | 38.81 | 212.65 | 116.00 | 3.88 | 63.79 | 183.68 |
| 1.75 | 2 | 0 | 3 | 5 | 43.82 | 209.89 | 101.00 | 4.38 | 62.97 | 168.35 |
| 2.00 | 0 | 1 | 3 | 4 | 50.95 | 202.32 | 100.00 | 5.09 | 60.70 | 165.79 |
Table 6.
Comparison of new logistics concept with conventional e-grocery delivery.
| Scenario | Conventional Delivery of Groceries | New Logistics Concept (100% Home Delivery; 0% Self-Collection; = 1.25 km) | New Logistics Concept (50% Home Delivery; 50% Self-Collection; = 2.0 km) | |
|---|---|---|---|---|
| Number of lockers | small (#) | 0 | 4 | 0 |
| medium (#) | 0 | 4 | 1 | |
| large (#) | 0 | 0 | 3 | |
| ∑ (#) | 0 | 8 | 4 | |
| Travel distance | ECB (km/day) | 0 | 111.82 | 50.95 |
| Van (km/day) | 293.27 | 212.65 | 202.32 | |
| Local emissions (kgCO2/day) | 56.31 | 40.83 | 38.85 | |
| Space requirement (m2) | 0 | 48 | 44 | |
| Costs (€/day) | 87.97 | 190.98 | 165.79 | |
© 2020 by the authors. Licensee MDPI, Basel, Switzerland. This article is an open access article distributed under the terms and conditions of the Creative Commons Attribution (CC BY) license (http://creativecommons.org/licenses/by/4.0/).
Share and Cite
MDPI and ACS Style
Leyerer, M.; Sonneberg, M.-O.; Heumann, M.; Breitner, M.H. Shortening the Last Mile in Urban Areas: Optimizing a Smart Logistics Concept for E-Grocery Operations. Smart Cities 2020, 3, 585-603. https://doi.org/10.3390/smartcities3030031
AMA Style
Leyerer M, Sonneberg M-O, Heumann M, Breitner MH. Shortening the Last Mile in Urban Areas: Optimizing a Smart Logistics Concept for E-Grocery Operations. Smart Cities. 2020; 3(3):585-603. https://doi.org/10.3390/smartcities3030031
Chicago/Turabian StyleLeyerer, Max, Marc-Oliver Sonneberg, Maximilian Heumann, and Michael H. Breitner. 2020. "Shortening the Last Mile in Urban Areas: Optimizing a Smart Logistics Concept for E-Grocery Operations" Smart Cities 3, no. 3: 585-603. https://doi.org/10.3390/smartcities3030031