Abstract
Device-free localization (DFL) has become a hot topic in the paradigm of the Internet of Things. Traditional localization methods are focused on locating users with attached wearable devices. This involves privacy concerns and physical discomfort especially to users that need to wear and activate those devices daily. DFL makes use of the received signal strength indicator (RSSI) to characterize the user’s location based on their influence on wireless signals. Existing work utilizes statistical features extracted from wireless signals. However, some features may not perform well in different environments. They need to be manually designed for a specific application. Thus, data processing is an important step towards producing robust input data for the classification process. This paper presents experimental procedures using the deep learning approach to automatically learn discriminative features and classify the user’s location. Extensive experiments performed in an indoor laboratory environment demonstrate that the approach can achieve 84.2% accuracy compared to the other basic machine learning algorithms.
1. Introduction
The Internet of Things (IoT) has become a widespread phenomenon due to its progressive capabilities [1]. Areas that have been well investigated in this field include wireless sensor networks (WSNs), radio frequency identification (RFID) and mobile computing. Particularly, the WSN provides various advanced technologies such as sensor development, wireless communication and distributed information processing and because of this, it has received a great amount of attention in IoT communities. Often, a number of sensor nodes are deployed in WSN applications. These sensors are connected through wireless communication to perform several tasks such as sensing, recognizing, and monitoring. These tasks are used in many applications, for example, object tracking [2], intruder detection [3], indoor fire detection [4] and human localization as well as activity recognition in indoor environments [5,6].
So far, indoor human localization has made a major breakthrough in WSN services. Most of the localization systems can be divided into two types: active and passive communication systems [7]. The former requires users to carry or wear terminal devices such as sensors or RFID tags in order to be located. Some use a cellular-based signal to locate the user’s location through smartphones while some utilize satellite signals to provide accurate localization points. Although these systems are usually great at providing a location-based service, they still suffer a certain amount of localization errors [8]. Furthermore, most of the systems encounter some challenges where it is difficult to be applied, especially in cases where humans do not want to attach or mount any sensors to their body.
As technologies progress, passive communication systems are able to solve the problem. These systems do not need any devices to be carried in order to be detected or located. Recent research has seen a rising trend towards this technology. It can also be known as device-free localization (DFL) or sensor-less sensing. Most of the work utilizes radio frequency (RF) to create a wireless sensor network, where specifically the propagation of the radio is actually the sensors [9]. In particular, a received signal strength indicator (RSSI) can also be used to measure signal variations between sensor nodes. The presence of a human can be detected when the person goes into the monitoring area because the movement will reflect, scatter and absorb the RSSI signal [10]. Therefore, using this method, it is possible to infer a person’s location by analyzing its influence on the wireless signals. This has promising prospects as it does not require users to be equipped with any terminal devices and thus, eliminates the privacy issues. Furthermore, the systems have a large sensing range, which make them an attractive technique for various applications.
The major element of this work is to characterize and classify the influence of the user’s location on the wireless signals using RSSI values. Traditionally, researchers used to extract statistical features from sensor raw data such as mean, variances, energy and entropy based on time and frequency domains [11]. Then, the features have to be processed in order to study the relationship between them and their target locations. However, in practice, the location-features relationship is not directly accessible. The variations in RSSI values caused by a moving target are usually weak and furthermore, noises in the environment degrade its classification results. This results in labour-intensive and time-consuming work to produce reliable features to suit the target location.
To address the problem, this paper presents a device-free localization method to classify the user’s location in an indoor environment. The work mainly proposes an experimental procedure for obtaining input data for a deep learning approach in the form of RSSI values. They are treated as matrix indices, which represent patterns of movement for a person in each location. The basic principle is that different moving arrangements will produce different patterns in the RSSI matrix indices. A deep learning model is then used to classify the patterns of RSSI data with the movement of a person in its target location and produce a classification model. The performance of the model is compared with several machine learning algorithms in terms of accuracy, precision, recall and F-measure. As a summary, the contributions of this paper are as follows:
- A device-free localization system is proposed, which consists of offline and online training phases. The offline phase is used to build a deep learning model that can identify the difference in RSSI value in the form of matrix indices. The matrix represents patterns when the person moves around in predetermined locations. Meanwhile, the online phase predicts the exact location of a person based on the real-time obtained values of RSSI based on the Wi-Fi signal.
- A procedure for obtaining matrix indices that act as input data for the deep learning model is presented. The procedure includes steps in data processing to obtain patterns and features for the deep learning model to compute classification and measure its performance.
- A Wi-Fi-based hardware testbed is designed to evaluate the proposed method. It consists of 12 sensor nodes that work as transmitter and receiver simultaneously. The collected data is then sent to a server for monitoring purpose and used to perform localization. The experiments are computed in an indoor environment for a single user.
The remainder of the paper is structured as follows. Section 2 presents related work on DFL techniques as well as deep learning models. Section 3 discusses hardware development and the data collection process to obtain input data for the deep learning model. Section 4 describes experimental procedures to classify sensor data using the deep learning technique and Section 5 presents the obtained results and its discussion. Finally, Section 6 summarizes the conclusion and future work.
2. Related Work
Recent advances in wireless sensing technologies have allowed DFL to receive a considerable amount of attention from IoT-based researchers. The area provides significant advantages compared to other technologies as there is no requirement for the user to carry a device for location monitoring. In past decades, different approaches have been proposed to develop an efficient indoor localization system.
The principle idea of DFL is based on observing the influence of the shadowing effect of a user on wireless signals. For example, [12], presented an approach based on radio tomographic imaging (RTI). It worked by imaging the RSS attenuation caused by physical objects in wireless links. It used an RF signal that could travel through obstructions such as walls and trees, where optical or infrared imaging cannot perform well. Then, statistical analysis related to variance was used to estimate spatial locations of movement for motion image estimation. This pioneering work established further interest for the DFL community. Based on this, studies have been carried out to improve the performance of DFL in different environments. For instance, [13] applied RSS signal using RTI to generate an image of the scene and used segmentation algorithms to label target tracking. Meanwhile, [14] measured RSS signal on multiple frequency channels and combined them using the weighted average method for multiple target tracking.
Most of these approaches allowed the wireless signal itself to become a sensor, which could be used to perceive the context of the environment [15]. This enabled traditional wireless sensors to turn into intelligent networks and to have the ability to not only perform human localization but also activity and gesture classification simultaneously. In fact, machine learning methods were among the well-known approaches to classify sensor data [16]. Features were extracted to characterize different influences on users based on the collected wireless signals. However, these features were manually selected and had to be handcrafted as the environment changed [17]. For instance, a k-NN classifier was used on the RF signal to recognize multiple conducted activities in different locations [13]. Hybrid features from time and frequency domains were then manually extracted and supplied to the classifier.
To make localization systems readily deployable in practical applications, deep learning techniques have been introduced in this paper. They are inspired by human brain architecture and considered as an extension method of machine learning techniques that perform higher-level inference and abstractions [18]. In contrast with other machine learning tools, deep learning models can perform well by automatically extracting meaningful and discriminative features for the classification process. The complex and deep-level architecture allows trained models to be transferred to new tasks where there are only a few labelled data, or where certain domain knowledge is required. This makes them feasible to be deployed and used in supervised training using an end-to-end neural network [19].
3. Proposed Method
In this study, the proposed localization system is illustrated in Figure 1. First, the sensor nodes are deployed in an indoor monitoring area. The system uses RSSI data that is transmitted and received simultaneously by wireless nodes to create a wireless network mesh. When a person is moving, the wireless links detect interference on the RSSI value and this can create influence on the signal to identify exactly where the person is located.
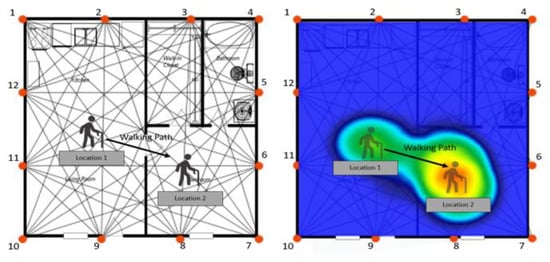
Figure 1.
Proposed system.
The system consists of two stages: offline and online. The former trains the RSSI value to build a classification model based on patterns formed by each location. Meanwhile, the online stage allowa real-time data to predict accurately where the person is located. This paper also introduces data processing techniques that can help the deep learning model to capture patterns effectively and accurately identify the location.
3.1. Hardware Implementation
An RSSI-based localization device was designed using three types of Wi-Fi serial transceiver modules (ESP 12-F). The device is called a WiLoc (Wi-Fi Location) stick, which is made in the form of the USB stick shown in Figure 2. The size of the stick is 8.8 cm length × 2.8 cm width × 1.5 cm height. It was designed with the purpose of making it easy to implement and connect with any power supply. The combination of three ESP 12-F Wi-Fi modules in a single board as shown in Figure 3 allows minimization of the data transmission rate by eliminating the switching module in the switching mode.
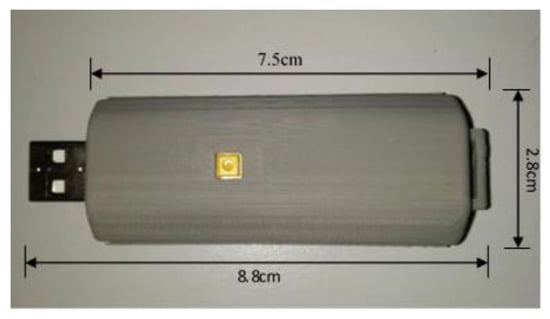
Figure 2.
Stick dimensions.
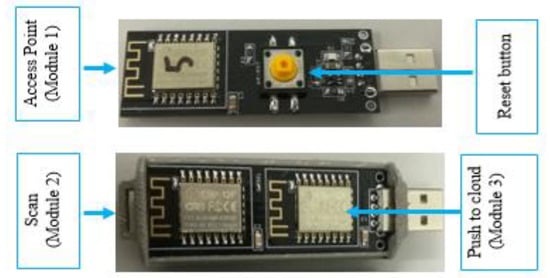
Figure 3.
ESP 12-F modules arrangement.
In this condition, the first module (module 1) acts as the access point and broadcasts the RSSI signal while the second module has been set as the client. This module scans and captures all the Wi-Fi signals around it and measures the RSSI. The second module (module 2) then sorts the signal and passes to the last module for data transmission to the cloud server. After the second module has scanned and sorted all the Wi-Fi RSSI signal, it passes it to the last module (module 3) which connects to the internet to push the aggregated RSSI signal to the cloud database. The sampling time to the cloud database of each data is three seconds. The WiLoc stick is operated on the 5 V power supply and it is easy to power up using a 5 V USB adaptor or any USB socket like a computer or a TV box. The average power consumption is about 215 mA during the signal transmission operation and it is based on a 2.4 GHz Wi-Fi frequency channel.
For the transmission process, module 3 is pre-loaded with the Wi-Fi manager function as shown in Figure 3 to make it user-friendly. This can be used to connect to any Wi-Fi (with internet) for pushing up the data to the cloud server and database. The WiLoc stick has a 2 min power up before it can act as the access point, and the user can connect to the stick using their own username and password. The interface of the main page Wi-Fi manager is shown in Figure 4a. After selecting the configuration panel, the Wi-Fi configuration window appears as in Figure 4b. It is composed of different Wi-Fi network signals that exist in the environment. The Wi-Fi manager lists all the Wi-Fi signals within the WiLoc stick coverage. The user then needs to select the relevant Wi-Fi SSID name with the internet connection and put in the password. After 2 min, the device automatically switches to client mode and connects to the Wi-Fi SSID name that has already been configured beforehand.
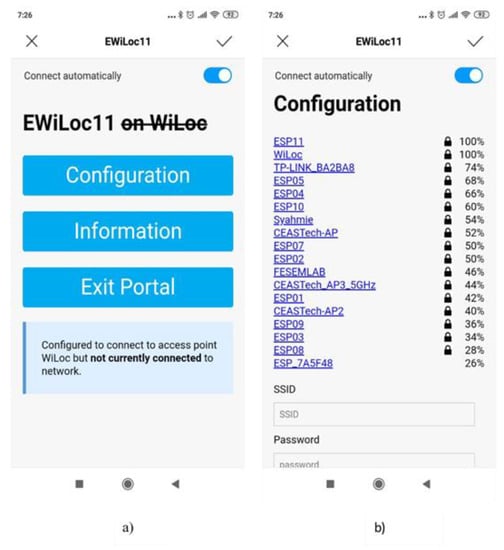
Figure 4.
Wi-Fi manager function: (a) Wi-Fi manager main page and (b) list of Wi-Fi configurations.
3.2. Data Collection
A 12-unit of WiLoc sticks were implemented inside the wireless sensor network (WSN) area at a laboratory environment located in University Malaysia Perlis (UniMAP). The implementation layout for the location of the WiLoc sticks is presented in Figure 5. The environment was designed into M × N, or in this case 6.4 m × 12 m. The spacing of WiLoc sticks was 1 m apart from each other and 1 m from the ground. Using the USB form, each WiLoc stick was mounted to the power socket on the wall or power extension plug.
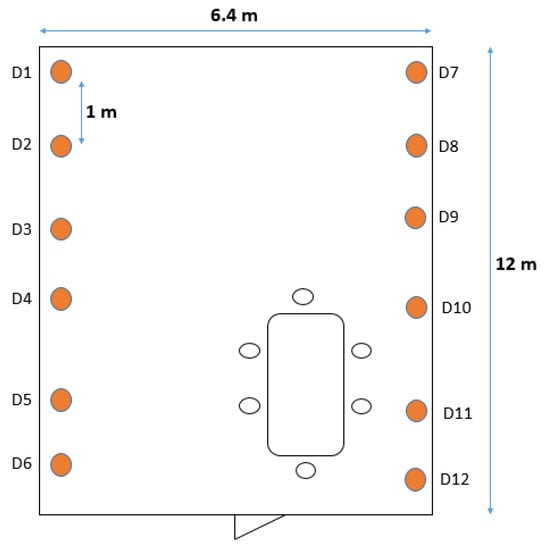
Figure 5.
Location of the WiLoc sticks inside the wireless sensor network (WSN) area.
Each WiLoc stick node created its own access point to allow other WiLoc stick nodes to scan their RSSI signal. After the WiLoc sticks finished collecting the RSSI value from the other 11 nodes, they pushed the aggregated RSSI data to the cloud database. The response time of the scanned RSSI, as well as the aggregated RSSI reading to the cloud database, was as fast as 3 s. The duration was sufficient to monitor any massive changes that occurred. The web-based user interface for monitoring the changes of RSSI of the WiLoc stick was accessible through the link https://wifi.ceastech.com/.
The experiment was further continued by collecting the data using the WiLoc sticks. Each of the sticks received and transmitted the Wi-Fi signal simultaneously. The stick was mounted to the power supply socket using a USB adapter. The collected data was then used to perform a classification process based on four predetermined locations. These locations were set depending on the placement of the wireless sensor nodes shown in Figure 6a. Meanwhile, Figure 6b shows the connected link signal between each node. The wireless signal was evenly distributed inside the experiment area. Suppose a person is standing at location 1, they would shadow some of the wireless links, for example from nodes 3 to 9, 3 to 8 and 2 to 9. The person stands stationary for a period of time and then moves to the next location. Finally, all the sensor data were collected and sent to be processed in the main router. The router then sent the data to the remote server for data visualization.
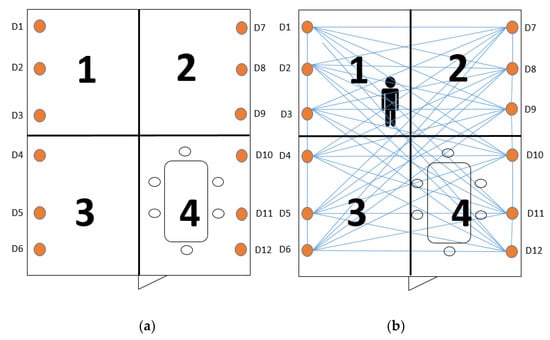
Figure 6.
Data collection process: (a) predetermined location; (b) wireless links between each node.
3.3. Data Retrieval
The collected RSSI data was saved in the server. In order to sort and retrieve the wireless sensor data, MySQL Workbench was used [20]. Figure 7 presents a snapshot of the workbench consisting of the collected data.
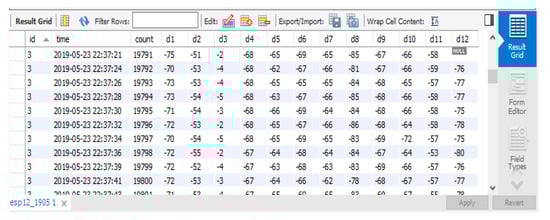
Figure 7.
TheMy Structured Query Language (SQL) workbench.
3.4. Data Processing
The raw data received by the wireless nodes contained various information such as number id, time when the signal was captured, signal counter and RSSI value for each node. However, the raw data needed to be processed to obtain information about the person’s location. Data processing helped to analyze the original data by parsing them into several steps. The first step involved filling in the missing (NULL) value by taking into account the previous value at (t–1). The missing data happened as the signal could be lost during the transmission process. If the signal was lost, it was unable to create a complete network mesh to build patterns based on the person’s location. The process can be represented in Equation (1):
where indicates the current time and represents the previous RSSI value.
The second step was to concatenate the RSSI value into several packet samples. The samples were measured by taking the average value of RSSI based on the captured time. In this case, the RSSI values were concatenated in a one minute duration of time. The duration was enough to capture the patterns of the person’s movement. For example, the RSSI value was averaged between until . Then, the following period of time was averaged in the same way. The main idea of concatenation is to deal with the missing RSSI values from the wireless nodes at certain times and to obtain a uniform packet sample of data. Obviously, it is difficult to classify the data with its label if it is not in a uniform state. The sample packets can be expressed in Equation (2):
where indicates the current time and th nodes th denotes the maximum period of time in the data collection.
The last process was to extract the wireless sensor data in the form of frames and to compile them into RSSI matrix indices with the dimensions of L × L. In this respect, the row of the matrix represented the sensor node that received the signal while the column represented the sensor node that transmitted the Wi-Fi signals. The RSSI matrix can be represented in Equation (3).
where indicates the current time, is the number of nodes and is the RSSI value at certain nodes.
4. Classification Using Deep Learning Algorithm
In this work, a deep multi-layer perceptron (DMLP) neural network was used to train and classify the sensor data. The network consisted of three layers: input, hidden and output layers. It was considered as a feed-forward neural network that fed information through a series of mathematical operations in nodes. Figure 8 shows the architecture of a deep neural network.
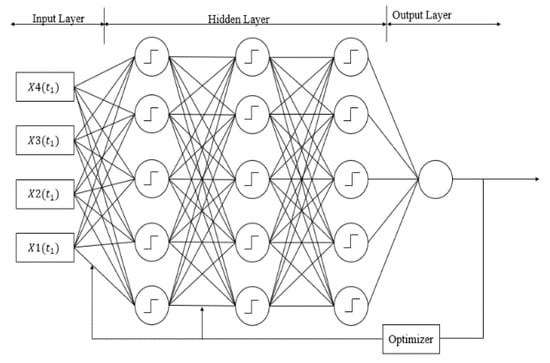
Figure 8.
Neural network architecture.
Traditionally, a simple MLP usually consists of one or two hidden layers. A deep neural network, on the other hand, refers to a neural network model with multiple n number of hidden layers; usually, more than two hidden layers are employed. The model learns the input data from the input-output relationship of the process embedded during the training phase through a supervised learning technique.
In this work, each hidden layer contains the same number of hidden nodes. The model corresponds to a linear transformation and uses a rectified-linear unit (ReLU) as the activation function. The ReLU is preferred because it can address the vanishing gradient problem that affects the network. The function works by limiting the input of negative hidden nodes to zero. In addition, softmax cross-entropy is used as the loss function—where it calculates the loss value to determine whether the model is trained well or not. Then, the Adam optimizer is used to adjust the amount of update based on the loss value. For the training process, mini-batch training is proposed, where the input data is divided into s samples of batch sizes which correspond with respect to the class distribution in the training set. Table 1 presents detailed information on the parameters used for this neural network model.

Table 1.
Parameters used in deep learning model.
The implementation of the model was based on the Python language and GPU-based Tensor Flow library framework, which used Nvidia-GeForce RTX series. The parameters in the above table were then applied to the model to test the performance rates. To determine the best configurations and parameters for the deep learning models, different values of the learning rate, batch sizes and the number of hidden units were used through the brute-force approach. These values were obtained through the training data and the model’s performance was evaluated using testing data.
It was important to determine these values as the learning rate differs depending on the number of input data. Meanwhile, the batch size was used to separate activity data into smaller sets for fast learning time and fewer memory allocations, while the hidden units allowed the network to analyse the input data and send the result to the output layer.
5. Results and Discussion
Comparison was performed between the two approaches, i.e., deep learning and basic machine learning algorithms, namely, using support vector machine (SVM), decision tree (DT) and multi-layer perceptron neural network (MLP).
For the validation process, the sensor data was divided into two sets, where 80% was used for training and producing the model while 20% was used for testing. In particular, 11,983 rows of data were used to train the model while 2996 rows were used to test the produced model. Then, the performance rates were measured by calculating the confusion matrix of each model from the testing process. These were obtained by comparing the output of the model with the ground truth provided in the dataset. This process calculated the performance in terms of accuracy, precision, recall and F-measure. These measurements were computed using equations as below [21]:
where N is the number of total data, TP is true positive, which is regarded as the number of correctly inferred activities, NI is the number of inferred activities, and NG is the number of ground truth labels.
Table 2 shows the confusion matrix of the DMLP model. Meanwhile, the confusion matrices for each of the basic machine learning algorithms are presented in Table 3, Table 4 and Table 5.
Table 2.
Confusion matrix of deep multilayer perceptron.
Table 3.
Confusion matrix of support vector machine.
Table 4.
Confusion matrix of decision tree.
Table 5.
Confusion matrix of multilayer perceptron ANN.
Table 6 depicts the summary of performance rates for these classifiers. Overall, it can be seen that the performance rates of the deep learning model have increased compared to the other machine learning classifiers. Considering the accuracy values, the results show that DMLP has better performance with the highest result of 84.18% accuracy, 90.89% precision, 83.59% recall and 87.09% F-measure. Traditional MLP gives relatively poor results with only 55.11% accuracy value. Furthermore, the high value of precision and recall for DMLP compared to the other classifiers show that the deep learning model is able to predict precisely from the true positive number and the total number of sensor data from each location. Ultimately, it shows that with the proposed approach, the true positive number for the classified data rises and conversely, the false-negative number becomes low.
Table 6.
Results of the different classification algorithms.
Furthermore, another experiment was performed to investigate the performance of classification models in terms of time execution in seconds. The models were tested against time in the training dataset. Table 7 presents the running time to train the data to form each of the models using the respective algorithms. It can be seen that SVM has the lowest time to form the model while DMLP took a longer time. This can be explained by the fact that deep learning models contain multiple hidden layers with hundreds of hidden units in each of the layers. Meanwhile, SVM is a machine learning classifier that acts by separating data with hyperplanes and thus, it has less execution time compared to the deep learning approach.
Table 7.
Performance results based on time execution.
6. Conclusions and Future Work
The presented results clearly show that the input data based on the introduced procedure was able to produce patterns that can distinguish each location when the person moves. Using the MLP deep learning model, the performance of the system to classify location based on RSSI data is better compared to the basic machine learning classifiers. Although it has the highest execution time, the model has the capability to automatically extract relevant features and produce meaningful results in terms of accuracy, precision, recall and f-measure. The model achieved performance rates of between 84% to 85%.
Overall, from the experimental results, it can be concluded that the produced features that act as the input for a deep learning model have the capability to capture patterns of movement and good performance in the classification process. Moreover, they are grouped in the form of matrix indices, which have less complexity to represent RSSI values for each location. Thus, when the person moves into the new location, the deep learning model can identify the right range of RSSI value and predict the right location. However, the system depends on the strength of the received signal. The signal has some implications when dealing with objects and walls in the environment. The accuracy value can be improved if there are less objects or obstacles in the environment as they can disturb the wireless propagation between nodes. Furthermore, the link density of wireless nodes in the environment can greatly affect performance rates. The further the subject is from the nodes, the less accurate it will be.
The classification performance is also affected by the training parameters in the deep learning model. Particularly, learning rate variations and number of iterations play an important role in achieving better classification results. However, from the experimental data, the classification results do not improve significantly if larger variations of these two parameters are used. Thus, fixed parameters have proven to work well to achieve higher accuracy in classifying the person’s location.
As for future work, the performance of the localization system can be investigated with fewer sensor nodes. This would be useful as the number of nodes is one of the primary requirements to produce a reliable network mesh. Furthermore, other means of feature extraction processes can be investigated to extract more relevant features and compare the performance rates with non-extracted feature methods. Finally, the validation process can be explored more with respect to other measurements such as cross-validation and grid search processes.
Author Contributions
Methodology, N.A.R. and S.S.; Investigation, H.N.; Supervision, L.M.K. and A.Z.; Original Draft, A.S.A.S. All authors have read and agreed to the published version of the manuscript.
Funding
The author would like to acknowledge the support from Malaysian Technical University Network (MTUN) grant under the project of Development and Deployment of Smart Community and Innovation Centre for Smart City 4.0.
Conflicts of Interest
The authors declare no conflict of interest.
References
- Sadowski, S.; Spachos, P. RSSI-Based Indoor Localization With the Internet of Things. IEEE Access 2018, 6, 30149–30161. [Google Scholar] [CrossRef]
- Pathak, A.R.; Pandey, M.; Rautaray, S. Application of Deep Learning for Object Detection. Procedia Comput. Sci. 2018, 132, 1706–1717. [Google Scholar] [CrossRef]
- Wang, J.; Zhang, X.; Gao, Q.; Yue, H.; Wang, H. Device-Free Wireless Localization and Activity Recognition: A Deep Learning Approach. IEEE Trans. Veh. Technol. 2017, 66, 6258–6267. [Google Scholar] [CrossRef]
- Ahmad, A.; Rathore, M.M.; Paul, A.; Hong, W.-H.; Seo, H. Context-Aware Mobile Sensors for Sensing Discrete Events in Smart Environment. J. Sens. 2016, 2016, 1–10. [Google Scholar] [CrossRef]
- Shukri, S.; Kamarudin, L.M.; Cheik, G.C.; Gunasagaran, R.; Zakaria, A.; Kamarudin, K.; Zakaria, S.M.M.S.; Harun, A.; Azemi, S.N. Analysis of RSSI-based DFL for human detection in indoor environment using IRIS mote. In Proceedings of the 2016 3rd International Conference on Electronic Design (ICED), Phuket, Thailand, 11–12 August 2016; pp. 216–221. [Google Scholar]
- Sukor, A.S.A.; Zakaria, A.; Rahim, N.A.; Kamarudin, L.M.; Setchi, R.; Nishizaki, H. A hybrid approach of knowledge-driven and data-driven reasoning for activity recognition in smart homes. J. Intell. Fuzzy Syst. 2019, 36, 4177–4188. [Google Scholar] [CrossRef]
- Shukri, S.; Kamarudin, K. Device free localization technology for human detection and counting with RF sensor networks: A review. J. Netw. Comput. Appl. 2017, 97, 157–174. [Google Scholar] [CrossRef]
- Zhang, J.; Xiao, W.; Zhang, S.; Huang, S. Device-Free Localization via an Extreme Learning Machine with Parameterized Geometrical Feature Extraction. Sensors 2017, 17, 879. [Google Scholar] [CrossRef]
- Denis, S.; Berkvens, R.; Weyn, M. A Survey on Detection, Tracking and Identification in Radio Frequency-Based Device-Free Localization. Sensors 2019, 19, 5329. [Google Scholar] [CrossRef]
- Sun, Y.; Zhang, X.; Wang, X.; Zhang, X. Device-Free Wireless Localization Using Artificial Neural Networks in Wireless Sensor Networks. Wirel. Commun. Mob. Comput. 2018, 2018, 1–8. [Google Scholar] [CrossRef]
- Hsieh, C.-H.; Chen, J.-Y.; Nien, B.-H. Deep Learning-Based Indoor Localization Using Received Signal Strength and Channel State Information. IEEE Access 2019, 7, 33256–33267. [Google Scholar] [CrossRef]
- Xu, S.; Liu, H.; Gao, F.; Wang, Z. Compressive Sensing Based Radio Tomographic Imaging with Spatial Diversity. Sensors 2019, 19, 439. [Google Scholar] [CrossRef] [PubMed]
- Sigg, S.; Shi, S.; Ji, Y. RF-Based device-free recognition of simultaneously conducted activities. In Proceedings of the ACM International Joint Conference on Pervasive and Ubiquitous Computing (UbiComp 2013), Zurich, Switzerland, 8–12 September 2013; pp. 531–540. [Google Scholar]
- Bocca, M.; Kaltiokallio, O.; Patwari, N.; Venkatasubramanian, S. Multiple Target Tracking with RF Sensor Networks. IEEE Trans. Mob. Comput. 2013, 13, 1787–1800. [Google Scholar] [CrossRef]
- Pita, R.; Utrilla, R.; Rodriguez-Zurrunero, R.; Araujo, A. Experimental Evaluation of an RSSI-Based Localization Algorithm on IoT End-Devices. Sensors 2019, 19, 3931. [Google Scholar] [CrossRef] [PubMed]
- Oukrich, N.; Cherraqi, E.B.; Maach, A. Human Daily Activity Recognition Using Neural Networks and Ontology-Based Activity Representation. In Proceedings of the Micro-Electronics and Telecommunication Engineering, Ghaziabad, India, 30–31 August 2019; pp. 622–633. [Google Scholar]
- Sukor, A.S.A.; Zakaria, A.; Rahim, N.A. Activity recognition using accelerometer sensor and machine learning classifiers. In Proceedings of the 2018 IEEE 14th International Colloquium on Signal Processing & Its Applications (CSPA), Penang, Malaysia, 9–10 March 2018; pp. 233–238. [Google Scholar] [CrossRef]
- Wang, J.; Chen, Y.; Hao, S.; Peng, X.; Hu, L. Deep learning for sensor-based activity recognition: A survey. Pattern Recognit. Lett. 2019, 119, 3–11. [Google Scholar] [CrossRef]
- Murad, A.; Pyun, J.-Y. Deep Recurrent Neural Networks for Human Activity Recognition. Sensors 2017, 17, 2556. [Google Scholar] [CrossRef] [PubMed]
- Charles, B. MySQL for the Internet of Things, 2nd ed.; Springer, Apress: New York, NY, USA, 2016. [Google Scholar]
- Van Kasteren, T.L.M.; Englebienne, G.; Kröse, B.J.A. Human Activity Recognition from Wireless Sensor Network Data: Benchmark and Software; Atlantis Press: Paris, France, 2011; Volume 4, pp. 165–186. [Google Scholar]


© 2020 by the authors. Licensee MDPI, Basel, Switzerland. This article is an open access article distributed under the terms and conditions of the Creative Commons Attribution (CC BY) license (http://creativecommons.org/licenses/by/4.0/).