Abstract
Due to the increased awareness of issues ranging from green initiatives, sustainability, and occupant well-being, buildings are becoming smarter, but with smart requirements come increasing complexity and monitoring, ultimately carried out by humans. Building heating ventilation and air-conditioning (HVAC) units are one of the major units that consume large percentages of a building’s energy, for example through their involvement in space heating and cooling, the greatest energy consumption in buildings. By monitoring such components effectively, the entire energy demand in buildings can be substantially decreased. Due to the complex nature of building management systems (BMS), many simultaneous anomalous behaviour warnings are not manageable in a timely manner; thus, many energy related problems are left unmanaged, which causes unnecessary energy wastage and deteriorates equipment’s lifespan. This study proposes a machine learning based multi-level automatic fault detection system (MLe-AFD) focusing on remote HVAC fan coil unit (FCU) behaviour analysis. The proposed method employs sequential two-stage clustering to identify the abnormal behaviour of FCU. The model’s performance is validated by implementing well-known statistical measures and further cross-validated via expert building engineering knowledge. The method was experimented on a commercial building based in central London, U.K., as a case study and allows remotely identifying three types of FCU faults appropriately and informing building management staff proactively when they occur; this way, the energy expenditure can be further optimized.
1. Introduction
With the increasing demands for smart building infrastructure and plant maintenance, automatic fault detection has gained attention in both academic and industrial fields []. There is a growing importance placed on the development and execution of smart grids and smart buildings in order to meet electricity demands and building material sustainability in an efficient and cost-effective manner whilst minimizing CO2 emissions, which account for around three-quarters of total greenhouse gas emissions []. Commercial buildings are responsible worldwide for approximately 41% of primary energy consumption including in the United States, Europe, and Asia; however, experts anticipate that will rise over the next 20 years []. Improved demand and control strategies require incorporation into the existing infrastructure to sustain the collective electricity demand of commercial buildings. One of the feasible and well-accepted moves is to extract the information from historic electricity consumption data of different units and identify the causes that widely effect the demand/supply scale. This efficient functioning of such systems is expected to improve the economy and deliver sustainable solutions for energy production in smart buildings [,]. A significant amount of energy is misused by malfunctioning or poorly maintained building units, and often, building operators are unaware that units are malfunctioning and wasting energy. A building’s energy consumption is a complex system that is comprised of several elements such as heating the ventilation and air-conditioning (HVAC) unit, lighting, elevation, security, etc. Figure 1 shows a pie chart that depicts the different areas that are responsible for extensive energy consumption within a building. It has been found that the HVAC consumes approximately 41% of the building’s total energy consumption, whereas lighting is the second highest energy consumption unit, which expends around 29% of the total energy. Subsequently, water heating, office equipment, and others consume 9%, 13%, and 8%, respectively, of the building’s total energy []. Faults related to HVAC systems represent between 1% and 2.5% of total commercial building consumption []. Multi-agent based systems depend on the specific areas of the buildings such as demand response and human behaviour, and they have a great effect on energy optimisation []. Typical building performance monitoring and fault identification are performed by building experts, which is a slow process and leaves many problems undetected or worse, ignored. The efficient integration of automatic and remote fault detection methodologies able to detect faults immediately when they occur would be a game changer. Furthermore, communicating the fault to the owner or maintenance personnel with an agreed simple language describing the fault, if it is severe enough, is highly desirable. This system pipeline would eliminate the scheduled maintenance costs, reduce diagnostic labour, reduce wasted energy, reduce peak electricity demand, and minimize downtime.
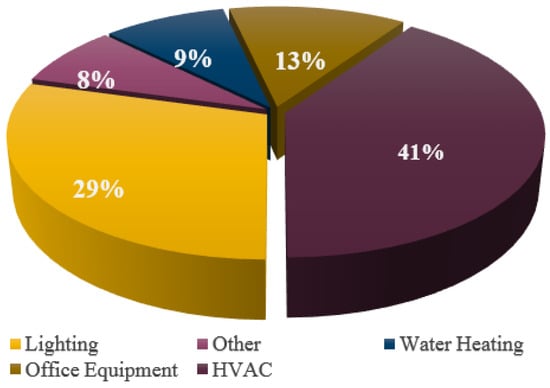
Figure 1.
Energy consumption status by different HVAC units.
The paper is outlined as follows; Section 2 presents the literature review on published HVAC fault detection methods. Section 2.5 overviews the structural details of fan coil unit (FCU) units and their associated faults. Section 3 illustrates the proposed technical framework and methodology that have been developed to deal with real building problems. The outcomes of the proposed method are then detailed in Section 4. Finally, the conclusions and impact of this study are discussed in Section 5.
2. Literature Review
Automatic fault detection and diagnosis methodologies for HVAC systems have evolved with notable advancements implementing data mining and machine learning (ML) techniques. However, practical limitations, such as the scalability and complexity of HVAC systems, have made fault detection extremely challenging since the beginning of dynamic research and exploration in 1980s [,]. Fault detection and diagnosis (FDD) research is classified into quantitative models, process history, and rule based groups, as shown in Figure 2. This proposed FDD study focuses on employing machine learning techniques to improve building performance, which is a part of process history based FDD, which is categorised into two further groups: knowledge based and data-driven based []. Knowledge based methods require vast amounts of prior information to process the data, whereas the data-driven model precludes the need of any prior information, but discovers this information buried within the data themselves. In this study, data-driven based automatic fault detection (AFD) is performed on historic FCU datasets (highlighted within the red box shown in Figure 2) where the prior label information of the FCU data is unavailable. The relevant literature of both groups is discussed in the following sections.
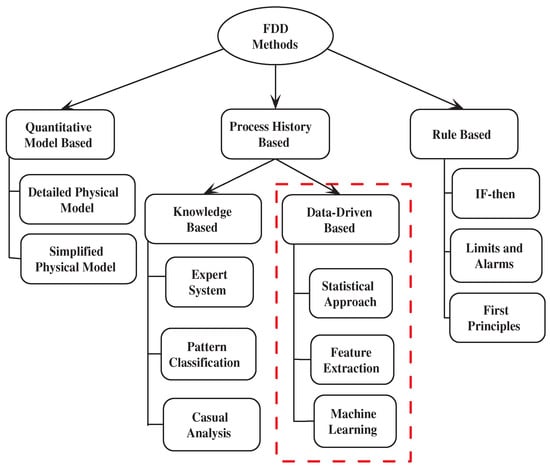
Figure 2.
Classification scheme for fault detection and diagnosis (FDD) methods for HVAC units.
2.1. Knowledge Based Methods
Zhao et al. reviewed artificial intelligence (AI) based fault detection and diagnosis (FDD) systems of building energy systems (BES) and published work [] describing FDD trends between the years 1998 and 2018. The authors detailed the benefit and pitfalls of the existing AI based FDD methods and highlighted possible future research directions in the field. The review classified FDD into two categories, i.e., data-driven and knowledge-driven FDDs. Data-driven FDDs mainly rely on the available training data as they are abundant and include supervised, unsupervised, and regression based learning practices, but problems arise in terms of reliability and robustness. Knowledge based methods influence the diagnostic process employing human expert’s knowledge or expertise to support the decision making. However, in the era of automation, engineers and maintenance staff are required to handle these huge tasks, which require both human expertise and derived knowledge to supervise an AI based algorithm (i.e., supervised ML). An adaptive Gaussian mixture model (AGMM) approach applying the time-varying probabilistic ML model for non-linear systems was proposed by Karami et al. []. An unscented Kalman filter (UKF) was integrated with Gaussian mixture model regression for adjusting the model parameters with the help of the feedback of residuals between observation and model prediction, which was limited only to chiller fault identification. An automatic fault detection technique assembling rapid centroid estimation (ERCE) was proposed to select illustrative features automatically that were unique in nature to the faults of the HVAC system and was able to address different types of air-handling unit (AHU) faults in commercial buildings []. Recently, Ranade et al. proposed a fault diagnosis scheme for FCUs by applying a grey-box model. The work followed a systematic procedure to obtain a simplified model of a heat exchanger coil using polynomial regression to generate residuals. The method showed that the residuals from this model facilitated fault diagnosis by adopting certain rules [].
2.2. Data-Driven Based Methods
The two-stage data-driven FDD strategy has been modelled with linear discriminant analysis (LDA) followed by a multi-class classification procedure. The LDA reduces the dimension of the in-hand data and clustered faults using the predefined Manhattan distance range to detect and diagnose chiller faults. The clustered information is further used to make the fault identification decision solving a multi-class classification problem. The method as experimented on ASHRAE Research Project 1043 (RP-1043) data for identifying seven types of chiller faults []. Gao et al. proposed an association rule based approach for six different types of air-handling units’ (AHU) behaviour, analysing time series data, which were instrumented in several buildings of the United States of America. Here, twelve performance and assessment rules (APAR) were inferred for rule based FDD application in AHU, and 75% accuracy was obtained for new or unseen data []. A hybrid multi-label classification algorithm assembling clustering and generalized linear mixed model (GLMM) was proposed by the researchers. Here, clustering grouped the available data and reduced the computational complexity of manual labelling, whereas the GLMM figured out the dependency of a subject with multiple labels in the training data. The results indicated its suitability to the large number of labelled information []. A laboratory generated air-water heat pump data, and their series of features was analysed with different ML approaches. The fault detection results showed that the method performed well with the laboratory generated training dataset, but failed with the real-world dataset []. Austin et al. presented a model to estimate air-side capacity based on specific parameters such as airflow rate, cooling capacity, system efficiency, and refrigerant mass flow of air-handling systems. The sensitivity was compared with other existing models. Additionally, the model was able to evaluate the uncertainty of input parameters and their sensor requirements. However, the model was limited to commercial air-handling units only []. A machine learning based anomaly detection and irregular building energy consumption tracking framework was proposed by Xu and Chen. Here, the recurrent neural network (RNN) was executed to identify the faulty interval and its energy consumption, and the outcomes were evaluated by the quantile regression range. The framework was only applied to three different residential houses. This was an unsupervised framework where no prior knowledge was required to detect anomalous behaviours, and building managers benefited by assessing the level of anomalies and spot opportunities in energy conservation []. Lee et al. proposed a real-time deep learning (DL) supported fault diagnostic model for AHUs. Initially, the EnergyPlus simulation software was employed to establish different types of fault references for DL implementation and behaviour learning. The successful execution of this method showed improvement in the diagnostic process with 95.16% accuracy, but it was not tested on real data, due to which the reliability of the model was lacking []. Zhao et al. fused wavelet transformation (WT) followed by principle component analysis (PCA) to discover behavioural knowledge and diagnose the HVAC AHU []. Beghi et al. encountered the high-dimensional data space problem of buildings and performed a dimensionality reduction technique that mapped the data to the lower space of interest. The reduced building data were fed into hybrid model to have an efficient FDD solution for large buildings. However, the work demonstrated that in practice, the FDD technique was more appropriate for fault detection rather than fault diagnosis []. Magoules et al. developed an artificial neural network (ANN) utilising recursive deterministic perceptron (RDP) to implement FDD for an entire building level. Remarkably, this new FDD prototype detected and ranked the faulty equipment according to the fault risk []. A recent prototype was developed by Shang and You exercising stochastic model predictive control (SMPC) that provided promising solutions to the complex control problems under uncertain disturbances. The SMPC approach actively learned the uncertainty from the data-driven pipeline involving the ML framework []. A similar type of energy optimisation pipeline was implemented by Sonta et al. along with learning the occupant’s behaviour in buildings to improve energy efficiency [].
2.3. Problem Statement
The literature of building management and its energy handling demonstrate that researchers have devoted great effort to identifying and developing proficient methods to resolve the real challenges in buildings to optimise their behavioural performance and save the energy wastage, mostly at the component level via smart building systems. However, many problems are left undetected/unresolved due to the large amount of data and the complex nature of building management systems (BMSs). The BMS produces vast amounts of data at every minute time interval, most of which have not been analysed and understood due to the lack of building experts, increasing overhead costs, as well as time complexity. Thus, the employability of data mining and ML methods is attracting attention for BMS data analysis, but it is a complex pathway to discover effective methods due to the fact that learning and knowledge discovery methods are comprehensively data dependent, where each type of data represents a specific behaviour. This makes the field highly interesting and vast for more focused research. Pivotally, although the being most numerous units used in buildings, the fan coil unit (FCU) has not been explored compared to other major units such as AHU, chillers, and boilers.
2.4. Contribution
The authors focused on this this small, but influential fan coil unit (FCU)unit and created a method that could be adopted for different buildings and equipment. The proposed work was performed on a real building based in London, U.K., as a case study. An FCU is a specific sub-unit of an HVAC system and the main unit of interest for this investigative research work. A machine learning based multi-level automatic fault detection (MLe-AFD) framework was proposed and developed for FCU fault identification and performance analysis. The study emphasized the successful utilization of machine learning provided by two-stage learning in the presented multi-level framework. This proposed model allowed utilising the unstructured and unlabelled building data in such a way that they fit with this model in the experiment stage. The results of this study showed the ability of the presented work to improve the fault identification while having a limited amount of information about the FCU behaviour.
2.5. Overview of FCU and Associated Faults
An FCU is a ceiling-mounted unit commonly found inside rooms, corridors, and open space areas and controlled by local thermostats. It is comprised of a heating coil, a cooling coil, and a fan or damper. The return air recirculates internal air or fresh air along with recirculated air and releases fresh air to the room depending on the thermostat. An outer structure and the schematic of FCU are shown in Figure 3. Commonly, the central chiller and boiler plant distributes cold water to all the cooling coils and hot water to all the heating coils. If the environment becomes too warm, the local thermostat senses the rise of temperature and signals the chilled water valve to flow cold water through the cooling coil, then cool air being blown by the fan. If the room temperature becomes too cold (depending on the local setpoint or the user preferred temperature setting), the heating coil starts working in similar way and blows the hot air until the room temperature reaches the anticipated level or setpoint.
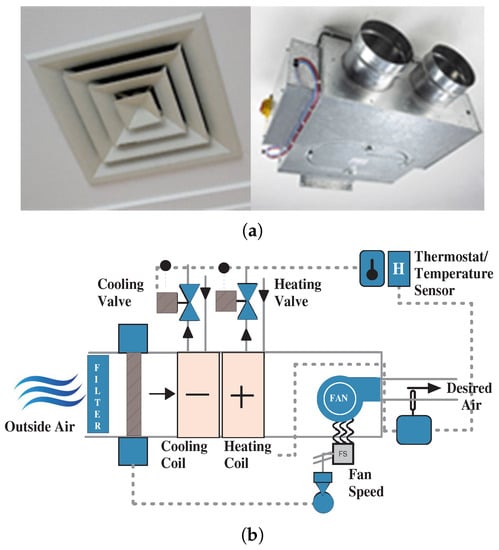
Figure 3.
(a) Inner and outer structure of an fan coil unit (FCU). (b) Schematic of an FCU.
Due to dirty plenums, filters, and coils, the resistance increases, lowering the air volume, causing inappropriate cooling or heating. There are several problems related to air distribution that create performance issues. Thus, three types of FCU performance issues: (a) saturation, (b) on-ness, and (c) hunting were investigated in the proposed work. These three malfunctioning behaviours were thoroughly examined and learned by ML methods for fault detection that aimed at a fast maintenance response. Figure 4 visually illustrates the three types of faults and shows the raw control temperature and related power demands during different types of faults. Each subfigure is divided into two parts: the upper part denotes the control temperature variation in degrees centigrade, and the lower part displays the associated power demand in kilowatts. Here, the pink and blue dotted lines in the control temperature graphs denote the heating and cooling setpoints, respectively. Similarly, the blue colour in the power demand represents cooling power, whereas the pink colour represents the heating power. These graphs show the control temperature and corresponding power consumption of a single unit for a whole day, where it is observed that the control temperature could not reach any of the setpoints (heating/cooling) though the power demand was continuously high. Figure 4a shows the “saturation” type of heating (indicated by pink colour) power trends where the temperature was still struggling to reach its setpoint. However, high power consumption was found as the temperature could not achieve the setpoint for that instance, illustrating the occurrence of a fault that needed to be identified and addressed. Figure 4b shows the “on-ness” behaviour in the cooling (indicated by blue colour) power trend. In general, the FCUs are enabled during the daytime from 6:00 am to 6:00 pm to cover the office hours, but in this case, the power consumption was continuously high and saturated even in the non-operational hours due to this defective behaviour. This wasted a significant amount of energy in building operation. Figure 4c shows the third type of fault case here, the heating trends and “hunting” nature of the FCU behaviour revealed in terms of power and temperature, while the unit was on even after the operational hours. These three faults of FCU behaviour were addressed and analysed here using the proposed multi-level clustering (MLC) to learn and identify the fault patterns automatically. The data were collected every 10 min with the control temperature, heating power, cooling power, setpoint, deadband, and enable signal information from the FCUs of the case study building.
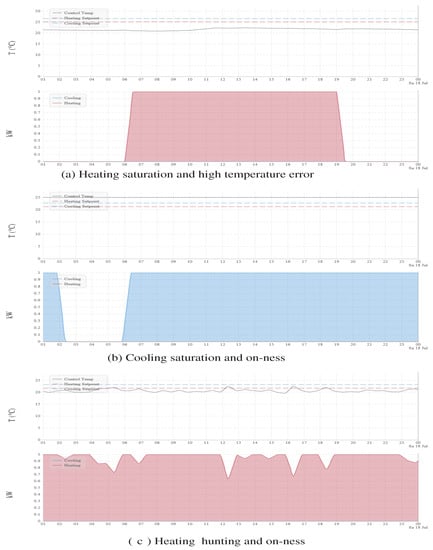
Figure 4.
The control temperature and associated power behaviour of three types of FCU faults on a specific day.
3. Proposed Multi-Level Automatic Fault Detection
The multi-level automatic fault detection (MLe-AFD) model was proposed by performing three stages, feature extraction from the raw FCU data, first-level clustering to separate faulty and non-faulty data, and second-level clustering to identify different types of faults. The performance of the proposed work was evaluated in each clustering level using statistical validation. It notified the building engineer about the faults and their types automatically so they could proactively perform guided maintenance. The flowchart of the proposed method is shown in Figure 5 and described in the following sections.
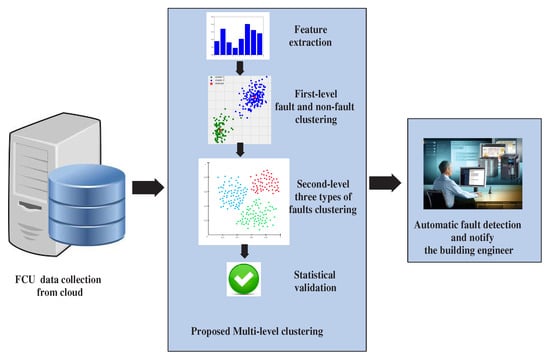
Figure 5.
A framework of the proposed system architecture of this experiment.
3.1. Data Collection Process
The data were gathered through the data acquisition device (DAD) installed in the building, which acted as a gateway to connect an existing/resident BMS to a secure Internet service by the Demand Logic (DL) team (London). The data gathering process was completed within 24 to 48 hours and created a virtual asset model (VAM) of all the equipment installed in that BMS network, considering each data point as BMS data.
The BMS data were extracted through a single embedded PC Engine 2D13 ALIX connected through a mobile network router. The embedded PC contained embedded software that was used to: (i) obtain a map of the BEMS network. This included all the BEMS Internet works and consisted of multiple local area networks, devices on a LAN (a single device may relate to one or many service equipment), and data points on a device. These could be binary or analogue control signals, feedback signals, or settings. The text label and numerical ID were obtained for each of the LAN, devices, and data points, (ii) pulling the data points (typically at 10 min intervals), (iii) storing/buffering the data if the Internet connection is lost, and (iv) securely sending the data to the cloud servers.
3.2. Feature Extraction
An “intelligent” feature extraction method was proposed and applied by the authors [,] to deal with the high-dimensional data and project them into the reduced data dimension. The feature extraction process generated informative and non-redundant information facilitating subsequent learning and improved the performance of the entire framework. This feature extraction method was performed on the six FCU parameters: control temperature, setpoint, deadband, heating power, cooling power, and enable signal. These FCU data were collected at every 10 min interval from the time series data on a daily basis via a secured gateway. The proposed feature extraction method was employed to discover different events: event start, respond delay, goal achieved, and event end based on the temperature and power flow during a day (24 h). The area () under the temperature and power curve () at each time interval () was calculated event-wise. This area under the curve calculation was carried out for both heating (H) and cooling (C) actions. There were six different features measured from each of the heating and cooling events employing the event area calculation as shown in Equations (1) and (2),
where represents heating and represents cooling features, n is the number of occurrences of each event type (heating or cooling) in a day, and k is the number of features generated by measuring the area of each event (). The feature extraction method transformed and represented heating-cooling events of a whole day by the twelve-dimensional () feature vector. In a day, there were () = 144 data points collected for each FCU parameter at 10 min intervals. Six different parameters were considered for each FCU. Thus, altogether, () = 864 data points existed for each FCU, subsequently converted into 12 meaningful features employing the cooling and heating operation information. These feature vectors were further considered for clustering to detect and identify the faults automatically.
3.3. Multi-Level Clustering
The faulty and non-faulty behaviour ground truths of the FCUs were unavailable to the authors during this investigation; thus, the unsupervised learning approach, i.e., clustering, was incorporated here to discover the FCU behavioural patterns without any prior knowledge. The clustering algorithm categorised the similar types of FCU behaviours into the same cluster based on the dissimilarity found in the feature space. Thus, the MLe-AFD was implemented in two stages. The first level clustering was performed to separate faulty and non-faulty FCU patterns (obtaining two clusters), and the obtained clusters were thoroughly analysed to understand each group. The second level clustering was applied to a faulty cluster to identify further faulty groups (three groups obtained). Three well-known clustering algorithms were implemented for multi-level application: k-means [,,], average linkage hierarchical clustering [], and Gaussian mixture model (GMM) clustering [], depending on the data characteristics.
The objective function of k-means is defined in Equation (3), where is the Euclidean distance between the data point and the cluster centre . The distance between the n number of data points from their respective cluster centres was defined as ‘’ for each cluster. Each data point was assigned to the group that had the nearby centroid. After all the data points were assigned, the positions of the k centroids were recalculated. The steps were re-iterated until the centroids no longer moved.
Hierarchical clustering created a grading of clusters in the FCU dataset measured by linkage criteria between the sets or the groups of observations. It was the function to measure the pairwise distances between the observations in each set. The objective function for average linkage hierarchical clustering is defined in Equation (4), where a and b are the objects that belong to the sets A and B.
The GMM followed the soft clustering technique for assigning the FCU behaviour data points to the Gaussian distributions. The GMM decided k number of clusters calculating the mean (), covariance (), and density of the distribution (). The working principle of GMM does not rely on the shape of the distribution and is shown in Equation (5),
The compactness of clustering outcomes was evaluated in each level measuring the statistical metrics to be confident about the inter-cluster separation and intra-cluster coherence.
3.4. Validation
Three standard clustering validation techniques were implemented; gap [], silhouette indexing (SI) [], and Davies–Bouldin (DB) [], to analyse and compare the performance. These measures were performance indicators used where the class labels (or, ground truths) were not available. These performance indicators determined the degree of intra-cluster cohesion and inter-cluster separation. Each of these methods had its own numerical range to illustrate the compactness of the clusters where loosely coupled clusters required further investigation. The gap approach is expressed in Equation (6) as,
where denotes expectation under the sample size of n from the distribution, considered as uniform data points with k centres, and the gap statistic measures the deviation of the observed value from its expected value under the null hypothesis. k is the optimal cluster number where the gap measure is maximised. The silhouette indexing (SI) is defined in Equation (7),
where is the average distance from the ith point to the other points in the same cluster and is the minimum average distance from the ith point to the points in different clusters. The silhouette value ranges from to . A high value indicates that i is well matched to its own cluster. The clustering solution is considered appropriate if most points have a high silhouette value. The Davies–Bouldin (DB) measure is denoted in Equation (8),
where is the cluster’s distance ratio for the ith and jth data points to the other cluster. The and are the average distances between each point in the cluster from the centroid of that ith cluster and the average distance between each point in the jth cluster and the centroid of the jth cluster. The value ranges from to , and a low DB value indicates the clustering solution to be appropriate.
3.5. Hypothesis Test: Two-Sample t-Test
A hypothesis test was performed to confirm the relationships of the FCU behavioural clusters. Two FCU groups were tested at a time; thus, a two-sample t-test was performed here. Here, the null hypothesis () indicated that the two FCU clusters came from independent random samples from a normal distribution using the two-sample t-test, and the alternative hypothesis () was the opposite. was accepted or rejected at the 5% significance level ( = 0.05) [,].
4. Experimental Result Analysis
The proposed MLe-AFD was examined on a real case study building. The details of the case study building and outcomes are discussed in the following section.
4.1. Case Study Description
The case study building was based in London, built in 1960, and renovated in 2009. It covered 149,000 sq. ft. for offices and 8000 sq. ft. for retail space. The building had seventeen (17) floors with seven hundred and thirty-one (731) FCUs distributed across the different floors. A total of 723 FCUs was operating out of a total of 731. The proposed MLe-AFD was experimented on using building data gathered since 2015 and continued to 2020. Thus, seven-hundred twenty-three FCUs for each day and 3615 FCUs for one week were monitored with thorough analysis performed to understand the behavioural patterns of faulty and non-faulty FCUs of the building, which could be useful for future fault anticipation.
These data were then accessed in the University lab for research purposes. The experiment was carried out using MATLAB R2019b tool on an Intel(R) Core(TM) i5 processor @ 3.30 GHz running the Windows 7 Enterprise 64-bit operating system with a 7856-MB NVIDIA Graphics Processing Unit (GPU).
4.2. Feature Correlation
The correlation between the features obtained from the proposed feature extraction method was analysed here by calculating the Pearson correlation coefficient (PCC) []. Pearson’s correlation coefficient is known as the best test statistical method for measuring the association and relationship between two continuous variables of interest and is based on the covariance. The coefficient values range between −1 and +1, where +1 defines a perfect correlation between the FCU features. The first six features were related to the heating trends, and the next six features were related to the cooling trends. Additionally, each FCU feature represented the control temperature and power behaviour events [,]. The heating features had a negative correlation with the cooling features, which represented an inverse relationship. It is found from the colour map in Figure 6 that feature variables were perfectly correlated with their own pair and moderately correlated with paired variables where the value ranged from −0.0003234 to +1.
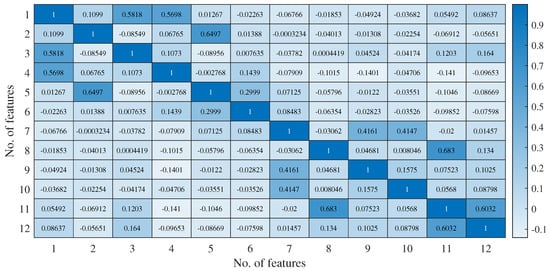
Figure 6.
Colour map for feature correlation of the 12D FCU feature vectors.
4.3. Clustering Results
The proposed MLe-AFD was performed in two stages using three different methods and the results compared to identify the best fitted clusters with the case study the FCU dataset. The first-level clustering was performed on each day using the 12D feature vector for all of one day and one week FCUs’ data and clustering them into two groups, faulty and non-faulty. Three different clustering algorithms were performed here to find these two groups. The results were verified using two methods, (i) by applying statistical metrics (describe in Section 3.2) and (ii) through analysis by building engineers where they confirmed the identified faulty and non-faulty FCU patterns (described in Section 3.2). The number of faulty and non-faulty FCUs found from each clustering model are shown in Table 1, which displays the numbers in each category obtained from the models. The non-faulty groups obtained from all three clustering techniques contained more FCUs than the faulty groups. The outcomes indicated that most of the FCUs were working properly, which was confirmed later by the building engineers.

Table 1.
The number of faulty and non-faulty data points accumulated into each cluster after employing first-level clustering.
Now, these two clusters obtained from each model were validated through the internal evaluation schemes, and the results are displayed in Table 2. The validation schemes assessed how well the clustering was performed using the quantities and features inherited from the FCU dataset. In the case of the gap algorithm, it found the optimal number of clusters first, which might provide a best fit for the FCU data in hand and a maximal gap metric score to indicate the clustering performance. The number of FCU behaviours were known to the authors from the building engineers, i.e., two and three groups respectively in the first- and second-level clustering. The first two groups (faulty and non-faulty) were common; however, the three types of faults at the next level were informed by engineers collaborating on this research, and this information was particularly supportive of the optimal number of clusters. It was found from the k-means clustering that there were 598 non-faulty and 125 faulty FCUs, where the gap criterion achieved 1.10 and expressed the very good compactness of the faulty and non-faulty FCU clusters. The SI measure score of 0.9649, which was very near +1, also defined decent clustering outcomes and 0.2582 from k-means. The DB scored 0.2582, where the metrics close to zero indicated promising outputs from k-means. There were 592 FCUs found in the non-faulty cluster and 131 FCUs on the faulty cluster. Here, the gap index scores were found to be the same as those of k-means, but a smaller SI score was achieved than the k-means and Gaussian mixture clustering. Furthermore, the obtained DB index was 0.1595, which was moderately low and indicated good linkage clustering performance. In the case of GMM clustering, five-hundred ninety-six and 127 FCUs were identified in the non-faulty and faulty groups, respectively, and all the considered indexes indicated a decent clustering outcome. Similarly, the experiment was tested on a week’s worth of data that was comprised of 3616 FCUs altogether. Table 1 displays how many of these week-long FCUs were assigned into two groups by the chosen algorithms. It can be observed that a greater number of data that were grouped together belonged to the non-faulty behavioural group. Furthermore, in Table 2, the internal validation results from the three measures were incorporated to investigate the compactness of these clustering algorithms, and it was found that all three methods achieved optimal scores based on their evaluation criteria.

Table 2.
The validation score obtained from different methods in the first-level clustering.
Figure 7 shows the bar plot to compare all the first-level clustering performances for daily and weekly FCUs. In the daily data, it was found that GMM performed better than the other two clustering methods in the first-level clustering to identify faulty and non-faulty FCUs. All the methods achieved good performance criteria in the weekly data analysis. However, the linkage and GMM clustering achieved the same score in the Silhouette and Davies–Bouldin indexing calculations. Our partner building engineers verified the clustering outcomes. Subsequently, the faulty FCU groups were further clustered using the corresponding algorithms to categorise different types of faults in the second-level clustering.
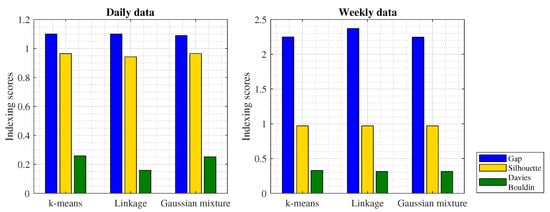
Figure 7.
Bar plot for the first-level clustering validation comparison.
The second-level clustering was performed only on the faulty FCU groups, i.e., 125 FCU patterns for k-means clustering, 131 FCU patterns for linkage, and 127 FCU patterns for GMM clustering were considered at this stage for the day FCU experiment. Subsequently, four-hundred thirty, 425, and 438 FCU patterns were found for second-level clustering using k-means, linkage, GMM clustering, respectively, in week data investigation. As the building engineers informed previously that there were three types of faults, hunting, saturation, and on-ness noted in FCU behaviour, the clustering aimed to break each faulty cluster into three more groups. The allocation of FCUs into each fault type is tabulated in Table 3 with the corresponding clustering algorithm. These clusters were also further verified through the expert building engineers to understand and map their categories into the obtained faults. The faults included in Table 3 are denoted as Fault 1 for hunting, Fault 2 for saturation, and Fault 3 for on-ness patterns. Like the first level, this second-level clustering was also validated statistically and through engineers to check the compactness and system performance and tabulated in Table 4.

Table 3.
The number of FCU data accumulated from each clustering to perform second-level clustering.

Table 4.
The validation score obtained from different methods in second-level clustering.
It was found from daily data analysis employing k-means that 35, 24, and 66 FCUs were identified as displaying hunting, saturation, and on-ness, respectively. Linkage demonstrated that 37, 25, and 69 FCUs were grouped as displaying hunting, saturation, and on-ness, respectively. GMM identified that 38, 27, and 62 FCUs displayed hunting, saturation, and on-ness, respectively. Similarly, it was observed from the weekly data analysis that k-means separated 175, 47, and 208 FCUs into three distinct faulty behaviours, whereas linkage grouped 174, 46, and 205 FCUs into the different clusters, and 177, 51, and 207 FCUs were separated by the GMM algorithm. The validation scores are summarized in Table 4. The k-means and linkage clustering models achieved identical scores for the gap criterion, whereas linkage and GMM achieved better scores than k-means for both SI and DB indexing for daily analysis. In the case of weekly analysis, k-means achieved different performance scores for all the validation methods, whereas linkage and GMM achieved similar scores for silhouette and Davies–Bouldin. All these implemented methods achieved good performance scores for all the internal validation criteria, which was acceptable and considered as good clustering for these FCU behaviour analyses.
Figure 8 shows the bar plot comparison of the internal validation scores obtained from all three clustering methods for day and week FCU data analysis. It was realised from second-level cluster analysis that GMM provided optimal performance for FCU automatic fault detection over the other two algorithms tested. Henceforth, the proposed MLe-AFD employing GMM was considered to be capable of detecting distinct FCU fault patterns automatically and without any prior information.
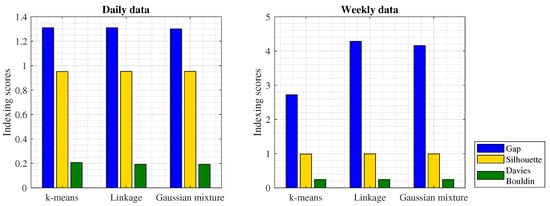
Figure 8.
Bar plot for second-level clustering validation comparison.
4.4. Hypothesis Test
A hypothesis test was performed to find the relationship between different types of FCU populations that were separated through clustering, and this test gave precise criteria for rejecting or accepting the null hypothesis, i.e., the obtained results within a significance level []. The proposed MLe-AFD was employed to detect anomalously behaving FCUs and, pivotally, their types of anomalies without the label information. One day and one week data were initially considered to test the outcomes of the proposed MLe-AFD. Hence, the paired t-test was implemented to discover the correlation between the predicted FCU clusters and to confirm the FCUs belonging to a particular cluster. Table 5 shows the comparison of the p-values obtained by MLe-AFD, where the first two clusters obtained from first-level clustering represent the non-faulty and faulty patterns considering control temperature and corresponding power variation. Another three clusters were obtained from the second-level clustering representing the different faulty FCU patterns. The significance level was considered for the FCU cluster to justify the null hypothesis. The null hypothesis was accepted for a predicted cluster where the p-value was greater than the significance level. From the table below, it is seen from both the daily and weekly data that the first- and second-level clustering obtained a p-value greater than the significance level (). Thus, this depicted that the null hypothesis was accepted, indicating that the proposed MLe-AFD could cluster the data into appropriate distinct patterns.

Table 5.
Hypothesis test obtained for daily and weekly data including the p-value of the first- and second-level clustering populations.
5. Discussions and Conclusions
It was concluded from this study that the multi-level machine learning framework was an effective solution for the automatic detection of FCU fault patterns in commercial buildings. The proposed AFD method was developed to illustrate how predictive machine learning methods could be influential in creating useful smart buildings with inherent and automated fault identification in heating and cooling FCUs as was the case investigated here. This study described the benefits of the proposed approach to identify faults remotely and, importantly, anticipate their behaviour automatically. Although it was realised from the clustering application that all the FCUs were identified as faulty, some may not actually be faults, but a result human interference such as open windows, etc., where the FCU could not cope with sudden changes in temperature. Other natural, but not considered changes also cause “faults”, e.g., when the sun shines in a room creating a temperature level with which the FCU setpoint cannot cope. Again, these are issues that can be identified via the method proposed and can inform managers of these non-fault issues, reducing workloads and informing building design efforts. Creating systems that can identify, predict, and categorise faults and non-faults by costs (determined by the building manger) will be pivotal to building sustainability, occupant well-being, and green efforts. The proposed work obtained statistically acceptable indexing scores.
The proposed method had a significant impact on energy savings, as well. Identification of the faulty units directly affects energy consumption performance of the built environment. This automatic approach will be the first step to reduce building energy wastage. The automatic fault findings would be beneficial for future fault anticipation, ensuring appropriate preventative maintenance strategies. This could significantly reduce the operational energy consumption and cost of the HVAC units.
The proposed MLe-AFD strategy was executed in two stages, the feature extraction method followed by unsupervised learning techniques. The feature extraction considered the temperature, setpoint, and corresponding power for FCU characterisation, where three distinct FCU faults were remotely identified. Further, this investigation was validated through engagement with building engineers to understand the effectiveness of the proposed framework. This method could reduce the manual workload of fault finding and identification and provide the necessary leap towards useful and applied AFD that could assist in predictive maintenance where necessary. Additionally, this method would help building engineers to look at a single FCU unit along with the whole cluster where they could take necessary actions for all the affected units belonging to that cluster without looking into each of them. Thus, the proposed MLe-AFD method optimized the building’s operational workload, identifying abnormally behaving equipment, reducing the large amount of energy loss in smart buildings. The method developed and deployed for this paper was focused on a specific type of HVAC unit (fan coil unit) of a single building, but will be extended to different types of units such as air-handling units (AHU), variable air volume (VAV), chilled beam, etc., for widespread and applied validation.
Author Contributions
M.D. performed the data collection and analysis, proposed and designed the algorithms, and wrote the paper. S.P.R. conducted the experiments, guided the development of the algorithm, and wrote the paper. S.D. supervised this work throughout and initiated the research and the collaborative work on this paper between the teams at Demand Logic Ltd.and London South Bank University. All authors reviewed the manuscript. All authors read and agreed to the published version of the manuscript.
Funding
This work was carried out as a part of the Innovate U.K. funded research project (EP/M506734/1) Energy Management & Analysis Exploiting Existing BEMS Infrastructure & Data, and the authors are grateful to the Demand Logic team for providing us with the BEMS data, verification, invaluable information, and feedback on building services and related performance issues.
Conflicts of Interest
The authors declare no conflict of interest.
References
- Alobaidi, M.H.; Chebana, F.; Meguid, M.A. Robust ensemble learning framework for day-ahead forecasting of household based energy consumption. Appl. Energy 2018, 212, 997–1012. [Google Scholar] [CrossRef]
- Kolokotsa, D. The role of smart grids in the building sector. Energy Build. 2016, 116, 703–708. [Google Scholar] [CrossRef]
- Buildings Energy Data Book. Available online: https://openei.org/doe-opendata/dataset/buildings-energy-data-book/resource/3edf59d2-32be-458b-bd4c-796b3e14bc65 (accessed on 11 June 2015).
- Clastres, C. Smart grids: Another step towards competition, energy security and climate change objectives. Energy Policy 2011, 39, 5399–5408. [Google Scholar] [CrossRef]
- Yu, X.; Cecati, C.; Dillon, T.; Simoes, M.G. The new frontier of smart grids. IEEE Ind. Electron. Mag. 2011, 5, 49–63. [Google Scholar] [CrossRef]
- Zhao, Y.; Li, T.; Zhang, X.; Zhang, C. Artificial intelligence based fault detection and diagnosis methods for building energy systems: Advantages, challenges and the future. Renew. Sustain. Energy Rev. 2019, 109, 85–101. [Google Scholar] [CrossRef]
- Roth, K.W.; Westphalen, D.; Feng, M.Y.; Llana, P.; Quartararo, L. Energy Impact of Commercial Building Controls and Performance Diagnostics: Market Characterization, Energy Impact of Building Faults and Energy Savings Potential; US Department of Energy: Washington, DC, USA, 2005.
- González-Briones, A.; De La Prieta, F.; Mohamad, M.S.; Omatu, S.; Corchado, J.M. Multi-agent systems applications in energy optimization problems: A state-of-the-art review. Energies 2018, 11, 1928. [Google Scholar] [CrossRef]
- Usoro, P.; Schick, I.; Negahdaripour, S. An innovation based methodology for HVAC system fault detection. J. Dyn. Syst. Meas. Control 1985, 107, 284–289. [Google Scholar] [CrossRef]
- Anderson, D.; Graves, L.; Reinert, W.; Kreider, J.; Dow, J.; Wubbena, H. A quasi-real-time expert system for commercial building HVAC diagnostics. ASHRAE Trans. Am. Soc. Heat. Refrig. Air-Cond. Eng. 1989, 95, 890609. [Google Scholar]
- Kim, W.; Katipamula, S. A review of fault detection and diagnostics methods for building systems. Sci. Technol. Built Environ. 2018, 24, 3–21. [Google Scholar] [CrossRef]
- Karami, M.; Wang, L. Fault detection and diagnosis for nonlinear systems: A new adaptive Gaussian mixture modeling approach. Energy Build. 2018, 166, 477–488. [Google Scholar] [CrossRef]
- Guo, Y.; Wall, J.; Li, J.; West, S. Real-time HVAC sensor monitoring and automatic fault detection system. In Sensors for Everyday Life; Springer: Berlin/Heidelberg, Germany, 2017; pp. 39–54. [Google Scholar]
- Ranade, A.; Provan, G.; Mady, A.E.D.; O’Sullivan, D. A computationally efficient method for fault diagnosis of fan coil unit terminals in building Heating Ventilation and Air Conditioning systems. J. Build. Eng. 2020, 27, 100955. [Google Scholar] [CrossRef]
- Li, D.; Hu, G.; Spanos, C.J. A data-driven strategy for detection and diagnosis of building chiller faults using linear discriminant analysis. Energy Build. 2016, 128, 519–529. [Google Scholar] [CrossRef]
- Gao, J.; Bergés, M. A large-scale evaluation of automated metadata inference approaches on sensors from air handling units. Adv. Eng. Inform. 2018, 37, 14–30. [Google Scholar] [CrossRef]
- Lin, S.C.; Chen, C.J.; Lee, T.J. A Multi-Label Classification With Hybrid Label-Based Meta-Learning Method in Internet of Things. IEEE Access 2020, 8, 42261–42269. [Google Scholar] [CrossRef]
- Bode, G.; Thul, S.; Baranski, M.; Müller, D. Real-world application of machine-learning based fault detection trained with experimental data. Energy 2020, 198, 117323. [Google Scholar] [CrossRef]
- Rogers, A.; Guo, F.; Rasmussen, B. Uncertainty analysis and field implementation of a fault detection method for residential HVAC systems. Sci. Technol. Built Environ. 2020, 26, 320–333. [Google Scholar] [CrossRef]
- Xu, C.; Chen, H. A hybrid data mining approach for anomaly detection and evaluation in residential buildings energy data. Energy Build. 2020, 215, 109864. [Google Scholar] [CrossRef]
- Lee, K.P.; Wu, B.H.; Peng, S.L. Deep-learning based fault detection and diagnosis of air-handling units. Build. Environ. 2019, 157, 24–33. [Google Scholar] [CrossRef]
- Zhao, Y.; Wang, S.; Xiao, F. Pattern recognition based chillers fault detection method using support vector data description (SVDD). Appl. Energy 2013, 112, 1041–1048. [Google Scholar] [CrossRef]
- Beghi, A.; Brignoli, R.; Cecchinato, L.; Menegazzo, G.; Rampazzo, M.; Simmini, F. Data-driven fault detection and diagnosis for HVAC water chillers. Control Eng. Pract. 2016, 53, 79–91. [Google Scholar] [CrossRef]
- Magoulès, F.; Zhao, H.X.; Elizondo, D. Development of an RDP neural network for building energy consumption fault detection and diagnosis. Energy Build. 2013, 62, 133–138. [Google Scholar] [CrossRef]
- Shang, C.; You, F. A data-driven robust optimization approach to scenario based stochastic model predictive control. J. Process Control 2019, 75, 24–39. [Google Scholar] [CrossRef]
- Sonta, A.J.; Simmons, P.E.; Jain, R.K. Understanding building occupant activities at scale: An integrated knowledge based and data-driven approach. Adv. Eng. Inform. 2018, 37, 1–13. [Google Scholar] [CrossRef]
- Dey, M.; Gupta, M.; Rana, S.P.; Turkey, M.; Dudley, S. A pid inspired feature extraction method for hvac terminal units. In Proceedings of the 2017 IEEE Conference on Technologies for Sustainability (SusTech), Phoenix, AZ, USA, 12–14 November 2017; pp. 1–5. [Google Scholar]
- Dey, M.; Rana, S.P.; Dudley, S. Smart building creation in large scale HVAC environments through automated fault detection and diagnosis. Future Gener. Comput. Syst. 2018, 108, 950–966. [Google Scholar] [CrossRef]
- Dey, M.; Gupta, M.; Turkey, M.; Dudley, S. Unsupervised learning techniques for HVAC terminal unit behaviour analysis. In Proceedings of the 2017 IEEE SmartWorld, Ubiquitous Intelligence & Computing, Advanced & Trusted Computed, Scalable Computing & Communications, Cloud & Big Data Computing, Internet of People and Smart City Innovation (SmartWorld/SCALCOM/UIC/ATC/CBDCom/IOP/SCI), San Francisco, CA, USA, 4–8 August 2017; pp. 1–7. [Google Scholar]
- Dey, M.; Rana, S.P.; Dudley, S. Semi-Supervised Learning Techniques for Automated Fault Detection and Diagnosis of HVAC Systems. In Proceedings of the 2018 IEEE 30th International Conference on Tools with Artificial Intelligence (ICTAI), Volos, Greece, 5–7 November 2018; pp. 872–877. [Google Scholar]
- Theodoridis, S.; Koutroumbas, K. Pattern Recognition; Elsevier: Amsterdam, The Netherlands, 2003. [Google Scholar]
- McLachlan, G.; Peel, D. Finite Mixture Models; Wiley: Hoboken, NJ, USA, 2000. [Google Scholar]
- Tibshirani, R.; Walther, G.; Hastie, T. Estimating the number of clusters in a data set via the gap statistic. J. R. Stat. Soc. Ser. B Stat. Methodol. 2001, 63, 411–423. [Google Scholar] [CrossRef]
- Rousseeuw, P.J. Silhouettes: A graphical aid to the interpretation and validation of cluster analysis. J. Comput. Appl. Math. 1987, 20, 53–65. [Google Scholar] [CrossRef]
- Davies, D.L.; Bouldin, D.W. A cluster separation measure. IEEE Trans. Pattern Anal. Mach. Intell. 1979, 224–227. [Google Scholar] [CrossRef]
- González-Briones, A.; Prieto, J.; De La Prieta, F.; Herrera-Viedma, E.; Corchado, J.M. Energy optimization using a case based reasoning strategy. Sensors 2018, 18, 865. [Google Scholar] [CrossRef]
- Rana, S.P.; Dey, M.; Siarry, P. Boosting content based image retrieval performance through integration of parametric & nonparametric approaches. J. Vis. Commun. Image Represent. 2019, 58, 205–219. [Google Scholar]
- Press, W.H.; Teukolsky, S.A.; Flannery, B.P.; Vetterling, W.T. Numerical Recipes in Fortran 77: Volume 1, Volume 1 of Fortran Numerical Recipes: The Art of Scientific Computing; Cambridge University Press: Cambridge, UK, 1992. [Google Scholar]
© 2020 by the authors. Licensee MDPI, Basel, Switzerland. This article is an open access article distributed under the terms and conditions of the Creative Commons Attribution (CC BY) license (http://creativecommons.org/licenses/by/4.0/).