Article

Detection and Classification of Hot Spots in Photovoltaic Panels Using Thermal Image Processing Techniques

1
Electrical Engineering Department, Faculty of Engineering, Jordan University of Science and Technology, Irbid 22110, Jordan
2
Communications and Computer Engineering Department, Faculty of Engineering, Jadara University, Irbid 21110, Jordan
*
Author to whom correspondence should be addressed.
Signals 2026, 7(4), 61; https://doi.org/10.3390/signals7040061
Submission received: 24 April 2026 / Revised: 10 June 2026 / Accepted: 17 June 2026 / Published: 1 July 2026

Abstract

Photovoltaic systems have recently attracted significant attention for the free, clean, and sustainable energy they generate. In this work, thermal image processing techniques were developed and utilized to classify hot spots on solar photovoltaic panels. Thermal images were classified into three categories: (a) ideal images, where images do not contain hot spots; (b) images affected by shadow; and (c) images affected by bird drops. The proposed classification was developed using image processing techniques, including histogram analysis, contrast enhancement, and filtering tools. The attained classes are then matched to the decrease in electrical power output. The proposed method was applied to thermal images to detect and classify the target hot spot. Experimental results showed that the estimated error was approximately 6.3% of the total number of images used in the research, with error rates of 6.57% for the shadow hot spot type and 6.67% for the bird drops (mud-like class). Moreover, the accuracy of the proposed method was around 93.7%.

1. Introduction

In light of the prevailing global environmental challenges, such as global warming and the depletion of the ozone layer, coupled with the finite nature of fossil fuel reserves, there has been a recent and significant focus on identifying alternative energy sources. These alternatives are characterized by their cleanliness, sustainability, inexhaustibility, and widespread availability [1]. Globally, demand for renewable energy has surged. For instance, in Spain, renewable sources accounted for 40% of the nation’s electricity needs in 2016. By 2024, this figure had risen to 50.8% [2].
The third most common renewable energy source for electricity generation after hydropower and wind power is solar power, which accounted for 11% of global renewable electricity in 2022. Photovoltaic cells (PV) convert light into electricity using the photovoltaic effect. They are made of semiconductor materials that absorb photons and release electrons. The electrons are then collected by metal contacts, forming an electric current. PV cells are the main components of solar panels, which generate renewable energy from sunlight.
A hot spot is a local thermal overload or poor electrical connection that often appears as localized thermal spots in energized electrical equipment [3,4,5,6]. Hot spotting in PV panels causes severe degradation in output power because mismatched cells generate heat, thereby reducing the PV panel’s output power [4]. Reasons can be either internal (such as soiling points, cracks, etc.) or external (such as shadowing, bird drops, etc.) [5]. An electrical or insulation failure leads to energy dissipation, resulting in localized heat production, commonly referred to as hot spots [6]. Hot spot heating occurs in a module when its operating current exceeds the reduced short-circuit current of a cell or a group of cells. So, hot spots are abnormal conditions of temperature increase or decrease that result in output power below expectations, thereby shortening the panel’s service life and increasing dissipated power, reducing overall system efficiency.
Roughly speaking, most of the failures in devices and elements can be detected using various methods, including optical techniques [7], infrared emission microscopy [8], liquid crystals [9], optical beam-induced current [10], light-induced voltage alteration [11], and atomic force microscopy [12]. Recently, methods based on thermal imaging concepts have been introduced as efficient tools for hot spot detection. Indeed, thermal imaging can detect the temperature differences distributed across the PV panel surface. Thermal imaging is used for detecting faults in the distribution apparatus of the power system [13,14,15].
Despite the revolution in PV systems, thermal imaging techniques are still used as a preliminary step [16]. The studies on thermal imaging for PV are rare, but interest in these topics has been increasing, and related research is also growing, with results improving each time. Many gaps may be encountered at the start of any research or study on thermal imaging techniques with PV systems [17,18].
  • There is a lack of thermal imaging tools for PV systems. There are not enough databases; most thermal images used in previous studies did not include all the types of hot spots mentioned previously.
  • Previous studies have been unable to investigate the types of hot spots and their effects because they could not classify them by type as a primary step before designing appropriate techniques for each class.
  • To our knowledge, no existing study can automatically detect a problem in a PV system or PV module and simultaneously identify or predict its type.
The main objectives of this paper are to
  • Develop proper approaches to detect and localize hot spots using thermal imaging tools and applications.
  • Propose and develop a hot spot classification method to simplify hot spot detection and localization.
  • Attempt to link the achieved image-processing results with the actual electrical output power performance in the presence of various hot spots.
This research helps provide the hot spot detection and classification to facilitate future work on this topic; on the other hand, this research presents an automatic program that classifies the type of hot spot that affects the photovoltaic panel and a program that finds the total power of losses in the PV panel caused by hot spots. The scope of this study is limited to hot spot detection and classification for ideal, shadow, and bird-drop hot spots. Other hot spot mechanisms, such as microcracks, bypass diode failures, and manufacturing defects, were not considered due to the lack of corresponding thermal-image datasets and remain the subject of future investigation.
This paper is organized as follows: Section 2 summarizes related work; Section 3 presents the experimental setup; Section 4 outlines the methodology of the proposed method; and Section 5 illustrates the results. Finally, Section 6 investigates the conclusion, contribution, and future work.

2. Previous Related Works

Infrared images are used in power system plants to identify issues and potential problems in high-voltage power equipment [13]. Thermal imaging was used in power plants to detect failures and hot devices and equipment, thereby protecting transformers from hot spots [6]. Thermal imaging, combined with image processing techniques, is used to detect various types of hot spots, identify shadowing effects, and trigger necessary actions by the control unit [15,16,17].
Several image processing techniques use the thermal image of the PV panel to detect hot spots by converting it to the red–green–blue (RGB) color model. Converting it to a greyscale level revealed the hot spot on the PV module, which was then enhanced using filters to remove noise and determine the percentage of hot pixels in the panel, thereby protecting it from failure [18].
In [15], the thermal image is converted to Hue, Saturation, Value (HSV) level to capture the first frame, the hue layer, and apply Canny edge detection to find the boundary of the PV panel, determining the percentage of shadowing based on the number of black pixels in the image.
In [19], authors applied image processing techniques—such as gray histogram curve fitting—to detect hot spots on connector fuses. They employed two techniques: the valley emphasis technique and the thermal thresholding technique; the latter was used to find the pixel that is bigger or smaller than the threshold value in the binary form, then detect hot spots.
Authors in [17] proposed a method in which the foreground and background are separated from the thermal image, the panel edges are found using minimum standard deviation, and hot spots in the foreground frame are detected.
Using a spatial detection image-processing technique [20], PV module surfaces were analyzed to detect dust accumulation based on the percentage of accumulated dust. In [21], the authors used the K-means clustering technique on thermal images to detect hot spots.
In [22], the simple linear iterative clustering SLIC technique was used, which reduced image complexity and detected hot spots on PV. It claims this method is more accurate than others, but lacks information on fault type and power loss. In [23], the quality of thermal images was improved using enhancement, histogram equalization, and segmentation techniques to detect hot spots affecting electrical equipment.
Segmentation techniques were employed to identify hot spots in infrared images, enabling their localization and separating the affected PV panel [24]. The cumulative density function algorithm was employed to identify hot spots that impact PV systems and correlate the results with power losses [25]. Hot spots affecting the PV system were detected using the system’s data-driven analysis, based on a current-voltage curve [26]. Thermal cameras and drones were used to capture and analyze thermal images using red, green, and blue filters to detect faults in photovoltaic systems [27]. A fuzzy interference system (FIS) was employed to identify hot spots affecting the PV system [28].
In [29], a support vector machine (SVM) algorithm was used to identify the faulted thermal images of PV panels. In [30], the classification of PV into hot spot or non-hot spot was investigated using various deep learning methods. The faulty PV panel was automatically detected using thermal, drone, and RGB cameras [31]. Using low-rank decomposition, the PV modules automatically segment thermal images into spotted and non-spotted areas [32]. The hot spot on the PV system was detected using the hue, saturation, and value (HSV) color space [33]. Using artificial intelligence (AI) and the Internet of Things (IoT), the hot spot of PV systems was identified [34,35].
A study conducted by [36] presents a hybrid approach for monitoring PV systems using infrared thermographs. The approach achieves high accuracy and efficiency by subdividing thermographs, extracting hybrid local features, and using unsupervised clustering.

3. The Experimental Setup

In this work, the PV panel used was a Sunmodule Plus SW 270 mono solar panel from Solarworld. In a single panel, there were 60 cells (156 mm × 156 mm) with operating temperatures ranging from −40 °C to 85 °C, and three bypass diodes protected the panel from hot spots. Three hot spot types were considered: ideal, shadow, and bird drops, with cases where coverage included a single cell or the module.
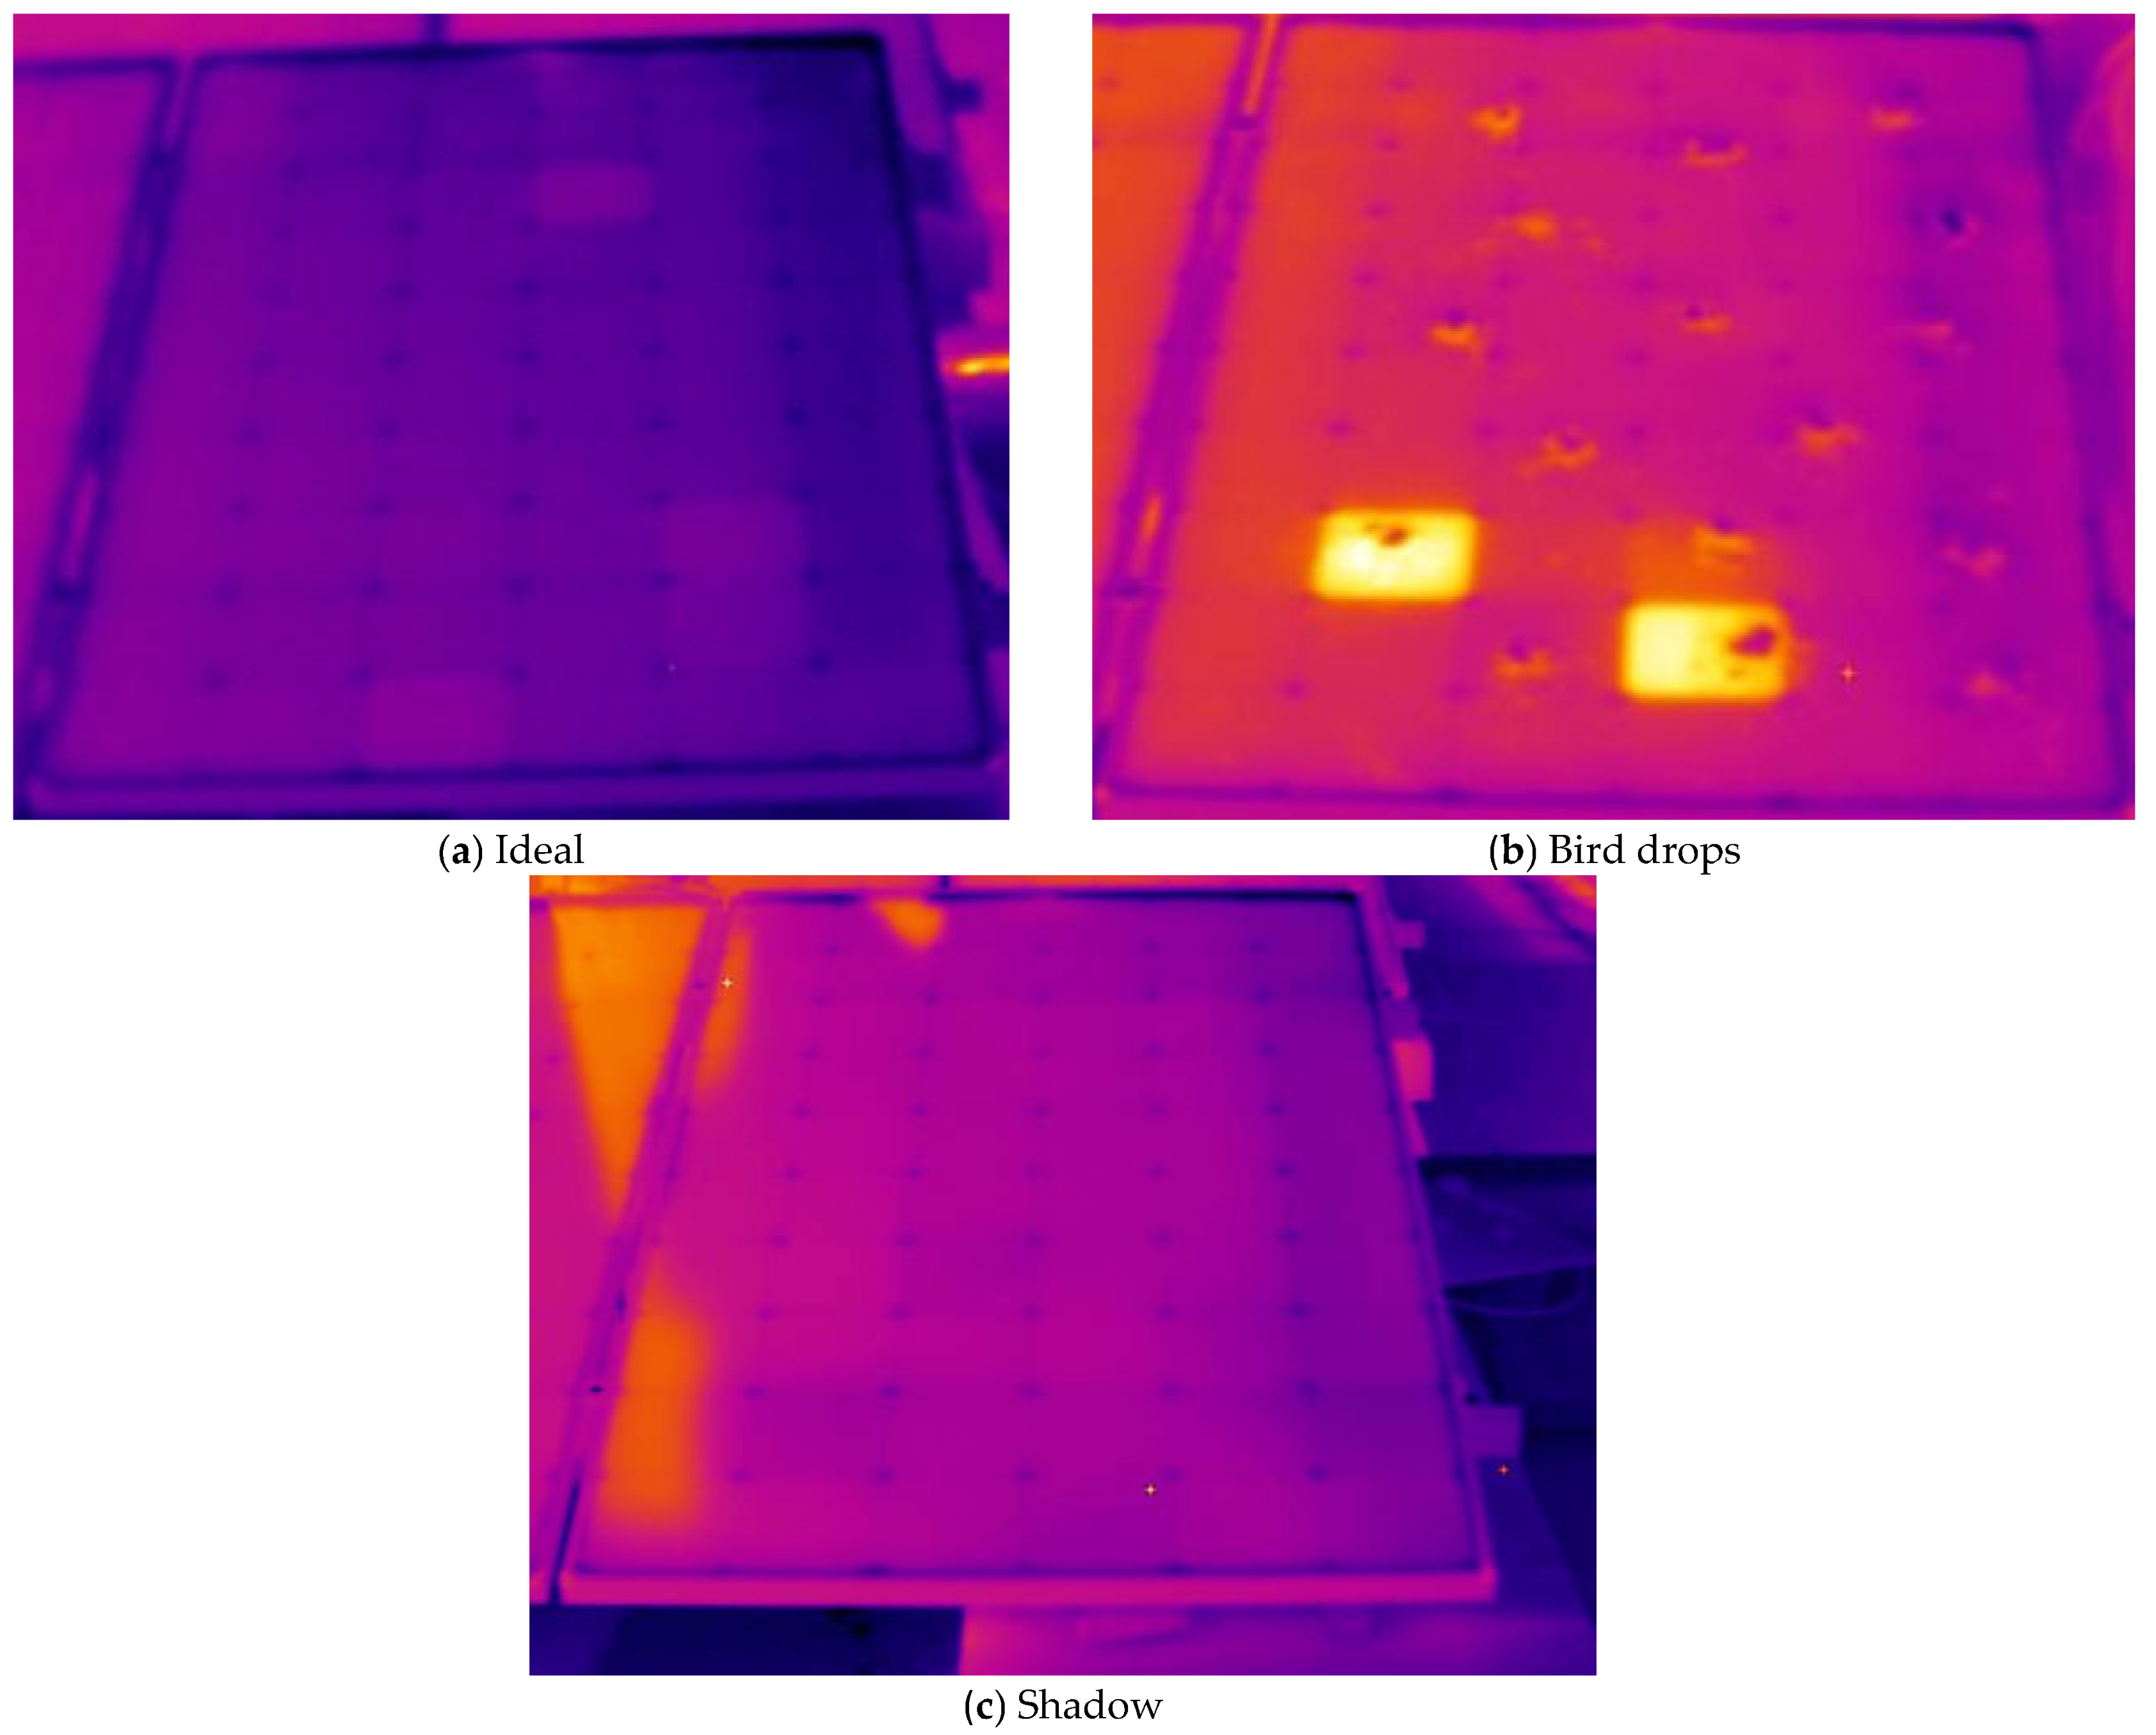
The thermal camera used in this research was the Fluke Thermal Imager Ti32; the temperature range was −20 °C to +600 °C. This thermal camera offers multiple color modes, supports various spaces, and is compatible with a storage card. The imager can be linked to the SmartView program for reviewing images. Figure 1 illustrates cases of thermal images used in this research.
A digital clamp meter (DCM) from GwINSTEK, model GCM-403, was also used; it measures both direct and alternating current and voltage. The FLUKE Ti32 thermal camera, with an emissivity setting of 0.9, was positioned approximately 2 m in front of the PV module. Thermal measurements were conducted in Irbid, northern Jordan, on two separate occasions, in July (summer) and December (winter), around noon under clear-sky conditions. During the summer measurements, the ambient temperature ranged from 35 °C to 37 °C, while the solar irradiance ranged from 900 to 1000 W/m2. During the winter measurements, the ambient temperature ranged from 22 °C to 25 °C, and the solar irradiance ranged from 700 to 750 W/m2. These environmental conditions were recorded to ensure a representative comparison between the two seasons.

4. Methodology

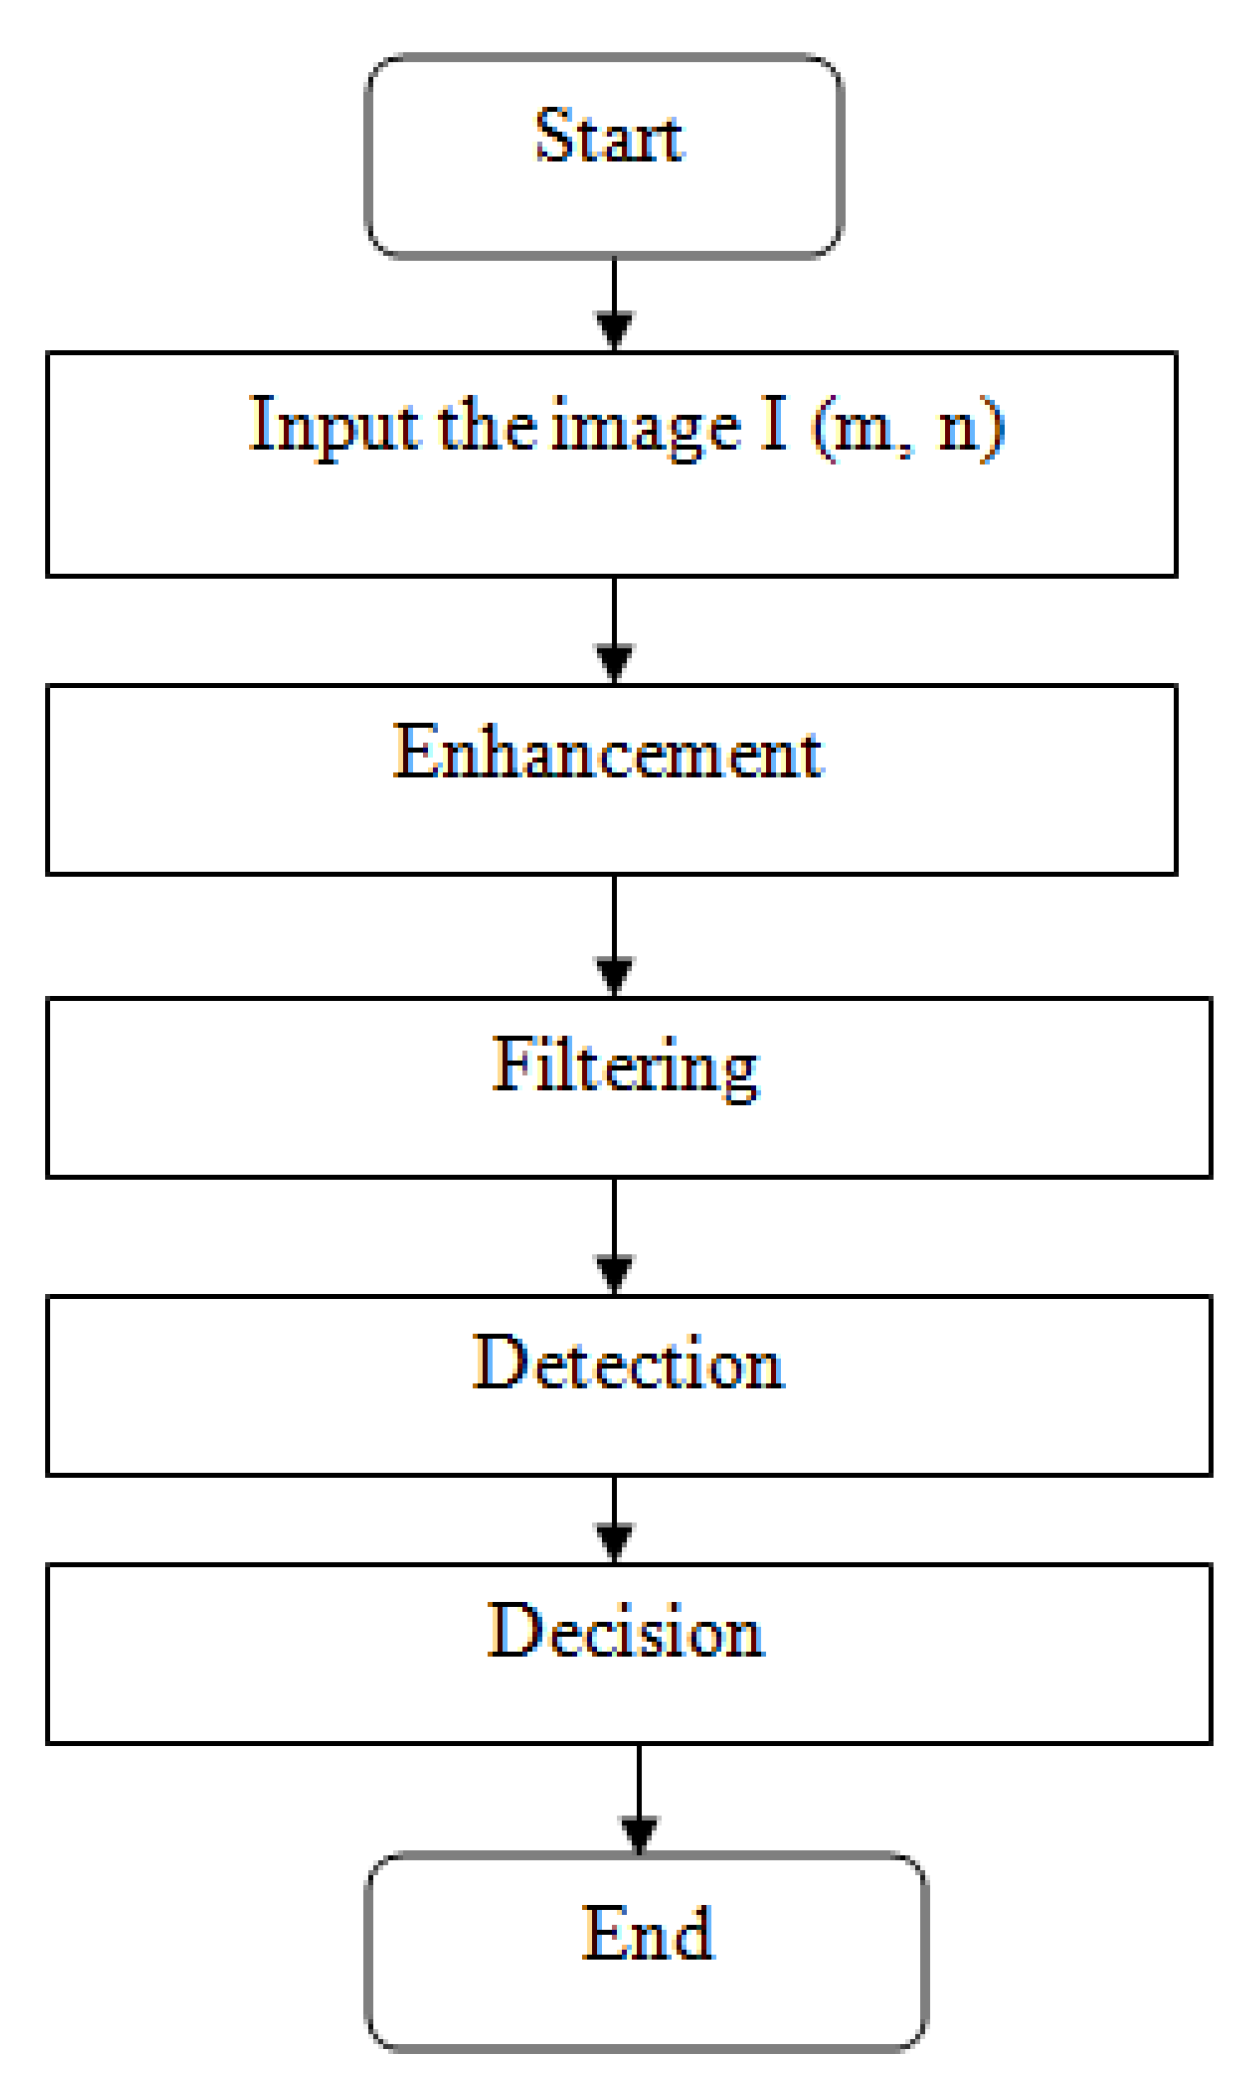
The proposed flowchart method for hot spot detection and classification is depicted in Figure 2. Firstly, the captured thermal image was imported and underwent several steps, including enhancement, filtering, and detection, after which a decision was made.
  • Enhancement Process
Several approaches can be used to enhance the process; we have adopted the contrast stretching technique in this paper. Contrast stretching enhances the clarity of the thermal image by increasing the range of brightness values, allowing a clearer view of more details and features. It also helps reduce the spread of thermal radiation, resulting in a lower-contrast thermal image [24].
  • Filtering Process
The primary purpose of using filters is to highlight essential details in an image while minimizing the impact of other details. Sometimes, filters are used to reduce image noise for several reasons, such as malfunctioning pixel elements in the camera sensor and faulty memory locations. Noise could be due to the channel (channel noise) or due to device failure (like low-quality lenses) [37,38]. In this research, two types of filters were used: the dithering filter and the morphological filter. For detection, the thermal image is segmented into three layers by converting it to the Hue, Saturation, and Value (HSV) model. It was found that the hue layer was more suitable compared to other layers.
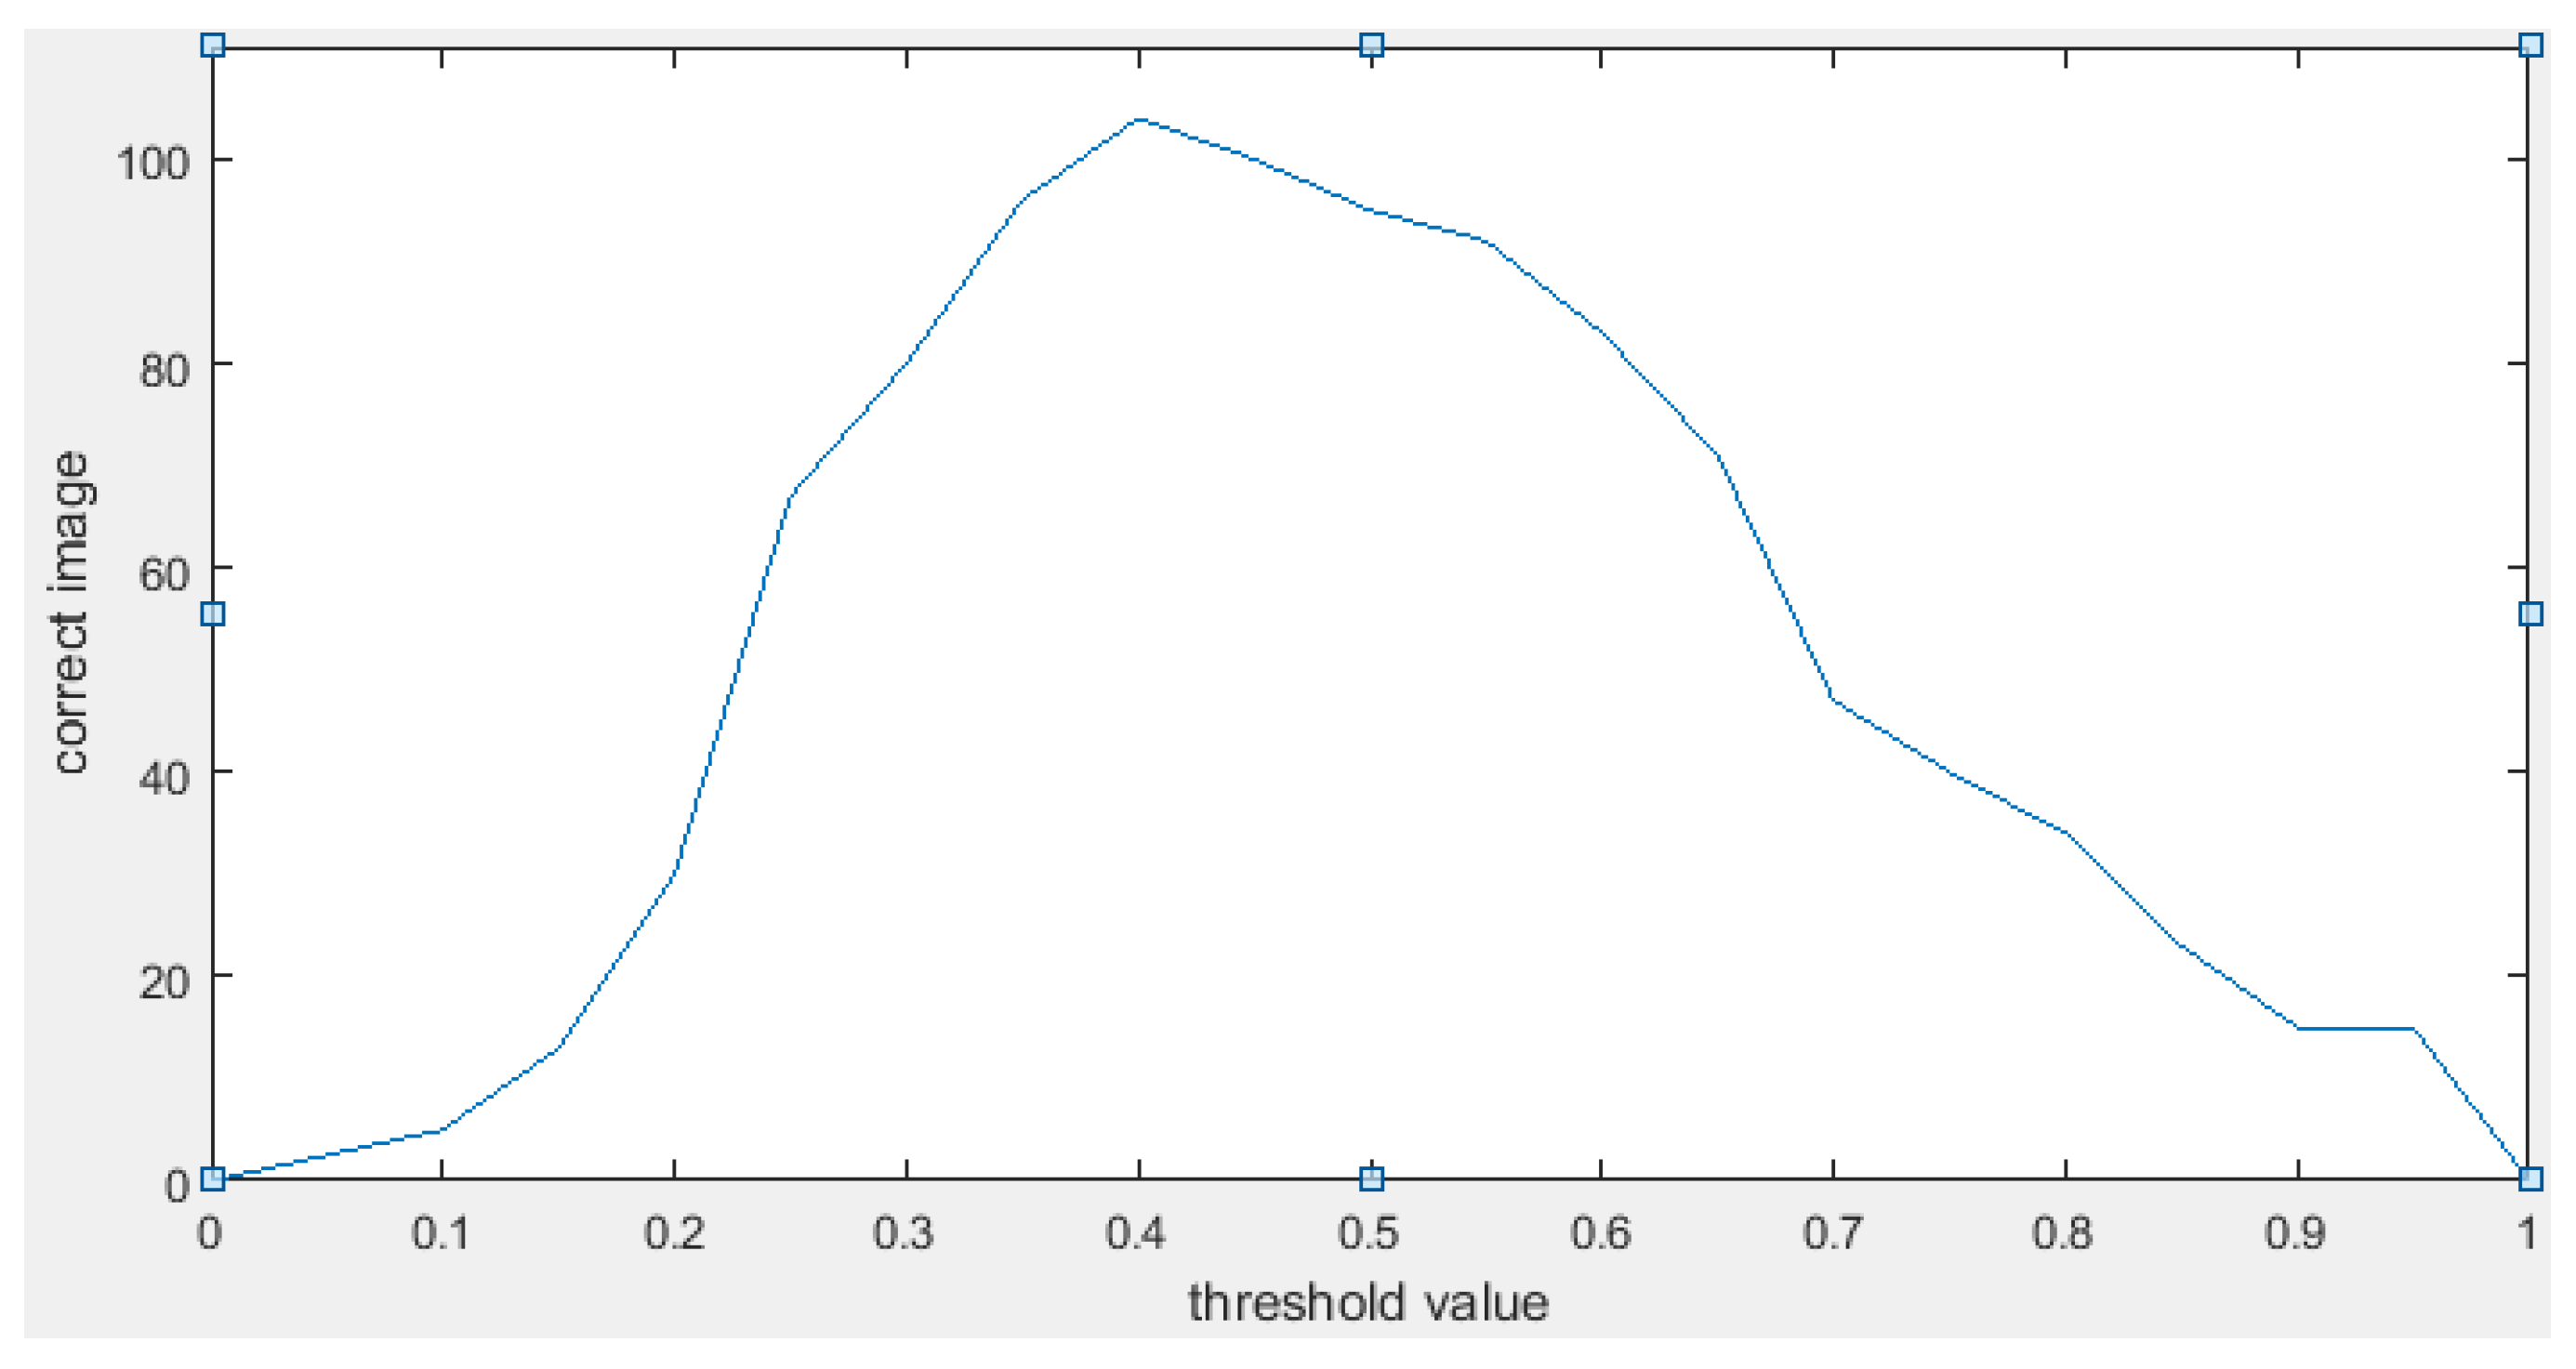
It is challenging to position the thermal camera perpendicular to the panel, as this creates a shadow on the panel; therefore, the image will include parts of the medium and surroundings, which must be removed first, since the camera is fixed and provides full coverage of the module. For each segment, the image is scaled to minimize the surrounding and other parts of the module. The remaining parts of the surrounding area and the module were removed through thresholding using MATLAB 2023b code; the threshold value was determined empirically and set to 0.4.
The threshold value used in this work was determined through a performance-based evaluation process. A range of candidate threshold values between 0 and 1 was examined with an increment of 0.05. For each threshold value, the complete thermal-image dataset of 111 images was processed using the proposed hot spot detection algorithm. The number of correctly classified images was then recorded and used as a performance metric.
Figure 3 illustrates the relationship between the threshold value and the number of correctly detected images. As shown, the detection performance initially increases with the threshold, reaches a maximum near 0.4, and then gradually decreases for higher thresholds.
The highest detection performance was achieved at a threshold of 0.4, where 104 of the 111 tested images were correctly classified. This corresponds to an overall classification accuracy of approximately 93.7% and an error rate of 6.3%. Therefore, a threshold value of 0.4 was selected as the optimal operating point for the proposed algorithm.
It should be noted that the selected threshold was obtained using the thermal-image dataset considered in this study. Consequently, different thermal cameras, image resolutions, environmental conditions, or photovoltaic module types may require recalibration of the threshold value. Future work will investigate adaptive threshold-selection methods to improve the robustness and generalizability of the proposed approach under varying operating conditions.
To determine the most suitable preprocessing filter, three filtering techniques were investigated: median, Gaussian, and dithering filters. As shown in Table 1, the classification accuracy without filtering was 73.0%. Applying the median filter increased the classification accuracy to 76.6%, while the Gaussian filter further improved it to 78.4%. The dithering filter achieved the highest classification accuracy (81.1%), demonstrating superior performance among the evaluated filters. Consequently, the dithering filter was selected for use in this study.
  • Detection and Decision Process
After the filtering step, the image boundary is determined. Detection is performed by identifying whether a hot spot exists in the thermal image by calculating the difference between the ideal and the hot images. At that time, the type of the hot spot is defined.
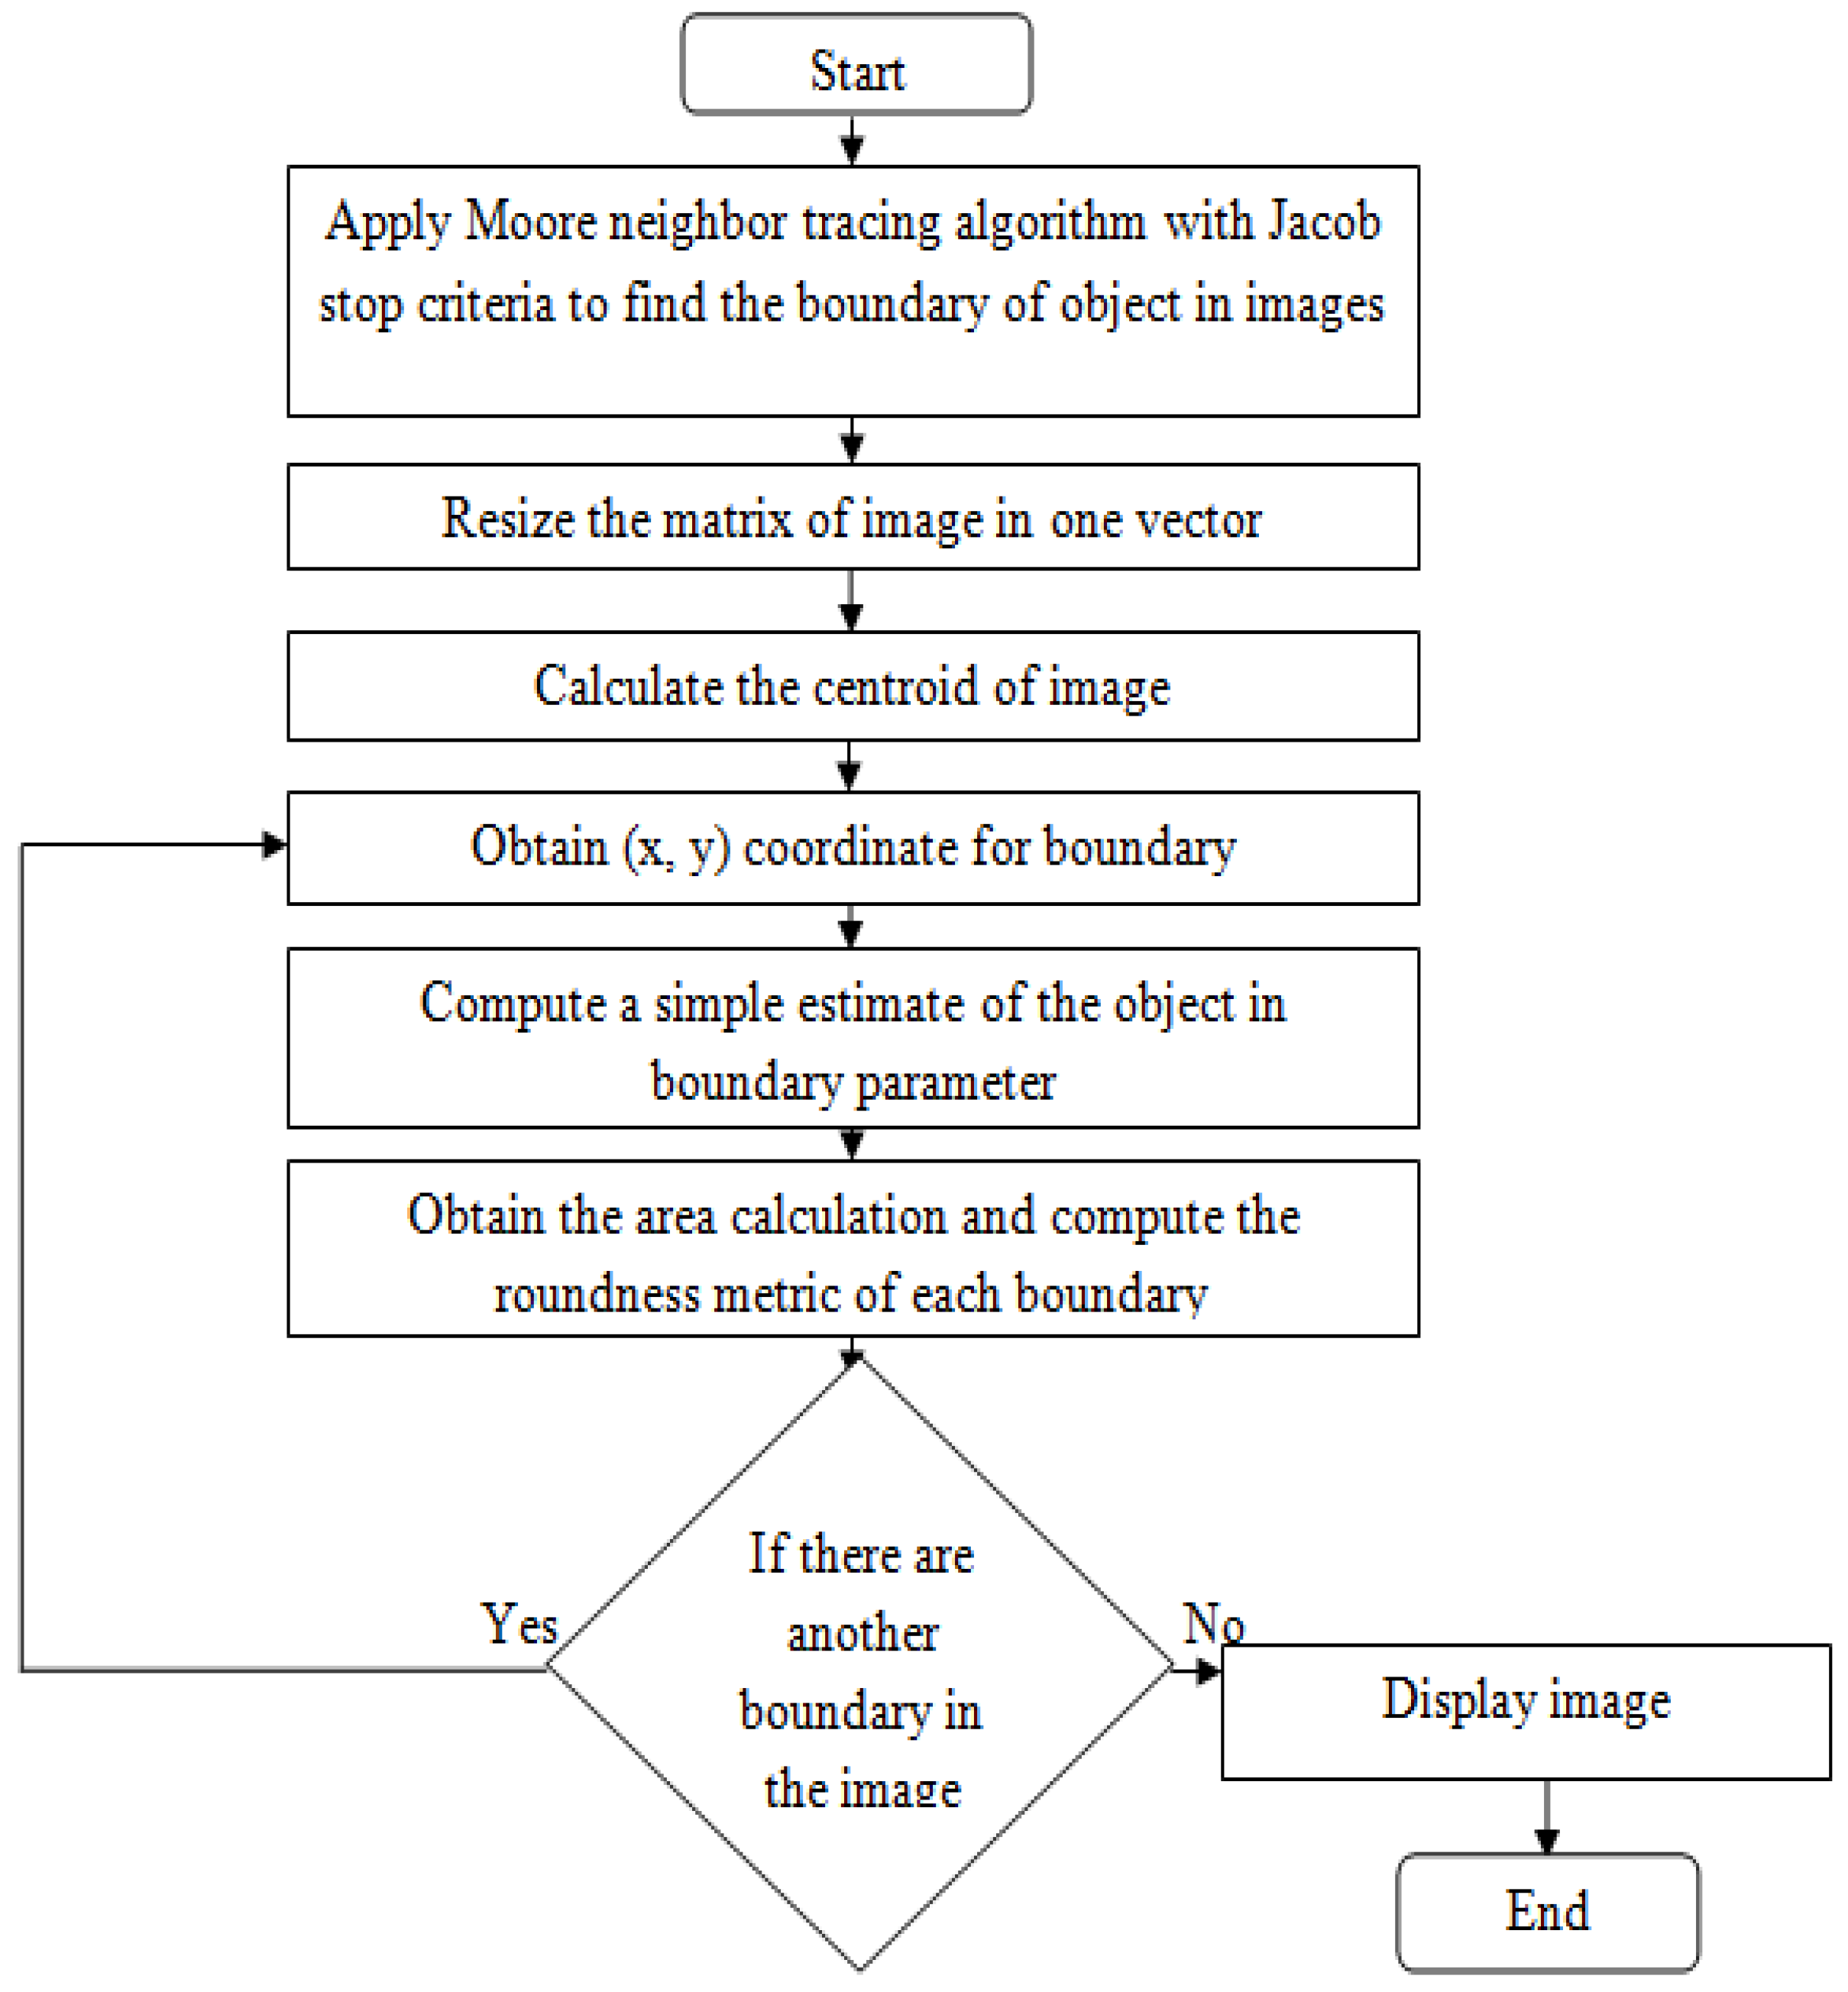
The process of defining the type of hot spot based on the thermal image output was performed using MATLAB code. We defined these regions as Regions of Interest (ROIs); they exhibit abnormal temperature differences relative to their surroundings. The ROI boundaries are estimated using the Moore-neighbor tracing algorithm with Jacob’s stop criteria. Figure 4 illustrates the process of determining the ROI. The flow chart will be analyzed and explained in detail in the following subsections.
Once the ROI boundaries are determined, the type of hot spots is selected based on the ROI’s radius and area. As mentioned earlier, the types of spots that were detected were ideal; others included a bird drop (mud) and a shadow. The entire object in the image was determined and marked with radius and area. A suitable way to distinguish between these objects is to find the distance between them. Here, the Euclidean distance is used to calculate the distance between each detected object, as outlined in the steps shown in Figure 4.
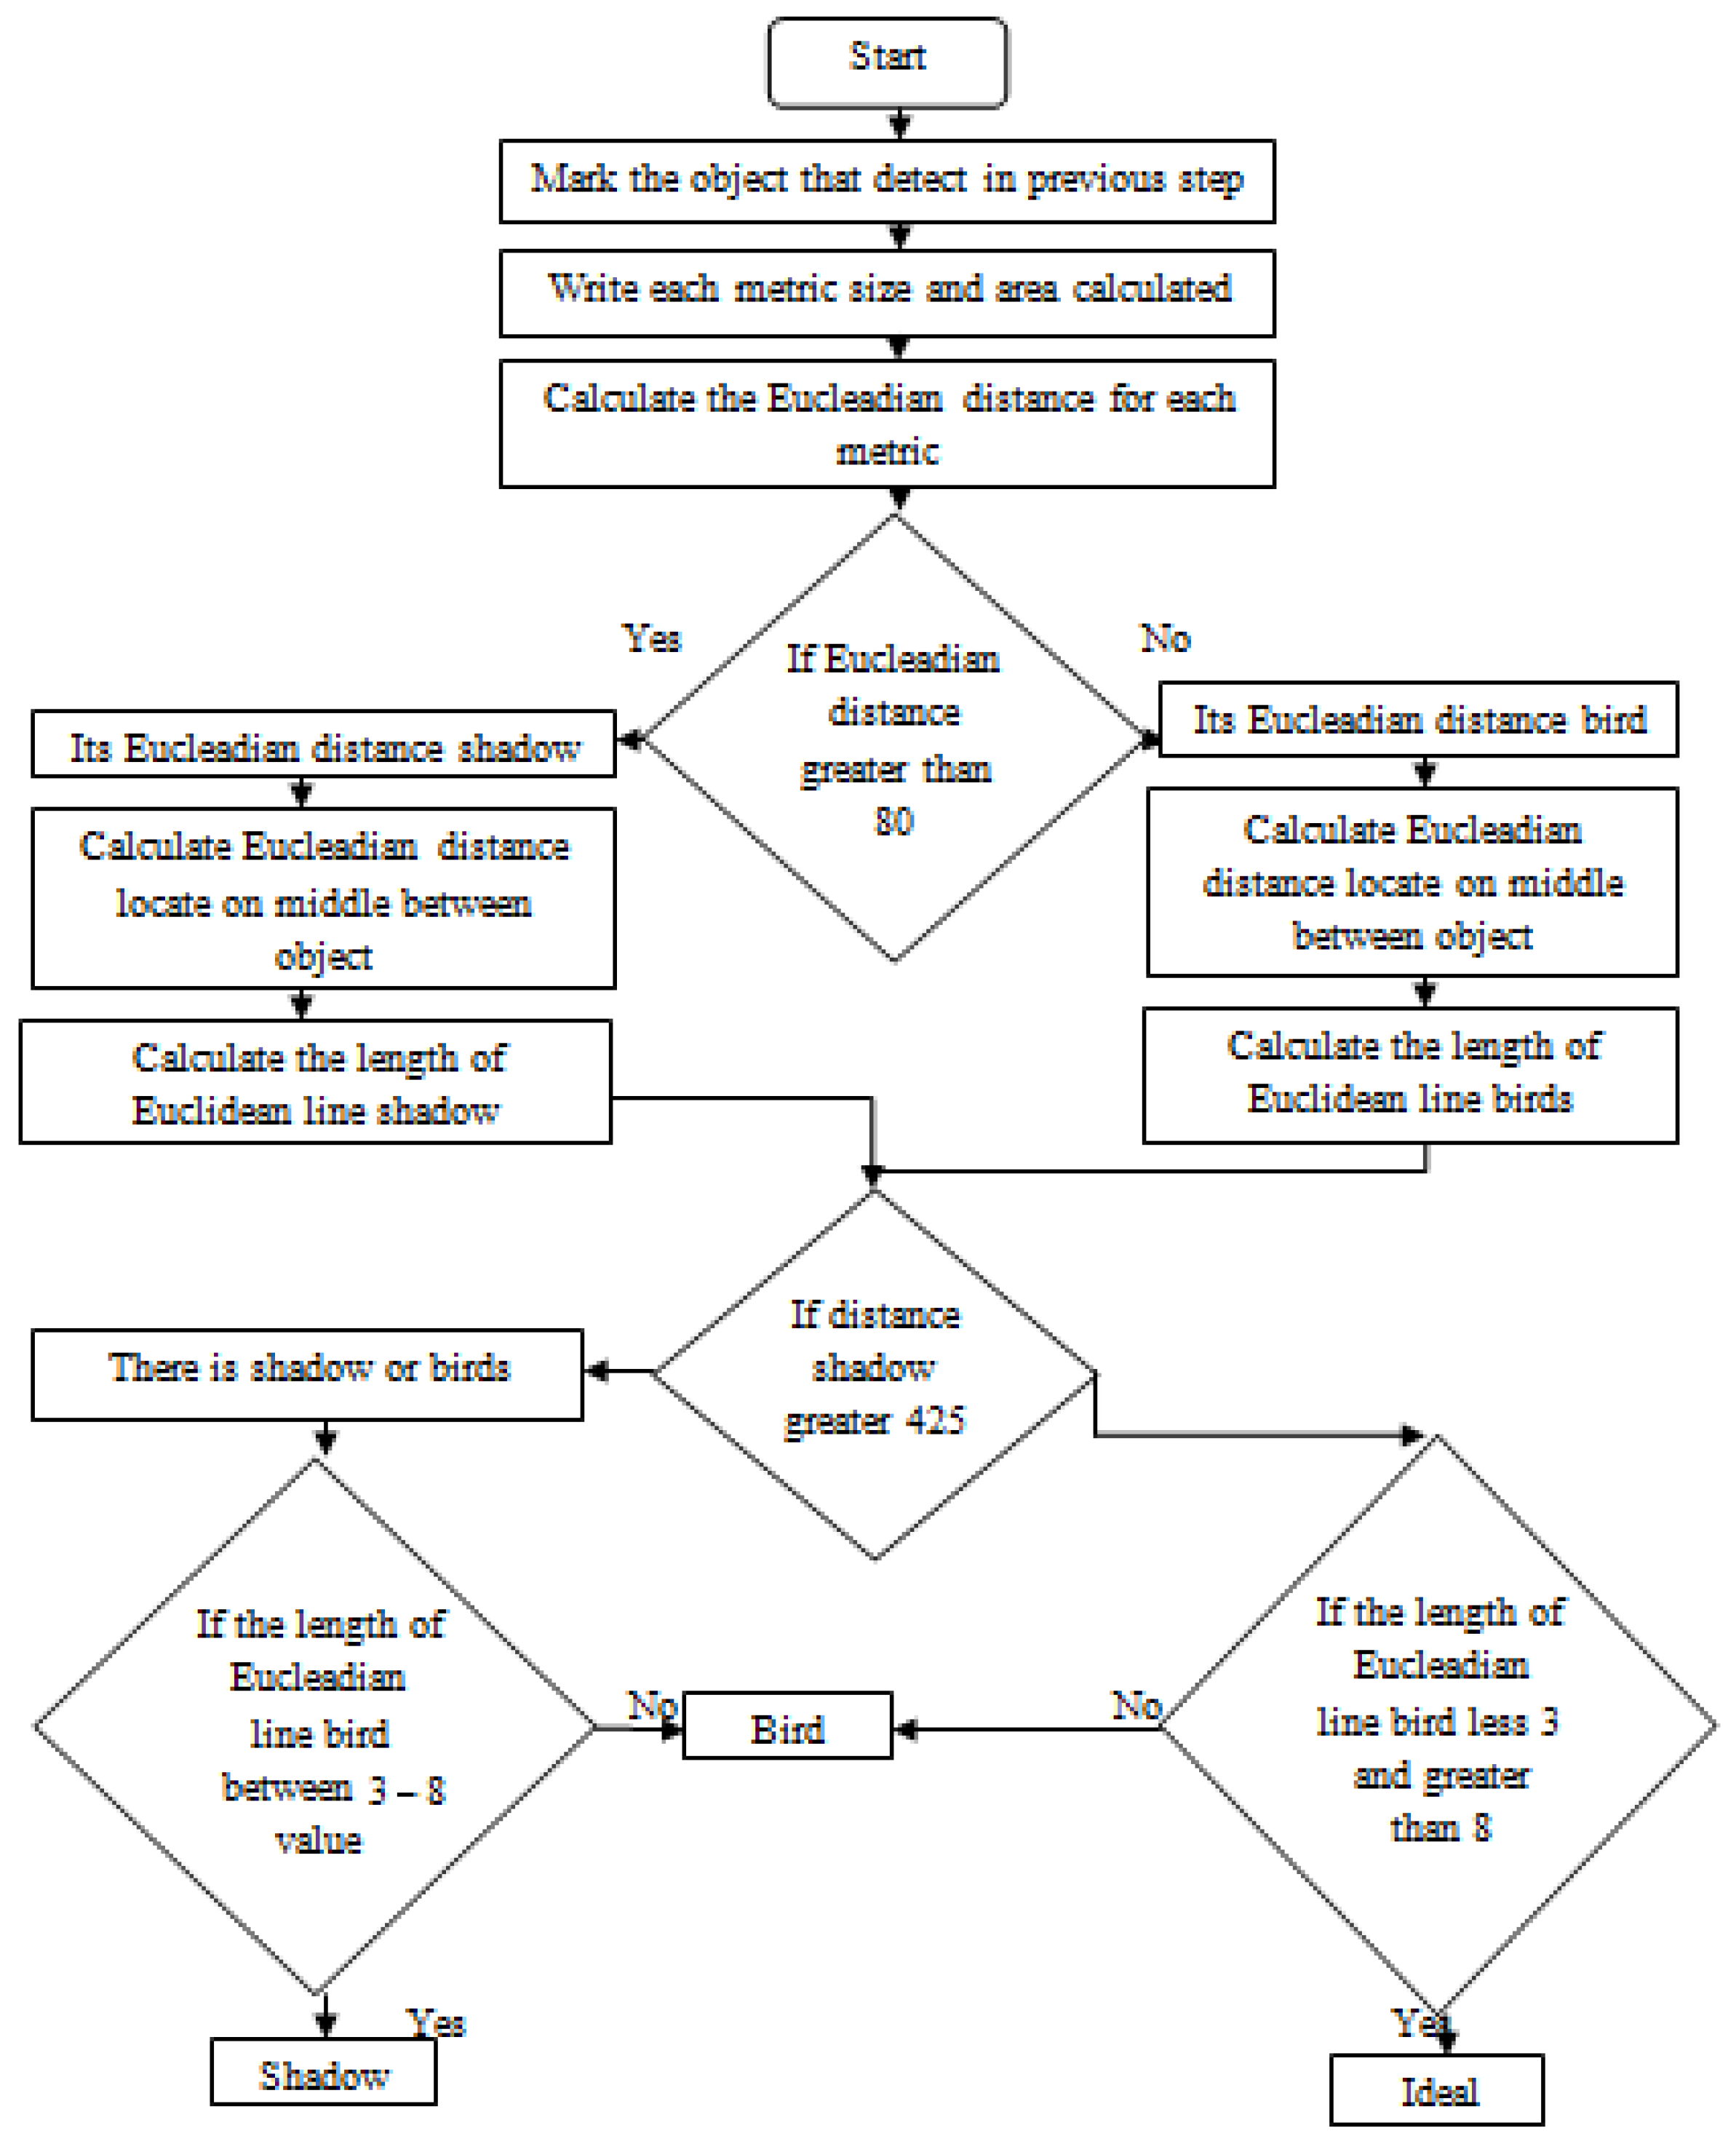
Deciding on the type of hot spot depends on the Euclidean distance of shadow and bird drops, where the Euclidean distance of shadow is named according to the value of Euclidean distance measured in the first stage; if it is greater than 80, then its Euclidean shadow and another value become Euclidean bird drops (mud). Each Euclidean distance should measure the length of the Euclidean line for shadow and bird drops, respectively. Defects are designated as shadows when the shadow Euclidean distance is >425, and the bird dropping distance is within 3–8; all other instances are classified as bird droppings. If the Euclidean distance shadow is greater than 425 and the length of the Euclidean line bird drops less than three and greater than 8, then it is an ideal type; if not, it will be in a bird drop type, as shown in Figure 5.
The threshold values used in the decision stage were determined empirically from the collected thermal-image dataset. Several candidate thresholds were evaluated, and the selected values provided the best separation between shadow and bird-drop classes. These thresholds are therefore dataset-dependent and may require recalibration when different thermal cameras, image resolutions, environmental conditions, or PV module types are used.
The difference determined for two known points is called the Euclidean distance; if p = (p1, p2,…, pn) and q = (q1, q2,…, qn) are two different points indicated in Euclidean n-space, then the Euclidean distance is determined using the form [23,24]
d ( p , q ) = i = 1 n ( q i p i ) 2
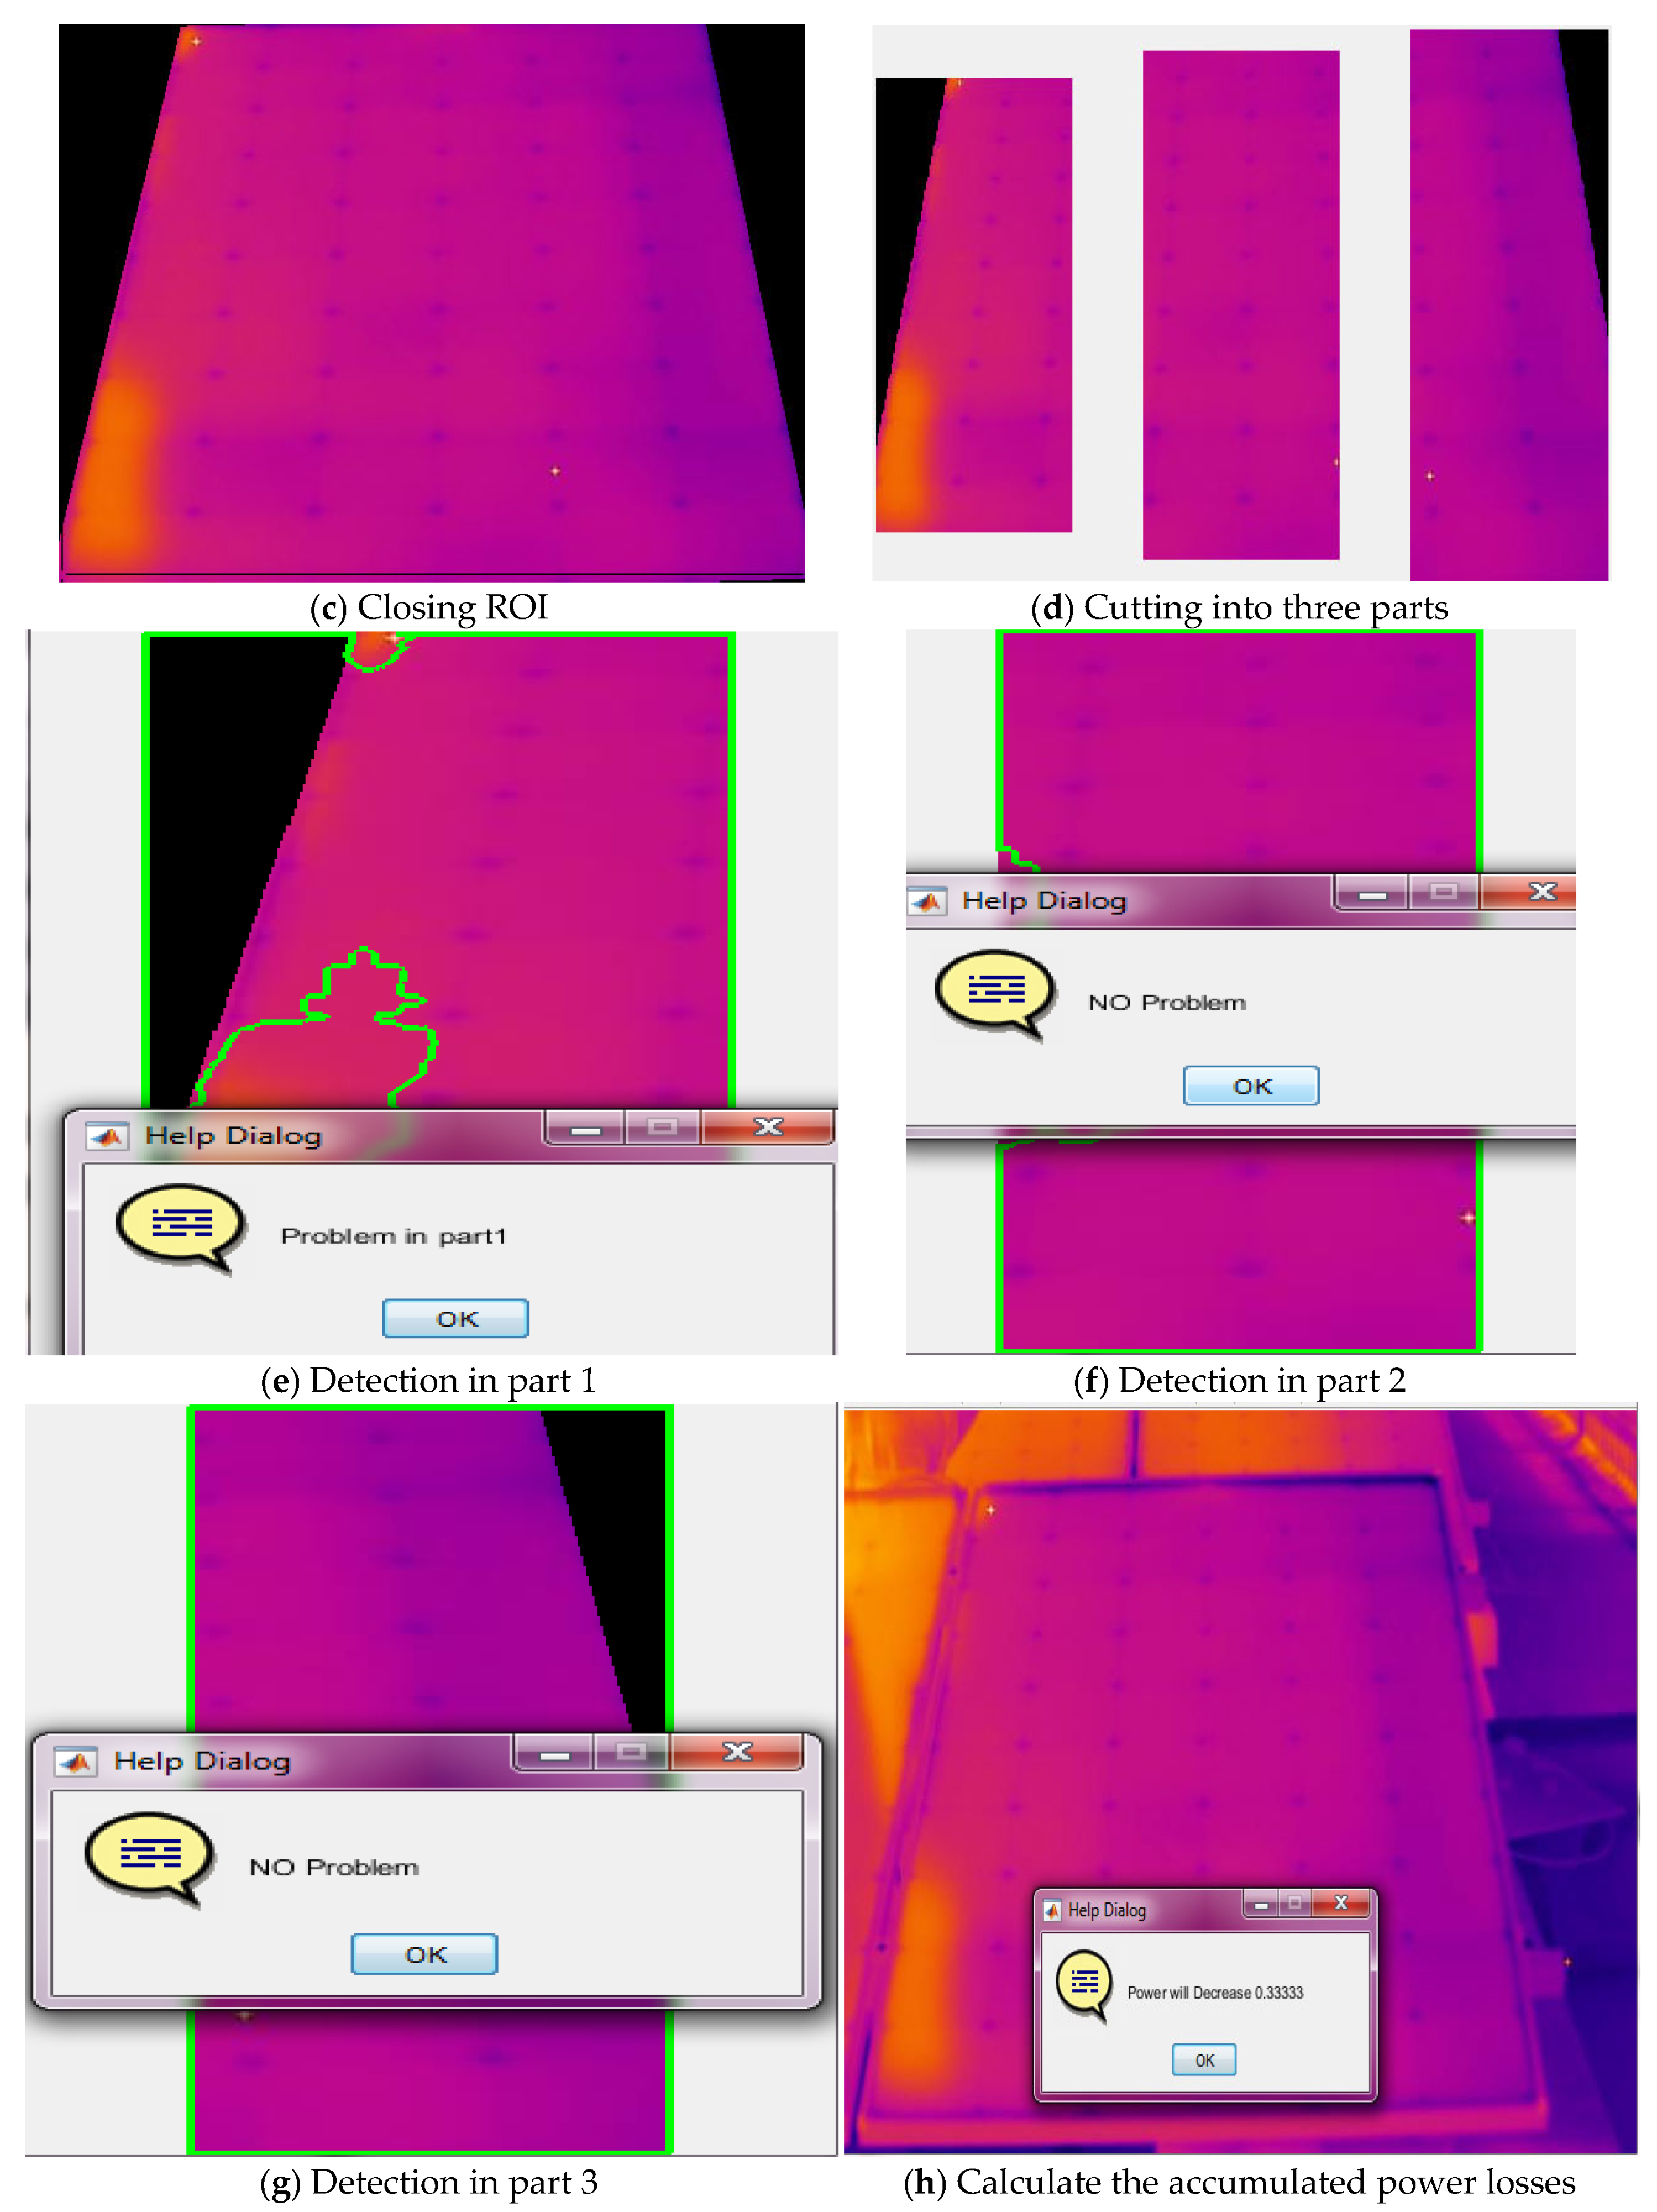
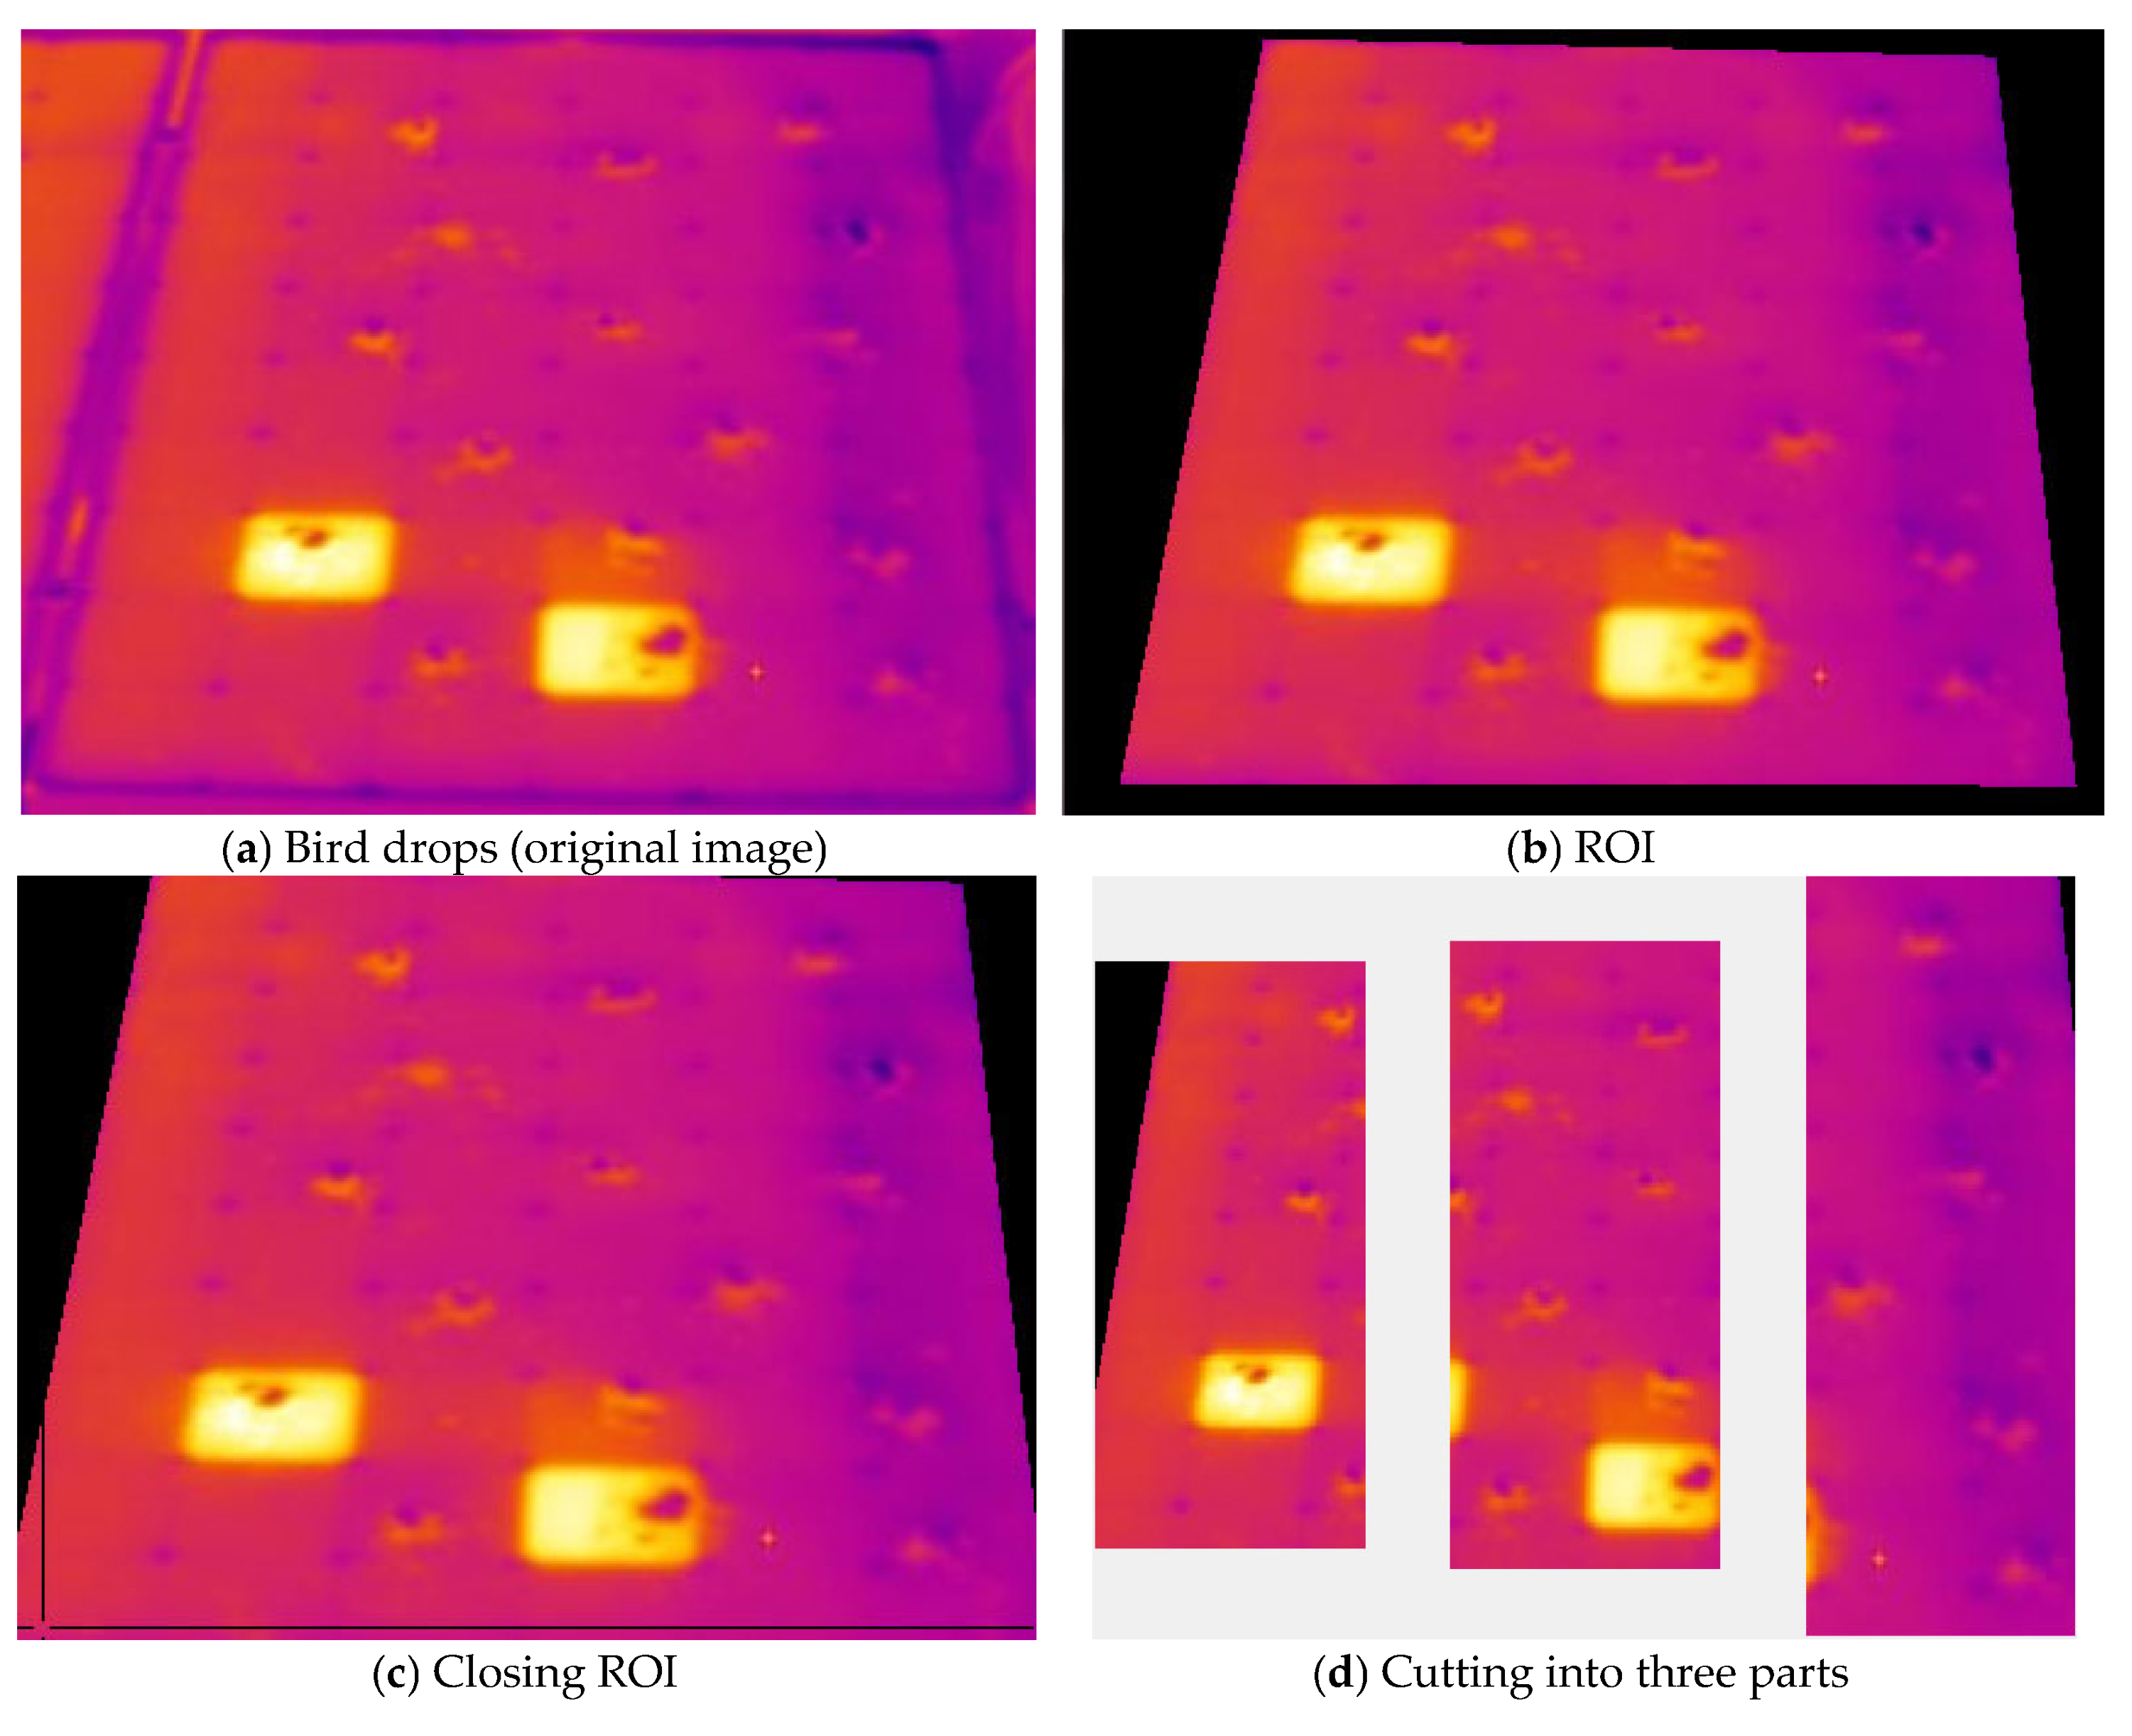
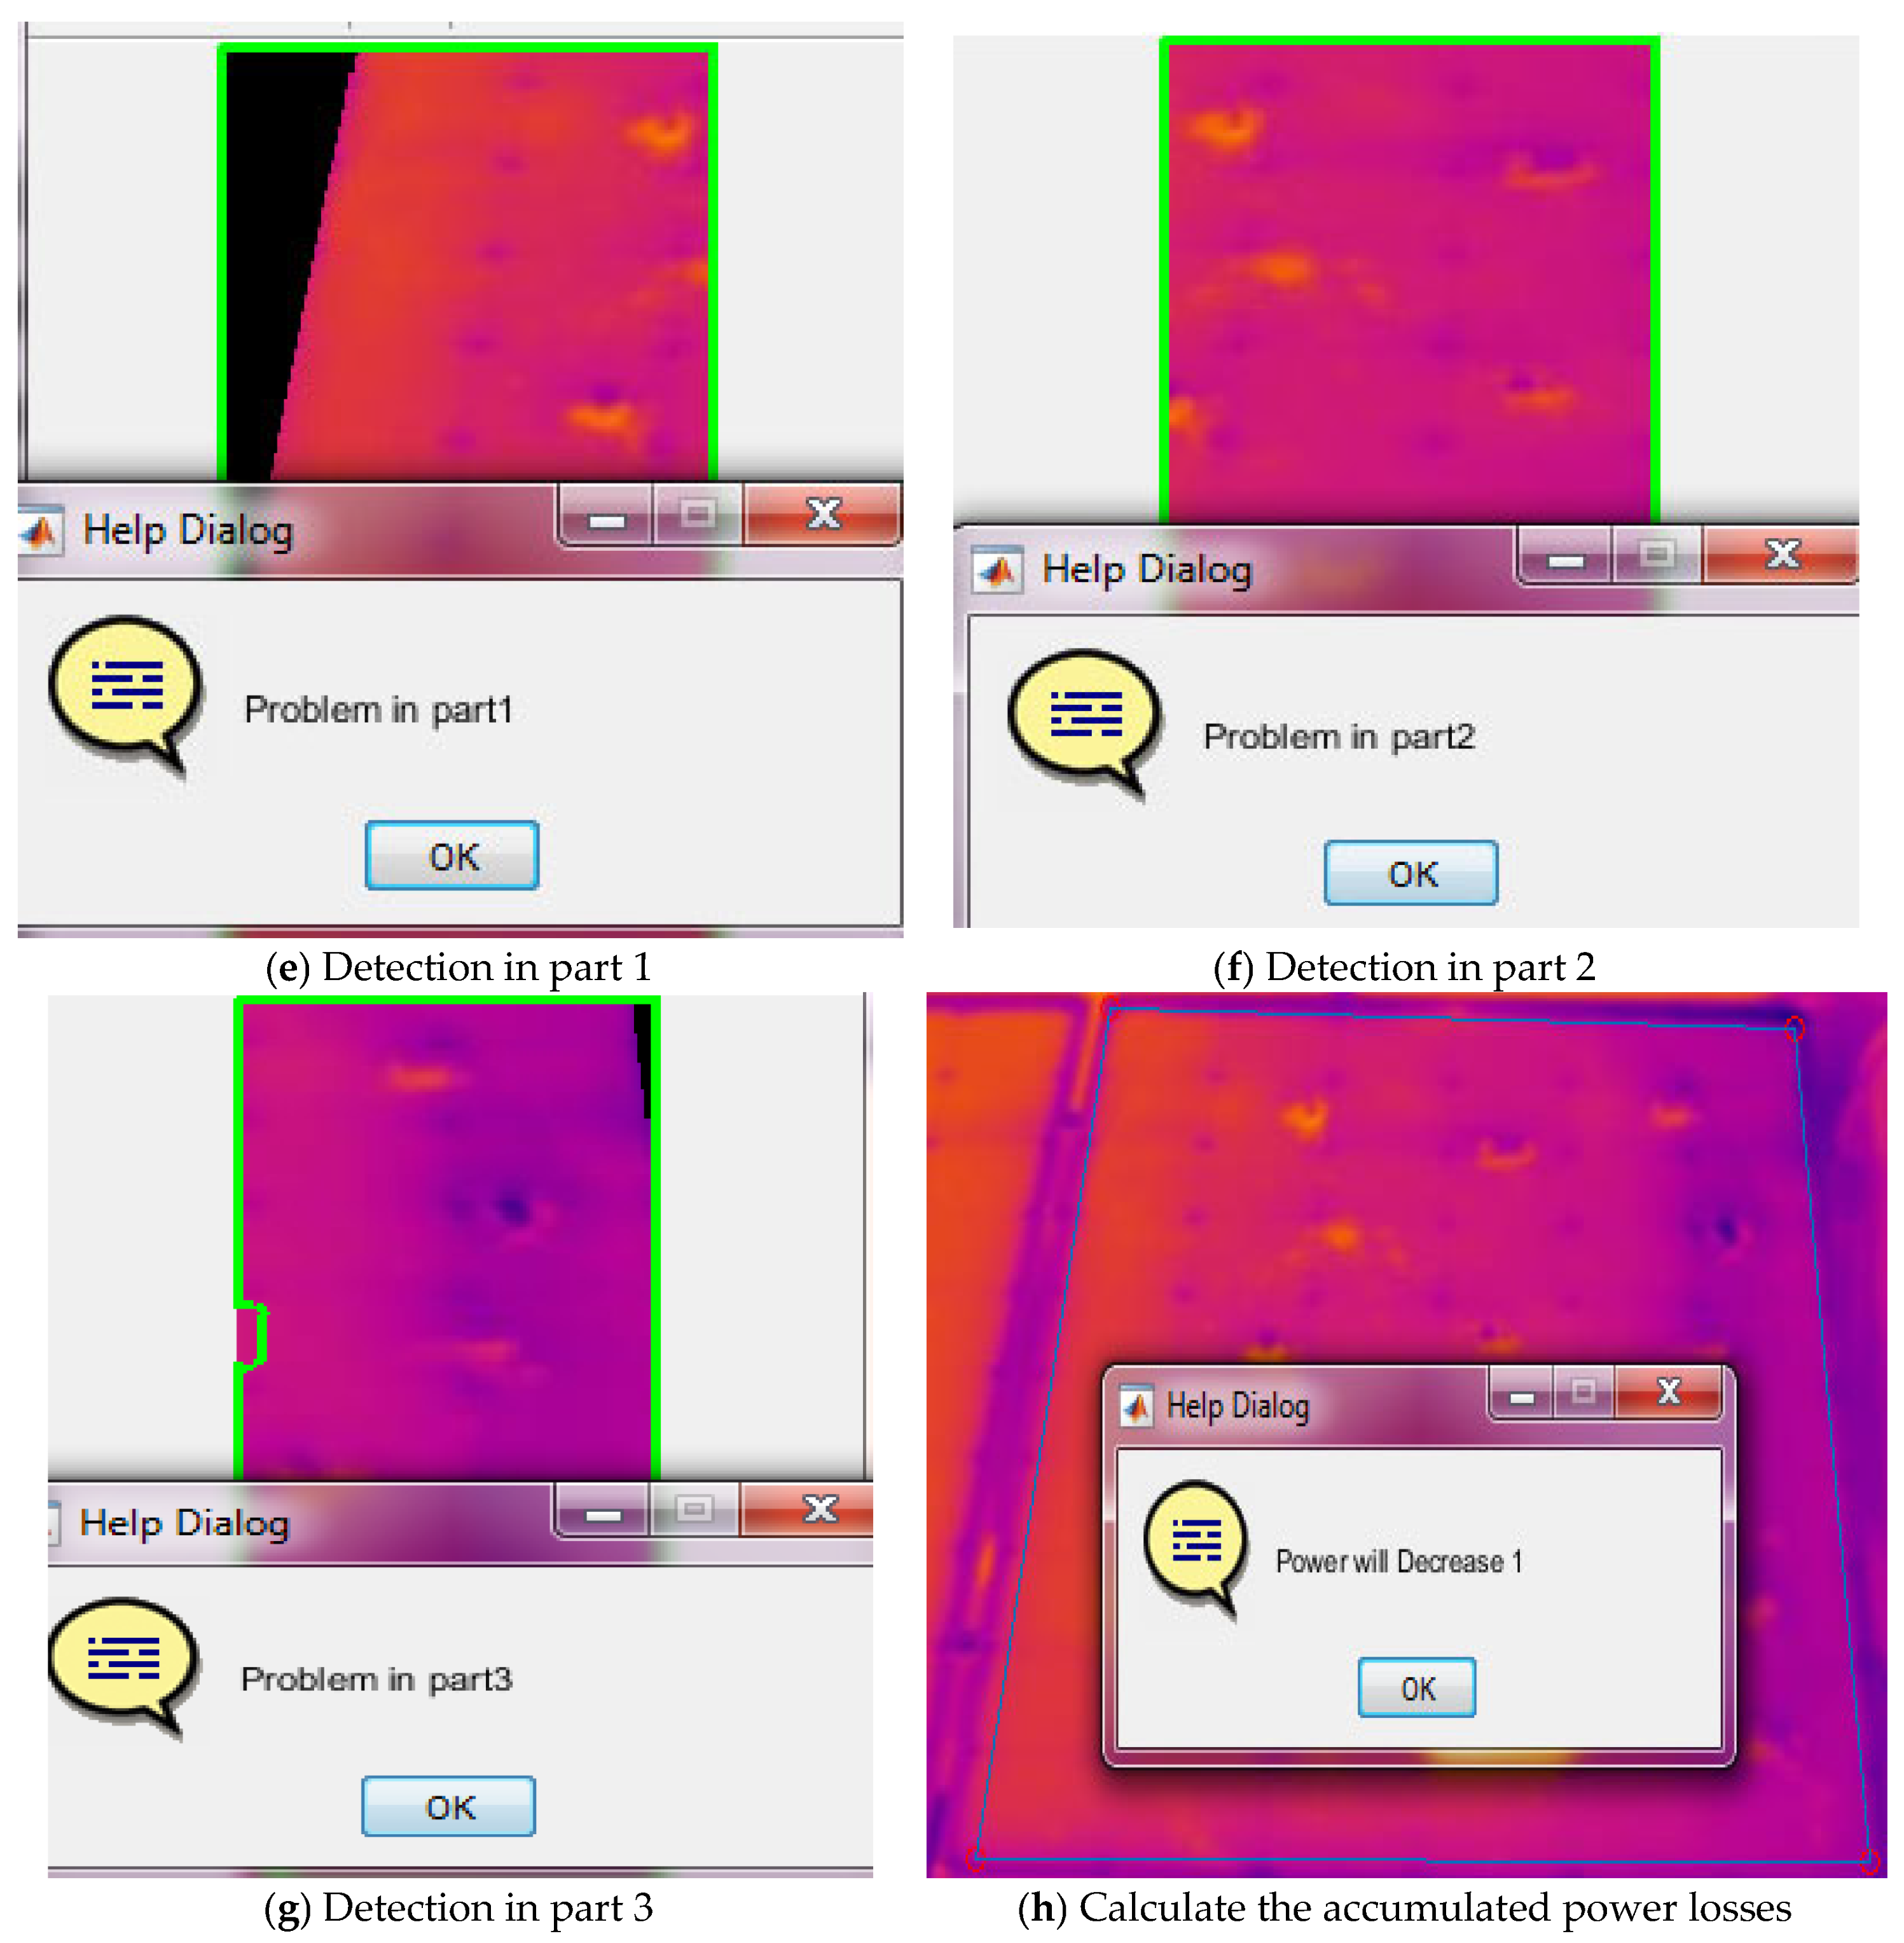
Another MATLAB code was created to estimate power losses; the code is linked to the output of the first MATLAB code. The ROI is extracted for image processing. As mentioned, the PV panel has six rows of cells; each pair of rows is linked to a diode; therefore, the image is segmented into three parts. Each image segment should be processed by first identifying the object within the ROI and its boundaries, then defining its area. A threshold value is determined to classify hot spots. The search process is performed by dividing each pixel into 5 × 5 subpixels; the hue layer value is compared between every two consecutive subpixels.
Once a difference is detected, it indicates a hot spot, and the surrounding subpixels are searched for differences in hau layer values to determine the hot spot’s boundaries. Then, the MATLAB code estimates the hot spot’s size and classifies it according to its type. Power losses depend on the type and number of hot spots. In the worst-case scenario, power loss depends on the hot spot location, the affected area, the PV module’s electrical configuration, and the bypass diode’s operation. Therefore, the relationship between hot spot coverage and power loss is not necessarily linear and was evaluated experimentally in this work.

5. Results and Discussions

(a) 
Detection and classification
MATLAB code was used to process the recorded thermal images, enabling the detection and classification of hot spot types. In our analysis, 111 images were tested. In Appendix A and Appendix B, examples of the process for detecting ideal, shadow, and bird hot spots are displayed.
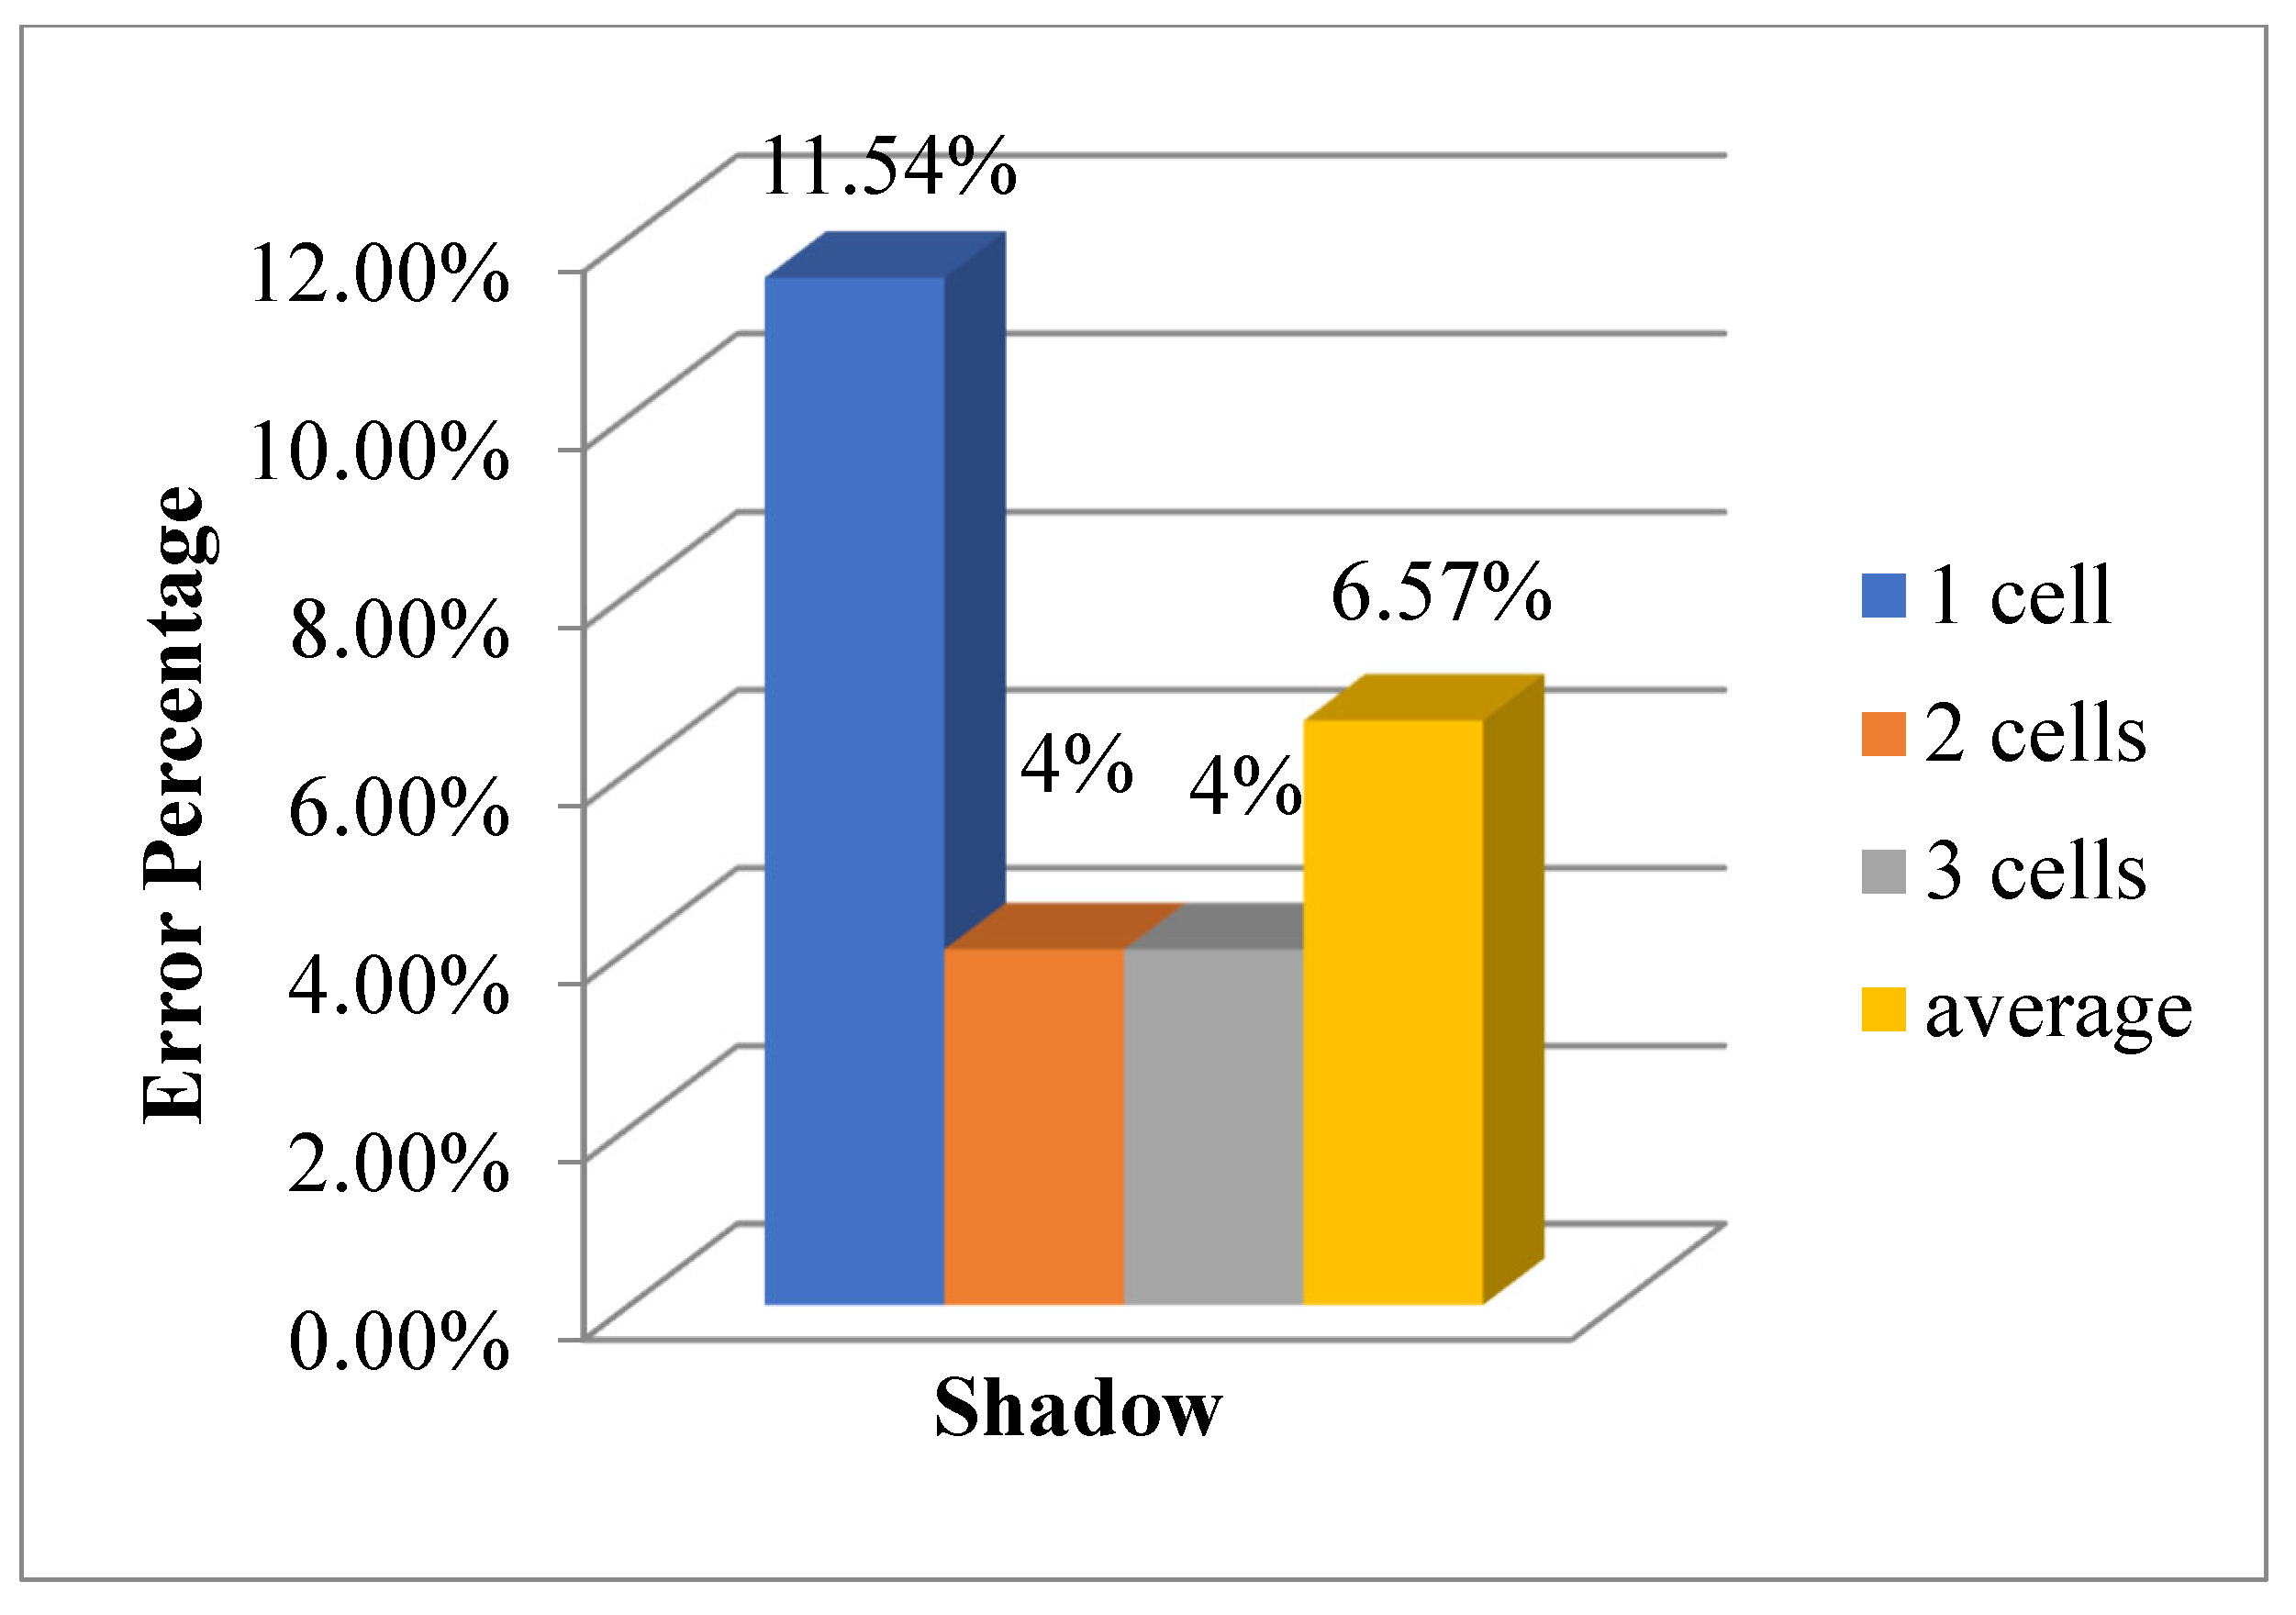
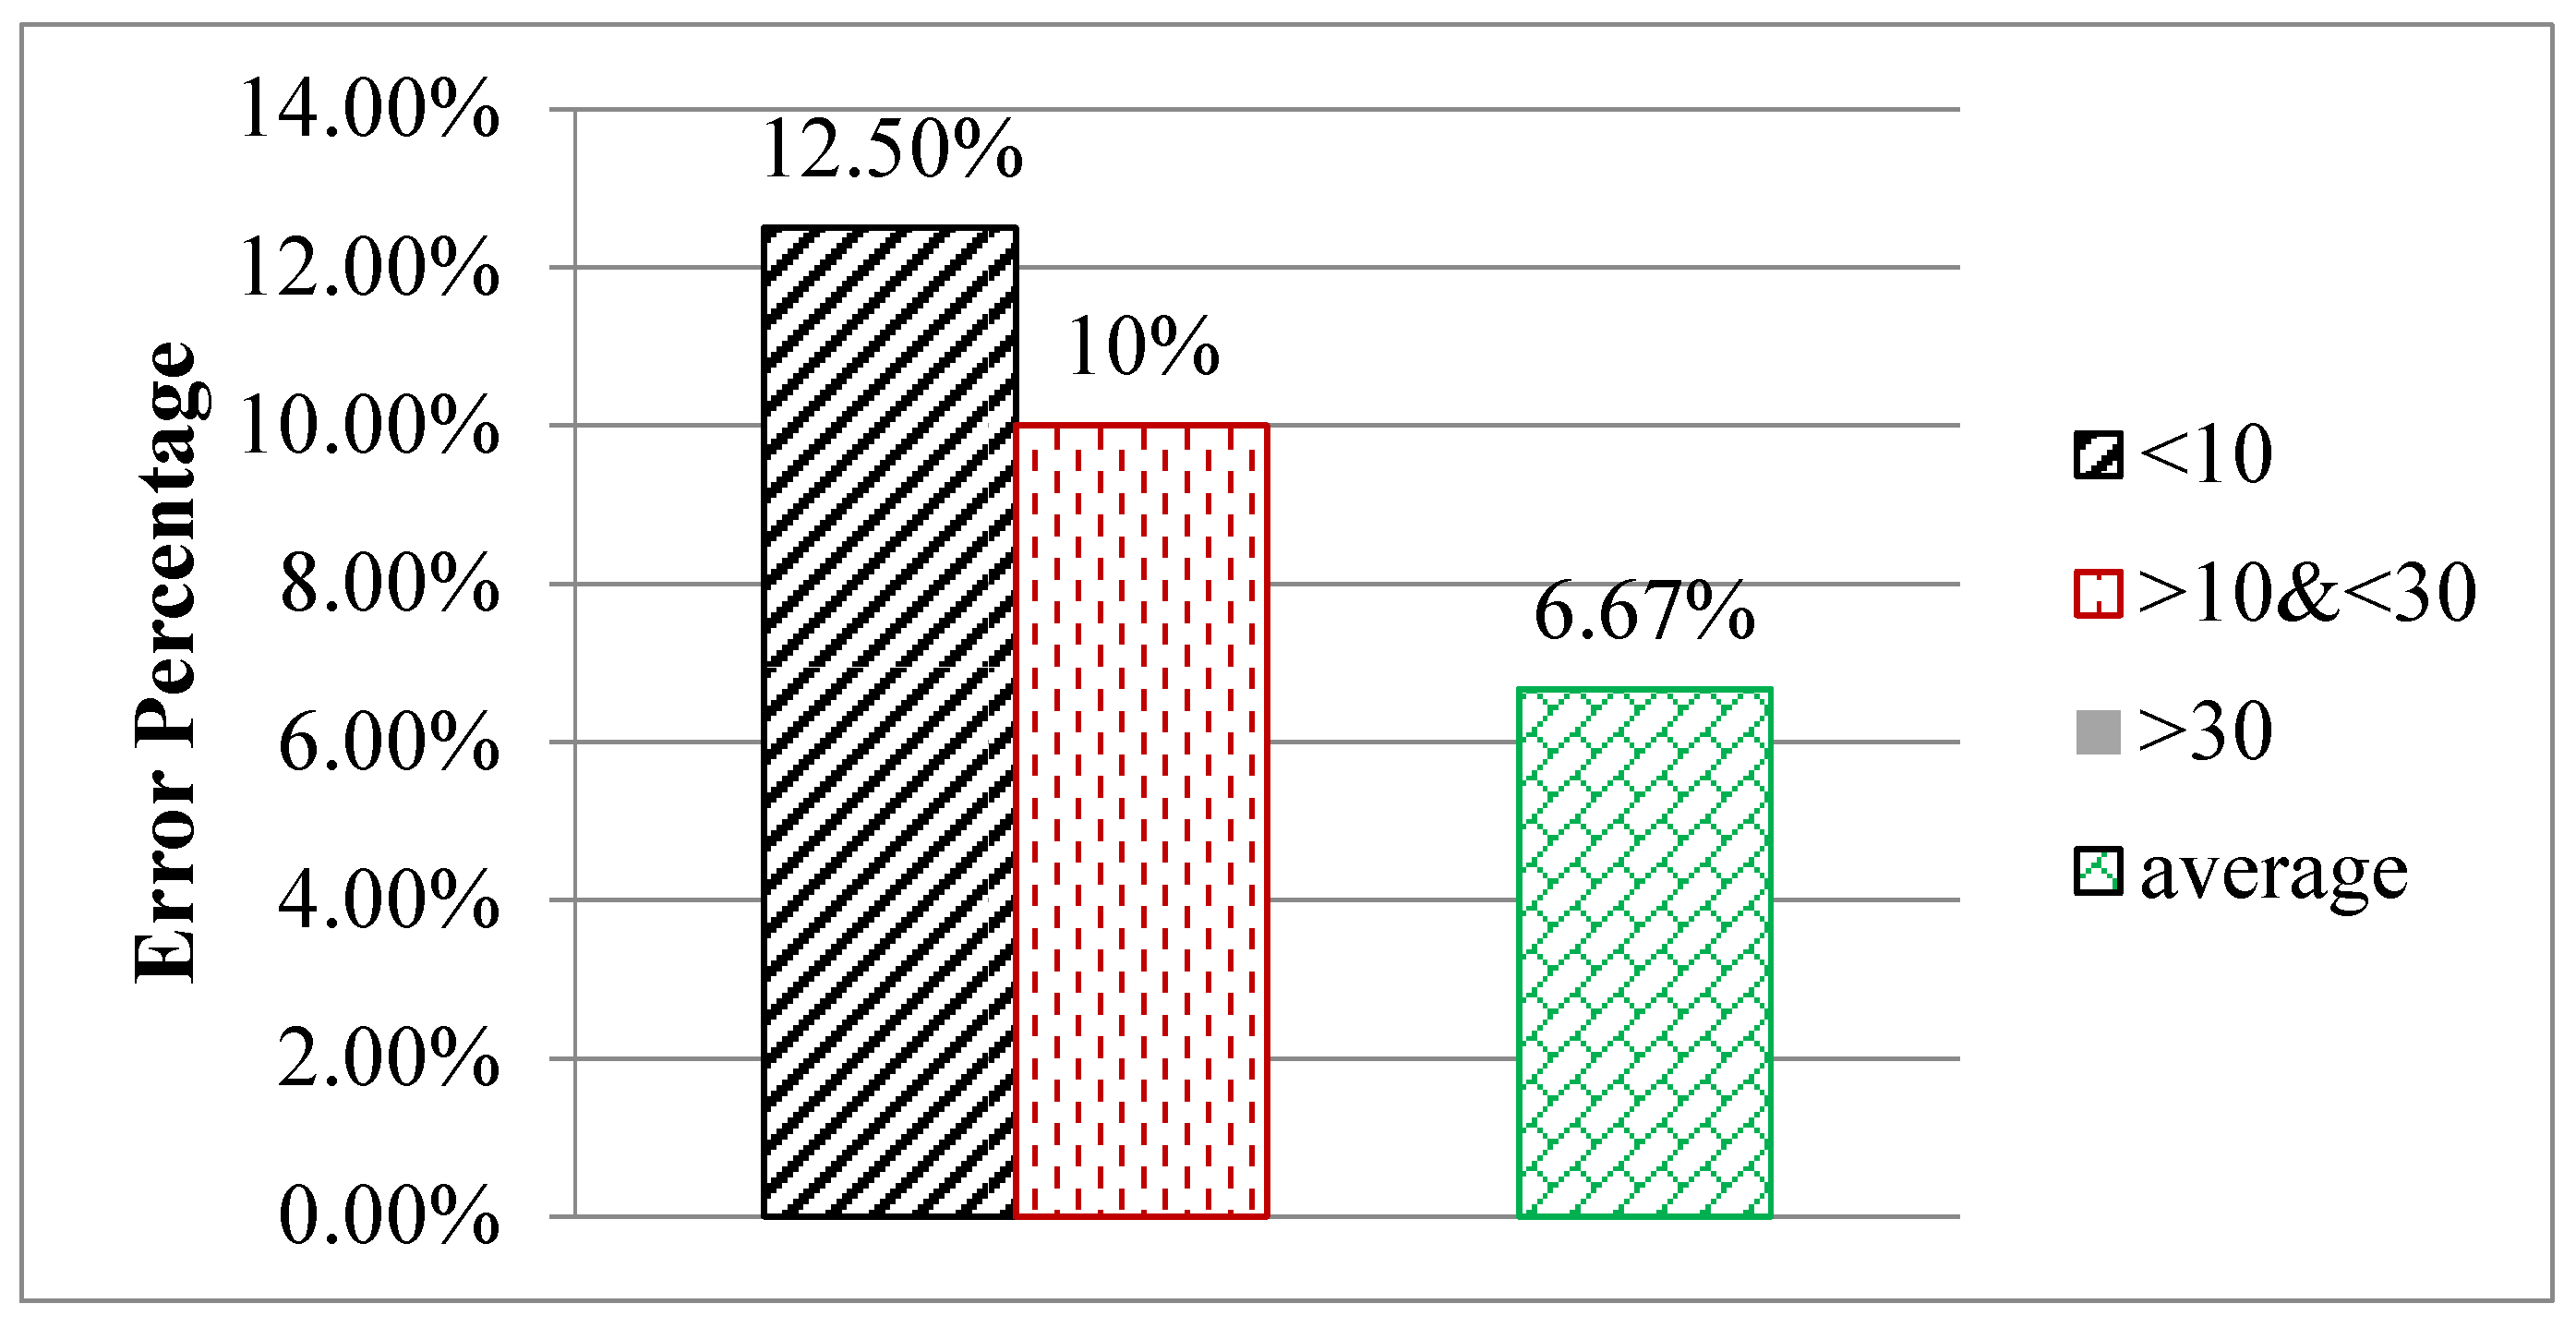
Table 2 presents the detection error percentage in the images. As seen, there were no false detections (i.e., classifying the ideal image as a shadow or bird drops). However, the weighted detection error was around 6.57% and 6.67% for images with shadow hot spots and bird drops, respectively. Both contrast stretching and dithering filters are applied.
The detection error values for shadow and bird drops are weighted to provide more insight. Figure 6 and Figure 7 present the detection error for different shadow sizes and different bird drop types, respectively.
Figure 6 shows the detection error for shadow coverage of one, two, and three cells. As shown, the detection error probability increases when the shadow covers a single cell. The probability decreases as the shadow covers a larger area, as expected. The weighted average error is found to be 6.57%.
The effect of the number of bird drops on detection is presented in Figure 7; as seen, for bird < 10 drops, the error detection percentage is 12.5%; however, for >10 and <30, and >30 drops, the error detection is reduced to 10% and 0%, respectively, which is expected as increasing the number of drops will make it easier to be detected. The weighted average error in detecting and classifying the bird drops using the proposed method is 6.67%.
In the case of relatively close drops, the effect of bird drops on power losses becomes similar to the effect of shadow. However, the detection process can still distinguish each case.
(b) 
Power losses
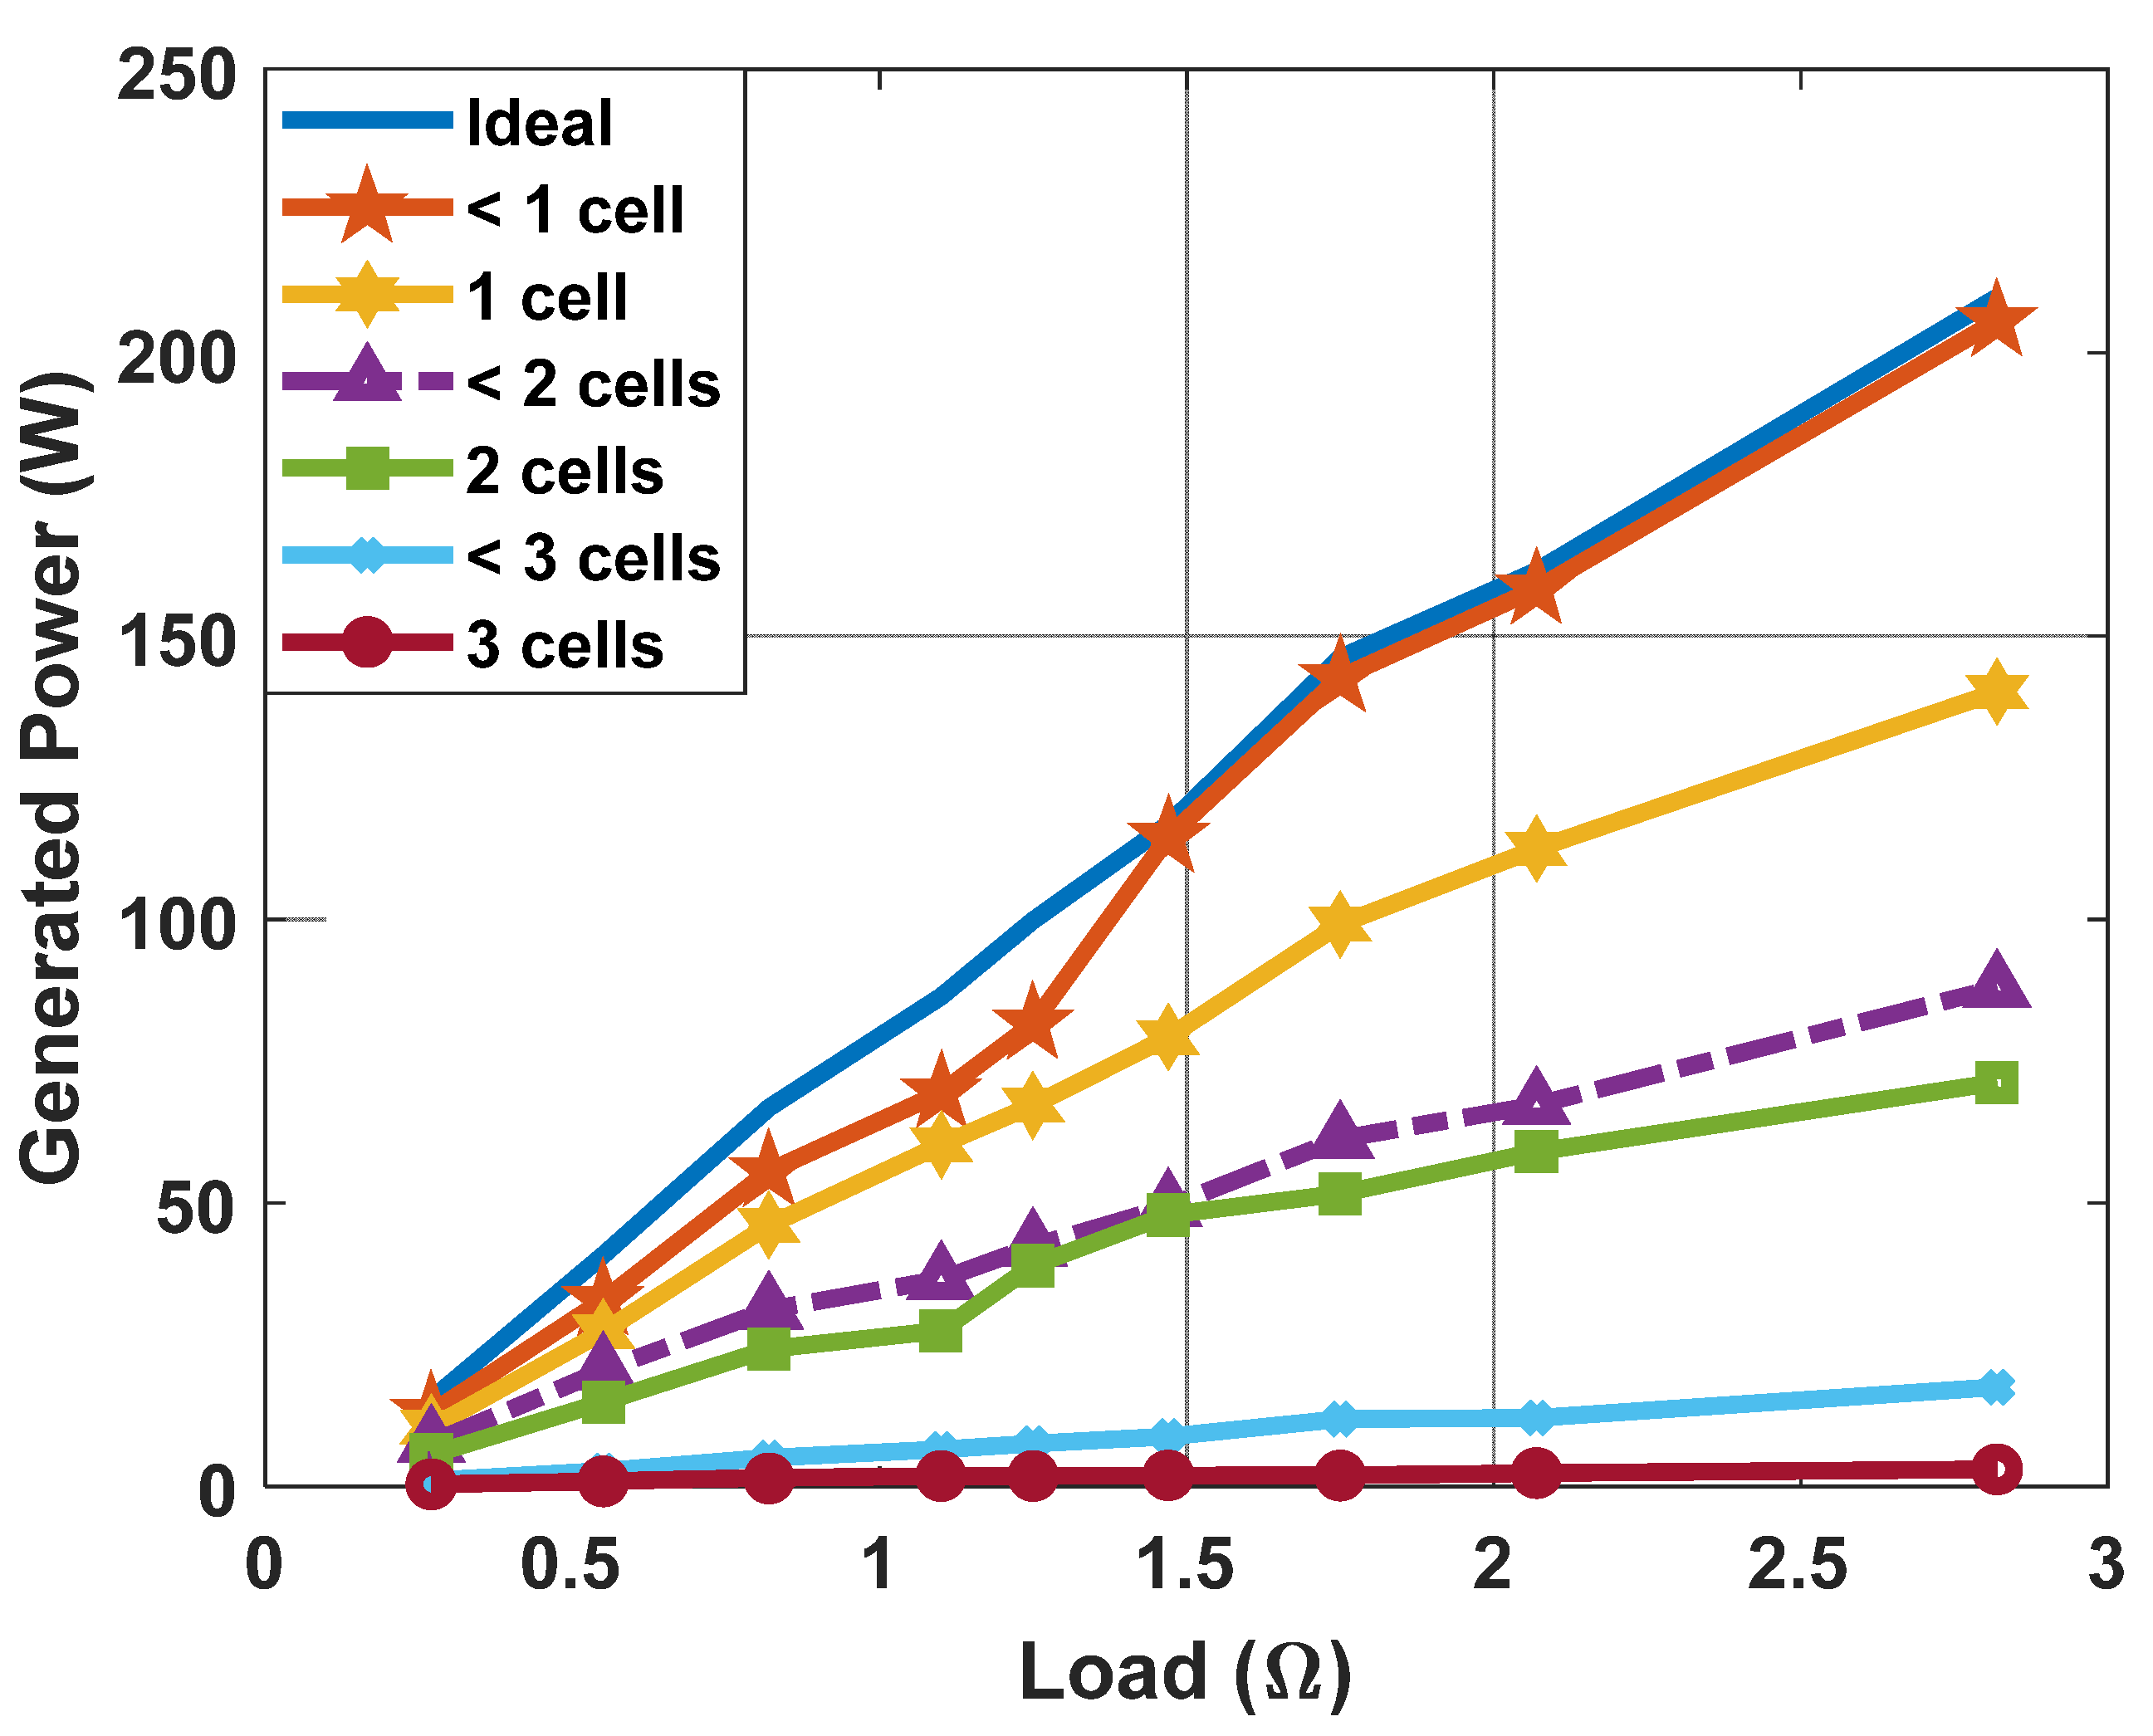
Figure 8 illustrates how shadowing with different scenarios affects the generated power. When the shadow on the module covers fewer than one cell, the output power is nearly ideal. The output power is reduced by 13% to 19.8% at low loads. When the module is affected by a shadow on one cell, the power is reduced by 30–33.2%. When shadow covers fewer than 2 cells, the power is reduced by 49.8–58.3%. The more shadow covers a larger area, the lower the generated power efficiency, as seen when the module affected by shadow covered two cells, more than two cells, and three cells; the power produced was reduced, respectively, by about 58.9–68.2%, 91.6–93.4%, and 97.5–98.7%.
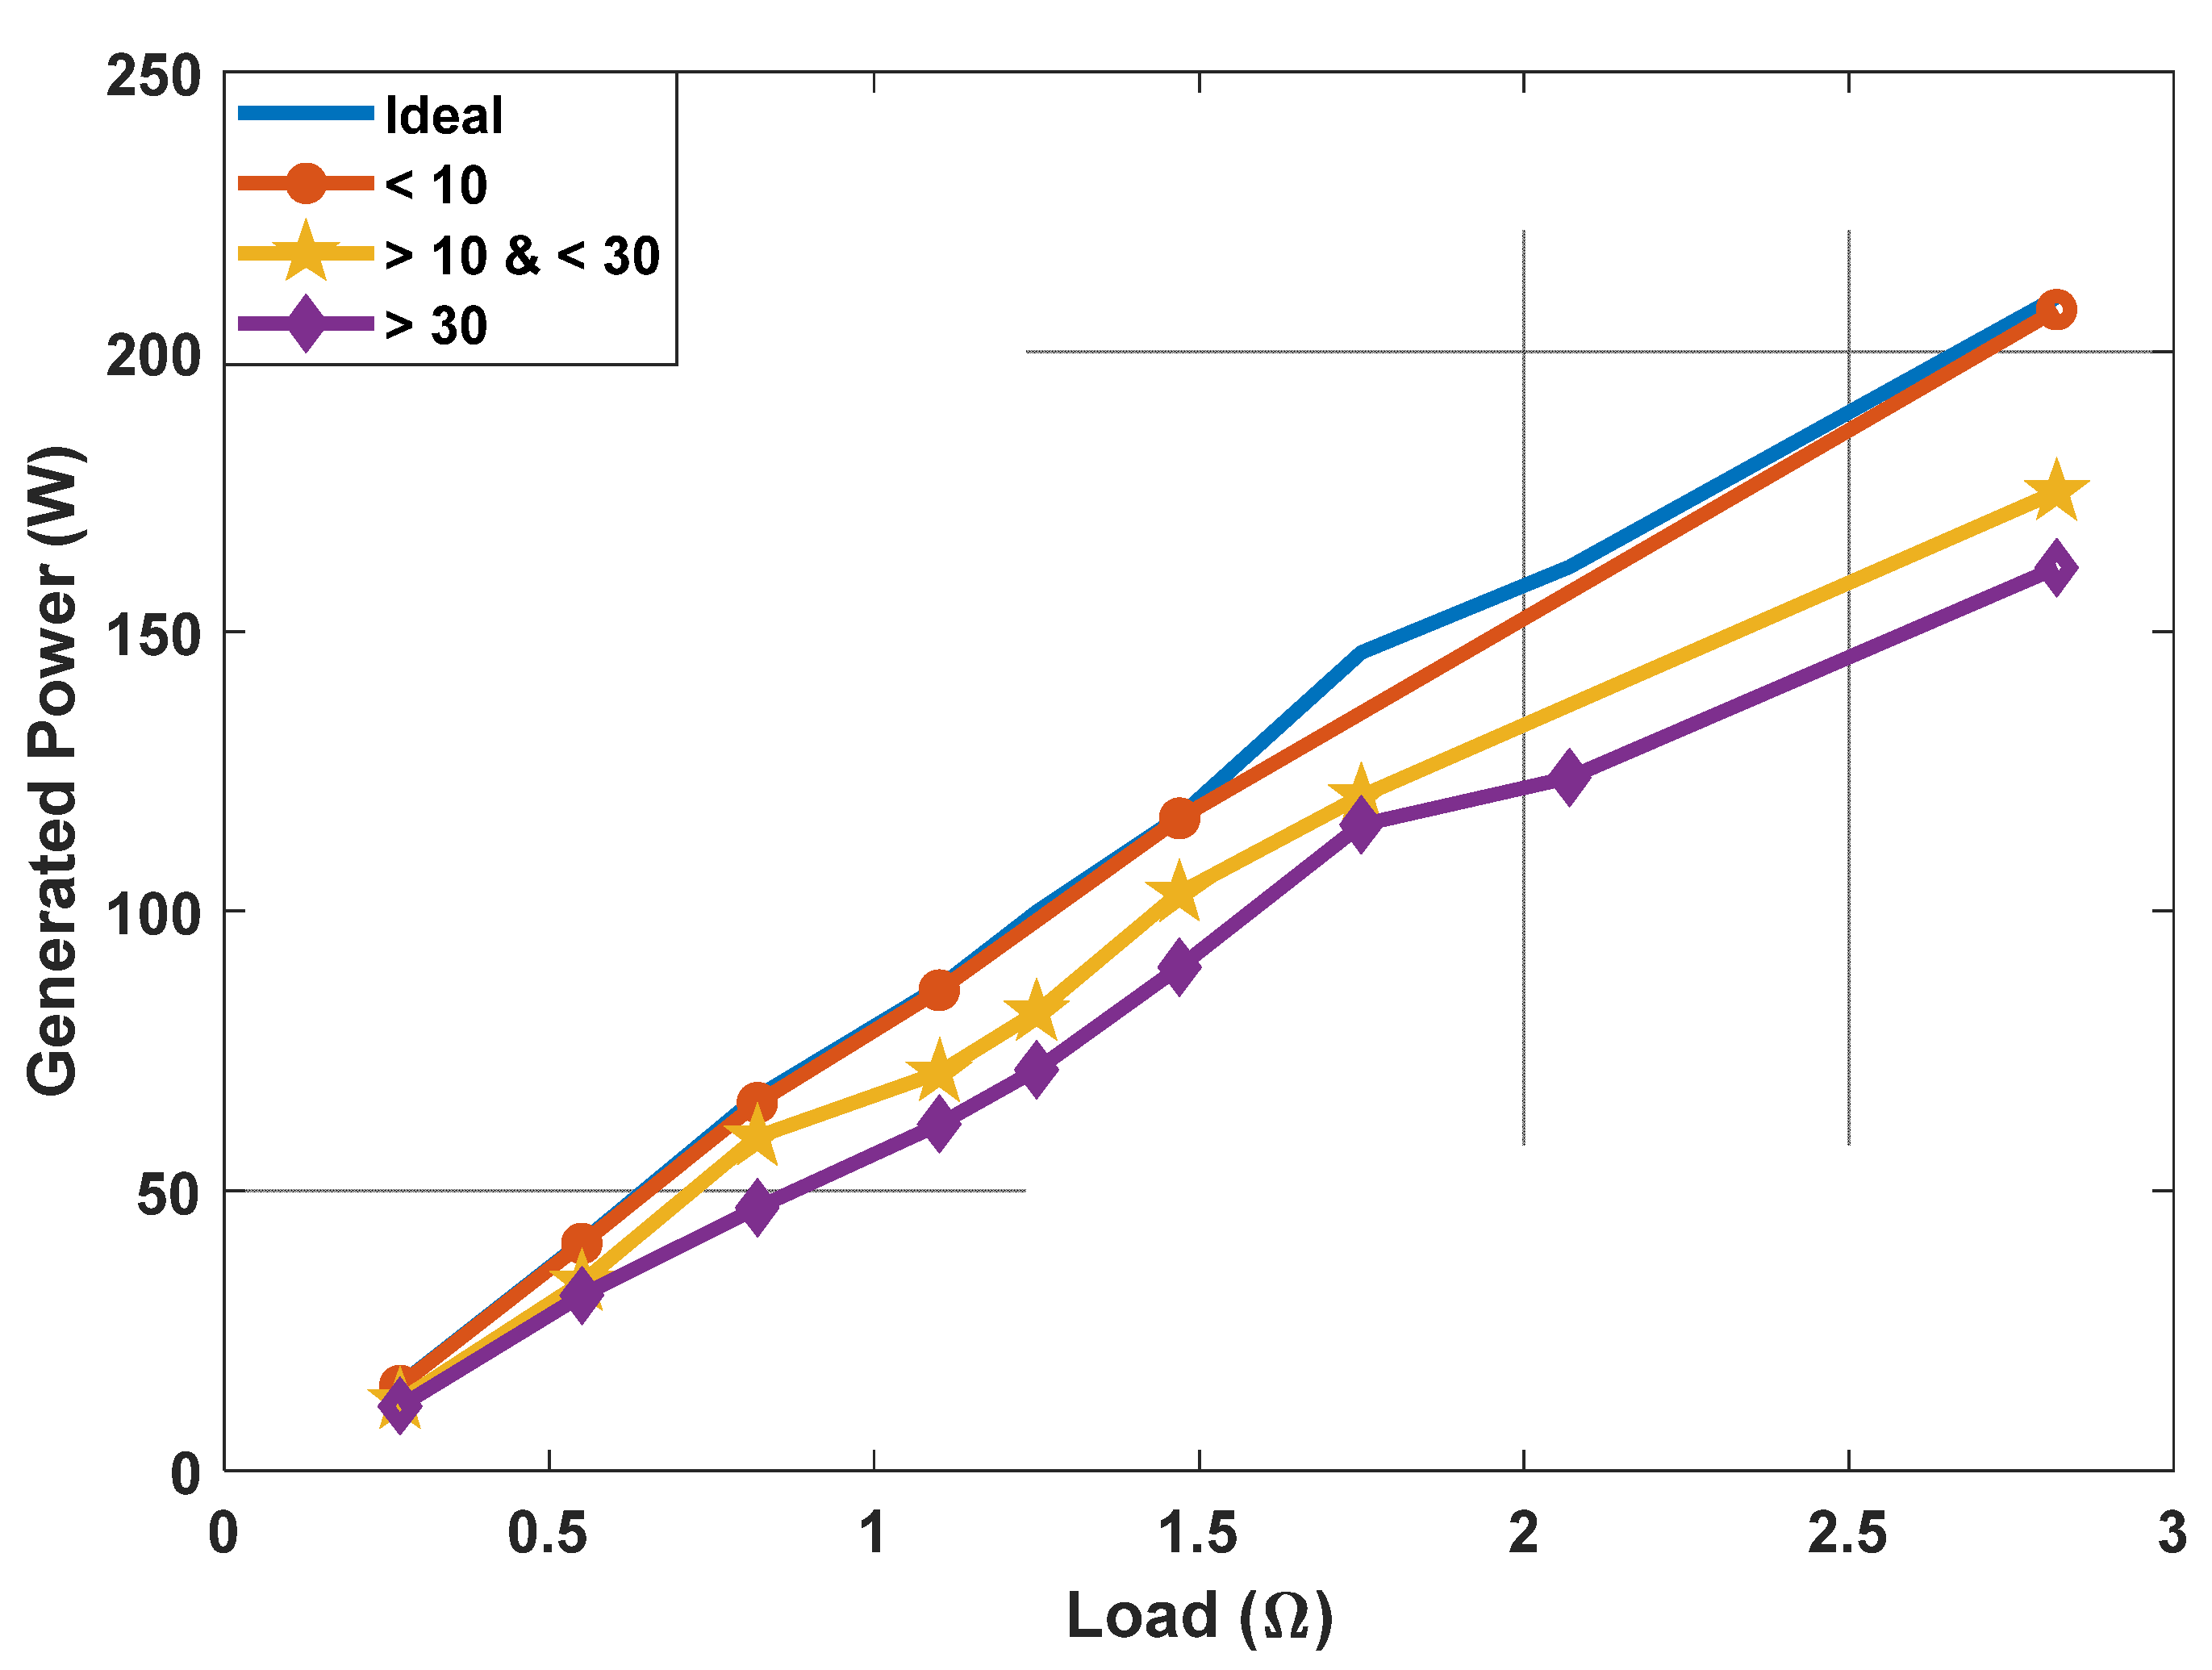
The bird drops have three types; as seen in Figure 9, the small bird drops do not significantly affect power output, with a power reduction of approximately 0.0022% to 0.01%. For medium bird drops, the power drop was around 10.7–18.5% of the total power produced. The last case studied in this section is the large bird drop, which significantly increases power losses, reducing power by 21–29.7%. According to the above-measuring data, the bird drop’s effect on output power is less than the shadow effect.
(c) 
Comparative Study of Image Detection
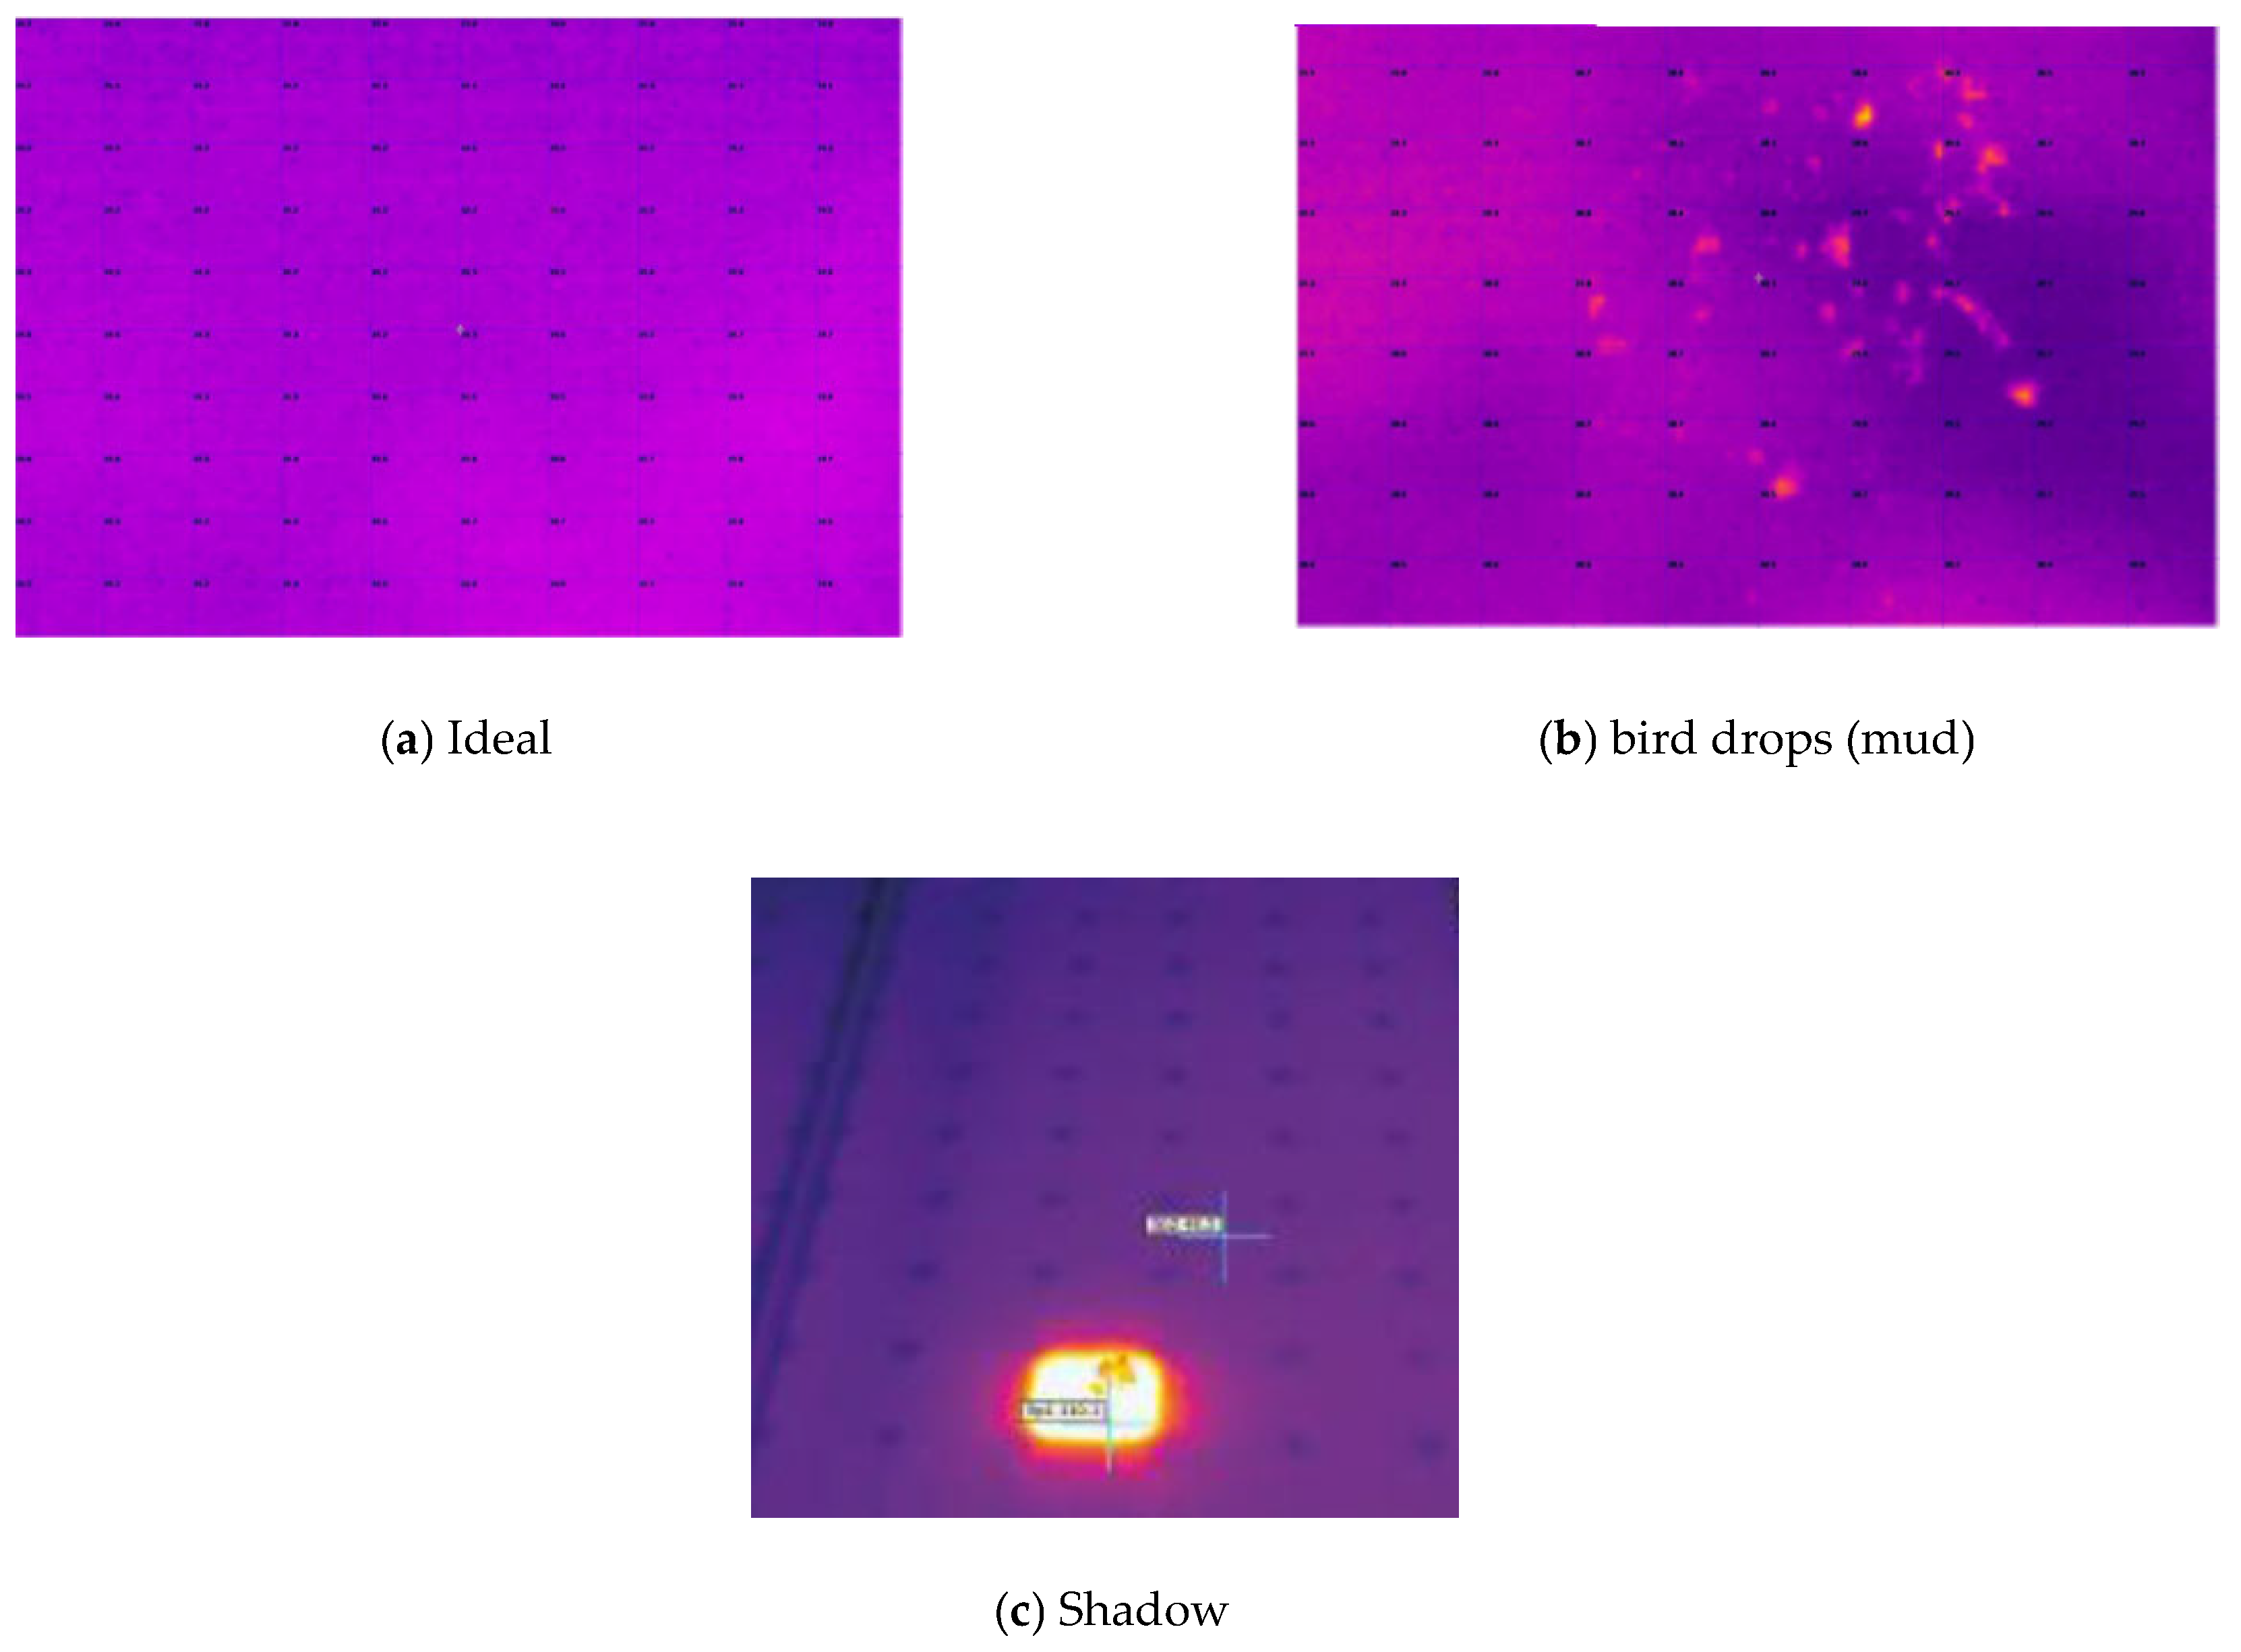
The proposed method, which was illustrated in research to detect and classify the hot spot effect on PV, was applied to external thermal images from various references [39,40,41,42,43,44,45,46]. Figure 10 represents some of the thermal images used in the comparison study.
The proposed method was applied to external samples to evaluate its generalization capability. The classification accuracy for ideal images was 100%, while the identification accuracy for shadow hot spots and bird drop hot spots were 90% and 92%, respectively. These results demonstrate the effectiveness of the proposed method for hot spot detection and classification under different operating conditions.

6. Conclusions

In this paper, we propose a method for detecting and classifying thermal images into ideal, shadow, and bird-drop (mud) categories using image processing techniques. The method was applied to 110 thermal images, yielding an overall error rate of 6.3%, with rates of 6.57% for shadow hot spots and 6.67% for bird drop hot spots. The method quantifies the relationship between hot spots and power losses by calculating the maximum power loss for each hot spot type and coverage area. For PV modules affected by shadows, the power loss is proportional to the size of the shadow. The extent of power loss due to shadows depends on the area covered and the duration of shadowing. The detection of bird droplets improves with increasing droplet count, but the generated power decreases correspondingly. When applied to external thermal image samples, the proposed method demonstrated an error rate of 0.18%, confirming its applicability.

Author Contributions

Conceptualization, W.A.; methodology, H.O.; software, W.A.; validation, W.A.; formal analysis, W.A.; investigation, H.O. and H.A.-O.; resources, I.T.; writing—review and editing, H.O.; supervision, H.A.-O.; project administration, H.A.-O.; funding acquisition, I.T. All authors have read and agreed to the published version of the manuscript.

Funding

The authors are grateful to the Deanship of Research at Jadara University for providing financial support for this publication.

Data Availability Statement

Data are available from the author upon request.

Conflicts of Interest

The authors declare no conflicts of interest.

Appendix A

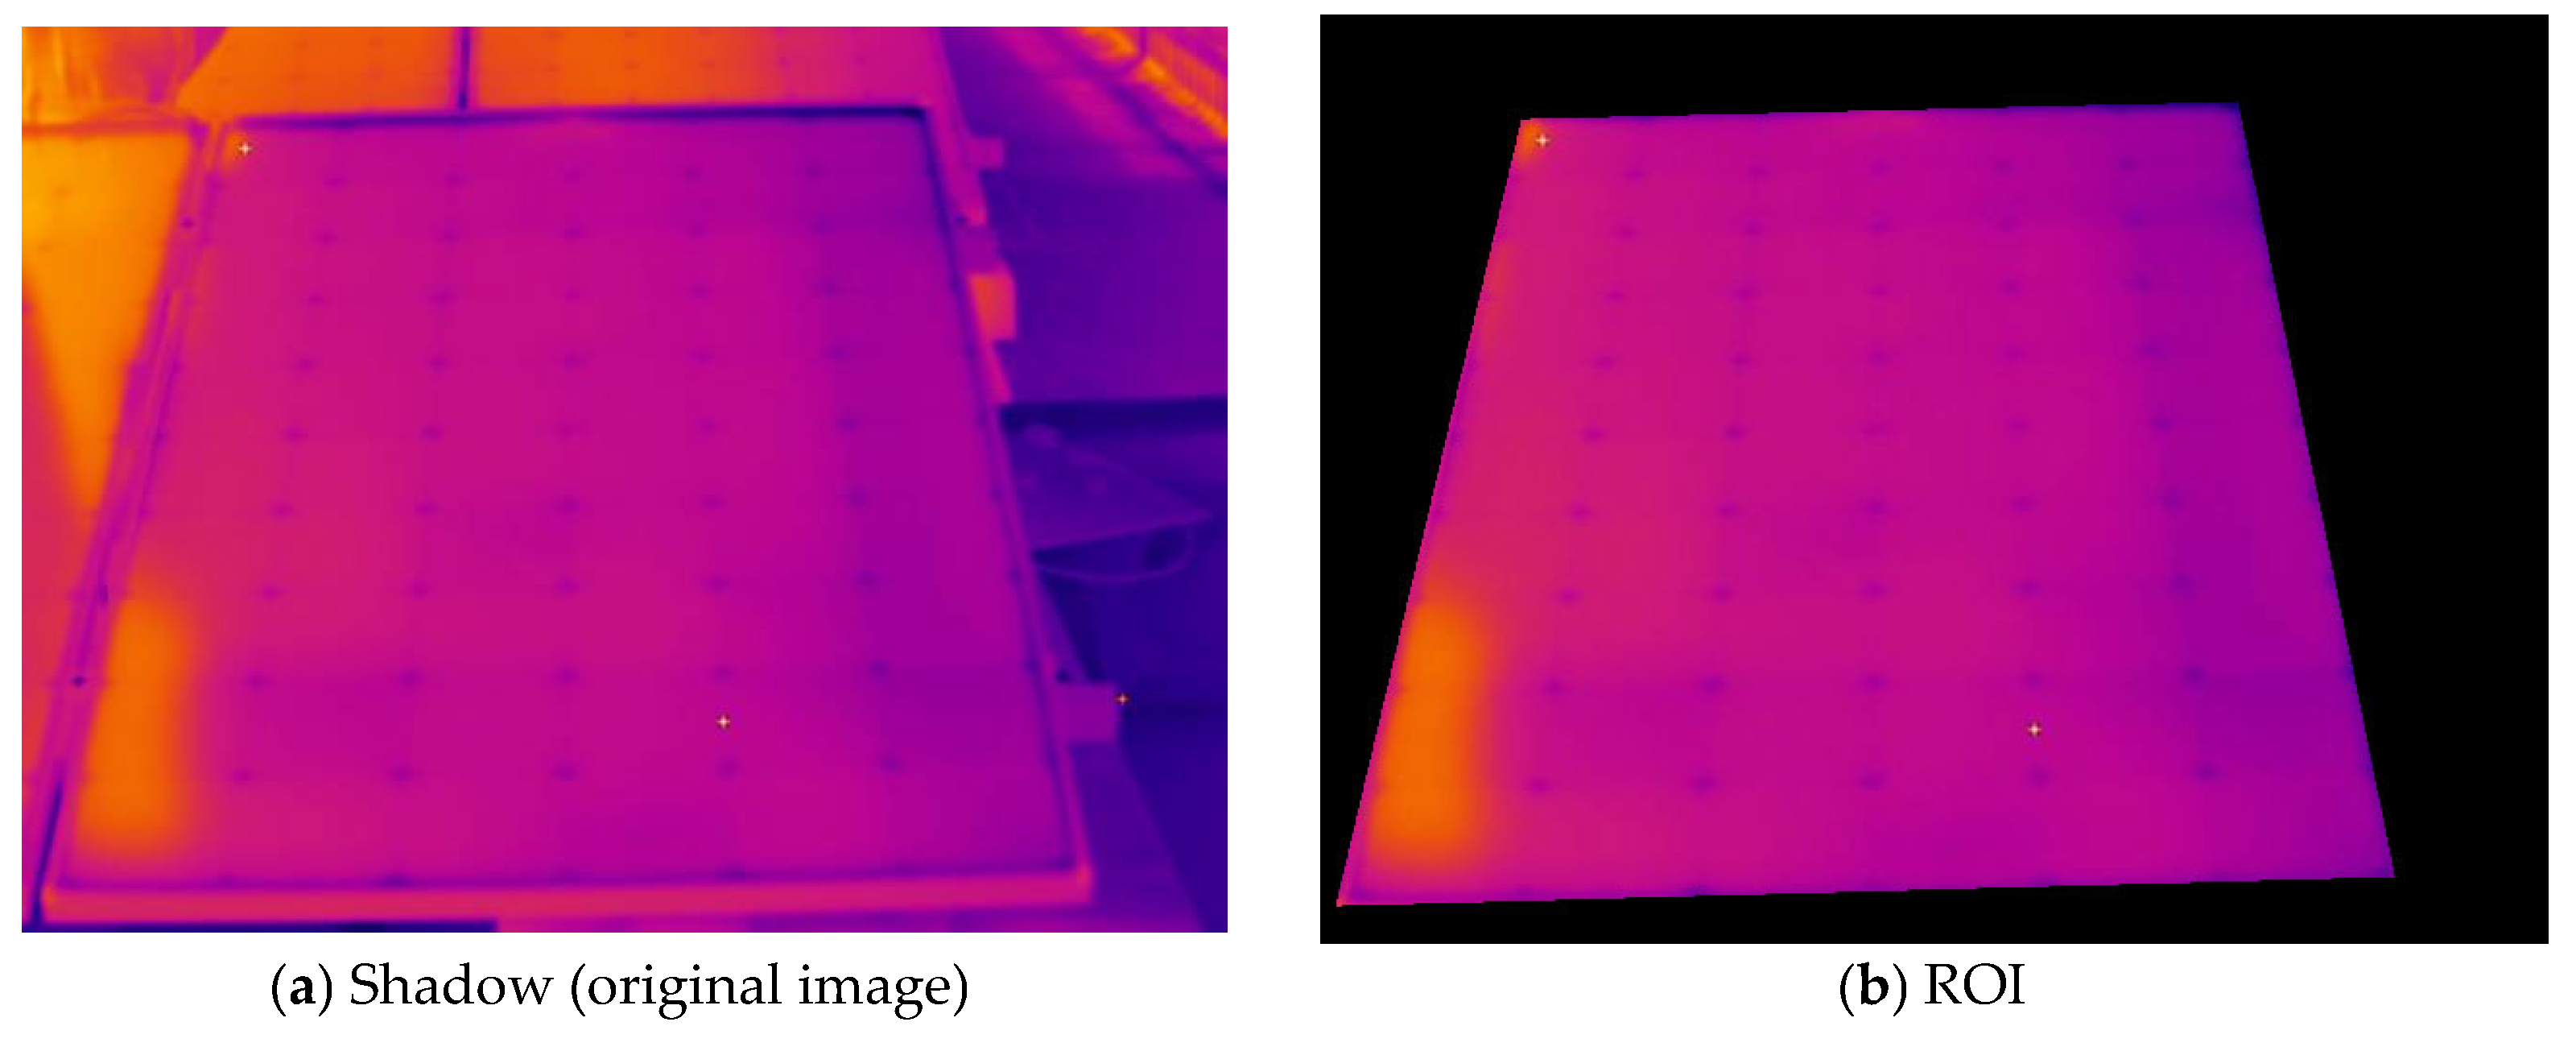
Detection of ideal images, shadow and bird hot spots:
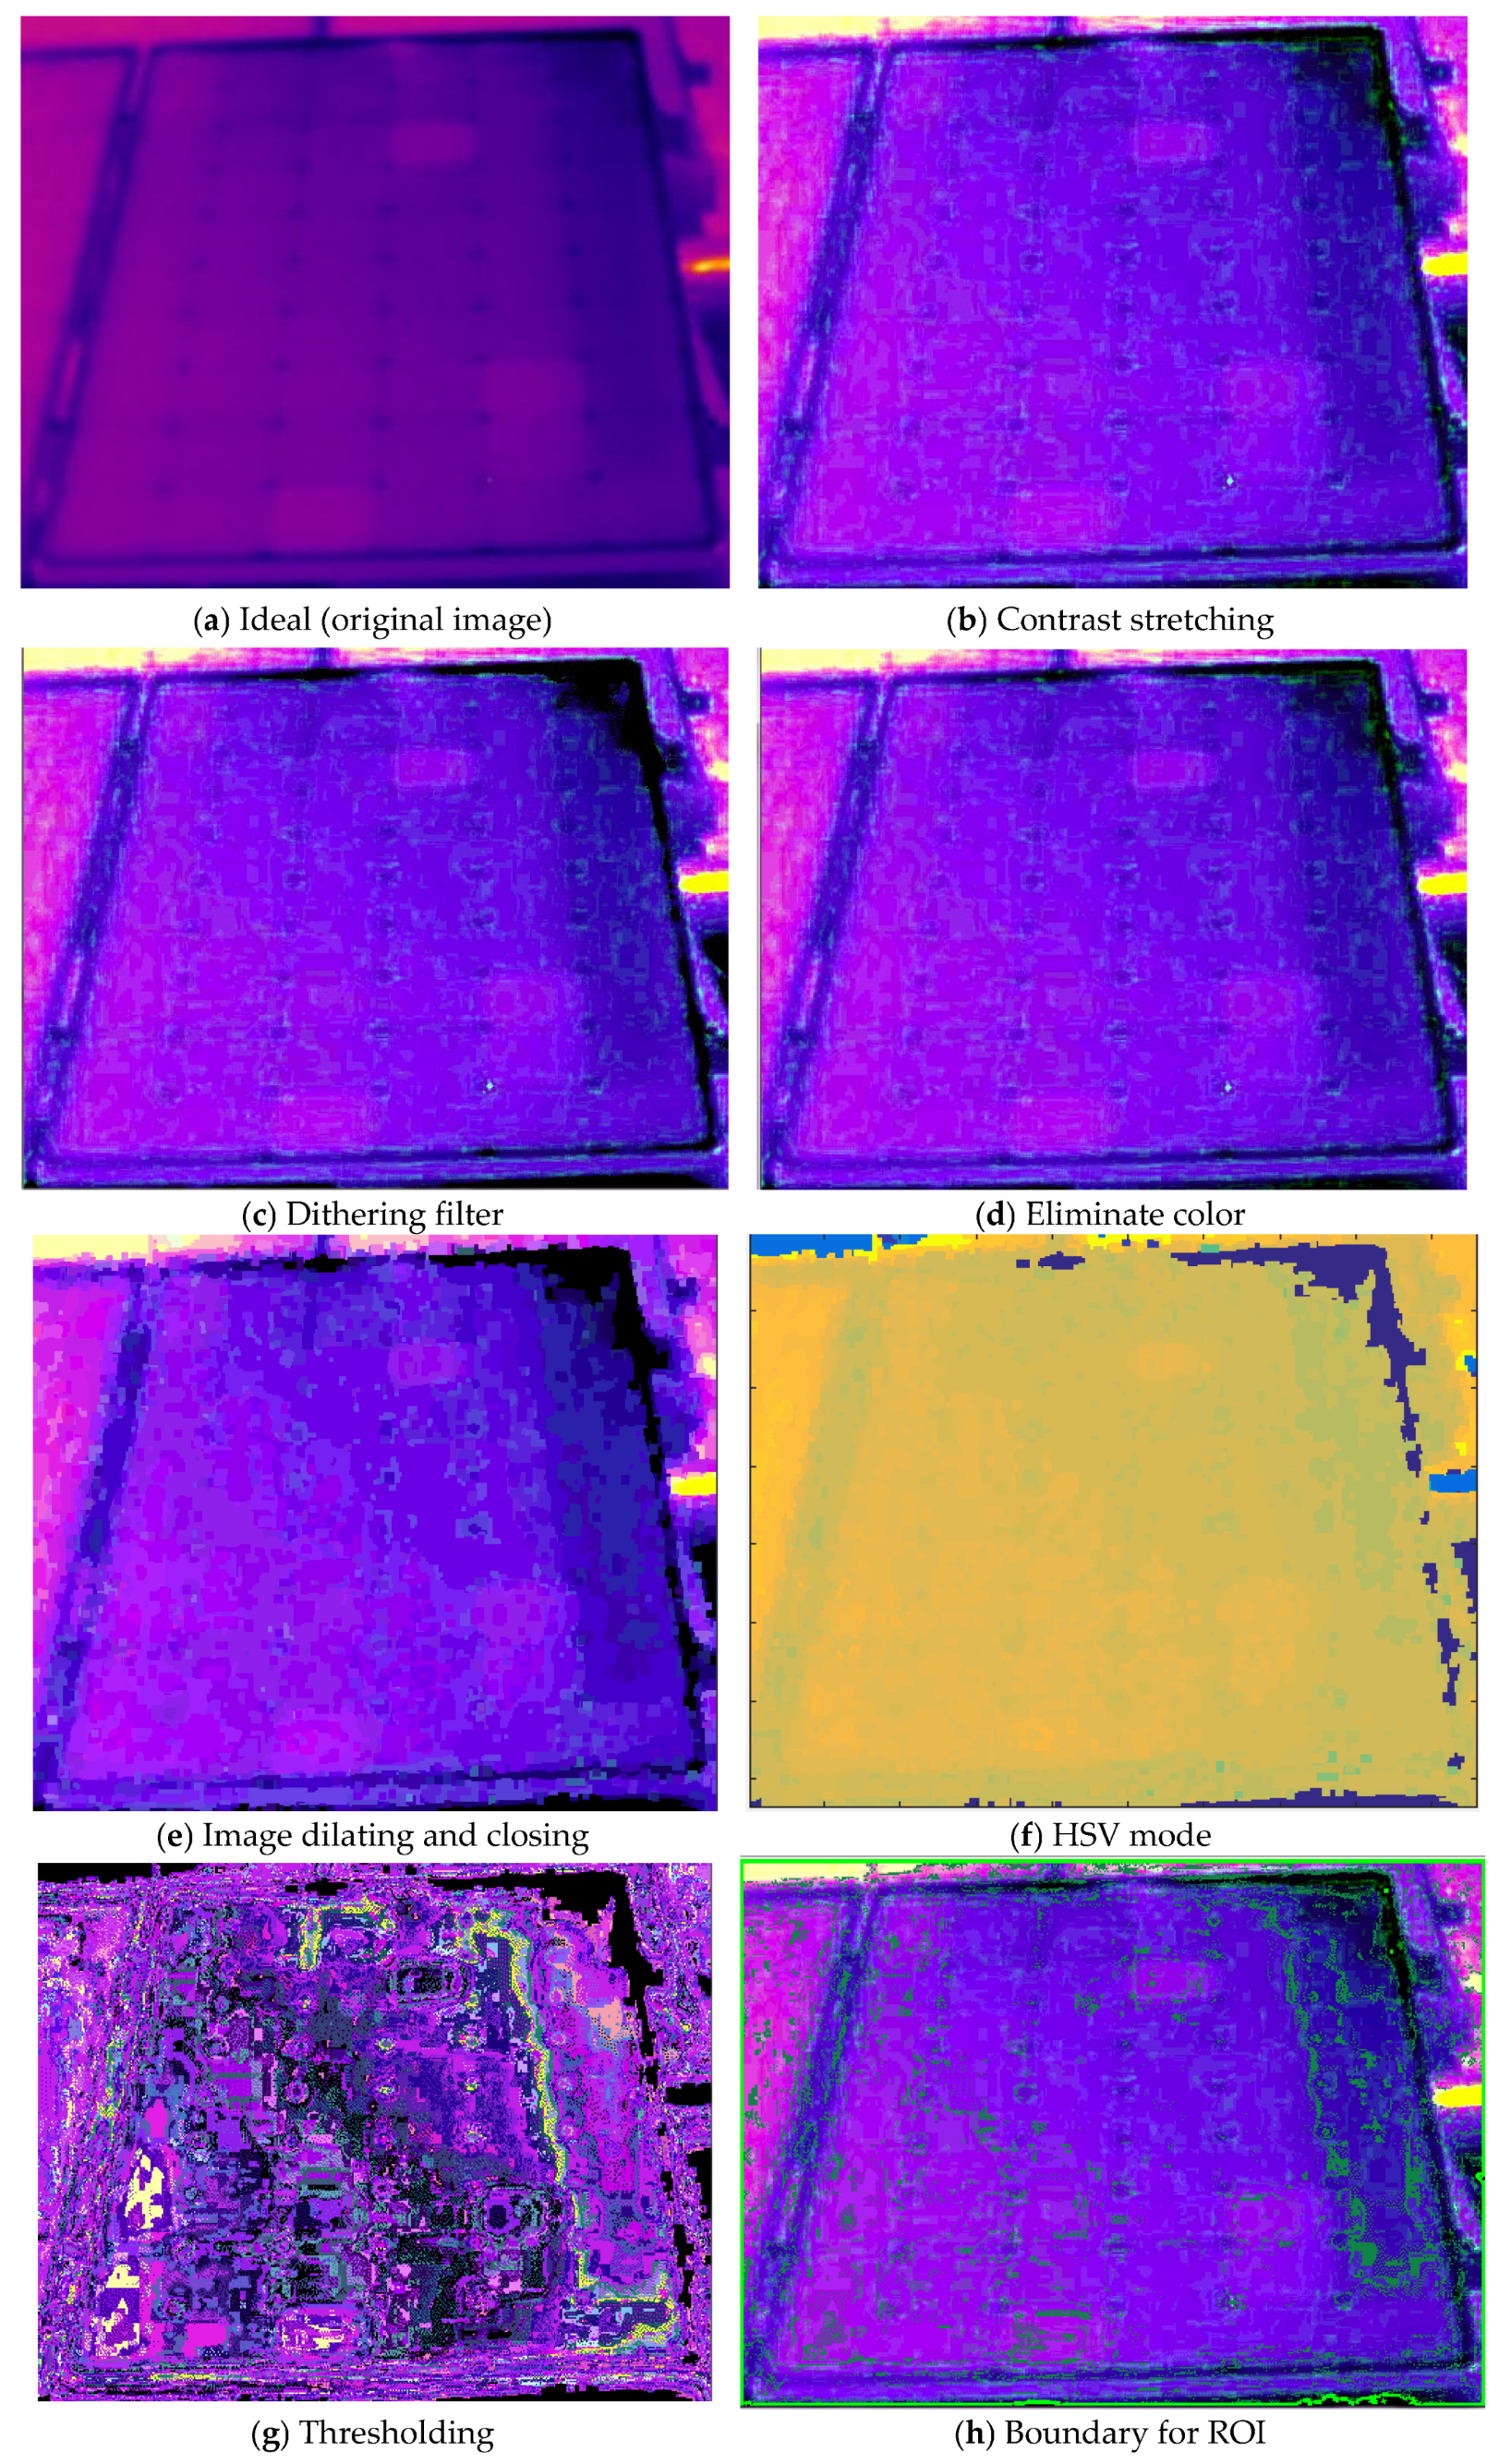
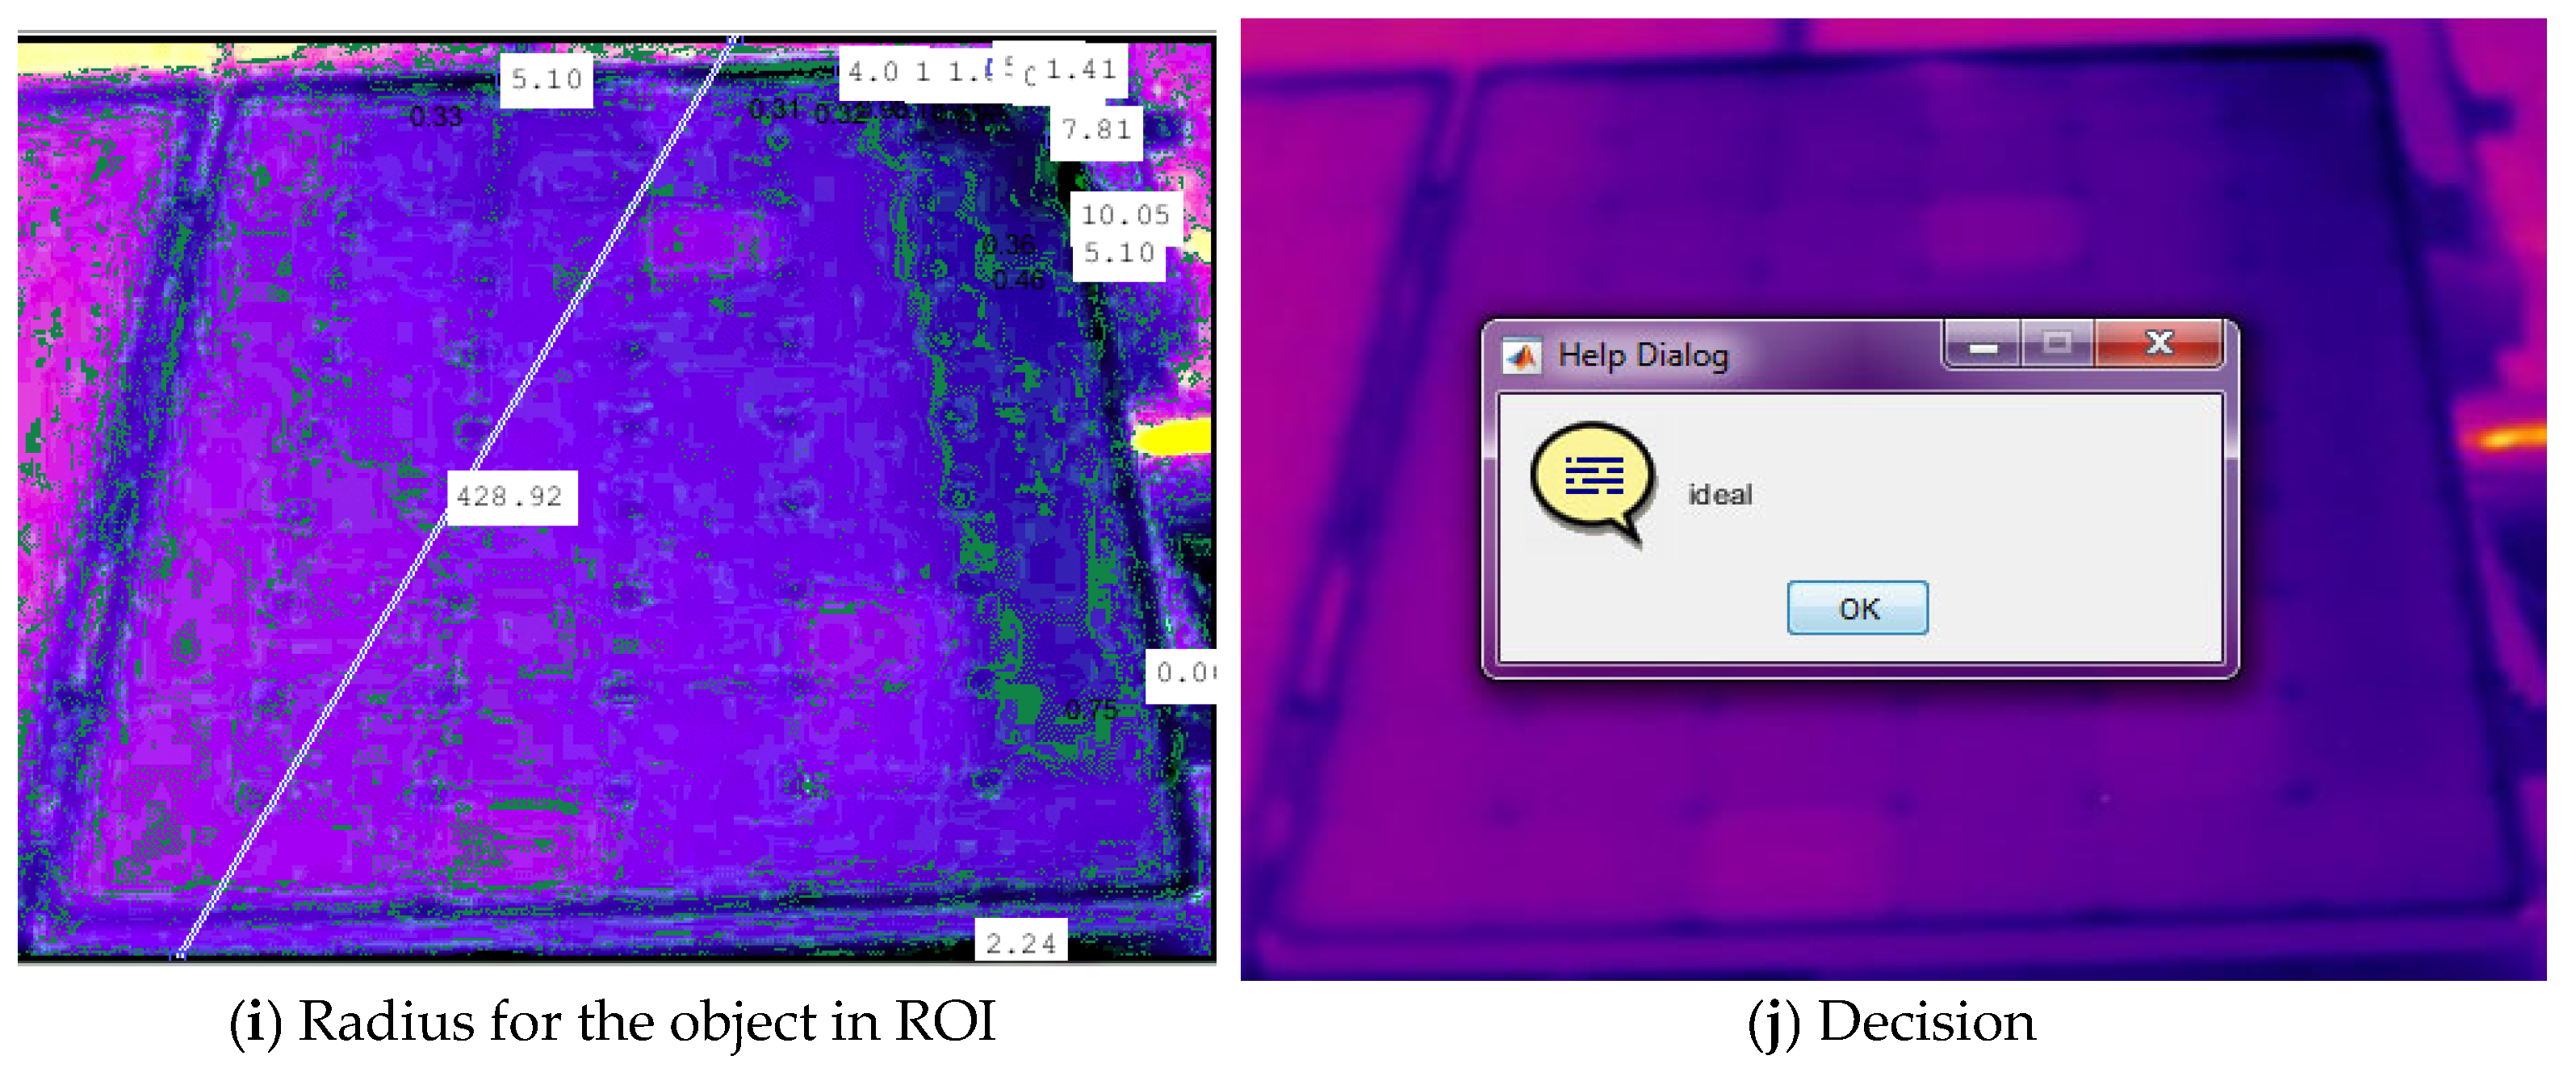
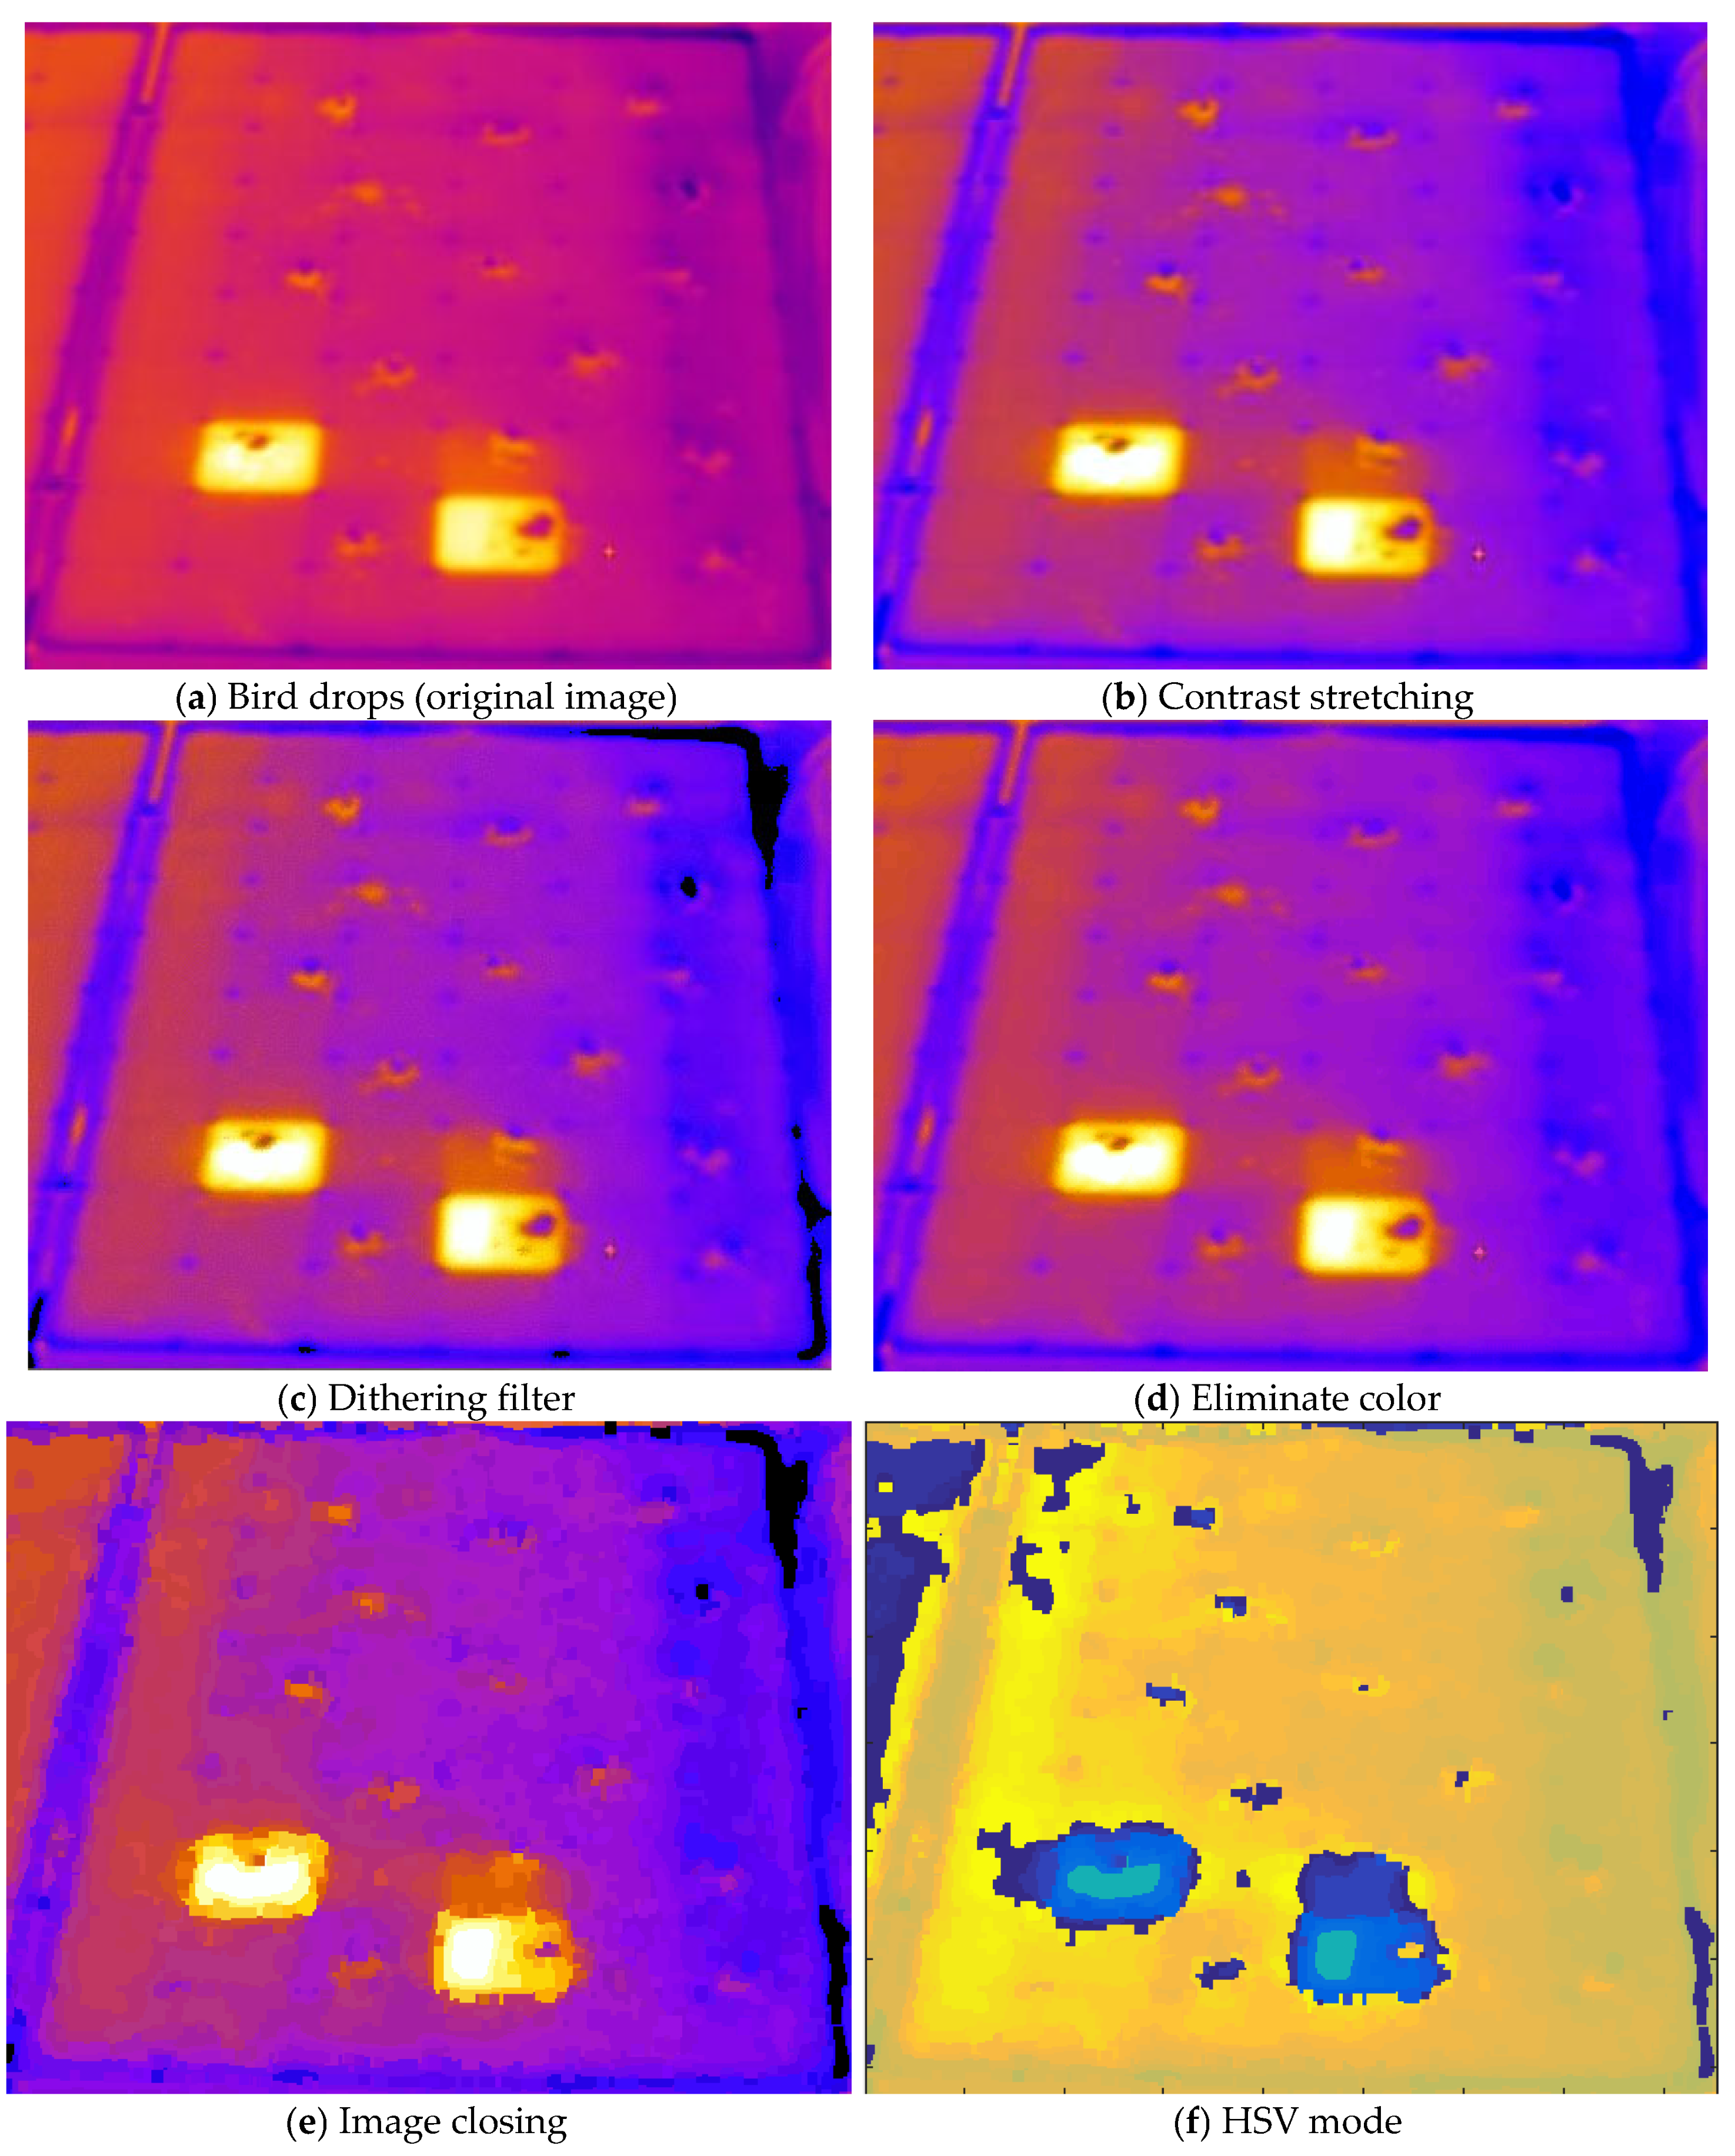
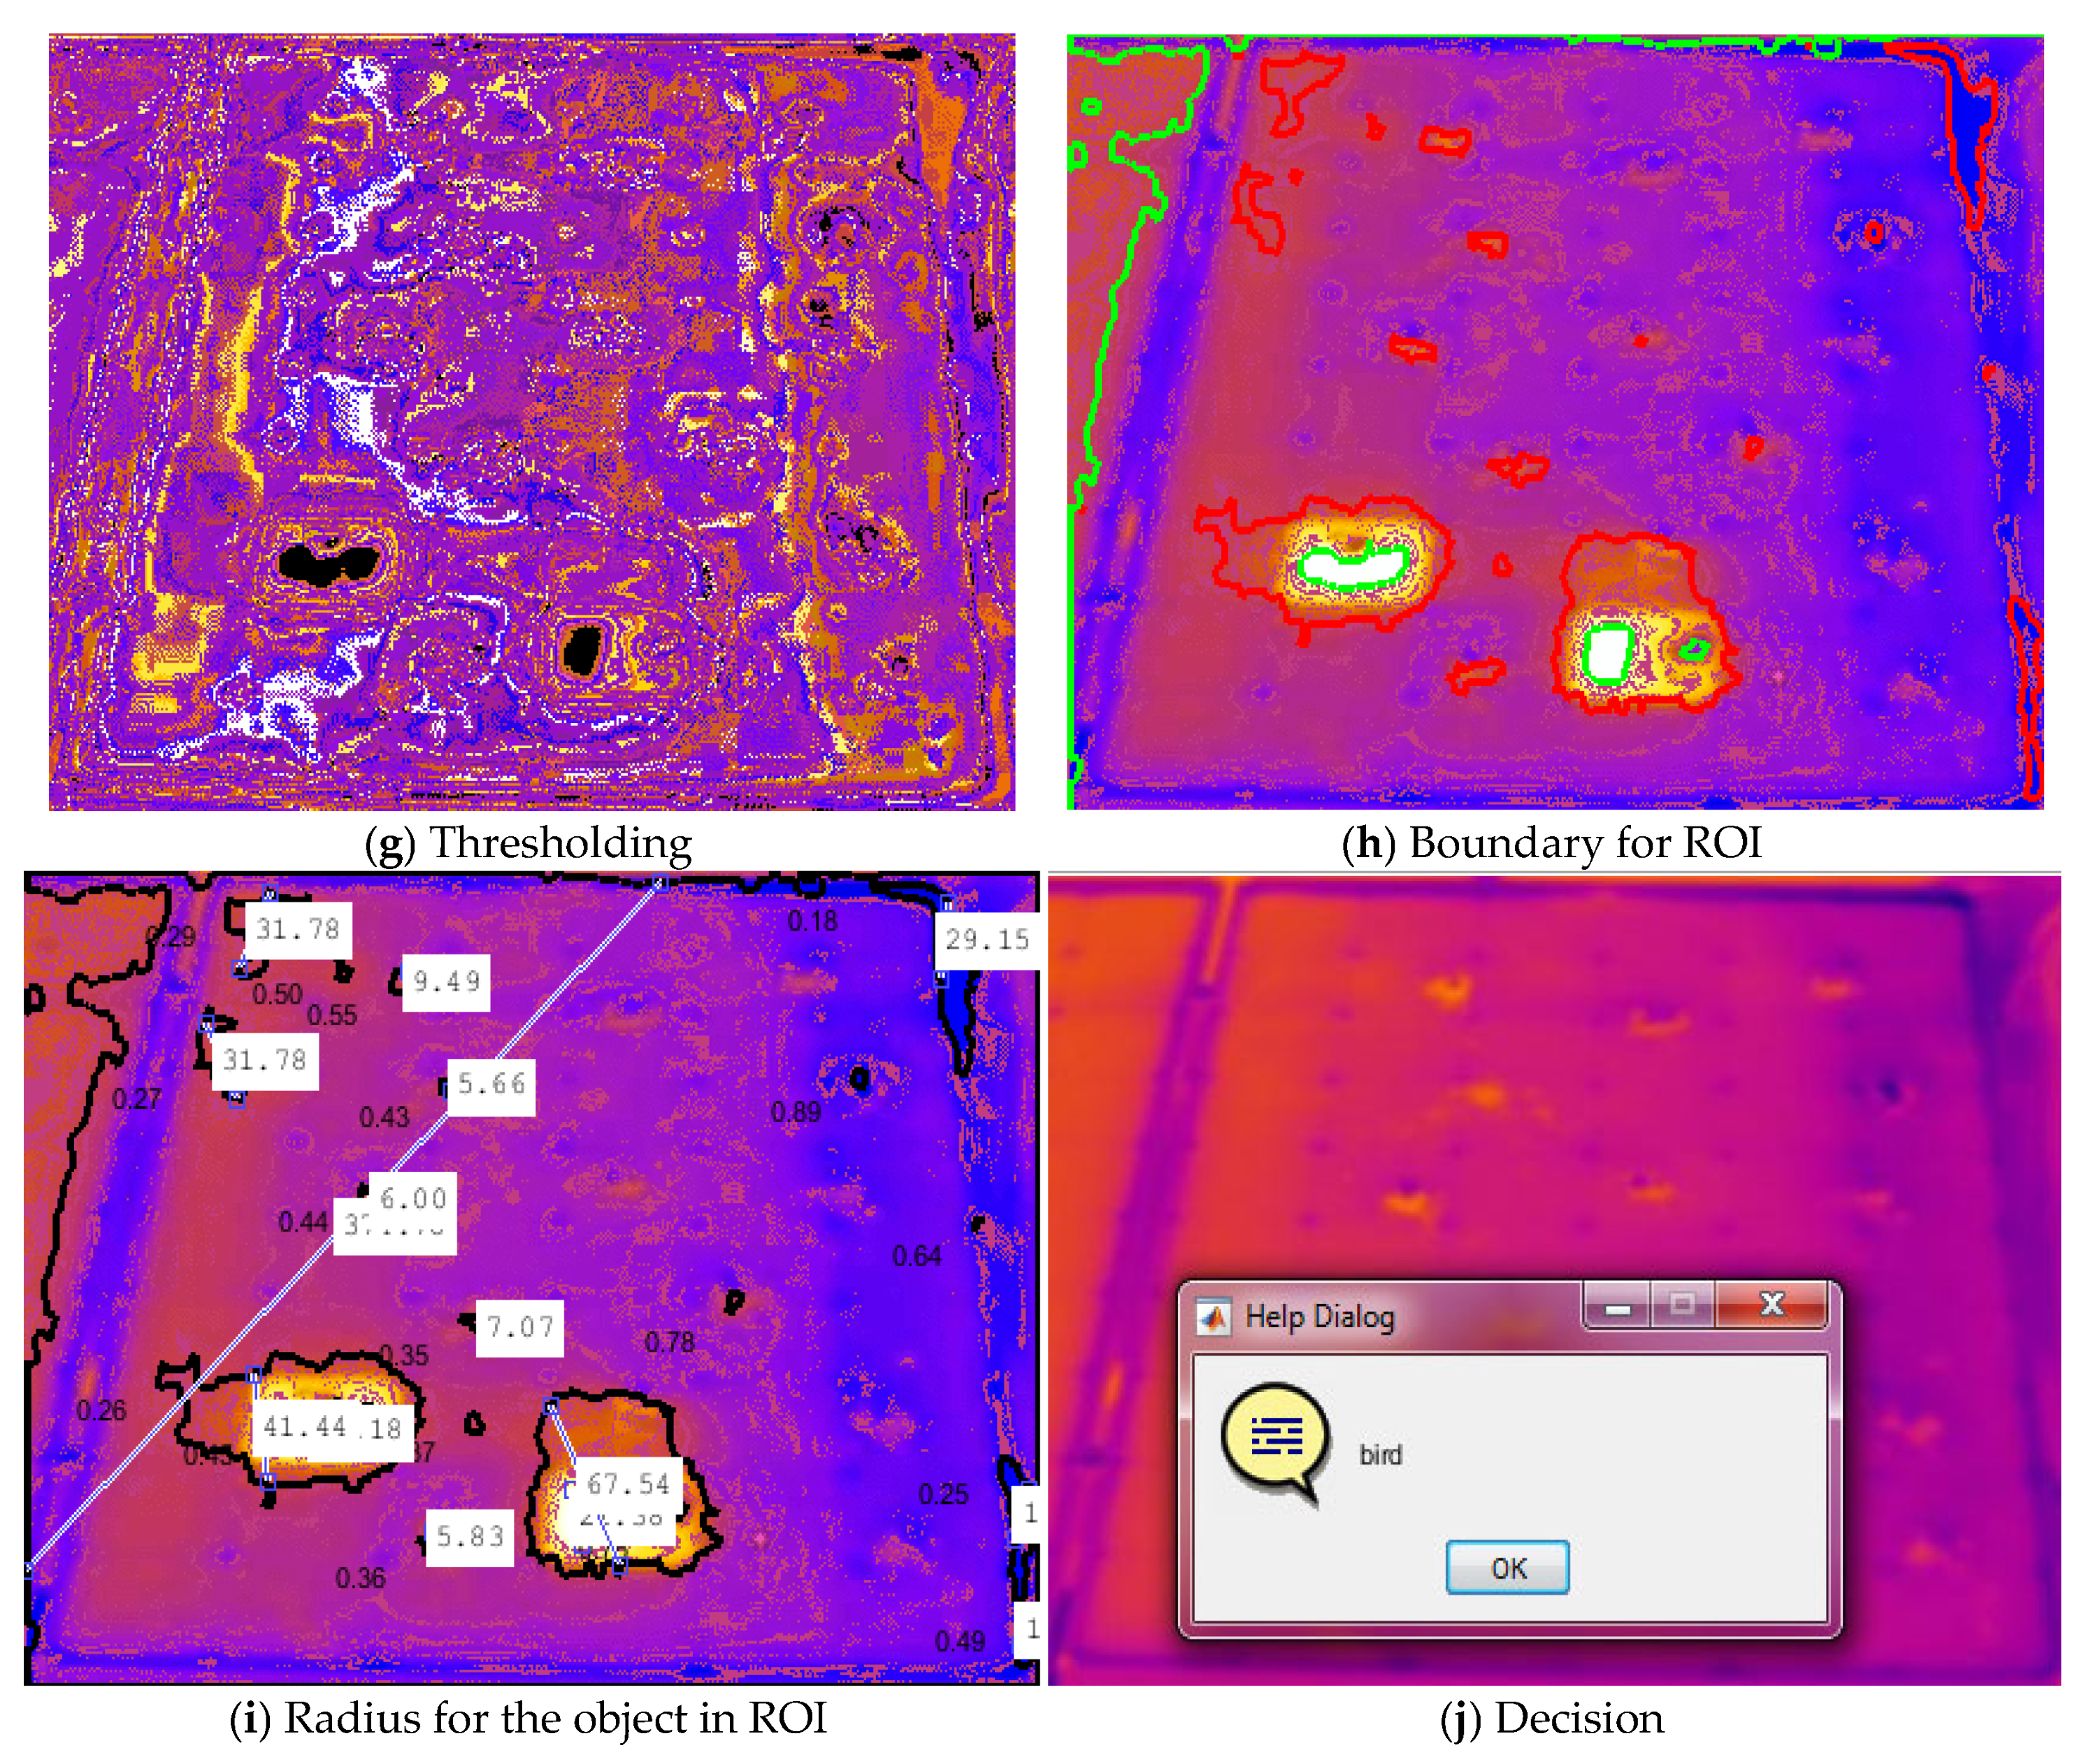
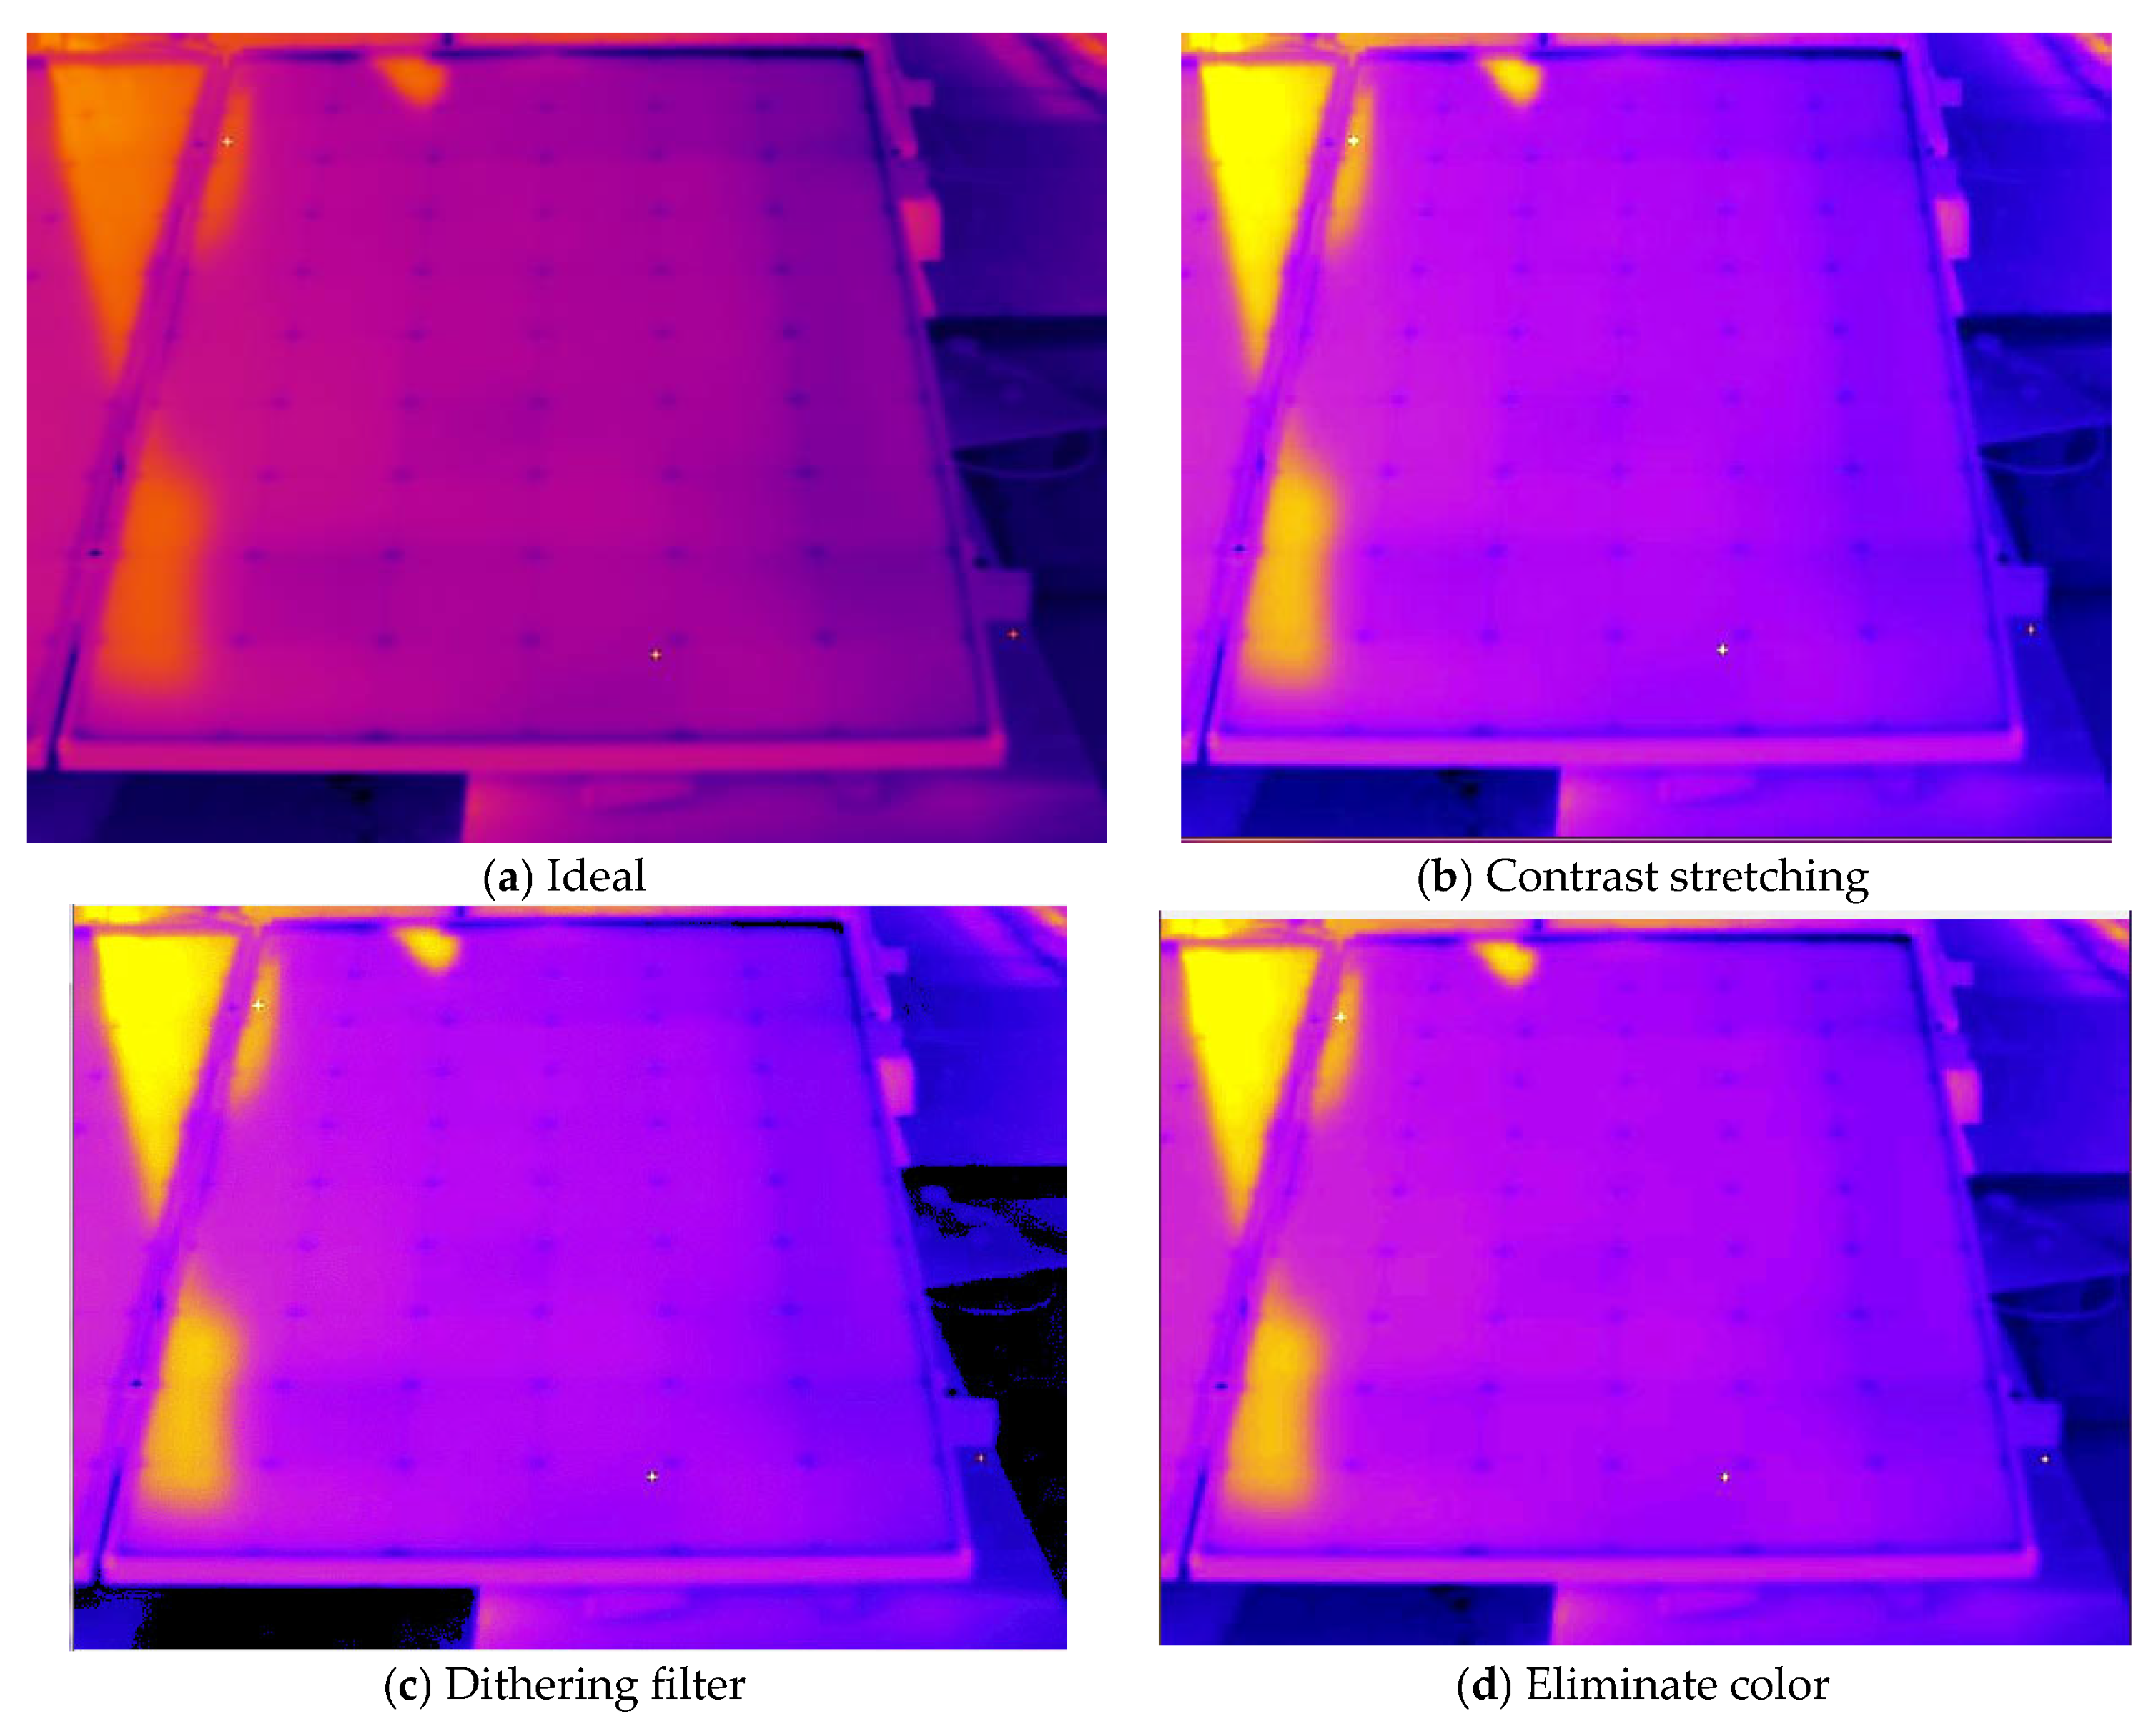
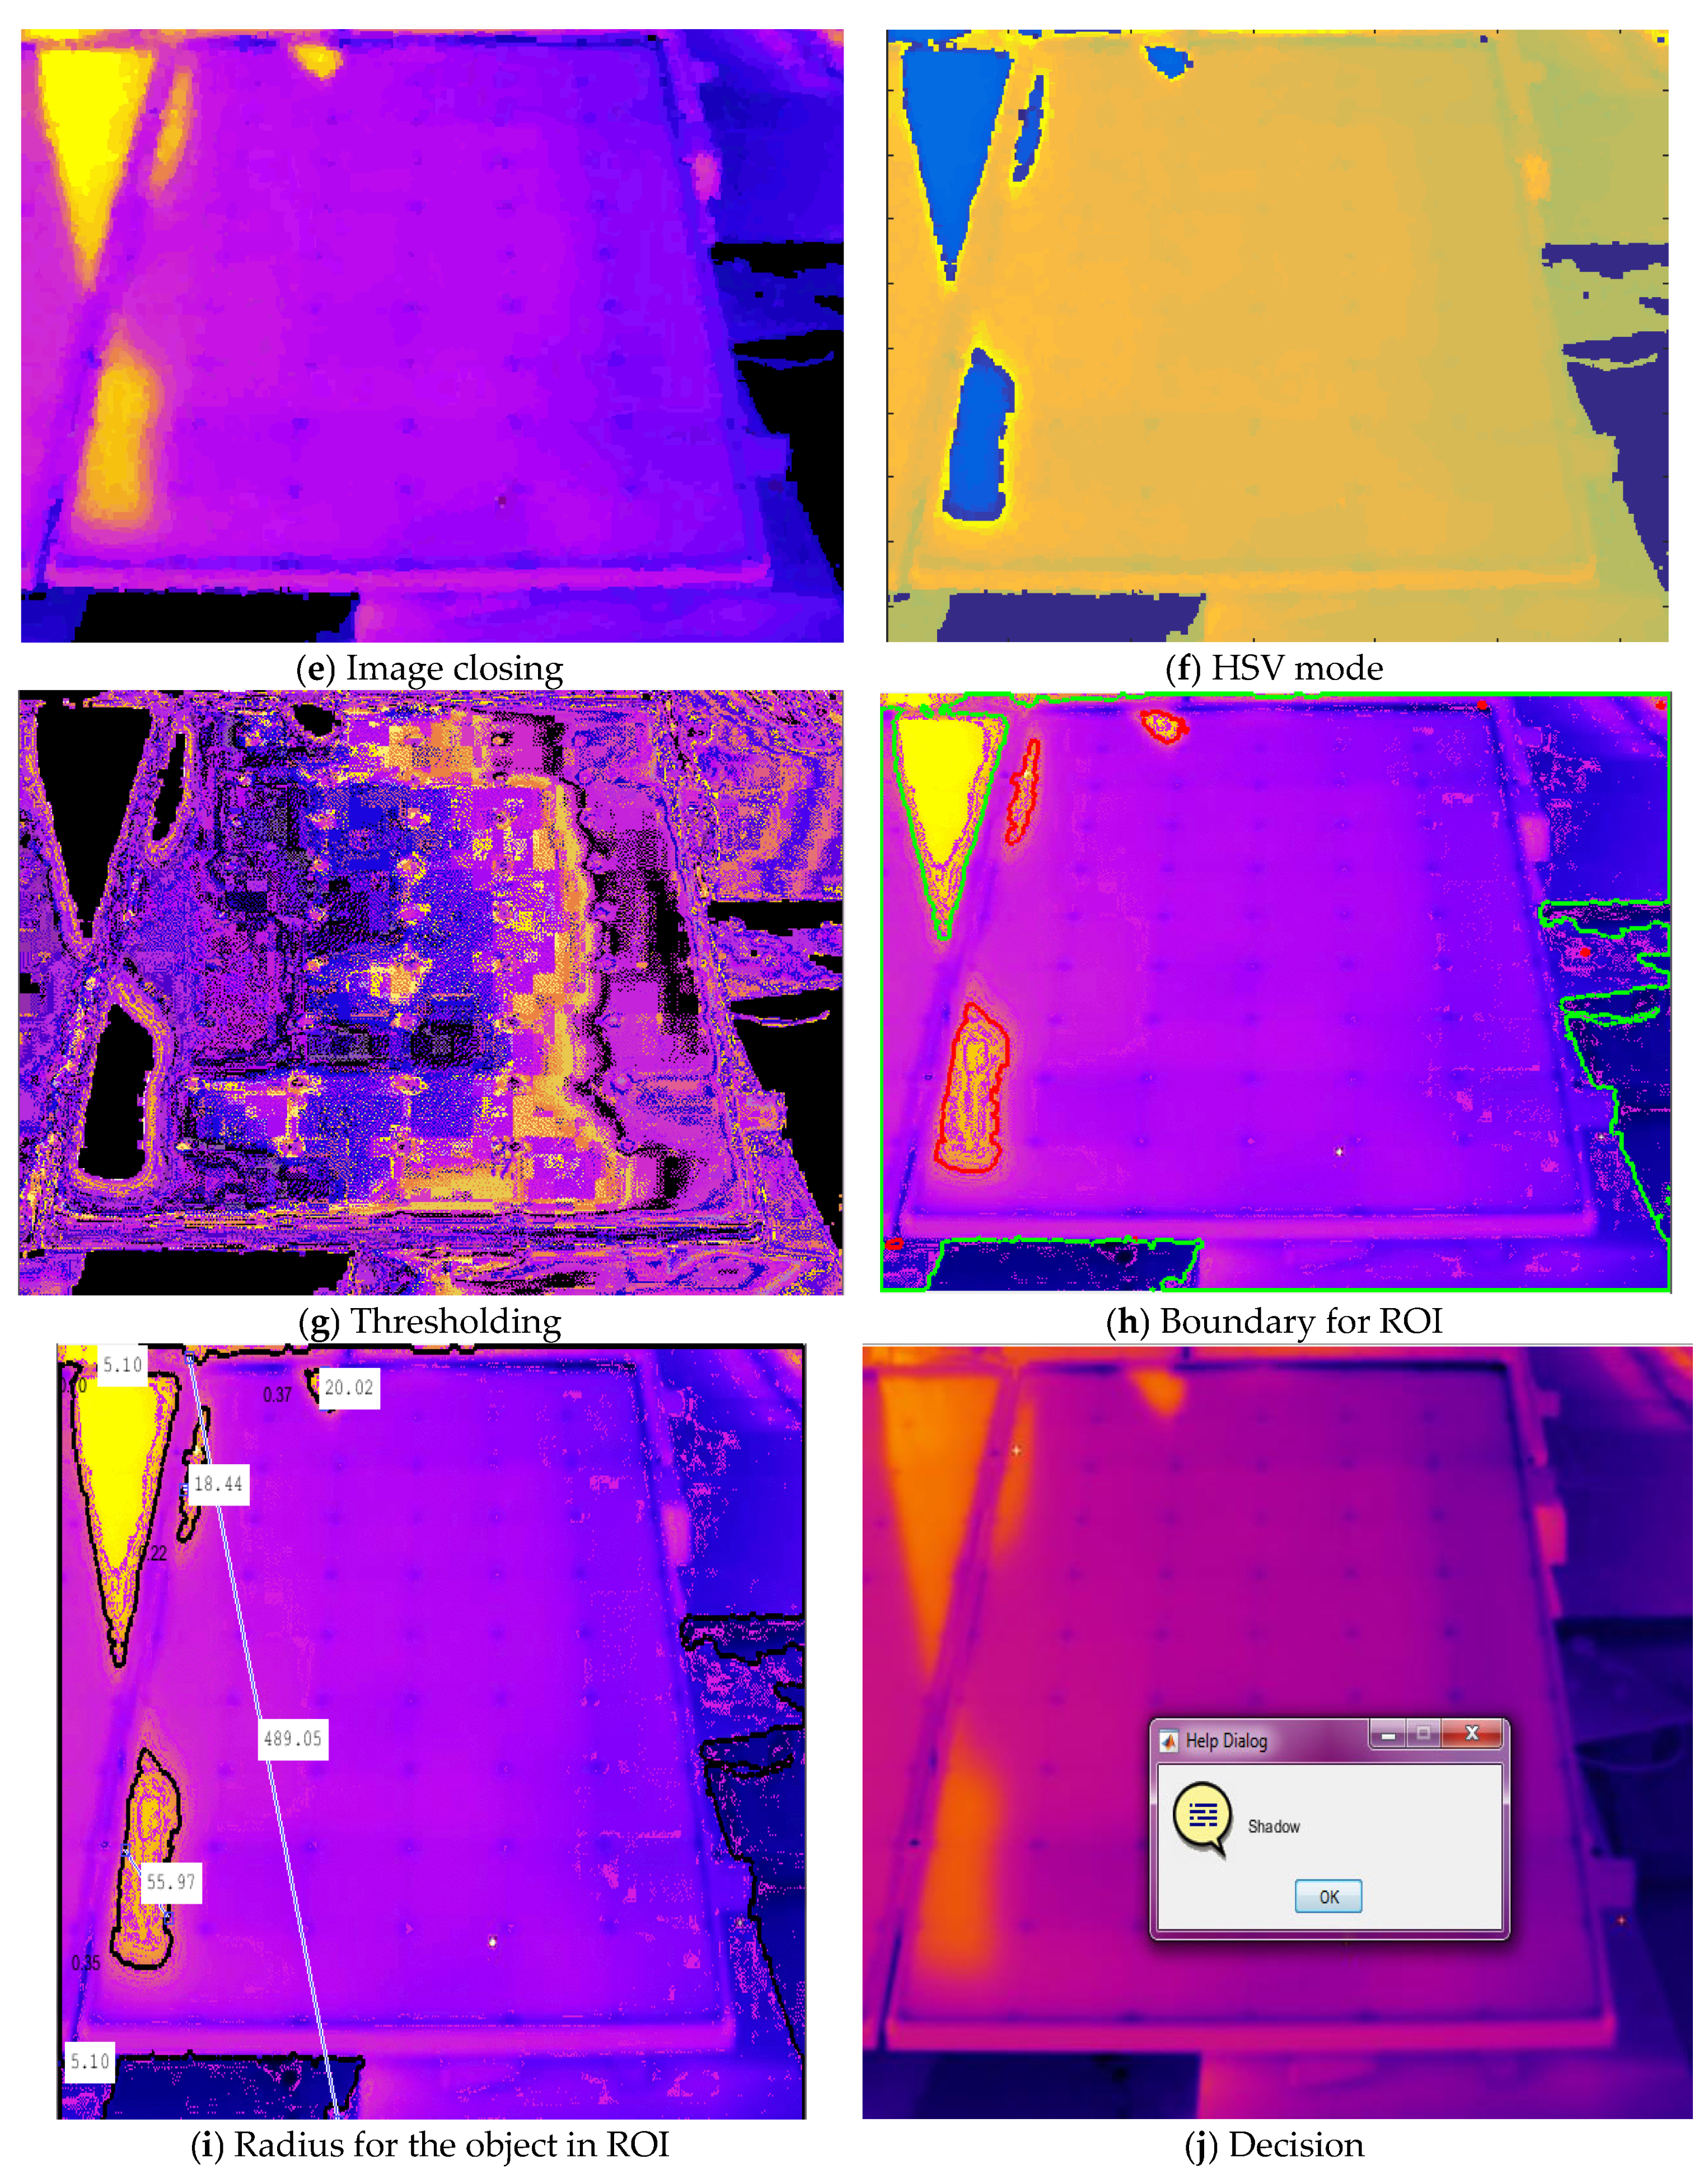
Figure A1, Figure A2 and Figure A3 illustrate a sample of detecting the type of hot spot in thermal images.
Figure A1. Steps for detecting the thermal image in the ideal case.
Signals 07 00061 g0a1aSignals 07 00061 g0a1b
Figure A2. Steps for detecting thermal images in the bird drops case.
Signals 07 00061 g0a2aSignals 07 00061 g0a2b
Figure A3. Steps for detecting the thermal image for the shadow case.
Signals 07 00061 g0a3aSignals 07 00061 g0a3b

Appendix B

Detecting Power Losses
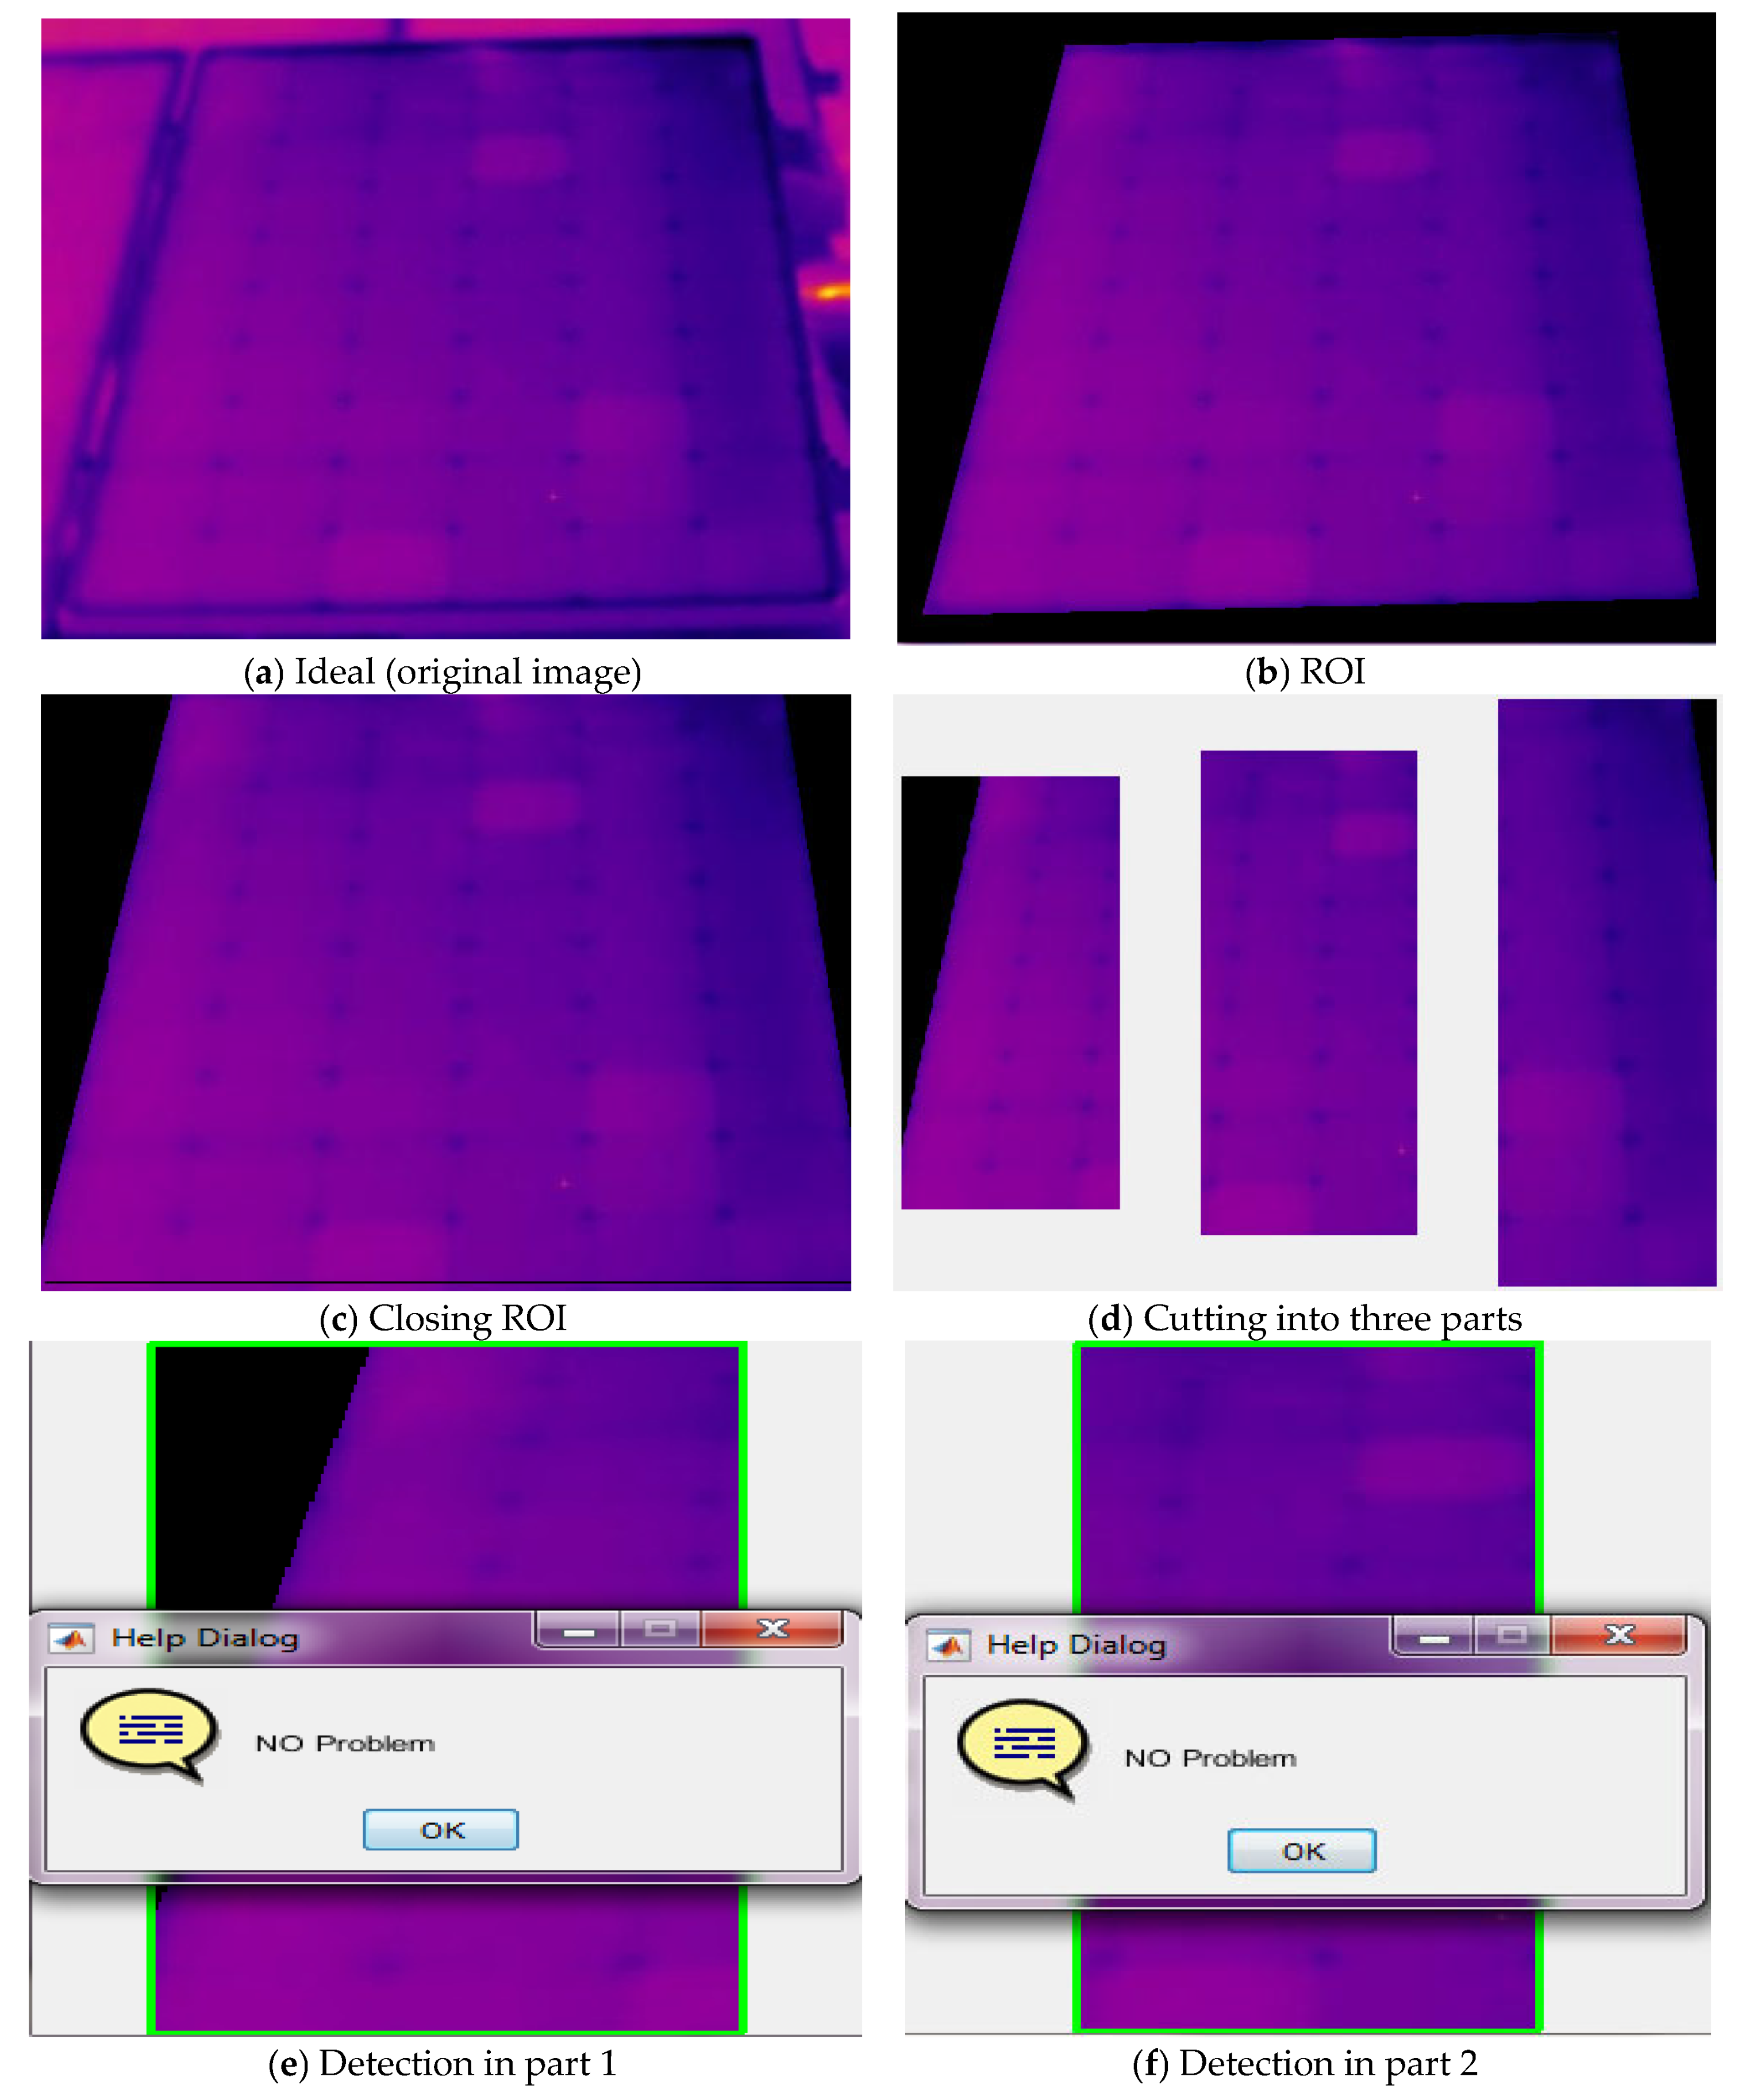
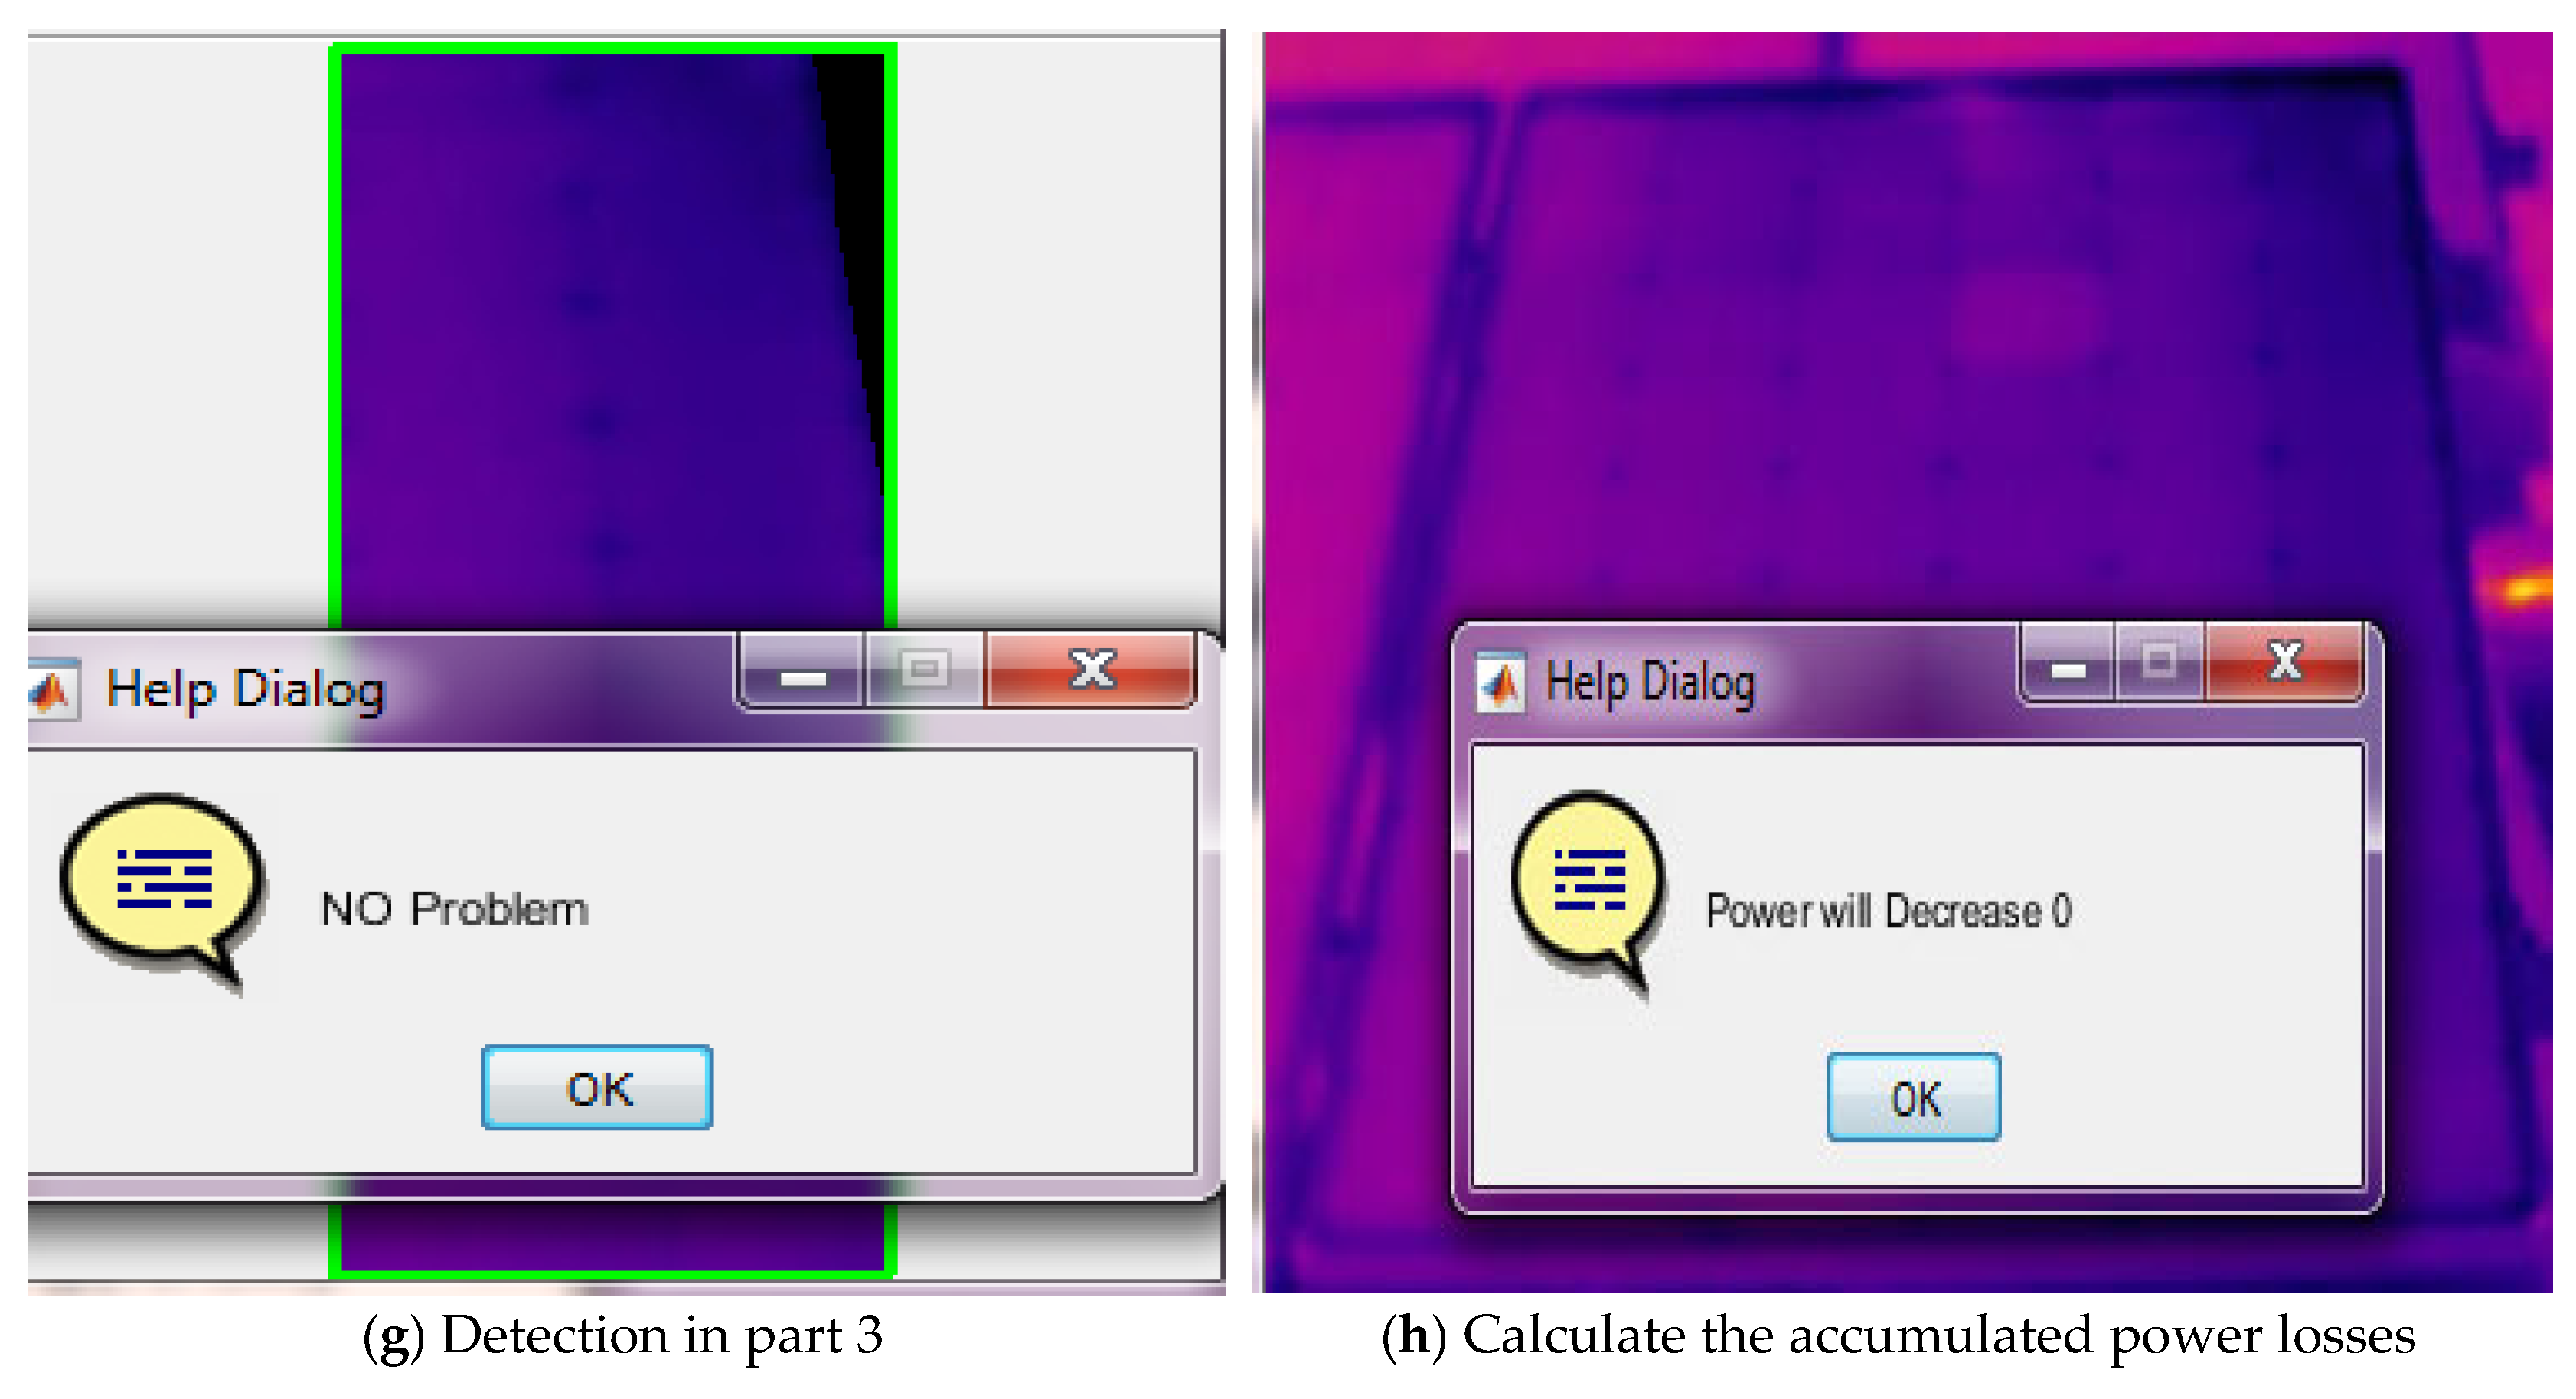
Figure A4, Figure A5 and Figure A6 illustrate a sample method for determining power losses from thermal images.
Figure A4. Steps for detecting power losses in the ideal case.
Signals 07 00061 g0a4aSignals 07 00061 g0a4b
Figure A5. Steps for detecting power losses in the bird drops case.
Signals 07 00061 g0a5aSignals 07 00061 g0a5b
Figure A6. Steps for detecting power losses in the shadow case.
Signals 07 00061 g0a6aSignals 07 00061 g0a6b

References

  1. Alrikabi, N. Renewable energy types. J. Clean Energy Technol. 2014, 2, 61–64. [Google Scholar] [CrossRef]
  2. I. Institute for E. Research. Spain Increases Its Renewable Share but Soon May Need to Replace Its Windmills. 2024. Available online: https://www.instituteforenergyresearch.org/renewable/spain-increases-its-renewable-share-but-soon-may-need-to-replace-its-windmills/ (accessed on 4 September 2024).
  3. Brice, C.W. Infrared Detection of Hot Spots in Energized Electrical Equipment. IEEE Trans. Ind. Appl. 1979, IA-15, 319–322. [Google Scholar] [CrossRef]
  4. Dhimish, M.; Holmes, V.; Mather, P.; Sibley, M. Novel hot spot mitigation technique to enhance photovoltaic solar panels output power performance. Sol. Energy Mater. Sol. Cells 2018, 179, 72–79. [Google Scholar] [CrossRef]
  5. Wohlgemuth, J.H.; Kurtz, S.R. How can we make PV modules safer? In 2012 38th IEEE Photovoltaic Specialists Conference; IEEE: Piscataway, NJ, USA, 2012; pp. 3162–3165. [Google Scholar]
  6. Harishkumar, S.; Mohammed, V.R.; Mujtaba, B.M. Detection of hot spots by thermal imaging to protect power equipments. Int. J. Stud. Res. Technol. Manag. 2014, 2, 64–66. [Google Scholar]
  7. Nikawa, K. Failure analysis in Si device chips. IEICE Trans. Electron. 1994, 77, 528–534. [Google Scholar]
  8. Khurana, N.; Chiang, C.L. Analysis of product hot electron problems by gated emission microscopy. In 24th International Reliability Physics Symposium; IEEE: Piscataway, NJ, USA, 1986; pp. 189–194. [Google Scholar]
  9. Hiatt, J. A method of detecting hot spots on semiconductors using liquid crystals. In 19th International Reliability Physics Symposium; IEEE: Piscataway, NJ, USA, 1981; pp. 130–133. [Google Scholar]
  10. Haraguchi, K. Detection of defect point and failure analysis in semiconductor devices by OBIC. In Proceedings of the Electron Beam Testing Symposium, Osaka, Japan, 2–4 December 1992. [Google Scholar]
  11. Cole, E.I.; Soden, J.M.; Rife, J.L.; Barton, D.L.; Henderson, C.L. Novel failure analysis techniques using photon probing with a scanning optical microscope. In Proceedings of 1994 IEEE International Reliability Physics Symposium; IEEE: Piscataway, NJ, USA, 1994; pp. 388–398. [Google Scholar]
  12. Lai, J.; Chandrachood, M.; Majumda, A.; Carrejo, J.P. Thermal detection of device failure by atomic force microscopy. IEEE Electron Device Lett. 1995, 16, 312–315. [Google Scholar] [CrossRef]
  13. Ishino, R. Detection of a faulty power distribution apparatus by using thermal images. In 2002 IEEE Power Engineering Society Winter Meeting. Conference Proceedings (Cat. No. 02CH37309); IEEE: Piscataway, NJ, USA, 2002; pp. 1332–1337. [Google Scholar]
  14. Li, B.; Zhu, X.; Zhao, S.; Niu, W. HV power equipment diagnosis based on infrared imaging analyzing. In 2006 International Conference on Power System Technology; IEEE: Piscataway, NJ, USA, 2006; pp. 1–4. [Google Scholar]
  15. Karakose, M.; Baygin, M. Image processing based analysis of moving shadow effects for reconfiguration in PV arrays. In 2014 IEEE International Energy Conference (ENERGYCON); IEEE: Piscataway, NJ, USA, 2014; pp. 683–687. [Google Scholar]
  16. Aghaei, M.; Gandelli, A.; Grimaccia, F.; Leva, S.; Zich, R.E. IR real-time analyses for PV system monitoring by digital image processing techniques. In 2015 International Conference on Event-Based Control, Communication, and Signal Processing (Ebccsp); IEEE: Piscataway, NJ, USA, 2015; pp. 1–6. [Google Scholar]
  17. Hepp, J.; Machui, F.; Egelhaaf, H.; Brabec, C.J.; Vetter, A. Automatized analysis of IR-images of photovoltaic modules and its use for quality control of solar cells. Energy Sci. Eng. 2016, 4, 363–371. [Google Scholar]
  18. Jung, H.-H.; Lyou, J. Matching of thermal and color images with application to power distribution line fault detection. In 2015 15th International Conference on Control, Automation and Systems (ICCAS); IEEE: Piscataway, NJ, USA, 2015; pp. 1389–1392. [Google Scholar]
  19. Wronkowicz, A. Approach to automated hot spot detection using image processing for thermographic inspections of power transmission lines. Diagnostyka 2016, 17, 81–86. [Google Scholar]
  20. Qasem, H.; Mnatsakanyan, A.; Banda, P. Assessing dust on PV modules using image processing techniques. In 2016 IEEE 43rd Photovoltaic Specialists Conference (PVSC); IEEE: Piscataway, NJ, USA, 2016; pp. 2066–2070. [Google Scholar]
  21. Mohd, M.R.S.; Herman, S.H.; Sharif, Z. Application of K-Means clustering in hot spot detection for thermal infrared images. In 2017 IEEE Symposium on Computer Applications & Industrial Electronics (ISCAIE); IEEE: Piscataway, NJ, USA, 2017; pp. 107–110. [Google Scholar]
  22. Alsafasfeh, M.; Abdel-Qader, I.; Bazuin, B. Fault detection in photovoltaic system using SLIC and thermal images. In 2017 8th International Conference on Information Technology (ICIT); IEEE: Piscataway, NJ, USA, 2017; pp. 672–676. [Google Scholar]
  23. Suguna, M.; Roomi, S.M.M.; Sanofer, I. Fault localisation of electrical equipments using thermal imaging technique. In 2016 International Conference on Emerging Technological Trends (ICETT); IEEE: Piscataway, NJ, USA, 2016; pp. 1–3. [Google Scholar]
  24. Monicka, S.G.; Manimegalai, D.; Karthikeyan, M.; Gunasekari, R. Image Processing Based Hotspot Detection on Photovoltaic Panels. Int. J. Intell. Syst. Appl. Eng. 2023, 11, 510–518. [Google Scholar]
  25. Dhimish, M.; Mather, P.; Holmes, V. Novel photovoltaic hot-spotting fault detection algorithm. IEEE Trans. Device Mater. Reliab. 2019, 19, 378–386. [Google Scholar] [CrossRef]
  26. Chen, H.; Yi, H.; Jiang, B.; Zhang, K.; Chen, Z. Data-driven detection of hot spots in photovoltaic energy systems. IEEE Trans. Syst. Man Cybern. Syst. 2019, 49, 1731–1738. [Google Scholar] [CrossRef]
  27. Lee, S.; An, K.E.; Jeon, B.D.; Cho, K.Y.; Lee, S.J.; Seo, D. Detecting faulty solar panels based on thermal image processing. In 2018 IEEE International Conference on Consumer Electronics (ICCE); IEEE: Piscataway, NJ, USA, 2018; pp. 1–2. [Google Scholar]
  28. Dhimish, M.; Badran, G. Photovoltaic hot-spots fault detection algorithm using fuzzy systems. IEEE Trans. Device Mater. Reliab. 2019, 19, 671–679. [Google Scholar] [CrossRef]
  29. Natarajan, K.; Bala, P.K.; Sampath, V. Fault detection of solar PV system using SVM and thermal image processing. Int. J. Renew. Energy Res. 2020, 10, 967–977. [Google Scholar] [CrossRef]
  30. Açikgöz, H.; Korkmaz, D.; Dandil, Ç. Classification of Hotspots in Photovoltaic Modules with Deep Learning Methods. Turk. J. Sci. Technol. 2022, 17, 211–221. [Google Scholar] [CrossRef]
  31. Henry, C.; Poudel, S.; Lee, S.-W.; Jeong, H. Automatic detection system of deteriorated PV modules using drone with thermal camera. Appl. Sci. 2020, 10, 3802. [Google Scholar] [CrossRef]
  32. Wang, Q.; Paynabar, K.; Pacella, M. Online automatic anomaly detection for photovoltaic systems using thermography imaging and low rank matrix decomposition. J. Qual. Technol. 2022, 54, 503–516. [Google Scholar]
  33. Liu, J.; Ji, N. A bright spot detection and analysis method for infrared photovoltaic panels based on image processing. Front. Energy Res. 2023, 10, 978247. [Google Scholar] [CrossRef]
  34. Masita, K.; Hasan, A.; Shongwe, T.; Hilal, H.A. Deep Learning in Defects detection of PV modules: A Review. Sol. Energy Adv. 2025, 5, 100090. [Google Scholar] [CrossRef]
  35. Cardinale-Villalobos, L.; Jimenez-Delgado, E.; García-Ramírez, Y.; Araya-Solano, L.; Solís-García, L.A.; Méndez-Porras, A.; Alfaro-Velasco, J. IoT system based on artificial intelligence for hot spot detection in photovoltaic modules for a wide range of irradiances. Sensors 2023, 23, 6749. [Google Scholar] [CrossRef] [PubMed]
  36. Ahmed, W. Enhancing solar PV reliability with hybrid local features and infrared thermography. Energy Rep. 2025, 13, 345–352. [Google Scholar]
  37. Solomon, C.; Breckon, T. Fundamentals of Digital Image Processing: A Practical Approach with Examples in Matlab; John Wiley & Sons: Hoboken, NJ, USA, 2011. [Google Scholar]
  38. Burger, W.; Burge, M.J. Digital Image Processing: An Algorithmic Introduction; Springer Nature: Berlin/Heidelberg, Germany, 2022. [Google Scholar]
  39. Daliento, S.; Di Napoli, F.; Guerriero, P.; d’Alessandro, V. A modified bypass circuit for improved hot spot reliability of solar panels subject to partial shading. Sol. Energy 2016, 134, 211–218. [Google Scholar] [CrossRef]
  40. Akram, M.W.; Li, G.; Jin, Y.; Chen, X.; Zhu, C.; Zhao, X.; Aleem, M.; Ahmad, A. Improved outdoor thermography and processing of infrared images for defect detection in PV modules. Sol. Energy 2019, 190, 549–560. [Google Scholar] [CrossRef]
  41. Ghosh, A. Soiling losses: A barrier for India’s energy security dependency from photovoltaic power. Challenges 2020, 11, 9. [Google Scholar] [CrossRef]
  42. Haque, A.; Bharath, K.V.S.; Khan, M.A.; Khan, I.; Jaffery, Z.A. Fault diagnosis of photovoltaic modules. Energy Sci. Eng. 2019, 7, 622–644. [Google Scholar] [CrossRef]
  43. Abderrezek, M.; Fathi, M. Experimental study of the dust effect on photovoltaic panels’ energy yield. Sol. Energy 2017, 142, 308–320. [Google Scholar] [CrossRef]
  44. Wendlandt, S.; Berthold, R.; Stegemann, B.; Suchaneck, O.; Hanusch, M.; Drobisch, A.; Berghold, J.; Schoppa, M.; Krauter, S.; Grunow, P. Thermal Stress Analysis at Encapsulation and Backsheet Materials for PV-Modules. In Proceedings of the 31st European Photovoltaic Solar Energy Conference and Exhibition, Hamburg, Germany, 14–18 September 2015. [Google Scholar]
  45. Sussex Solar. Available online: https://sussexsolar.com/ (accessed on 1 July 2025).
  46. Photovoltaic Inspections. Available online: https://monroeinfrared.com/infrared-inspections/ir-maintenance-inspections/pv-infrared-inspections/ (accessed on 1 July 2025).
Figure 1. Thermal images for different types of hot spots.
Signals 07 00061 g001
Figure 2. Detection and classification steps.
Signals 07 00061 g002
Figure 3. Finding the best thresholding value.
Signals 07 00061 g003
Figure 4. The flow chart is used for detecting the boundaries.
Signals 07 00061 g004
Figure 5. Taking a decision step flow chart.
Signals 07 00061 g005
Figure 6. Effect of shadow size on detection.
Signals 07 00061 g006
Figure 7. Results of detection and classification of bird drop hot spots.
Signals 07 00061 g007
Figure 8. Power (watts) vs. load (ohms) curve for a PV module affected by shadow.
Signals 07 00061 g008
Figure 9. Power (watts) vs. load (ohms) curve for a PV module affected by all types of birds.
Signals 07 00061 g009
Figure 10. Thermal images from the external database: (a) ideal, (b) bird drops (mud), and (c) shadow. Figure 10 (a-b) Reproduced from [41] under the Creative Commons CC BY license. (c) Reproduced from [42] under the CC BY 4 license.
Signals 07 00061 g010
Table 1. Classification accuracy obtained using different image preprocessing filters.
Correct DetectionError DetectionPercentage Error Accuracy
Without any filter81 images30 images27%73%
With the median filter85 images26 images23.4%76.6%
With Gaussian filtering87 images24 images21.6%78.4%.
With a dithering filter90 images21 images18.9%81.1%
Table 2. Percentage error for detection images.
Image TypeImage DetectionCorrect DetectionPercentage Error
Ideal5 images5 images0%
Shadow76 images71 images6.57%
Bird drops (mud)30 images28 images6.67%
Total111 images104 images6.3%
Disclaimer/Publisher’s Note: The statements, opinions and data contained in all publications are solely those of the individual author(s) and contributor(s) and not of MDPI and/or the editor(s). MDPI and/or the editor(s) disclaim responsibility for any injury to people or property resulting from any ideas, methods, instructions or products referred to in the content.