1. Introduction
Airborne electromagnetic (AEM) surveys operate by transmitting electromagnetic signals into the ground via a transmitter coil mounted on an aircraft platform. These signals induce secondary electromagnetic fields within subsurface geological bodies, which are subsequently detected by onboard electromagnetic sensors [
1]. Analysis of these received signals enables the mapping of subsurface structures. However, during flight, platform vibrations cause the sensors to cut through the geomagnetic field, generating high-amplitude motion-induced noise that severely contaminates the weak geological response signals and degrades the system’s signal-to-noise ratio [
2,
3]. To acquire high-precision measurement data, it is essential to maintain the sensors in an optimal attitude through effective vibration isolation and control.
In modern AEM systems (e.g., SkyTEM, VTEM), both transmitter and receiver coils are typically housed within an aerodynamic pod suspended beneath a helicopter or fixed-wing aircraft [
4]. While this external configuration effectively minimizes electromagnetic interference from the airframe, it exposes the sensitive coils directly to turbulent airflow, landing impacts, and mechanical vibrations. Even sub-millimeter displacements or angular deviations of the coil can induce spurious voltages [
5], thereby corrupting early-time gate data critical for shallow imaging. Therefore, reducing vibrations transmitted from the pod to the coils and AEM sensors during flight is an effective way to improve system performance.
Granular materials exhibit good cushioning characteristics and have been widely applied in various fields such as aerospace, marine, mechanical, and civil engineering to reduce vibration and noise. Liang and Ji [
6,
7] studied the Cushioning effect of soil particles during spacecraft landing using a DEM-FEM coupling method. The results show that force-chain structures formed among particles can achieve spatiotemporal dispersion of impact energy; under oblique landing conditions, the energy absorption by particles is higher, effectively reducing the impact overload on the reentry capsule. Guo [
8] established a numerical model of a sand-gravel particle damper using PFC3D to investigate the influence of parameters on energy dissipation. The results indicate that rotational speed and fill ratio significantly affect the damper’s energy dissipation, while excitation amplitude has a relatively minor effect; this technology has been successfully applied to suppress longitudinal vibration in ship propulsion shafting. Song et al. [
9] applied particle dampers to naval floating raft isolation systems and used discrete element simulations to compare the energy dissipation performance of lead, steel, and glass particles. They found that lead particles at 85% fill ratio can achieve a vibration reduction of up to 68%. Liu et al. [
10] investigated the effects of particle material type, size, and number on the vibration response of mechanical components, confirming that steel particles exhibit excellent isolation performance in the mid-to-high frequency range. In addition, researchers have studied the seismic isolation performance of rubber-sand mixtures (RSM) through resonant column and cyclic triaxial tests, finding that adding 10–20% rubber particles significantly improves the damping ratio of the mixture and reduces seismic response acceleration by more than 35% [
11,
12,
13]. Although granular cushioning has achieved significant progress in these fields, its application in signal detection systems remains rarely reported. Given that such systems (e.g., airborne electromagnetic survey equipment) are extremely sensitive to micro-vibrations, introducing granular cushioning mechanisms may provide a new passive vibration isolation approach to suppress motion-induced noise and improve signal fidelity.
The cushioning performance of granular materials is governed by their intrinsic properties. During impact, particles may undergo plastic deformation or fragmentation, and viscous interactions among them contribute to energy absorption [
14,
15,
16]. In addition, force chain structures are formed among the particles, and the fracture and recombination of these force chains exhibit significant time effects. They expand the instantaneous local impact force in space and prolong it in time, thereby reducing the impact intensity [
17,
18,
19]. During the interaction process, the inelastic collisions between the particles enable the effective transfer of mechanical energy, and the sliding friction between the particles converts the mechanical energy of the system into heat energy, achieving the effect of dissipation [
20].
Under different impact conditions, there are obvious differences in the cushioning performance of granular materials. Currently, it is mainly characterized by the depth of the impact pit, the duration of the impact, and the impact force exerted on the bottom plate that carries the cushioning particles. The influence of the impact velocity, impact angle [
21], the physical and geometric properties of the impacting object, and the physical properties of the cushioning particles on the impact process is analyzed. Among them, the physical and geometric properties of the impacting object mainly include mass, particle size, density, elastic modulus, etc., and the physical properties of the cushioning particles mainly include density, elastic modulus, coefficient of restitution, and friction coefficient, as well as layer thickness and compactness. The arrangement of the cushioning particles can adjust the transmission direction of the contact force and the dispersion response, and the layer thickness of the cushioning particles affects the arrangement of the particles, thereby changing the transmission direction of the contact force. In addition, both experimental studies [
22,
23] and discrete element calculations [
24,
25,
26] have shown that when the impacting object impacts the cushioning particles, the impact load on the bottom plate presents two peaks in the time history. One peak occurs when the impacting object starts to contact the cushioning particles, and the other peak is caused by the reflected wave impacting the bottom surface [
27]. The research also found a critical thickness. When the layer thickness of the cushioning particles is less than the critical thickness, the impact load on the bottom plate decreases with the increase in the layer thickness. When the layer thickness is greater than the critical thickness, the impact force on the bottom plate no longer changes with the further increase in the layer thickness. Finding the determining factors and calculation methods of the critical thickness can not only improve the calculation efficiency of numerical calculations but also save costs in practical applications, which has economic benefits.
Cundall and Strack pioneered the Discrete Element Method (DEM), which is crucial for studying the mechanical behavior of granular materials and solving related engineering problems [
28]. Early developments focused on 2D disks and 3D spherical elements, but recent advancements have brought up sophisticated techniques to simulate non-spherical particles, like multi-sphere clumps [
29,
30], mosaic element configurations [
31,
32], extended polyhedral representations [
33,
34], and super-quadratic geometries [
35,
36]. Despite these refinements, challenges remain, especially in rapid contact detection and the development of strong contact force models [
37,
38]. The non-spherical particle construction has inherent complexity, and contact algorithms have limitations, which leads to high computational costs [
39,
40,
41]. Therefore, 3D spherical particles remain advantageous for fundamental research because they are computationally simple and efficient.
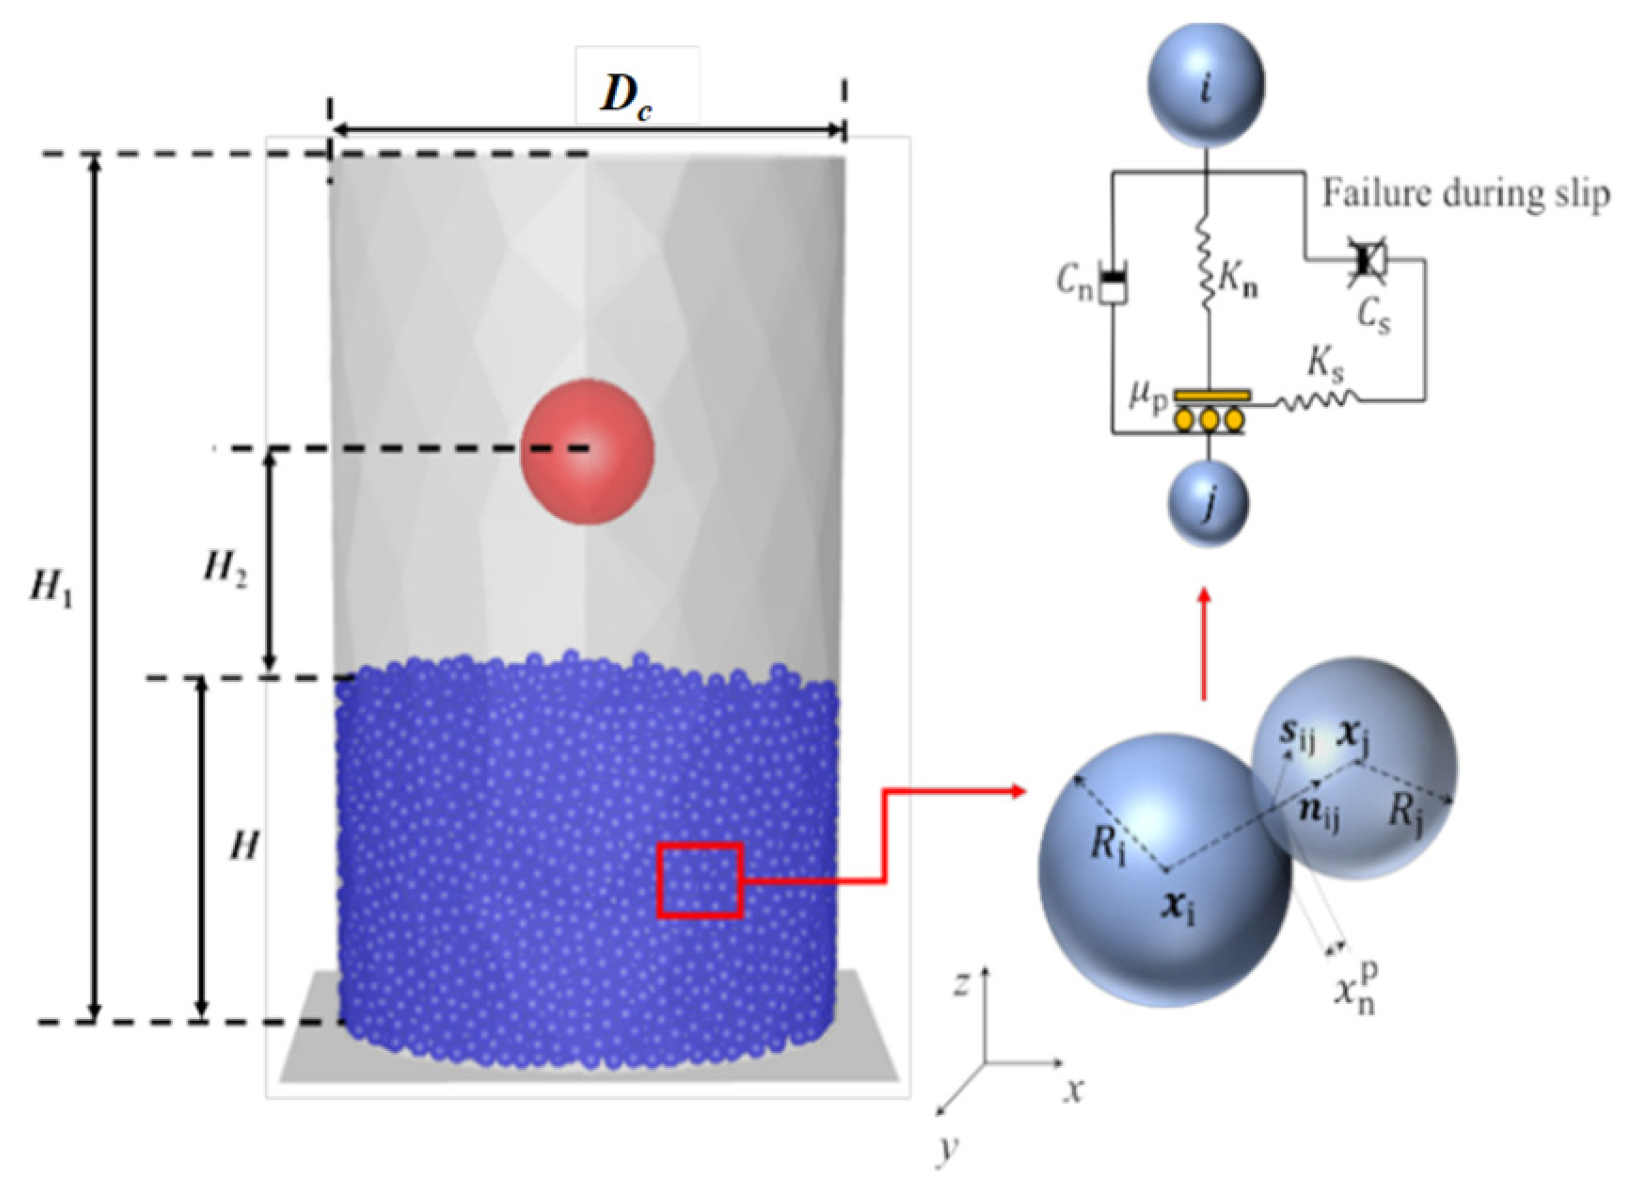
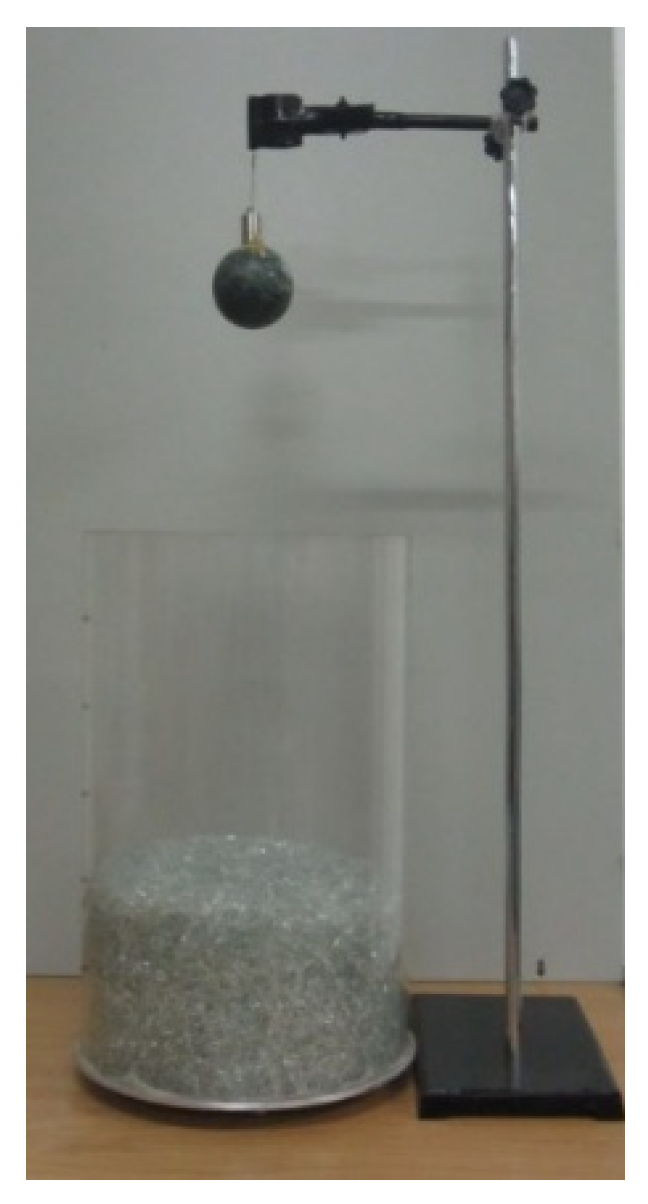
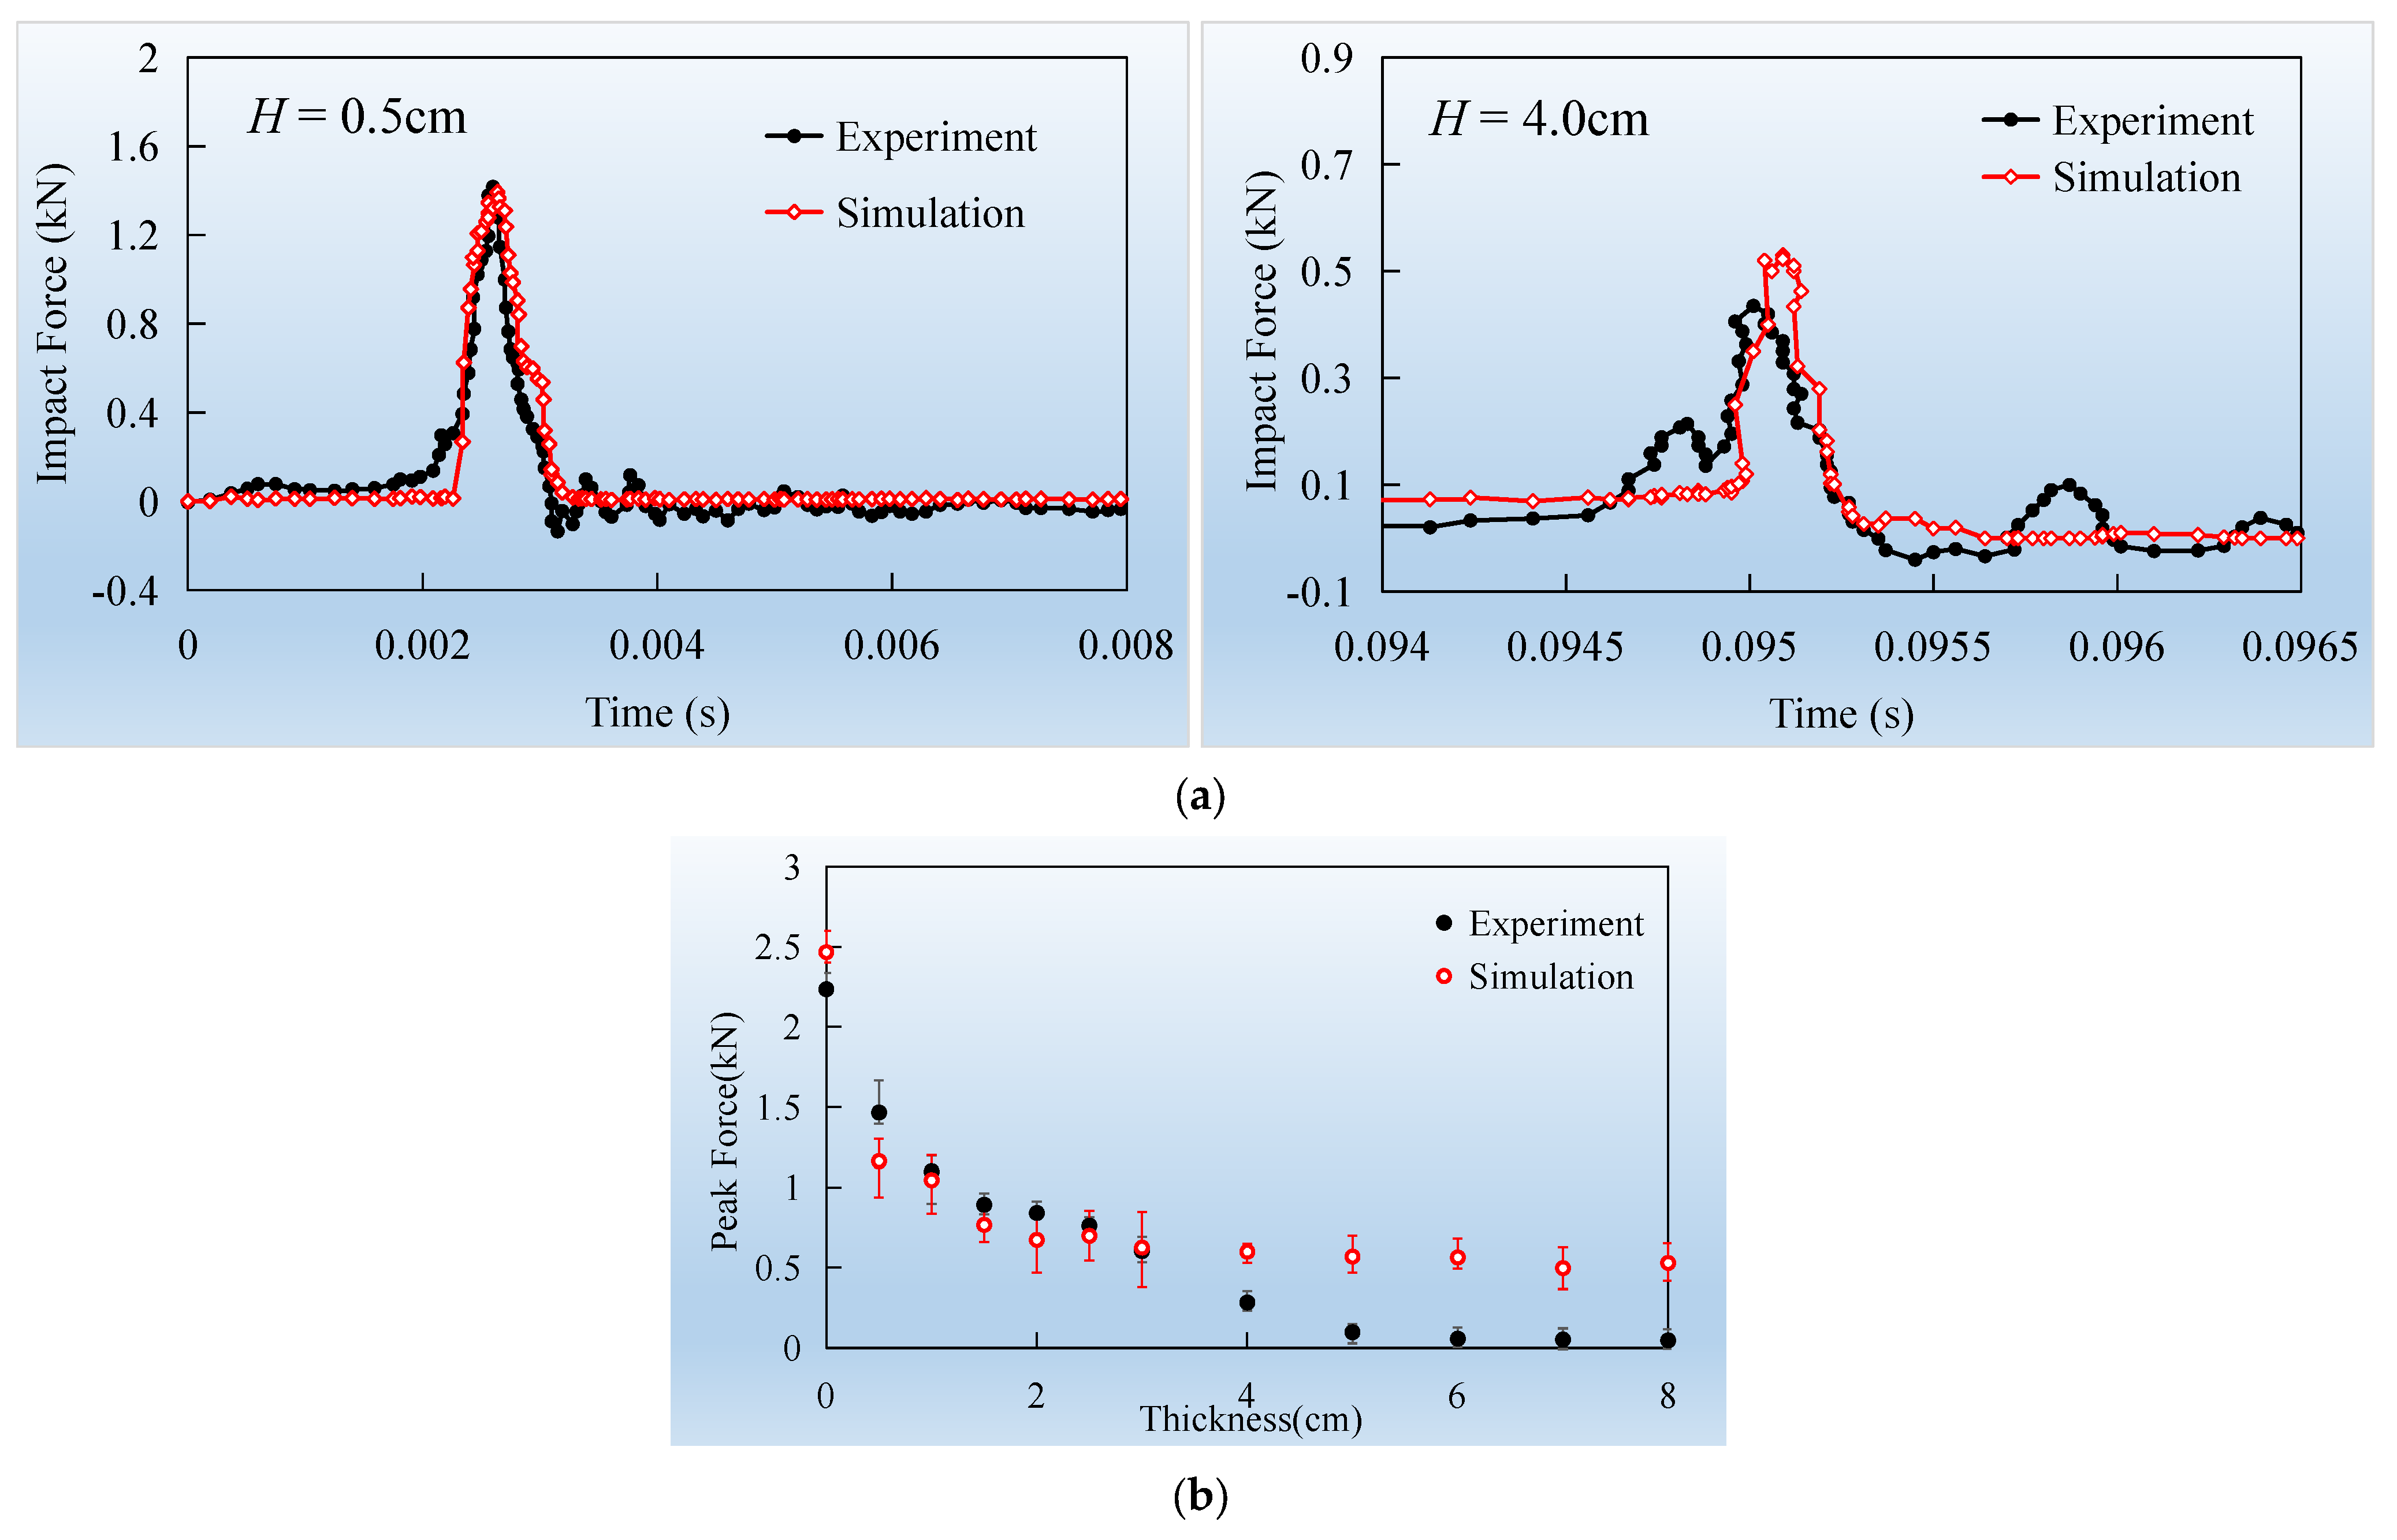
Therefore, this study establishes a discrete element method (DEM) model for impact dynamics by spherical contact mechanics. This model is validated against experimental data to confirm its predictive performance. By adjusting the layer thickness, we analyze the forces transmitted to the substrate and the reaction forces experienced by the impactor. Moreover, the research explores two main categories of governing parameters: one is the intrinsic properties of particles, including Young’s modulus, density, and inter-particle friction coefficient, and the other is the extrinsic characteristics of the impactor, such as impact velocity and geometric dimensions. Given the computational efficiency and well-established contact mechanics, spherical particles are adopted in this study.
3. Analysis of Factors Influencing Cushioning Performance
During the impact process, the granular material has a significant influence on the peak loads acting on the system, indicating the effectiveness of the granular material in cushioning. In this study, the peak impact force transmitted to the base plate and the reaction force experienced by the impactor are taken as the main metrics to evaluate cushioning performance. The effects of particle properties and impactor characteristics are analyzed in detail.
To systematically investigate these parameter variations, a series of parametric simulations were conducted based on the validated DEM model. Similar to the validation process, every data point in the following parametric studies was obtained from at least three independent simulation runs using different random initial packings to minimize the impact of stochastic outliers. To maintain the visual clarity of the figures while demonstrating data reliability, error bars are specifically plotted for representative layer thicknesses (e.g., H = 1 cm, 9 cm, and 18 cm) rather than for all curves. The inclusion of these representative error bars provides a quantitative estimate of variability, thereby ensuring the statistical robustness of the reported trends.
3.1. Influence of Particle Young’s Modulus
Young’s modulus is a key parameter that determines the stiffness of a material and its ability to resist elastic deformation. In a granular system, Young’s modulus not only determines the contact stiffness and force between particles as well as between particles and the boundary, but also affects the propagation, diffusion, and attenuation of impact loads within the particle aggregate, thereby influencing the overall impact response and cushioning efficiency.
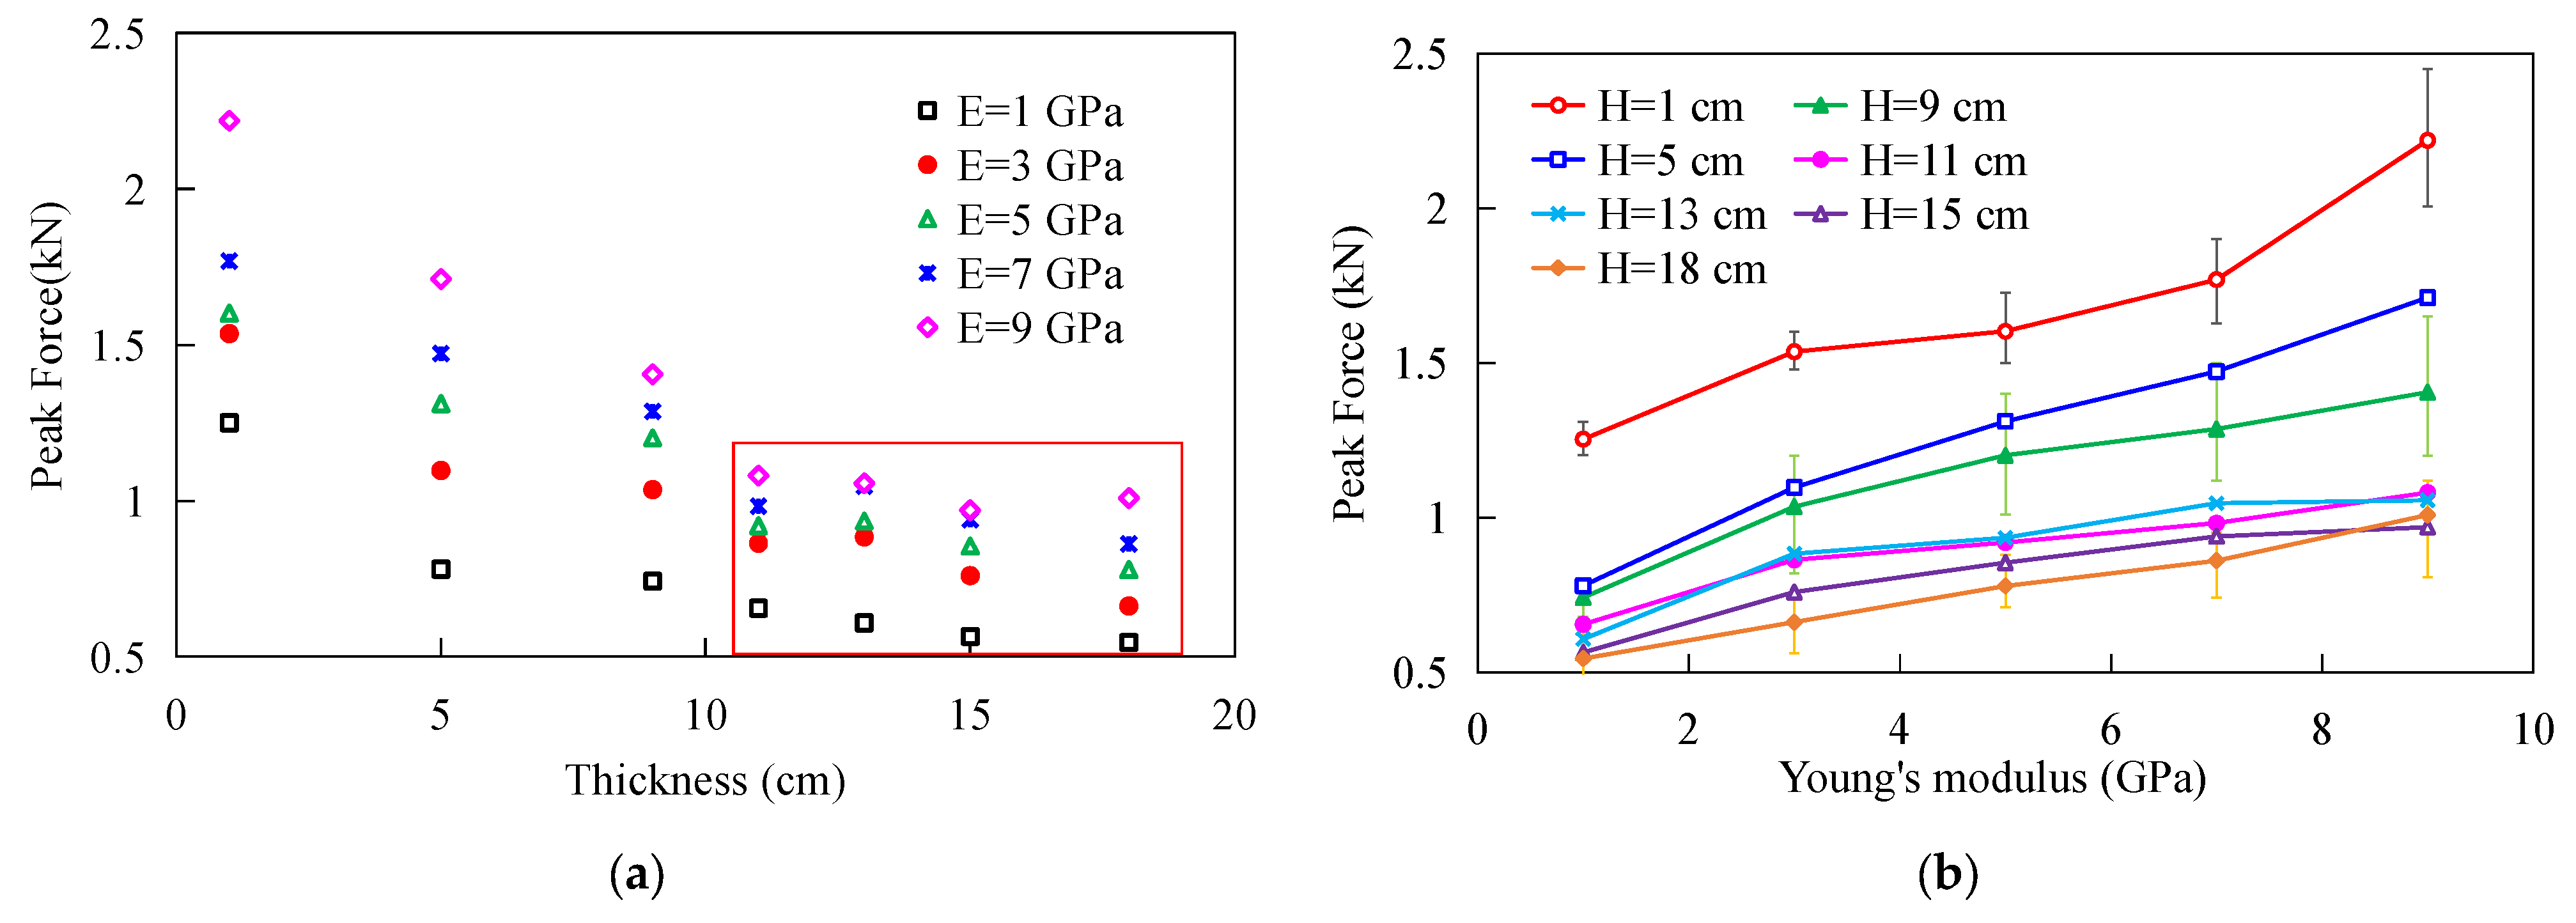
In this subsection, based on the established discrete element method (DEM) model, a series of impact simulations were conducted by varying the particle Young’s modulus (
E) and the layer thickness (
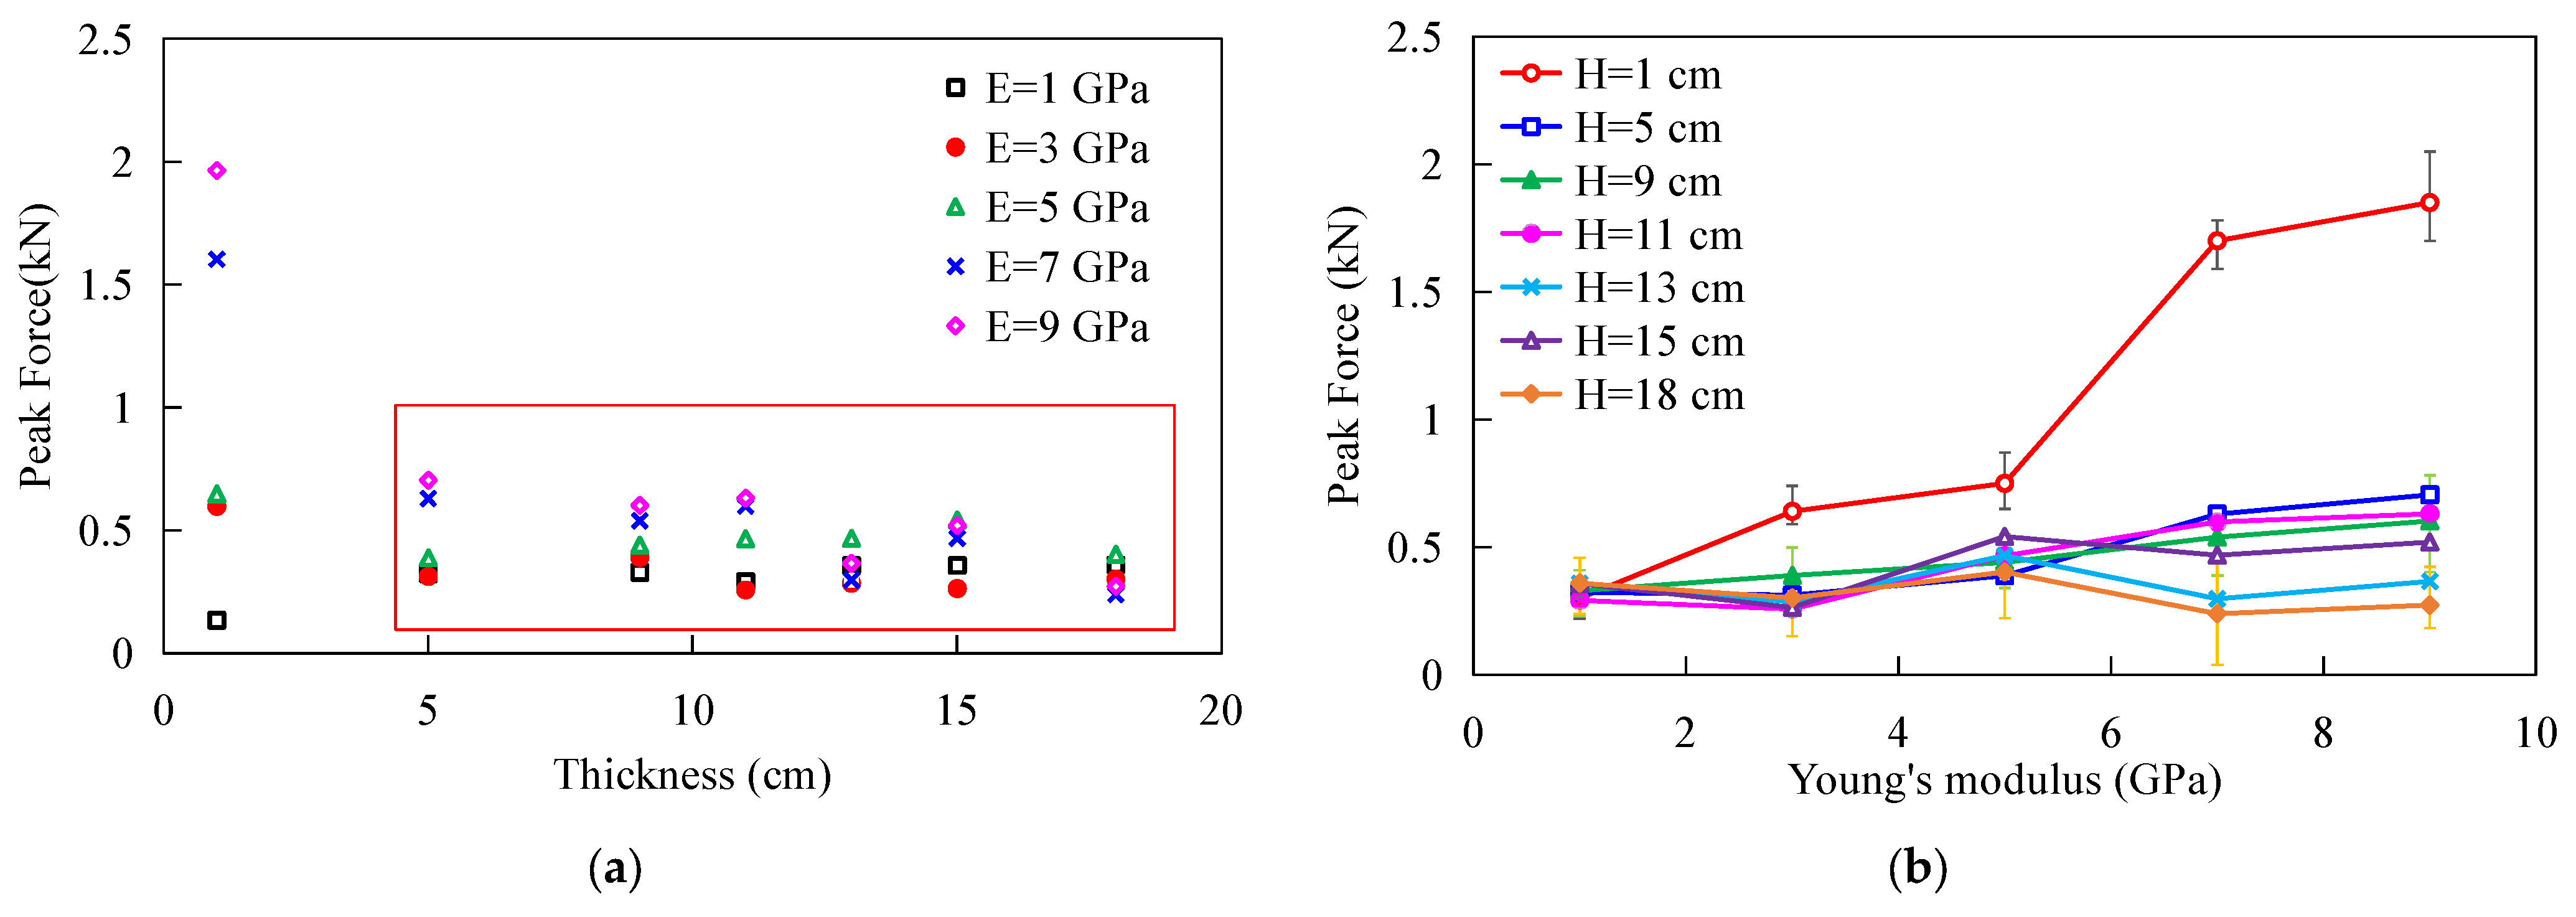
H). The peak impact forces transmitted to the base plate and the reaction forces on the impactor are adopted as the primary metrics. The results are presented in
Figure 4 and
Figure 5.
As shown in
Figure 4a, across all Young’s modulus values considered, the peak impact force transmitted to the base plate decreases monotonically with increasing layer thickness
H, indicating that the granular layer effectively attenuates the impact load. When
H reaches approximately 11 cm, the reduction in the peak force becomes marginal and the response tends to converge. Generally, the critical thickness is identified as the threshold where the peak impact force plateaus and becomes insensitive to further increases in layer thickness [
24,
25,
44]. This suggests that the cushioning layer has a critical thickness of
Hc ≈ 11 cm, beyond which further thickening provides limited additional benefit.
As shown in
Figure 4b, for a fixed layer thickness, the peak impact force on the base plate increases almost linearly with the particle Young’s modulus
E. However, within the layer thickness range of 11 cm to 18 cm, the curves for different Young’s modulus
E nearly overlap, suggesting that the influence of
E weakens at larger thicknesses.
This behavior is because as the layer thickness increases, the stress-wave reflection from the rigid base decreases. When the layer thickness is more than 11 cm, this reflection effect becomes very small. Instead, energy dissipation mechanisms like particle rearrangement, inter-particle friction, and stress diffusion take over the process, leading to better attenuation performance.
The mechanical properties of the particles also influence the peak impact force that the impactor experiences.
Figure 5a shows the variation in peak impact force on the impactor with layer thickness under different particle Young’s moduli. The results show that when
H > 1 cm, the peak force remains nearly constant. This suggests that the particle Young’s modulus has a limited influence on the impactor peak force within this thickness range
Figure 5b presents the dependence of the impactor peak force on
E at different layer thicknesses. For a thin layer (
H = 1 cm), the peak force increases almost linearly with
E, suggesting that the impactor-granular contact response is highly sensitive to changes in contact stiffness under thin-layer conditions. In contrast, for layer thicknesses of
H = 5~18 cm, the peak impact force remains nearly invariant with respect to
E. This confirms that for sufficiently thick layers, particle stiffness has a negligible influence on the peak deceleration load experienced by the impactor.
3.2. Influence of Particle Density
The particle density
ρ influences the cushioning performance of the granular layer mainly by altering its effective mass and inertial behavior, which in turn affects momentum exchange, force-chain evolution, and energy dissipation mechanisms during impact. In this subsection, DEM simulations were carried out by varying ρ and the layer thickness
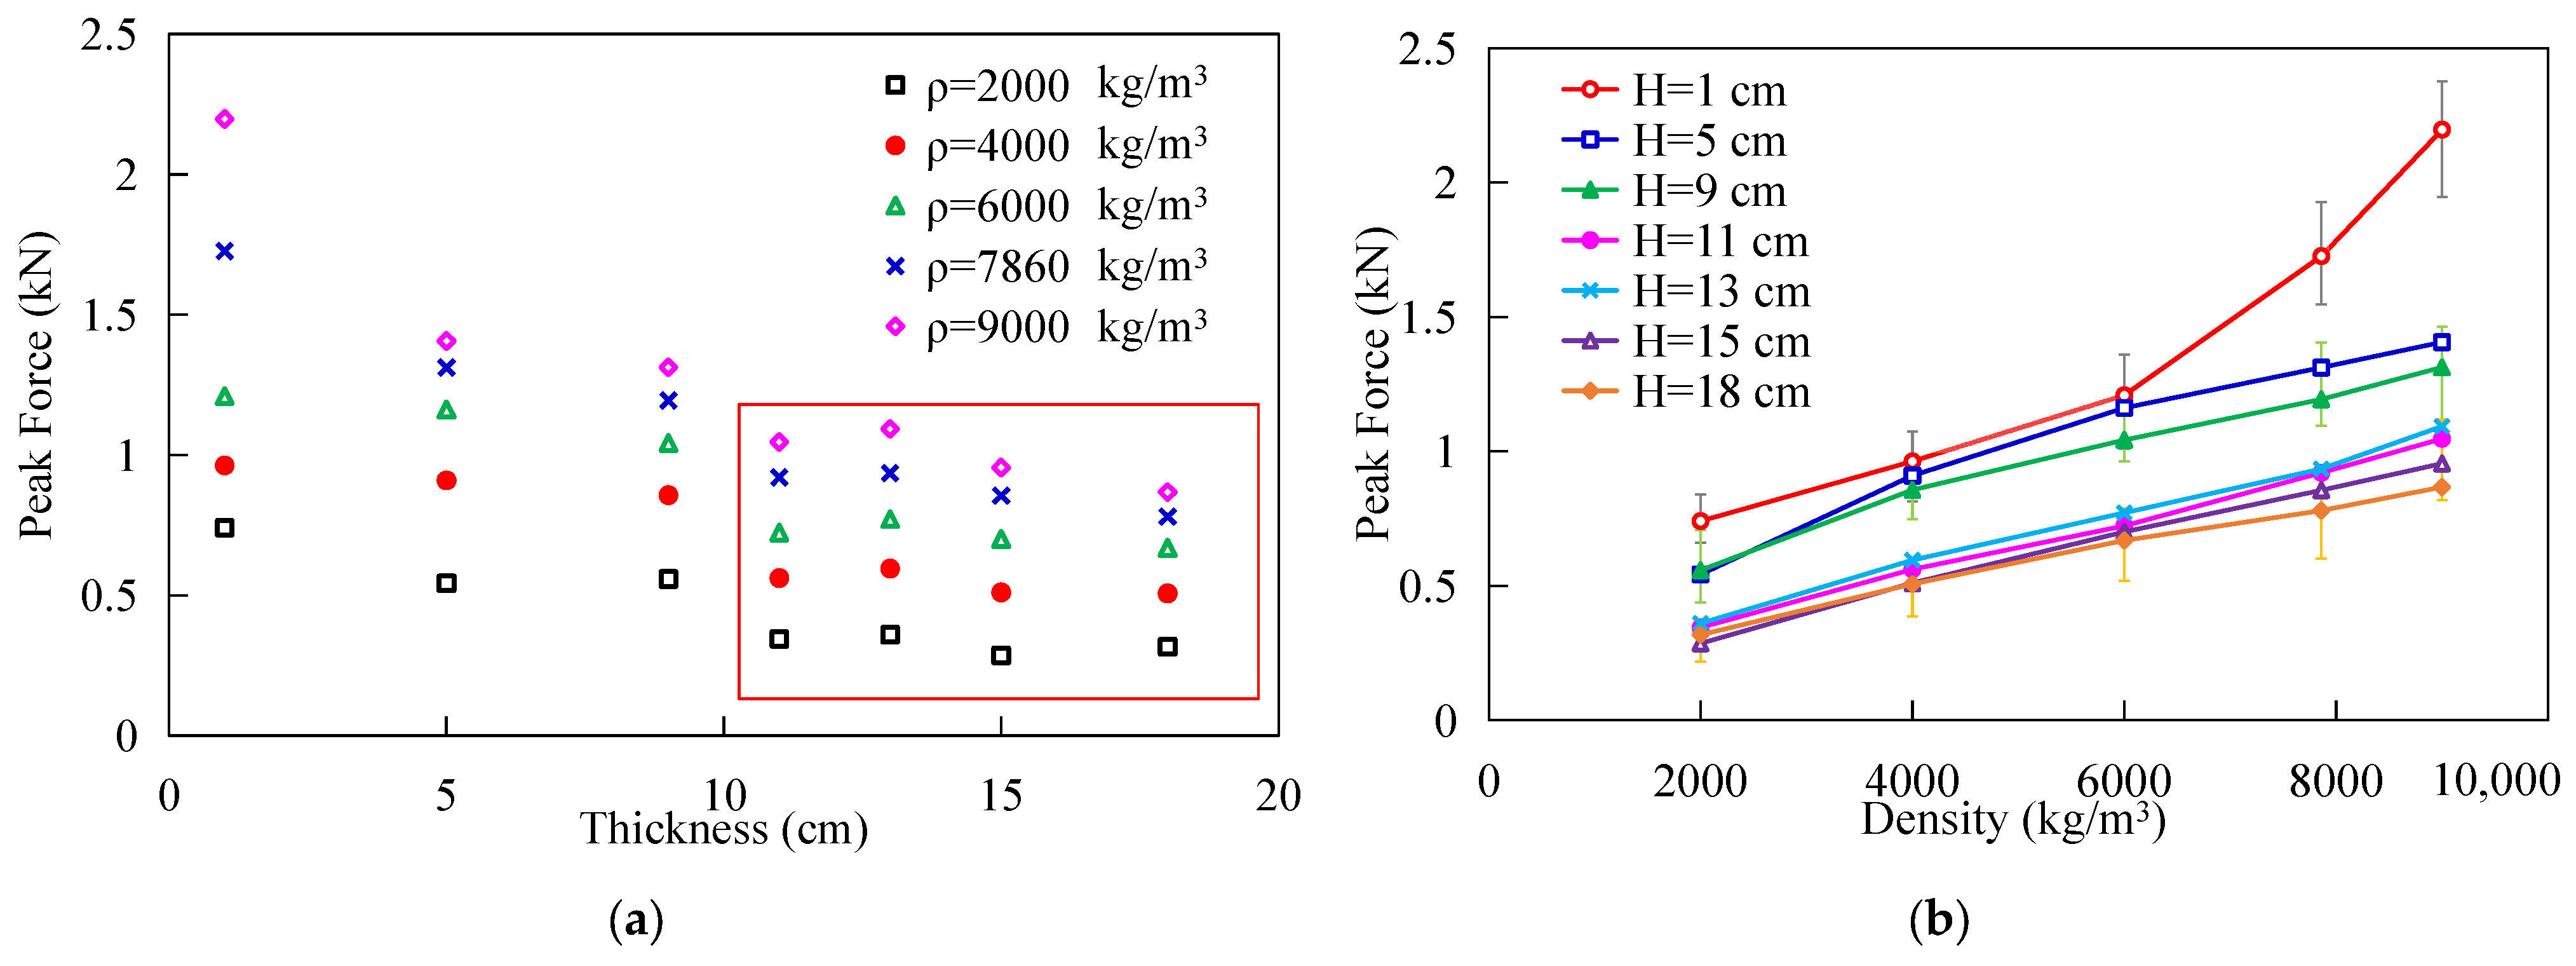
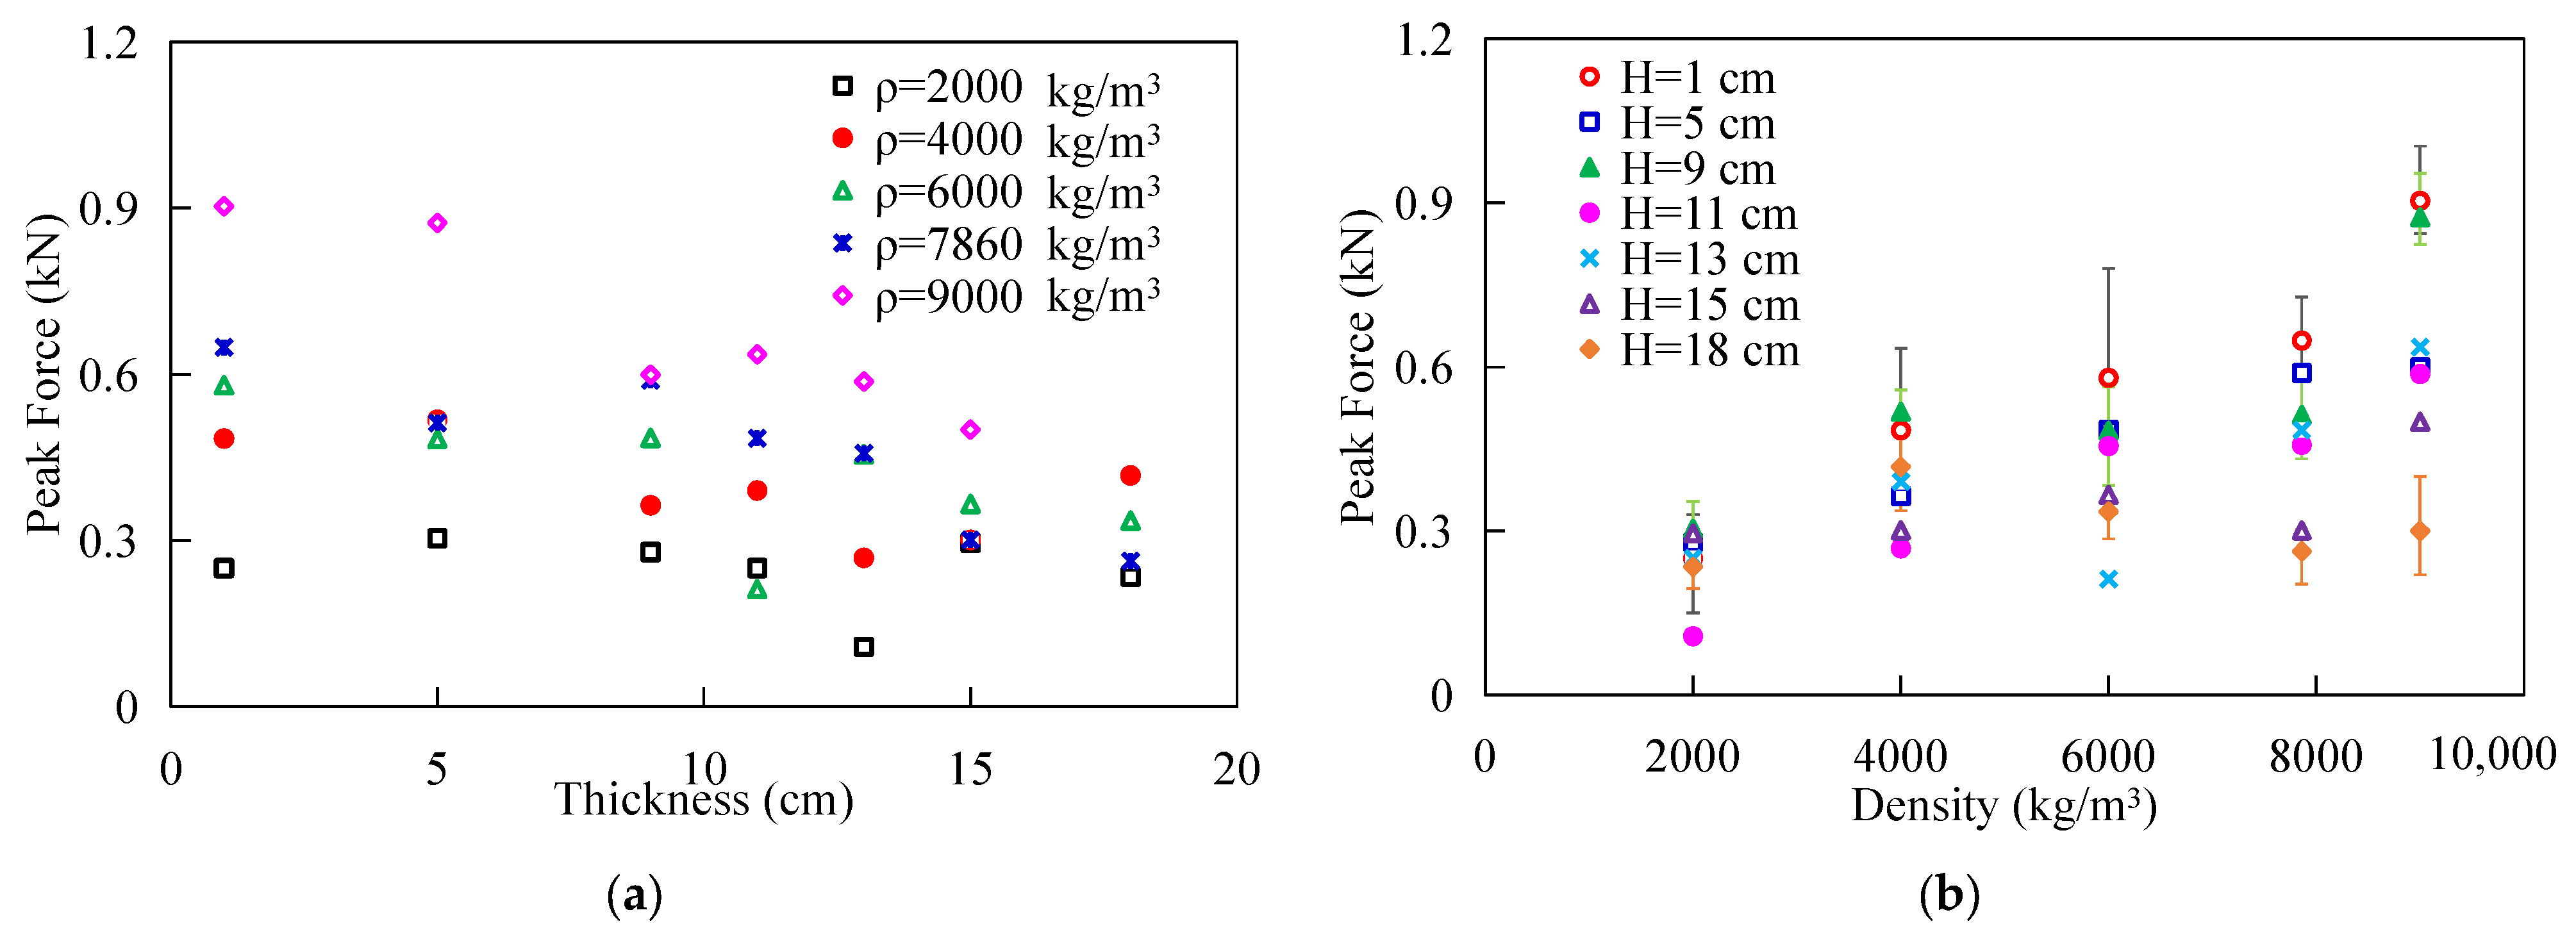
H. The peak forces acting on the base plate and impactor were extracted as the primary cushioning metrics, as shown in
Figure 6 and
Figure 7.
Figure 6a shows that, for all densities, the peak force on the base plate decreases with increasing
H and then approaches a plateau when
H ≈ 11 cm, indicating a critical thickness beyond which further increases produce negligible improvements in cushioning efficiency. At a fixed thickness, as shown in
Figure 6b, the base-plate peak force exhibits a gradual increase with increasing
ρ. This suggests that granular layers with higher density exhibit weaker cushioning capability. When
H > 11 cm, the force differences among densities remain observable but are markedly reduced.
The above trends can be attributed to the density-controlled transition in particle mobility. At low ρ, particles possess lower inertia and respond rapidly to impact loading, readily undergoing lateral rearrangement and partial “flow-like” motion. Such mobility disrupts strong vertical force chains and diverts a larger portion of impact energy into particle kinetic energy (and subsequent frictional dissipation during rearrangement), resulting in both a reduced peak force and a shorter pulse duration at the base plate. In contrast, increasing ρ enhances particle inertia and suppresses transient lateral motion, leading to a “solid-like” response dominated by inertial-locking. Under this condition, the granular bed supports the load through more persistent force chains and larger contact deformation, resulting in higher contact stresses and a longer force transmission time.
Figure 7 further shows that the peak force on the impactor is much less sensitive to
ρ than the base-plate response. Except for very thin layers, the impactor peak force varies only weakly with density and also tends to stabilize as
H approaches the same critical thickness (11 cm). This indicates that changing
ρ primarily alters the internal transmission and dissipation processes within the granular layer (i.e., how the impact energy is redistributed before reaching the base), while the near-field contact force experienced by the impactor is comparatively insensitive once bottom boundary effects are sufficiently mitigated.
In summary, increasing the layer thickness significantly improves cushioning performance, reaching a critical limit at approximately 11 cm. Increasing particle density slightly increases the peak load transmitted to the base plate (i.e., reduces cushioning efficiency), while its influence on the impactor peak force is weak, especially for sufficiently thick layers where force-chain diffusion and dissipation mechanisms dominate the response.
3.3. Influence of Particle Friction Coefficient
The friction coefficient (μ) between particles is a key micro-scale parameter that determines the contact behavior and macroscopic mechanical response of granular systems. By adjusting μ, the shear resistance between particles is regulated, thereby influencing the tangential displacement, energy dissipation, and effective stiffness of the system, consequently affecting the overall cushioning performance. To investigate its effect, the discrete element method (DEM) was employed to simulate the impact events with different layer thicknesses (H) and friction coefficients (μ), and the forces acting on the substrate and the impactor were analyzed.
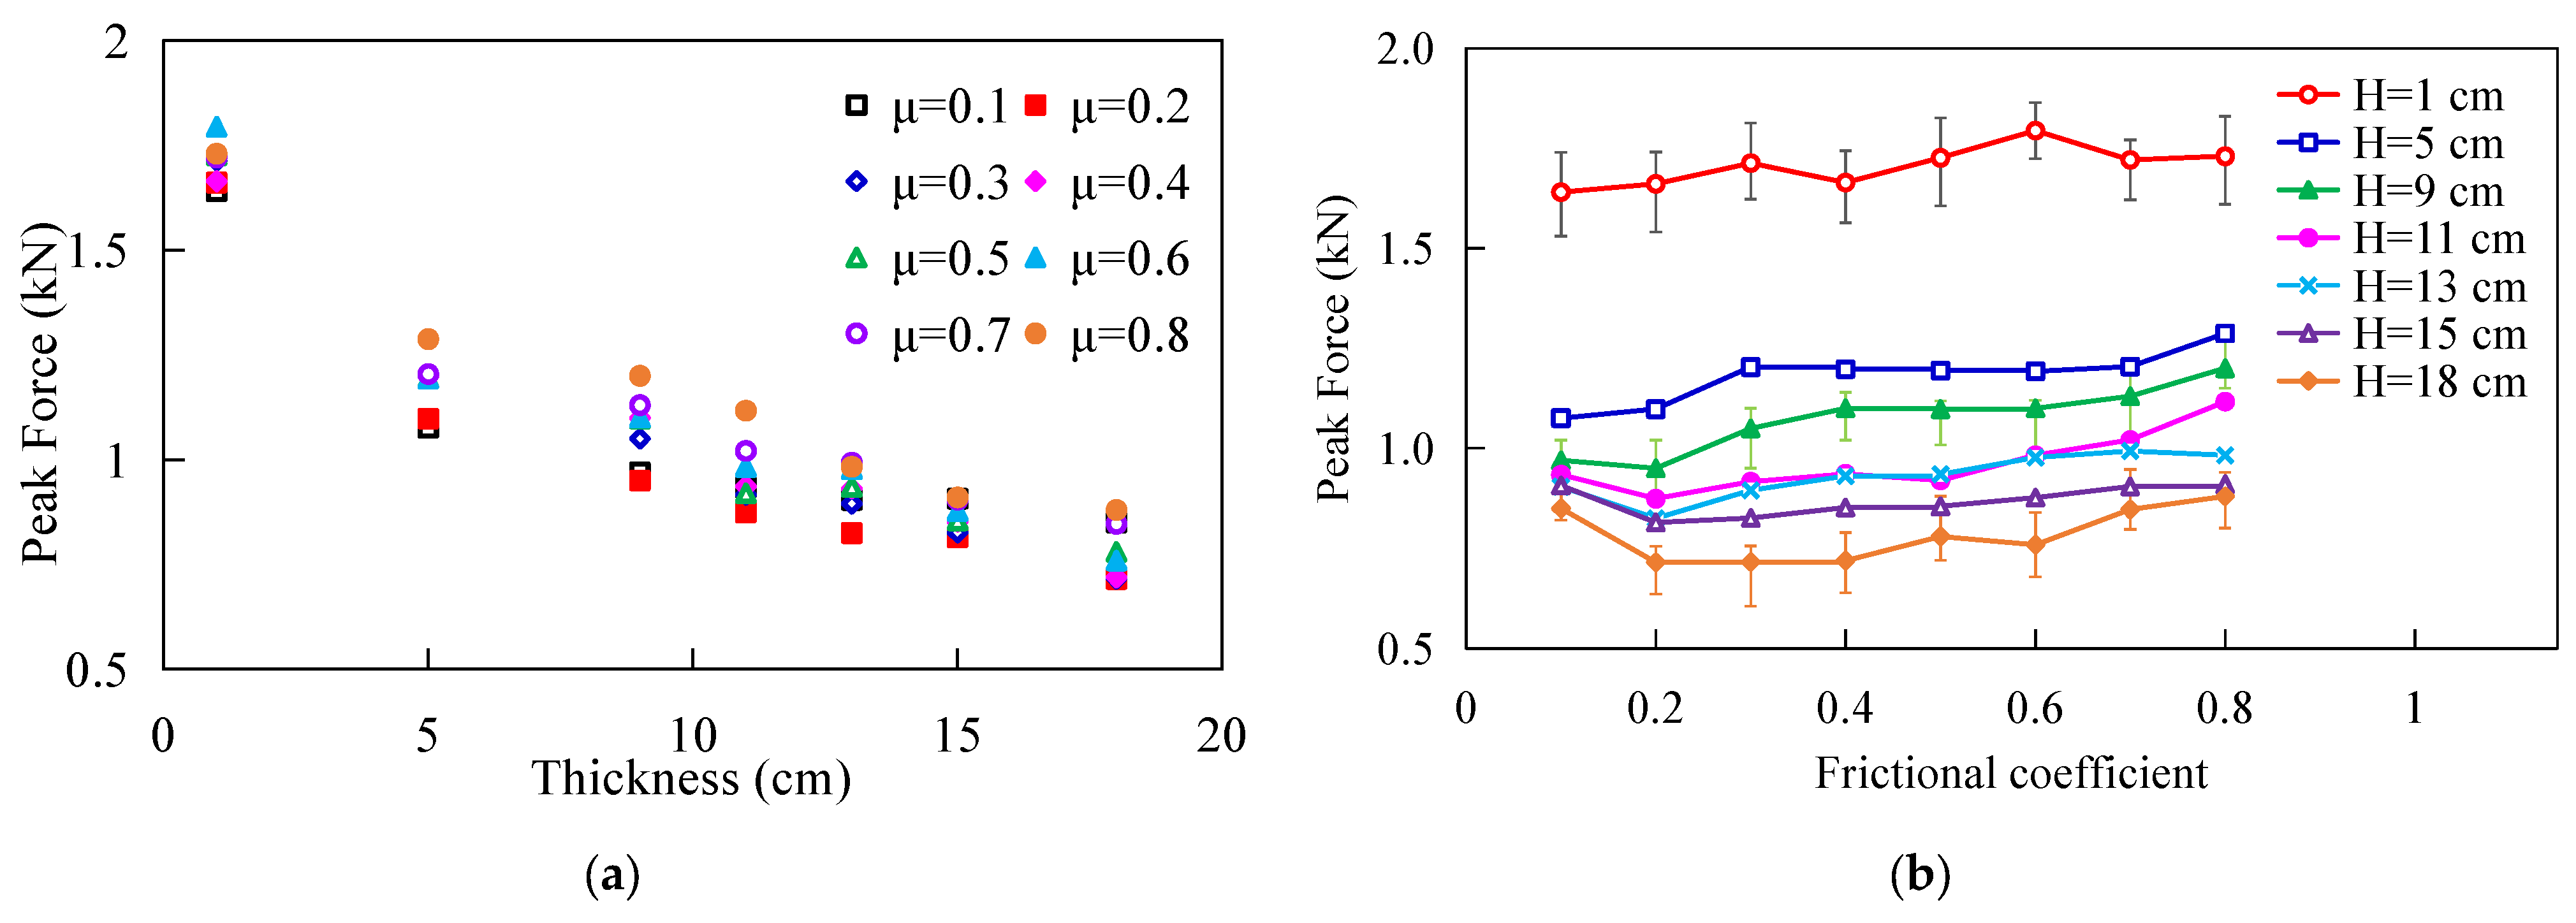
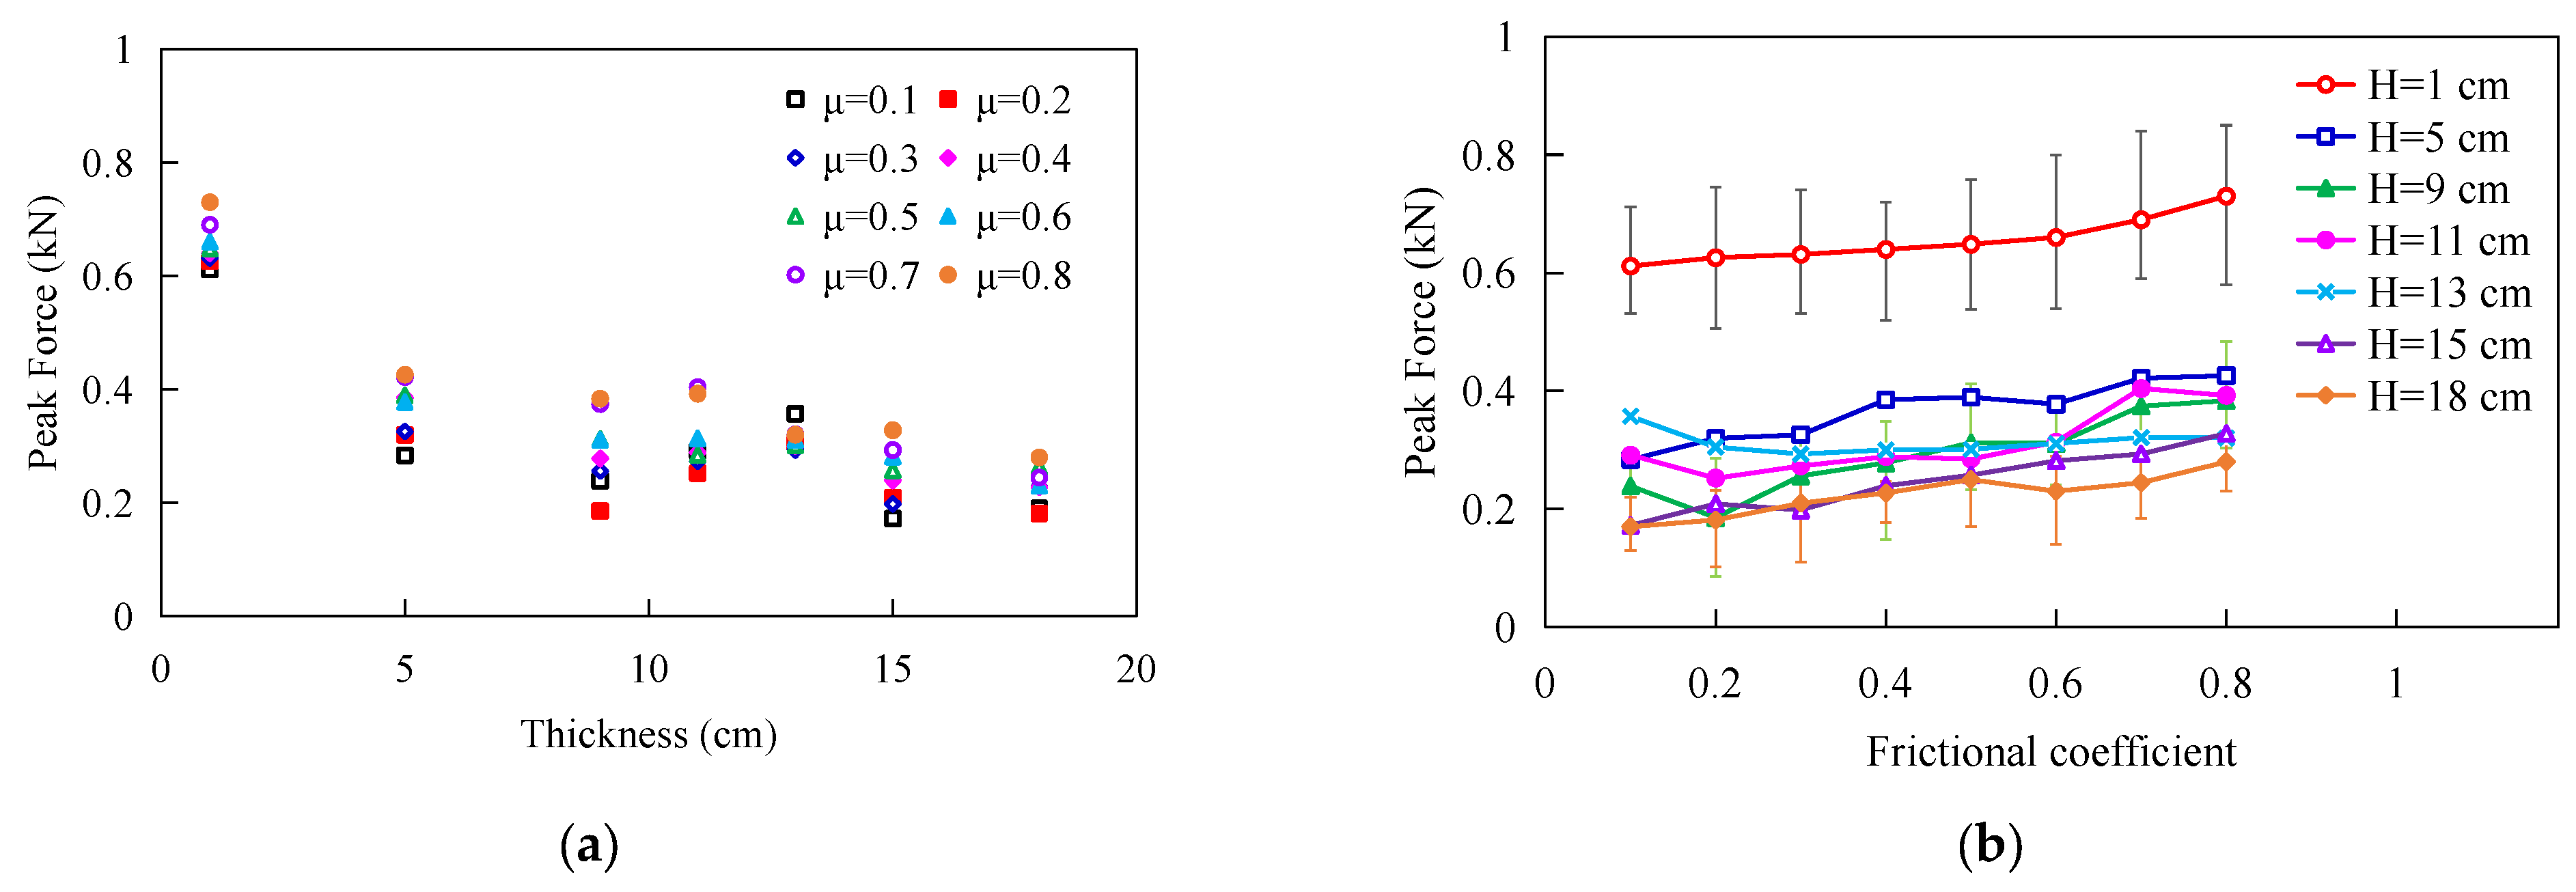
Figure 8 shows the relationship between the peak impact force on the base plate and the layer thickness (
H) and friction coefficient (
μ). As shown in
Figure 8a, for any
μ, within a critical thickness range (
H ≤ 1 cm), the peak force decreases significantly as
H increases, showing a nearly linear attenuation. Beyond this range, the decrease in peak force is almost negligible, indicating that the thickness effect has reached saturation. Additionally,
Figure 8b indicates that for a fixed
H, the peak force gradually increases as
μ increases, meaning that as the friction between particles increases, the cushioning efficiency gradually decreases.
The cushioning mechanism can be viewed as follows: A higher friction coefficient increases the tangential resistance and improves contact interlocking, which in turn restricts relative sliding and rotation between particles. This “friction locking effect” prevents the relaxation of stress by causing particles to rearrange themselves and promotes the formation of a stable and rigid force chain network. These force chains act as effective channels for the transmission of longitudinal stress waves, thereby enabling the distribution of impact energy to be more evenly distributed across the base plate. Conversely, under low-friction conditions (i.e., μ < 0.3), inter-particle constraints are weak, so the assembly is more prone to lateral slippage and local fluidization when impacted. This structural instability causes the formation of persistent vertical force chains to be disrupted, effectively redistributing and dissipating impact energy laterally. Therefore, reducing μ improves the structural compliance and energy dissipation capacity of the granular layer, enhancing the cushioning performance.
This interpretation is consistent with the findings of Ji et al. [
25]. They found that a higher friction coefficient produces a more stable and directional force-chain network. Impact energy then transmits more efficiently along these chains to the base plate, reducing the spatial and temporal dispersion of energy. Meanwhile, the distribution of inter-particle forces shifts toward higher values, with significantly fewer weak contacts forming within the assembly. In contrast, lower friction promotes frequent breaking and re-forming of force chains. This enhances particle rearrangement and allows load to be shared through multiple paths-leading to more effective energy dissipation.
For the granular cushioning layer installed between the electromagnetic coil frame and the inner wall of the AEM pod, this finding suggests that low-friction granular materials are preferable to minimize motion-induced noise and maintain coil stability during flight.
From
Figure 9a, it can be seen that the impactor peak force decreases as the layer thickness increases.
Figure 9b shows the influence of the friction coefficient. It is evident that, for a constant layer thickness, the impactor peak force fluctuates only in a limited range and is not sensitive to the change in the friction coefficient.
By comparing the force responses of the base plate and the impactor, it can be observed that the friction coefficient between the particles plays a different role in the cushioning mechanisms of the two. For the base plate, the friction coefficient directly affects the peak force by regulating the stability of the internal force chain and the efficiency of energy dissipation. However, it has an insignificant effect on the force experienced by the impactor. This indicates that the friction coefficient mainly influences the overall cushioning performance by altering the stress transmission path within the particles, while having limited effects on the local contact stiffness and instantaneous response of the impact interface.
3.4. Influence of Impactor Size
The size of the impactor determines its contact area with the granular bed, which directly affects the efficiency of energy transfer during the impact process.
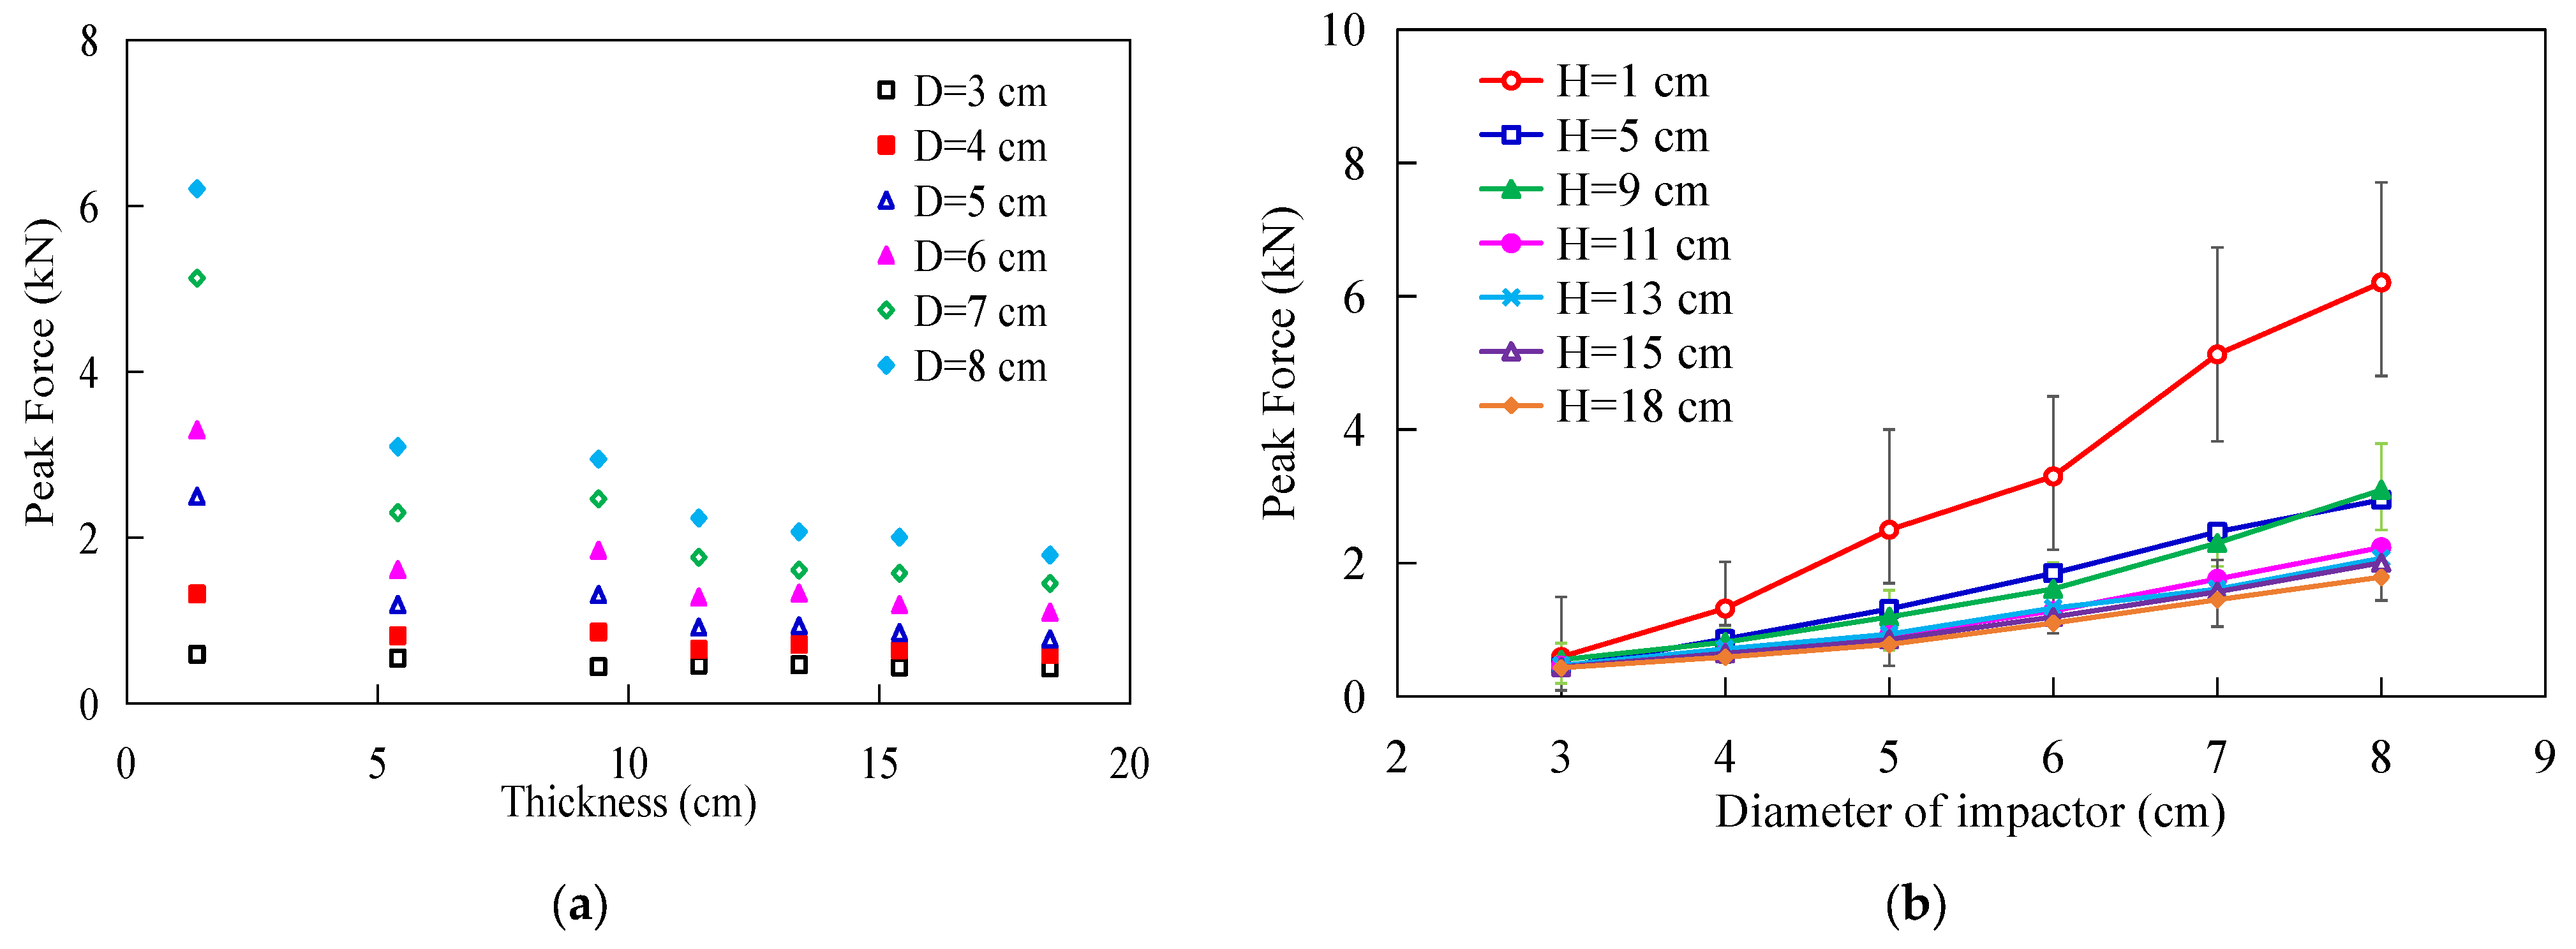
Figure 10a shows the variation in peak impact force transmitted to the base plate under different layer thicknesses and impactor sizes. The results indicate that the peak impact force on the base plate decreases gradually as the layer thickness increases. When
H > 11 cm, the downward trend of the peak force plateaus and ceases to change significantly. This implies that the system has reached a critical thickness, where the enhancement of cushioning performance by increasing thickness becomes limited. Moreover, for a given layer thickness, the peak impact force increases significantly with the enlargement of the impactor size, as shown in
Figure 10b. This trend can be attributed to two coupled mechanisms. First, assuming constant material density, increasing impactor size directly leads to a greater mass, thereby elevating the initial kinetic energy input into the granular system. Second, a larger impactor engages with a greater number of particles at the moment of impact. This expands the contact area for load transmission and enhances the efficiency of mechanical energy transfer into the granular bed.
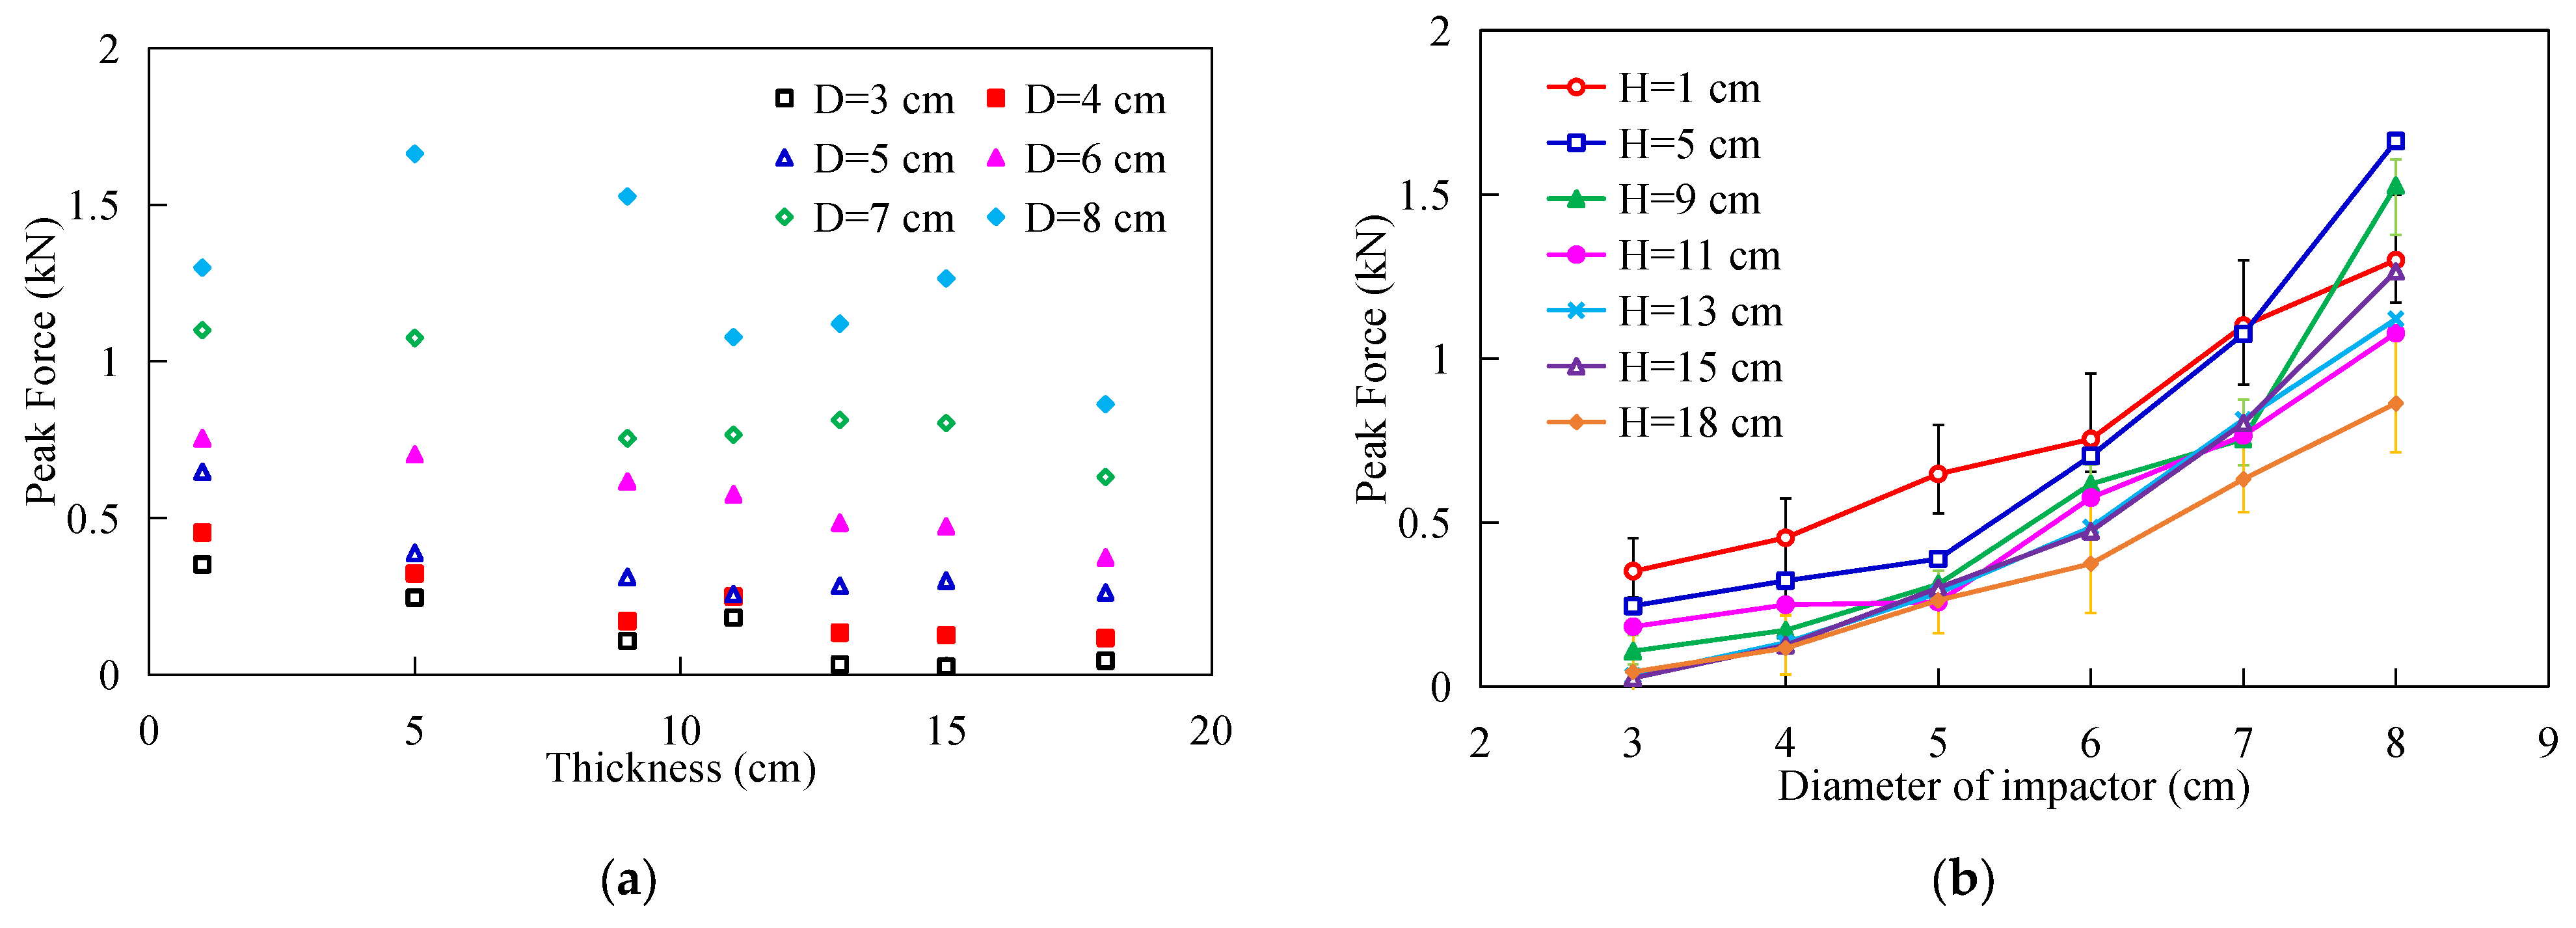
Figure 11a shows the peak force under different impactor sizes transmitted to the base plate. It can be seen that for smaller impactors (
D < 7 cm), the peak force decreases gradually as the layer thickness increases. But for larger impactors (
D > 7 cm), it becomes insignificant. This suggests that for larger impactors, the large increases in initial kinetic energy and contact surface area become the main factors, which effectively dominate the cushioning variation caused by the granular layer thickness.
Figure 11b shows that within the layer thicknesses, there is a positive correlation between peak force and
D, but the rate of increase (sensitivity) is significantly different. Specifically, in thinner thicknesses (
H = 1 cm), the curve has the flattest slope (lowest sensitivity), even though it starts with a relatively high initial force for small diameters.
This is caused by the constraining effect of boundary conditions. For a thin granular layer, only a small number of particles participate in the interaction, and the impact process behaves as a quasi-direct collision between the impactor and the base plate. Therefore, increasing the impactor mass only enhances the input energy, but it cannot reconfigure a wider network of force chains. In contrast, for a thicker granular layer, larger-diameter impactors can drive more particles to resist deformation, leading to a sharp increase in impact force with diameter.
3.5. Influence of Impact Velocity
Impact velocity is a key parameter for energy input; it plays a decisive role in the mechanical response of the cushioning system. This paper studies the peak impact force transmitted to the base plate and that experienced by the impactor across a velocity range of 1~9 m/s under different granular layer thicknesses.
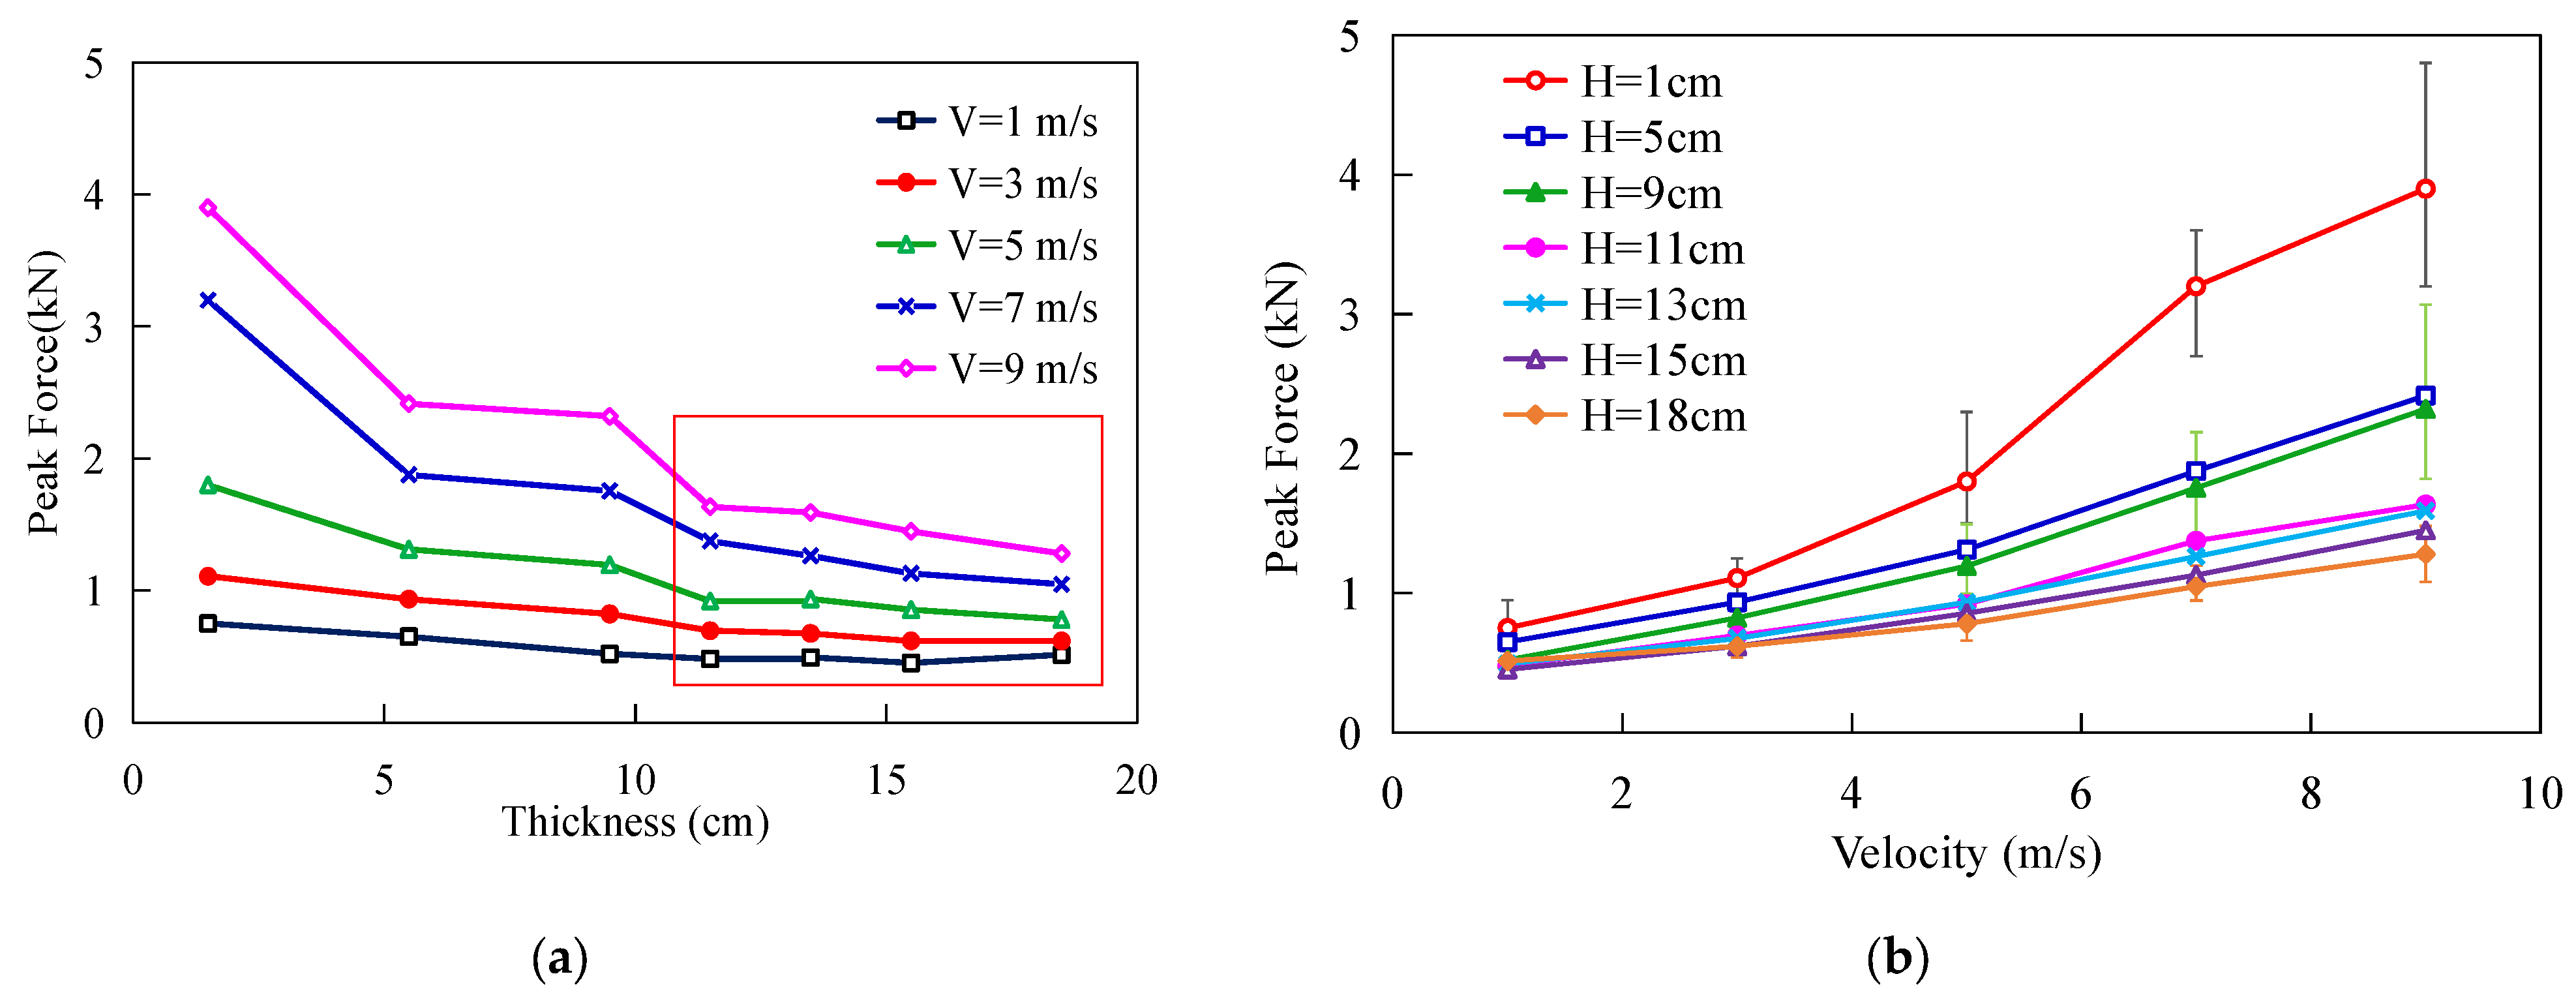
Figure 12a shows the variation in peak force on the substrate with thickness at different velocities. The results show that under all velocities, the peak impact force decreases almost linearly as the layer thickness increases. At high velocities, the force decreases more rapidly with increasing layer thickness, while at lower velocities (
V < 5 m/s), the peak forces are relatively low with gentle variations. As the velocity increases, kinetic energy increases quadratically, resulting in a substantial increase in impact force. When the layer thickness approaches 11 cm, the impact force decreases significantly, indicating that the system is nearing a critical thickness limit, where the thickness effect becomes fully saturated. From the observation of
Figure 12b, it is observed that the peak force on the base plate increases nearly linearly with impact velocity, which is independent of the layer thickness. Moreover, for thicknesses below the critical value (
H < 11 cm), the impact force is highly sensitive to velocity changes, resulting in a steeper slope. In contrast, for
H ≥ 11 cm, the velocity-force curves tend to converge, and the slope decreases significantly. This further confirms the existence of a critical thickness, and its regulatory role in the dynamic response of the system.
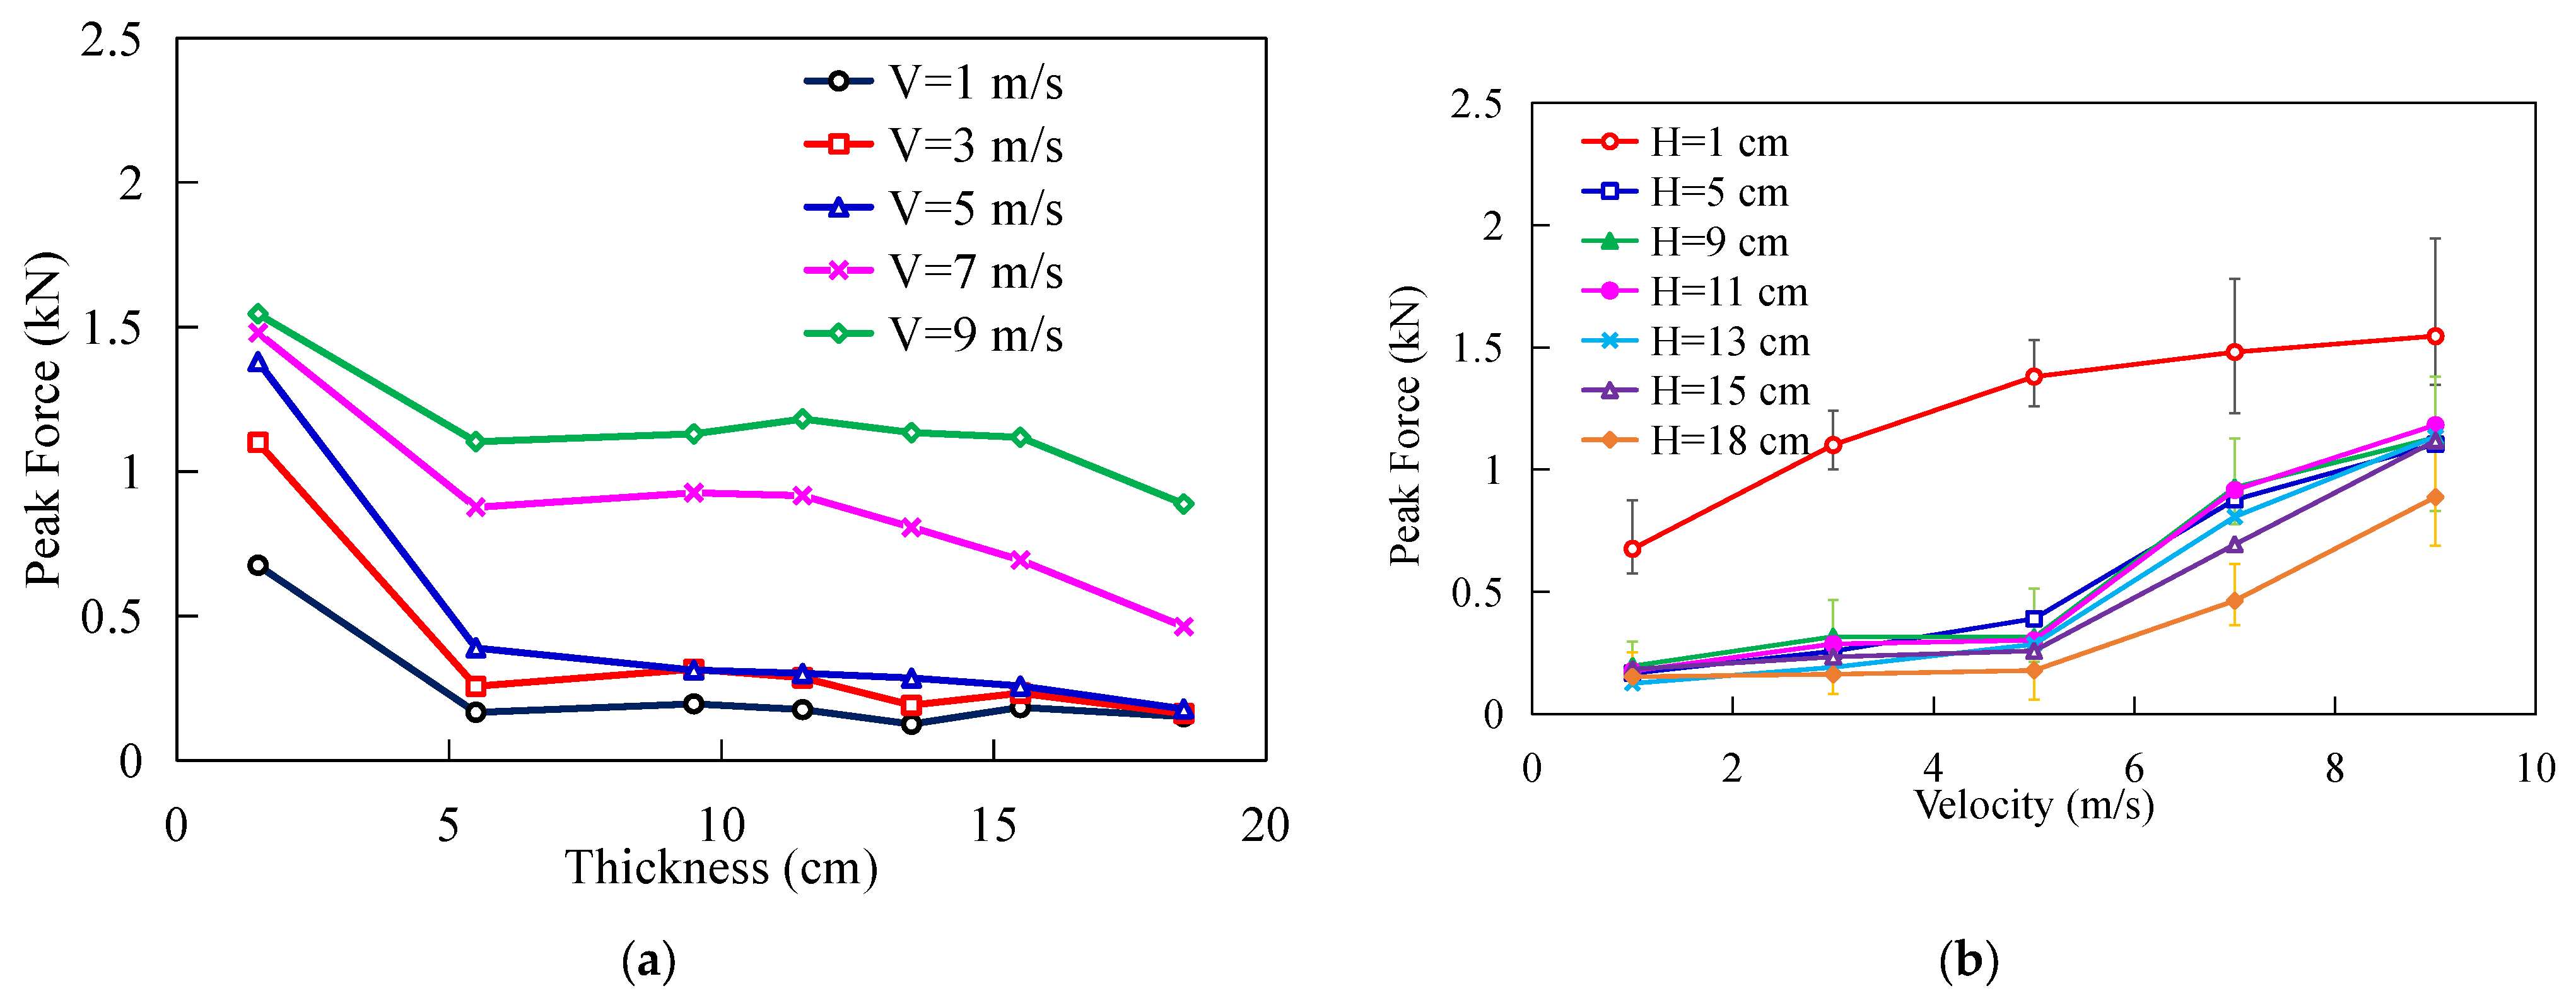
Additionally, the impact velocity also produces a significant impact on the impactor itself.
Figure 13a shows that at lower velocities (
V ≤ 5 m/s), the force decreases significantly with increasing thickness; however, at higher velocities (
V > 5 m/s), the influence of thickness diminishes. As shown in
Figure 13b, the impact force increases with velocity across all thicknesses. In thicker layers (
H > 1 cm), the curves nearly coincide, indicating that the thickness effect is no longer significant; yet, the force growth intensifies noticeably when the velocity exceeds 5 m/s. In contrast, the thinner layer (
H = 1 cm) exhibits a more gradual increase in force with velocity. This is attributed to the transformation of energy transfer and dissipation in the granular medium. Under low-velocity impact (
V ≤ 5 m/s), the granular assembly has enough time to dissipate energy via inter-particle sliding, inelastic collisions, and structural rearrangement. At this point, increasing the thickness of the particle layer significantly prolongs the propagation path of the stress wave, thereby reducing the force transmitted to the substrate. When thickness reaches roughly 11 cm, the dissipation capacity of the granular layer becomes saturated. When the velocity increases (
V > 5 m/s), the kinetic energy increases with the square of the velocity, and the rate of energy input rapidly exceeds the dissipation capacity of the particle layer. Rapidly, force-chain networks form between particles, dominating the vertical transfer of energy, resulting in a significant weakening of the regulating effect of layer thickness on energy dissipation.
From this perspective, under high-velocity impact conditions, the particle layer exhibits a quasi-rigid characteristic due to insufficient response time, making it difficult to effectively disperse the load through structural adjustment. However, the force on the impactor is mainly determined by momentum transfer at the contact interface. Therefore, the influence of layer thickness weakens, and velocity becomes the dominant factor.
4. Conclusions
In this paper, a discrete element method (DEM) model for a granular bed under impact loading was established, and its reliability was verified through impact experiments. Based on this model, the effects of granular physical properties (elastic modulus, density, friction coefficient) and impactor characteristics (size, velocity) on cushioning performance were studied. The main conclusions are summarized as follows:
- (1)
When the granular layer thickness reaches the critical thickness, any further increase in thickness weakens the enhancement effect on the cushioning performance. Additionally, increasing particle Young’s modulus, density, or friction coefficient leads to higher peak forces on the base plate, with Young’s modulus and density having significantly stronger effects than the friction coefficient. Notably, a higher friction coefficient actually degrades cushioning performance by promoting stable force chain formation that enhances stress wave transmission, whereas lower friction facilitates particle rearrangement and energy dissipation. In contrast, these properties exhibit minimal influence on the impactor peak force.
- (2)
The impactor size and velocity are the main factors determining the impact load. Increasing either significantly increases the input kinetic energy and contact area, thereby causing a substantial increase in the force exerted on both the base plate and the impactor. Under thin layer conditions, the impactor force is highly sensitive to impact parameters, while in thick layers it becomes primarily governed by particle rearrangement and energy dissipation mechanisms.
These findings have significant implications for vibration isolation design in high-sensitivity detection systems. In AEM surveys, platform vibrations propagate through the pod structure to the coils, which are mounted inside pods, causing micro-movements that cut through the geomagnetic field and generate intense motion-induced noise. Based on the findings of this study, installing a granular cushioning layer with low friction, appropriate thickness, and low Young’s modulus between the coil mounting frame and pod inner wall can effectively attenuate the transmission of high-frequency vibrations and impact energy to the coils, suppressing their attitude disturbances. This would help reduce motion-induced noise, preserve the integrity of shallow response signals, and potentially improve the AEM system’s ability to resolve near-surface geological targets while enhancing the data signal-to-noise ratio.