1. Introduction
As a key component of high-end equipment, the operational reliability of rolling bearings has garnered increasing attention in recent years [
1,
2]. Frequent occurrences of major safety accidents caused by rolling bearing faults highlight the urgent need for efficient and rapid fault diagnosis methods. Therefore, developing advanced fault diagnosis algorithms for rolling bearings is of significant research value [
3,
4]. Currently, fault diagnosis technology based on vibration signals is relatively well-developed. However, because rolling bearings often operate in harsh environments, the collected vibration signals are frequently accompanied by strong noise interference, which poses significant challenges to accurate fault detection. To accurately identify the condition of a bearing, the extraction and enhancement of fault features from the acquired vibration signals have become essential and indispensable steps [
5,
6].
Bispectral analysis of signals is an important method for identifying the characteristic frequencies of faults. As a type of third-order spectrum with periodicity and symmetry, the bispectrum can differentiate mechanical operating conditions through the distinct distribution of spectral peaks. However, the stability of traditional bispectral analysis is often compromised by the random phase variations in sideband components, leading to less reliable results. To address this issue, Gu et al. [
7] proposed the MSB (Modulation Signal Bispectrum), which leverages the amplitude modulation characteristics of current signals and integrates both low and high sidebands to provide a more accurate representation of current signals. By analyzing current signals, this method enables the monitoring of equipment status and the diagnosis of faults. Consequently, the MSB has quickly gained widespread application in the field of fault diagnosis. To achieve the goals of noise reduction and bandwidth optimization, Tian [
8] proposed a robust bearing fault detection method based on MSB. Considering that the MSB algorithm is vulnerable to non-Gaussian noise interference, Guo [
9] proposed an autoregressive modeling filter designed to suppress non-Gaussian noise. This method employs the autoregressive model as a filtering unit for preprocessing, effectively reducing non-Gaussian noise. After noise suppression, the modulation components are decomposed by MSB to accurately extract the fault feature information. Meanwhile, Xu [
10] revealed the influence of planetary gears on bearing characteristics under different radial clearance conditions by using the modulation signal bispectral sideband estimation as an analytical indicator. Guo [
11] introduced a bearing fault diagnosis method combining optimized wavelet packet noise reduction with MSB. The approach filters key fault-related signals using the Gini coefficient, then selects optimal MSB slices based on eigenfrequency intensity to construct an MSB detector for accurate fault identification. Xu et al. [
12] proposed a method for modulation signals, which leverages the MSB to extract equidistant harmonic components in the square envelope bispectra. The extracted results are then integrated to isolate fault characteristics, enabling the efficient detection and diagnosis of planetary gearbox faults. To address the challenge of extracting weak fault features in rolling bearings, Yang et al. [
13] proposed an amplitude modulation bispectrum method. This approach enhances feature extraction by reconstructing signal amplitude in the frequency domain and adjusting component proportions to highlight fault features. Zou et al. [
14] proposed the TFMB (Time-Frequency Modulation Bispectrum), which uses a short-time Fourier transform to obtain the time-frequency spectrum, preserving both time and frequency information. The amplitude results are then applied to bispectral demodulation, accounting for the signal’s time-varying characteristics to achieve more accurate demodulation. However, in the early stage of bearing faults, the fault information is characterized by low amplitude, which is highly susceptible to noise interference.
In recent years, the methods for enhancing bearing fault characteristics based on quantitative periodic impulse metrics such as kurtosis [
15,
16], entropy [
17] and Gini index [
18] have developed rapidly with their superior performance. Kurtosis is defined as the ratio of the squares of the fourth-order moments and the second-order moments of a signal. Minimum entropy deconvolution can achieve signal impact feature enhancement by designing an optimal filter based on the criterion of maximizing the kurtosis of the filtered signal [
15], but the method is highly susceptible to the influence of random pulses. Antoni et al. [
19,
20] formally defined SK (Spectral Kurtosis) based on the Wold-Cramér decomposition of conditionally non-smooth processes, highlighting its ability to identify non-Gaussian components and their frequency-domain locations. They demonstrated its effectiveness in diagnosing rotating machinery faults through experimental and test signals. The Fast Kurtogram is an efficient estimation algorithm used for fault signal demodulation by computing the SK of each subband to localize resonance bands [
15]. As research progresses, scholars have found that the SK is highly sensitive to noise and random pulses, making it unsuitable for detecting periodic fault pulses. Consequently, various periodic pulse measures have been proposed for bearing fault characteristics. Miao et al. [
18] verified the robustness of the Gini index against random impulse disturbances and proposed a blind deconvolution method with enhanced infographics based on it. While the study clarified the definition of the Gini index and verified its effectiveness in enhancing bearing fault features, the sorting process required for its calculation increases computation time and limits its application. In addition to this, there are scholars who add periodic a priori knowledge into periodic impulse metrics. For example, McDonald et al. [
21] proposed maximum correlation kurtosis deconvolution, which iteratively optimizes filter coefficients to maximize the correlation kurtosis of filtered signals. McDonald et al. [
22] also introduced multipoint optimal minimum entropy deconvolution, adjusted to maximize the multipoint D-paradigm, while Buzzoni et al. [
23] developed maximum second-order cyclostationarity smooth blind deconvolution. Additionally, McDonald et al. [
22] proposed cyclostationarity-based deconvolution, which aims to maximize the second-order cyclic smoothness metric of filtered signals. The above methods demonstrate excellent effectiveness in extracting fault features for the target period but have notable limitations, including high sensitivity to input parameter accuracy and low computational efficiency. To address these issues, many researchers have proposed various sparse indexes that do not rely on prior knowledge of cycles yet remain sensitive to periodic fault pulses.
Antoni et al. [
17] proposed a periodic pulse detection technique, named Infogram, based on the negentropy of the signal’s squared envelope and squared envelope spectrum. This approach applies the concept of thermodynamic entropy, interpreting fault states as deviations from equilibrium, with signal entropy used to quantify the fluctuation of the energy flow. Since bearing fault signals are second-order cyclically smooth, their energy flow exhibits noticeable periodic fluctuations, and the negentropy of the squared envelope and the squared envelope spectrum effectively capture this characteristic. Due to the strong correlation between neighboring pulses and the weak autocorrelation of random noise, the period characteristics can be enhanced by correlation processing [
24]. Fault-induced shocks can disrupt the system equilibrium and significantly reduce the entropy of the signal after correlation processing, so Zhang et al. [
25] proposed correlation spectral negentropy (CSNE) as a way of adaptively extracting frequency bands containing fault information for diagnosis. Simulated and experimental results demonstrate that the index effectively suppresses random pulses and noise, remains highly sensitive to periodic pulses, and efficiently extracts rolling bearing fault characteristics.
This paper proposes bispectral slice negentropy analysis as a novel method for fault identification. This approach demodulates the fault signal by leveraging the intrinsic modulation characteristics of the signal, generates a bispectrum with sparse features, and achieves accurate fault diagnosis in a high-background-noise environment. This effectively compensates for the limitations of existing methods. Subsequently, the bispectral frequency slices are computed based on the periodic pulse sensitivity of the CSNE. The resulting curves effectively reveal fault information, enabling the extraction of fault characteristic frequencies and harmonics, and achieving accurate fault diagnosis even in high-noise environments. The structure of the paper is organized as follows:
Section 2 introduces the fundamentals of the BSNA method, including
Section 2.3, which illustrates the methodological workflow using a simulated signal.
Section 3 evaluates the effectiveness of the proposed approach by extracting fault characteristics from a newly generated simulation signal.
Section 4 explores the application of BSNA to the actual bearing fault data, focusing on outer and inner ring faults. Finally,
Section 5 summarizes the paper.
2. Methodology
2.1. Theory of Time-Frequency Modulation Bispectrum
The Modulation Signal Bispectrum (MSB) leverages the inherent modulation characteristics of a signal to extract and identify fault-related characteristics. Given
as the original vibration signal, the MSB can be mathematically expressed as follows:
where
represents the mathematical expectation,
denotes the Fourier transform of
, and
is the complex conjugate of
. Parameters
and
correspond to the center frequency and modulation frequency, respectively. The terms
and
represent the lower and upper frequency bands. Simultaneously,
and
illustrate secondary nonlinear coupling phenomena in the modulated signal.
To identify fault characteristics, frequency slices can be extracted using the MSB detector. This process involves integrating and averaging
as the initial step:
where
represents the resolution of the modulation frequency. To reduce the error of the results, the fault characteristic frequency is determined by averaging multiple suboptimal slices with high peak values.
where K represents the total number of selected suboptimal slices.
The averaging effect introduced by the Fourier transform during computation may obscure certain transient nonlinear features. To address this, the formula of the time-frequency modulation bispectrum (TFMB) is generalized to the time-frequency domain and expressed as follows:
where
is denoted as the short−time Fourier transform of
, and
is the complex conjugate of
.
denotes the center frequency, while
represents the modulation frequency. The combinations of
and
characterize the quadratic nonlinear coupling phenomenon in the modulated signal.
If
and
are quadratically nonlinearly coupled, their phase satisfies the following relationship:
Substituting into Equation (5) sets the phase to zero, resulting in
corresponds to the maximum statistical expectation of the product of four absolute values, characterized by a prominent peak in the bispectral results.
To demonstrate the effectiveness of the TFMB in capturing the relationship between resonance bands and modulation frequency while preserving crucial fault information, a simulation signal is constructed to replicate an outer ring fault. The parameters are defined as follows: amplitude
, intrinsic frequency
, damping coefficient
and repetition period
. The calculated characteristic frequency of the bearing’s outer ring fault is
. Interference signals,
and
, are added with amplitudes
and
, and intrinsic frequencies
and
, respectively. Gaussian white noise,
, with a SNR of −9 dB is also introduced.
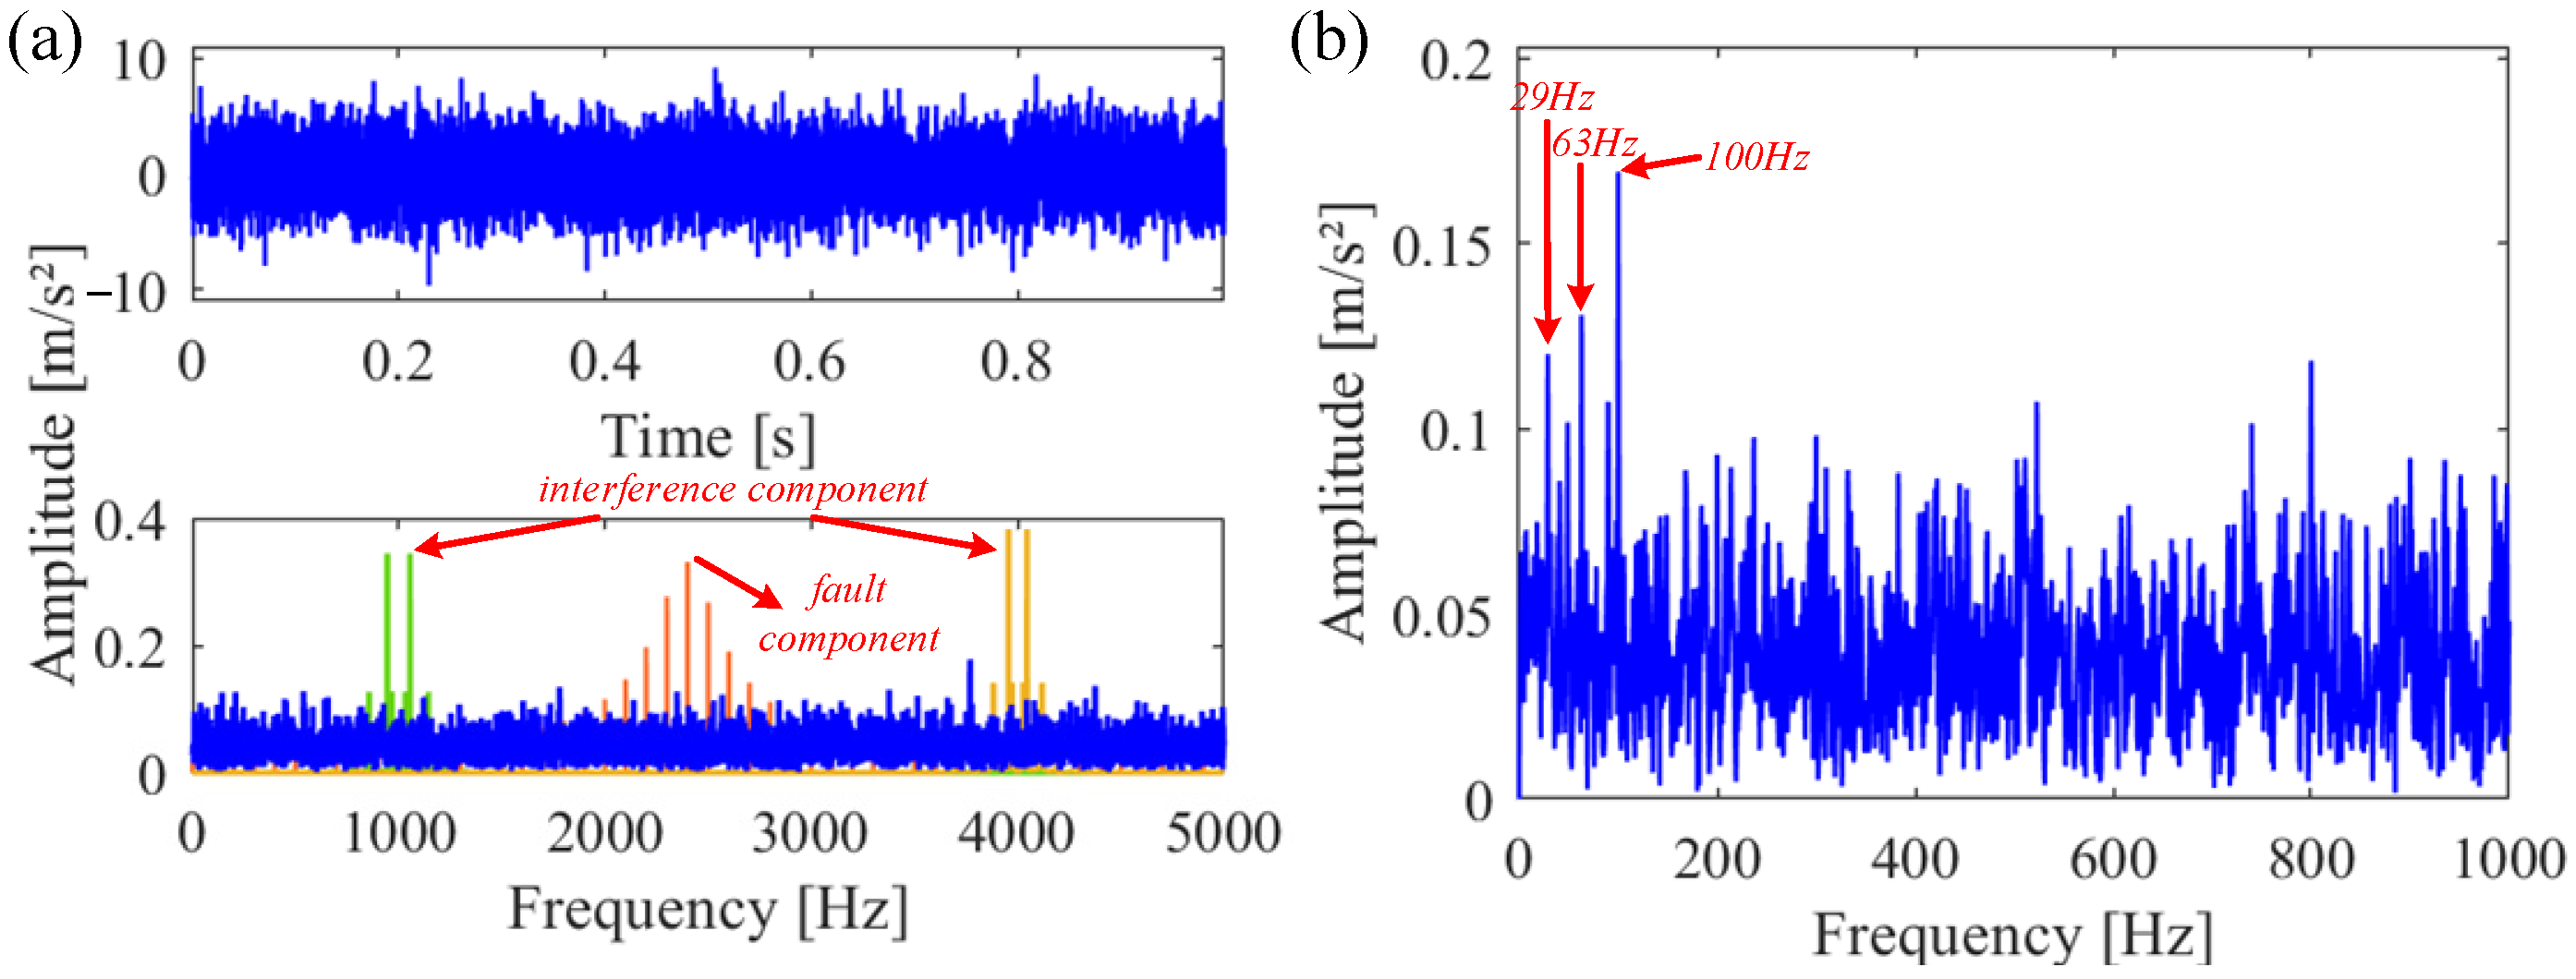
As shown in
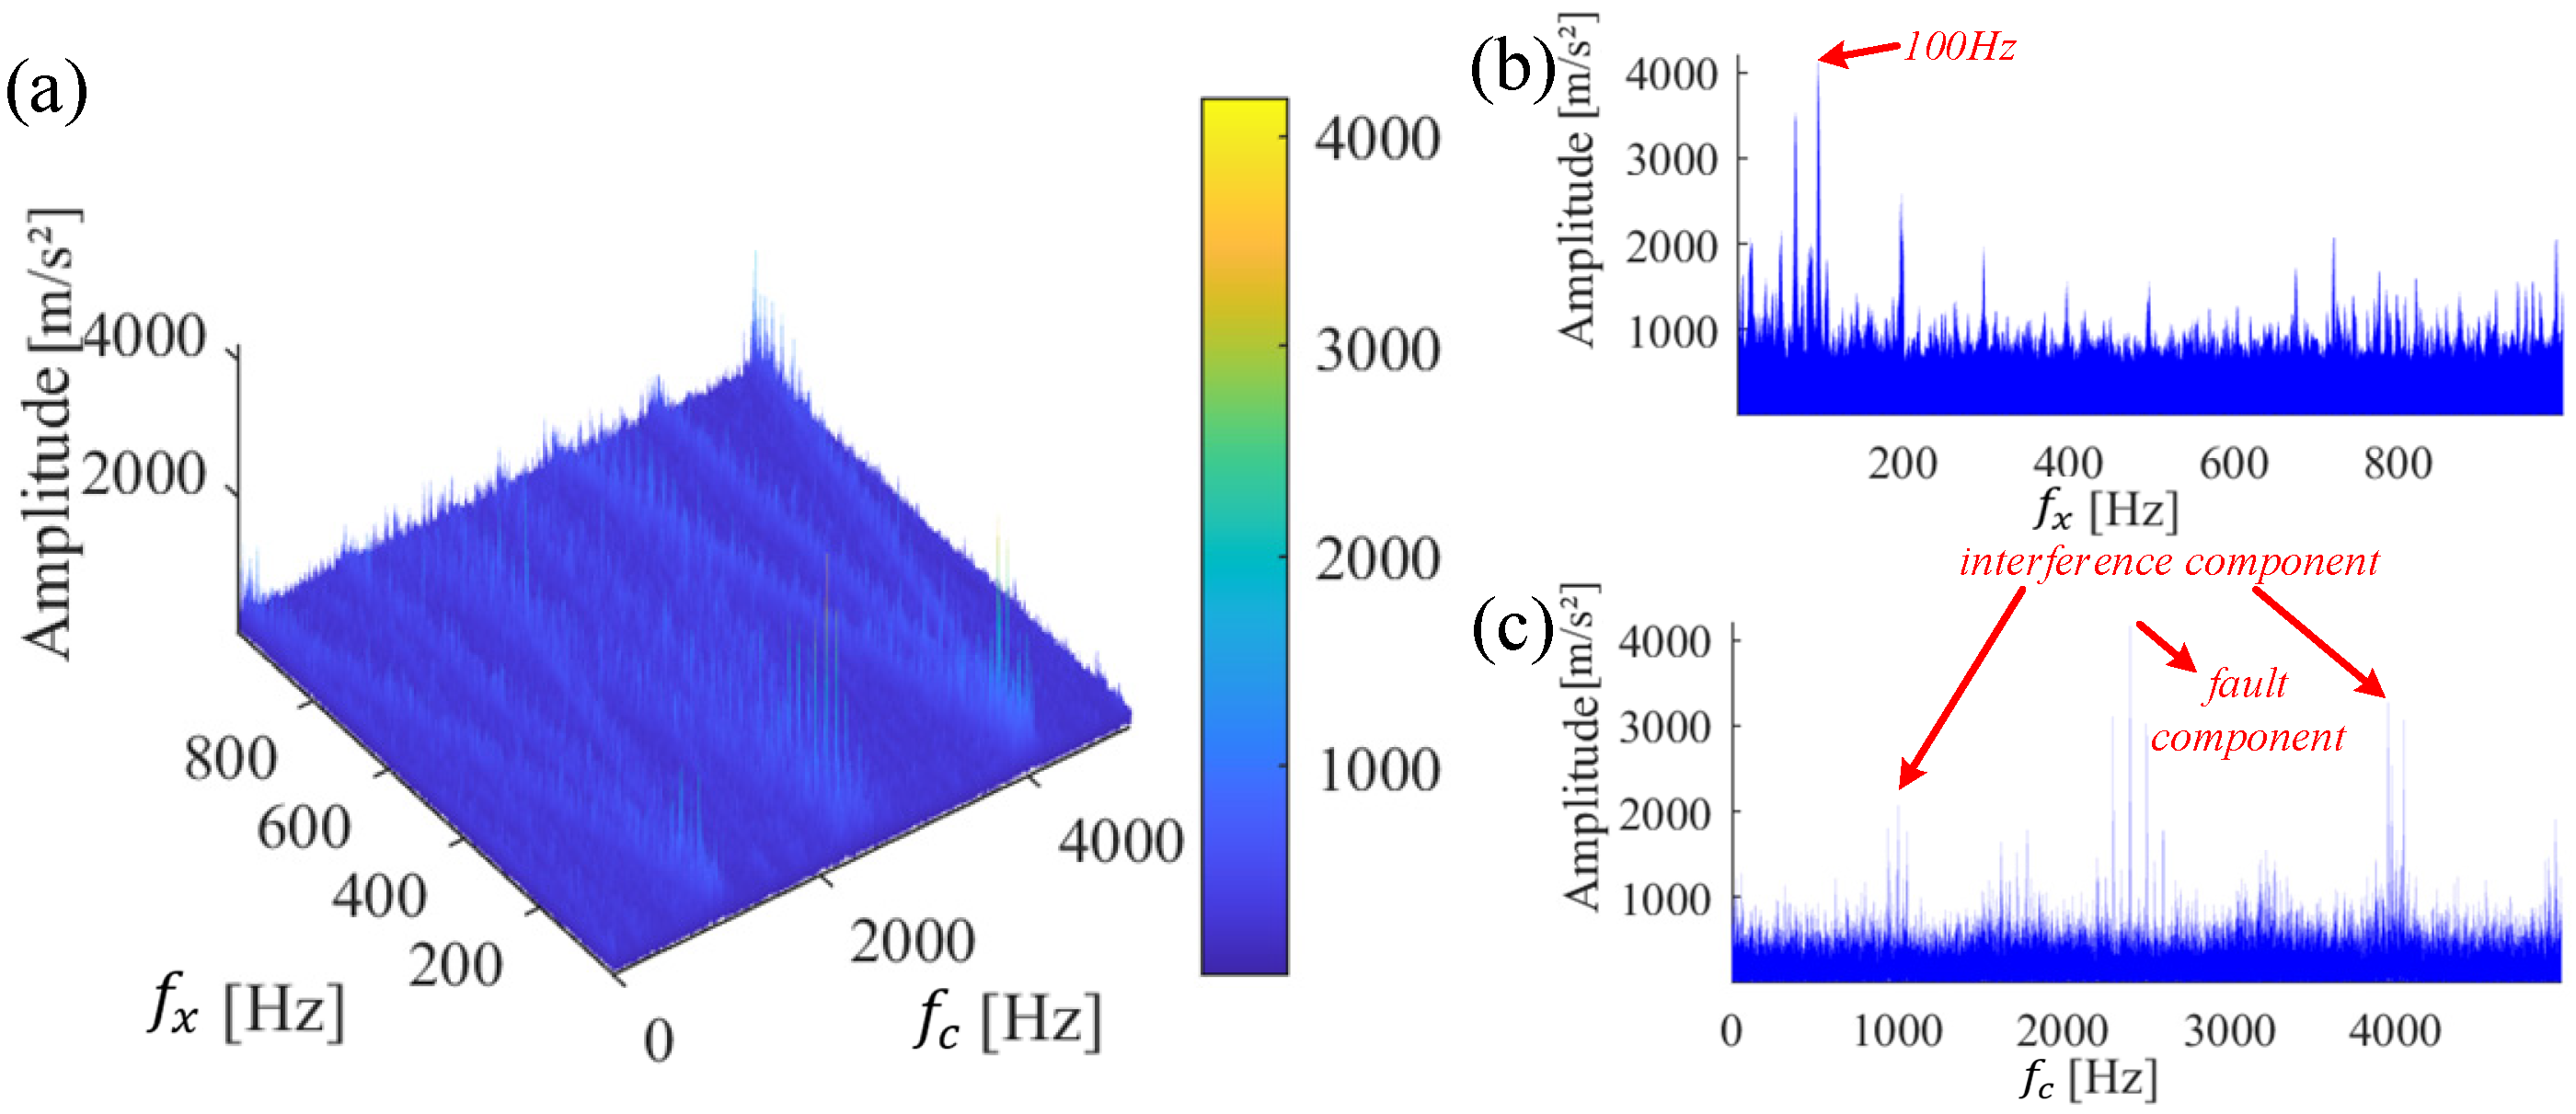
Figure 1a, the fault information in the spectrum is located at the resonance band centered at 2400 Hz. However, due to the high noise level and the significant amplitude of interference components, the envelope spectrum is unable to identify the fault characteristic frequency. To address this, TFMB demodulation is applied. The process involves first plotting the time-frequency spectrum, followed by generating the TFMB using Equation (4). The results are presented in
Figure 2.
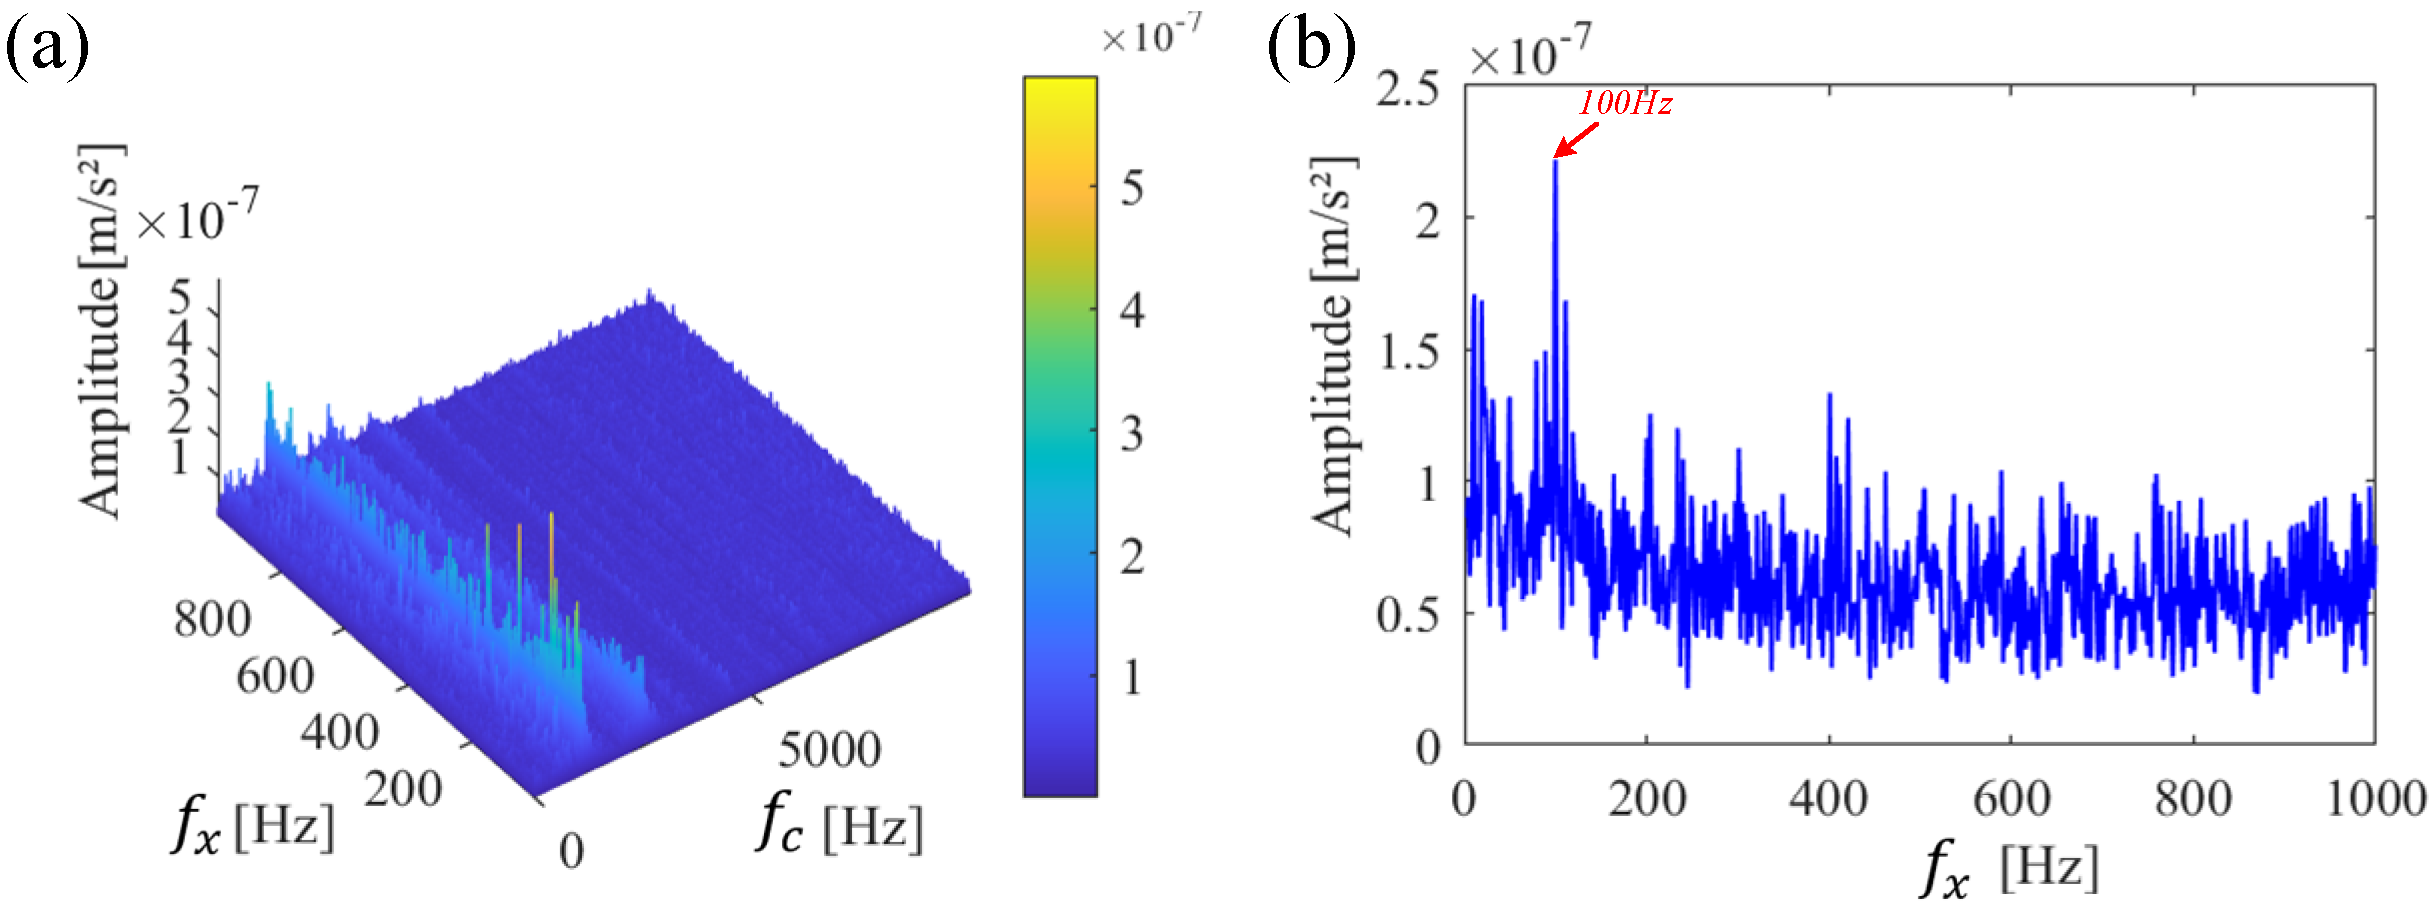
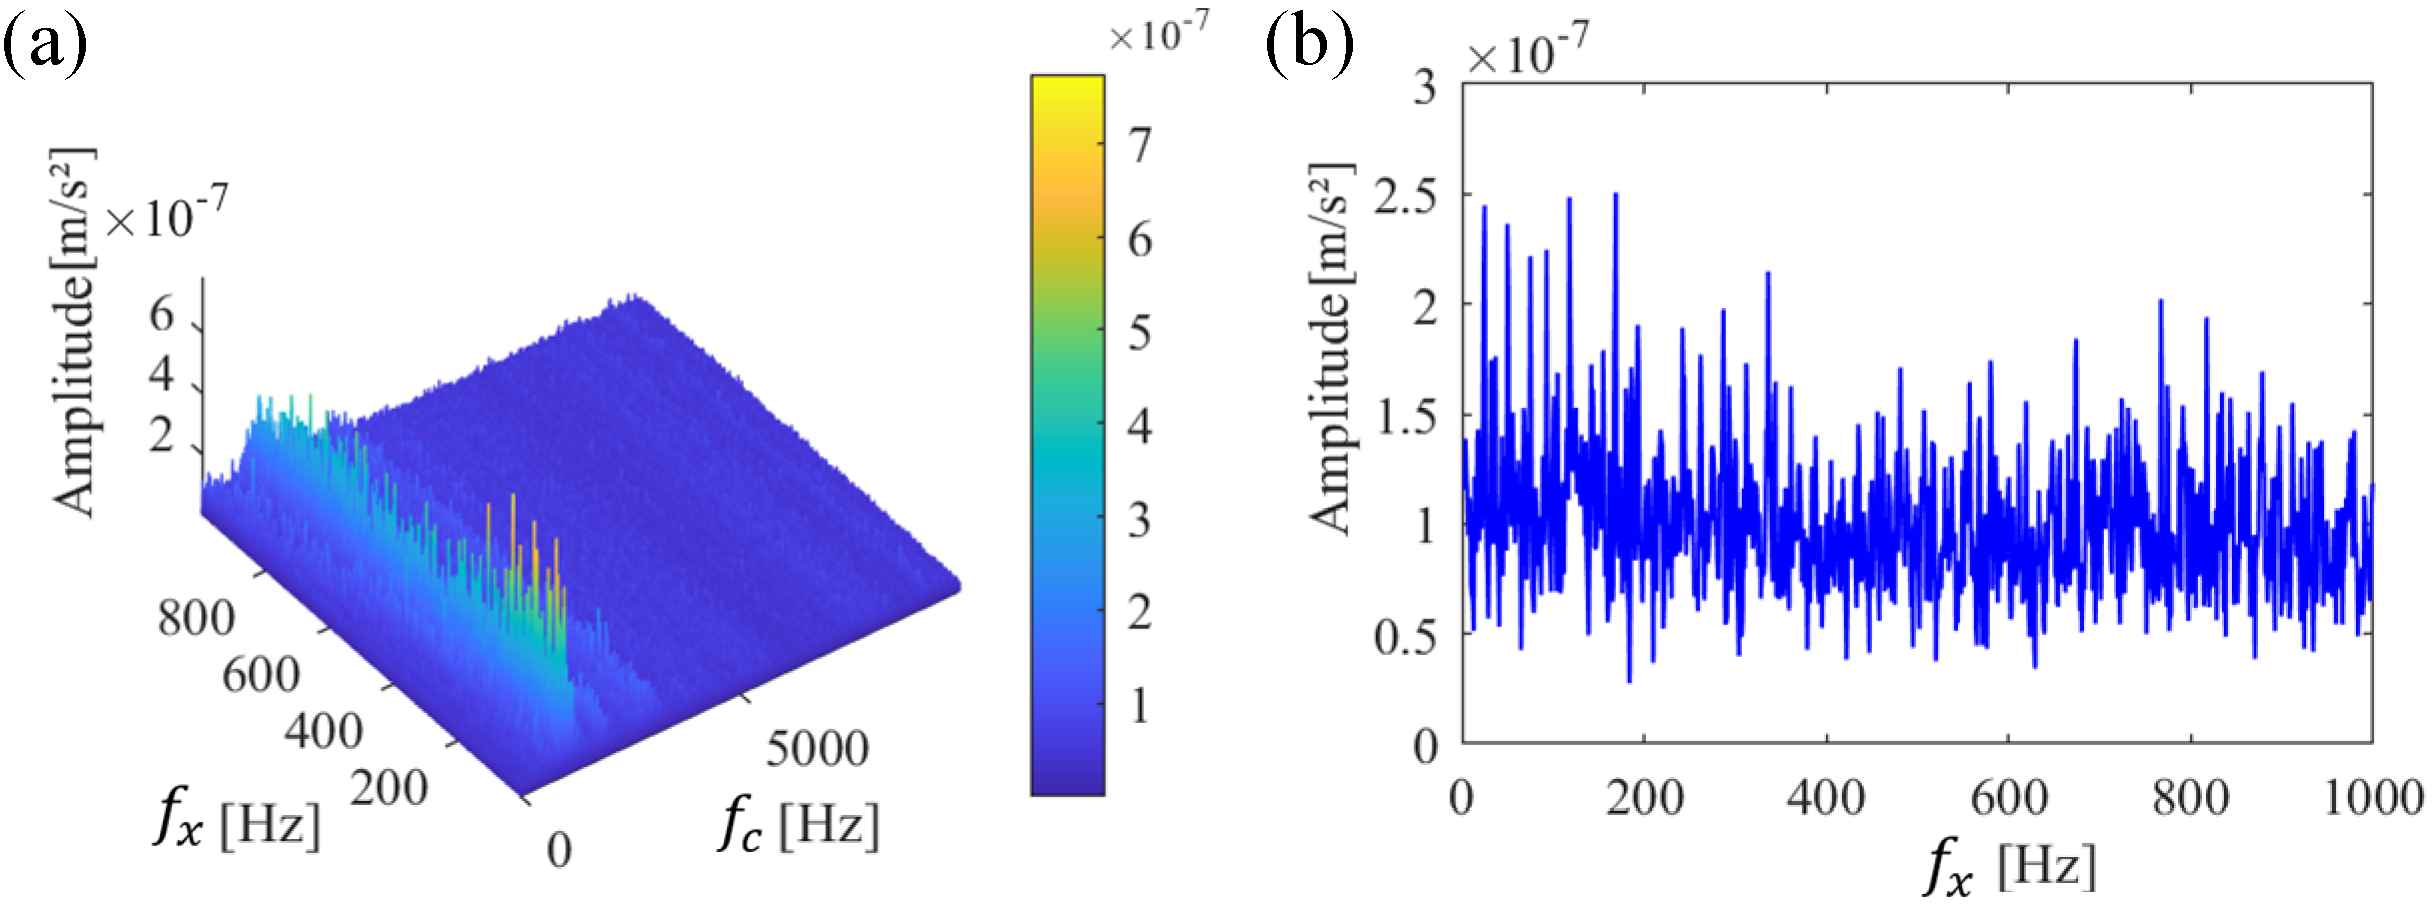
Figure 2b,c displays the projection characteristics of the bispectrum on planes corresponding to the modulation frequency and center frequency, respectively. When analyzed along the modulation frequency direction, the projection is similar to the envelope spectrum. However, compared to the traditional envelope spectrum, the bispectral projection significantly suppresses the amplitude of interference spectral lines, making the fault characteristic frequency more distinct. In the center frequency direction, the projection is similar to the spectrum of the signal but offers enhanced resonance band definition where fault information resides, while simultaneously reducing the amplitude of irrelevant components. It follows that the TFMB can highlight the resonance bands and modulation frequencies more effectively, thus retaining essential fault information.
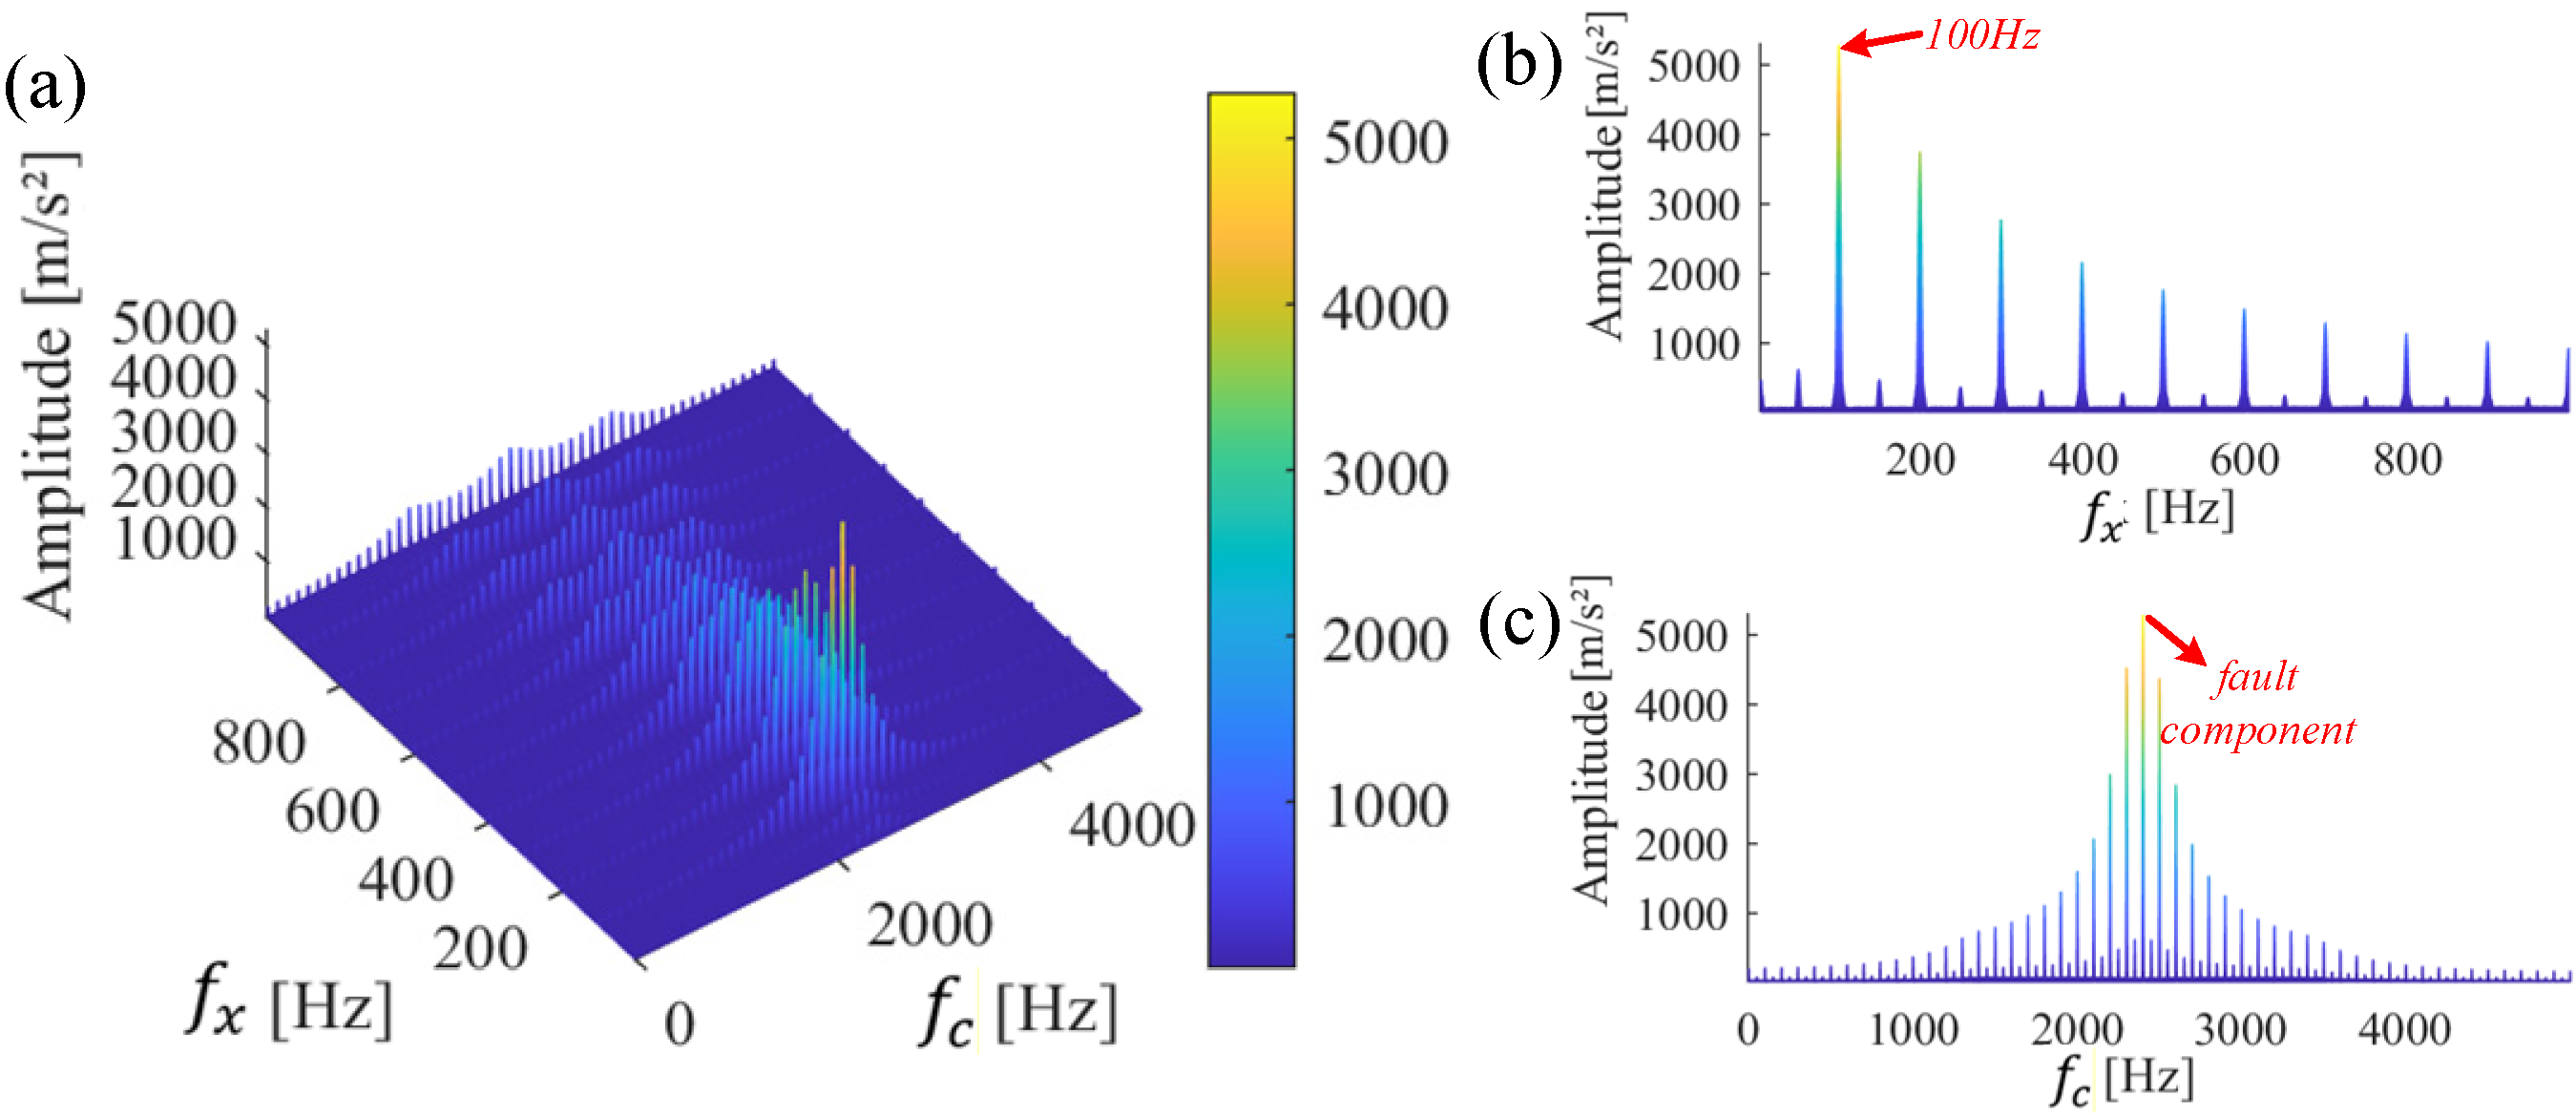
Figure 3 shows the TFMB of the periodic pulse component
caused by the outer ring fault, along with its projection onto the plane of modulation and center frequencies. The figure demonstrates that this bispectrum method effectively preserves critical information about the outer ring fault and efficiently extracts the fault characteristic frequency under ideal noise-free conditions. This highlights the advantages of the TFMB in revealing the relationship between resonance bands and modulation frequencies. It also effectively preserves critical fault characteristics, showcasing its significance in fault diagnosis applications.
2.2. Theory of Correlation Spectral Negentropy
Entropy, originally a measure of system chaos in thermodynamics, was later introduced into information theory to detect nonlinear and nonsmoothed signal components [
14]. Antoni [
5] has shown that entropy can be interpreted as a probability distribution of the instantaneous energy flow of a signal. Since the fault impulse component of a failing bearing can be approximated as a second-order cyclic smooth signal with periodic energy fluctuations, entropy proves effective for identifying the fault shock component within the signal.
Set the acquired vibration signal as
, with its spectrum
obtained through the Fourier transform. The spectrum is divided into
frequency bands, indexed as
. The boundaries of the
-th frequency band are represented as
, with a center frequency of
and a bandwidth of
. Thus,
can also be expressed as
. The squared envelope within this frequency band is
, which has a time−domain equivalent
,
representing the squared envelope of the signal
in the frequency band
. The entropy of the squared envelope of the signal
in the frequency band
is defined as follows:
where
represents the computational average, and
represents the Hilbert squared envelope of the time-domain signal
within the frequency band
.
Negentropy is equivalent to information gain, and the negentropy of the squared envelope (NSE) of a signal is defined as follows:
The correlation between neighboring pulses amplifies periodic features through correlation processing, while the autocorrelation of random noise or occasional shock signals remains weak. The shock information caused by faults disrupts the original balance of the system, significantly reducing signal entropy after correlation processing. Thus, correlation spectral negentropy can effectively be used to detect unbalanced disturbances in the system.
The unbiased autocorrelation of the squared envelope in any frequency band is calculated as shown in Equation (10) and is illustrated schematically in
Figure 4.
where
is the delay factor,
.
The complex envelope of the optimized signal component in the frequency band
is represented as
and the instantaneous energy flow obtained by the square-envelope reconstruction can be expressed as follows:
Correlation spectral negentropy (CSNE) can be defined as follows:
2.3. The Proposed Bispectral Slice Negentropy Analysis Method
The vibration signals of bearing faults collected by sensors often exhibit complex dynamic features and high noise levels, reflecting the actual operating state of the bearing and potential fault modes. These signals are typically non-linear and non-smooth, making their analysis crucial for accurate fault diagnosis. However, due to the complexity of the actual operating environment, as well as the interference from various external factors during the operation of the equipment, the signals often have a high level of background noise and information from other mechanical components. This increases the difficulty of fault feature extraction and pattern recognition.
The information contained in the bearing vibration signals can be categorized into two types: fault-related information that reflects the health of the bearing, and irrelevant noise or redundant interference. In order to process the bearing fault data more effectively, this paper initially applies TFMB to preserve essential fault-related information and suppress irrelevant noise. It can be observed from
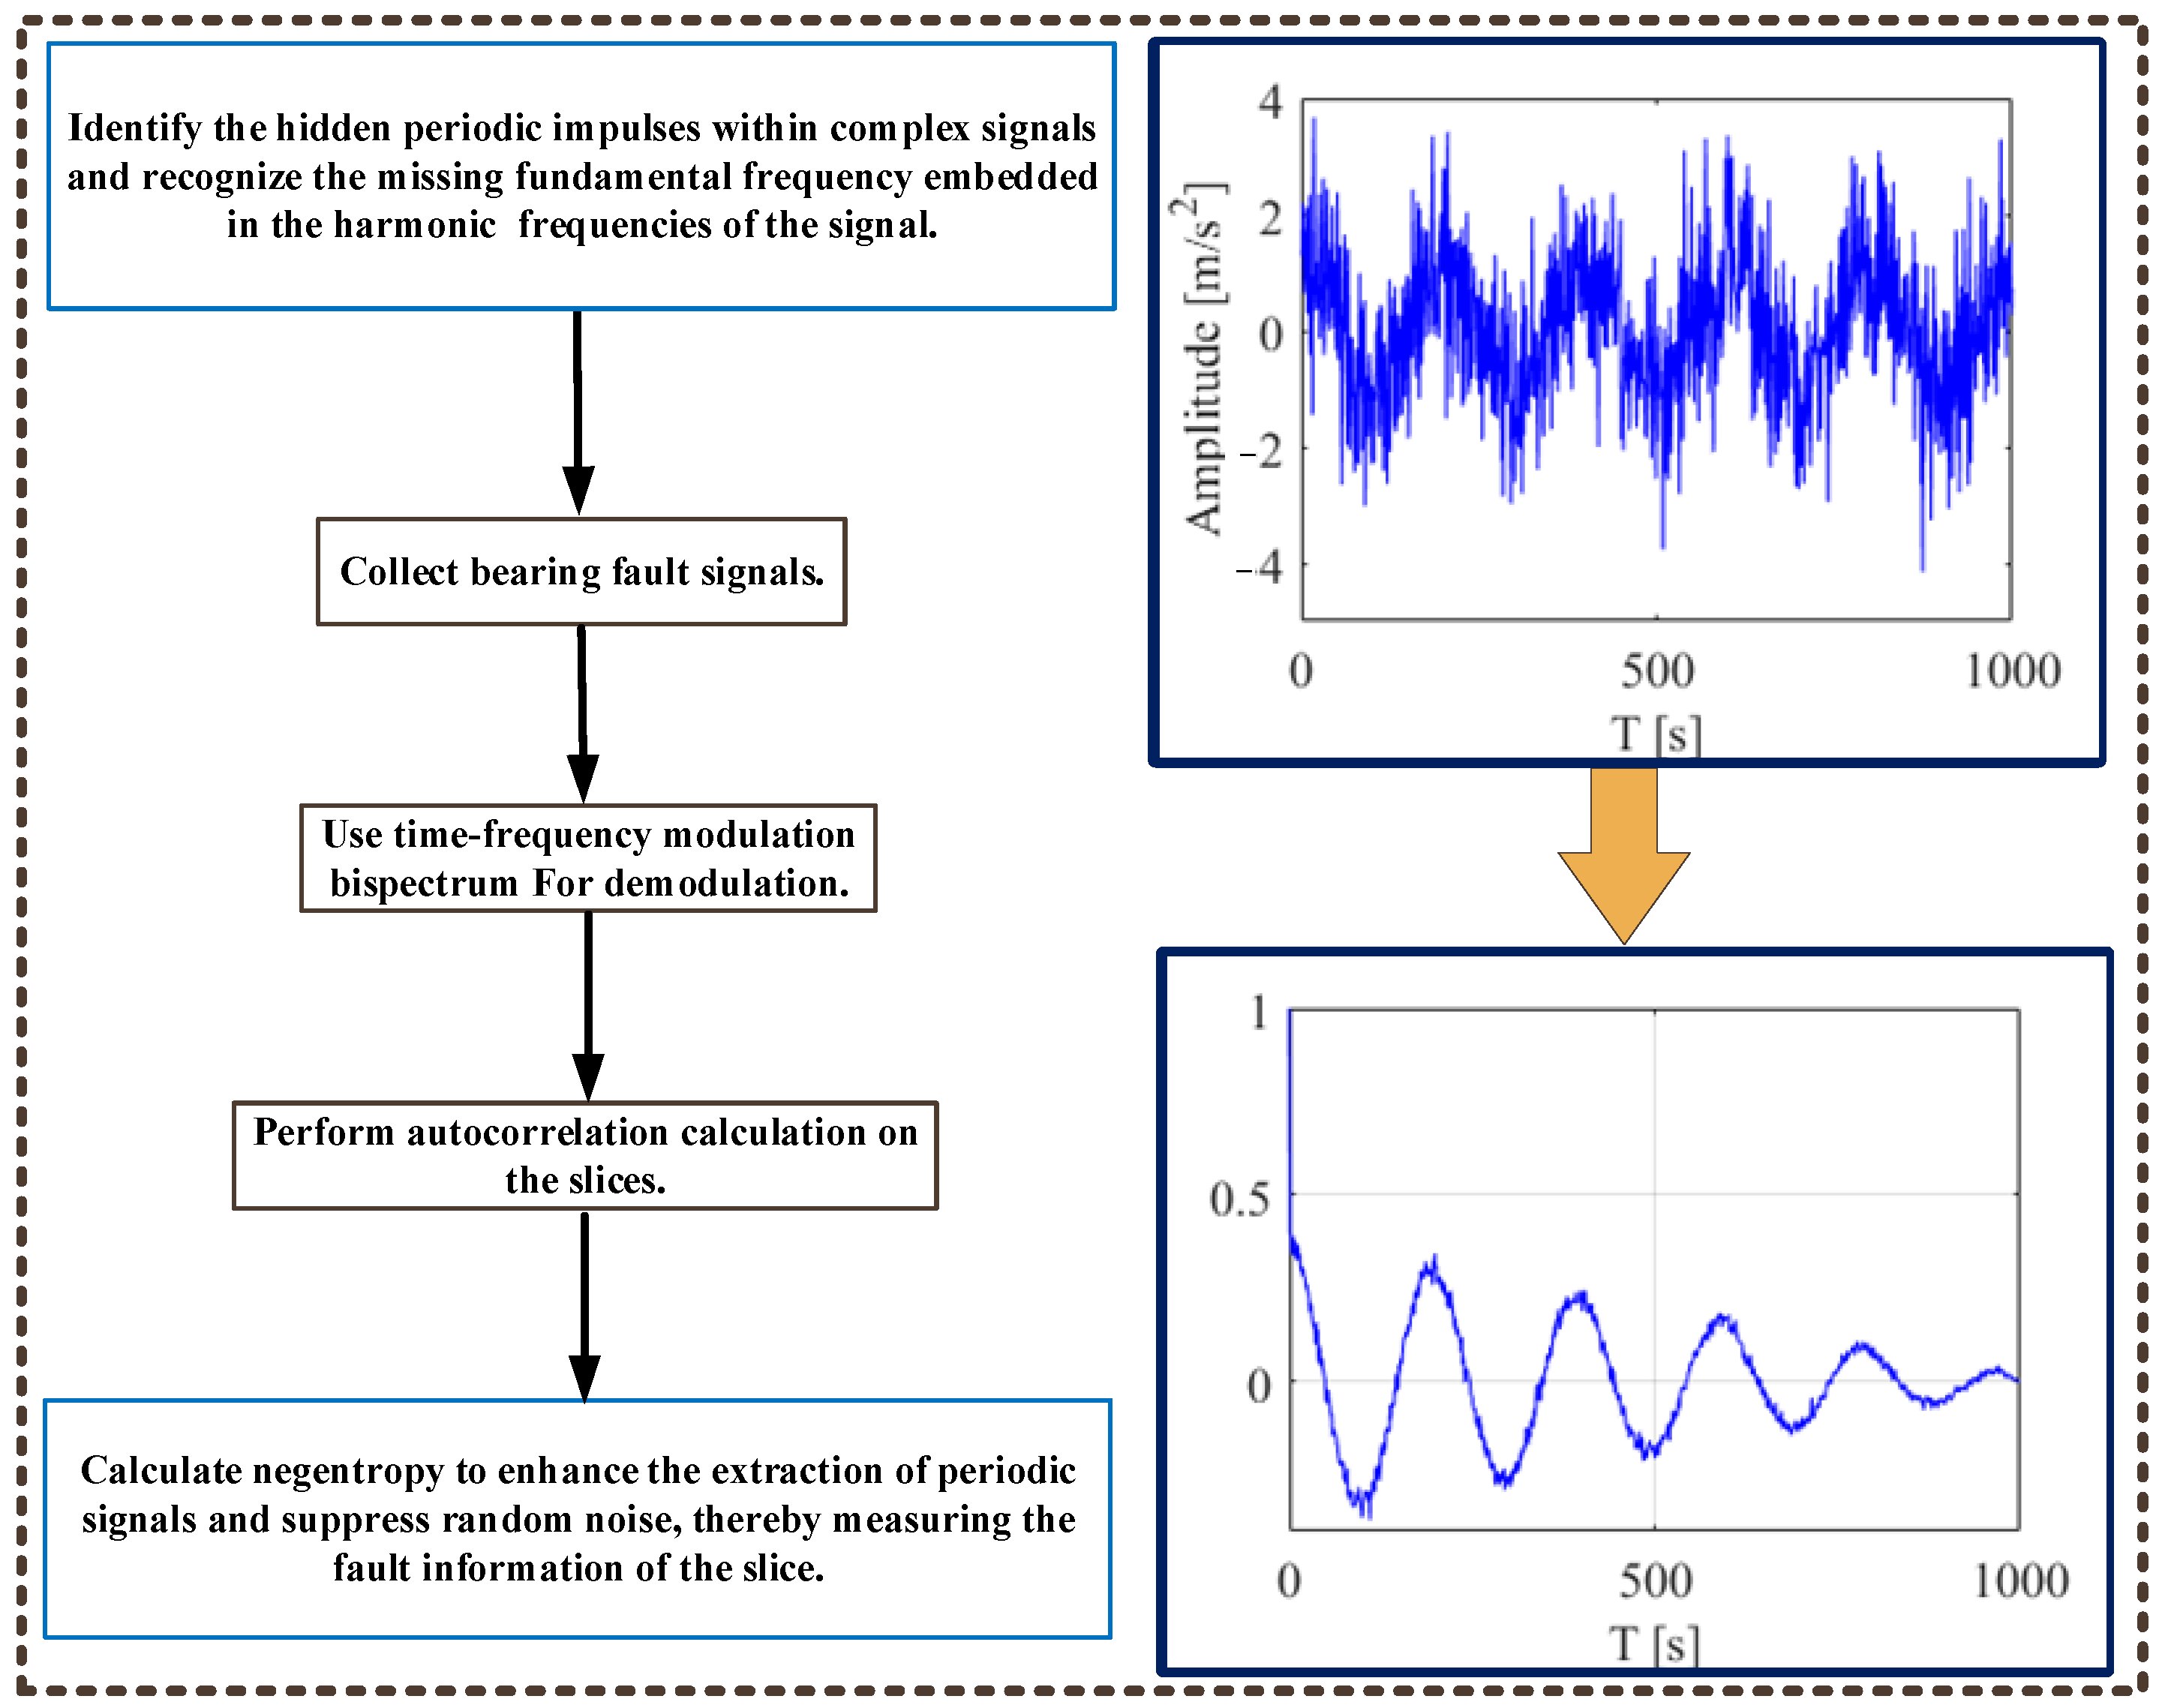
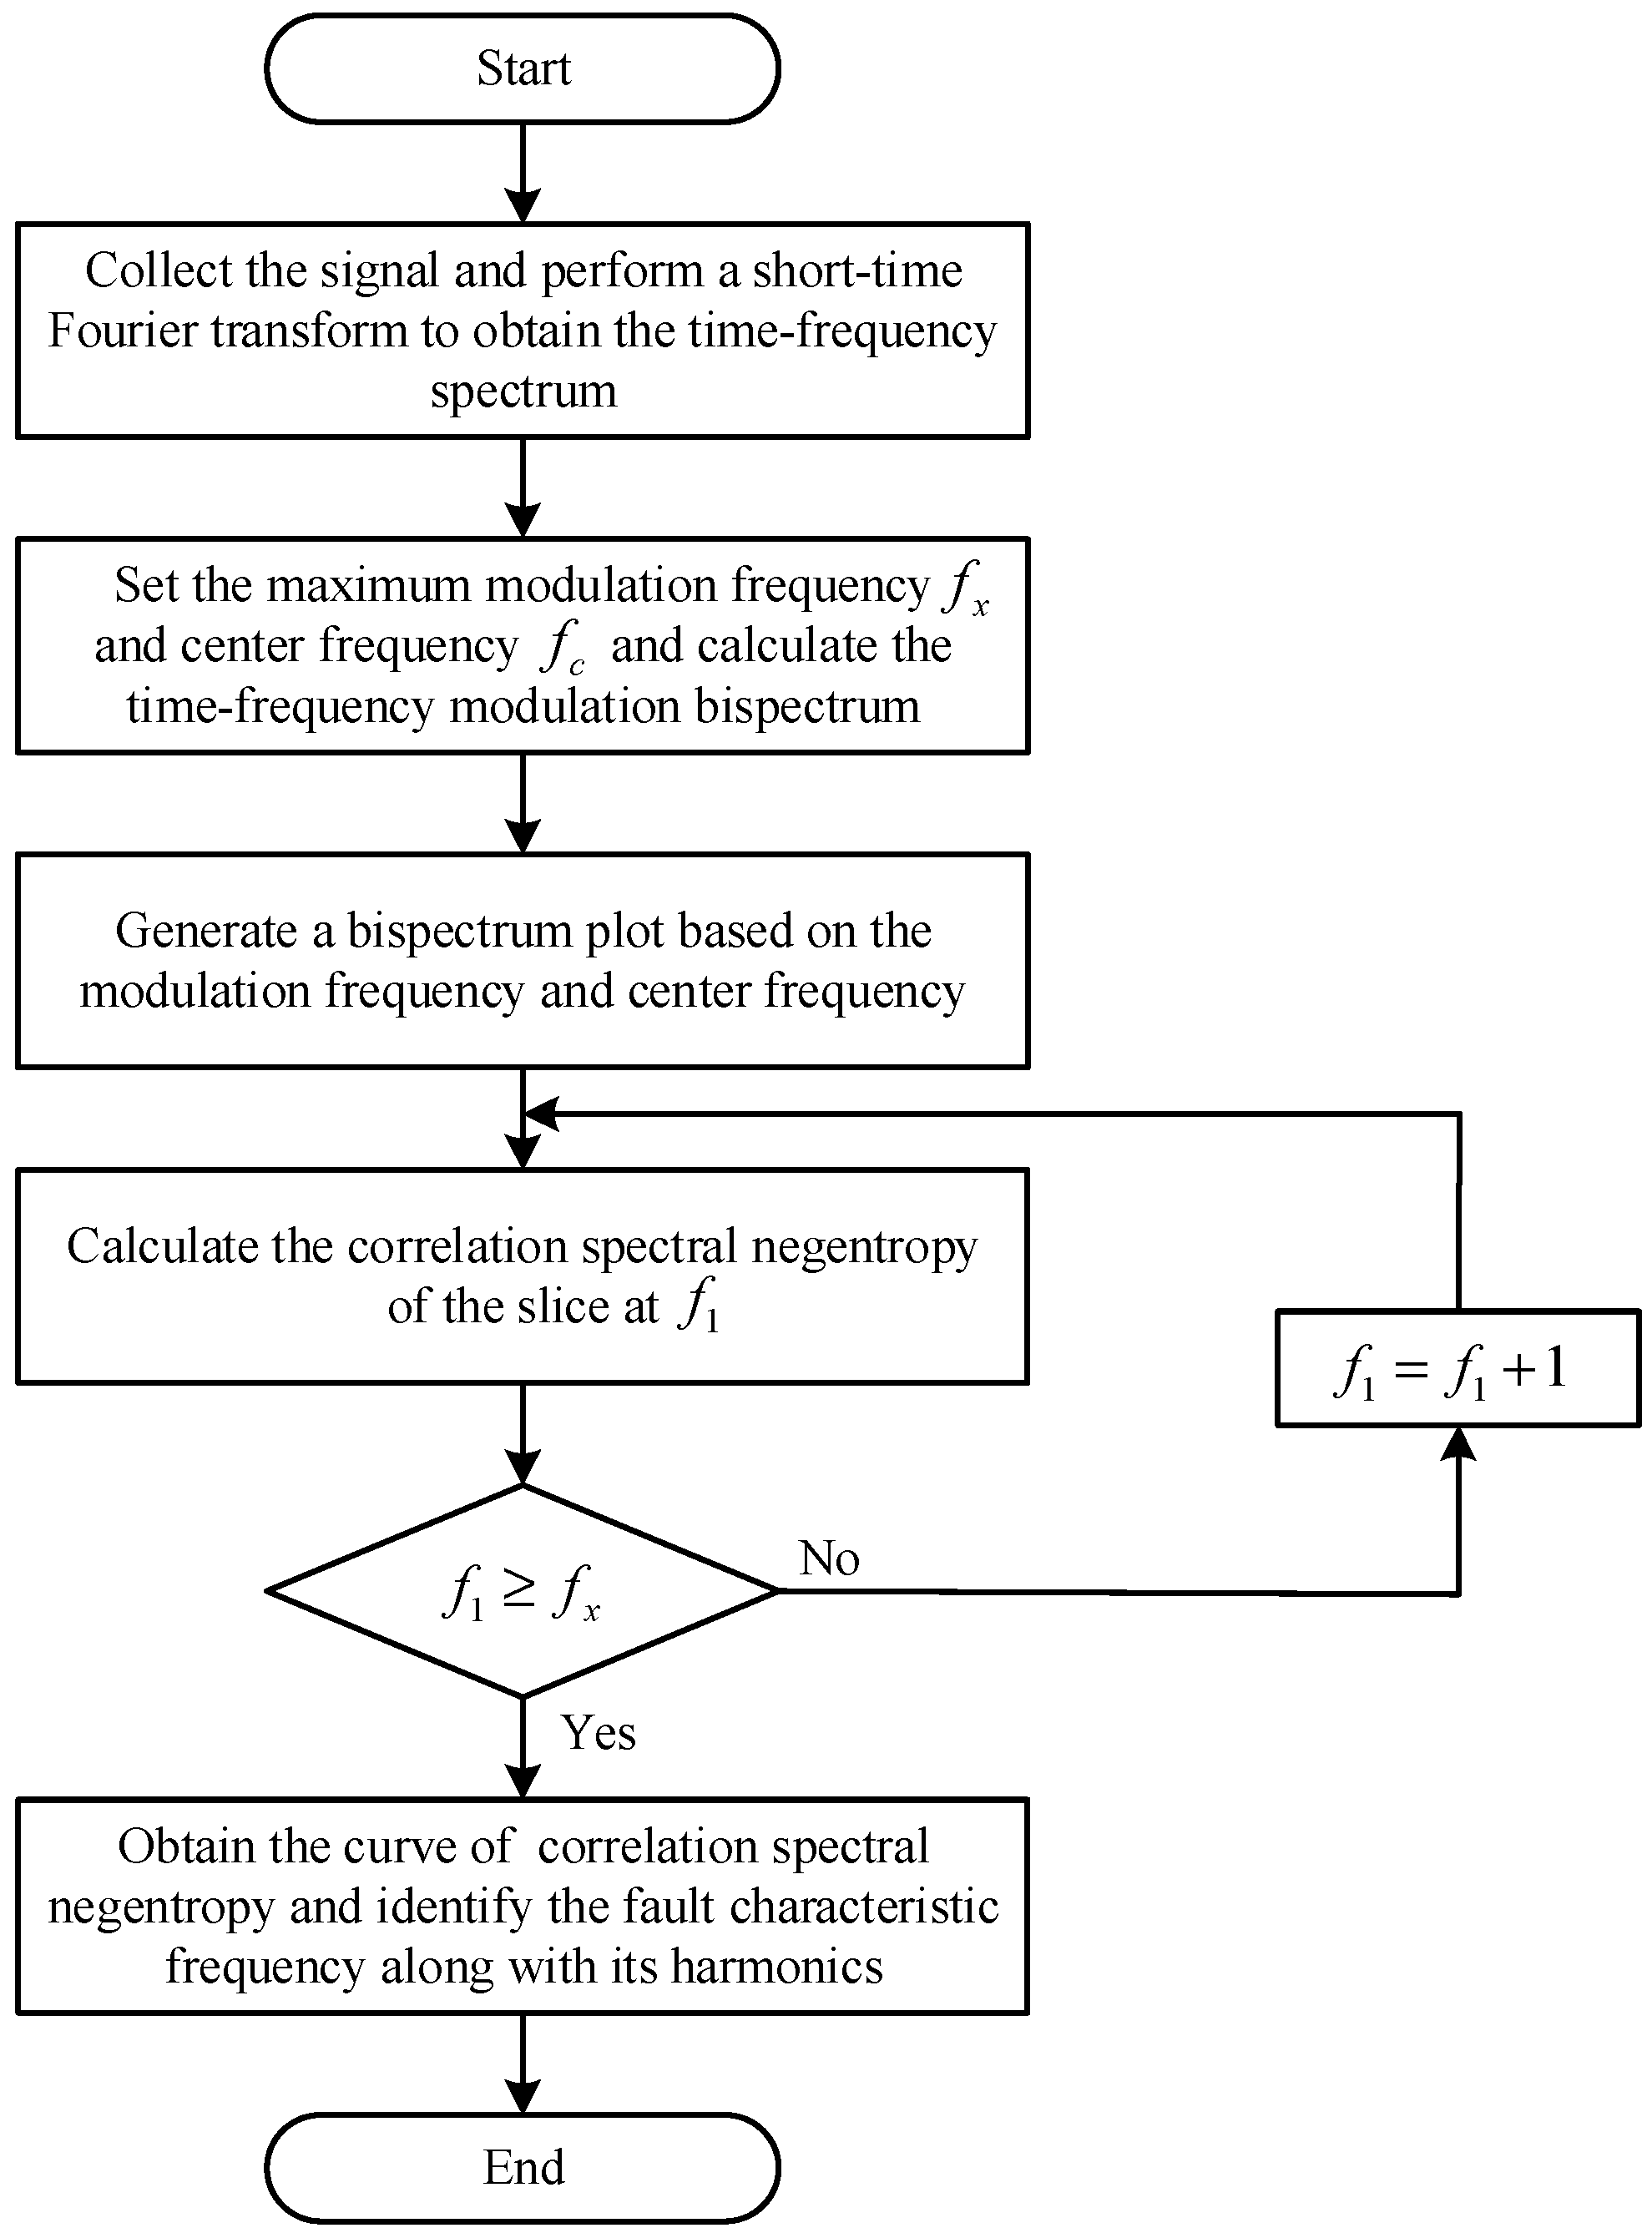
Figure 2 that the direct projection results of the time-frequency modulated bispectrum still contain noise interference components with relatively large amplitudes. Especially for early bearing faults, the extent of damage is minimal, and the vibration energy is low, resulting in weaker fault signals that are more challenging to detect and identify. Next, the CSNE for each modulation frequency slice is computed, and a corresponding curve is plotted. Since the CSNE highlights the energy of periodic pulses and quantifies the fault-related information within the slices, these curves exhibit higher energy and amplitude at the fault characteristic frequency and its harmonics, facilitating precise fault identification. The steps of the method are as follows, with the corresponding flowchart illustrated in
Figure 5.
Step 1: Acquire fault data and perform a short-time Fourier transform to generate a time-frequency spectrum.
Step 2: Compute the time-frequency modulation bispectrum, creating a bispectral plot of modulation and center frequencies.
Step 3: Conduct correlation spectral negentropy analysis on each modulation frequency slice to produce a correlation spectral negentropy plot.
Step 4: Identify the fault characteristic frequency and its harmonics by observing the curve, finally completing the fault diagnosis.
The simulation signal
of an outer ring fault, described in
Section 2.2, is used to demonstrate the proposed method in detail. The time-domain waveform is shown in
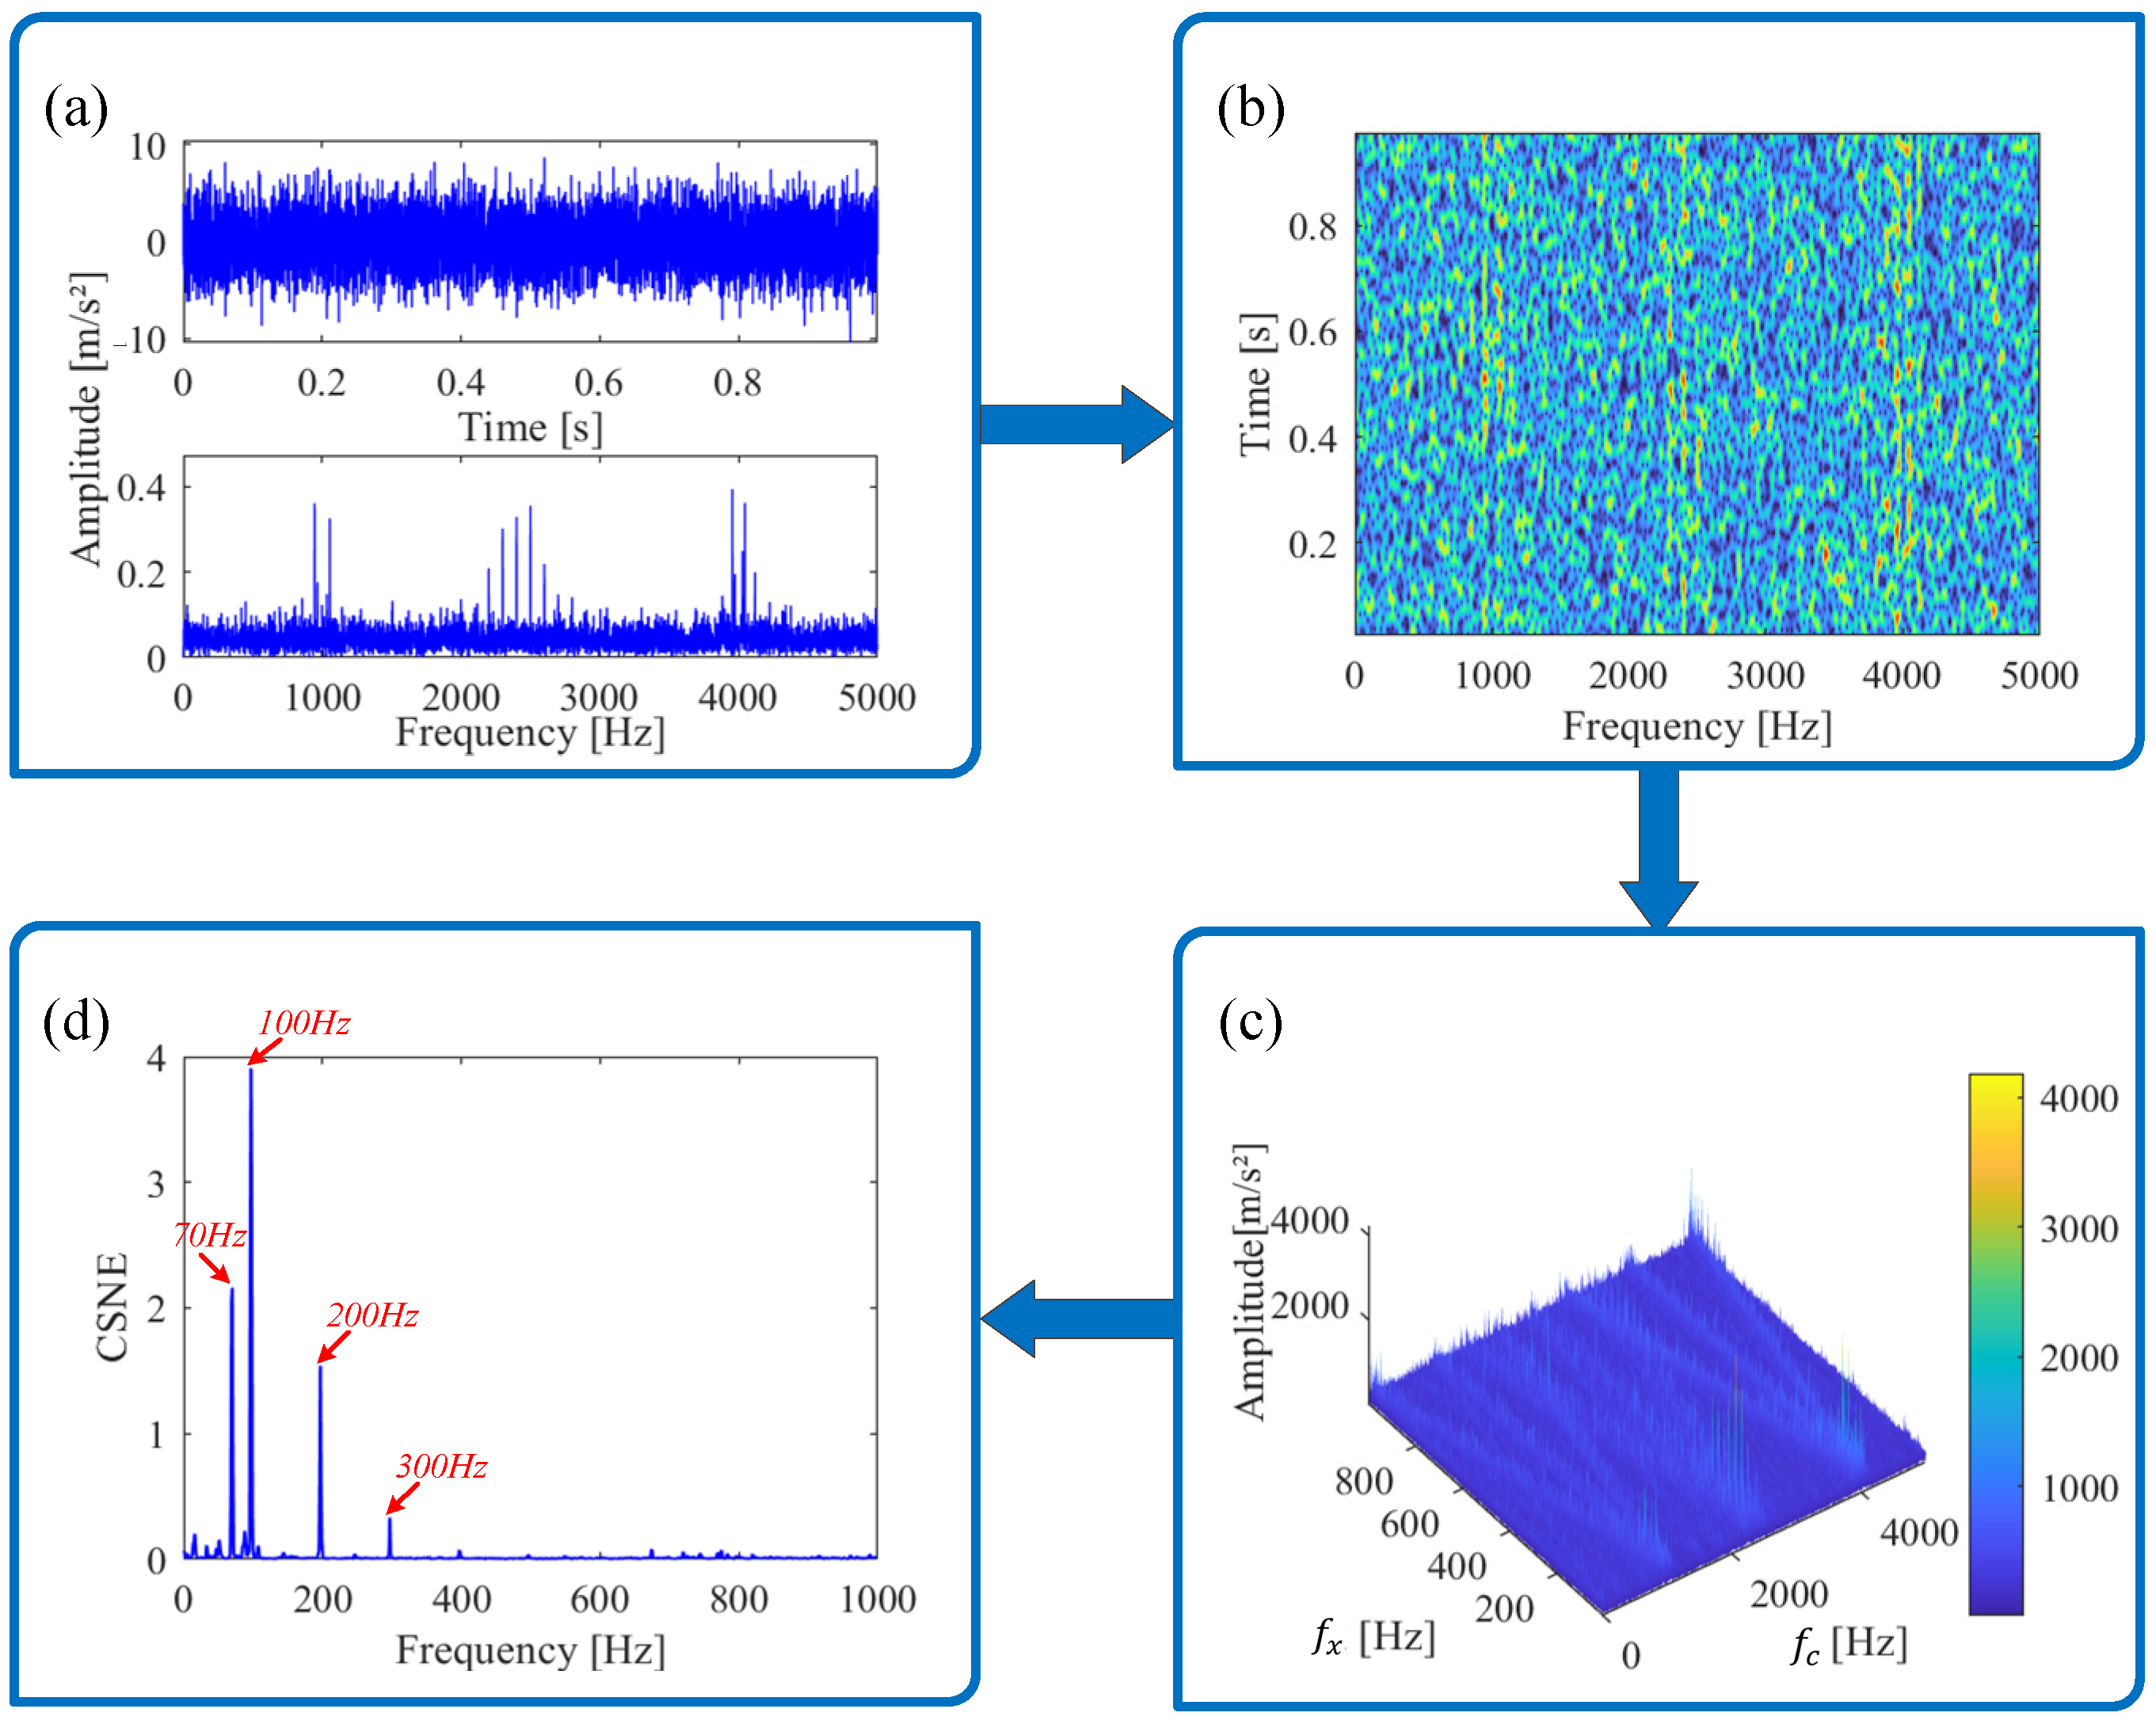
Figure 6a, where the signal is masked by noise and the periodic features in the signal are not observed. Subsequently, the time-frequency spectrum, obtained through STFT, is shown in
Figure 6b, based on which the TFMB is calculated according to Equation (4), and the resulting bispectral distribution is displayed in
Figure 6c. The calculation of the bispectrum further reveals the nonlinear coupling relationship between the modulation frequency and the center frequency, which lays the foundation for the extraction of fault characteristics. Then, using Equation (12), the CSNE for each frequency slice is calculated along the modulation frequency direction to quantify fault-related information. As shown in
Figure 6d, peaks in CSNE values are observed at 70 Hz, 100 Hz, 200 Hz, and 300 Hz, indicating strong correlations with fault characteristics in the simulated signal. It can be seen that the method proposed in this paper can effectively identify the fault characteristic frequencies of the simulation signal even under significant noise.
3. Simulation Signal Analysis
To verify the effectiveness of the proposed method, this section presents the design and simulation of an outer ring fault signal. The advantages of the method are demonstrated by analyzing the signal and comparing it with traditional envelope spectrum analysis, the conventional MSB detector analysis, and the bispectral slicing negentropy analysis. The following is the design, analysis process, and results of the specific signal.
where
simulates the repetitive shock signal of bearing failure, with an amplitude
, intrinsic vibration frequency
, damping coefficient
, and a repetition period
, corresponding to a fault characteristic frequency of
.
represents the pulse interference signal, incorporating two disturbance pulses with amplitudes of 30 and 40, corresponding to intrinsic vibration frequencies
and
respectively, and a damping coefficient
. The modulation signal of equipment operation is expressed as
, with an amplitude
. Additionally,
introduces Gaussian white noise with a SNR of −6 dB.
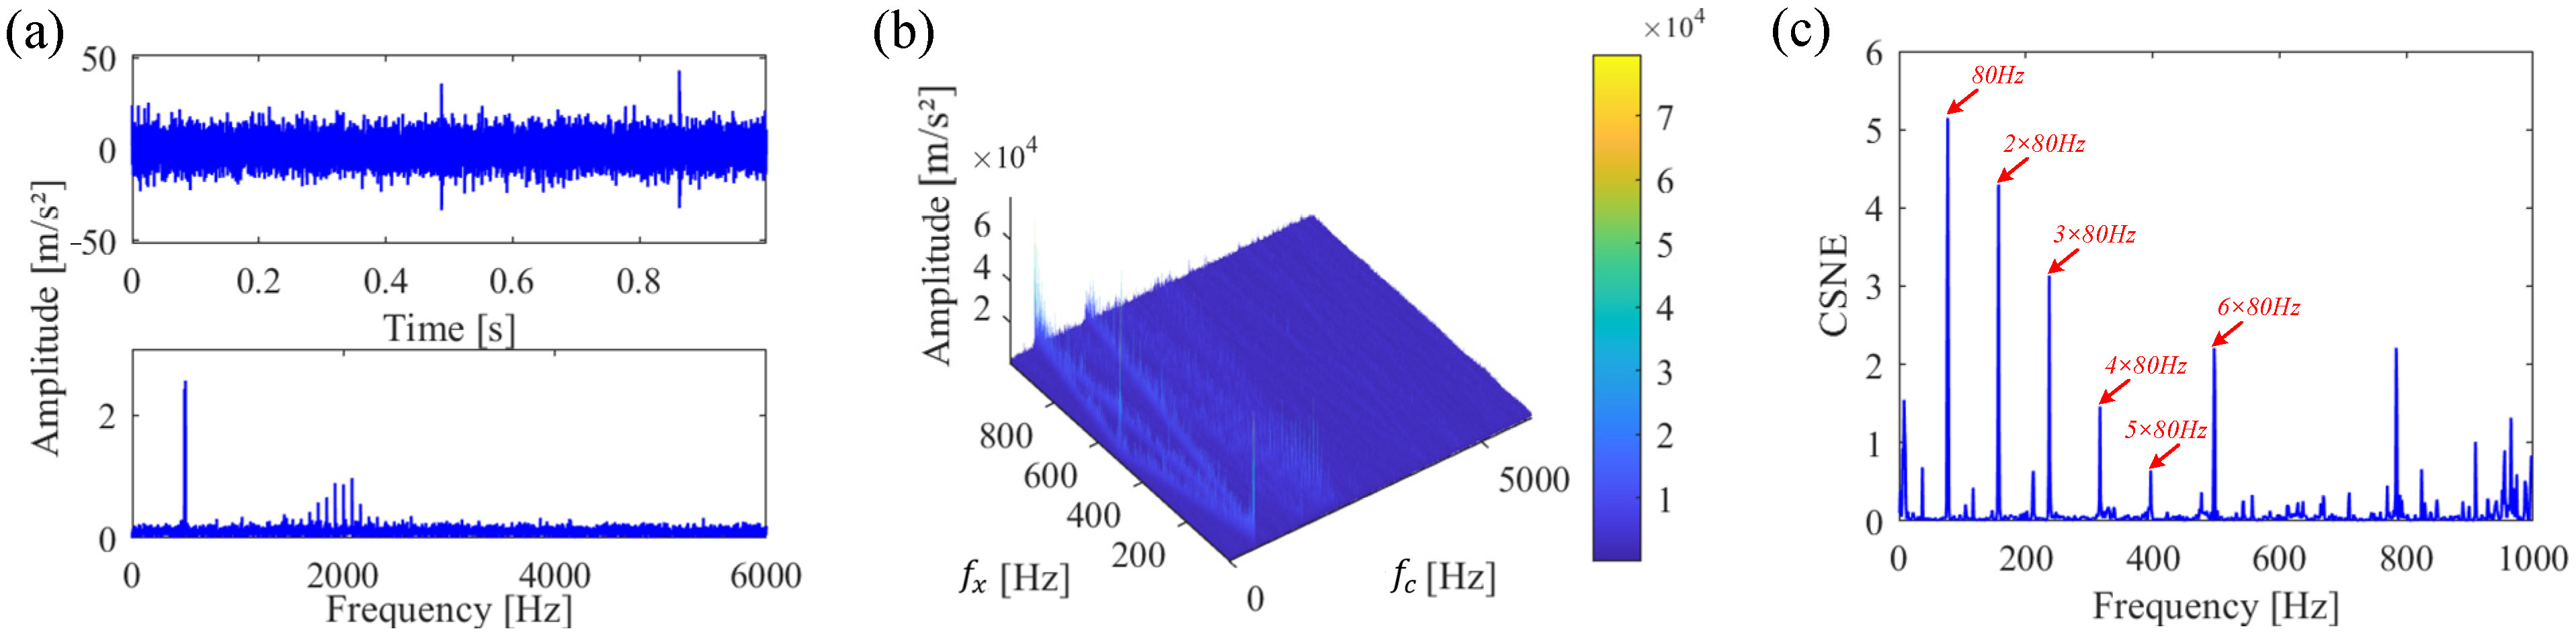
Figure 7a presents the time-domain waveform and frequency spectrum of the signal. Due to significant noise in the time-domain signal, the repetitive pulse components are heavily masked. To further reduce the noise, the signal is analyzed using the short-time Fourier transform and processed with the TFMB demodulation method, where the resulting 3D plot is displayed in
Figure 7b. The figure shows that a number of spectral lines with higher amplitude are extracted after demodulation, indicating the effective separation of specific frequency features. To more clearly identify the fault characteristic frequency, the CSNE values of each frequency slice are computed along the modulation frequency direction of the TFMB using Equation (12). This approach can detect periodic shock components and extract fault information, and the resulting frequency-dependent CSNE values are shown in
Figure 7c, where the noise amplitude is significantly reduced. The fault characteristic frequency of 80 Hz and its 2nd to 6th harmonics are clearly visible.
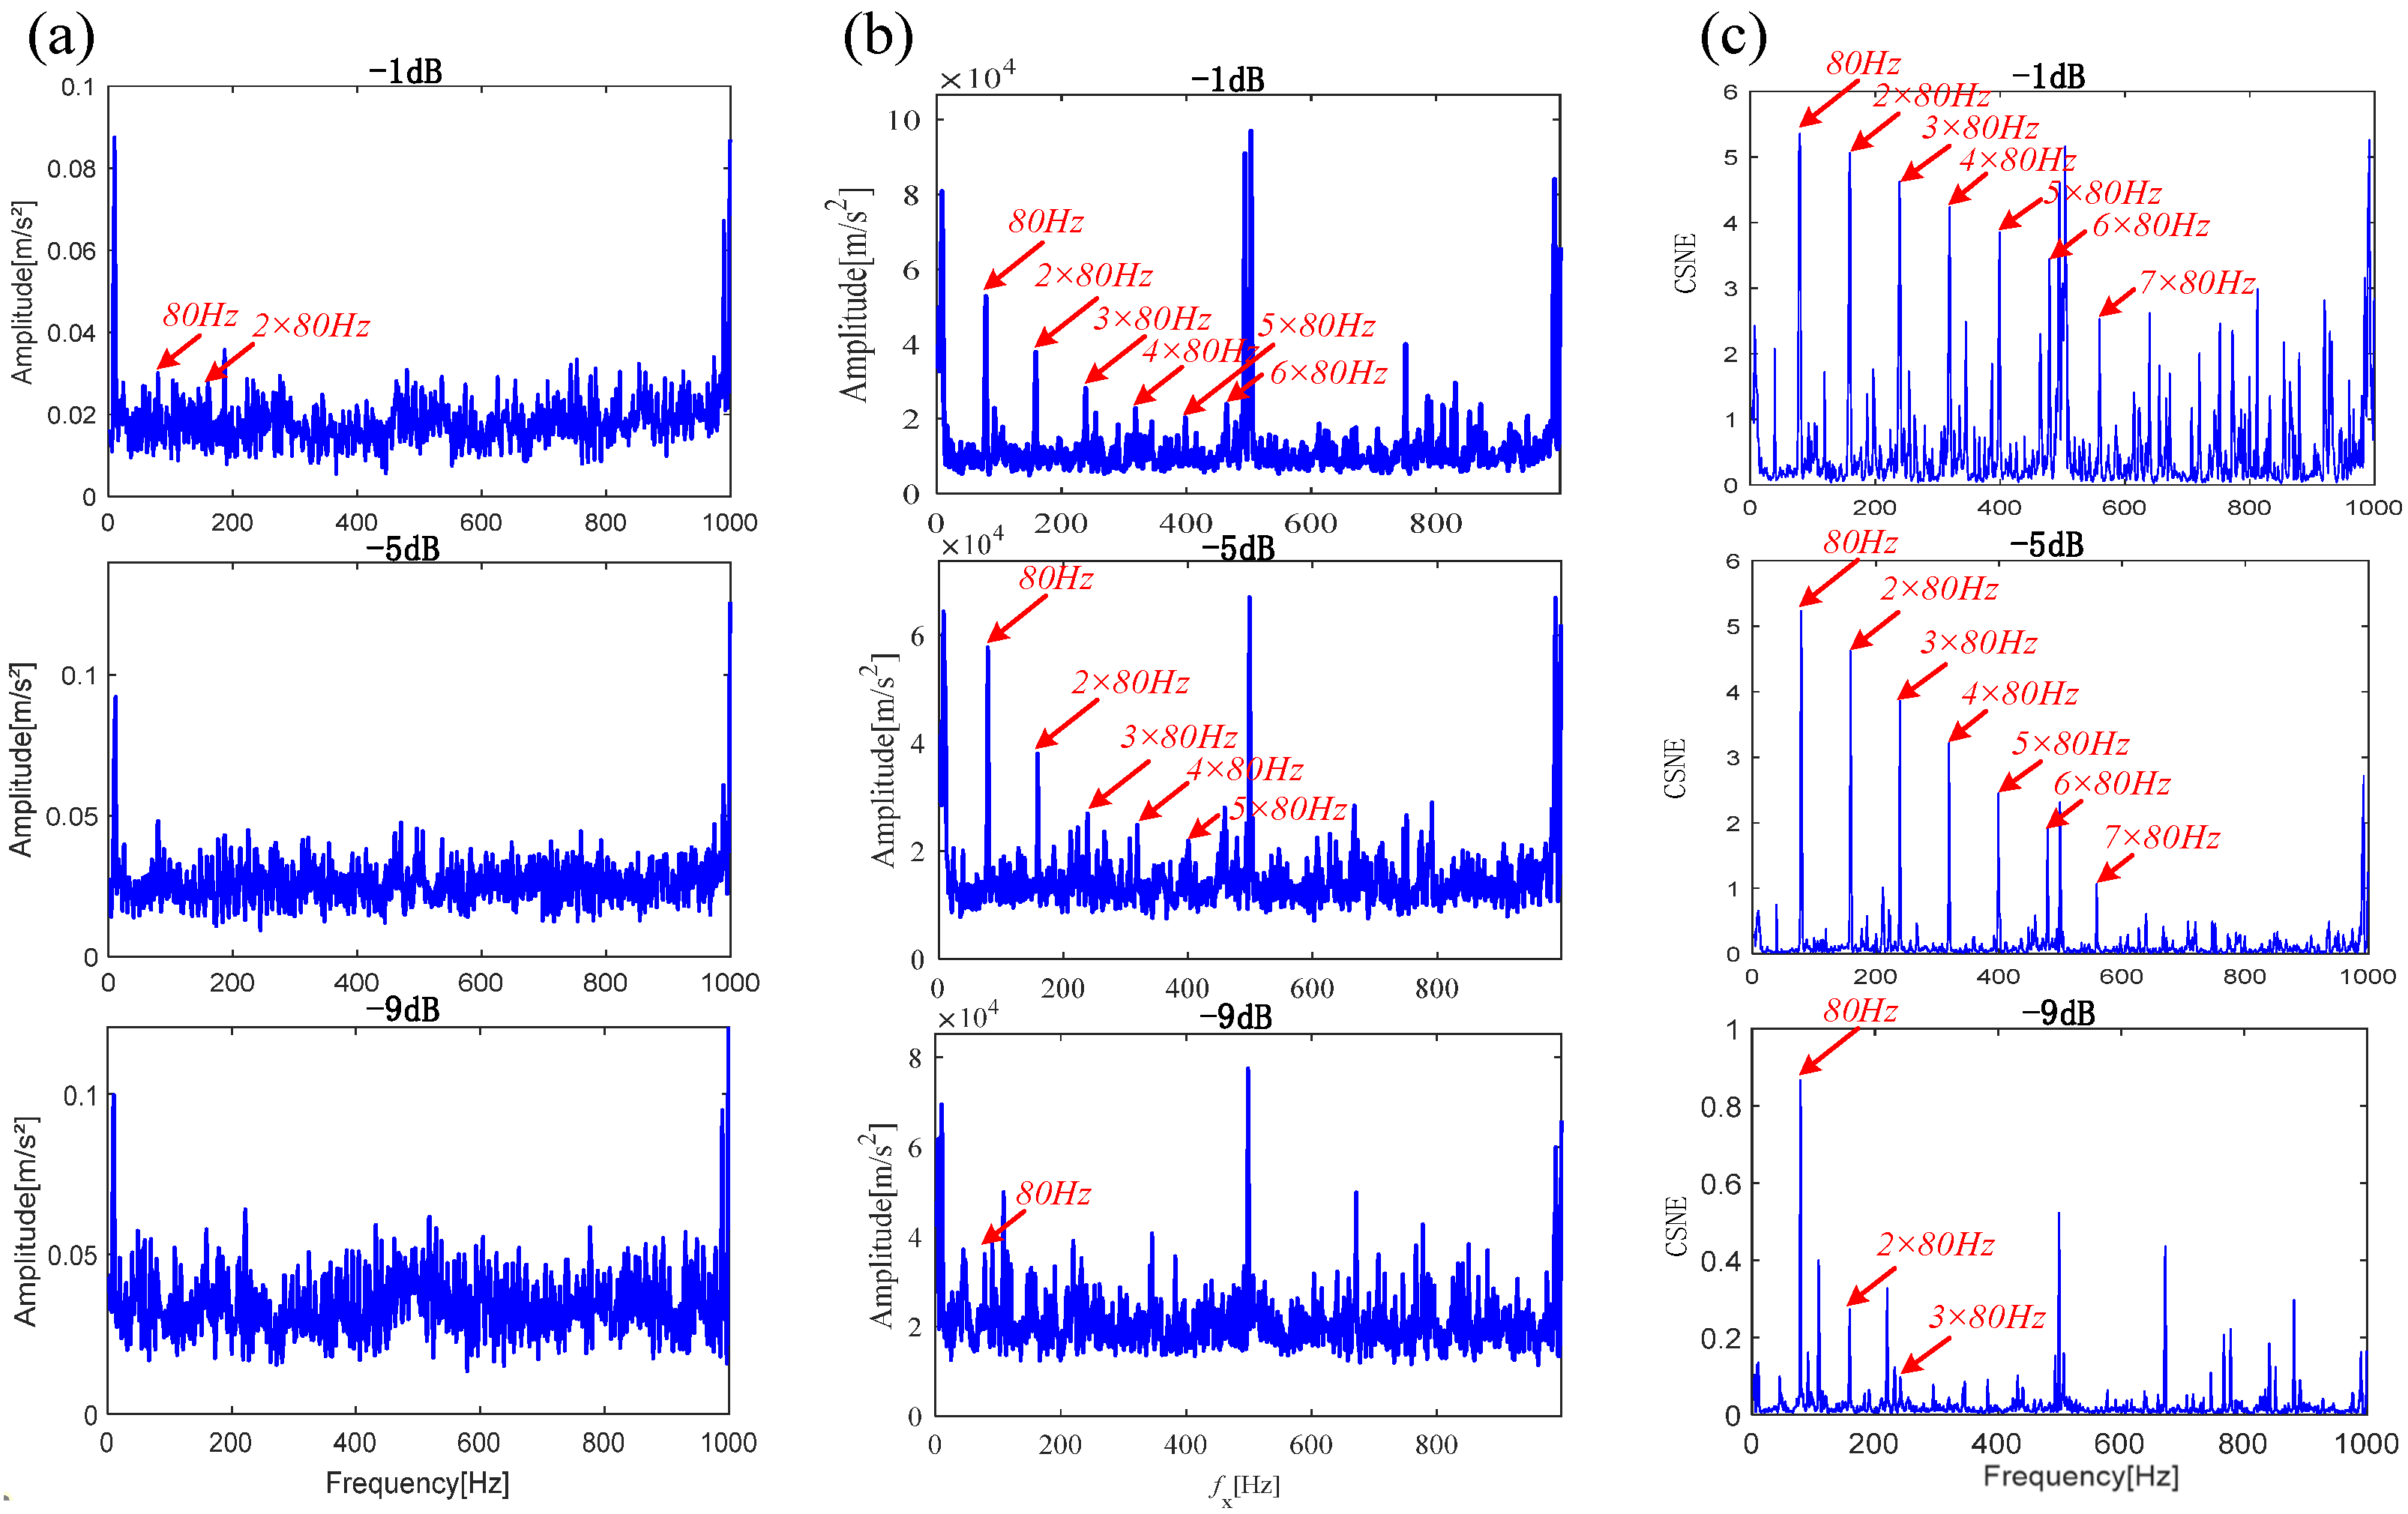
To compare the noise resistance of the proposed method, the noise signal
was set to −1 dB, −5 dB, and −9 dB, respectively. The signals were processed using the MSB, TFMB, and BSNA methods, and the results are presented in
Figure 8.
Figure 8a shows the average slice results of the MSB signals under different noise levels processed by Equations (2) and (3).
Figure 8b displays the projections of the TFMB processing results along the
direction under varying noise conditions.
Figure 8c presents the processing results of the BSNA method. As can be seen from the figures, when
, all three methods are capable of extracting fault information. When
, both TFMB and BSNA can extract fault information, but obvious noise remains in the TFMB results. When
, only the BSNA method successfully extracts fault information. Comparative analysis demonstrates that the BSNA method proposed in this paper exhibits significant advantages in early fault feature extraction. Compared with the traditional MSB detector, this method not only further reduces noise interference but also effectively extracts richer fault information, demonstrating excellent denoising performance and robust fault detection capabilities.
5. Conclusions
This paper proposes a novel bispectrum slice negentropy analysis (BSNA) method for efficiently extracting periodic impulse information from signals and identifying fault characteristic frequencies. To address the issue that traditional signal processing methods struggle to separate fault characteristics from complex signals amid the intricate environmental noise in the early stages of bearing faults, this method introduces the negentropy measure into the analysis of bispectrum results for the first time. BSNA leverages the nonlinear properties of the bispectrum to create a TFMB, which captures the modulation characteristics of the signal. By calculating CSNE, the method quantifies fault information in each frequency slice, revealing the energy distribution of the modulation frequency and accurately identifying fault characteristic frequencies and their harmonics. Simulation and experimental results demonstrate that BSNA can effectively identify characteristic frequencies and harmonics in bearing outer and inner ring faults while exhibiting strong robustness against high noise levels. Compared to the traditional MSB method, BSNA achieves superior noise reduction and highlights fault characteristic frequencies more distinctly. Furthermore, the BSNA framework provides a valuable reference for broader mechanical fault diagnosis applications. Its adaptability makes it applicable to analyzing vibration signals from other rotating machinery, such as gears and wind turbines, aiding in predictive maintenance and performance monitoring.
The BSNA method offers significant advantages in fault detection; however, its high computational complexity poses challenges for large-scale applications. Specifically, the STFT and TFMB processes require substantial computational resources, with demands escalating as data scales increase. Furthermore, the spectral negentropy analysis involves iterative optimization and extensive processing, further contributing to the computational burden. These limitations hinder the efficiency of this method, especially for high-frequency signals and large datasets, restricting practical implementation. Hence, optimizing the algorithm to enhance computational efficiency remains a critical area for future research.