Article

Cross-Scene Sign Language Gesture Recognition Based on Frequency-Modulated Continuous Wave Radar

1
College of Computer Science and Engineering, Northwest Normal University, Lanzhou 730070, China
2
Gansu Engineering Research Center of Internet of Things, Lanzhou 730070, China
*
Author to whom correspondence should be addressed.
Signals 2022, 3(4), 875-894; https://doi.org/10.3390/signals3040052
Submission received: 3 October 2022 / Revised: 2 November 2022 / Accepted: 2 December 2022 / Published: 6 December 2022
(This article belongs to the Special Issue Intelligent Wireless Sensing and Positioning)

Abstract

:
This paper uses millimeter-wave radar to recognize gestures in four different scene domains. The four scene domains are the experimental environment, the experimental location, the experimental direction, and the experimental personnel. The experiments are carried out in four scene domains, using part of the data of a scene domain as the training set for training. The remaining data is used as a validation set to validate the training results. Furthermore, the gesture recognition results of known scenes can be extended to unknown stages after obtaining the original gesture data in different scene domains. Then, three kinds of hand gesture features independent of the scene domain are extracted: range-time spectrum, range-doppler spectrum, and range-angle spectrum. Then, they are fused to represent a complete and comprehensive gesture action. Then, the gesture is trained and recognized using the three-dimensional convolutional neural network (CNN) model. Experimental results show that the three-dimensional CNN can fuse different gesture feature sets. The average recognition rate of the fused gesture features in the same scene domain is 87%, and the average recognition rate in the unknown scene domain is 83.1%, which verifies the feasibility of gesture recognition across scene domains.

1. Introduction

With the development of millimeter-wave radar technology, millimeter-wave technology has been applied in an increasing number of production environments. For example, in autopilot [1,2], the unmanned user interface [3,4] employs millimeter-wave sensing detection technology. In terms of vehicle trajectory positioning and tracking [5] and vehicle situational awareness [6], the detection capability of millimeter-wave radar is significantly more robust than other sensing technologies. Millimeter-wave radar also plays a role in human gait recognition [7,8] and vital signs (respiration and heartbeat [9]) detection. The gesture is an essential tool for human–computer interaction and a significant field in wireless signal perception. For example, gestures are used in applications or video games [10]. Existing gesture recognition research is based on wearable sensor devices [11] or wireless communication signals (Wi-Fi [12], RFID), as well as computer vision research methods using optical cameras [13] and depth cameras [14] to collect data. Wearable sensors [15] mainly capture position and spatial state information during finger movement and then use this information to analyze gestures to achieve the purpose of gesture recognition. Wearable devices can also study whole-body behavior and posture [16]. Wi-Fi signals are typically characterized by Received Signal Strength Indication (RSSI) or Channel State Information (CSI) [17], which can also be combined with machine learning algorithms to recognize gestures. The computer vision method [18] collects the skeleton data in the gesture movement, uses the skin color, contour, texture, and other information of the hand to represent the specific movement process of the gesture and then recognizes the gesture. The above three methods are the mainstream methods of gesture research, but some aspects have apparent deficiencies. The data collected by computer vision methods largely depend on light [19]. If the light is dim, the collected data will be incomplete, and the gesture cannot be accurately recognized. Using Wi-Fi signals to describe motions, the multipath effect seriously affects the independence of gestures. Extracting gestures from a large number of reflected signals is a huge challenge. The most significant disadvantage of using wearables to recognize gestures is the very high cost of deployment [20]. To sum up, the mainstream research methods of gestures have shortcomings.
Millimeter-wave radar has the characteristics of large bandwidth, narrow beam, strong detection ability, high signal transmission quality, and small impact on the environment at close range. It can distinguish subtle changes in motion and fully meet the research requirements of gesture motion. Therefore, using millimeter-wave radar [21] to recognize gestures can avoid the disadvantages of the above methods.
It is a trendy research field to use millimeter-wave radar to study gestures. Foreign Google [22] uses a self-developed 77 GHz millimeter-wave radar to analyze motions, and domestic Infineon [23] uses a wafer polar grid array (eWLB) to manufacture SiGe radar chips to study gestures. Li and Zhang [24] discussed the mixing and modulation principle of frequency-modulated continuous wave (FMCW) signals. Tao et al. [25] extracted the range and doppler features from the range of doppler images of gesture echoes. They then classified them with the training data of the dual-channel CNN. Kim and Toomajian [26] used orthogonal matching pursuit (OMP) algorithm to analyze radar echo signals and obtain micro doppler trajectories. Then, K-means is used to cluster the data, and the neighborhood classifier is used to classify gestures. Yong et al. [27] estimated gestures range, doppler, and angle parameters through time-frequency analysis of radar echoes. After training, they used a multi-branch, end-to-end, multi-dimensional CNN to classify gesture feature parameters. Zhaoyang et al. [28] fused the stitched feature map with the non-stitched feature map by using the range map, doppler map, angle map, and the stitched range doppler time feature map on the fixed frame time length. They then used the CNN for classification training. Jing Biao [29] used the one-dimensional CNN to process echo data and then used the one-dimensional initial V3 structure and long short-term memory (LSTM) network to aggregate one-dimensional features for gesture recognition. These studies extract part of the gesture features in a specific scene and do not fuse the gesture features into an environment-independent feature set. In the literature [30], they extract features from time and space, capture the motion information in multiple adjacent frames and fuse them into a unified hand feature set. The gesture features obtained by this method are complete and comprehensive, and the fused gesture recognition effect is better.
Research on gestures using millimeter-wave radar mainly focuses on an experimental scenario. Most researchers collect data on multiple motions and then process the data to obtain gesture features. Then, the gestures are trained and recognized in a deep-learning model. Few experimenters conduct training after collecting gesture data in one experimental environment and then use the gesture data in another suitable habitat as a validation set to verify the training results. It is further explained that the gesture recognition of millimeter-wave radar has nothing to do with the scene domain. To confirm that the gesture recognition by millimeter-wave radar is independent of the scene domain, four different scene domains (environment, location, orientation, and person) are designed for experiments. Gesture data is first collected in four other scene domains. Then, the gesture data is processed, and distance-time features, distance-doppler features, and distance-angle features are extracted from the gesture data. Gestures are described using three feature sets. It can solve the problem that the gesture features of different scenes are difficult to adapt to other locations, and the description of gestures is incomplete. It will also play a more significant role in the classification and identification stage. Then, the three feature sets are trained in the three-dimensional CNN [31]. At the same time, the time dimension is introduced into the training of gesture features. Finally, gestures are recognized in different scene domains, which further illustrates that the millimeter-wave radar recognizes gestures, and the scene domain is irrelevant. The overall structure of the experiment is shown in Figure 1.

2. FMCW Radar System and Theory

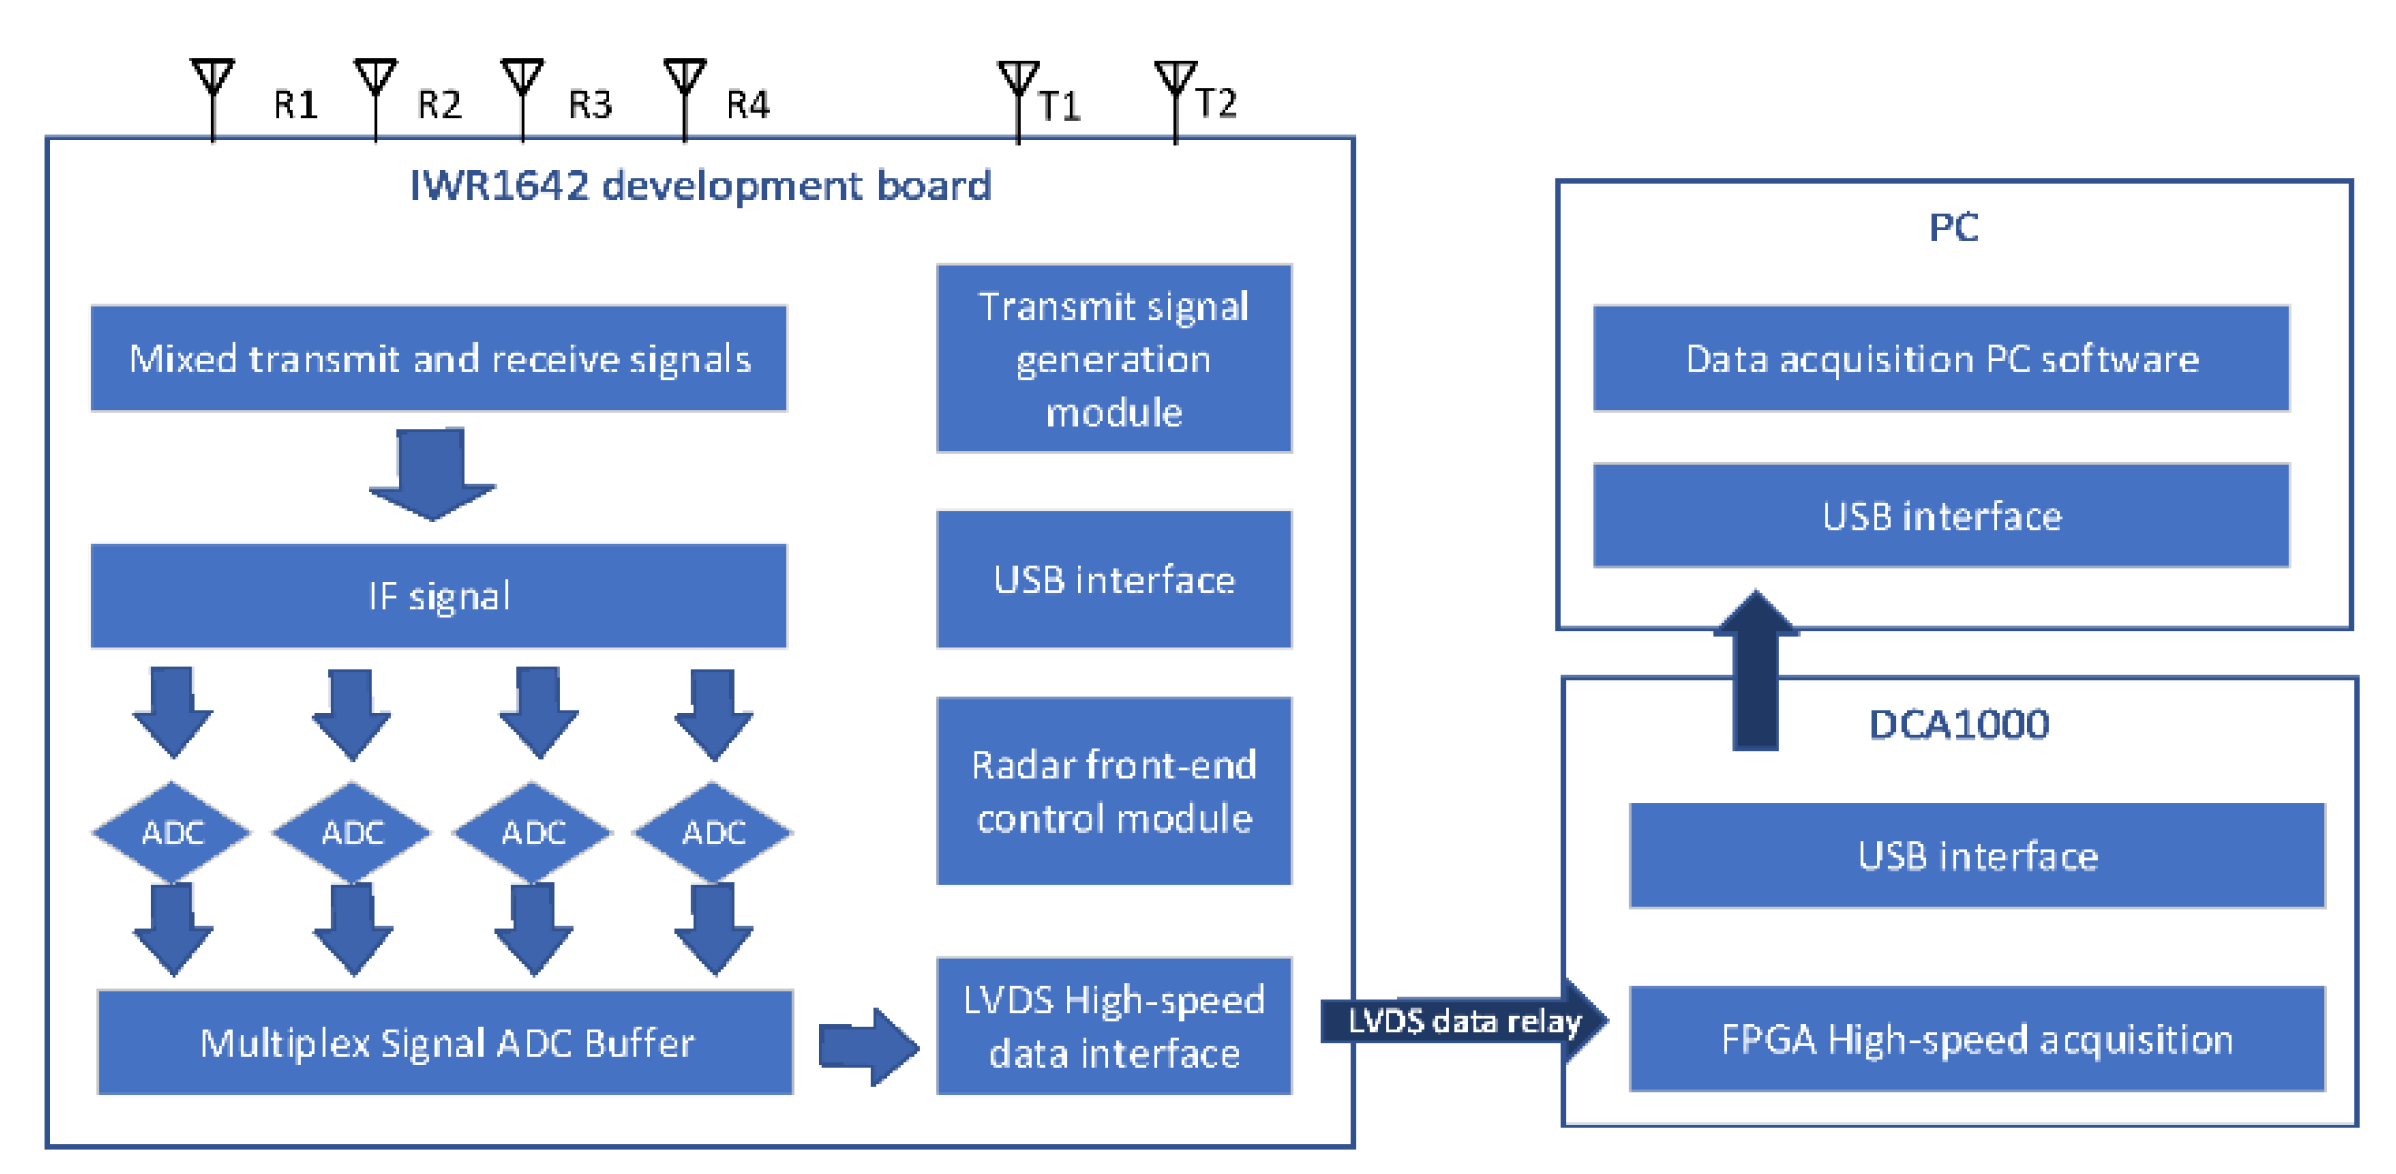
The experiment uses two development boards, IWR1642 and DCA1000. The original data sampling process is shown in Figure 2. Thick arrows represent data signal links, and thin arrows represent control signal links. The light-colored thick arrows indicate the data flow direction on the same board, and the dark-colored thick arrows indicate the data flow between different boards. As can be seen from Figure 2, the PC is connected to the two panels through the universal serial bus (USB) interface. The USB interface between the PC and the IWR1642 development board is responsible for program download and virtual serial port functions. the USB interface between the PC and DCA1000 controls signals’ communication and data transmission. After the FMCW radar on the IWR1642 development board receives the echo signal, it passes through the low-noise amplifier and mixes to obtain the intermediate frequency signal. Secondly, the analog-to-digital converter (ADC) integrated of IWR1642 samples the four-way signals and temporarily stores them in the ADC buffer. Then, the ADC is transmitted to the DCA1000 data acquisition card through the low-voltage differential signal (LVDS) interface. Finally, the field-programmable gate array (FPGA) chip collects the ADC data stream and sends the result to the PC for processing.
As shown in Figure 2, the FMCW radar has two transmitting antennas and four receiving antennas. The two transmitting antennas transmit signals alternately using the time gap. After receiving the intermediate frequency signal transmitted by the radar, the PC performs a ping-pong operation on the data, constructs complex signal and serial-parallel conversion and other preprocessing processes, and obtains eight receiving antenna time-domain signals. The intermediate frequency signal obtained by mixing the transmitted signal and the reflected signal is shown in Figure 3.
In the experiment, the acquisition unit of the FMCW radar intermediate frequency signal is 64 frames, each data frame has 128 frequency sweep signals, and each frequency sweep has 64 sampling points. Each frame of data is 40 ms long, so the observation duration of 64 frames of data lasts 2.56 s. Many experimental tests show that the time of gesture action is 12–20 frames, which is approximately 0.5–0.8 s. The specific radar parameters are shown in Table 1.
After an FMCW radar signal is transmitted, it reflects off objects and transmits the echoes to the radar antenna, including noise. The primary noise interference of gesture targets is static objects, such as tables and chairs in the experimental environment, displayed plants, etc. Therefore, the static clutter filtering method filters the interference information. The algorithm flow of filtering static objects is shown in Algorithm 1.
The radar adopted in this paper has N t = 2 transmitting antennas and N r = 4 receiving antennas. Since there is a fixed distance between each receiving antenna, the received signal has a phase difference, which can be obtained from the doppler frequency shift. Therefore, fast Fourier transform (FFT) based on doppler FFT can obtain the angle of the target relative to the radar to have more comprehensive object attribute information.
According to the signal emission and reflection diagram in Figure 3, the reflected echo is accompanied by interference clutter. The intermediate frequency signal can be obtained if the transmitted wave and reflected wave are mixed. Through signal processing, the characteristic diagram of motion can be obtained. The three-dimensional FFT processing process of FMCW radar signal is as follows: FFT operation is performed on each sampling index of intermediate frequency signal in each sweep period, and the same processing process is performed on each chirp signal. That is range dimension FFT (range). The obtained results are saved in each column of the matrix to obtain the distance information of the target. Then, the exponential dimension of the sweep period is calculated by FFT to obtain the doppler characteristics. After the two-dimensional FFT operation is performed, the range-doppler diagram is obtained. Finally, FFT calculation is performed on the same frame data obtained by multiple receiving antennas to obtain the angle information of the target.
Algorithm 1 Static filtering algorithm
Input: CFAR (Constant False-Alarm Rate) processing result matrix R c f a r ; distance unit vector B p r e where the target in the previous frame is located; distance unit vector B c u r where the target is located in the current frame.
Output :   Static   interference   cancellation   result   matrix   R s t a .
Calculation process
1.
Initialize R s t a to R c f a r , clear C s , C d , and B c u r
2.
Count the number of targets detected by R c f a r , denoted as C d
3.
for each coordinate in R c f a r ( x i , y i ) do
4.
  if the coordinate y i is the doppler zero frequency offset value then
5.
   Increment the record distance coordinate x i in B c u r and increment C s by a count
6.
  end if
7.
end for
8.
Sort B c u r and B p r e in ascending order
9.
if C d and C s counts are not equal
10.
 Find the same distance coordinates in all B c u r and B p r e and remove duplicate targets from R s t a
11.
end if

3. Design of Convolutional Neural Network

In traditional target detection, all target spatial feature information is contained in a single two-dimensional image. Therefore, the two-dimensional CNN can be used to analyze the spatial characteristics of the two-dimensional image to complete the target detection and classification. Micro gesture recognition consists of continuous motion time slice information within a period. Each time slice contains the state information of the current moment, and constant time slices have the evolution process of the target space position. It can describe a specific state of motion of the human body. Therefore, to recognize micro gestures, it is necessary to perform feature mining in conjunction with time series space. The two-dimensional CNN does not have the learning ability of motion time series features. The article introduces the time series-space standard feature extraction method of the three-dimensional CNN.

3.1. Learning Model

In gesture recognition, one-dimensional CNN identify raw data [32]. This method has high-performance requirements for training algorithms and is rarely used. The extracted data features are two-dimensional images. Meanwhile, the three-dimensional CNN [33] is based on the two-dimensional CNN. First, the training process of the two-dimensional CNN is introduced and then the three-dimensional CNN used in the experiment is introduced [34].
The core operations of the two-dimensional CNN include two-dimensional convolution operations and two-dimensional pooling operations. In the two-dimensional convolutional operation, the output is the two-dimensional feature map output by the upper layer, and the two-dimensional convolution operation is performed with the convolution kernel of the current layer. The activation function processes the output result, and the two-dimensional pooling operation reduces the dimension. The whole process is shown in Figure 4. Input 8 × 8 two-dimensional data map, and perform two-dimensional convolution operation with 3 × 3 convolution kernel to obtain 6 × 6 intermediate feature map. 3 × 3 two-dimensional spatial features are finally obtained through the 2 × 2 pooling operation.
Unlike the two-dimensional CNN input and output are two-dimensional feature maps, the three-dimensional CNN input is a sequence of continuous data frames. Then, three-dimensional convolution operation and three-dimensional pooling operation are used to extract temporal-spatial joint features. The final output contains three-dimensional feature units of a continuous sequence of feature maps X ( x , y , z ) in the segment, the team can be expressed as Equation (1) [35].
Y ( x , y , z ) = X ( x , y , z ) H ( x , y , z ) = i = 0 K 1 1 j = 0 K 2 1 k = 0 K 3 1 X ( x + i , y + i , z + k ) H ( x , y , z )
The symbol “ “ represents the convolution operation X ( x , y , z ) and H ( x , y , z ) denote the three-dimensional feature unit in the previous layer and the three-dimensional convolution kernel unit in the three-dimensional convolution operation. K 1 , K 2 , K 3 represent the three-dimensional convolution kernel’s length, width, and height information. The whole process is shown in Figure 5. The input is 8 × 8 × 6 continuous data frames, and after an operation with 3 × 3 × 3 convolution units, the 6 × 6 × 4 three-dimensional feature units of the middle layer are obtained. Then, after the 2 × 2 × 2 three-dimensional pooling operation, the feature unit of 3 × 3 × 2 is finally output. Comparing the two-dimensional CNN in Figure 4, it can be found that the production of the two-dimensional CNN is a single frame of two-dimensional data. Therefore, the entire network architecture can only achieve data compression in the spatial dimension and complete spatial feature extraction. The input of the three-dimensional CNN is continuous data frames. Through three-dimensional convolution and three-dimensional pooling, the entire network can achieve compression in both time and space dimensions at the same time and finally complete the time-space joint feature extraction.

3.2. The Three-Dimensional CNN Architecture Analysis

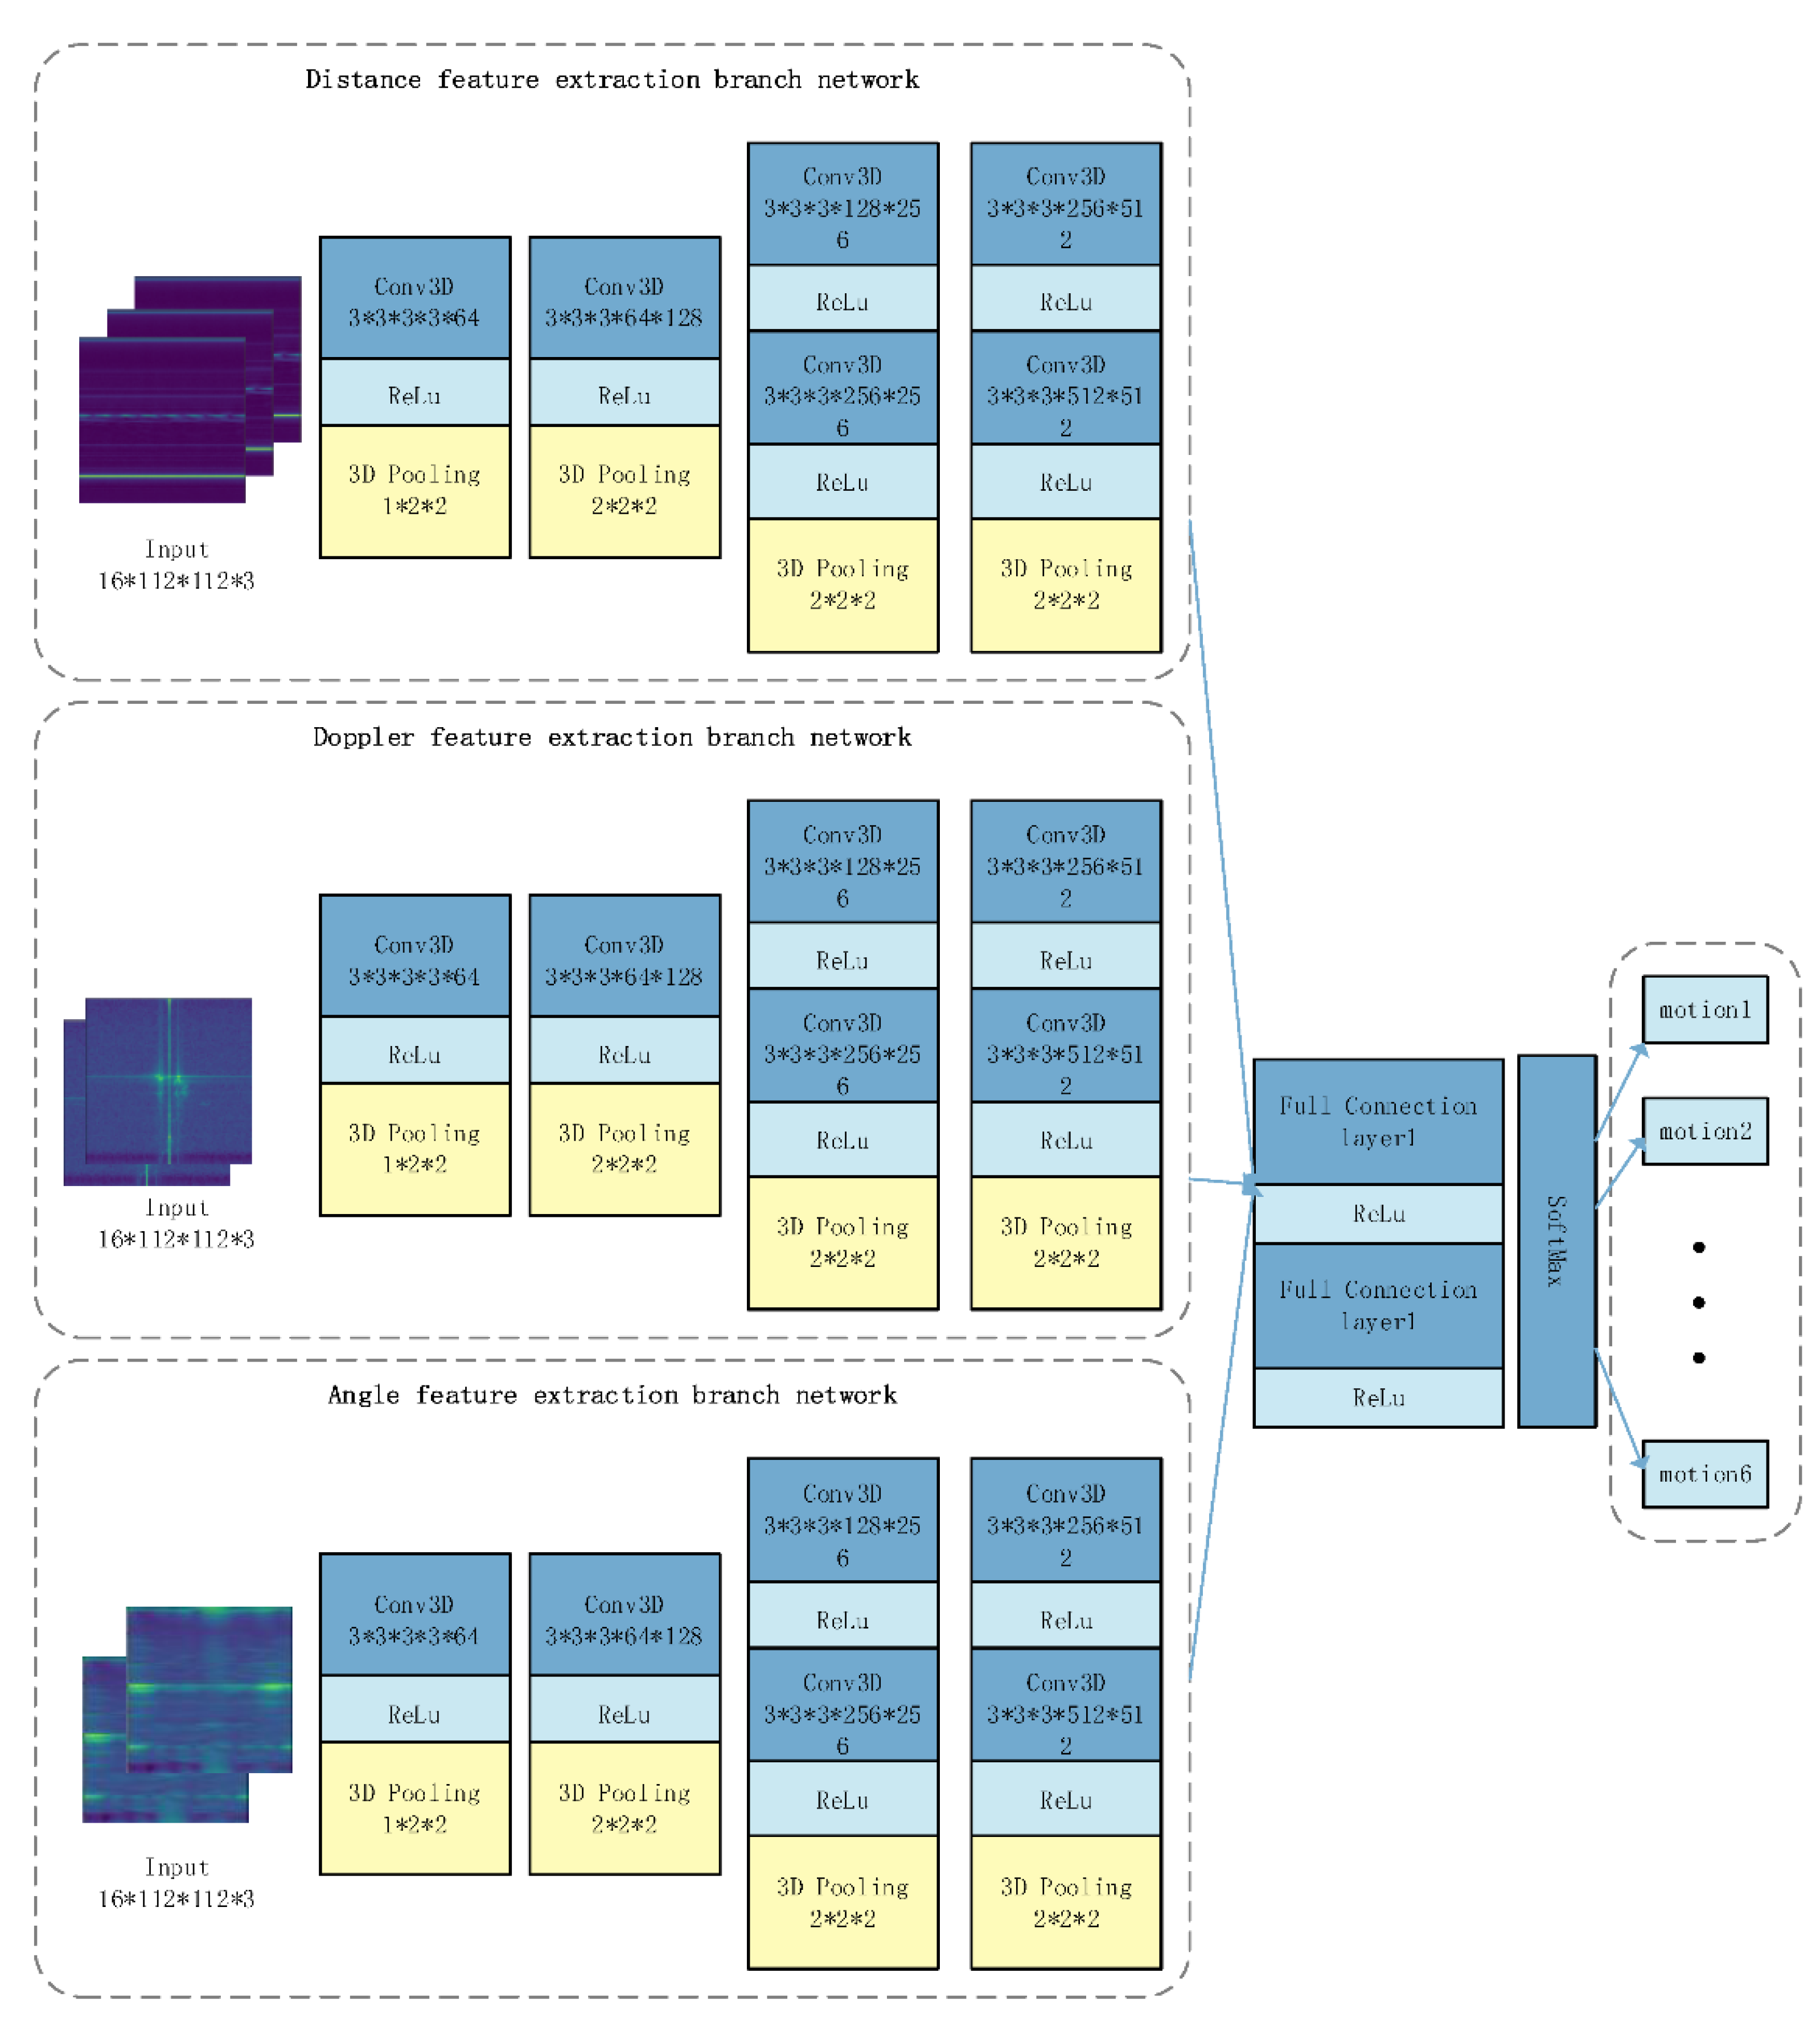
Although the gesture feature maps come from the same motion information, they are not the same when viewed from different angles [35]. Considering the uniqueness of each feature set, different feature sets representing the same gesture are trained, and features from different angles are fused [36]. The three-dimensional CNN combines spatial and temporal elements, and after training these three branch structures, different gestures can be obtained by integrating the features.
Based on the three-dimensional CNN to recognize micro-motion gestures, the network structure is shown in Figure 6. The network architecture contains four layers of three-dimensional convolutions and two fully connected layers. In the third and fourth convolutional layers, the convolutional operation of the stacked structure is introduced. All convolution operations use a 3 × 3 × 3 convolution kernel structure with the smallest dimension. They introduced the excitation function to enhance the network learning ability. The network uses the ReLu activation function. As shown in Figure 6, the input data format is ( N f , h , w , c ) , and N f = 16 represents 16 consecutive data frames h , w , c represents the data frame’s length, width, and height, respectively, and they are set to 112 × 112 × 3. The three-dimensional convolution operation parameters are ( l k , h k , w k , c i , c o ) . l k , h k , w k represent the convolution kernel’s three-dimensional length, width, and height. Set to 3 × 3 × 3. c i = 3 means that the three-dimensional convolutional layer has three input channels c o = 64 implies that the three-dimensional convolution operation has 64 output channels. As the number of convolution layers deepens, the number of output channels of the three-dimensional convolution operation will also increase layer by layer. The number of output channels of the second and third layers is set to 128, 256. To avoid the problem of too many training parameters caused by the deepening of network layers, Three-dimensional max pooling is added after each convolutional layer to reduce the dimension of feature units. The configuration parameters are ( p t , p h , p w ) , p t represents the compression ratio in the time series dimension, and p h , p w represent the spatial compression ratio of a single data frame. Feature serialization is performed on the output unit of the last convolutional layer by two fully connected layers, then combined with the softmax function, combined with the minimum information entropy criterion to achieve network training, time-space joint feature extraction, and multi-gesture classification.

4. Experimental Setup and Result Analysis

4.1. The Experimental Setup

The experimental equipment is the 77 GHz millimeter wave development board IWR1642, as shown in Figure 7. The antenna is set to two transmitters and four receivers, and the frame cycle time is set to 40 ms, that is, the time length of 100 frames for each gesture. Each frame contains 128 chirped signals, and 128 sampling points are set for each chirp to realize the discretization of the IF signal. Then, the dca1000 development board is used to transmit the original data to the PC. The upper computer program reads the signal’s amplitude and performs data preprocessing and feature extraction.
During the experiment, six kinds of dynamic gestures, shown in Figure 8, were selected as the test gestures. The experimenter was required to complete the gestures in Figure 9 in different direction, positions and environments. The experiment was carried out in a laboratory, corridor and open square, two indoor and one outdoor. Each experimental environment is equipped with different equipment deployment and the location and direction of the test object. As shown in Figure 9, ABCDE represents five directions, and the red rectangular box represents six positions. The first, on the left of Figure 10 is the corridor plan, which is 3.3 m high and 2.5 m wide. The experiment was conducted at 6:00 a.m. without interference from others. The second experimental environment is the laboratory, which has many sundries, such as desks, bookshelves, office chairs and computers. The size is 5 m and 6 m. The first, on the right, is a relatively open outdoor experimental environment. The same experimental time was 6 a.m.
In these three experimental environments (Figure 10), five experimenters tested the six gestures in Figure 8 in different positions and directions. Collect data from different environments, positions and directions. Then verify the accuracy of cross-scene gesture recognition after training. The experiment is to verify the gesture recognition effect in different scene domains, so it only needs to determine an influencing factor, train other factors and then take the data under this factor as the verification data set to verify the recognition results. If it is necessary to verify whether the gestures in the corridor scene in Figure 10a can be recognized in Figure 10b or Figure 10d, the data in Figure 10a need to be trained and then the data in Figure 10b or Figure 10d should be used as a verification set for verification to obtain the recognition accuracy of Figure 10a in the whole scene domain. Similarly, the recognition accuracy of Figure 10b or Figure 10d can be obtained. The same method can be used to verify the verification results to verify the gesture recognition effect in different positions, directions and people. This way, the recognition rate of different scene domains can be obtained. The feasibility of cross-scene gesture recognition is further demonstrated.

4.2. The Experimental Analysis

In gesture recognition, multiple indicators are used to evaluate the classification performance of the learning model. As shown below, TP indicates that the target gesture is correctly classified as the target gesture. FP indicates that other gestures are incorrectly classified as target gestures. FN indicates that the target gesture is incorrectly classified as other gestures. TN indicates that other gestures are correctly classified as other gestures. The performance indicators of the learning model include precision, recall, accuracy and score, which can be calculated by formula. F β ( β = 1 ) harmonic average of accuracy and recall.
p r e c i s i o n = T P T P + F P
r e c a l l = T P T P + F N
a c c u r a c y = T P + F N T P + F N + F P + T N
F β = ( β 2 + 1 ) p r e c i s i o n × r e c a l l β 2 ( p r e c i s i o n + r e c a l l )

4.2.1. Training Model Parameter Setting

The parameter setting in the network structure is significant. When designing the neural network structure, it is mainly necessary to consider the step size of the convolution kernel, the number of convolution kernels, and the activation function. And the design of the learning rate, optimization method, exit value, and the number of nodes is also more critical. The recognition effect is best when these four parameters are set to (0.015, 0.01, 0.005, 0.001). Other parameters are default values. Compared with the training time consumed by each round of data, the experimental results are shown in Figure 11. Through exploratory analysis, the learning rate and the number of data nodes of the learning model are essential parameters. They affect the accuracy of data training and gesture recognition for optimal model performance.

4.2.2. Optimization Analysis of Hardware Parameters

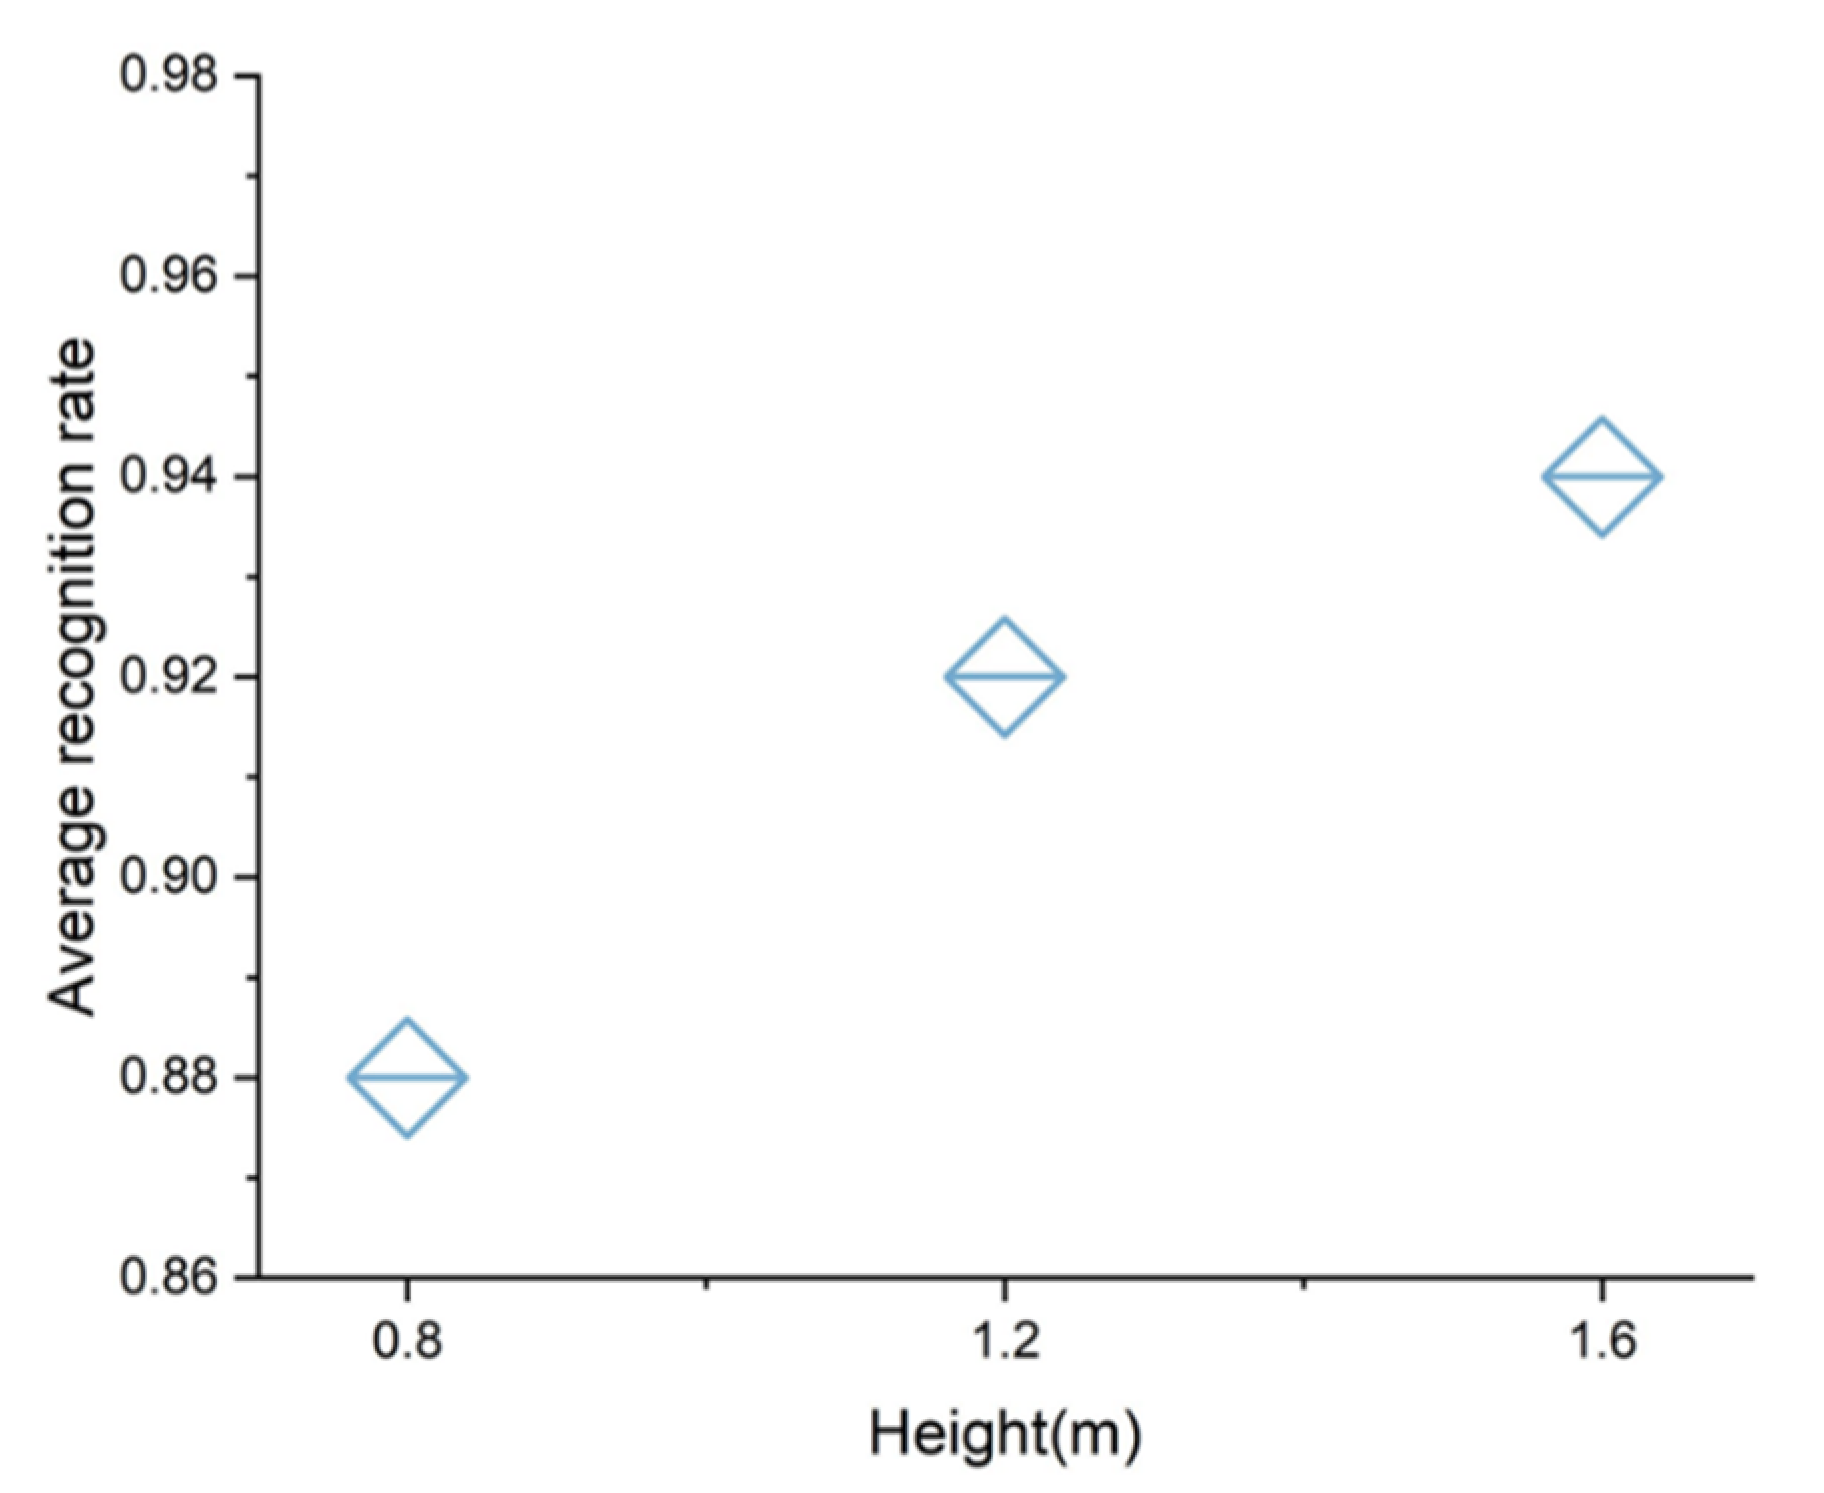
Different heights of experimental settings also affect the recognition performance. To verify the effect of the height of the equipment on the results. Experiments were carried out at heights of 0.80 m, 1.20 m, and 1.60 m, respectively. It can be seen that the height of the device impacts the final recognition. It can be seen through many experiments that the best recognition effect can be achieved under the condition of 1.6 m above the ground. The specific effect is shown in Figure 12. Furthermore, it is speculated that the packet delivery rate may affect the average recognition rate differently. By setting ten different packaging delivery groups for verification, the comparison can prove that the recognition rate of gesture 30 cm/s is the best, and the average recognition rate is above 94%. The experimental results are shown in Figure 13.

4.2.3. Recognition Accuracy of Different Frequency Bands

In this part of the experiment, three different experimental scenarios are designed to make comparisons. Through the experiment, the implementation of the algorithm is analyzed. In the crowded experimental environment full of obstacles, the reflected echoes of static objects are mixed with those of target objects. The frequency wireless signal determines its penetration ability and propagation path loss. The classification results are a visual summary through the classification of sample data and the recognition of three experimental scenes of the learning model algorithm. To verify that different environments significantly impact cognitive results, we collected the same data. The transmission frequencies of millimeter wave signals in three experimental scenarios are 24 GHz and 77 GHz. In the three environments, all motion data are the same. The experimenter is collected in the frequency bands of 24 GHz and 77 GHz, and the experimental data is put into the learning network model for recognition. The complete recognition results are shown in Figure 14. The experimental results show that the accuracy of gesture recognition is a 77 GHz bandwidth signal, which is higher than that of a 24 GHz bandwidth signal. Three experimental scenarios show that the 77 GHz band is more suitable for small human behavior perception. The unified use of the 77 GHz band signal makes the experimental results reach the best due to the test signal.

4.2.4. Influence of Different Gesture Directions on Recognition Effect

Data should be collected from different experimental directions to verify the influence of gesture experiments in different experimental directions on the recognition results. Taking into account the same experimental environment, experimental location, and experimental personnel, gesture experiments must be performed in five different directions (as shown in Figure 9). The experimental distance between the human body and the sensor is 0.8 m. The recognition effect of the five experimental directions is shown in Figure 15. The influence of different directions on the recognition effect is from high to low: 3, 2, 4, 1, and 5. The overall results show that the recognition results differ for different experimental directions. From the experimental results (as shown in Figure 15), it can be seen that the recognition effect of direction 3 is the best.

4.2.5. Influence of Different Experimental Locations on Recognition Effect

We collected data from different experimental directions to verify the influence of different locations on the experimental results. Experimental location refers to five different locations set in the experimental environment, which are used to collect gesture data of each location. Considering the same experimental environment, in experimental environment, the experimenter carried out experiments in the transmission and reception process and tested the influence of five different experimental locations in each experimental environment on the experimental results. As shown in Figure 9, the effects of E and D on the five locations are arranged from high to low. The distance between the sensor and the human body is set to 0.8 m, and the recognition results of the four environments are shown in Figure 16; from the overall results, it can be seen that the recognition results of different experimental locations are significantly different. The experimental results show that the recognition effect obtained by the experiment at the E location is the best.

4.2.6. User Diversity and Comparison of Different Models

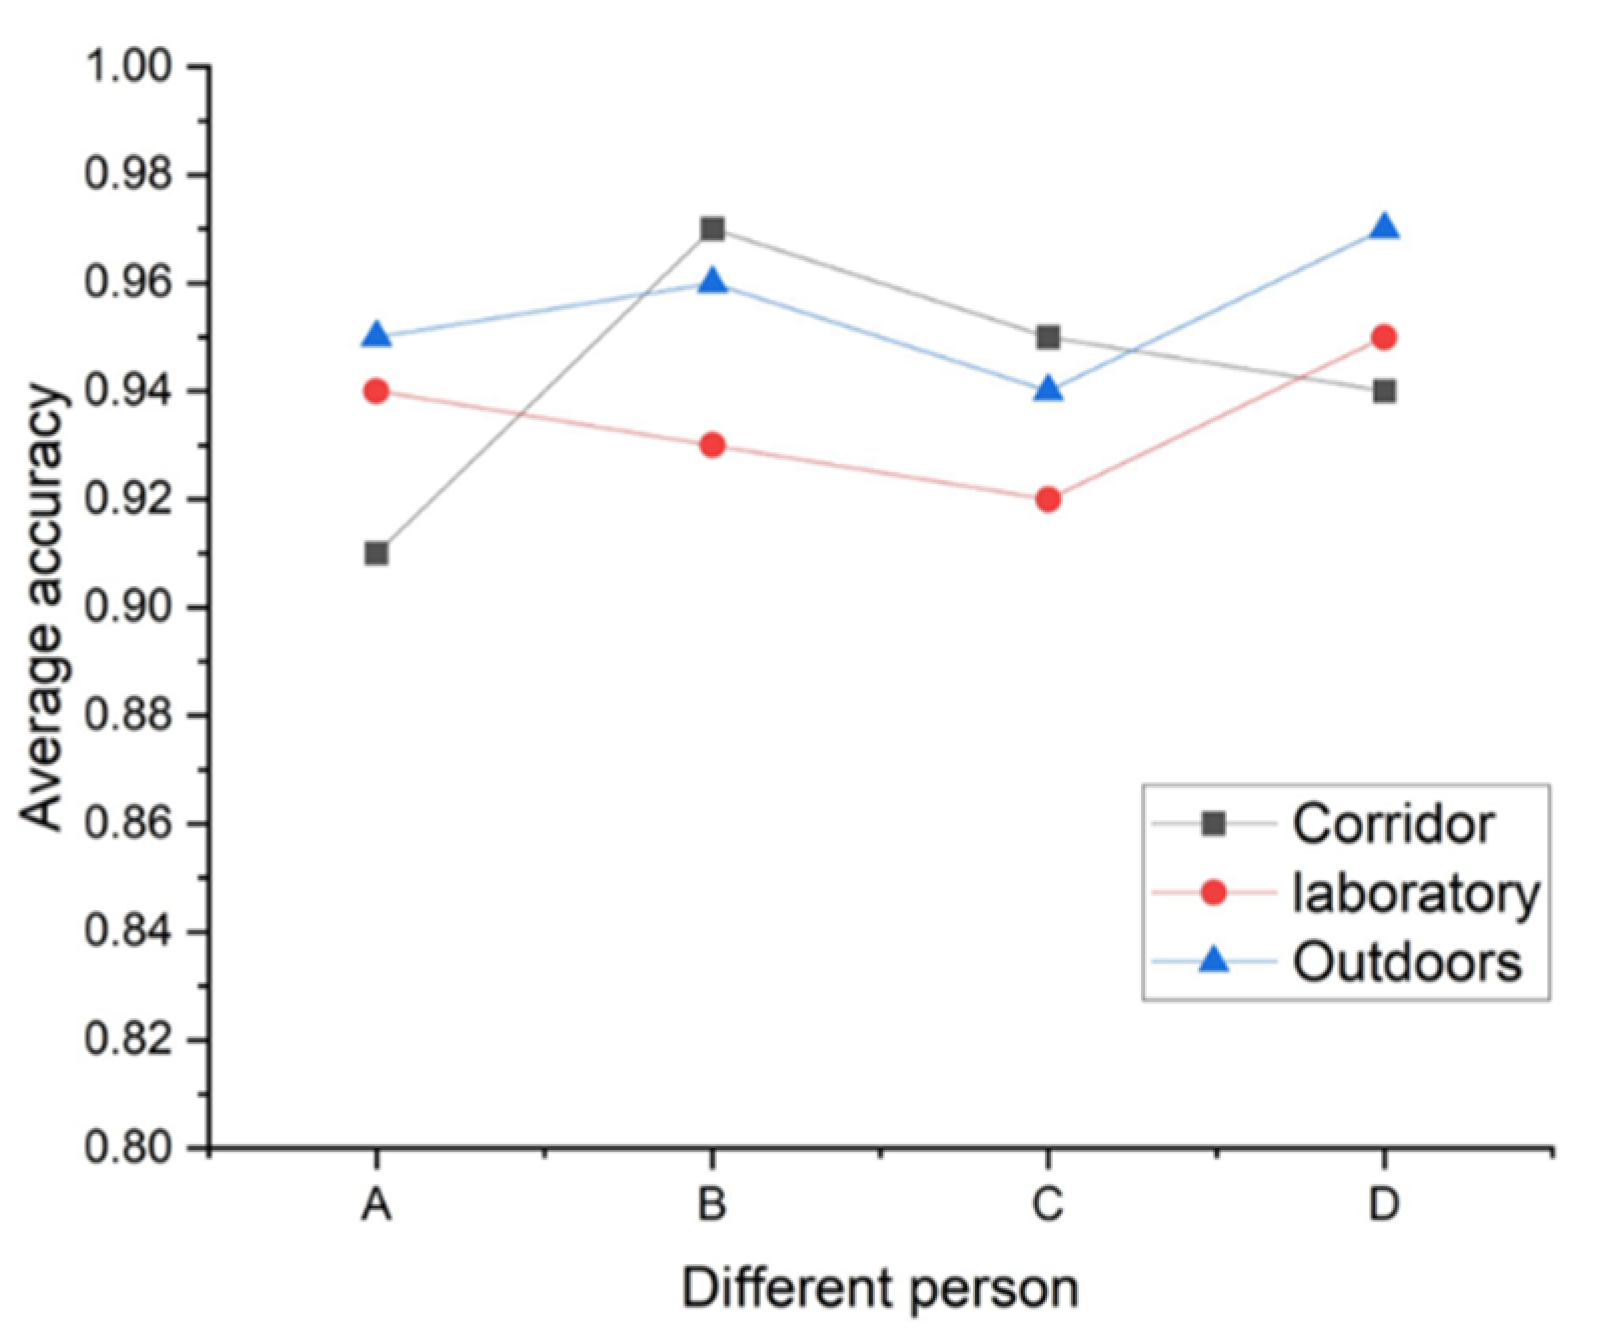
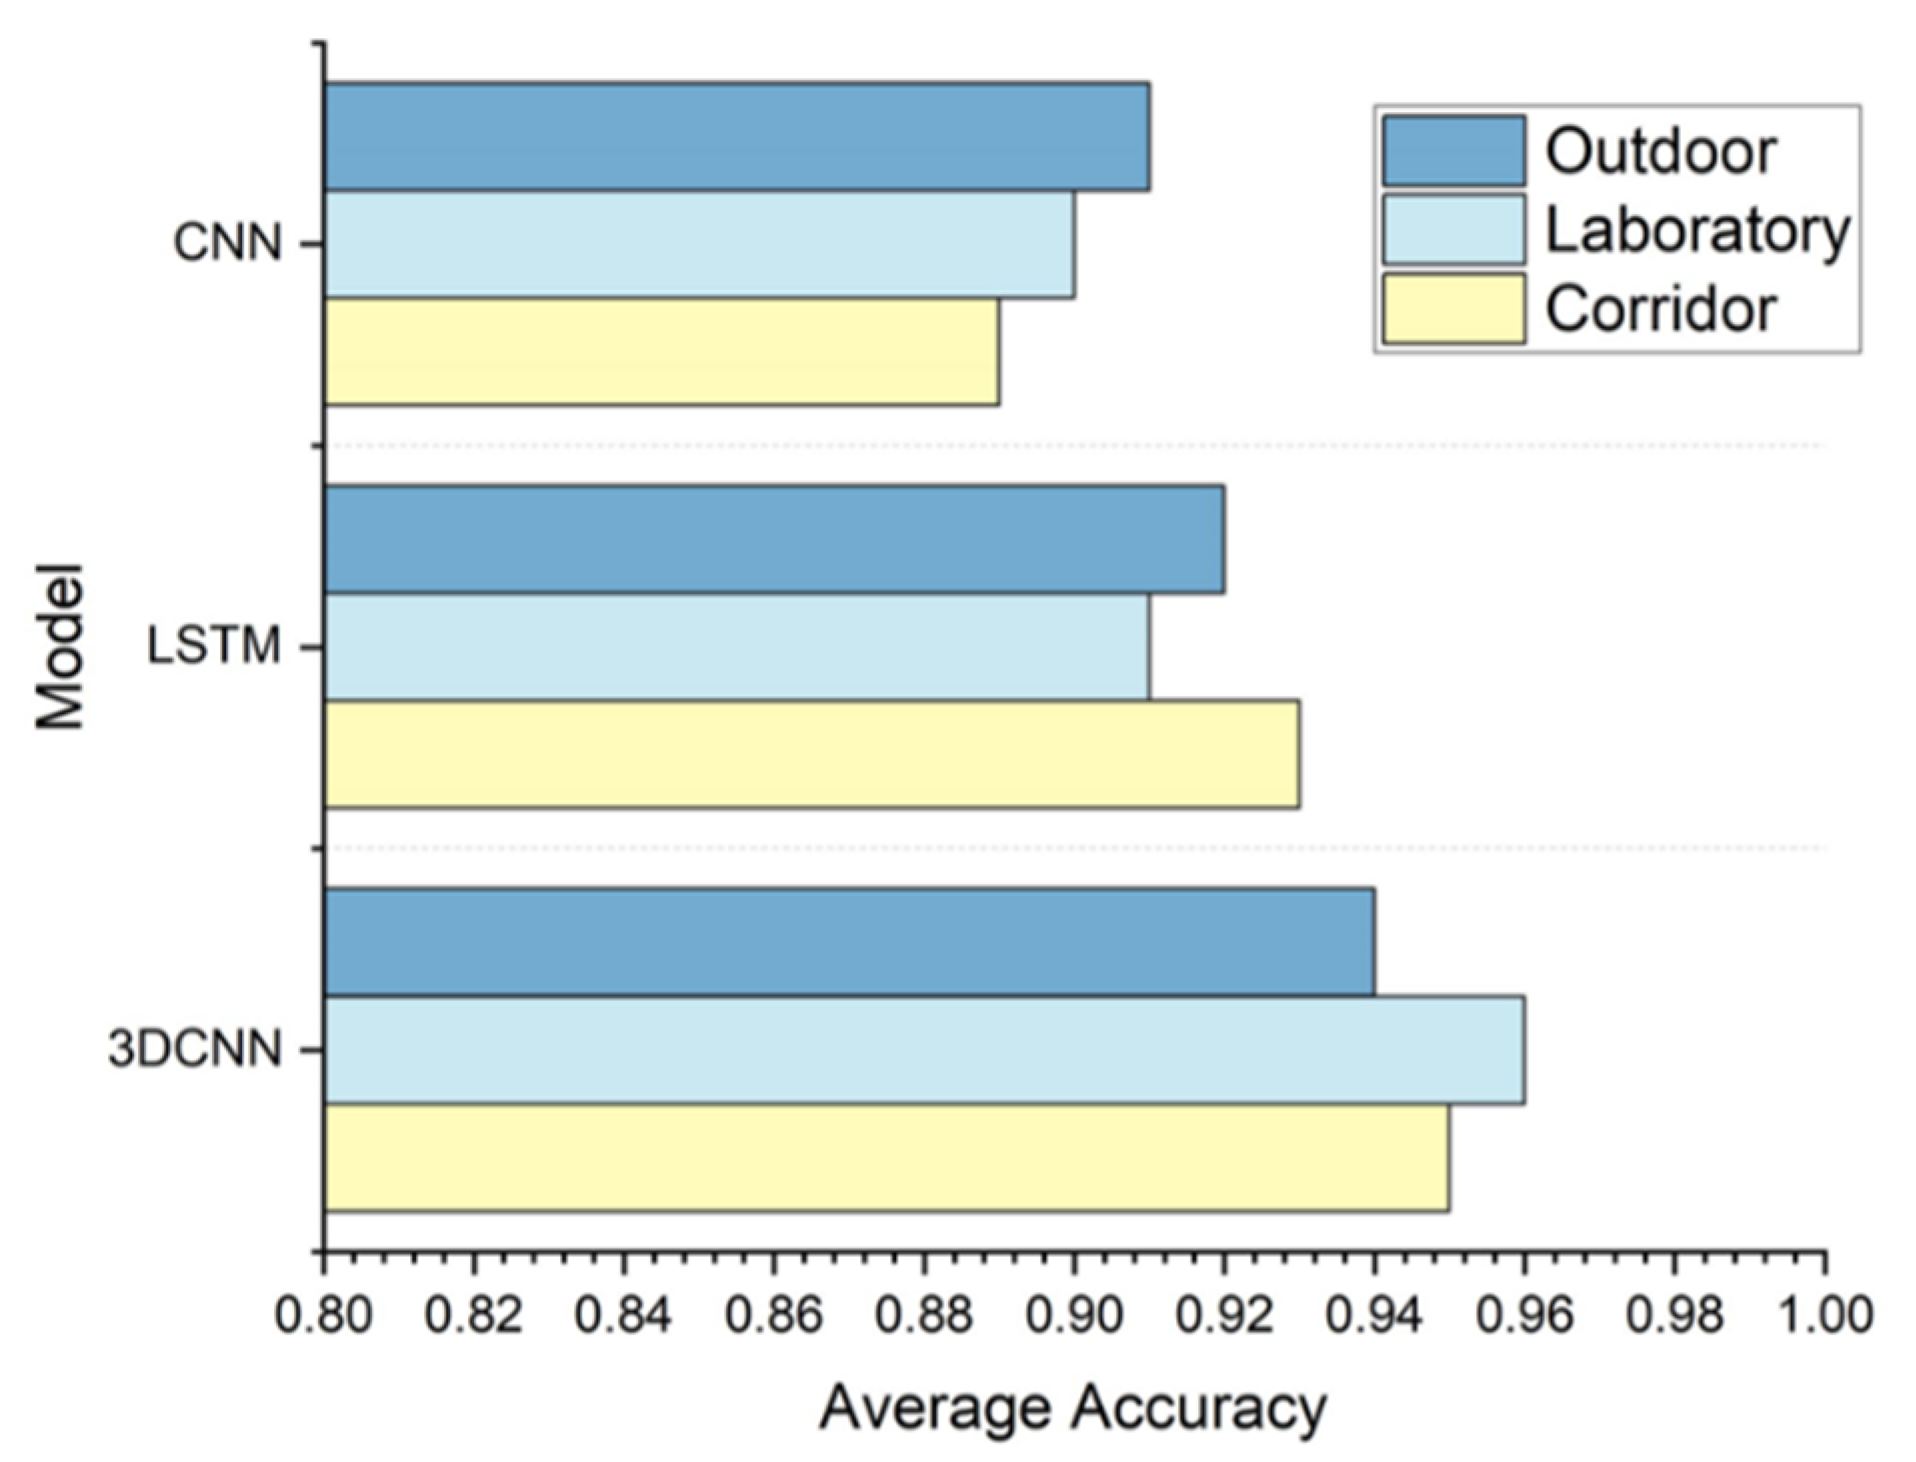
Four experimenters conduct experiments under different scene domains. Figure 17 shows the average recognition rate of the four experimenters. Figure 18 compares three deep learning classification algorithms to analyze the relationship and accuracy between different algorithms. Whether in the laboratory or the laboratory corridor and hall, different testers can maintain the accuracy of the experiment at a high level, and the testers will not cause great fluctuations in the test results. This paper uses the deep learning model to realize gesture recognition, and the three-dimensional CNN model is mainly used. Different gesture sequences are collected by analyzing different network models CNN, LSTM and the three-dimensional CNN. By analyzing the F1 scores, the precision and recall rates of the three models are obtained. Figure 18 shows the F1 scores for three different algorithms. The experimental results show that the average accuracy of the three-dimensional CNN algorithm is above 92%, and the three-dimensional CNN algorithm has the highest F1 score. It can fully consider the influence of various factors and has high robustness.

4.2.7. Robustness Validation

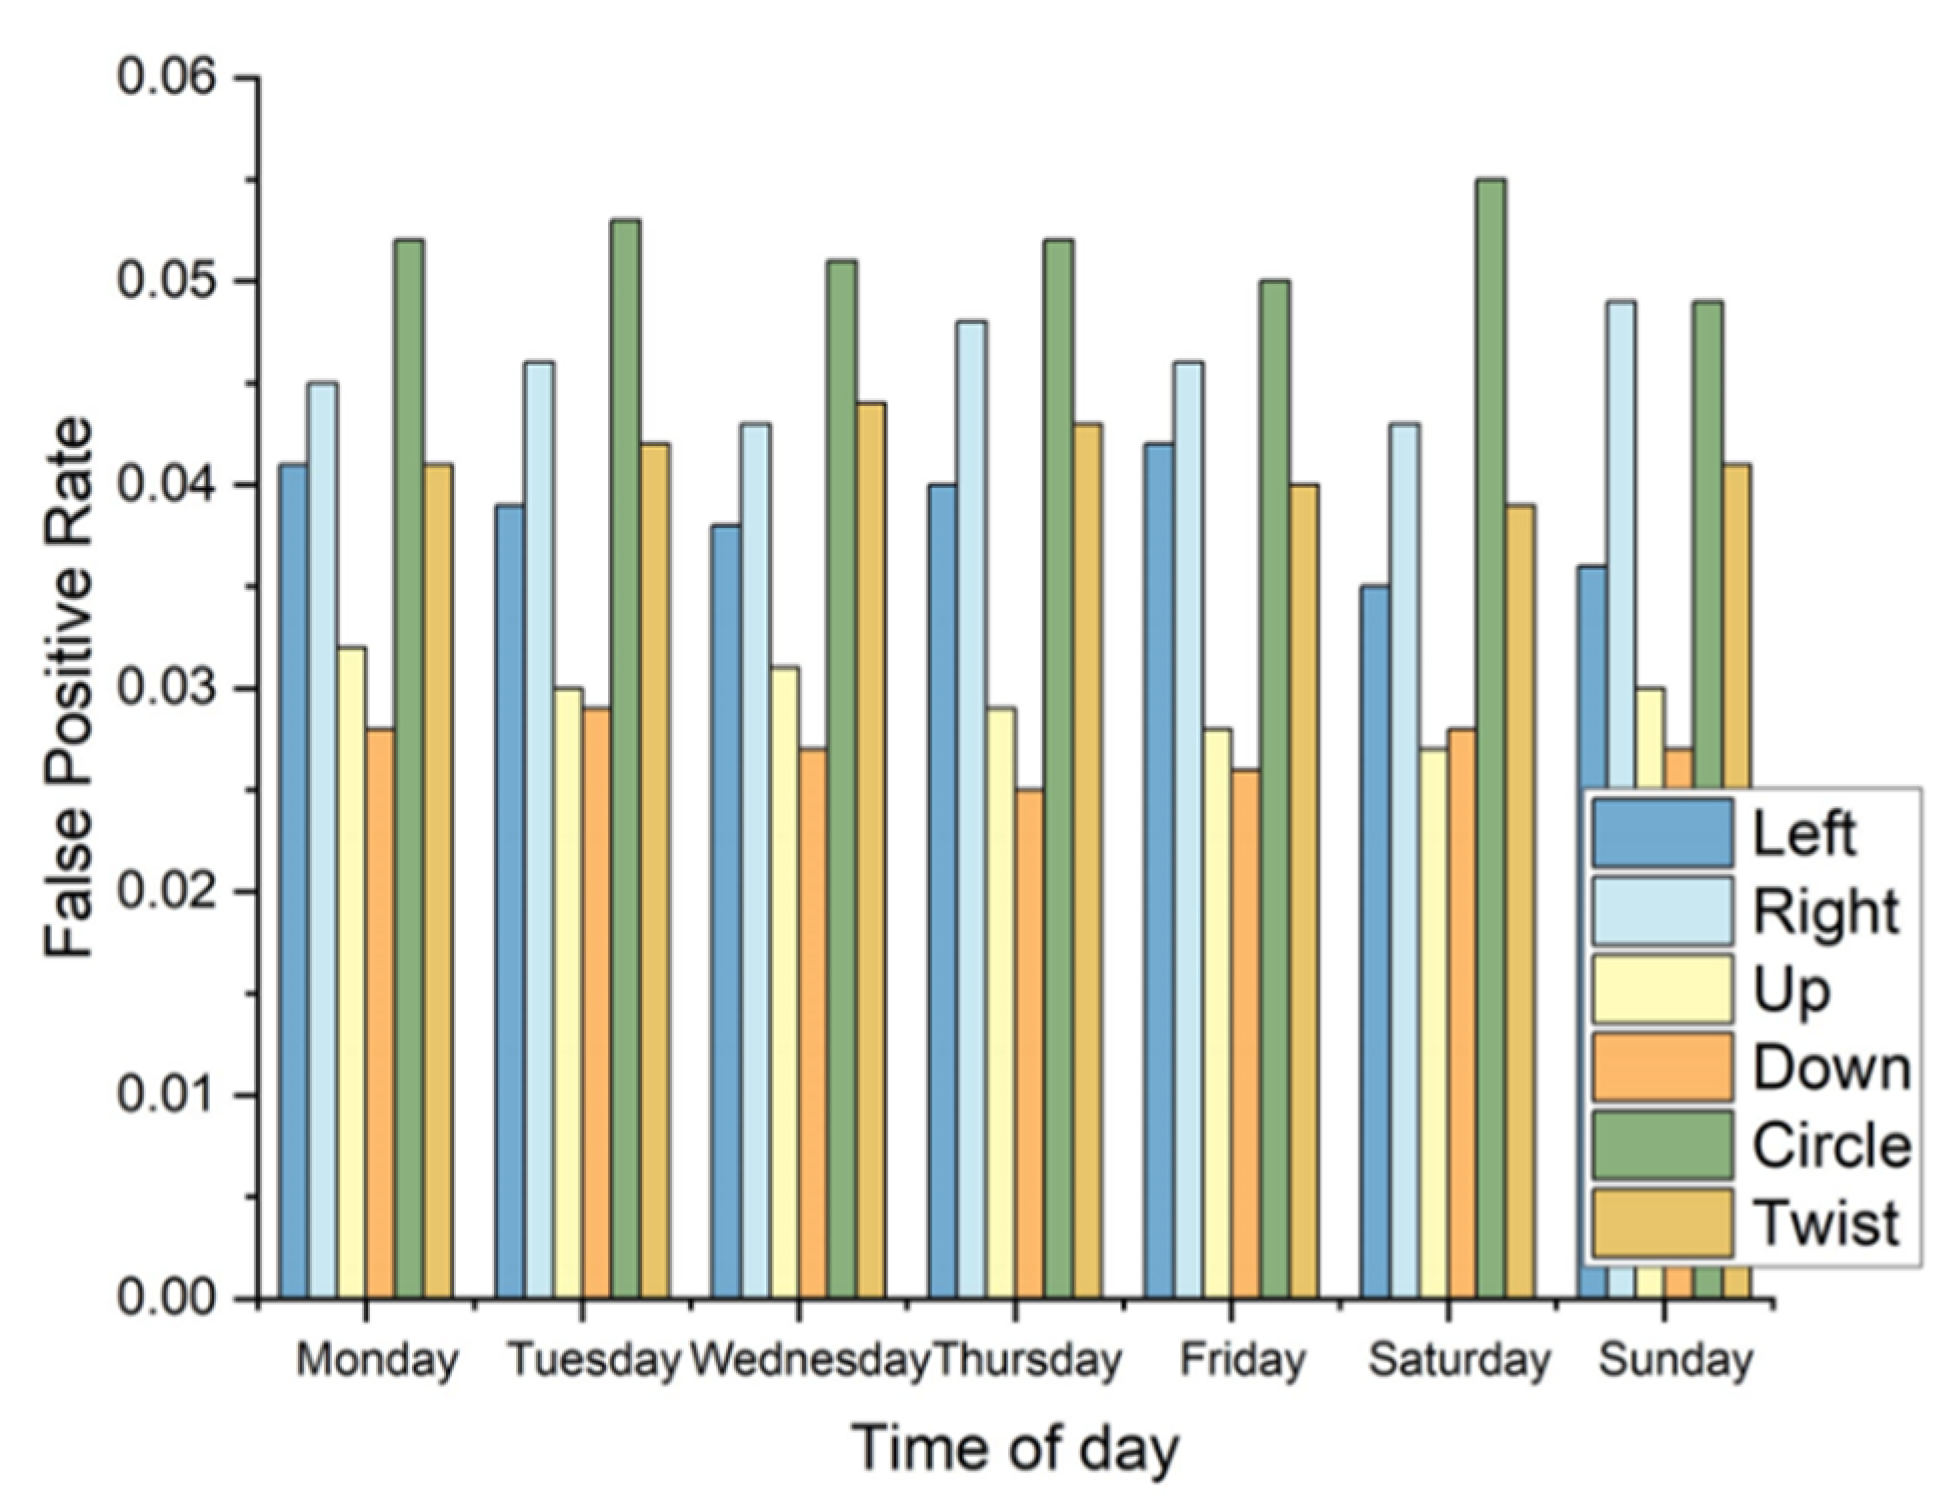
Over time, temperature and humidity will affect the millimeter wave signal. Millimeter-wave signals will scatter and absorb particles in the air during transmission to weaken the signal strength. This is the inevitable loss of electromagnetic waves in the propagation process, so it is necessary to consider this loss. It also has an obvious degree of persuasion for the overall feasibility of the experiment. The time dimension is introduced to verify the performance of the identification method. Figure 19 shows five different average false positive rates (FPR) types. Make gestures at the same time every day for one week, and observe the FPR of six test postures, which are 3.23%, 4.21%, 4.15%, 4.26%, 3.32% and 3.85%, respectively. Therefore, the method proposed in this paper has sufficient robustness under time-varying conditions.

4.2.8. Impact of Different Feature

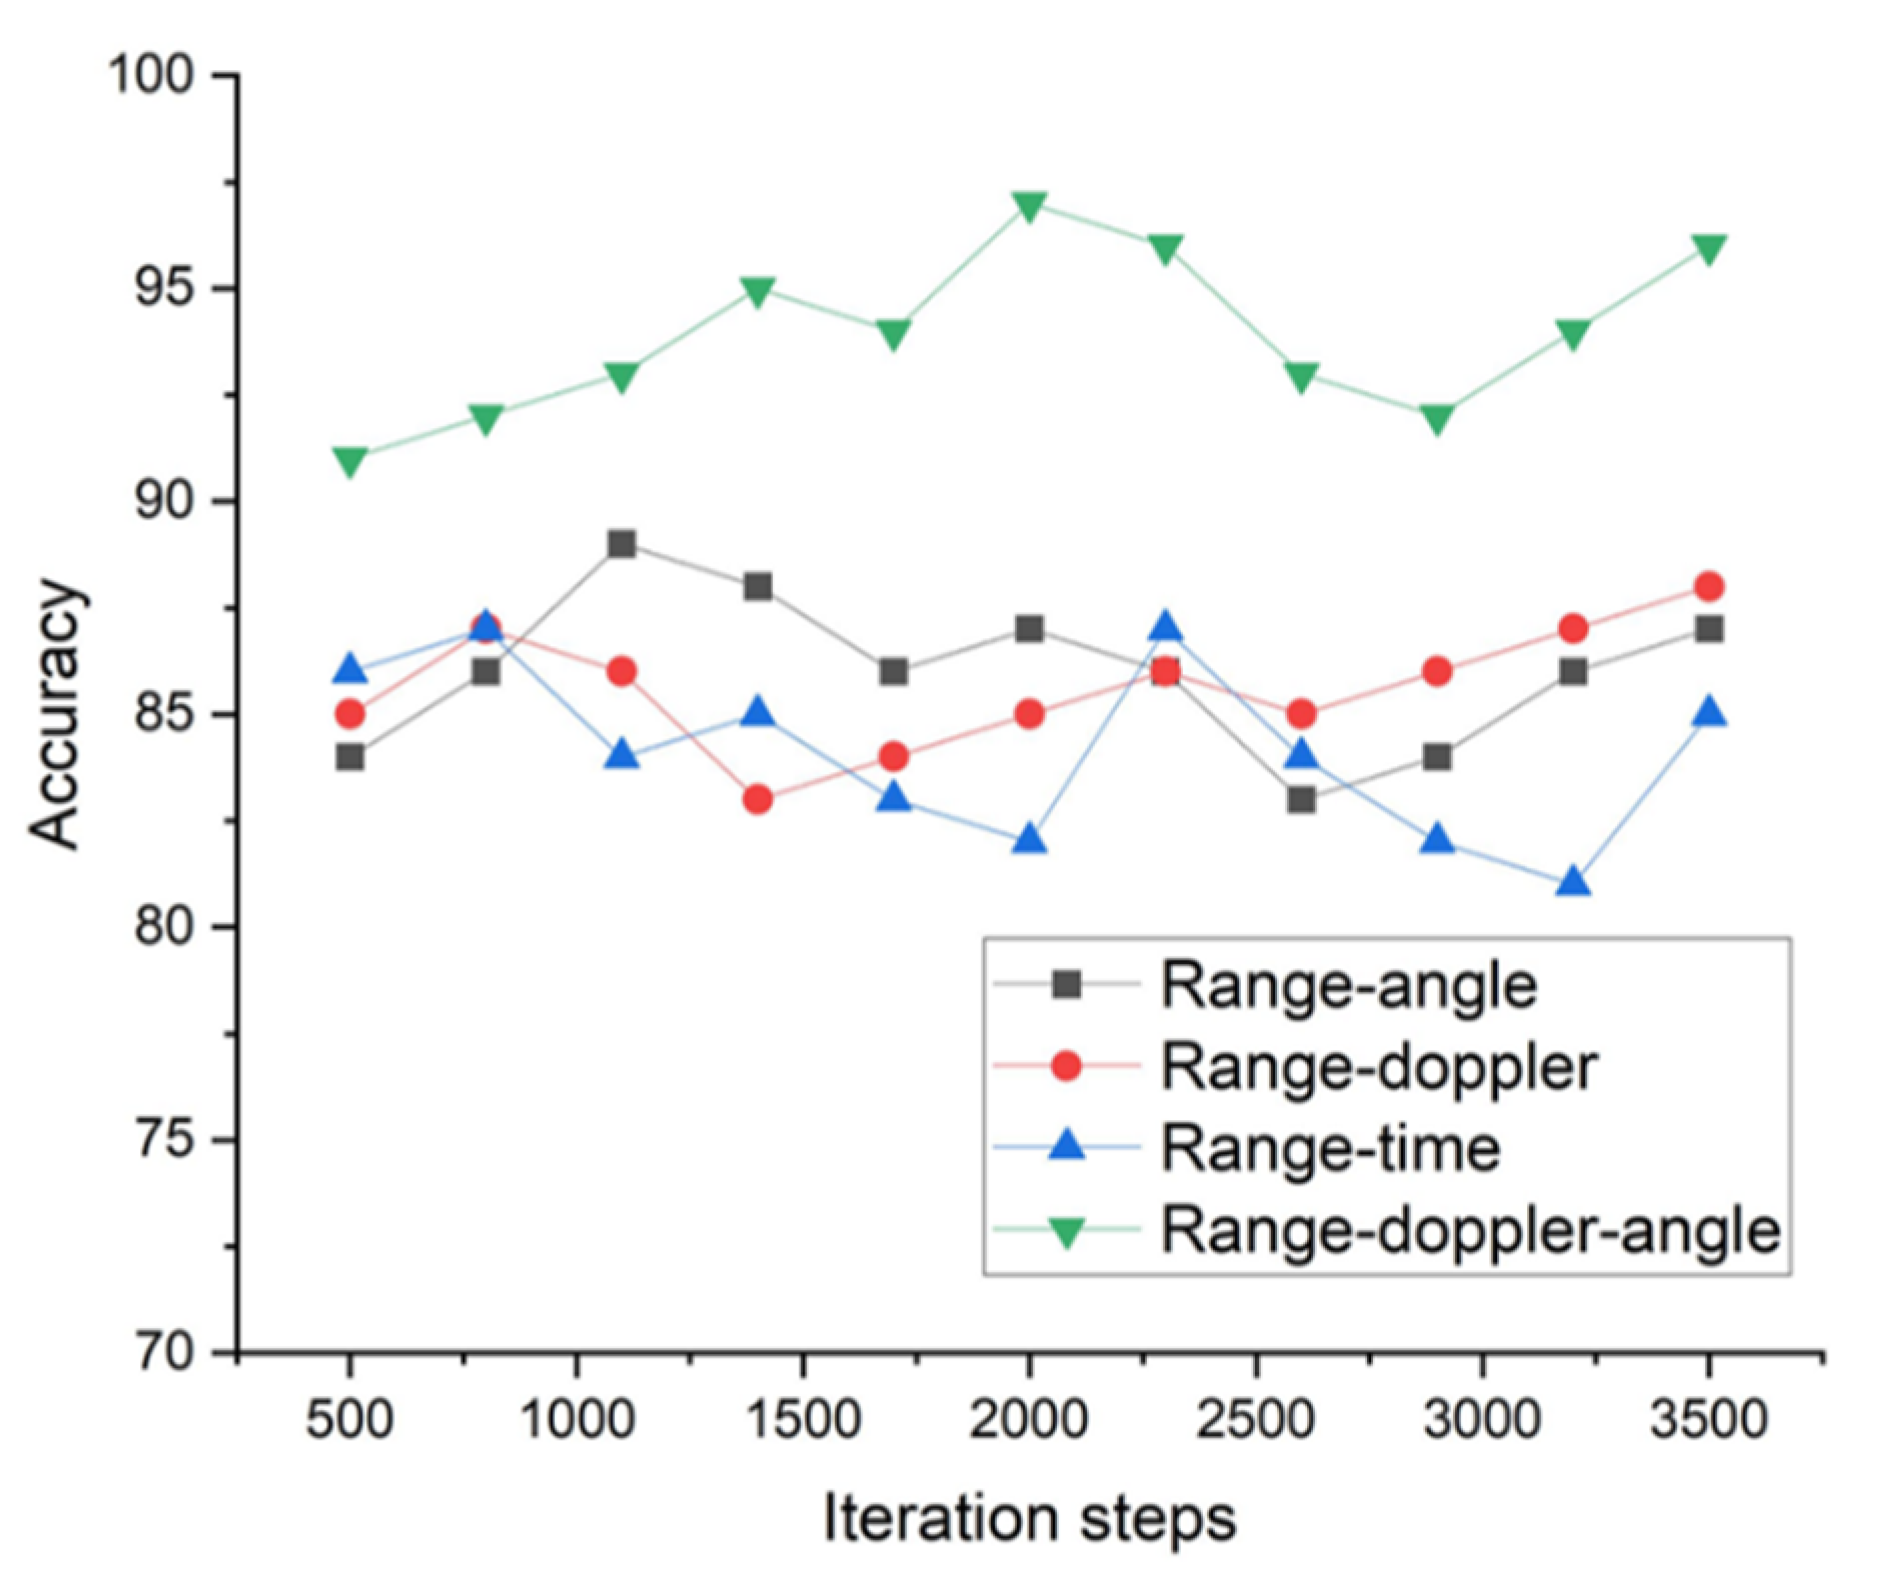
The influence of the gesture feature map on the recognition effect is obvious. The recognition effect has obvious differences between the range characteristic map and the range-doppler characteristic map. In this paper, the recognition results of a single feature map are obtained by analyzing different gesture features. As shown in Figure 20, the recognition effects of a single feature are almost the same. Therefore, it is necessary to extract the features between three-dimensional gesture images. By comparing the three-dimensional and single gesture feature maps, we can see the obvious difference in their recognition effect. Because the three-dimensional gesture feature is adopted in this paper, the range, doppler and angle feature parameters are fused. In contrast, the recognition effect of the fused gesture feature map is better and more accurate. This is because a single gesture feature cannot represent the whole gesture. After fusion, each feature will complement and extract all the contents of gesture features. Using a neural network algorithm for recognition training, the recognition effect is more accurate and higher. For the fused feature map, set different learning rates and the n observe the recognition efficiency.

4.2.9. Comparison with Previous Studies

Previous studies very similar to those mentioned in the article mainly include Tao et al. [25] used the Dual-Channel CNN to train and classify the data. Yong et al. [27] used the End-To-End multi-dimensional CNN training data. Zhaoyang et al. [28] used the mixing CNN to train recognition on the concatenated gesture feature set. Jing Biao [29] used the one-dimensional V3 structure and LSTM fusion network for gesture recognition on raw echo data. Tao et al. [25] used range and doppler features to describe gestures. So the description of motions is not comprehensive, and the average recognition rate of gestures is 75%. Yong et al. [27] used the end-to-end CNN to train and recognize gestures on a three-dimensional gesture feature set. The average recognition rate for motions is 78%. Zhaoyang et al. [28] concatenate distance, doppler, and angle features. The average recognition rate is 80%. Jing Biao [29] used the one-dimensional V3 structure and LSTM fusion network to process raw echo data. Since the raw data is not preprocessed, the average recognition rate is only 72%. The three-dimensional CNN trains a three-dimensional gesture feature set. The gesture feature set describes gestures comprehensively and accurately. Therefore, the average recognition efficiency is high, reaching 83%. The comparison of the recognition effect is shown in Figure 21 below.

4.2.10. Overall System Performance Analysis

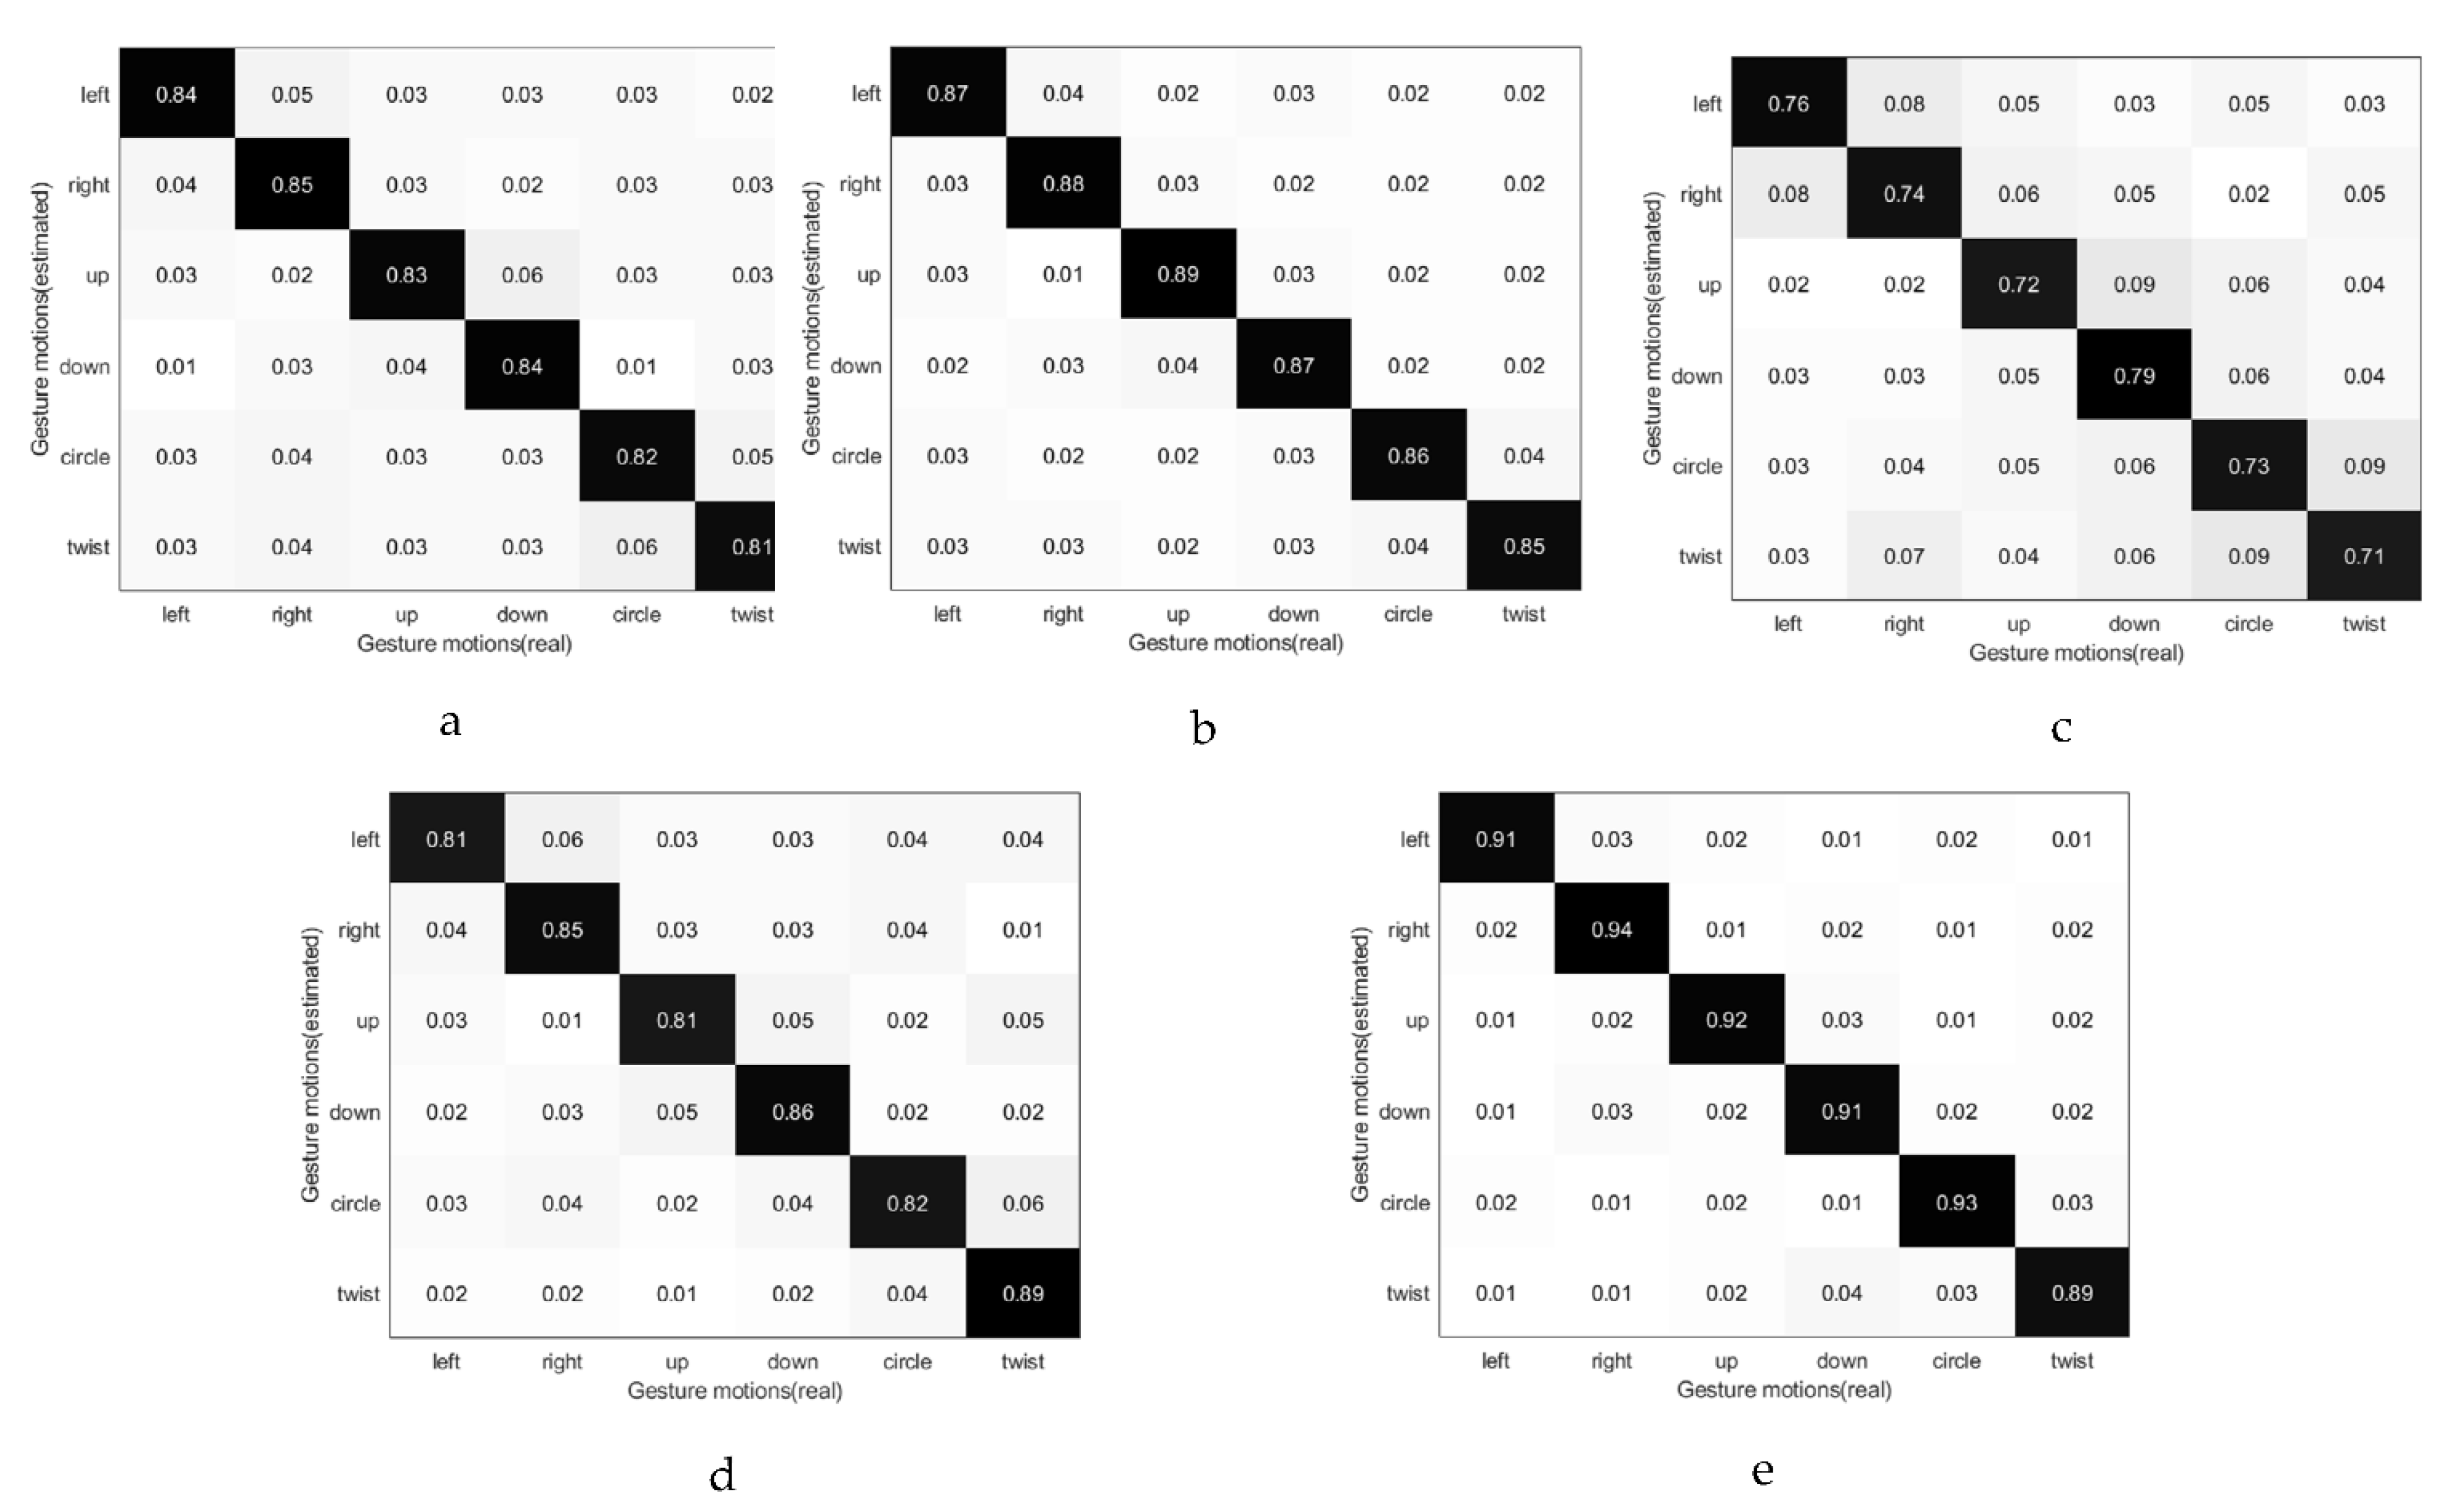
The experiments are conducted across scene domains, so comparing the recognition effects of different scene domains is essential. During the investigation, only the experimenter was in the perceptual area. This avoids the influence of human factors on the experiment. Five people, five orientations, and six gestures were set up in three experimental settings, and ten data sets were collected for each motion. For experiments with known scenarios, the training data used is 90% of the data in the environment. That is, 90% of each person’s six gestures, the position and orientation are randomly selected, and the test data is 10% of the data. The average recognition results for known scene domains are shown in Figure 22a. For experiments with unknown scenarios, the training data is all data, and the test data is all data. The average recognition results for the unknown scene domain are shown in Figure 22b. Different positions and orientations and experimenters as experimental factors can affect the accuracy of gesture recognition. Four location datasets are trained in three experimental environments to compare the effects of observed locations on gesture recognition. The other area validates the training results. The average recognition rate in the location scene domain is 74.1% (Figure 22c). Due to the limited coverage of FMCW signals, data from different locations cannot be fully adapted to other areas. If out of range, distance and velocity resolution will drop dramatically. Therefore, the recognition rate also drops. In addition, verify the effect of angle on gesture recognition accuracy. The verification results are shown in (Figure 22d). The curve’s influence on the recognition effect is similar to that of the position, and different angles will affect the recognition result of the gesture more or less. Finally, the influence of the experimenter on the recognition rate is verified. The experimental results are shown in (Figure 22e). The average recognition rate reaches 91.5%, which is higher than the average recognition rate under other factors. This is because the length of human fingers and the experiment time are negligible, so the recognition rate is very high.

5. Conclusions

This paper uses the three-dimensional CNN for cross-scene recognition of gestures collected by millimeter-wave radar. The experiment is to train and verify the gesture data collected in one experimental scene in another practical set. It shows that gesture recognition by millimeter-wave radar has nothing to do with the scene domain. To verify that, millimeter-wave radar recognizes gestures independent of the scene domain. The experiments are designed with four scene domains (environment, location, orientation, and person). Motions are first collected from the scene domain. Then, the gesture data is processed—extraction to distance-time features, distance-doppler features, and distance-angle features. Using three gesture feature sets to describe gestures can solve the problem that gesture features in different scenes are difficult to adapt to other positions and gesture descriptions are incomplete. Then, these three feature sets are trained in the three-dimensional CNN. At the same time, the time dimension is introduced into the training of gesture features. Finally, gestures are recognized in different scene domains, illustrating that millimeter-wave radar recognizes gestures regardless of scene domain. Experiments show that motions in the scene domain (environment, location, orientation, and person) can be identified by other gestures in the scene domain. The experimental results show that the average recognition accuracy in the known scene domain is 87% and the average recognition accuracy in the unknown scene is 83.1%. At the same time, the structure of the neural network is also an external factor that affects the experiment. It is analyzed to enhance the recognition system’s robustness and to verify its overall recognition effect.

Author Contributions

Conceptualization, X.D., K.W. and Z.H.; methodology, X.D. and K.W.; software, K.W. and Z.M.; validation, X.D., K.W. and Z.H.; formal analysis, X.D., K.W. and Z.M.; investigation, Z.H.; resources, X.D. and Z.H.; data curation, X.D., K.W. and Z.M.; writing—original draft preparation, K.W.; writing—review and editing, X.D., Z.H. and Z.M.; visualization, X.D. and Z.H.; supervision, X.D.; project administration, X.D. and Z.H.; funding acquisition, X.D. and Z.H. All authors have read and agreed to the published version of the manuscript.

Funding

This research was funded by National Natural Science Foundation of China (Grant 62162056) and the Industrial Support Foundations of Gansu (Grant 62162056) to X.D. and Z.H. (Grant No. 2021CYZC-06).

Conflicts of Interest

The authors declare no conflict of interest.

References

  1. Huang, D.; Chen, L. Intelligent driving perception of FM CW millimeter wave radar. Intell. Comput. Appl. 2021, 11, 152–155. [Google Scholar]
  2. Dang, X.; Qin, F.; Bu, X.; Liang, X. A robust sensing algorithm for fusion of millimeter wave radar and laser radar for intelligent driving. Acta Radaris Sin. 2021, 10, 622–631. [Google Scholar]
  3. Molchanov, P.; Gupta, S.; Kim, K.; Pulli, K. Short-range FMCW monopulse radar for hand-gesture sensing. In Proceedings of the 2015 IEEE Radar Conference (RadarCon), Arlington, TX, USA, 10–15 May 2015; pp. 1491–1496. [Google Scholar]
  4. Molchanov, P.; Gupta, S.; Kim, K.; Kautz, J. Hand gesture recognition with 3D convolutional neural networks. In Proceedings of the IEEE Conference on Computer Vision and Vattern Recognition Workshops, Boston, MA, USA, 7–12 June 2015; pp. 1–7. [Google Scholar]
  5. Liu, L.; Qin, B.; Li, L.; Du, Y. Estimation method of Vehicle Trajectory Accuracy sensed by roadside millimeter wave radar. China Commun. Informatiz. 2022, 26, 119–123. [Google Scholar]
  6. Zhang, L.; Zhong, W.; Zhang, J.; Zhu, Q.; Chen, X. Millimeter wave beam tracking based on vehicle environment situational awareness. Signal Process. 2022, 38, 457–465. [Google Scholar]
  7. Shotton, J.; Fitzgibbon, A.; Cook, M.; Sharp, T.; Finocchio, M.; Moore, R.; Kipman, A.; Blake, A. Real-time human pose recognition in parts from single depth images. In Proceedings of the CVPR 2011, Colorado Springs, CO, USA, 20–25 June 2011; pp. 1297–1304. [Google Scholar]
  8. Otero, M. Application of a continuous wave radar for human gait recognition. In Proceedings of the SPIE 5809, Signal Processing, Sensor Fusion, and Target Recognition XIV, Bellingham, WA, USA, 25 May 2005. [Google Scholar]
  9. Rahman, T.; Adams, A.T.; Ravichandran, R.V.; Zhang, M.; Patel, S.N.; Kientz, J.A.; Choudhury, T. DoppleSleep: A contactless unobtrusive sleep sensing system using short-range Doppler radar. In Proceedings of the 2015 ACM International Joint Conference on Pervasive and Ubiquitous Computing (UbiComp’15), Osaka, Japan, 7–11 September 2015; Association for Computing Machinery: New York, NY, USA, 2015; pp. 39–50. [Google Scholar]
  10. Dardas, N.H.; Georganas, N.D. Real-Time Hand Gesture Detection and Recognition Using Bag-of-Features and Support Vector Machine Techniques. In Proceedings of the IEEE Transactions on Instrumentation and Measurement, Capri Island, Italy, 10–11 October 2011; Volume 60, pp. 3592–3607. [Google Scholar]
  11. Wu, J.; Konrad, J.; Ishwar, P. Dynamic time warping for gesture-based user identification and authentication with Kinect. In Proceedings of the 2013 IEEE International Conference on Acoustics, Speech and Signal Processing, Vancouver, UK, 26–31 May 2013; pp. 2371–2375. [Google Scholar]
  12. Virmani, A.; Shahzad, M. Position and orientation agnostic gesture recognition using wifi. In Proceedings of the 15th Annual International Conference on Mobile Systems, Applications, and Services, New York, NY, USA, 19–23 June 2017; pp. 252–264. [Google Scholar]
  13. Wang, R.Y.; Popović, J. Real-time hand-tracking with a color glove. ACM Trans. Graph. 2009, 28, 1–8. [Google Scholar]
  14. Sharp, T.; Keskin, C.; Robertson, D.; Taylor, J.; Shotton, J.; Kim, D.; Rhemann, C.; Leichter, I.; Vinnikov, A.; Wei, Y.; et al. Accurate, Robust, and Flexible Real-time Hand Tracking. In Proceedings of the 33rd Annual ACM Conference on Human Factors in Computing Systems (CHI’15), Seoul, Republic of Korea, 18–23 April 2015; Association for Computing Machinery: New York, NY, USA, 2015; pp. 3633–3642. [Google Scholar]
  15. Duffner, S.; Berlemont, S.; Lefebvre, G.; Garcia, C. 3D gesture classification with convolutional neural networks. In Proceedings of the 2014 IEEE International Conference on Acoustics, Speech and Signal Processing (ICASSP), Florence, Italy, 4–9 May 2014; pp. 5432–5436. [Google Scholar]
  16. Chan, L.; Hsieh, C.-H.; Chen, Y.-L.; Yang, S.; Huang, D.-Y.; Liang, R.-H.; Chen, B.-Y. Cyclops: Wearable and Single-Piece Full-Body Gesture Input Devices. In Proceedings of the 33rd Annual ACM Conference on Human Factors in Computing Systems (CHI’15), Seoul, Republic of Korea, 18 April 2015; Association for Computing Machinery: New York, NY, USA, 2015; pp. 3001–3009. [Google Scholar]
  17. Zhang, J.; Tang, Z.; Li, M.; Fang, D.; Nurmi, P.; Wang, Z. CrossSense: Towards cross-site and large-scale WiFi sensing. In Proceedings of the 24th Annual International Conference on Mobile Computing and Networking, New Delhi, India, 29 October–2 November 2018; pp. 305–320. [Google Scholar]
  18. Kurakin, A.; Zhang, Z.; Liu, Z. A real time system for dynamic hand gesture recognition with a depth sensor. In Proceedings of the 20th European Signal Processing Conference (EUSIPCO), Belgrade, Serbia, 12 December 2012; pp. 1975–1979. [Google Scholar]
  19. Keskin, C.; Kıraç, F.; Kara, Y.E.; Akarun, L. Real Time Hand Pose Estimation Using Depth Sensors. In Consumer Depth Cameras for Computer Vision. Advances in Computer Vision and Pattern Recognition; Fossati, A., Gall, J., Grabner, H., Ren, X., Konolige, K., Eds.; Springer: London, UK, 2013. [Google Scholar]
  20. Dorfmuller-Ulhaas, K.; Schmalstieg, D. Finger tracking for interaction in augmented environments. In Proceedings of the IEEE and ACM International Symposium on Augmented Reality, New York, NY, USA, 26–29 October 2001; pp. 55–64. [Google Scholar]
  21. Zheng, Y.; Zhang, Y.; Qian, K.; Zhang, G.; Liu, Y.; Wu, C.; Yang, Z. Zero-effort cross-domain gesture recognition with Wi-Fi. In Proceedings of the 17th Annual International Conference on Mobile Systems, Applications, and Services, Shanghai, China, 26 May 2019; pp. 313–325. [Google Scholar]
  22. Wang, S.; Song, J.; Lien, J.; Poupyrev, I.; Hilliges, O. Interacting with soli: Exploring fine-grained dynamic gesture recognition in the radio-frequency spectrum. In Proceedings of the 29th Annual Symposium on User Interface Software and Technology, Tokyo Japan, 16–19 October 2016; pp. 851–860. [Google Scholar]
  23. Lien, J.; Gillian, N.; Karagozler, M.E.; Amihood, P.; Schwesig, C.; Olson, E.; Raja, H.; Poupyrev, I. Soli: Ubiquitous gesture sensing with millimeter wave radar. ACM Trans. Graph. 2016, 35, 1–19. [Google Scholar] [CrossRef] [Green Version]
  24. Li, G.; Zhang, R.; Ritchie, M.; Griffiths, H. Sparsity-driven micro-Doppler feature extraction for dynamic hand gesture recognition. IEEE Trans. Aerosp. Electron. Syst. 2017, 54, 655–665. [Google Scholar] [CrossRef]
  25. Chen, T.; Zhang, F.; Liu, Z. Gesture Recognition based on FMCW Millimeter Wave Radar. Appl. Sci. Technol. 2021, 48, 1–5. (In Chinese) [Google Scholar]
  26. Kim, Y.; Toomajian, B. Hand gesture recognition using micro-Doppler signatures with convolutional neural network. IEEE Access 2016, 4, 7125–7130. [Google Scholar] [CrossRef]
  27. Wang, Y.; Wu, J.; Tian, Z.; Zhou, M.; Wang, S. Multi-dimensional gesture recognition algorithm based on FMCW radar. J. Electron. Inf. Technol. 2019, 41, 822–829. (In Chinese) [Google Scholar]
  28. Xia, Z.; Zhou, C.; Jie, J.; Zhou, T.; Wang, X.; Xu, F.J. Micro-motion identification based on multi-channel FM continuous wave millimeter-wave radar. Electron. Inf. Technol. 2020, 42, 164–172. (In Chinese) [Google Scholar]
  29. Jin, B.; Peng, Y.; Kuang, X.; Zhang, Z. Dynamic Gesture Recognition method for Millimeter wave Radar based on 1D-SCNN. J. Electron. Inf. Technol. 2021, 43, 1–8. (In Chinese) [Google Scholar]
  30. Ji, S.; Xu, W.; Yang, M.; Yu, K. 3D Convolutional Neural Networks for Human Action Recognition. In Proceedings of the IEEE Transactions on Pattern Analysis and Machine Intelligence, Haifa, Israel, 18 April 2013; Volume 35, pp. 221–231. [Google Scholar]
  31. Jiang, W.; Miao, C.; Ma, F.; Ya, S.; Wang, Y.; Yuan, Y.; Xue, H.; Song, C.; Ma, X.; Koutsonikolas, D.; et al. Towards environment independent device free human activity recognition. In Proceedings of the 24th Annual International Conference on Mobile Computing and Networking, New Delhi, India, 29 October–2 November 2018; pp. 289–304. [Google Scholar]
  32. Zhou, Y.; Sun, X.; Zha, Z.J.; Zeng, W. Mict: Mixed 3d/2d convolutional tube for human action recognition. In Proceedings of the IEEE Conference on Computer Vision and Pattern Recognition, Salt Lake City, UT, USA, 18–23 June 2018; pp. 449–458. [Google Scholar]
  33. Dong, X.; Wu, H.H.; Yan, Y.; Qian, L. Hierarchical transfer convolutional neural networks for image classification. In Proceedings of the 2019 IEEE International Conference on Big Data (Big Data), Los Angeles, CA, USA, 9–12 December 2019; pp. 2817–2825. [Google Scholar]
  34. Wu, W.; Qi, Z.; Fuxin, L. Pointconv: Deep convolutional networks on 3d point clouds. In Proceedings of the IEEE/CVF Conference on Computer Vision and Pattern Recognition, Long Beach, CA, USA, 15–20 June 2019; pp. 9621–9630. [Google Scholar]
  35. Jiang, B.; Zhang, Z.; Lin, D.; Tang, J.; Luo, B. Semi-supervised learning with graph learning-convolutional networks. In Proceedings of the IEEE/CVF Conference on Computer Vision and Pattern Recognition, Long Beach, CA, USA, 15–20 June 2019; pp. 11313–11320. [Google Scholar]
  36. Al-Jamali NA, S.; Al-Raweshidy, H.S. Smart IoT Network Based Convolutional Recurrent Neural Network with Element-Wise Prediction System. IEEE Access 2021, 9, 47864–47874. [Google Scholar] [CrossRef]
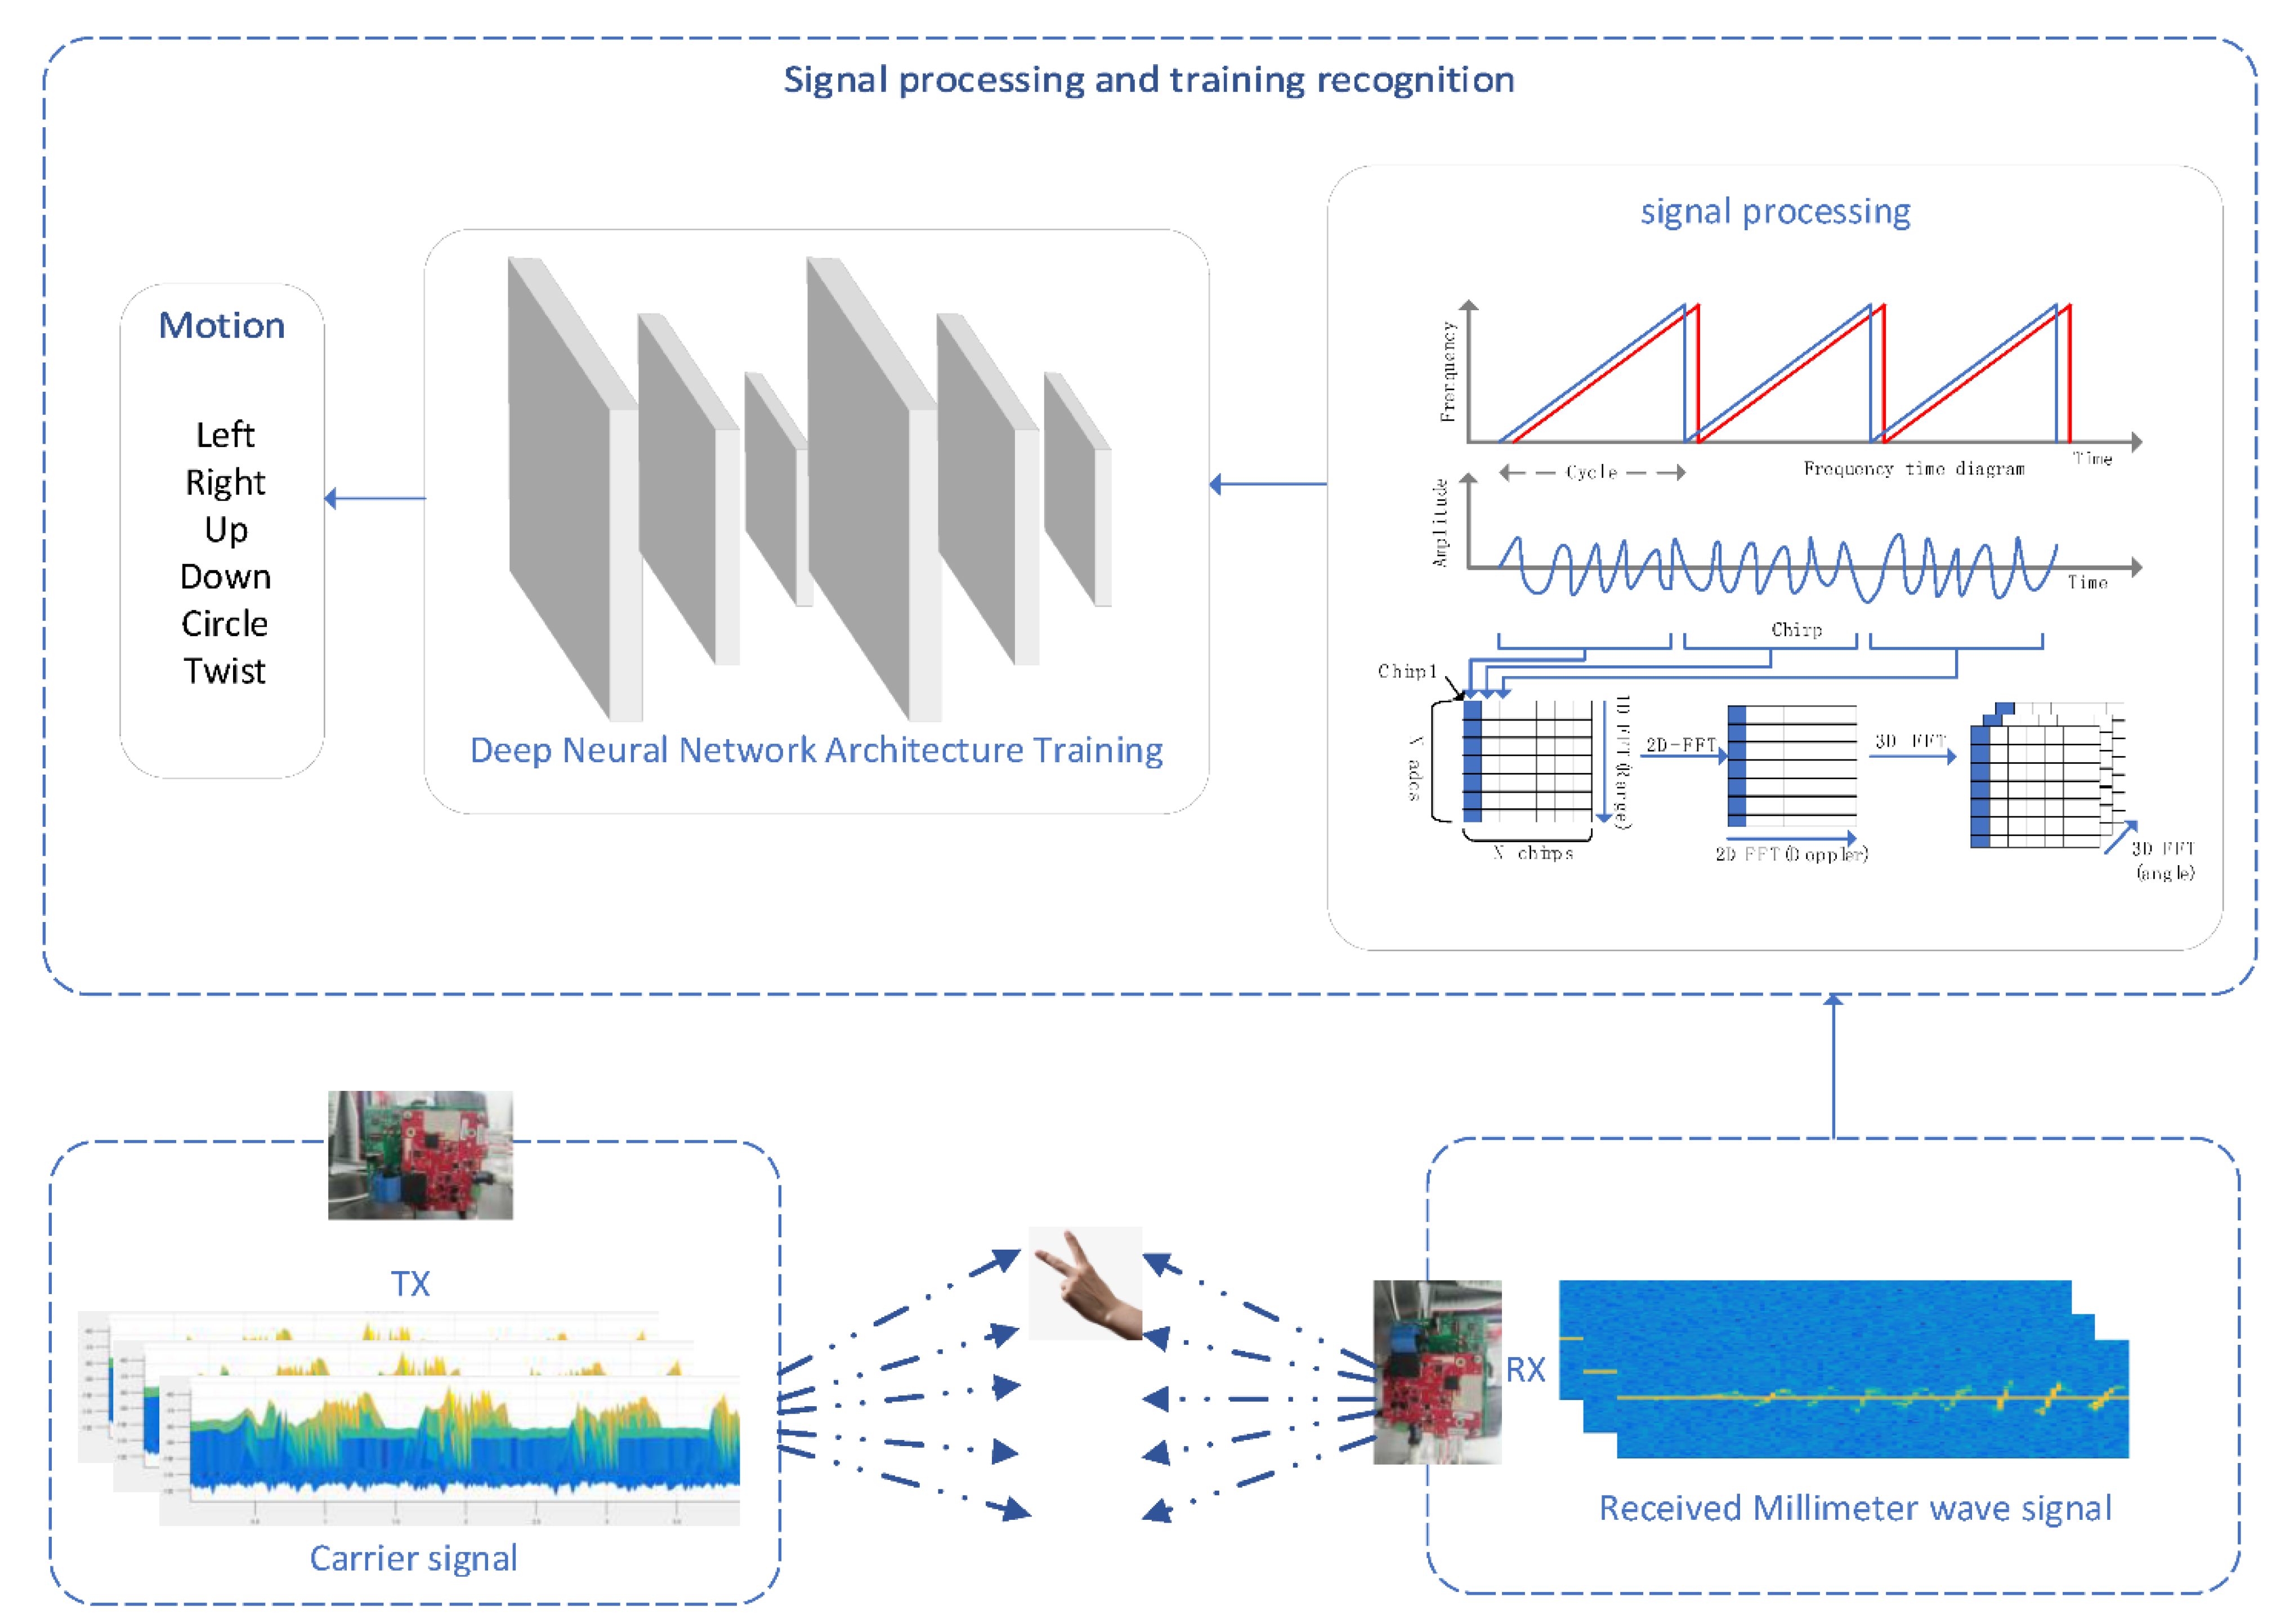
Figure 1. Millimeter-wave signal gesture recognition architecture network.
Signals 03 00052 g001
Figure 2. FMCW radar system.
Signals 03 00052 g002
Figure 3. FMCW wave diagram.
Signals 03 00052 g003
Figure 4. The process of the two-dimensional CNN.
Signals 03 00052 g004
Figure 5. The process of the three-dimensional CNN.
Signals 03 00052 g005
Figure 6. Architecture of the three-dimensional CNN.
Signals 03 00052 g006
Figure 7. IWR1642.
Figure 7. IWR1642.
Signals 03 00052 g007
Figure 8. Experimental gestures.
Signals 03 00052 g008
Figure 9. Device deployment instance.
Signals 03 00052 g009
Figure 10. Experimental environment instance. (a) corridor environment, (b) laboratory environment and (c) outdoor environment.
Signals 03 00052 g010
Figure 11. Effect of learning rate on accuracy instance.
Signals 03 00052 g011
Figure 12. Influence of height on recognition rate.
Signals 03 00052 g012
Figure 13. Influence of packet rate on recognition rate.
Signals 03 00052 g013
Figure 14. Comparison of recognition accuracy in different environment. (a) Recognition rate under 77 GHz bandwidth. (b) Recognition rate under 24 GHz bandwidth.
Signals 03 00052 g014
Figure 15. Influence of different directions on recognition effect.
Signals 03 00052 g015
Figure 16. Influence of different location on recognition effect.
Signals 03 00052 g016
Figure 17. Identification accuracy of different person.
Signals 03 00052 g017
Figure 18. Comparison of different model.
Signals 03 00052 g018
Figure 19. Robustness verification.
Signals 03 00052 g019
Figure 20. Characteristic comparison diagram.
Signals 03 00052 g020
Figure 21. Comparison of the recognition effect.
Signals 03 00052 g021
Figure 22. Confusion matrix. (a) The confusion matrix of the recognition results of the known scene domain, (b) The confusion matrix of unknown scene domain identification results, (c) The confusion matrix of the experimental location scene domain, (d) The confusion matrix of the experimental direction scene domain, (e) The confusion matrix of any scene domain in the experiment.
Signals 03 00052 g022
Table 1. Radar target detection parameter setting.
Radar Parameter NameValue
FM bandwidth4 GHz
Antenna configuration2Tx, 4Rx
Antenna SpacingWave Length/2
FM period40 μs
Data frame period40 ms
The number of chirp signals in the frame128
Sampling Rate2 MHz
The number of sampling points in the FM-period64
Distance resolution3.75 cm/s
Speed resolution4 cm/s
Publisher’s Note: MDPI stays neutral with regard to jurisdictional claims in published maps and institutional affiliations.