You are currently viewing a new version of our website. To view the old version click .
Signals
  • Article
  • Open Access

12 April 2022

XBeats: A Real-Time Electrocardiogram Monitoring and Analysis System

,
,
and
1
Department of Electrical, Computer and Software Engineering, Faculty of Engineering and Applied Science, Ontario Tech University, Oshawa, ON L1G 0C5, Canada
2
School of Computing, Queen’s University, Kingston, ON K7L 2N6, Canada
*
Author to whom correspondence should be addressed.
This article belongs to the Special Issue Internet of Things for Smart Planet: Present and Future

Abstract

This work presents XBeats, a novel platform for real-time electrocardiogram monitoring and analysis that uses edge computing and machine learning for early anomaly detection. The platform encompasses a data acquisition ECG patch with 12 leads to collect heart signals, perform on-chip processing, and transmit the data to healthcare providers in real-time for further analysis. The ECG patch provides a dynamically configurable selection of the active ECG leads that could be transmitted to the backend monitoring system. The selection ranges from a single ECG lead to a complete 12-lead ECG testing configuration. XBeats implements a lightweight binary classifier for early anomaly detection to reduce the time to action should abnormal heart conditions occur. This initial detection phase is performed on the edge (i.e., the device paired with the patch) and alerts can be configured to notify designated healthcare providers. Further deep analysis can be performed on the full fidelity 12-lead data sent to the backend. A fully functional prototype of the XBeats has been implemented to demonstrate the feasibly and usability of the proposed system. Performance evaluation shows that XBeats can achieve up to 95.30% detection accuracy for abnormal conditions, while maintaining a high data acquisition rate of up to 441 samples per second. Moreover, the analytical results of the energy consumption profile show that the ECG patch provides up to 37 h of continuous 12-lead ECG streaming.

1. Introduction

The World Health Organization (WHO) in 2019 identified that cardiovascular diseases (CVDs) are the number one cause of death []. Electrocardiogram (ECG or EKG) is the oldest and most used test by cardiologists for understanding heartbeat “rhythms”. Cardiologists build their diagnoses on heart conditions by analyzing the heart’s electrical activity displayed in waveform format. Diagnosing heart diseases is commonly a manual process []. Holter monitors are widely known devices used by practicing specialists and cardiologists to perform ECG testing. There are multiple configurations of ECG tests using Holter monitors, like the number of leads or data acquisition period. The selection between the common two to three leads or the standard 12 leads is left to the cardiologist’s discretion or as the patient’s heart condition develops []. The 2- to 3-lead Holter monitors are used for detecting heart rate and its rhythm. Conversely, a standard 12-lead ECG would be needed to screen patients for possible cardiac ischemia and help healthcare providers quickly identify patients who have ST-elevation myocardial infarction (i.e., heart attack) and perform the appropriate medical intervention in time []. A standard 12-lead ECG requires a Holter monitor that can be installed at hospitals or carried by the patients. Usually, Holter monitors installed at hospitals come with diagnostic tools to analyze heartbeats in real-time. However, previous ECG charts are not available for comparison with ECG current signals to observe any potential correlation between previous ECG charts and current ECG charts. Furthermore, heart conditions could be misdiagnosed (or an anomaly entirely missed) due to intermittent heart irregularity (aka arrhythmia) [].
Notably, similar devices provide similar functionality to Holter monitors, also called event monitors []. Event monitors are portable devices that a person can carry around day and night until symptoms occur. The main difference is that Holter monitors record ECG signals regardless of the heart conditions during the recording period. In contrast, event monitors are designed to be automatically activated when symptoms are experienced and then record current heartbeats. Alternatively, the patient can manually activate them if an abnormal heart rhythm is felt. Accordingly, recent event monitors can now be configured to be worn continuously, and others are applied to the skin and are activated automatically when any symptoms are experienced []. Event monitors overcome Holter monitors’ shortcomings as they can provide heart monitoring for extended periods that can last for weeks. However, event monitors are not designed to trigger an emergency response for life-threatening arrhythmia due to a processing lag at the order of several minutes. Given the requirements mentioned above, the patient is recommended to stay in bed and be hospitalized for the test period. Consequently, in response to the rapid digital revolution and the COVID-19 pandemic, the healthcare landscape has seen a rapid shift from physical to virtual care and telemedicine. The provision of remote patient monitoring has changed the traditional healthcare abilities to monitor and manage patients []. Despite the significant research efforts brought by MedTech companies and the research community, continuous remote ECG monitoring still lacks comprehensiveness and completeness compared to the services offered in hospitals and clinics [,].
This paper proposes XBeats, a new platform for continuous remote ECG monitoring using a lightweight standard 12-lead ECG smart patch that integrates intelligent signal analysis and offers two heartbeat classification phases. The platform encompasses hardware components that are responsible for the data acquisition represented in our proposed smart patch for ECG monitoring. The ECG patch gathers the ECG data and transmits it to the backend system. The connection between the ECG patch and the backend system is enabled by integrating the latest Internet of Things (IoT) communication protocols (i.e., Bluetooth Low Energy (BLE) and MQTT (Message Queueing Telemetry Transport)). Moreover, the ECG patch introduces interactive modes of operations that are dynamically configured based on the patients’ health conditions or the healthcare provider’s recommendations.
The remainder of the paper is organized as follows: Section 2 reviews related work in this area. The proposed platform architecture is described in Section 3, and we demonstrate the end-to-end solution for real-time ECG monitoring. Section 4 describes the developed prototype of the ECG patch for evaluating the proposed platform. Section 5 contains performance evaluation, and experimental results are given in Section 5. Lastly, Section 6 provides concluding remarks and draws future directions.

3. XBeats System Architecture

The design of XBeats addresses the limitations of existing solutions by providing a BLE-connected, real-time, and comprehensive ECG monitoring system. The architecture comprises a wearable and unobtrusive real-time ECG device which can be configured with three operation modes: (a) continuous mode, (b) triggered mode, and (c) offline mode.

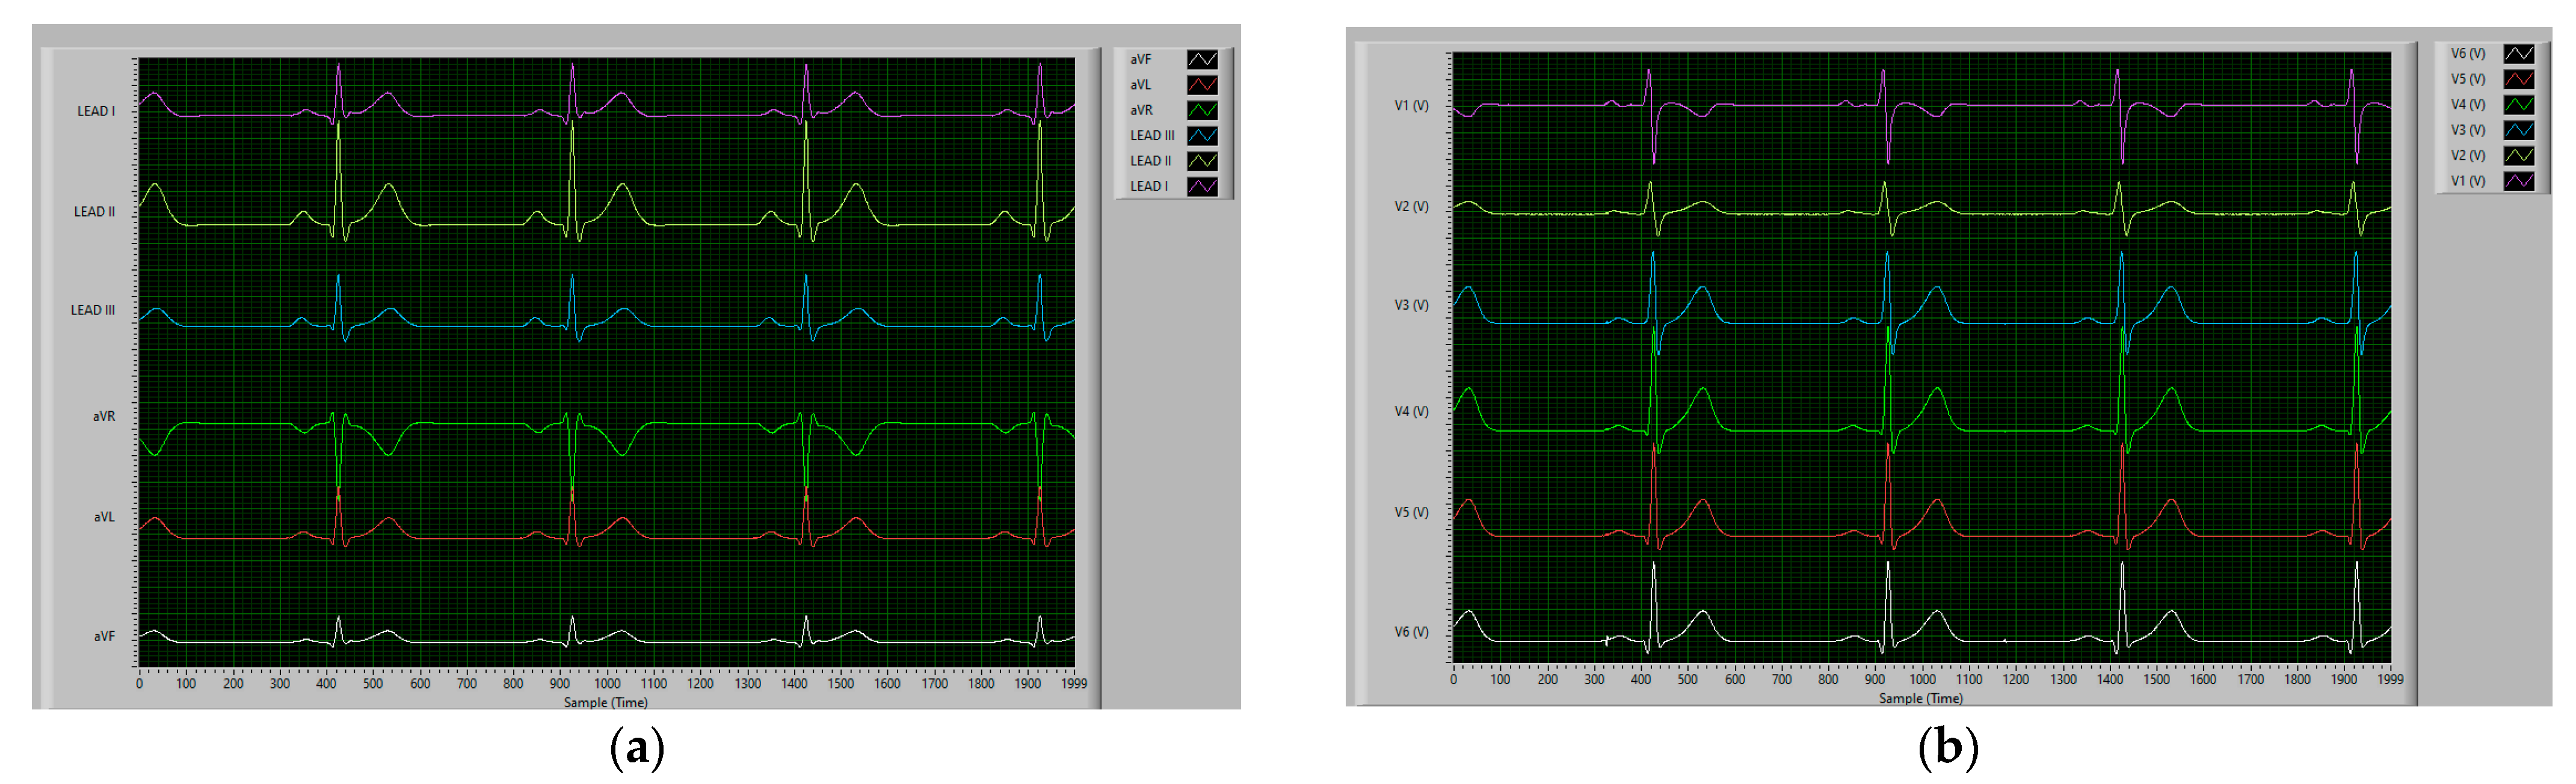
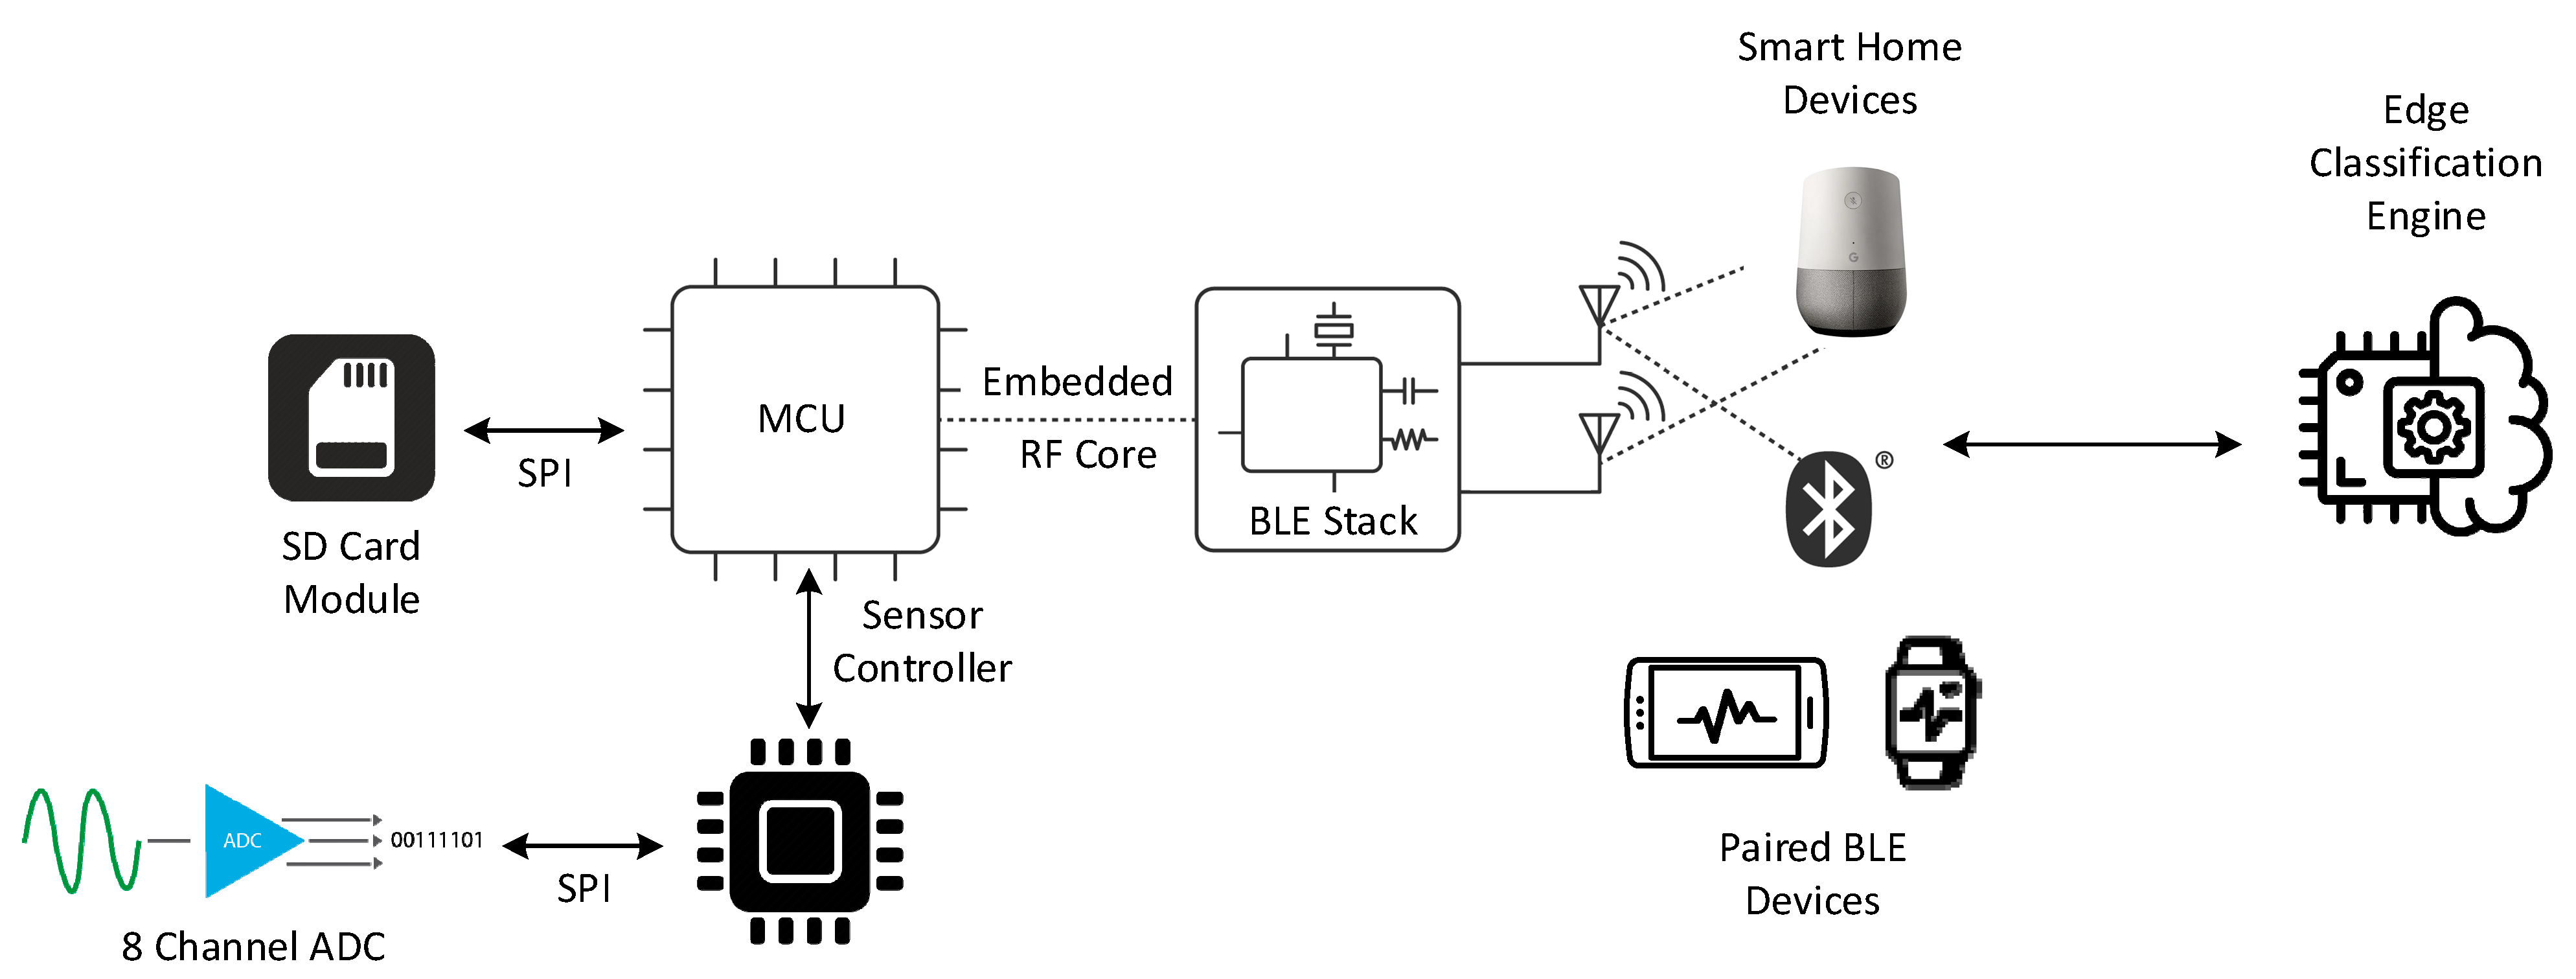
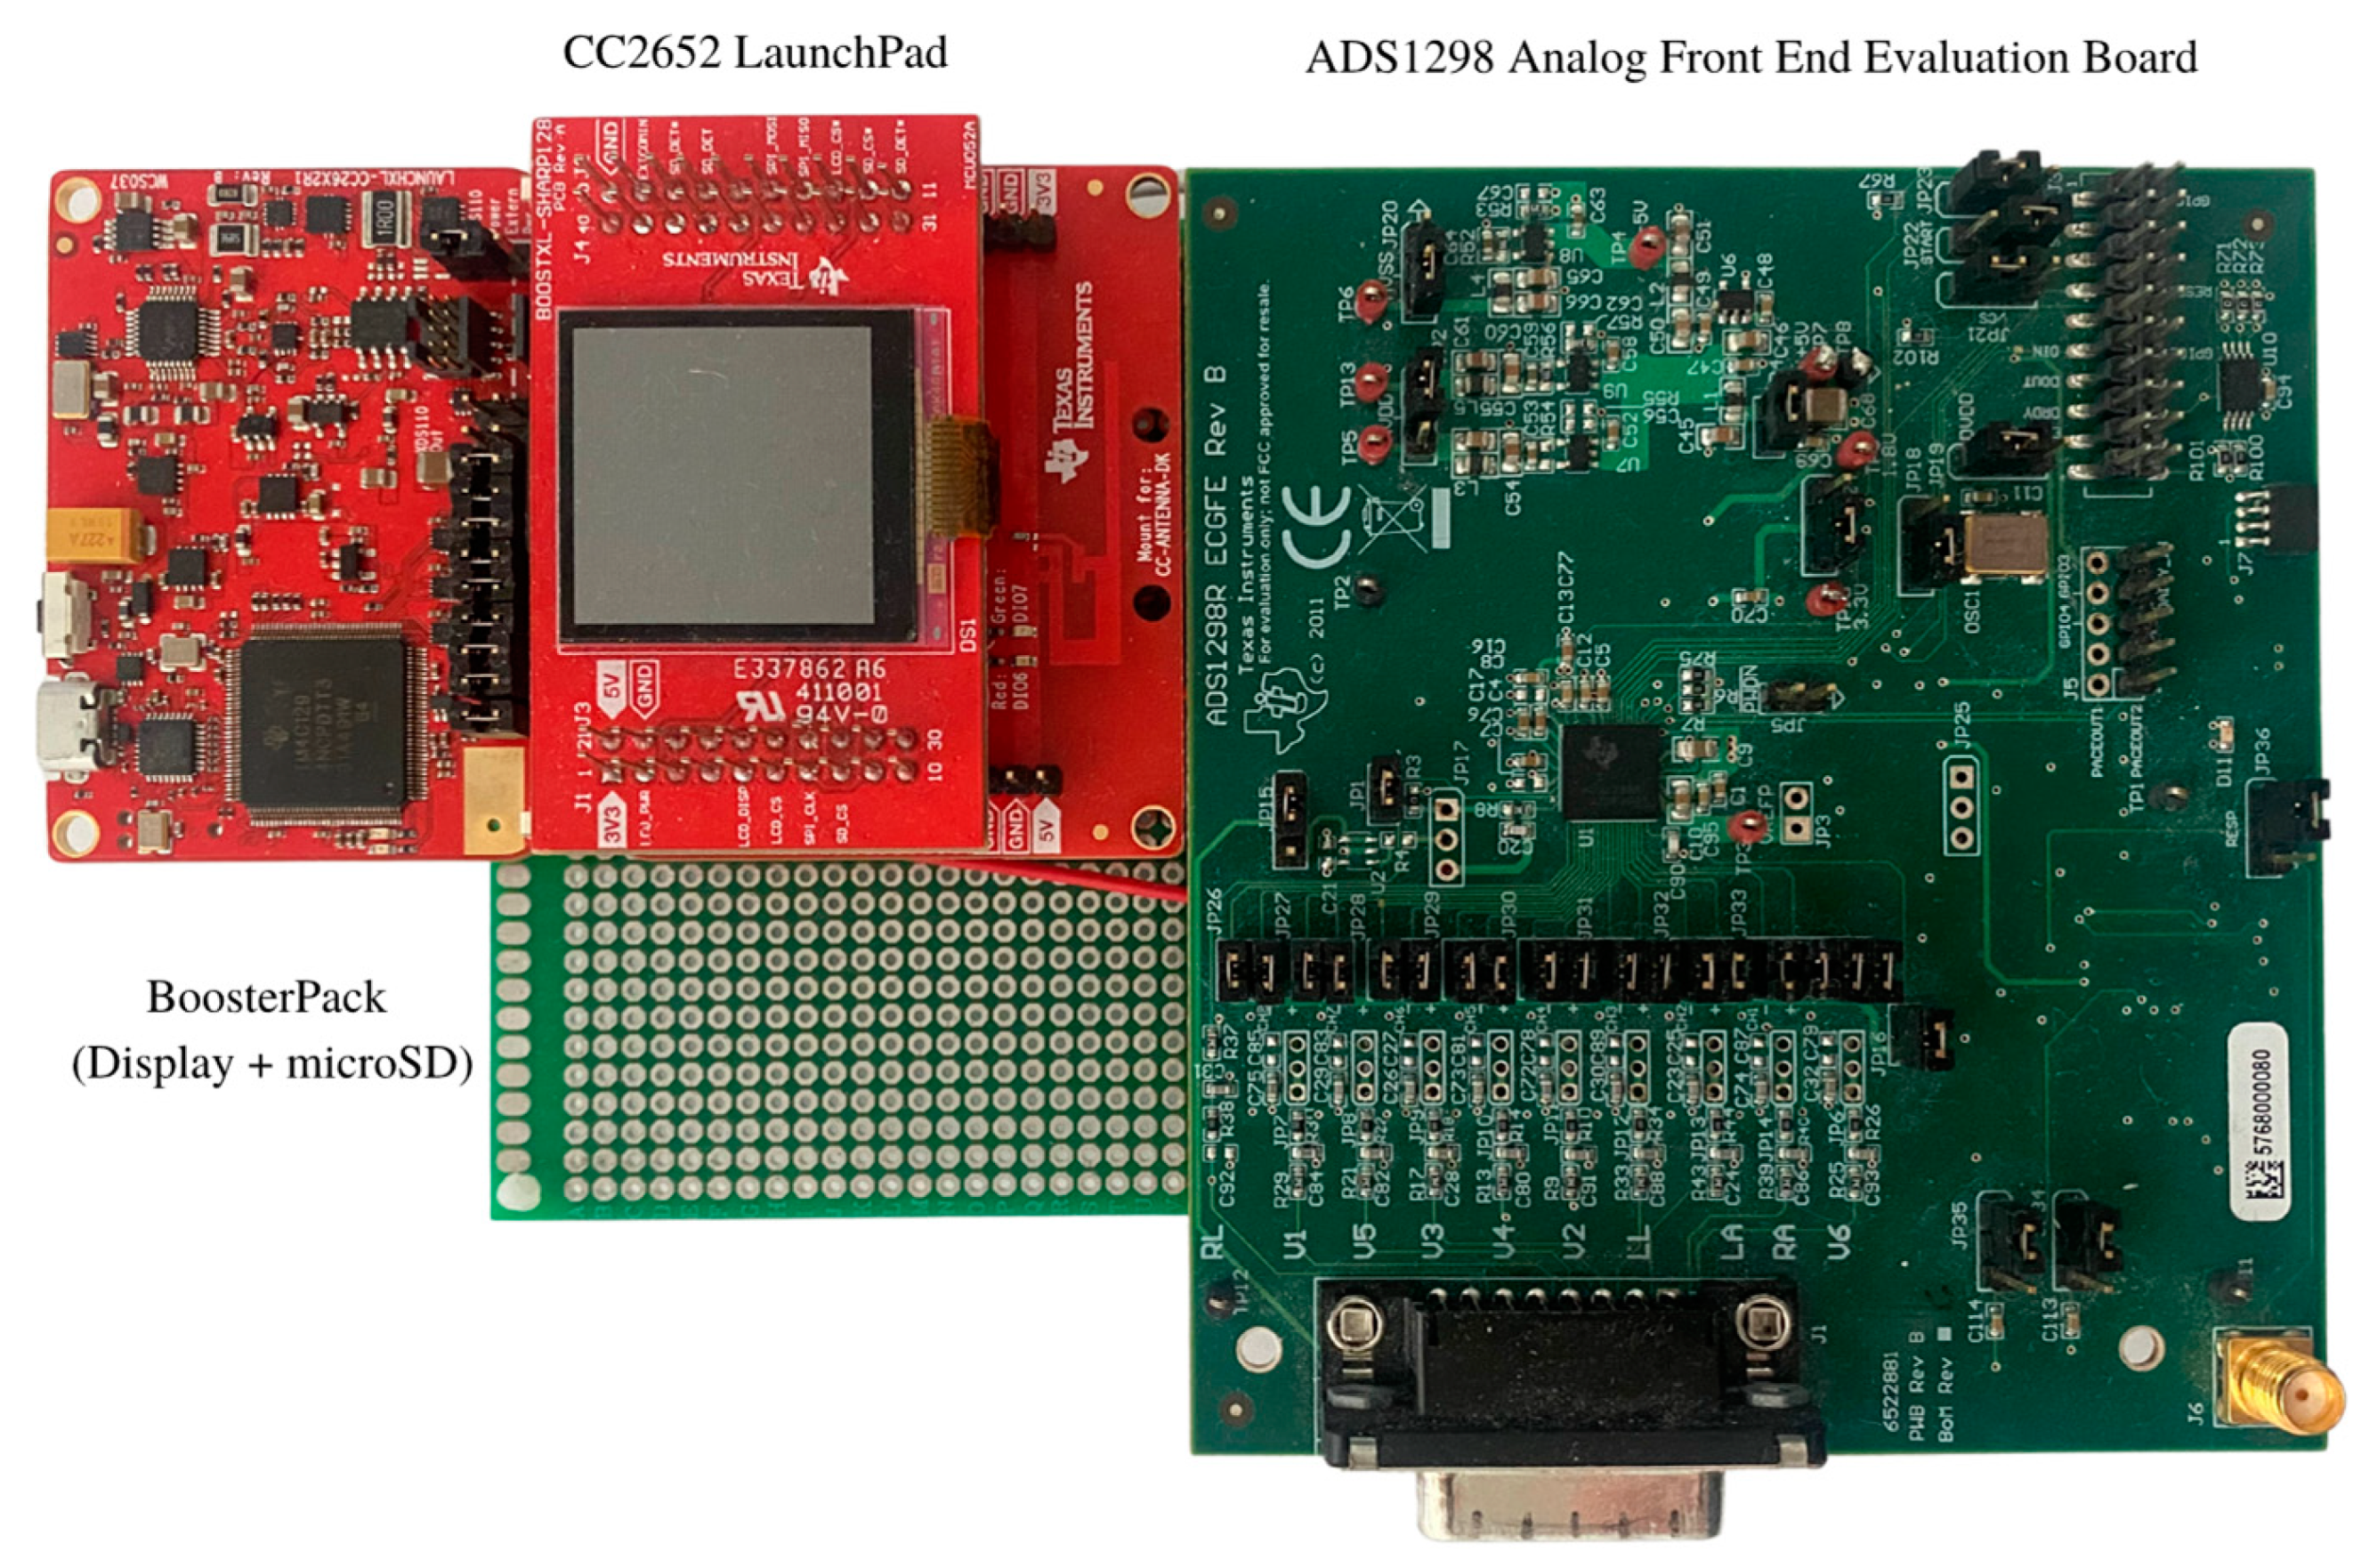
3.1. Hardware Specifications

The building blocks of the proposed platform are shown in Figure 1. The operation modes that govern the delivered functionalities and behavior of the proposed ECG patch are:
Figure 1. Higher-level architecture of the XBeats framework.
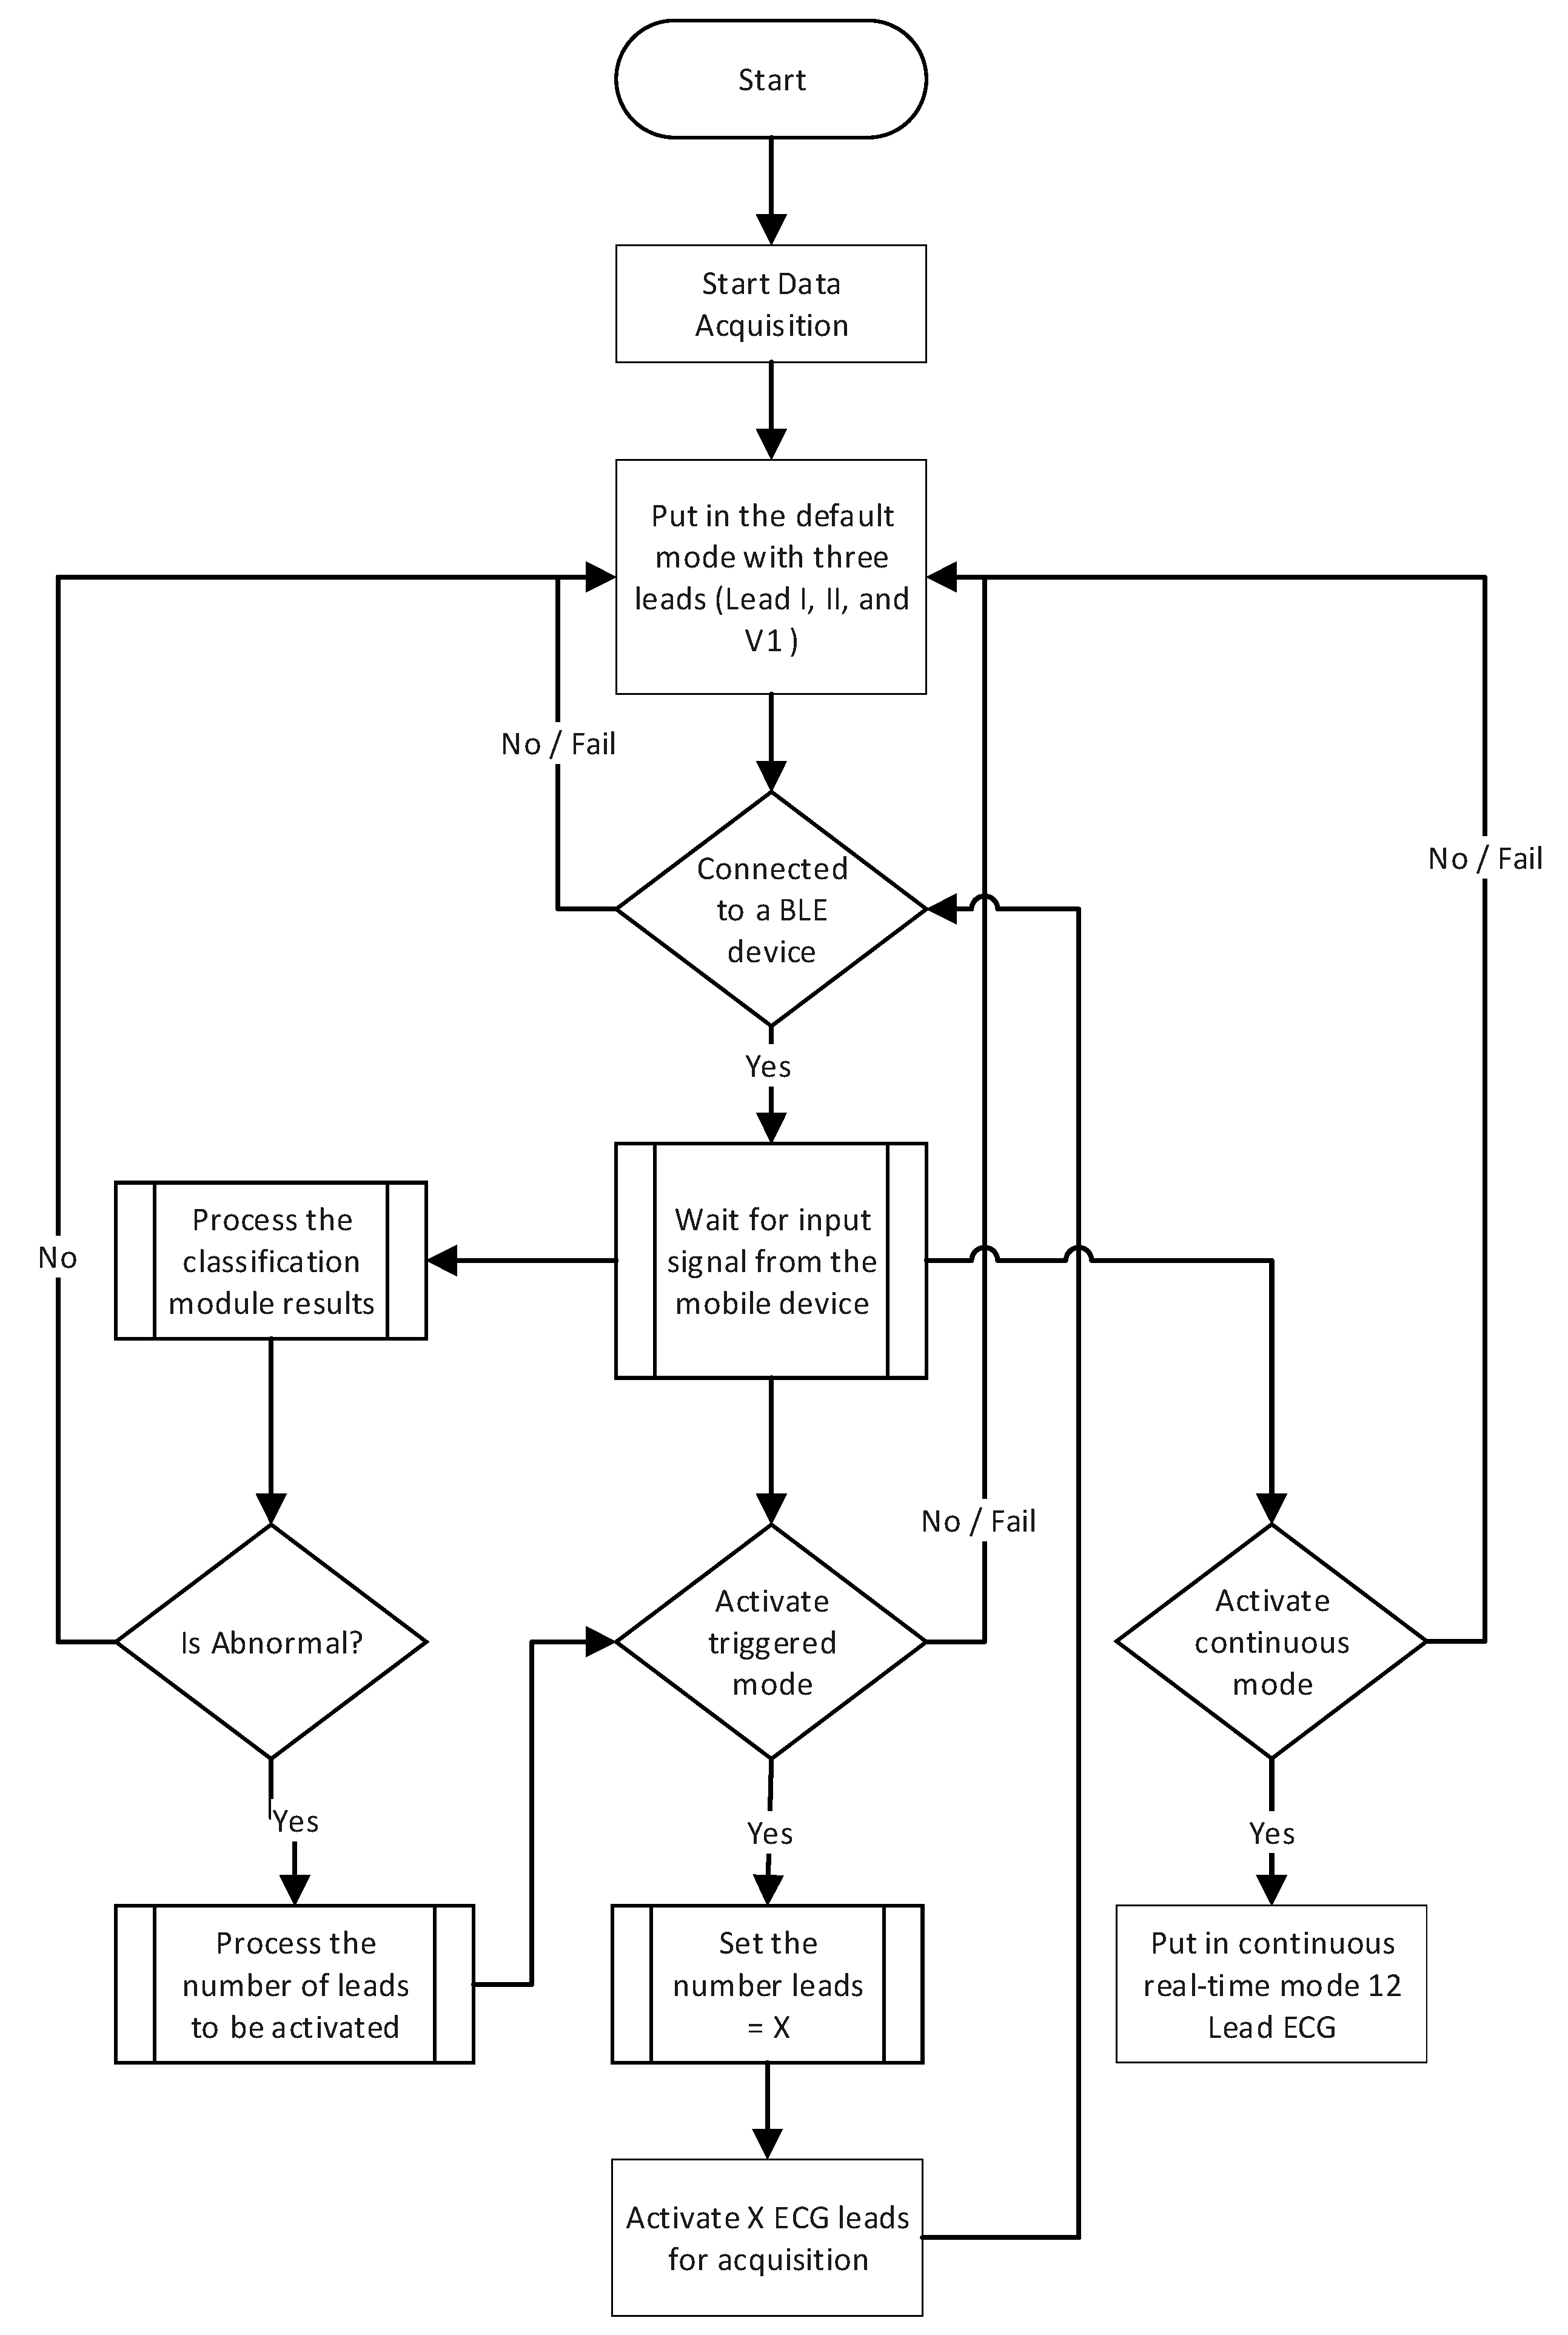
  • The continuous mode provides an unbounded real-time high-resolution data stream of the 12-lead ECG data transmitted directly to a backend system. Physicians sometimes require this mode of operation if abnormal heart conditions are detected or the patient’s case requires 24/7 monitoring. However, this mode has a significant power consumption profile that affects the device’s battery lifetime due to the continuous transmission of the collected ECG data wirelessly to the backend system via a communication gateway;
  • The offline mode records the 12-lead ECG data on the Multimedia Card (MMC) storage when no paired BLE device is nearby to connect to the ECG patch. This mode is enabled for the entire data acquisition period until a paired BLE device connects to the patch and synchronizes the data transfer to the backend system; and
  • The triggered mode is optimized for power saving. The device sends keep-alive signals in normal heart conditions and only transmits ECG signals when a potential heart abnormality is detected. The ECG patch chooses from three data acquisition settings where the number of leads is configurable. The default setting for this operation mode is three ECG leads (e.g., Lead I, II, and V1), which can be changed dynamically in real-time. The patient and healthcare provider can reconfigure the number of enabled ECG leads through a paired BLE-enabled device or the backend system.
The design of the ECG patch implements a modular architecture that focuses on the specifications and functionalities of the hardware components needed for the device operation. Therefore, our ECG patch is not limited to a specific hardware component or vendor, where the proposed hardware components can replace other components with similar capabilities.

3.1.1. Data Acquisition

The data acquisition module is set to acquire the following leads purely in the analog format: two of the limb leads and the six chest leads (i.e., Leads I, II, V1, V2, V3, V4, V5, and V6), while the augmented leads (i.e., aVR, aVL, and aVF) and Lead III are computed digitally. Most importantly, to capture at least one complete heartbeat signal, a sliding window of 2 s interval is used based on the fact that the minimum and maximum heart rates are recorded between 30 and 240 beats per minute (bpm) [].
The device runs on the default operation mode until a new instruction is received from a connected paired BLE device as shown in Figure 2. Once the connection is established, the instructions are received through the connected BLE device. Then, the ECG patch starts a service routine that listens for new instructions to update the current operation mode. The service routine expects one of three instructions to be received at a time. One of the expected instructions is to activate the continuous mode to perform a 12-lead ECG test. This instruction comes directly from the user through the mobile application or as instructed by the healthcare provider through the backend system. The second instruction involves handling the results of the classification module. The classification module analyzes the ECG data continuously on an edge device upon receiving it from the ECG patch. The classification results are transmitted to the mobile application, and then the mobile application sends instructions to the ECG patch with the classification results. The ECG patch will continue in the triggered operation mode with three leads (i.e., Leads I, II, and V1) when the heart activity is normal. On the other hand, in case of abnormal heart conditions, the classification module will return the number of leads to be activated and start the triggered mode.
Figure 2. Data Acquisition flowchart of the ECG patch operation.

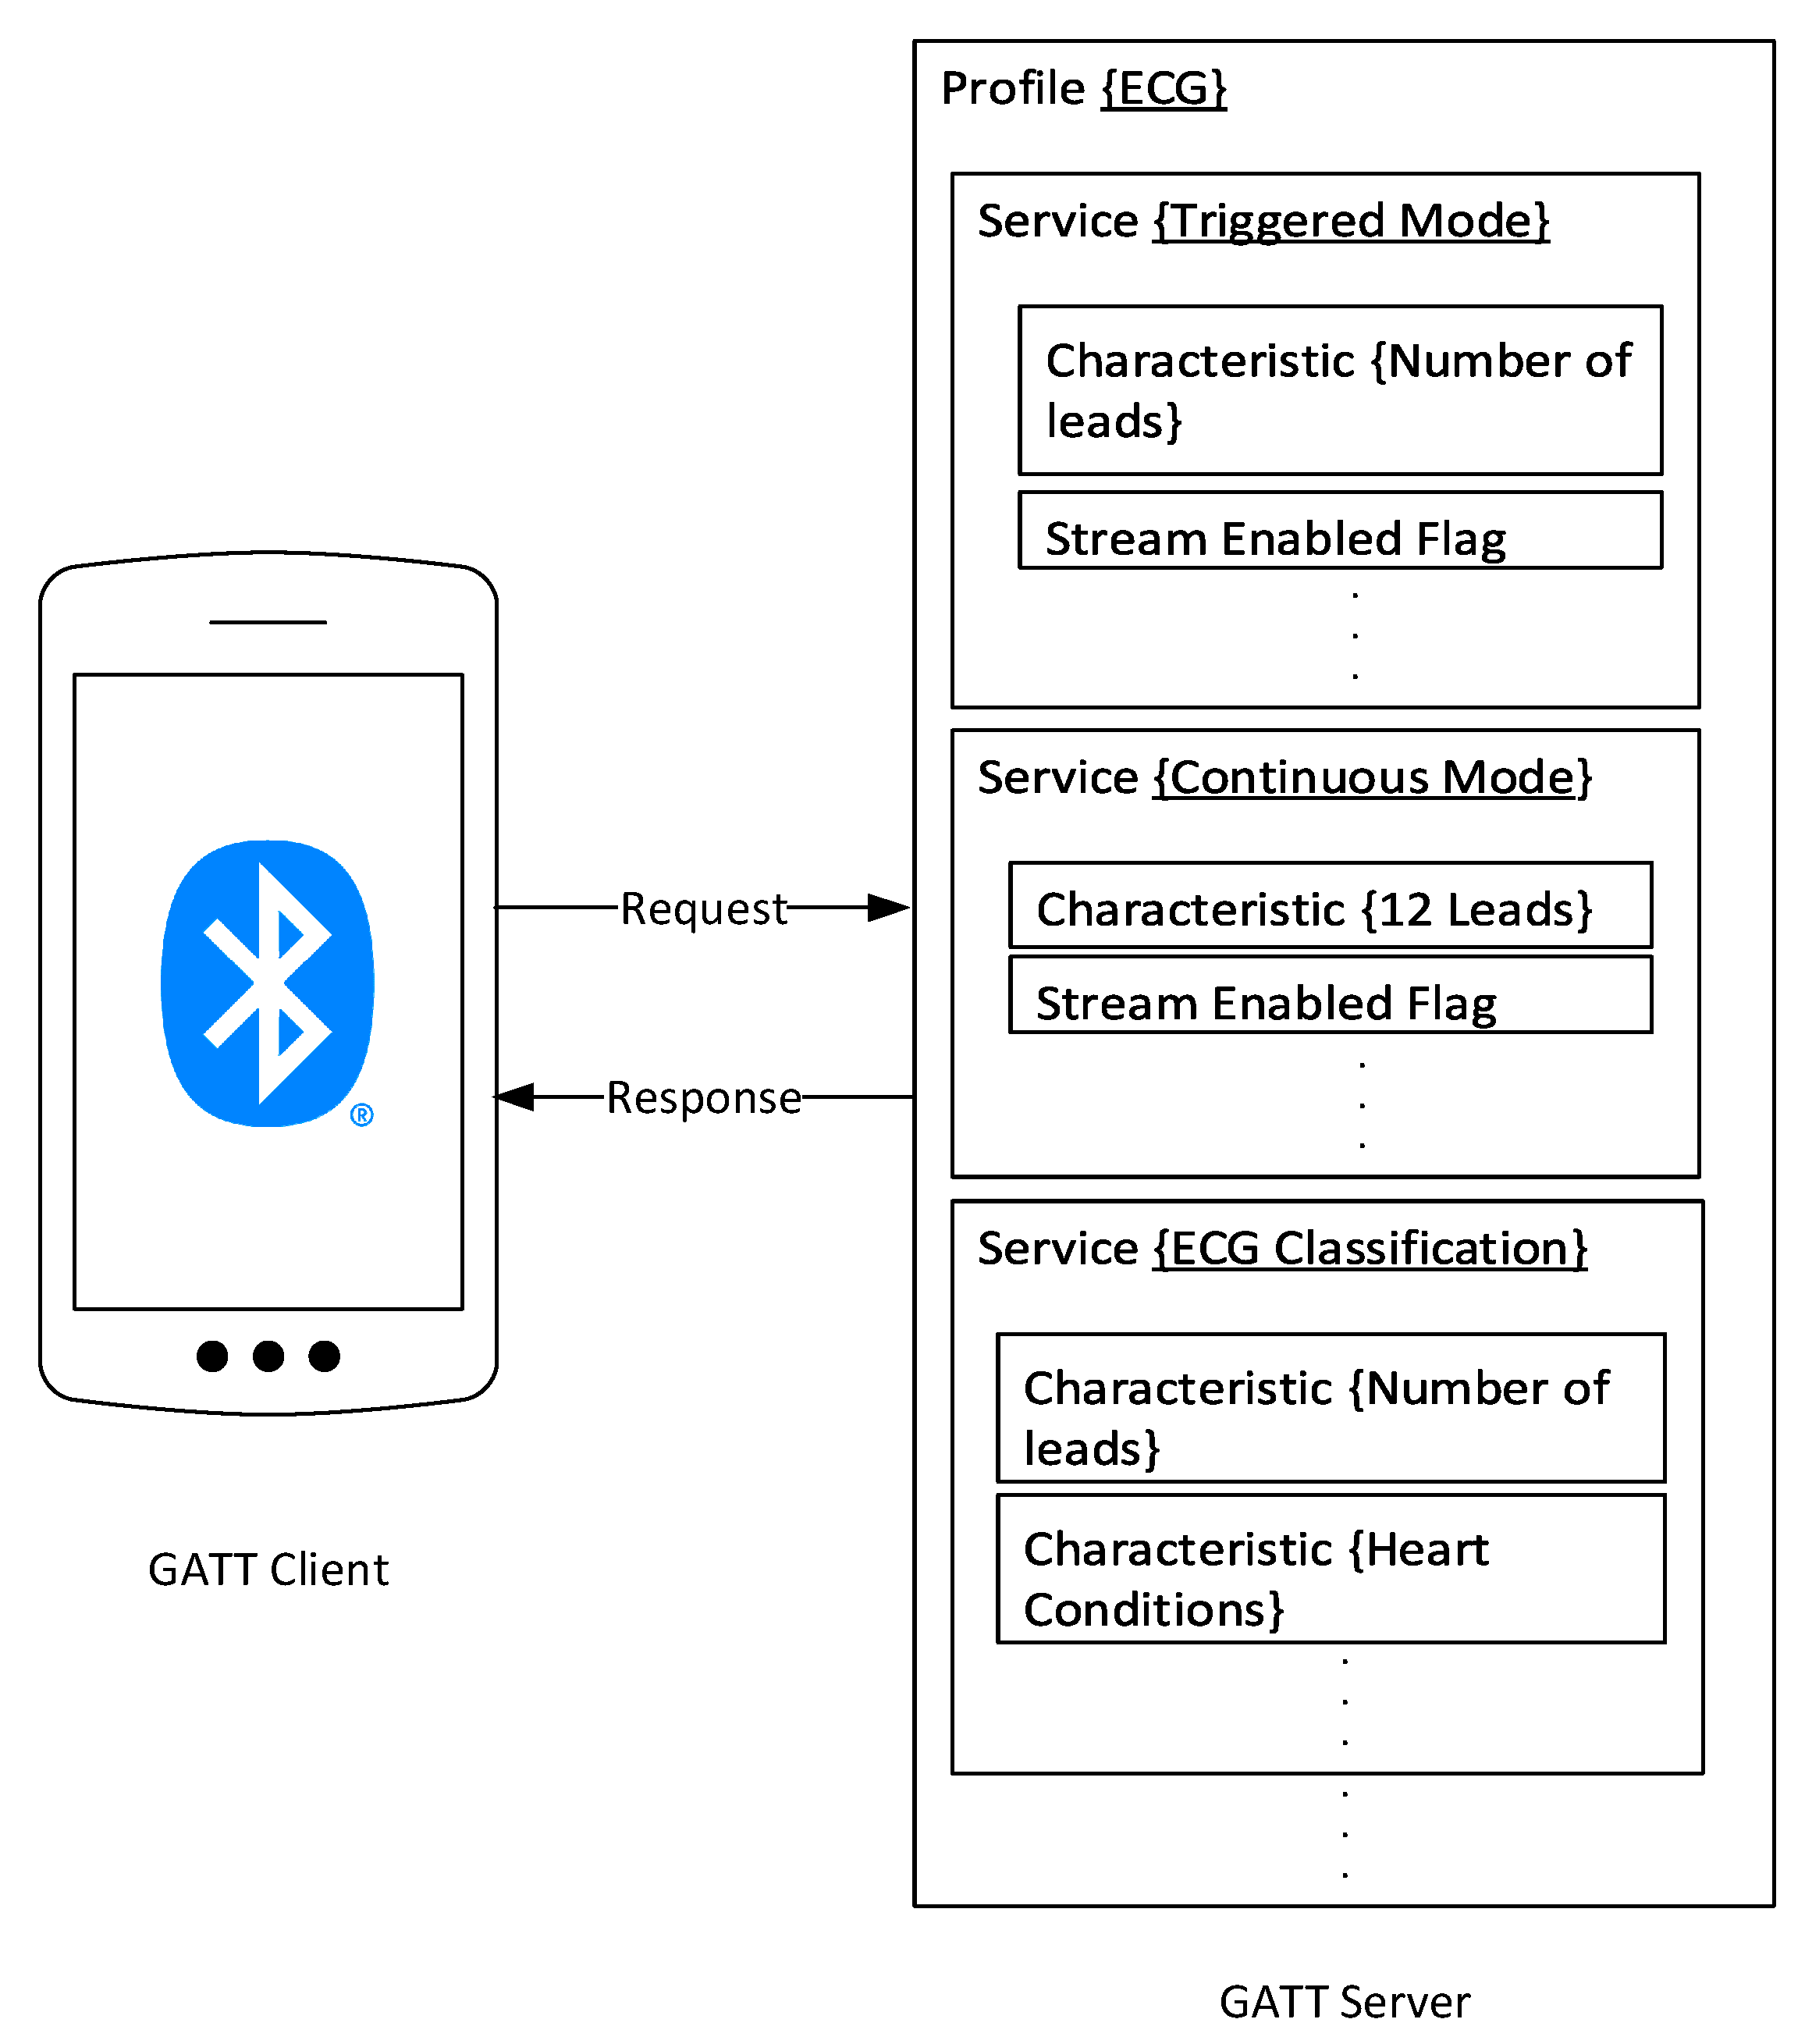
3.1.2. Data Transmission and Protocols

Data transmission constitutes the second step of the data pipeline in the XBeats framework as the ECG patch continuously exchanges data with the backend system. Furthermore, the patients and their healthcare providers can display related vital information about the heart from the recorded ECG signals. The data transmission hardware comprises a multi-standard wireless MCU with an RF core that fully supports Bluetooth Low Energy 5.2 (BLE). The MCU enables seamless data transmission in real-time to the backend system. The BLE 5.2 upgrades the data transfer rate two times the rate of the previous Bluetooth 4.2 from 1 Mbps to 2 Mbps. The communication between BLE-based sensors and smart devices is governed by Generic Access Profile (GAP) and Generic Attribute (GATT) protocols [].
GATT defines how two BLE devices exchange data, while GAP constitutes a standard way for BLE devices to communicate with the outside world. A complete GATT transaction constitutes three high-level, nested objects called Profiles, Services, and Characteristics. For instance, the Heart Rate Profile (HRP) is used in devices measuring heart rate []. The HRP profile has two mandatory services: heart rate and device information services. Complementary services can also be added, for instance, Battery Service (BAS) to indicate the battery’s current level. BLE provides a versatile set of full-stack solutions to meet the needs for low-power wireless connectivity. However, a Profile [] must be defined to exchange data between BLE-enabled peripherals. According to Bluetooth SIG [], a profile with its related services can be selected from the Bluetooth SIG’s predefined profiles and services if they match the application’s specifications or develop custom services to match the application’s specifications. There is no standard BLE profile to deliver the standard 12-lead ECG services []. Therefore, we create a customized BLE profile to enable XBeats to provide the designed services in our platform (i.e., operation modes and ECG data streaming).
To that extent, our proposed ECG BLE “Profile” describes the number of GATT “Services” and GATT “Characteristics” that should be used to achieve the addressed functionalities of the proposed ECG patch. The BLE profile describes how services deliver the application’s intended functionalities []. Figure 3 shows the designed “ECG Profile” with three services that correspond to operation modes defined on the ECG patch and the edge classification service. The first service in the ECG profile is the triggered mode containing three characteristics. The first characteristic holds information about the active number of leads. In contrast, the second characteristic is a flag that refers to the status of real-time streaming, whether it’s currently enabled or disabled. The second “Service” is for the continuous operation mode where ECG leads are fixed to the standard 12-lead configuration, and the stream flag characteristic is enabled by default. Lastly, we implement the “ECG Classification” service for our novel dynamic modes of operation. The “ECG Classification” service contains two characteristics. The first characteristic holds the current heart condition results from the classification implemented on the edge device. The other “Characteristic” carries the recommended ECG leads to be activated based on the results from the classification function on the edge device.
Figure 3. The Proposed BLE Profile for the ECG patch communications and data transmission protocols.

3.1.3. Data Logging

The ECG patch integrates a high-performance and reliable MMC for continuous data logging. The data logging process is encapsulated in an independent task running simultaneously with the data acquisition task. A data retention service routine is also integrated within the system for more extended periods, as recommended by cardiologists. Consequently, the device monitors all incoming ECG signals for critical heart conditions detection. After this grace period, newly received data is not recorded until previously saved data is downloaded. This is another system design decision with an alternative option that could be overwriting older data with recent ECG signals. Cardiologists recommend our design choice []. The system will alert patients and healthcare providers to reconnect the smart ECG patch or offload the data logger to record ECG signals.

3.1.4. Edge Classification

XBeats integrates a binary classifier implemented on the edge to perform preliminary analysis on the collected raw ECG signal for anomaly detection. The classifier can be either integrated into a mobile application or an edge device with enough resources. The objective of the proposed edge classification is to optimize data transmission to the backend system compared to the continuous mode of operation. The classification module also aims to optimize the device’s battery life by regulating the power consumption profile of the communication module by actively adjusting the number of enabled leads for ECG data acquisition. Before the classification task, data preprocessing is applied to the collected ECG data. The preprocessing phase extracts the PQRST features from the ECG waveform using the Pan Tompkins algorithm []. The PQRST feature points constitute one single heartbeat. The correlation between two consecutive PQRST vectors facilitates interpreting the patient’s heart condition and discovering abnormalities if they exist. The preprocessing step includes detecting multiple R points (R-R interval), which helps measure the heart rate. Also, the PR interval, QRS duration, or QT interval contributes to revealing significant heart condition information. That, in return, adds more confidence to the binary classification detection task. The binary classification module (i.e., integrated into the mobile application) classifies the signals into just two categories; normal, which includes one type of signal, and abnormal, representing all other types of signals.
The binary classification of ECG signals utilizes the online dataset PTB-XL Arrhythmia Database [] to train the model on larger populations. The implemented model uses lead II and resamples the ECG data to 300 Hz to match the minimum sampling rate of the signals extracted from our ECG patch. Model training and verification are performed according to the proposed approach in []. The preprocessing phase includes an algorithm to extract 85 features from the ECG waveforms mentioned in []. Accordingly, we propose a feature selection technique called mutual information (MI) ranking criterion to select the 10 most informative features from Lead II to obtain high accuracy. Furthermore, we filter the top 10 features into 5 features that are used as an input for the classification algorithm. This approach suits our system needs due to the power and time limitation. We only need to extract significant information about the heart condition, which adds more confidence in the binary classification task. The 5 features are a collection of R–R-intervals, HBF (Hermite basis functions), and time–domain morphology features explained in []. We test several algorithms to evaluate which yields better results, including Random Forest, Support Vector Machine (SVM), Decision Tree, k-nearest neighbors (Knn), Logistics Regression, and Extra Trees.

4. Prototype Implementation

This section lays out the tools and hardware used in building our proposed ECG patch. The hardware prototype consists of four major components: A microcontroller with a wireless core for BLE communications, an analog frontend interface (AFE) for acquiring analog ECG signals using a high-performance analog to digital converter and a micro-SD card module for data logging, as shown in Figure 4.
Figure 4. Hardware Prototype.

4.1. Data Acquisition and Logging

The prototype of the proposed ECG patch is powered by the SimpleLink 32-bit Arm MCU (CC2652R), which runs as the central processor. The CC2652R chip is capable of handling real-time operations needed for critical safety systems. The MCU features an ultra-low power sensor controller powered by an Arm Cortex-M0 processor that offloads simple tasks like sensors readings of the main MCU. These features make the selected MCU well-suited for high data acquisition applications. Moreover, the ECG patch utilizes a specialized medical AFE to take electrical signals from the heart and digitize them. The ADS1298 chip is integrated into the patch to digitize the acquired ECG signals, and it comes with a 24-bit status word that reflects the status of the electrodes (i.e., probably attached, whether connected or not). Moreover, it offers two sampling modes, namely, high-resolution mode and low power mode. Furthermore, we use the Wilson Center Terminal (WCT) to determine the central terminal needed to perform a standard 12-lead ECG test [,]. The ADS1298 chip internally generates the WCT voltage through three integrated low-noise amplifiers that route the signals from the Right Arm (RA), Left Arm (LA), and Left Leg (LL) leads to calculate the WCT voltage. The equivalent voltage for the WCT is calculated using the following equation: (RA + LA + LL)/3. Similarly, the Right Leg (RL) electrode is driven internally by the RL Driver (RLD) on the ADS1298 chip. In XBeats, the RLD is derived as the average of RA, LA, and LL, which has the same level as the WCT voltage. To that extent, the RLD common-mode voltage is set to (AVDD + AVSS)/2, where AVDD is the analog voltage supply, and the AVSS is the analog ground supply. Therefore, the WCT is buffered internally and routed to the RLD. On the other hand, the RLD improves the common-mode rejection (CMR) and reverses the common-mode interference in the ECG circuit due to the power lines interface and other sources. Lastly, we use a digital notch filter of 50 Hz or 60Hz to compensate for the common-mode rejection.
We use the proprietary Texas Instruments Real-Time Operating System (TI-RTOS) in our proposed platform to operate the ECG patch. TI-RTOS provides tools for managing and scheduling tasks using application layer functions. The combination of TI-RTOS and ultra-low-power MCU supports longer battery life and makes applications more adaptable for real-time monitoring systems and wearable devices. The ECG hardware firmware encapsulates the operations conducted by the MCU into tasks using the scheduling APIs of the onboard RTOS. Data acquisition, logging, and transmission are encapsulated in separate tasks. Each task is ranked based on a pre-configured priority. The data acquisition task is set to receive the highest priority in the firmware operating on the hardware. While the data logging task has the second-highest priority after the data acquisition task, then the data transmission task.
The data acquisition task in the XBeats platform runs at a sampling rate ranging between 250 to 500 SPS. In the case of the 250 SPS, the acquisition task captures one sample every four milliseconds (250 samples/1000 ms = 4 ms). The data acquisition task itself requires 1ms to capture each sample. Therefore, the remaining time available for other tasks (e.g., compression, logging, and transmission) to operate after each sample acquisition equals 3 ms (4 ms − 1 ms). This period is down to 1 ms at 500 SPS. However, in the proposed platform we process samples in batches every 1 s, in which we execute logging and transmission tasks. This means we have a total of 750 ms available for these two tasks when the sampling rate is 250. In comparison, at the 500 rates, a total of 500 ms is available for running these tasks. This setup is a stringent time constraint in our system, and the data logging and transmission tasks will have to be completed during this time interval. Otherwise, it will be interrupted by the data acquisition task since it has the highest priority according to our setup to ensure we don’t miss any data. Then our novel classification service comes in handy as it enables the ECG to dynamically configure the number of active ECG lead in the acquisition service.

4.2. Data Transmission

Data transmission represents the main bottleneck of the proposed ECG patch, which is defined as the BLE communication link. The ECG patch uses the low power mode of the BLE stack instead of the classical BLE mode. Therefore, we designed our custom BLE profile to maximize communications and data handling between the ECG patch and smart devices (i.e., Smartphone or Smart Home devices). Table 1 shows the attributes table of one of the ECG services available on the ECG patch; this service constitutes the continuous operation mode with 12-lead enabled. Services are shown in black; characteristics are bold, and characteristic values and descriptors are shown in grey.
Table 1. The Proposed BLE Profile for the ECG Patch Application: 12-Lead ECG service Attributes.
The other two services, “triggered mode service” and “ECG classification service”, are designed similarly to the attributes in Table 1. Consequently, the combination of the three services allows our ECG patch to deliver a dynamic way of configuring the settings of the device in real-time as heart conditions develop. We leverage the new features introduced in BLE v5.2 over earlier versions of BLE (e.g., BLE v4.1). The first feature is the improved transmission rate (i.e., LE 2M PHY), allowing BLE 5.2 enabled devices to transfer data at a symbol rate of 2 Mbps. This means we can transmit each bit in half the time compared to earlier BLE PHY, which allows for a symbol rate of 1 Mbps. Moreover, the Data Length Extensions (DLE) [] enable the packet to carry a significantly larger payload (Up to 251 bytes vs. 27 when disabled), introduced in BLE v4.2. The integration of DLE has increased the size of data sent in a single packet and reduced the number of the mandatory Interframe Space (IFS) delays (i.e., 150 μs) between each packet sent. Accordingly, the ECG patch can transmit more data in significantly less time.

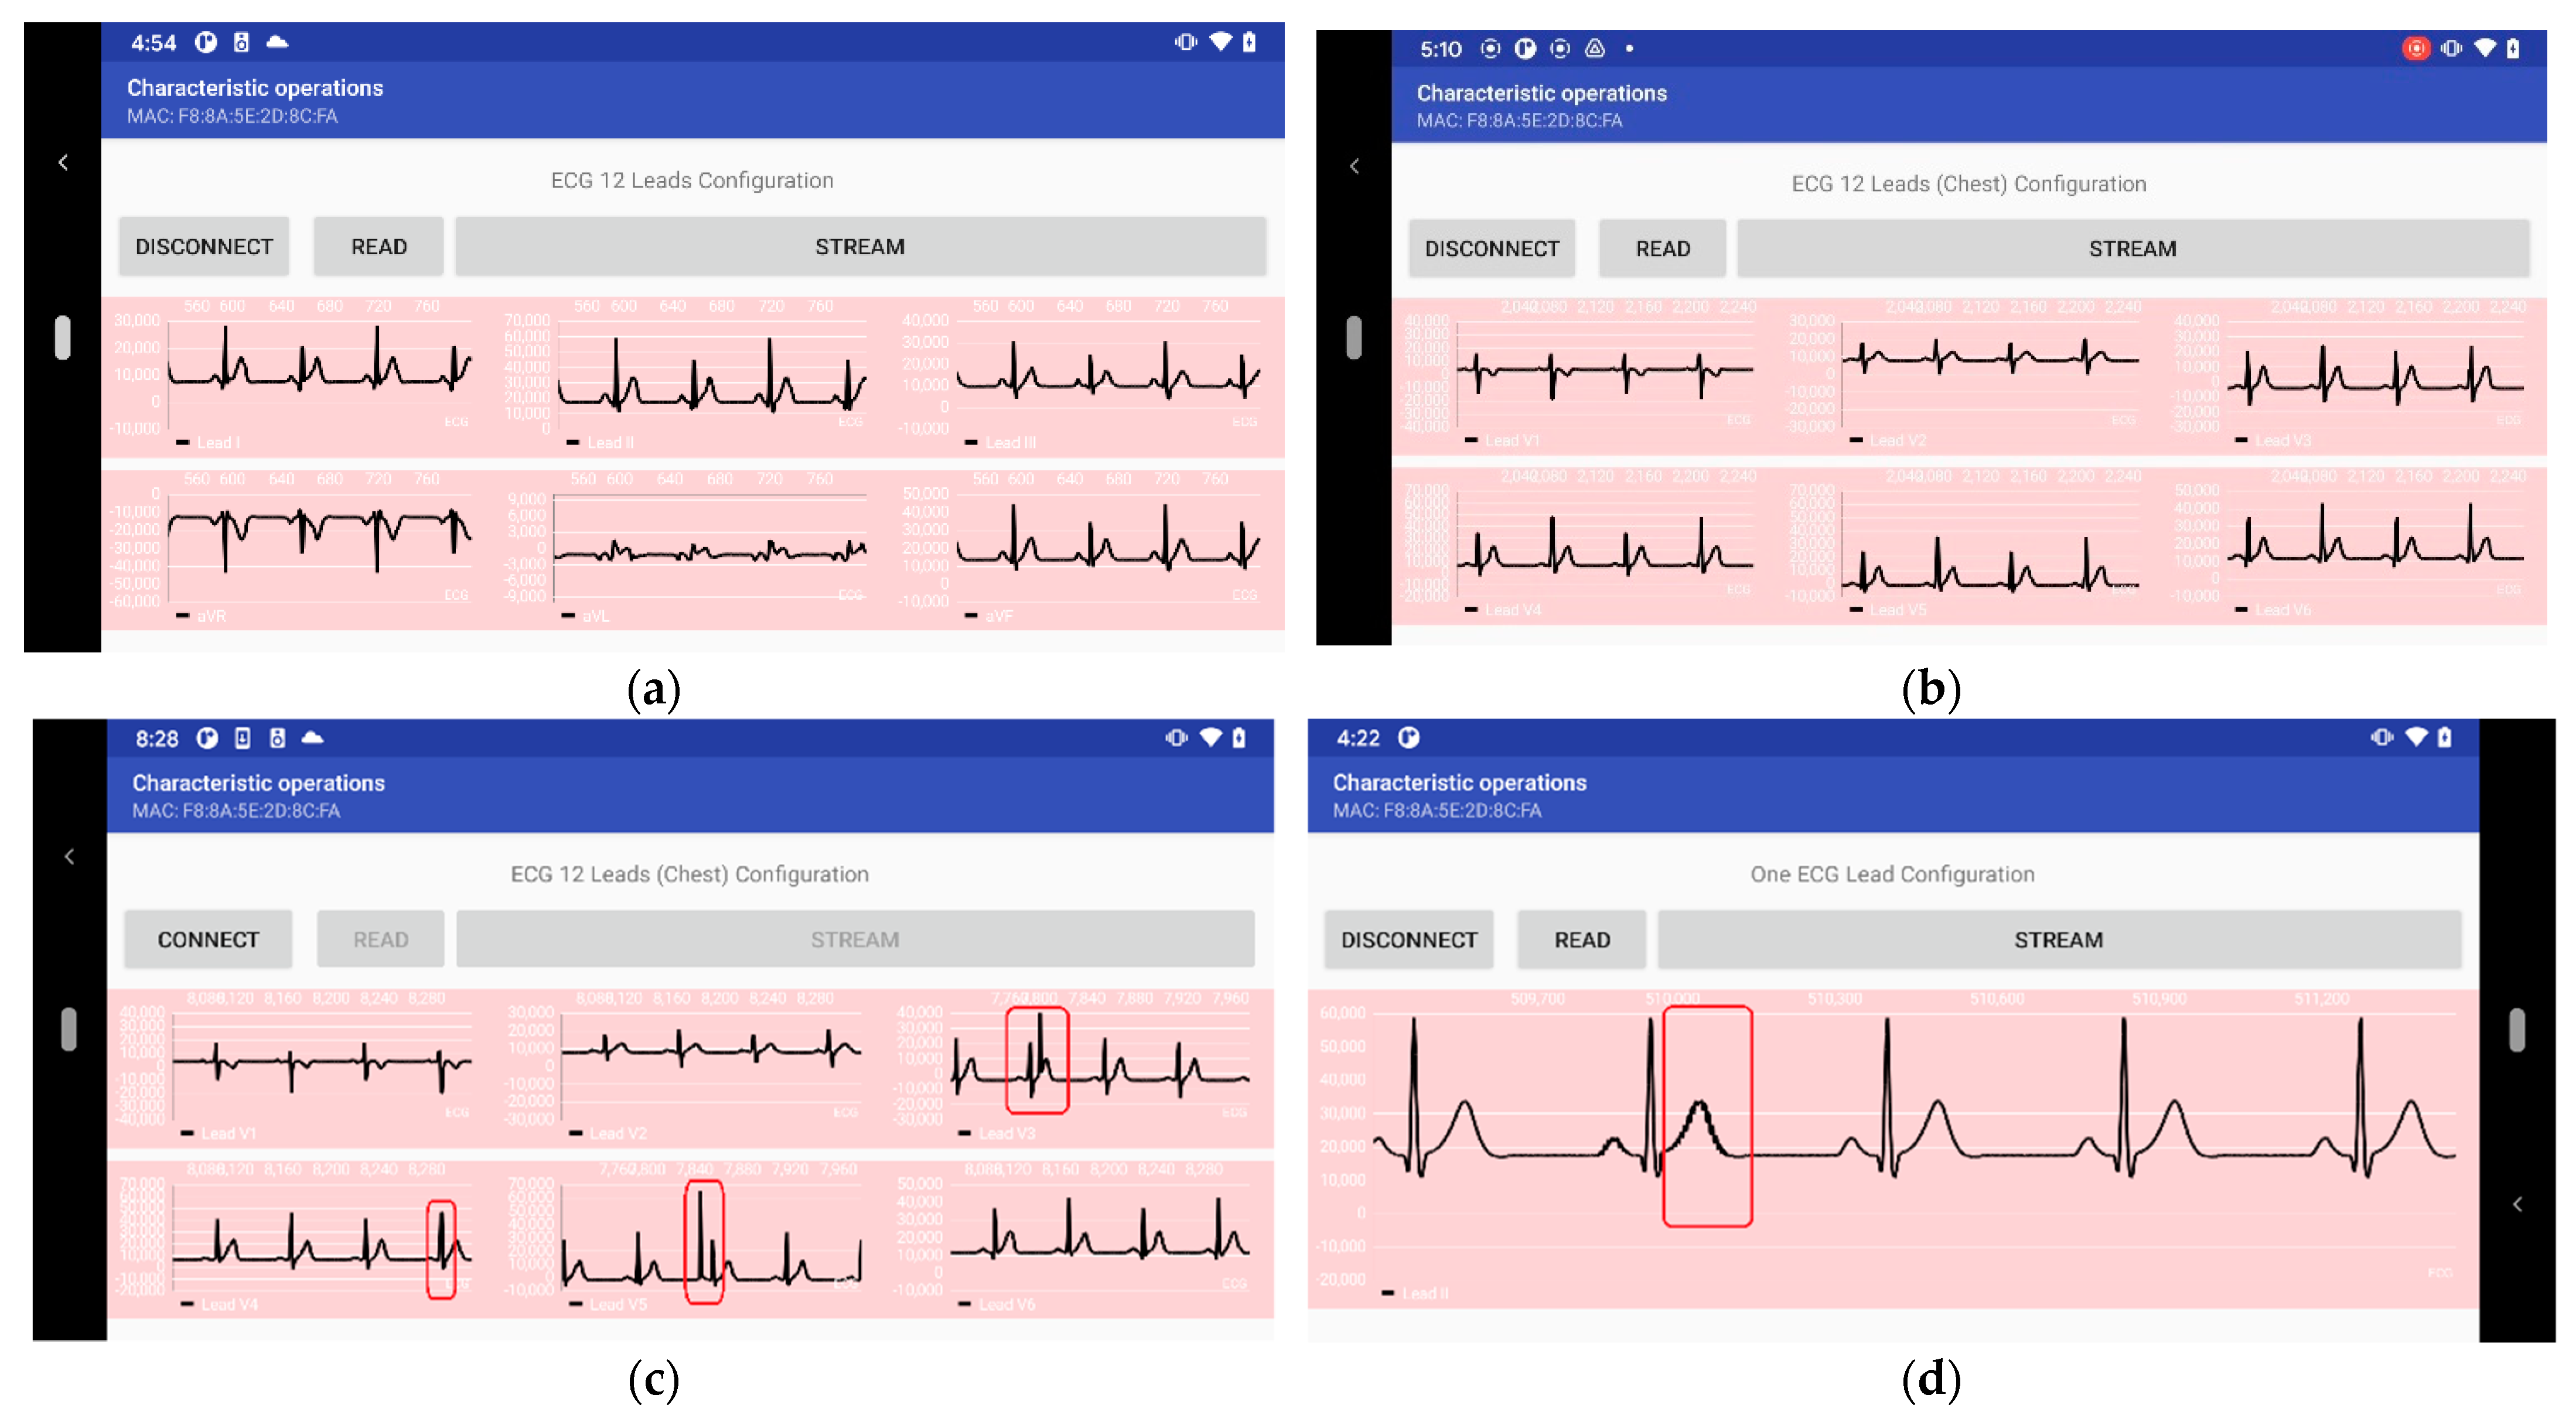
5. Experimental Results and Discussions

This section presents the evaluation techniques and tests to verify and validate all the components in the XBeats platform. These include measurements about the operation modes, useful sampling rates, and energy consumption analysis concerning the hardware constraints. The hardware constraints in each of the following experiments are mainly related to the data acquisition time constraints, the quality and correctness of the acquired ECG signals, the accuracy of the classification algorithm, and the overall battery lifetime. The experiments are organized in the same order we presented the XBeats platform in terms of the functional components. Therefore, the first experiment evaluates the ECG data acquisition under different operation modes while running the data logging subroutine, followed by data transmission using BLE. Then, we assess the ECG data classification module, and, lastly, we determine the analytical energy consumption of the ECG patch over time. But, first, we explain the data sources used to conduct our experiments. The experimental setup consists of the following steps:
  • Collect ECG data in real-time using the prototype hardware of the ECG patch. The experiment includes acquiring ECG data at different modes of operation: standard 12-Lead ECG data under the “continuous” mode of operation; one and three ECG leads under the triggered mode of operation; standard 12-lead ECG data under the offline mode of operation;
  • Evaluate the effective ECG data sampling rate compared to the theoretical data acquisition values provided by the analog to digital converter. The evaluation is performed on each of the operation modes above;
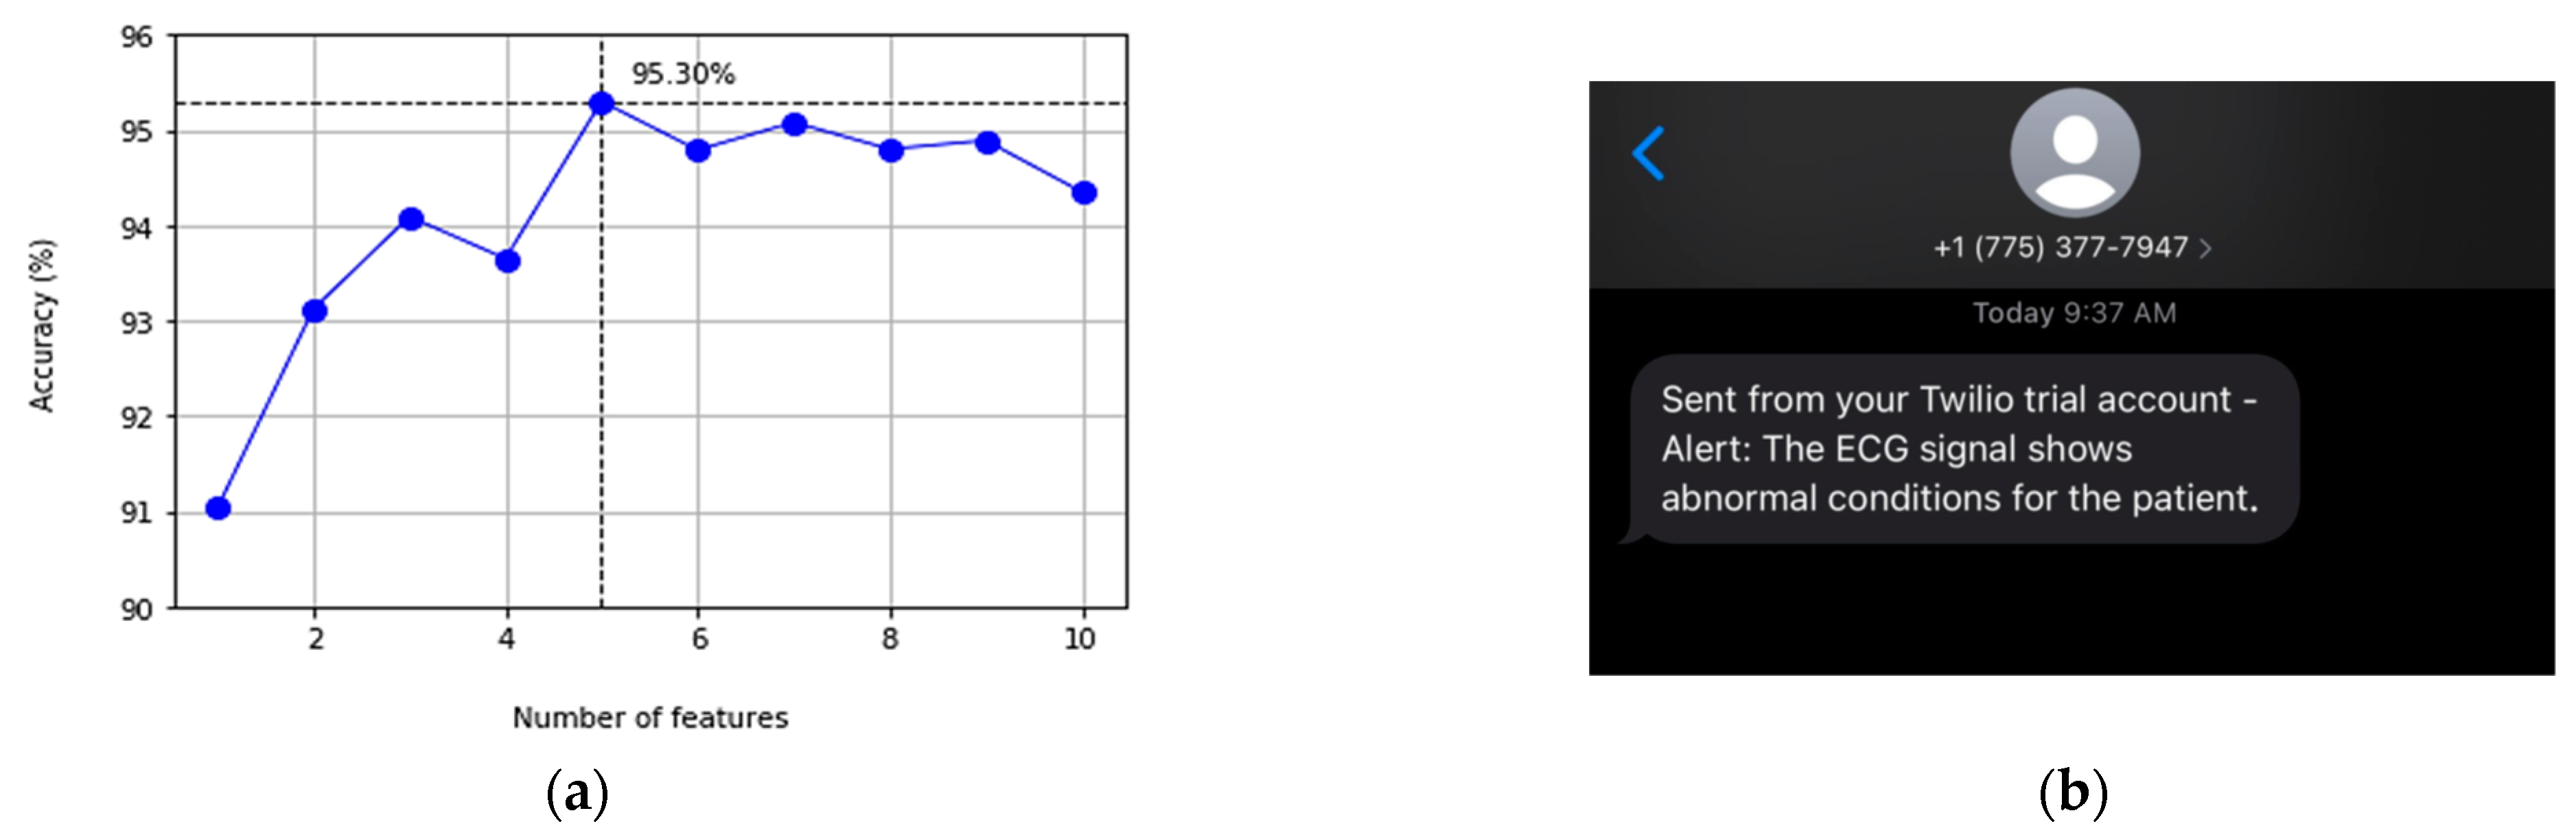
  • Evaluate the proposed ECG classification service implemented on an edge node. The evaluation steps include comparing the accuracy and processing time of six different techniques, which is concluded by the selected classification techniques for our edge classification service; and
  • Calculate the power consumption footprint and the energy-saving of applying the triggered operation mode while activating the edge classification service.

5.1. Data Sources Description

We connect our ECG patch to the TechPatient CARDIO V4 heart simulator to collect ECG data to generate ECG datasets. This way, we avoid connecting the prototyped hardware to an actual patient. The simulator can generate real-time ECG waveforms for different cardiac conditions and support two modes of operation: ECG mode and Rhythmic mode. The ECG mode provides realistic 12-lead ECG waveforms. The rhythmic mode simulates 45 predefined arrhythmias or heart diseases, such as ventricular tachycardia and ventricular fibrillation. The device can be configured in 1 beat per minute (BPM) increments from 20 to 240 BPM and 2 BPM increments from 240 to 300 BPM in the ECG mode. Therefore, we created two datasets using the ECG Simulator: normal and abnormal ECG signals to test the XBeats platform.
On the other hand, we use a larger dataset (i.e., PTB-XL) for training and validating the developed classification algorithms and a dataset we created from the TechPatient CARDIO V4 heart simulator [] as an external source of data for additional validation. The purpose of using the PTB-XL is to extend the developed classification model to cover a broader range of heart diseases and provide better accuracy. The PTB-XL dataset [] provides a freely accessible ECG dataset of unprecedented size hosted by PhysioNet. The dataset comprises 21,837 clinical 12-lead ECG measured simultaneously, representing the conventional 12-lead ECG records. The length of each record is 10 s. The tests were performed on 18,885 subjects (52% were male, and 48% were female). The digitized signals are available at two sampling frequencies, 500 and 100 samples per second. Each record in the dataset has an attached header file describing each subject’s demographic information, health conditions, doctor’s comments, age, gender, diagnoses, number of records, number of samples, and the sampling rate. The records are categorized into five superclasses (NORM: normal ECG, CD: conduction disturbance, MI: myocardial infarction, HYP: hypertrophy, and STTC: ST/T changes) from which a 24-subclasses are derived, forming a multitude of diverse ECG data as a resource for ECG analysis algorithms. Accordingly, we aggregate all the abnormal signals (24 different abnormal heartbeat classes) into one category to make up a binary data set for normal and abnormal conditions. The size of the PTB-XL dataset makes it a valuable asset in machine learning and deep learning applications.

5.2. Data Acquisition and Data Transmission

In this section, we perform a sequence of experiments to validate the resultant sampling rate and the correctness of the digitized ECG data. Consequently, we connect the TechPatient CARDIO V4 heart simulator to the ADS1298 evaluation hardware. This step aims to create a benchmark for our ECG patch when evaluating the ECG patch while acquiring ECG data in real-time. We use the ADS1298 ECG frontend evaluation software built on top of LabVIEW libraries. The initial setup includes generating square signals using a square generator. Following that step, we start to capture the signals using the evaluation software using the ADS1298 development kit. Then use the ECG patch to collect the same signals and compare them to the benchmark signals collected by the evaluation software. In the second step, we use the evaluation software to collect ECG data through the ADS1298 development kit simulated directly from the TechPatient CARDIO V4 heart simulator, as shown in Figure 4. Then we compare collected ECG data by the evaluation software to the ECG data collected by the proposed ECG patch. The signals displayed in Figure 5 represent a full set of 12-lead for a standard ECG test, where Figure 5a shows the ECG limb leads, and Figure 5b shows the ECG chest leads. The data retrieval process was accomplished by selecting from two methods: Read Data Continuous (RDATAC) and Read Data (RDATA). The RDATAC method sets the device to continuously read data without sending any subsequent commands or further configuration. In contrast, the RDATA reads data output from the output register once triggered by the data-ready flag. After a successful data cycle, 216 bits of data are available to read from the output register. The 216 bits (27 bytes) are formatted as follows: 24 status bits + 24 bits of data per channel × 8 channels = 216 bits. The low power mode starts at 250 SPS, generating 6750 bytes every second, while the high-resolution mode starts at 500 SPS which generates 13.5 Kbytes every second. Table 2 shows the size of the ECG data acquired and saved on the internal storage attached to the ECG patch. The digitized ECG signals are derived using the formulas illustrated in Table 3.
Figure 5. Sample of the collected ECG data using the ADS1298 TI evaluation software using a maximum sampling rate of 500 samples/sec for 4 s: (a) Limb leads corresponding to the first group of leads (i.e., I, II, III, aVR, aVL, and aVF); and (b) Chest leads corresponding to the second group of leads (i.e., V1, V2, V3, V4, V5, and V6).
Table 2. Collected ECG Data Size over Different Periods.
Table 3. ECG 12-Lead Derivations.
Following the benchmark setup, we evaluate the ECG patch prototype by applying the same configurations used in the benchmark experiment. The ADS1298 chip on the ECG prototype applies the RDATAC methods to collect ECG data continuously at a default sampling rate of 500 SPS. This setup is fixed during the whole experiment. We run the experiment four times under different operation modes, as shown in Table 4. The evaluation criterion is based on the resultant data rate of our ECG prototype, which varies according to the selected operation mode. The first operation mode evaluated is the “offline mode”, in this operation mode, the wireless communication module (i.e., BLE) is switched off completely. The ECG patch is programmed to enable the 12-lead ECG acquisition in the “offline mode” or the “disconnected mode”. We allow this feature to guarantee that the ECG patch doesn’t miss any vital information about the heart conditions during disconnectivity. The resultant ECG data acquisition rate in the “offline mode” is 480 SPS. In contrast, the” Disconnected mode” provided a resulting sampling rate of 370 SPS. The observations from this experiment noted that the communication module on the ECG patch enters the advertising mode []. A BLE device uses advertisements to broadcast packets to BLE-enabled devices around it. Then the receiving devices can act on this information or connect to receive more information. When the BLE module on the ECG patch is in advertising mode, advertising packets are sent periodically on each advertising channel to update the presence of the ECG patch to the surrounding devices until it matches with a paired BLE device and establishes a new connection. This operation adds an overhead to the data acquisition task and, thus, the reduced sampling rate.
Table 4. The useful sampling rate of the XBeats prototype over various operation modes.
The second patch of tests includes the operation modes that rely on the BLE wireless connectivity to transfer the acquired ECG data to the paired BLE-enabled mobile device. This experiment requires a BLE-enabled mobile device to run our customized mobile application. We use the Google Pixel 3 smartphone to install our ECG patch mobile application. The smartphone supports the latest BLE v5.2 that allows our application to utilize the Data Length Extensions, and the LE 2M PHY features provided by BLE v5.2. Our mobile application automatically sets the physical layer to the 2 MB/s physical configurations and updates the maximum payload to 251 bytes. The payload of one successful BLE packet at the “continuous mode” contains seven samples, where each sample carries values from the digitized channels. We encapsulate the 24 bits received for each channel into an unsigned integer object. The total payload size inside on BLE packet applies the following formula: N u m b e r   o f   C h a n n e l s × O b j e c t   S i z e × N u m b e r   o f   s a m p l e s . Consequently, we evaluate the “continuous mode” on the ECG patch prototype and display the streamed ECG in real-time, as shown in Figure 6a,b. The displayed ECG leads are computed similarly using the leads derivation in Table 3. The useful acquisition rate at the “continuous mode” is 343 SPS. Likewise, we apply the same setup on the “triggered mode” with one and three lead configurations. The observed useful data acquisition rate at both operation modes configurations was the same (i.e., 441 SPS).
Figure 6. A Sample of the streamed ECG data over BLE in real-time using the ECG patch: (a) Chest leads; (b) Limb leads; (c) Chest leads with noise and outliers; and (d) One ECG lead with outliers.
We noticed some noise and outliers in the ECG singles acquired by our ECG patch prototype, as shown in Figure 6b,c, while operating in the “continuous mode” and “triggered mode”. We found that the primary source of noise and outliers is a result of sudden movements and motion artifacts on the wires connecting the electrodes to the ECG patch prototype.

5.3. Signal Detection and Classification

The signal detection and classification represent one of the novel integrations of this work as it enables the dynamic configurations of operation modes in real-time. Moreover, it provides an additional safeguard to the ECG monitoring platform as we bring the classification closer to the patient. This feature is considered the first step of a two-phase ECG data classification of the ECG monitoring platform. The binary classification module provides a faster response by classifying the ECG data to normal heartbeat or irregular heartbeats. The second phase includes deep analytics functions deployed at the backend level, where we perform and build a correlation between real-time and historical data for better analysis and predictions. To that extent, we use the real-time ECG dataset acquired from the simulator using the proposed ECG patch to evaluate the performance of our classification algorithm. In contrast, we use the PTB-XL datasets for training the proposed classification module. The dataset is split into training and testing sets at an 80% to 20% ratio. To select the best classifier for our application, we compare six different algorithms, namely, random forest (RF), support vector machine (SVM), K-nearest neighbors (KNN), Decision tree (DT), logistic regression (LR), and Extra Trees Classifier, which is the ensemble learning method of the decision trees method as recommended by [].
The main objective of our model is to achieve the best accuracy with the minimum processing time to fit the constraints of our hardware system. We calculate the F1-score (F1), Precision, Recall, overall accuracy, and the processing time to fit the trained model of each classification technique. The training set performance is calculated using a K-fold cross-validation splitting strategy with 10 folds. The results are collected using only 5 features from the top 5 to minimize our processing time, as shown in Table 5. We used Python and Scikit-learn for implementation. The results in Table 6 compare the 6 algorithms from the accuracy and time perspectives. We observe that the Extra Trees Classifier achieves the best combination of accuracy and time with the highest accuracy of 95.3% and only 5.78 s to classify the ECG signal. Logistic regression performs the best processing time with 0.857 s but with an accuracy of 93.6%, which is considered the lowest accuracy out of all classifiers. Worth noting, the processing time in Table 6 represents the overall processing time of the corresponding algorithm over the selected dataset. The following experiment evaluates the actual time when implementing the best algorithm in real-time on an edge device. Table 7 shows the performance details obtained from the test dataset for the normal signals (N) and abnormal signals (ABN). We observe that almost all the best values result from the Extra Trees classifier, which concludes that it’s the best model to adopt in our system. Furthermore, we investigate the accuracy of the Extra Trees classifier with the number of features, as shown in Figure 7a. It can be observed that the highest performance is accomplished with only 5 features (accuracy = 95.30%), and after that, the accuracy decreases with the growth of the number of features.
Table 5. The top 5 informative features used to classify the ECG signals.
Table 6. The six classification techniques accuracy and processing time.
Table 7. Performance report obtained from the six classification techniques for normal and abnormal ECG signals.
Figure 7. (a) Accuracy of Extra Trees classifiers with a varying number of the top 10 mutual information ranked features; and (b) SMS message by Twilio sent to the healthcare provider to alert of any abnormal heartbeats.
We deploy the classification module on a Raspberry Pi 3 B+ board acting as an edge device. MQTT is the underlying communication protocol between our mobile application and the edge device. The mobile application is designed to publish the ECG data in patches every second. This is another system design decision that can be changed to alternative options with 5 or 10 s intervals. Therefore, the integration of the MQTT protocol provided a pipeline for our mobile application to publish the ECG signals collected by the ECG patch in 0.12 s. The edge device continuously receives ECG data until an abnormal heartbeat is detected; the system simultaneously sends the signal to different services to alert caregivers and/or healthcare providers. Figure 7b shows a screenshot of an SMS message sent to alert the healthcare provider of irregular heartbeats as part of the notification service provided by the proposed platform. The average processing time for the ECG signal detection is 0.29 s. If an abnormal heart condition is detected, a message is sent out immediately to caregivers in a range of 0.57 to 0.77 s, which is quick enough for healthcare providers to take necessary actions.

5.4. Energy Consumption

The current hardware design used in the prototype includes some development boards and is not yet optimized for compact design and final commercial production. Therefore, we use the Energy Trace tool to determine the analytical energy consumption of the ECG patch over time. We use the Energy trace tool in the free-run mode, where the sampling frequency is approximately 4.2 kHz. We performed analytical tests on the ECG prototype, where the device is assumed to be in the “continuous” operation mode. The test includes acquiring the full 12-lead ECG data and transmitting the data over BLE in real-time to a smartphone. This means the MCU is always in an active mode, and no power-saving protocols are applied other than the default settings on the MCU. Consequently, the analytical results show that the ECG patch can deliver a continuous real-time 12-lead ECG for 37 h approximately using a rechargeable lithium-ion battery with a capacity of 2000 mAh; details are shown in Table 8.
Table 8. Analytical power consumption of the ECG patch hardware prototype.

6. Conclusions

Although the ECG test is a 100-year-old technology, it remains scientifically challenging and attractive to research to unleash the full potential of information technology and IoT in this domain. We demonstrate the need for a compact wearable ECG monitoring system from the literature. We introduce XBeats a novel platform for continuous real-time monitoring. The ECG patch prototype proposed XBeats supports dynamic modes of operations that are actively configured when the heart conditions of the patient change. The device carries out all primary operations: data acquisition, logging, and transmission at an acquisition rate of up to 441 samples per second with significantly low latency. The proposed platform integrates an on-chip binary ECG signal classification implemented on edge devices. The classification algorithm achieved a maximum detection accuracy of 95.30% based on the Extra Trees machine learning classifier. This accuracy is accepted in our proposed platform as an initial phase of classification to support in-time notifications to the patient/healthcare providers. Our system demonstrates exemplary performance and can send immediate messages to patients or healthcare providers when irregular heartbeats are detected. It can also support long-term medical diagnosis for ECG signals in real-time. The results achieved in the prototype development allow us to conclude that high-quality real-time remote 12-lead ECG monitoring is achievable through our robust platform design and selected hardware components. As a future direction, we plan to integrate high-performance streaming engines at the backend like Kafka or NATS. Additional future work includes extending the binary classification module to further analyze the abnormal class severity. We also consider modifying the classification technique to work with aggregated ECG data in real-time as they arrive with predefined windows for the aggregation process. The platform shall avoid false positives regarding the patient’s heart conditions when classifying the heartbeats individually. Moreover, the system can be configured to call emergency response in extreme cases when the patient is at imminent risk or irresponsive.

Author Contributions

Conceptualization, A.B. (Ahmed Badr), K.E. and A.R.; methodology, A.B. (Ahmed Badr), K.E. and A.R.; software, A.B. (Ahmed Badr) and A.B. (Abeer Badawi); validation, A.B. (Ahmed Badr), A.B. (Abeer Badawi), K.E. and A.R.; formal analysis, A.B. (Ahmed Badr) and A.B. (Abeer Badawi); investigation, A.B. (Ahmed Badr), A.B. (Abeer Badawi), K.E. and A.R.; resources, K.E. and A.R.; data curation, A.B. (Ahmed Badr) and A.B. (Abeer Badawi); writing—original draft preparation, A.B. (Ahmed Badr) and A.B. (Abeer Badawi); writing—review and editing, A.B. (Ahmed Badr), K.E. and A.R.; visualization, A.B. (Ahmed Badr) and A.B. (Abeer Badawi); supervision, K.E. and A.R.; project administration, K.E.; funding acquisition, K.E. All authors have read and agreed to the published version of the manuscript.

Funding

This research was funded by the Natural Sciences and Engineering Research Council of Canada (NSERC), grant number: CRC-2017-00170.

Data Availability Statement

The data presented in this study are available on request from the corresponding author.

Conflicts of Interest

The authors declare no conflict of interest.

References

  1. Cardiovascular Diseases. Available online: https://www.who.int/news-room/fact-sheets/detail/cardiovascular-diseases-(cvds) (accessed on 25 January 2022).
  2. Ashley, E.A.; Niebauer, J. Conquering the ECG. In Cardiology Explained; Remedica: London, UK, 2004; pp. 15–33. [Google Scholar]
  3. Galli, A.; Ambrosini, F.; Lombardi, F. Holter Monitoring and Loop Recorders: From Research to Clinical Practice. Arrhythmia Electrophysiol. Rev. 2016, 5, 136–143. [Google Scholar] [CrossRef] [PubMed] [Green Version]
  4. Mubarik, A.; Iqbal, A.M. Holter Monitor. In StatPearls; StatPearls Publishing: Treasure Island, FL, USA, 2022. [Google Scholar]
  5. Chua, S.-K.; Chen, L.-C.; Lien, L.-M.; Lo, H.-M.; Liao, Z.-Y.; Chao, S.-P.; Chuang, C.-Y.; Chiu, C.-Z. Comparison of Arrhythmia Detection by 24-Hour Holter and 14-Day Continuous Electrocardiography Patch Monitoring. Acta Cardiol. Sin. 2020, 36, 251–259. [Google Scholar]
  6. Serhani, M.A.; El Kassabi, H.T.; Ismail, H.; Navaz, A.N. ECG monitoring systems: Review, architecture, processes, and key challenges. Sensors 2020, 20, 1796. [Google Scholar] [CrossRef] [PubMed] [Green Version]
  7. Alshamrani, M. IoT and artificial intelligence implementations for remote healthcare monitoring systems: A survey. J. King Saud Univ.-Comput. Inf. Sci. 2021. [Google Scholar] [CrossRef]
  8. Nasir, F.; Abubakar, A.; Emmanuel, I.; Folawiyo, Y.Y.; Adewole, K.S.; Mojeed, H.A.; Oloyede, A.A.; Olawoyin, L.A.; Sikiru, I.A.; Nehemiah, A.; et al. A comprehensive survey on low-cost ECG acquisition systems: Advances on design specifications, challenges and future direction. Biocybern. Biomed. Eng. 2021, 41, 474–502. [Google Scholar]
  9. Kwon, S.; Lee, S.-R.; Choi, E.-K.; Ahn, H.-J.; Song, H.-S.; Lee, Y.-S.; Oh, S. Validation of Adhesive Single-Lead ECG Device Compared with Holter Monitoring among Non-Atrial Fibrillation Patients. Sensors 2021, 21, 3122. [Google Scholar] [CrossRef]
  10. Sahoo, P.K.; Thakkar, H.K.; Lin, W.-Y.; Chang, P.-C.; Lee, M.-Y. On the design of an efficient cardiac health monitoring system through combined analysis of ECG and SCG signals. Sensors 2018, 18, 379. [Google Scholar] [CrossRef] [Green Version]
  11. Sahoo, P.K.; Thakkar, H.K.; Lee, M.-Y. A cardiac early warning system with multi channel SCG and ECG monitoring for mobile health. Sensors 2017, 17, 711. [Google Scholar] [CrossRef]
  12. Klum, M.; Leib, F.; Oberschelp, C.; Martens, D.; Pielmus, A.-G.; Tigges, T.; Penzel, T.; Orglmeister, R. Wearable Multimodal Stethoscope Patch for Wireless Biosignal Acquisition and Long-Term Auscultation. In 2019 41st Annual International Conference of the IEEE Engineering in Medicine and Biology Society (EMBC); Institute of Electrical and Electronics Engineers (IEEE): Berlin, Germany, 2019; pp. 5781–5785. [Google Scholar]
  13. Rashkovska, A.; Depolli, M.; Tomašić, I.; Avbelj, V.; Trobec, R. Medical-grade ECG sensor for long-term monitoring. Sensors 2020, 20, 1695. [Google Scholar] [CrossRef] [Green Version]
  14. Rincon, J.A.; Guerra-Ojeda, S.; Carrascosa, C.; Julian, V. An IoT and Fog Computing-Based Monitoring System for Cardiovascular Patients with Automatic ECG Classification Using Deep Neural Networks. Sensors 2020, 20, 7353. [Google Scholar] [CrossRef]
  15. Ahsanuzzaman, S.; Ahmed, T.; Rahman, A. Low Cost, Portable ECG Monitoring and Alarming System Based on Deep Learning. In Proceedings of the 2020 IEEE Region 10 Symposium (TENSYMP), Dhaka, Bangladesh, 5–7 June 2020; pp. 316–319. [Google Scholar]
  16. Gao, Z.; Wu, J.; Zhou, J.; Jiang, W.; Feng, L. Design of ECG Signal Acquisition and Processing System. In 2012 International Conference on Biomedical Engineering and Biotechnology; IEEE Computer Society: Washington, DC, USA, 2012; pp. 762–764. [Google Scholar]
  17. Klum, M.; Urban, M.; Tigges, T.; Pielmus, A.-G.; Feldheiser, A.; Schmitt, T.; Orglmeister, R. Wearable cardiorespiratory monitoring employing a multimodal digital patch stethoscope: Estimation of ECG, pep, lvetand respiration using a 55 mm single-lead ECG and phonocardiogram. Sensors 2020, 20, 2033. [Google Scholar] [CrossRef] [PubMed] [Green Version]
  18. Yuan, L.; Yuan, Y.; Zhou, Z.; Bai, Y.; Wu, S. A Fetal ECG Monitoring System Based on the Android Smartphone. Sensors 2019, 19, 446. [Google Scholar] [CrossRef] [PubMed] [Green Version]
  19. Wang, L.-H.; Zhang, W.; Guan, M.-H.; Jiang, S.-Y.; Fan, M.-H.; Abu, P.A.R.; Chen, C.-A.; Chen, S.-L. A Low-Power High-Data-Transmission Multi ECG Acquisition Sensor System. Sensors 2019, 19, 4996. [Google Scholar] [CrossRef] [Green Version]
  20. Abtahi, F.; Snäll, J.; Aslamy, B.; Abtahi, S.; Seoane, F.; Lindecrantz, K. Biosignal PI, an Affordable Open-Source ECG and Respiration Measurement System. Sensors 2015, 15, 93–109. [Google Scholar] [CrossRef] [PubMed] [Green Version]
  21. Ozkan, H.; Ozhan, O.; Karadana, Y.; Gulcu, M.; Macit, S.; Husain, F. A Portable Wearable Tele-ECG Monitoring System. IEEE Trans. Instrum. Meas. 2019, 69, 173–182. [Google Scholar] [CrossRef]
  22. Pineda-López, F.; Martínez-Fernández, A.; Rojo-Álvarez, J.L.; García-Alberola, A.; Blanco-Velasco, M. A flexible 12-lead/Holter device with compression capabilities for low-bandwidth mobile-ECG telemedicine applications. Sensors 2018, 18, 3773. [Google Scholar] [CrossRef] [Green Version]
  23. Boehm, A.; Yu, X.; Neu, W.; Leonhardt, S.; Teichmann, D. A Novel 12-Lead ECG T-Shirt with Active Electrodes. Electronics 2016, 5, 75. [Google Scholar] [CrossRef] [Green Version]
  24. Uktveris, T.; Jusas, V. Development of a Modular Board for EEG Signal Acquisition. Sensors 2018, 18, 2140. [Google Scholar] [CrossRef] [Green Version]
  25. Medtronic, Cardiac Monitors. Available online: https://www.medtronic.com/us-en/healthcare-professionals/products/cardiac-rhythm/cardiac-monitors.html (accessed on 25 January 2021).
  26. ZioXT by iRhythm. Available online: https://www.irhythmtech.com/products-services/zio-xt (accessed on 25 January 2022).
  27. Wearable Biosensor by Philips. Available online: https://www.usa.philips.com/healthcare/product/HC989803196871/wearable-biosensor-wireless-remote-sensing-device (accessed on 25 January 2021).
  28. Savvy ECG–Savvy. Available online: http://www.savvy.si/en/Savvy_1/ (accessed on 25 January 2022).
  29. ePatch–BioTelemetry, Inc. Available online: https://www.gobio.com/epatch (accessed on 25 January 2022).
  30. QardioCore Wearable ECG EKG Monitor. Available online: https://www.getqardio.com/en/qardiocore-wearable-ecg-ekg-monitor-iphone (accessed on 25 January 2022).
  31. Chen, C.-L.; Chuang, C.-T. A QRS Detection and R Point Recognition Method for Wearable Single-Lead ECG. Sensors 2017, 17, 1969. [Google Scholar] [CrossRef] [Green Version]
  32. Townsend, K.; Cufí, C.; Davidson, R. Getting Started with Bluetooth Low Energy: Tools and Techniques for Low-Power Networking; O′Reilly Media, Inc.: Newton, MA, USA, 2014; Chapter 4. [Google Scholar]
  33. Heart Rate Profile 1.0–Bluetooth® Technology. Available online: https://www.bluetooth.com/specifications/specs/heart-rate-profile-1-0 (accessed on 25 January 2021).
  34. Bluetooth® Low Energy-Specifications. Available online: https://www.bluetooth.com/specifications/ (accessed on 25 January 2022).
  35. Bluetooth® Low Energy-Profiles. Available online: https://www.bluetooth.com/specifications/gatt (accessed on 25 January 2022).
  36. Yiadom, M.Y.A.B.; Baugh, C.W.; McWade, C.M.; Liu, X.; Song, K.J.; Patterson, B.W.; Jenkins, C.A.; Tanski, M.; Mills, A.M.; Salazar, G.; et al. Performance of Emergency Department Screening Criteria for an Early ECG to Identify ST-Segment Elevation Myocardial Infarction. J. Am. Heart Assoc. 2017, 6, e003528. [Google Scholar] [CrossRef] [Green Version]
  37. Pan, J.; Tompkins, W.J. A Real-Time QRS Detection Algorithm. IEEE Trans. Biomed. Eng. 1985, 32, 230–236. [Google Scholar] [CrossRef] [PubMed]
  38. Wagner, P.; Strodthoff, N.; Bousseljot, R.-D.; Kreiseler, D.; Lunze, F.I.; Samek, W.; Schaeffter, T. PTB-XL, a large publicly available electrocardiography dataset. Sci. Data 2020, 7, 154. [Google Scholar] [CrossRef] [PubMed]
  39. Saenz-Cogollo, J.F.; Agelli, M. Investigating Feature Selection and Random Forests for Inter-Patient Heartbeat Classification. Algorithms 2020, 13, 75. [Google Scholar] [CrossRef] [Green Version]
  40. LE Data Length Extension. Available online: http://software-dl.ti.com/lprf/simplelink_cc2640r2_sdk/1.35.00.33/exports/docs/ble5stack/ble_user_guide/html/ble-stack/data-length-extensions.html (accessed on 25 January 2022).
  41. HE Instruments|Patient Simulators. Available online: https://www.heinstruments.com (accessed on 25 January 2022).
  42. Bluetooth Low Energy–Advertising. Available online: https://www.bluetooth.com/blog/bluetooth-low-energy-it-starts-with-advertising/ (accessed on 25 January 2022).
Publisher’s Note: MDPI stays neutral with regard to jurisdictional claims in published maps and institutional affiliations.

Article Metrics

Citations

Article Access Statistics

Multiple requests from the same IP address are counted as one view.