Article

Clarification of the Acoustic Characteristics of Velopharyngeal Insufficiency by Acoustic Simulation Using the Boundary Element Method: A Pilot Study

1
Department of Oral and Maxillofacial Surgery, Yamaguchi University Graduate School of Medicine, Yamaguchi 755-8505, Japan
2
Cybernet Systems Co., Ltd., Tokyo 101-0022, Japan
*
Author to whom correspondence should be addressed.
Acoustics 2025, 7(2), 26; https://doi.org/10.3390/acoustics7020026
Submission received: 5 March 2025 / Revised: 2 May 2025 / Accepted: 9 May 2025 / Published: 13 May 2025
(This article belongs to the Special Issue Developments in Acoustic Phonetic Research)

Abstract

:
A model of the vocal tract that mimicked velopharyngeal insufficiency was created, and acoustic analysis was performed using the boundary element method to clarify the acoustic characteristics of velopharyngeal insufficiency. The participants were six healthy adults. Computed tomography (CT) images were taken from the frontal sinus to the glottis during phonation of the Japanese vowels /i/ and /u/, and models of the vocal tracts were created from the CT data. To recreate velopharyngeal insufficiency, coupling of the nasopharynx was carried out in vocal tract models with no nasopharyngeal coupling, and the coupling site was enlarged in models with nasopharyngeal coupling. The vocal tract models were extended virtually for 12 cm in a cylindrical shape to represent the region from the lower part of the glottis to the tracheal bifurcation. The Kirchhoff–Helmholtz integral equation was used for the wave equation, and the boundary element method was used for discretization. Frequency response curves from 1 to 3000 Hz were calculated by applying the boundary element method. The curves showed the appearance of a pole–zero pair around 500 Hz, increased intensity around 250 Hz, decreased intensity around 500 Hz, decreased intensities of the first and second formants (F1 and F2), and a lower frequency of F2. Of these findings, increased intensity around 250 Hz, decreased intensity around 500 Hz, decreased intensities of F1 and F2, and lower frequency of F2 agree with the previously reported acoustic characteristics of hypernasality.

1. Introduction

Patients sometimes fail to achieve velopharyngeal function after cleft palate surgery. Velopharyngeal insufficiency is a proximal cause of articulatory disorders, such as the substitution of glottal stops for certain consonants. Leakage of exhaled air into the nasal cavity impairs the ability to increase the intraoral pressure, resulting in abnormal sound production, such as distorted consonants. In addition, it has been pointed out that the speech of post-cleft palate surgery patients may also be affected by abnormalities in palatal morphology and related posteriorization of the tongue [1]. Research to date into the acoustic characteristics of the speech of cleft palate patients has focused mainly on techniques such as frequency analysis. For example, characteristics such as a lower second formant (F2) frequency of /i/ [2,3] and lower F2 frequency due to posteriorization of the tongue [4] have been noted, but the characteristics of the speech of cleft palate patients have not been fully identified.
Recently, many studies have been using magnetic resonance imaging (MRI) to analyze the movement and shape of the velopharynx during speech [5,6], and attempts to perform three-dimensional analysis of nasopharyngeal movement during swallowing have also been reported using computed tomography (CT) [7]. Although these methods enable detailed analysis of the movement of the nasopharynx during speech and swallowing, the relationships between the state of velopharyngeal closure or the shape of the articulatory organs and the sounds produced there cannot be analyzed.
We have been aiming to establish a simulation method using the boundary element method to clarify the relationship between the morphology of the articulatory organs and the speech that is produced. In previous studies, we applied the boundary element method to develop a simulation of the Japanese vowels /a/, /i/, and /u/ using a model of the vocal tract from the frontal sinus to the trachea, and verification of its validity showed that it is capable of simulation with sufficient accuracy [8,9]. This approach makes it possible to predict with high accuracy the changes in acoustic characteristics that result from modifying vocal tract morphology.
The present study sought to clarify the acoustic changes and characteristics of velopharyngeal insufficiency by modifying a vocal tract model created from computed tomography (CT) data during phonation of /i/ and /u/ into a model that recreates velopharyngeal insufficiency and then using the modified model for acoustic analysis with the boundary element method.

2. Materials and Methods

2.1. Participants

The study participants were six healthy adults (three males and three females; age range of 26–45 years) with a normal occlusal relationship and no abnormalities in the articulatory organs, including the tongue, palate, velum, and pharynx. The Institutional Review Board of Yamaguchi University Hospital approved this study (H26-22-4), and written, informed consent was obtained from all participants.

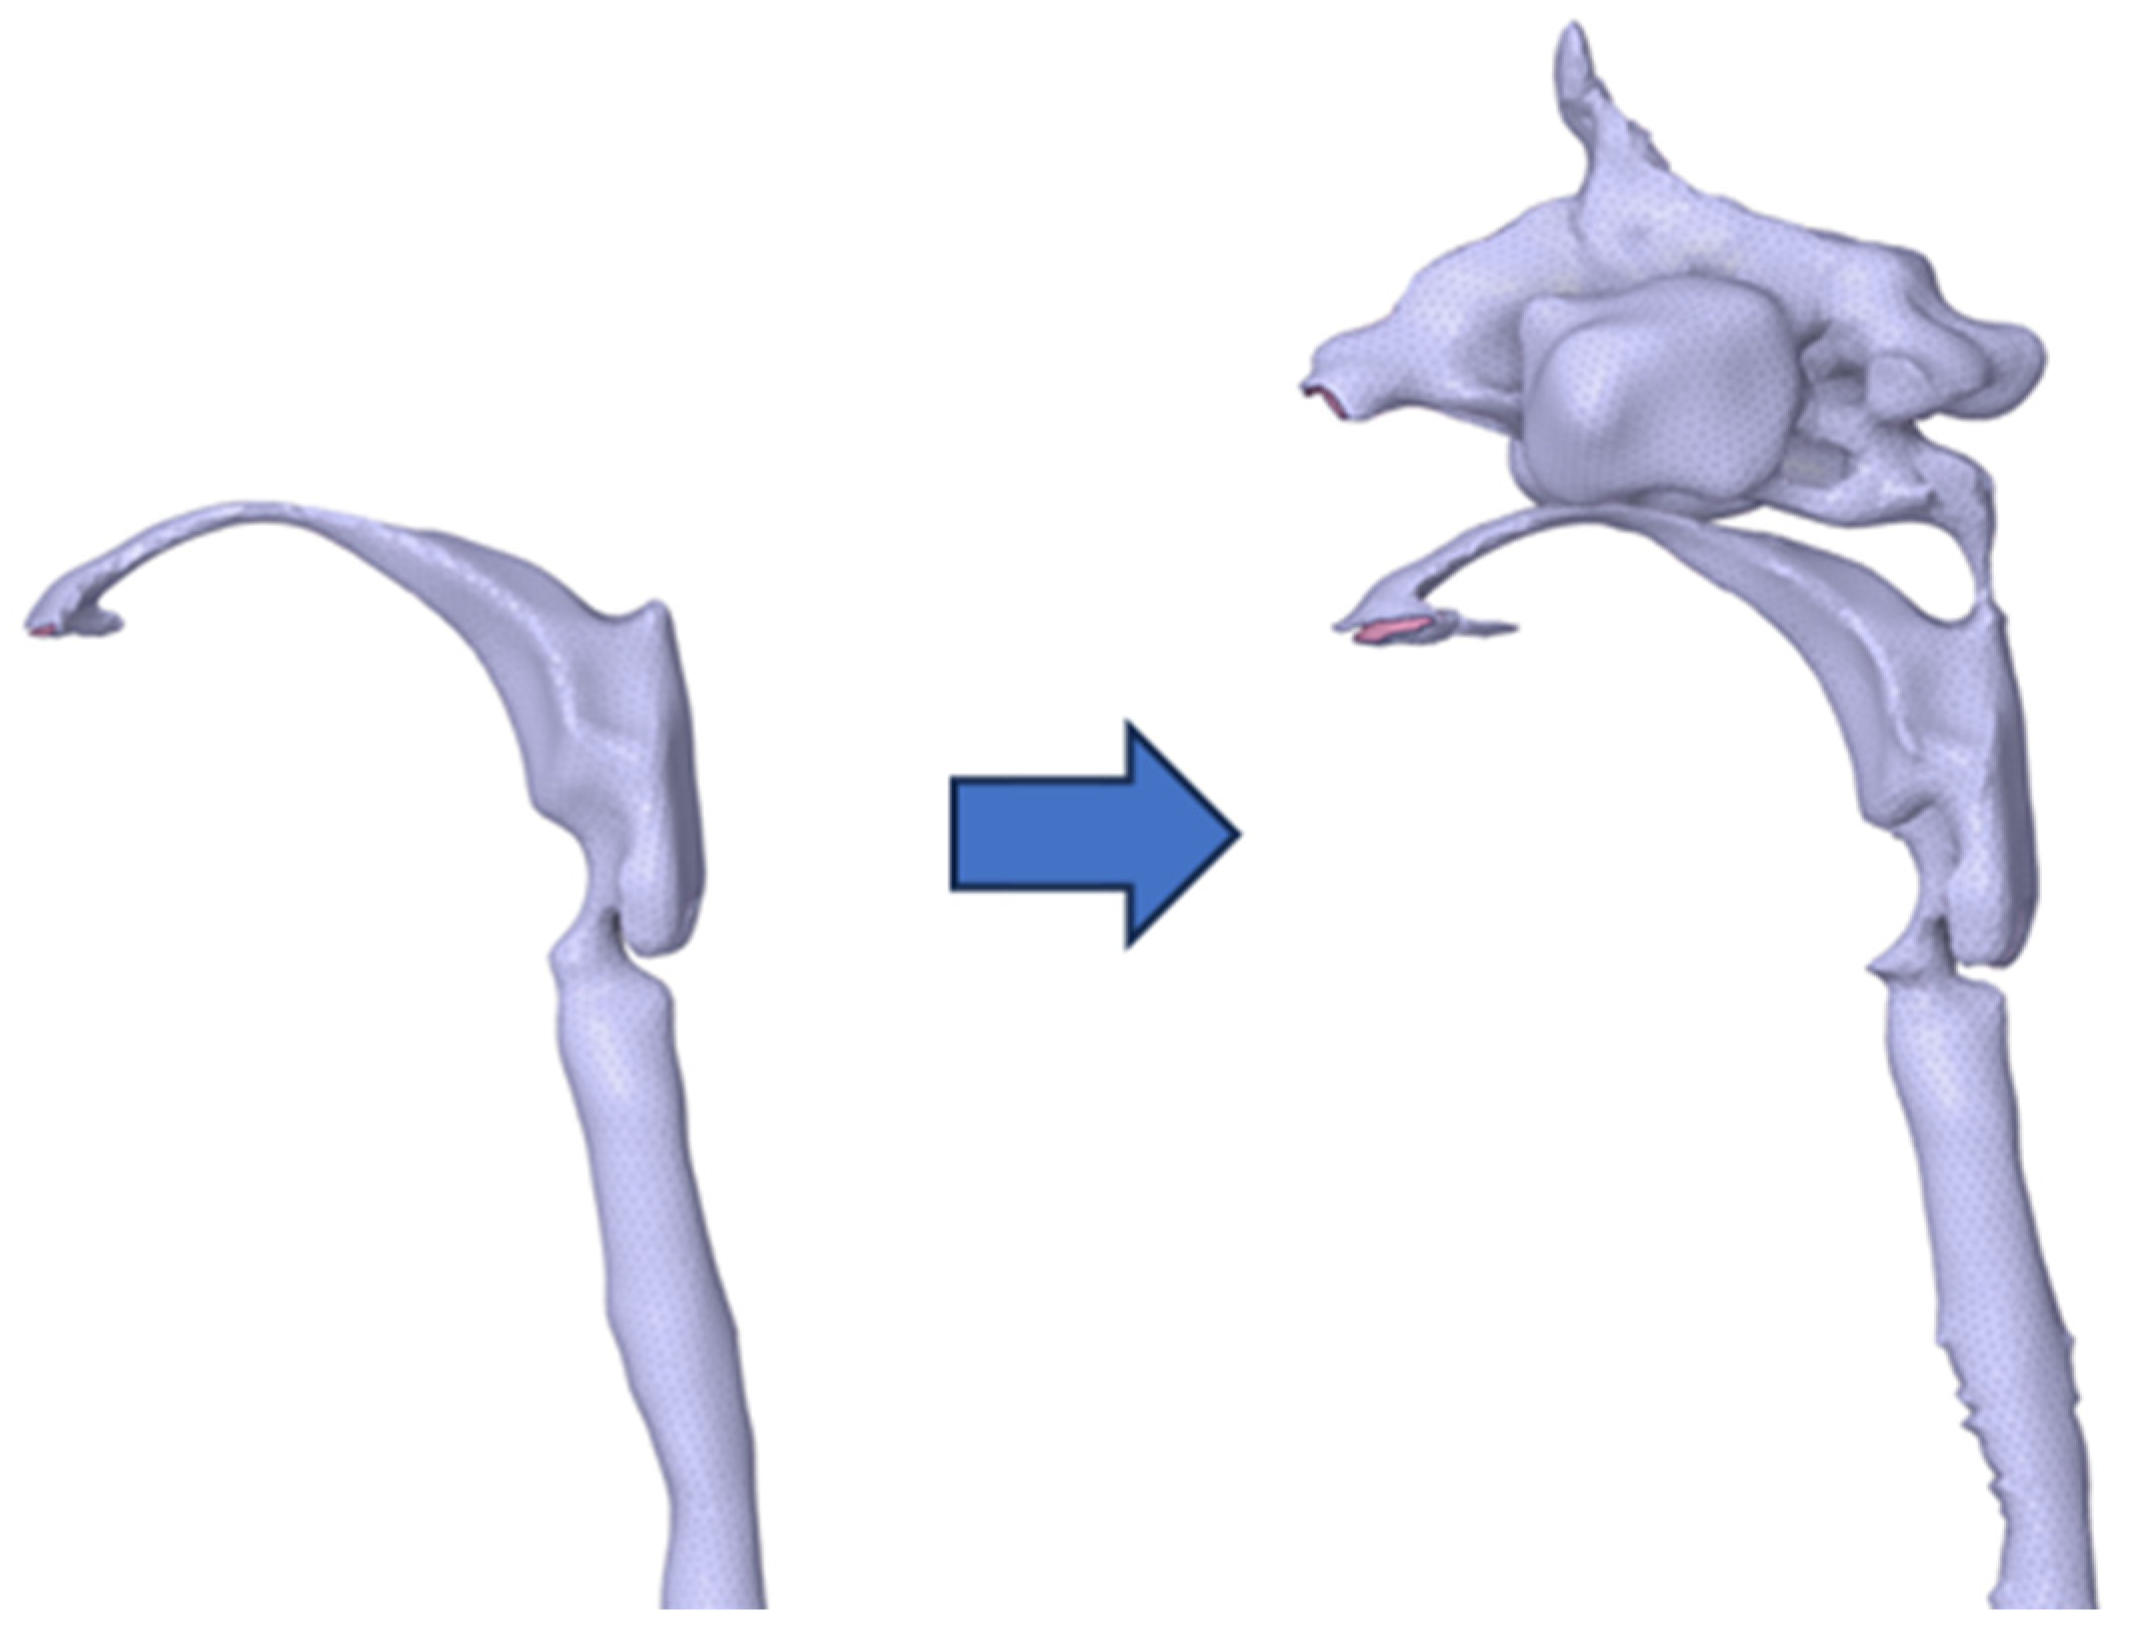
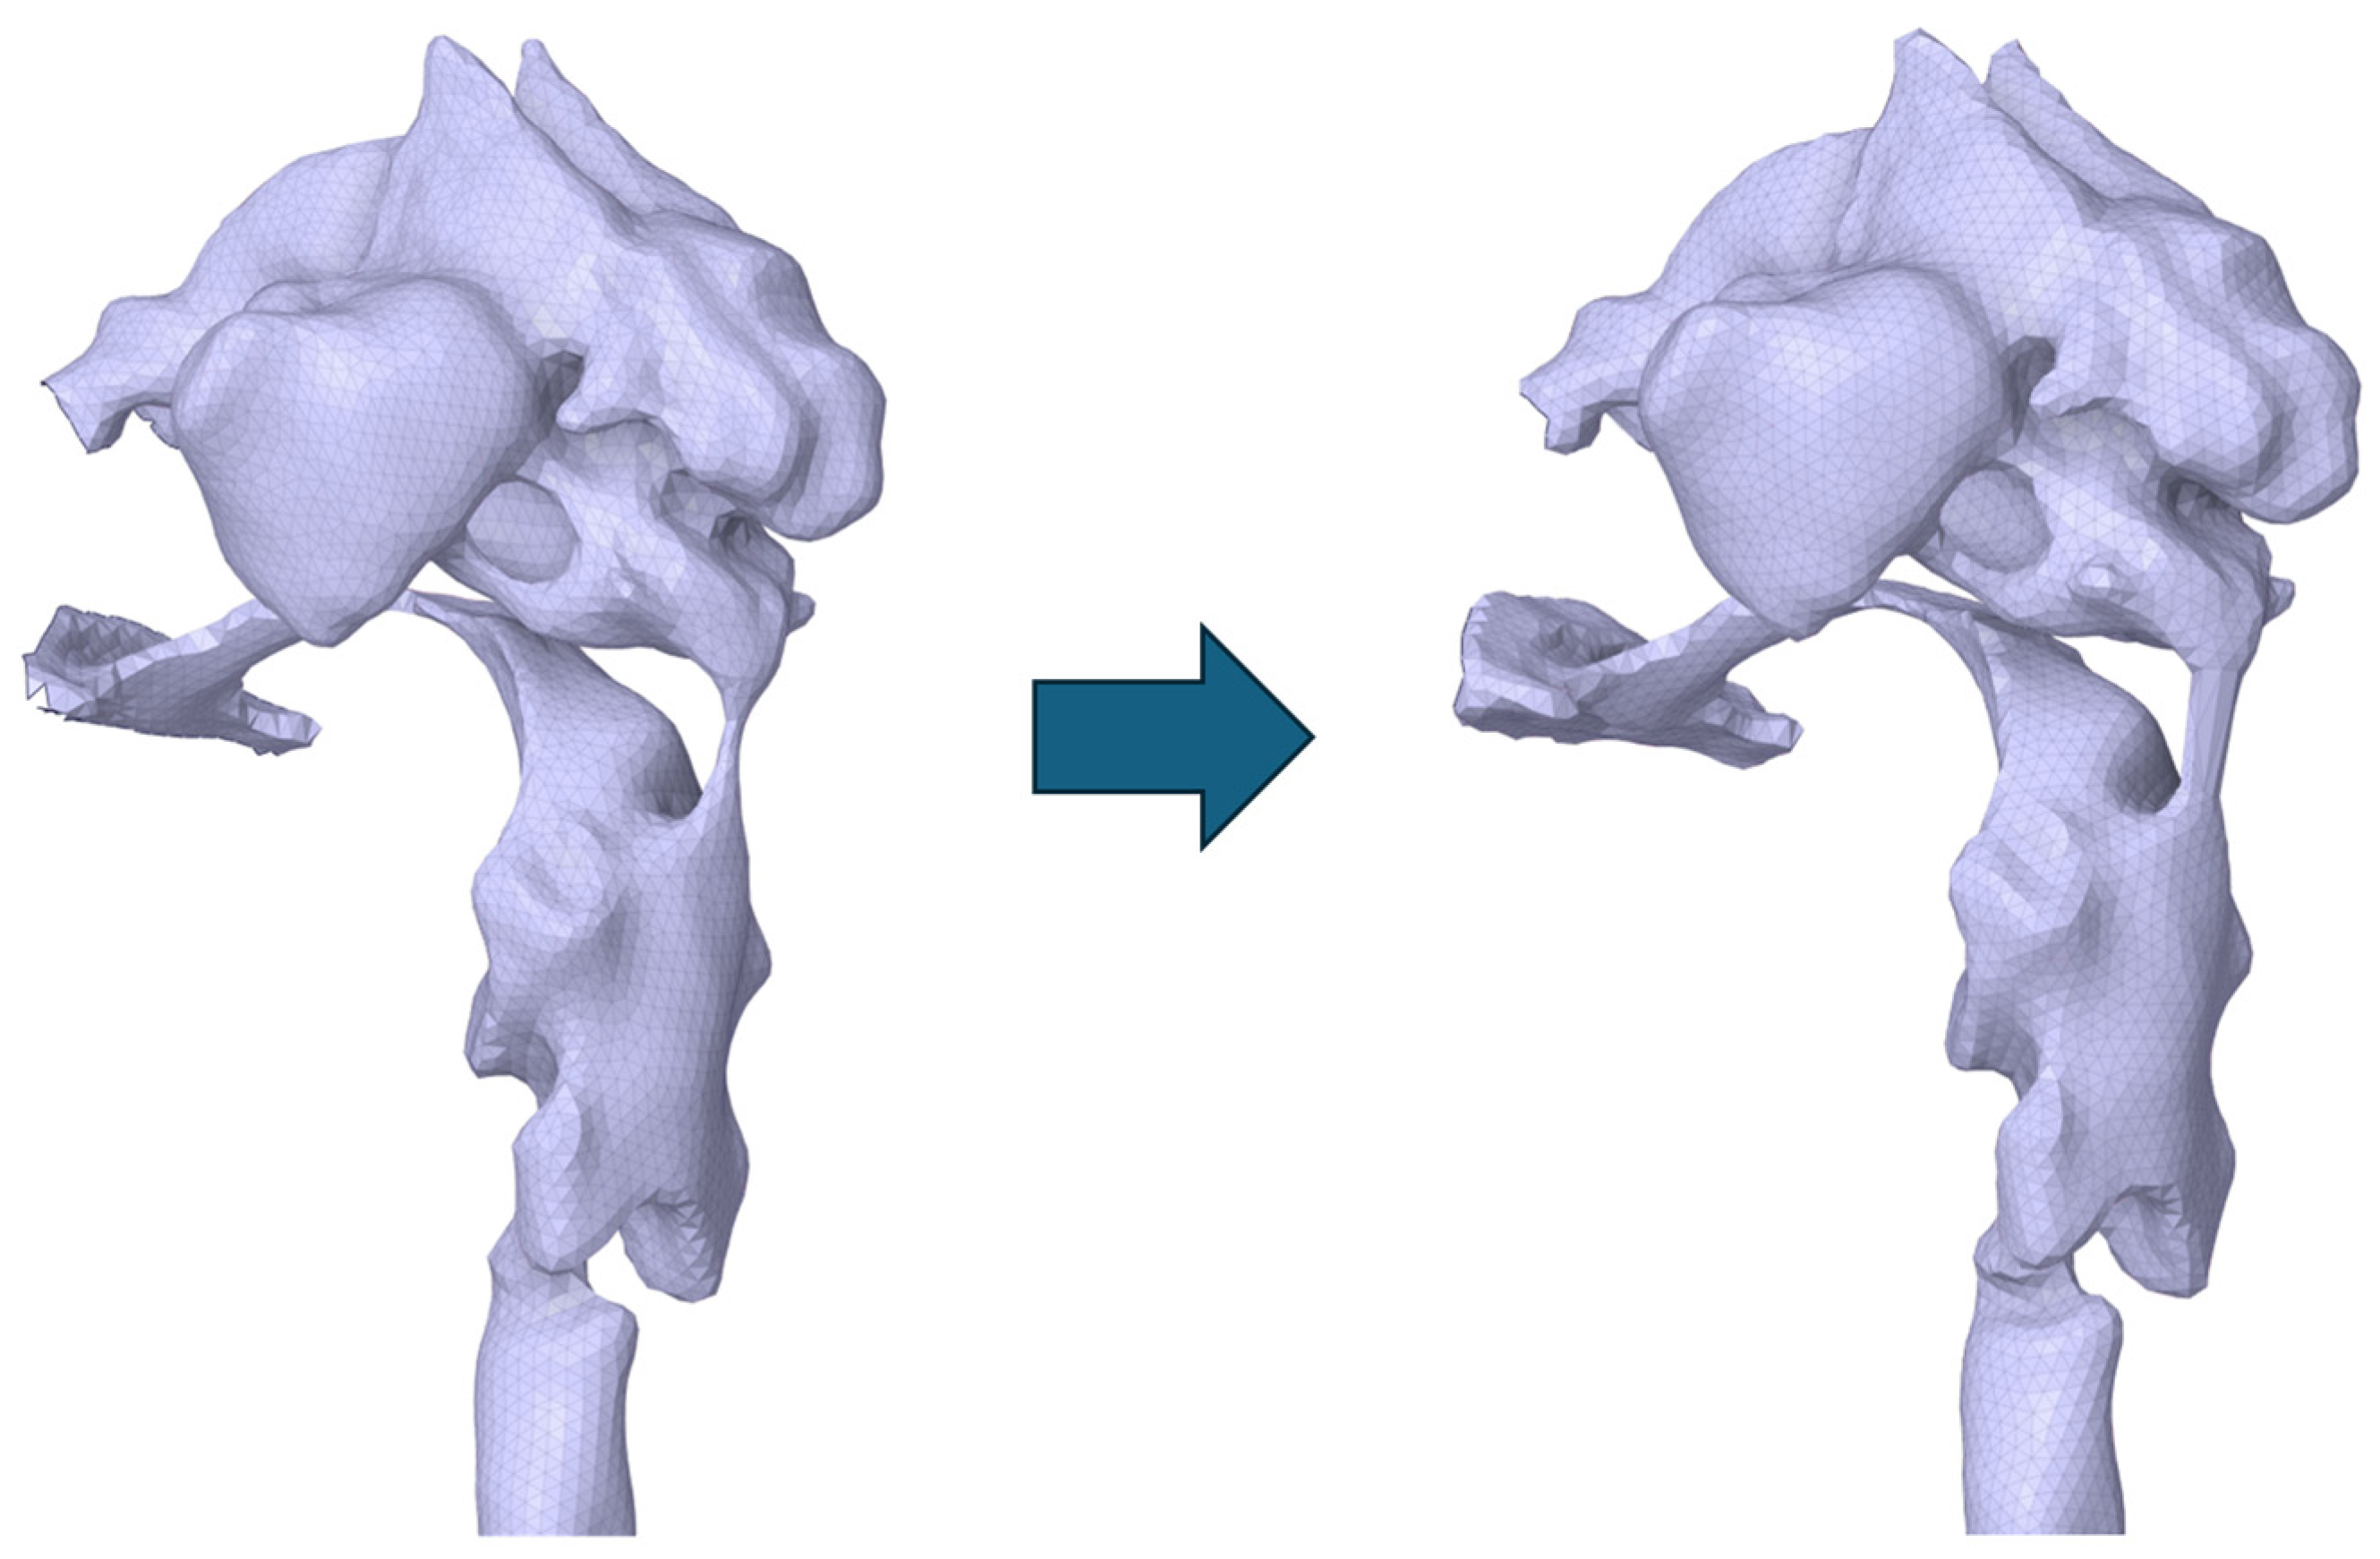
2.2. Simulation Method

The vocal tract model that we described previously [9] was used for the six participants. A SOMATOM Force (Siemens Healthineers, Munich, Germany) CT scanner was used for imaging. The scanning conditions were as follows: tube voltage, 100 (+Tin filter) kV; tube current, 96 mA; slice thickness, 0.6 mm; and CTDI vol., 0.23 mGy. The CT scanner used had the advantage of being able to maintain a low exposure dose. Namely, whereas the exposure dose for an ordinary chest CT examination is 5–30 mSv, it was only 0.1 mSv with the present CT scanner. CT imaging was carried out only once during phonation of the Japanese vowels /i/ and /u/ in the supine position. Using Amira 3D visualization software (version 5.6.0; Maxnet, Tokyo, Japan), the frontal, ethmoid, sphenoid, and maxillary sinuses; the nasal and oral cavities; and the pharynx, larynx, and glottis were extracted from the CT data. They were then used to create a three-dimensional model of the vocal tract, which was extended virtually for 12 cm in a cylindrical shape to represent the region from the lower part of the glottis to the tracheal bifurcation. To equalize and adjust the mesh size and remove unnecessary meshes, a direct modeler (Space Claim Direct Modeler, version 2021R1; ANSYS, Canonsburg, PA, USA) was used to modify the vocal tract model. The meshes of the nostril and oral aperture were removed, and the nasal and oral cavities and tracheal bifurcation were then opened. Using the method previously described [8], acoustic analysis was performed from 1 to 3000 Hz at 1 Hz intervals by software (WAON; version 4.55; Cybernet Systems Co., Ltd., Tokyo, Japan) using the Kirchhoff–Helmholtz integral equation and the boundary element method. The parameters of the acoustic analysis model were set as follows: The wall of the vocal tract model was regarded as rigid, so that the sound absorption coefficient was set to 0% with a specific acoustic impedance of ∞; the bottom of the virtual trachea was regarded as nonrigid after being extended cylindrically between the tracheal bifurcation and the lower part of the glottis [10]; the acoustic medium temperature was set to 37 °C; at this temperature, the sound velocity was 352.85 m/s and the density was 1.1468 kg/m3; and the sound source and observation point were set as points corresponding to the vocal cords and a location 10 cm in front of the lips, respectively. A frequency response curve was then drawn at the sound pressure level to calculate the first formant (F1) and F2.

2.3. Analysis Method
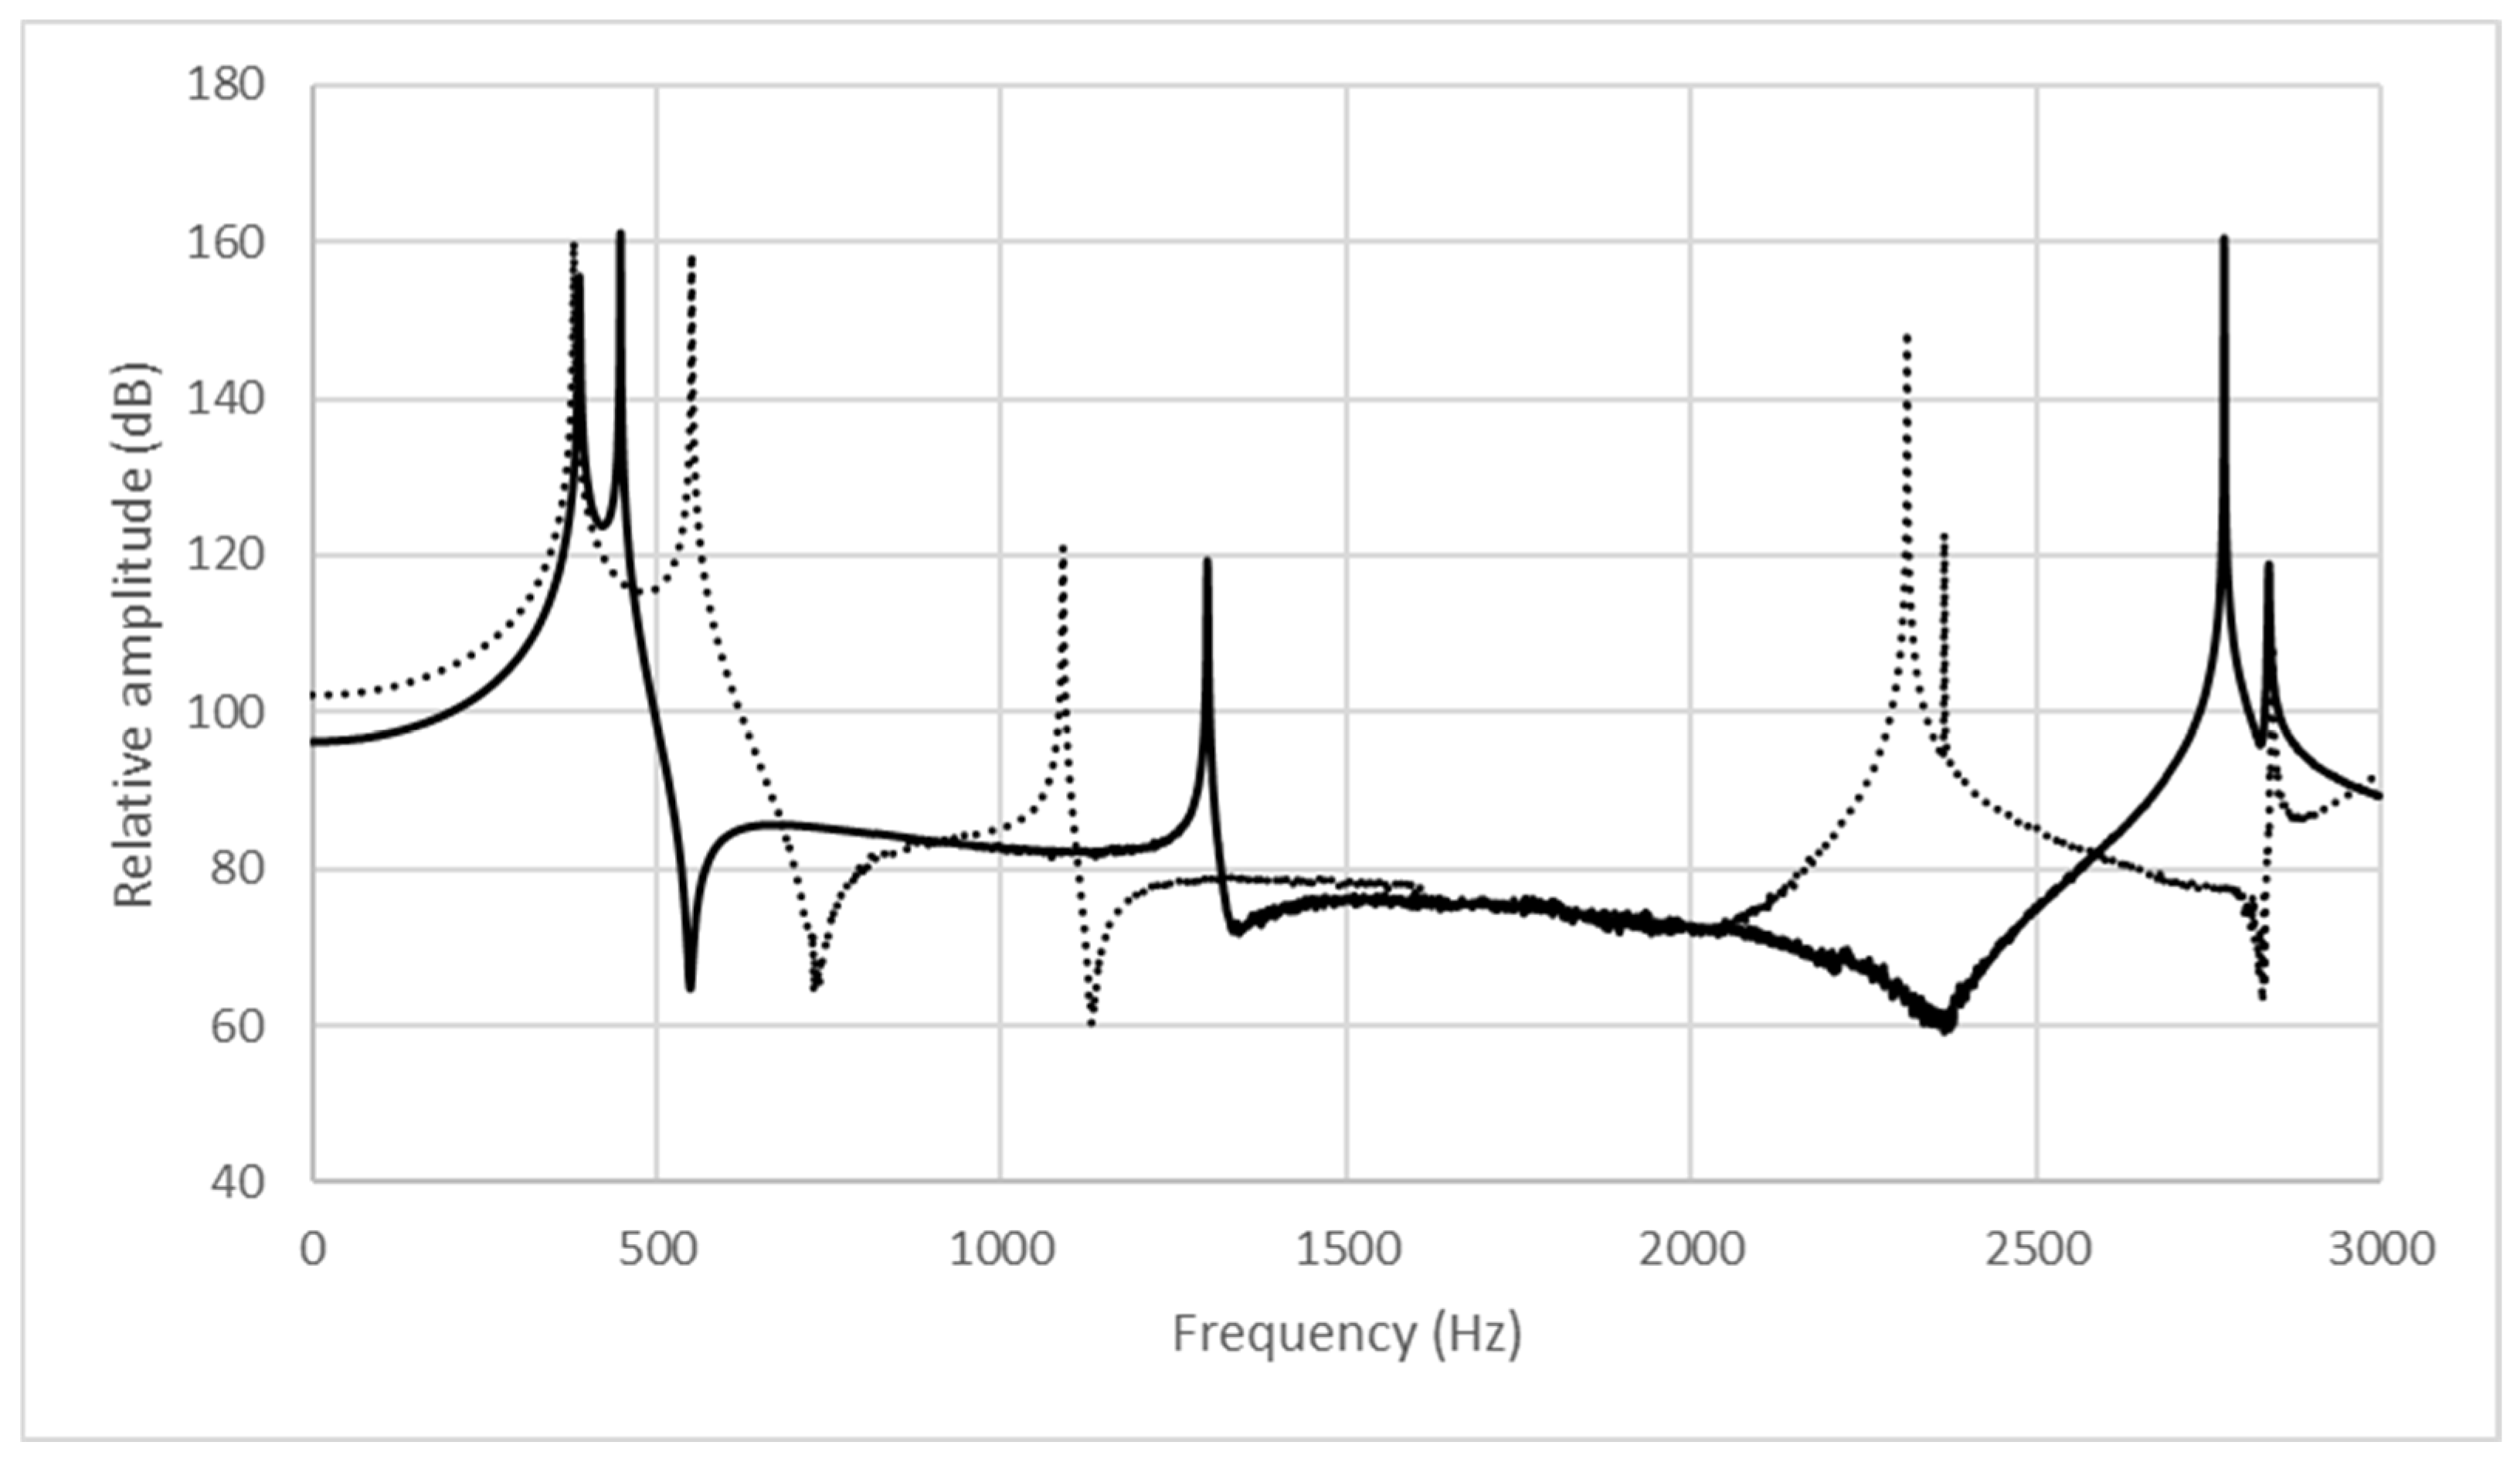
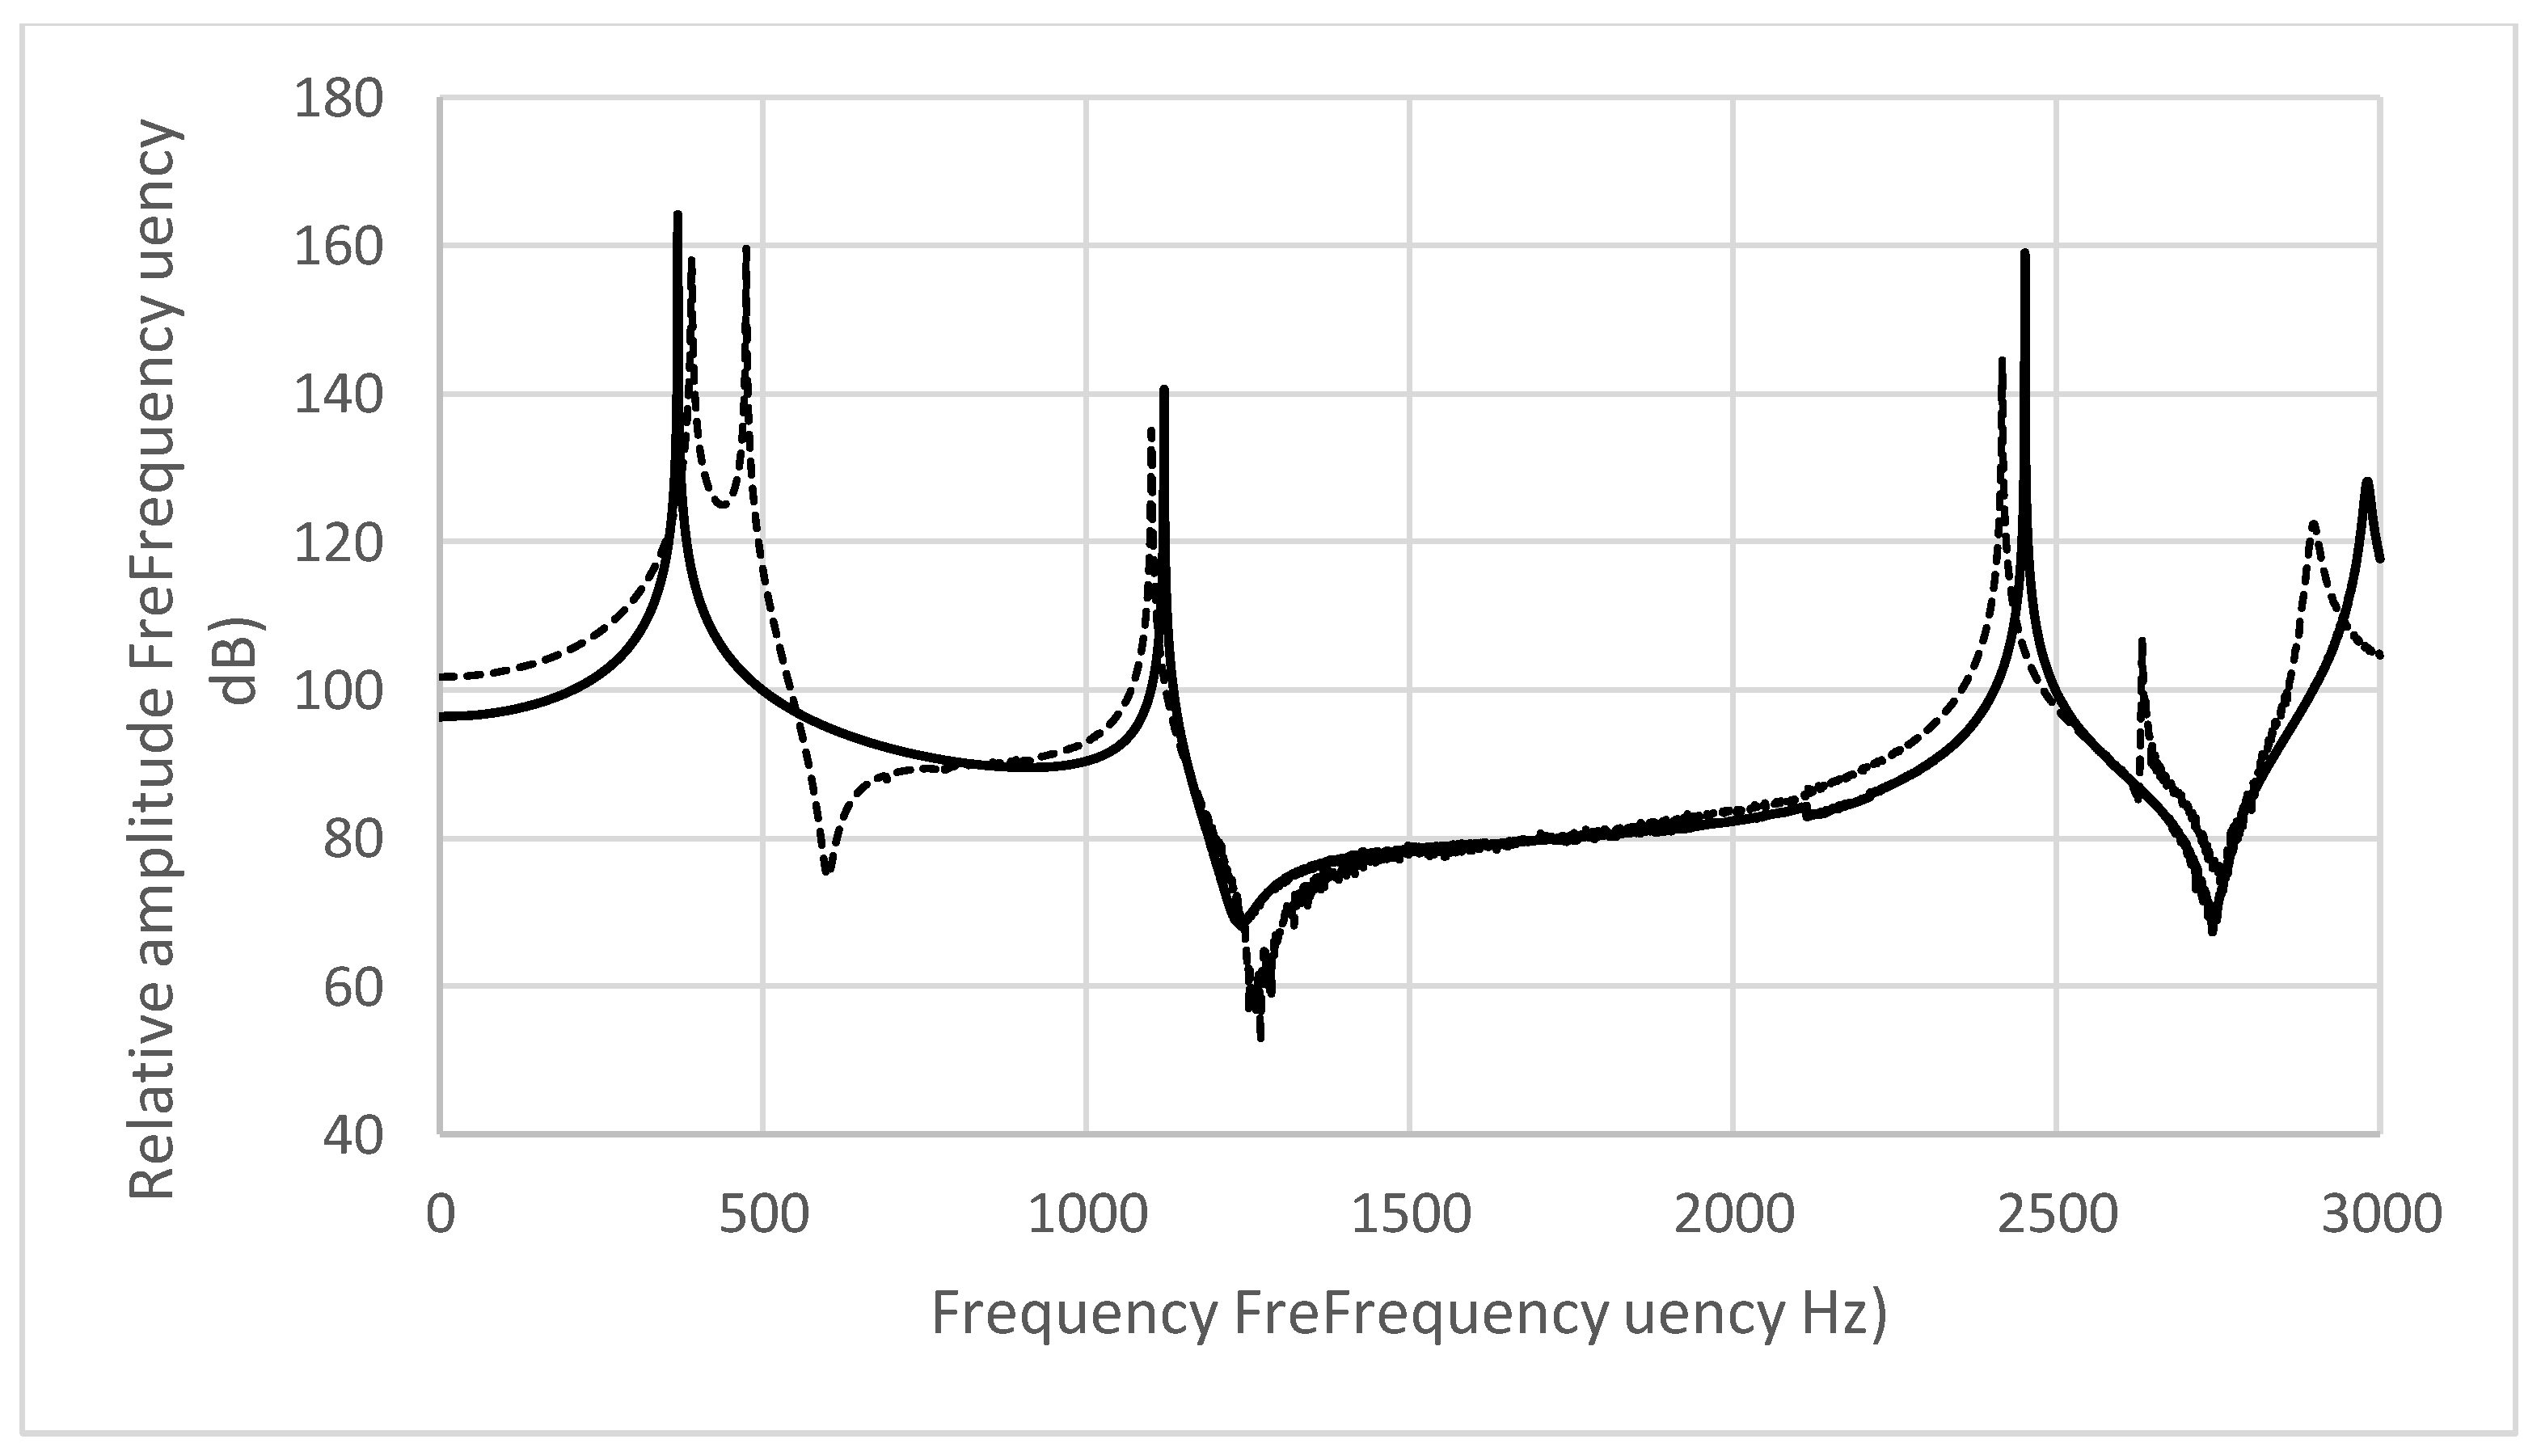
The condition of velopharyngeal insufficiency was recreated in the vocal tract models to investigate the acoustic characteristics. Of the vocal tract models created from the CT data, those with no nasopharyngeal coupling were modified to become models in which the nasopharynx was coupled (Figure 1). For the modification, a 2-milimeter mesh model of the vocal tract was created. A 1–3-mesh hole was opened in the nasal cavity side and in the oral cavity side of the mesh corresponding to the nasopharyngeal coupling site so that the cavities were coupled. For models with nasopharyngeal coupling, the part of the nasopharyngeal coupling site that coupled with the nasal cavity and the part that coupled with the oral cavity were each enlarged by 1–3 meshes (Figure 2). One to three meshes was the minimum number of meshes at which the cross-sectional area of the nasopharyngeal coupling site changed. In the preliminary experiments, vocal tract models enlarged by four or more mesh holes were created and simulated, but there was no difference in the results. Therefore, 1–3 mesh holes were opened for the models with no nasopharyngeal coupling, and the nasopharyngeal coupling sites were enlarged by 1–3 meshes for the models with nasopharyngeal coupling. The changes in cross-sectional area of the nasopharyngeal coupling site as a result of the modifications are shown in Table 1. Acoustic analysis was performed using modified models.

3. Results

The results of acoustic simulation in the six participants are shown in Table 2, Table 3, Table 4 and Table 5. With the Japanese vowel /i/, participants 1, 4, and 6 had nasopharyngeal coupling, and participants 2, 3, and 5 had no nasopharyngeal coupling during phonation. With /i/, two of the three participants with nasopharyngeal coupling showed a decrease in the frequency of F2 as a result of enlargement of the coupling site, and two of the three participants with no nasopharyngeal coupling showed a decrease in the frequency of F2 as a result of coupling being created.
The frequency response curves obtained from the results of simulation with the models of the Japanese vowel /i/ before and after modification of the nasopharyngeal coupling site are shown in Figure 3 and Figure 4. In the models with no nasopharyngeal coupling, pole–zero pairs around 500 Hz were observed with /i/ in all participants when coupling was created at the nasopharyngeal coupling site. An increase in intensity around 250 Hz was found with /i/ in all participants. A decrease in intensity around 500 Hz was found with /i/ in five of six participants. A decrease in intensity of the formant frequency was found for F2 with /i/ in five of six participants.
With the Japanese vowel /u/, participants 1, 4, and 6 had nasopharyngeal coupling, and participants 2, 3, and 5 had no nasopharyngeal coupling during phonation. With /u/, one of the three participants with nasopharyngeal coupling showed a decrease in the frequency of F2 as a result of enlargement of the coupling site, and all three participants with no nasopharyngeal coupling showed a decrease in the frequency of F2 as a result of coupling being created.
The frequency response curves obtained from the results of simulation with the models of the Japanese vowel /u/ before and after modification of the nasopharyngeal coupling site are shown in Figure 5 and Figure 6. In the models with no nasopharyngeal coupling, pole–zero pairs around 500 Hz were observed with /u/ in all participants with coupling created at the nasopharyngeal coupling site. An increase in intensity around 250 Hz was found with /u/ in three of six participants. A decrease in intensity around 500 Hz was found with /u/ in four of six participants. A decrease in intensity of the formant frequency was found for F1 with /u/ in four of six participants.
For both vowels, pole–zero pairs around 500 Hz were observed due to the presence of nasopharyngeal coupling. Although the frequency of occurrence differed between the two vowels, increased intensity around 250 Hz, decreased intensity around 500 Hz, lower frequency of F2, and decreased intensities of F1 with /u/ and F2 with /i/ were observed by mimicking velopharyngeal insufficiency.

4. Discussion

A comparative study in which acoustic analysis of vocal tract models that recreate velopharyngeal functional insufficiency, using the boundary element method with the same parameter settings as in our previous studies, was performed [8,9].
Prior studies have reported a range of acoustic characteristics of hypernasality, such as increased intensity around 250 Hz [11], decreased intensity around 500 Hz [11], decreased formant intensity [2,11], increased intensity in the band between F1 and F2 [12,13], broadened F1 bandwidth [13,14], resonance around 1000 Hz [2], and loss of or decreased F3 or high-frequency formants [2,13].
The results of simulation on models with modification of the nasopharyngeal coupling site showed a pole–zero pair around 500 Hz, increased intensity around 250 Hz, decreased intensity around 500 Hz, decreased intensity of F1 and F2, and decreased F2 formant frequency.
First, the pole–zero pair around 500 Hz is produced by coupling of the nasal and oral cavities, and there are a number of reports of this, including our own prior reports [8,9,15]. In the present analysis, there was a pole–zero pair around 500 Hz with /i/ and /u/ in all cases, including those originally with nasopharyngeal coupling and those with no nasopharyngeal coupling in which coupling was created at the nasopharyngeal coupling site.
Next, the increase in intensity around 250 Hz is reported to be caused by resonance in the overall cavity, from the pharynx, nasal cavity, and glottis to the nostrils, and because sounds emitted from the nostrils are particularly intensified in this domain [11]. A characteristic of nasalization reported in prior studies is that the component in the extremely low-frequency range becomes more intense [11], and Hattori et al. suggested that this is the case with the increased intensity around 250 Hz. The vocal tract model that we have been using for some time extends from the glottis to the oral cavity, nasal cavity, and paranasal sinus. This is a similar range to the overall cavity from the pharynx, nasal cavity, and glottis to the nostrils that Hattori et al. reported increases the intensity at around 250 Hz, and it therefore appears that it was possible to recreate this characteristic.
The reduction in intensity around 500 Hz has been described together with the increase in intensity around 250 Hz as a characteristic of nasalization of vowels [11]. Hattori et al. stated that the cause of this is resonance in the nasal cavity, and considering the pathway of the voice from the pharynx to the oral cavity, it is likely that the branch along the way causes antiresonance. This would mean that sounds of this frequency are selectively absorbed by the nasal cavity on the way to the mouth. There is some emission of sound from the nostrils when they are open, but the emissivity from the mouth is far greater (with the exception of narrow vowels), and this is probably because the F1 of vowels, which is the resonance from the pharynx to the oral cavity, is often in this vicinity.
There have been reports of decreases in the intensity of formant frequencies, which include reports for all formants [2,11], for F2 [16], and for F3 and above [11,12]. However, there is also a report that, because formant frequencies depend greatly on the level of vocalization, and there are considerable individual differences, rather than a decrease in formant frequency, there is an increase in the level of the bandwidth around 1000 Hz between F1 and F2 [17]. In the present simulation, a decrease in the formant frequency was seen with the Japanese vowel /i/ at F2 in five of six cases and with the Japanese vowel /u/ at F1 in four of six cases, with no increase in the level around 1000 Hz.
The decrease in F2 formant frequency is likely to be due to the appearance of resonance at around 1000 Hz with no overlap with the formant [2]. Imai et al. [3] explained this resonance around 1000 Hz as a nasalization component that appears due to leakage of exhaled air into the nasal cavity and is probably related to the shift in F2 toward lower frequencies. However, the present simulations and those in our prior studies showed a peak around 1000 Hz with the Japanese vowel /i/, regardless of nasopharyngeal coupling. It therefore appears that the resonance around 1000 Hz is not a nasalization component as explained by Imai et al. Instead, it is produced by one or another of the resonances from the oral cavity to the glottis. At the same time, it is likely that the decrease in F2 frequency is the result not only of nasal cavity resonance but also of the effects of the difference in palatal morphology between cleft palate patients, even after palatoplasty, and people without cleft palate [18], as well as a tendency for the tongue to be pulled back, which is a common articulatory maneuver in cleft palate patients [1]. If the tongue is pulled back, there is likely to be a resulting shift in F2 toward lower frequencies [2,3]. Since it has been reported that this tendency is not seen with vowels because the tongue is more readily pulled back with consonants [19], and also the present study used CT data taken in the supine position, there is therefore a need for further study of tongue position.
As mentioned above, the increased intensity around 250 Hz, decreased intensity around 500 Hz, decreased intensities of F1 and F2, and lower frequency of F2 agree with the previously reported acoustic characteristics of hypernasality. We believe that these may be acoustic characteristics resulting from velopharyngeal insufficiency, but the results need to be verified by analyzing actual cleft palate patients with velopharyngeal insufficiency. It is difficult to make any further physiological interpretation based on the results of this study alone.
To create a vocal tract model that mimics the state of velopharyngeal insufficiency, the nasopharyngeal coupling site was opened or expanded by one to three meshes. In the preliminary experiments, vocal tract models with holes of four or more meshes were created, and a simulation was performed, but there was no difference in the results. This mesh size was then used. It is considered necessary to compare this with the actual velopharyngeal shape of patients with velopharyngeal insufficiency after cleft palate surgery in the future.

5. Conclusions

A vocal tract model that recreates velopharyngeal functional insufficiency was created, and wave acoustic analysis using the boundary element method was performed. The findings included the appearance of pole–zero pairs around 500 Hz, increased intensity around 250 Hz, decreased intensity around 500 Hz, decreased intensity of F1 and F2, and lower frequency of F2. Of these findings, the increased intensity around 250 Hz, decreased intensity around 500 Hz, decreased intensity of F1 and F2, and lower frequency of F2 agree with the previously reported acoustic characteristics of hypernasality.

Author Contributions

Conceptualization, K.M.; methodology, K.M.; software, M.T. and M.M.; validation, M.S. and H.U.; formal analysis, M.S., M.T. and M.M.; investigation, M.S., M.T., M.M. and H.U.; resources, M.T. and M.M.; data curation, M.S.; writing—original draft preparation, M.S. and K.M.; writing—review and editing, M.S. and K.M.; visualization, M.S. and K.M.; supervision, K.M.; project administration, K.M.; funding acquisition, K.M. All authors have read and agreed to the published version of the manuscript.

Funding

This study was conducted with the support of a Grant-in-Aid for Scientific Research (B) (18H03001) and the Kawai Foundation for Sound Technology and Music.

Institutional Review Board Statement

This study was conducted in accordance with the Declaration of Helsinki, and the protocol was approved by the Institutional Review Board of Yamaguchi University Hospital (H26-22-4).

Data Availability Statement

The original contributions presented in this study are included in the article. Further inquiries can be directed to the corresponding author.

Conflicts of Interest

Masahiro Takekawa and Masaaki Mori are technical employees of Cybernet Systems Co., Ltd. The paper reflects the views of the scientists and not the company. Mami Shiraishi, Katsuaki Mishima, and Hirotsugu Umeda declare no conflicts of interest.

References

  1. Cullinan, W.L.; Counihan, D.T. Ratings of vowel representatives. Percept. Mot. Skill 1971, 32, 395–401. [Google Scholar] [CrossRef] [PubMed]
  2. Smith, S. Vocalization and added nasal resonance. Folia Phoniatr. 1951, 3, 165–169. [Google Scholar] [CrossRef] [PubMed]
  3. Imai, T.; Nakamura, S.; Hirahara, T.; Ifukube, T. Quantitative evaluation of the nasality in cleft palate speech. Acoust. Soc. J. 1985, 41, 69–76. [Google Scholar]
  4. Kent, R.D.; Read, C. The Acoustic Analysis of Speech, 2nd ed.; Singular/Thomson Learning: San Diego, CA, USA, 2002. [Google Scholar]
  5. Perry, J.L.; Snodgrass, T.D.; Gilbert, I.R.; Sutton, B.P.; Baylis, A.L.; Weidler, E.M.; Tse, R.W.; Ishman, S.T.; Sitzman, T.J. Establishing a clinical protocol for velopharyngeal MRI and interpreting imaging findings. Cleft Palate Craniofacial J. 2022, 61, 748–758. [Google Scholar] [CrossRef] [PubMed]
  6. MacIsaac, M.; Elsamna, S.; Quintana, J.; Rottgers, S.; Halsey, J. MRI assessment of velopharyngeal dysfunction: A comprehensive primer for radiologists. Pediatr. Radiol. 2025, in press. [Google Scholar] [CrossRef]
  7. Ito, Y.; Inamoto, Y.; Saitoh, E.; Aihara, K.; Shibata, S.; Aoyagim, Y.; Kagaya, H.; Palmer, J.B.; Gonzalez-Fernandez, M. The effect of bolus consistency on pharyngeal volume during swallowing: Kinematic analysis in three dimensions using dynamic Area Detector CT. J. Oral Rehabil. 2020, 47, 1287–1296. [Google Scholar] [CrossRef] [PubMed]
  8. Shiraishi, M.; Mishima, K.; Umeda, H. Development of an acoustic simulation method during phonation of the Japanese vowel /a/ by the boundary element method. J. Voice 2021, 35, 530–544. [Google Scholar] [CrossRef] [PubMed]
  9. Shiraishi, M.; Mishima, K.; Takekawa, M.; Mori, M.; Umeda, H. An acoustic simulation method of the Japanese vowels /i/ and /u/ by using the boundary element method. Acoustics 2023, 5, 553–562. [Google Scholar] [CrossRef]
  10. Zwikker, C.; Kosten, C.W. Sound Absorbent Material; Elsevier: New York, NY, USA, 1949; pp. 1–22. [Google Scholar]
  11. Hattori, S.; Yamamoto, K.; Fujimura, O. Nasalization of vowels in relation to nasals. J. Acoust. Soc. Am. 1958, 30, 267–274. [Google Scholar] [CrossRef]
  12. Dickson, D.R. An acoustic study of nasality. J. Speech Hear. Res. 1962, 5, 103–111. [Google Scholar] [CrossRef] [PubMed]
  13. House, A.S.; Stevens, K.N. Analog studies of the nasalization of vowels. J. Speech Hear. Disord. 1956, 21, 218–232. [Google Scholar] [CrossRef] [PubMed]
  14. Fant, G. Acoustic Theory of Speech Production; De Gruyter Mouton: Hague, The Netherlands, 1960. [Google Scholar]
  15. Kenneth, N.S. Acoustic Phonetics; MIT Press: Cambridge, MA, USA, 2000; pp. 135–137. [Google Scholar]
  16. Hanson, M.L. A study of nasopharyngeal competence in children with repaired cleft palates. Cleft Palate J. 1964, l, 217–231. [Google Scholar]
  17. Kataoka, R.; Yamashita, Y. Quantitative evaluation of hypernasality in children with cleft palate—Acoustical characteristics of hypernasality. Dent. Med. Res. 2009, 29, 14–20. [Google Scholar] [CrossRef]
  18. Wada, T.; Miyazaki, T. Growth and changes in maxillary arch form in complete unilateral cleft lip and palate children. Cleft Palate J. 1975, 12, 115–130. [Google Scholar]
  19. Fletcher, S.G. Diagnosing Speech Disorders from Cleft Palate; Grune & Stratton: New York, NY, USA, 1978; pp. 79–83. [Google Scholar]
Figure 1. Model with no nasopharyngeal coupling—coupled model; Japanese vowel /i/ No. 5. Method of modification of the nasopharyngeal coupling site in a model with no nasopharyngeal coupling. On a model of the vocal tract created with a 2-milimeter mesh, a hole is opened in the mesh of the nasopharyngeal coupling site on the nasal cavity side and the mesh on the oral cavity side to create coupling.
Acoustics 07 00026 g001
Figure 2. Model with nasopharyngeal coupling—cross-sectional area enlargement model; Japanese vowel /i/ No. 6. Method of modification of the nasopharyngeal coupling site in the model with nasopharyngeal coupling. On a model of the vocal tract created with a 2-milimeter mesh, a hole is opened in the mesh of the nasopharyngeal coupling site on the nasal cavity side and the mesh on the oral cavity side to enlarge the coupling site.
Acoustics 07 00026 g002
Figure 3. Japanese vowel /i/, participant No. 6. The frequency response curves obtained when acoustic simulation was carried out on the model of the vocal tract of participant No. 6. Solid line: The results of analysis using the vocal tract model with an unmodified nasopharyngeal coupling site. A pole–zero pair is seen around 500 Hz. Broken line: The results of analysis using the vocal tract model with an enlarged nasopharyngeal coupling site. An increase in intensity around 250 Hz, a pole–zero pair around 500 Hz, and a decrease in intensity and decrease in frequency of F2 are seen.
Acoustics 07 00026 g003
Figure 4. Japanese vowel /i/, participant No. 5. The frequency response curves obtained when acoustic simulation was carried out on the model of the vocal tract of participant No. 5. Solid line: The results of analysis using the vocal tract model with an unmodified nasopharyngeal coupling site. No pole–zero pair is seen around 500 Hz. Broken line: The results of analysis using the vocal tract model with a coupled nasopharyngeal coupling site. An increase in intensity around 250 Hz, a pole–zero pair, a reduction in intensity around 500 Hz, and a decrease in intensity and decrease in frequency of F2 are seen.
Acoustics 07 00026 g004
Figure 5. Japanese vowel /u/, participant No. 6. The frequency response curves obtained when acoustic simulation was carried out on the model of the vocal tract of participant No. 6. Solid line: The results of analysis using the vocal tract model with an unmodified nasopharyngeal coupling site. A pole–zero pair is seen around 500 Hz. Broken line: The results of analysis using the vocal tract model with an enlarged nasopharyngeal coupling site. An increase in intensity around 250 Hz, a pole–zero pair around 500 Hz, and a decrease in frequency of F2 are seen.
Acoustics 07 00026 g005
Figure 6. Japanese vowel /u/, participant No. 3. The frequency response curves obtained when acoustic simulation was carried out on the model of the vocal tract of participant No. 3. Solid line: The results of analysis using the vocal tract model with an unmodified nasopharyngeal coupling site. No pole–zero pair is seen around 500 Hz. Broken line: The results of analysis using the vocal tract model with a coupled nasopharyngeal coupling site. An increase in intensity around 250 Hz, a pole–zero pair, a reduction in intensity around 500 Hz, and a decrease in frequency of F2 are seen.
Acoustics 07 00026 g006
Table 1. Minimum cross-sectional areas of the nasopharyngeal coupling site in the vocal tract models.
Minimum Cross-Sectional Area of the Coupling Site in the Vocal Tract Model During Phonation of /i/ (mm2)Minimum Cross-Sectional Area of the Coupling Site in the Vocal Tract Model During Phonation of /u/ (mm2)
Participant No.SexBefore ModificationAfter ModificationBefore ModificationAfter Modification
1Male2.8214.527.9113.55
2Male00.3703.35
3Male015.8601.58
4Female0.453.5412.0114.47
5Female06.3402.55
6Female1.4413.994.1210.74
Table 2. Three cases with nasopharyngeal coupling during phonation of the Japanese vowel /i/, in which nasopharyngeal insufficiency was recreated by enlarging the nasopharyngeal coupling site.
/i/ F1F2
Participant No.SexIntensity Around 250 HzIntensity Around 500 HzSimulation Value (Hz)Actual Voice (Hz)Discrimination Threshold (%)EnlargedPercent Change (%)IntensitySimulation Value (Hz)Actual Voice (Hz)Discrimination Threshold (%)EnlargedPercent Change (%)Intensity
1MaleIncreaseDecrease3563511.4365↑2.5↑Decrease219620317.51992↓9.3↑Decrease
4FemaleIncreaseDecrease3743701.1378↑1.1↑Increase251026495.52511↑0.0↑Decrease
6FemaleIncreaseIncrease40144210.2381↓5.0↓Increase277528823.92315↓16.6↓Decrease
“↑” and “↓” mean increase and decrease, respectively.
Table 3. Three cases with no nasopharyngeal coupling during phonation of the Japanese vowel /i/, in which nasopharyngeal insufficiency was recreated by coupling the nasopharyngeal coupling site.
/i/ F1F2
Participant No.SexIntensity Around 250 HzIntensity Around 500 HzSimulation Value (Hz)Actual Voice (Hz)Discrimination Threshold (%)CoupledPercent Change (%)IntensitySimulation Value (Hz)Actual Voice (Hz)Discrimination Threshold (%)CoupledPercent Change (%)Intensity
2MaleIncreaseDecrease3653426.3360↓1.4↓Increase220423566.92191↓0.6↓Increase
3FemaleIncreaseDecrease3173366349↑10.1↑Decrease234721807.12368↑0.9↑Decrease
5FemaleIncreaseDecrease3683582.7389↑5.7↑Decrease245125795.22416↓1.4↓Decrease
“↑” and “↓” mean increase and decrease, respectively.
Table 4. Three cases with nasopharyngeal coupling during phonation of the Japanese vowel /u/, in which nasopharyngeal insufficiency was recreated by enlarging the nasopharyngeal coupling site.
/u/ F1F2
Participant No.SexIntensity Around 250 HzIntensity Around 500 HzSimulation Value (Hz)Actual Voice (Hz)Discrimination Threshold (%)EnlargedPercent Change (%)IntensitySimulation Value (Hz)Actual Voice (Hz)Discrimination Threshold (%)EnlargedPercent Change (%)Intensity
1MaleDecreaseDecrease3713641.9385↑3.8↑Decrease112711986.31135↑0.7↑Decrease
4FemaleDecreaseIncrease4494470.4478↑6.5↑Decrease140313335.01705↑21.5↑Decrease
6FemaleIncreaseIncrease4324729.3426↓1.4↓Increase207219068.01997↓3.6↓Increase
“↑” and “↓” mean increase and decrease, respectively.
Table 5. Three cases with no nasopharyngeal coupling during phonation of the Japanese vowel /u/, in which nasopharyngeal insufficiency was recreated by coupling the nasopharyngeal coupling site.
/u/ F1F2
Participant No.SexIntensity Around 250 HzIntensity Around 500 HzSimulation Value (Hz)Actual Voice (Hz)Discrimination Threshold (%)CoupledPercent Change (%)IntensitySimulation Value (Hz)Actual Voice (Hz)Discrimination Threshold (%)CoupledPercent Change (%)Intensity
2MaleDecreaseDecrease4454362.0478↑7.4↑Decrease1102122211.01018↓7.6↓Decrease
3MaleIncreaseDecrease3813751.6360↓5.5↓Increase1121126112.5993↓11.4↓Increase
5FemaleIncreaseDecrease4954646.3527↑6.5↑Decrease122012926.01136↓6.9↓Increase
“↑” and “↓” mean increase and decrease, respectively.
Disclaimer/Publisher’s Note: The statements, opinions and data contained in all publications are solely those of the individual author(s) and contributor(s) and not of MDPI and/or the editor(s). MDPI and/or the editor(s) disclaim responsibility for any injury to people or property resulting from any ideas, methods, instructions or products referred to in the content.

