Abstract
This study was conducted to improve the sound absorption dips in nonwoven fabric sheets with a back air space. Considering the particle velocity distribution in the back air space, another nonwoven sheet was added to divide the air space into layers. The sound absorption coefficient of the sound-absorbing structure was theoretically derived using the transfer matrix method. The nonwoven sheet model with the Rayleigh model and the air space behind the nonwoven sheet were mathematically represented using the transfer matrix. The transfer function method was employed to combine the transfer matrices to obtain the sound absorption coefficient. A two-microphone acoustic impedance tube was used to measure the sound absorption coefficient, and the theoretical and experimental values were compared. The sound absorption dip of the first order was improved by placing a nonwoven sheet at a position half the thickness of the back air space. It was theoretically predicted that placing the nonwoven sheet at 1/4 of the back air space thickness from the rigid wall would improve the first- and second-order sound absorption dips. By selecting the conditions, a similar trend was observed during the experiments. The study shows that the higher the ventilation resistance of the added nonwoven fabric sheet, the more improved the sound absorption dip.
1. Introduction
The acoustic properties of nonwoven fabric sheets are dependent on the fiber type, lamination method, surface density, and ventilation resistance [1,2,3]. Even with thin nonwoven fabric sheets, sound absorption curves can be obtained according to the thickness of the air space by adding an air space behind it. However, porous sheets with a back air space present the disadvantage of sound absorption peaks appearing periodically, resulting in dips in the sound absorption curve [4,5]. This phenomenon is caused by the formation of standing waves due to reflections from a rigid wall. In general, the sound pressure reaches its maximum and the particle velocity is minimized near the rigid wall, while the sound pressure is minimized and the particle velocity is maximized at a distance of one-quarter wavelength from the wall. The attenuation of sound waves caused by the ventilation resistance of nonwoven fabrics is effectively achieved by reducing the particle velocity through minute frictional forces arising from boundary layer viscosity near the fibers. In other words, due to this viscous frictional resistance, little or no attenuation occurs when nonwoven fabrics are placed at locations of maximum sound pressure. Therefore, the optimal sound absorption effect is achieved by positioning porous materials at the quarter-wavelength location, where the particle velocity is at its maximum [6].
Studies, such as those by Rayleigh [7] and Miki [8], have attempted to predict the sound absorption coefficient of porous materials. Delany and Bazley [1] obtained the characteristic impedance and propagation constant by ventilation resistance. Miki [8] and Komatsu [9] subsequently improved it, and the propagation constant and characteristic impedance of porous materials are currently obtained via empirical equations based on experiments in the Miki and Komatsu models. However, the Rayleigh model approximates the porous material as a set of cylindrical tubes with a small cross-sectional area; it has long been known as Rayleigh’s capillary model. The characteristic impedance and propagation constant can be obtained by assuming the porosity and tortuosity to be 1 [10]. When the Rayleigh model is applied to a nonwoven sheet, only the flow resistance of the nonwoven sheet requires consideration, and the sound absorption coefficient can be easily predicted [11,12].
Thus, this study was conducted to improve the sound absorption dips in nonwoven fabric sheets with a back air space. Considering the particle velocity distribution in the back air space, another nonwoven sheet was added to divide the air space into layers.
Here, the sound absorption coefficient of the sound-absorbing structure was theoretically derived using the transfer matrix method. The nonwoven sheet model with the aforementioned Rayleigh model [7] and the air space behind the nonwoven sheet were mathematically represented using the transfer matrix. The transfer function method was employed to combine the transfer matrices to obtain the sound absorption coefficient.
The sound absorption performance of nonwoven sheets with a backing air gap is notably influenced by sheet vibrations induced by incident sound waves [4]. To mitigate this effect, measurements were conducted with the nonwoven sheet affixed to a honeycomb-shaped support frame, which served to restrain its vibrations during testing. The sound absorption coefficient was determined using a two-microphone acoustic impedance tube, and the results were compared with theoretical predictions. The study shows that the higher the ventilation resistance of the added nonwoven fabric sheet, the more improved the sound absorption dip.
2. Materials and Methods
2.1. Measurement Setup
The sound absorption coefficient was measured using a Brüel & Kjær, Narum, Denmark Type 4206 two-microphone impedance tube. The test sample was mounted onto the impedance tube, and a sinusoidal signal generated by the signal generator within the Fast Fourier Transform (FFT) analyzer was used to drive a loudspeaker, which introduced sound waves into the tube. The FFT analyzer then measured the transfer function between the sound pressure signals captured by two microphones positioned along the tube. This transfer function was subsequently used to compute the normal-incidence sound absorption coefficient in accordance with ISO 10534-2 [13]. The critical frequency for plane wave propagation is determined by the tube’s inner diameter. For the sample holder employed in this study, with an inner diameter of 29 mm, the upper frequency limit for accurate measurements was 6400 Hz. The input voltage supplied to the loudspeaker was set at 0.2 V.
The ventilation resistance of the nonwoven fabric sheet was measured using a Kato Tech Co., Ltd., Kyoto, Japan KES-F8-AP1 air permeability tester. Air was passed through the sample at a constant volume velocity, with airflow alternately discharged and drawn in both directions. The ventilation resistance, R, was determined based on the pressure drop measured during this process.
2.2. Samples Used in the Experiments
Figure 1a,b shows an image and a schematic diagram of the sample holder, respectively. The sample holder is made of an aluminum alloy, with dimensions of 29 and 49 mm (inner and outer diameters, respectively). As shown in Figure 1b, the back air space formed by the upper nonwoven sheet is divided by another nonwoven sheet, considering the particle velocity distribution.
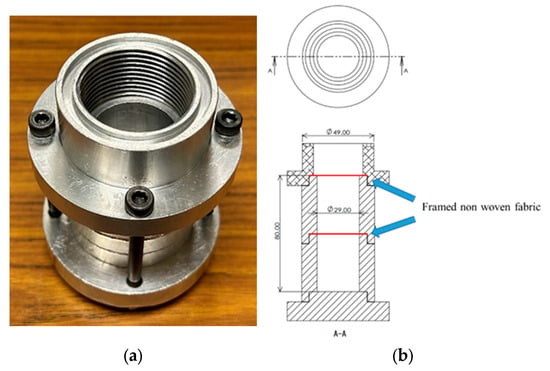
Figure 1.
Sample tube: (a) image; (b) dimensions (80 mm, e.g., 40 and 40 mm airspace).
Table 1 lists the specifications of the nonwoven fabric sheets used (3A51AD, 3701B, and 3A01A from Toyobo Co. Ltd., Osaka, Japan and RW2250 and RW2100 from Idemitsu Kosan Co. Ltd., Tokyo, Japan). Here, the five nonwoven fabric sheets used differ in terms of ventilation resistance, thickness, flow resistivity, and area density. The ventilation resistance Rn is the actual value measured using an air permeability tester. The flow resistivity σn is the value obtained by dividing the ventilation resistance Rn by the thickness tn of the nonwoven sheet.

Table 1.
Specifications of nonwoven fabric sheet.
Figure 2a–e present micrographs of the nonwoven fabrics, while Figure 2f shows an image of a sample with a nonwoven fabric sheet (3A01A) mounted on a honeycomb-shaped support frame to suppress vibrations. Nonwoven fabric sheets with small surface densities tend to vibrate because of incident sound waves. This is known to reduce the sound absorption coefficient [4]. Thus, the nonwoven fabric sheet was attached to a stainless steel support frame. The outer diameter of the sample was 39.9 mm; however, the part used for the measurement was 29 mm in diameter. The support frame consists of a 1 mm thick perforated plate with hexagonal holes arranged to achieve an aperture ratio of 0.756. Its sole function is to suppress vibrations of the nonwoven fabric, and, acoustically, it can be considered negligible—similar to a wire mesh with the same aperture ratio.
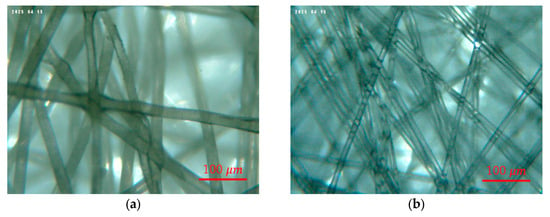
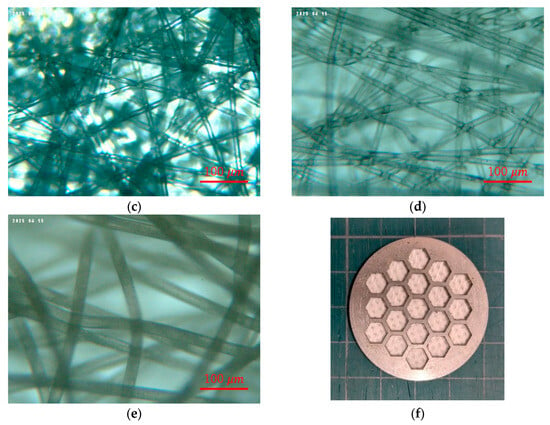
Figure 2.
Micrographs of nonwoven fabric sheet and photograph: (a) RW2100; (b) 3A01A; (c) 3701B; (d) 3A51AD; (e) RW2250; (f) test sample of nonwoven fabric sheet (3A01A) with support frame.
When sound waves are incident on a nonwoven fabric sheet with a back air space, standing waves are generated. It is generally known that the sound absorption coefficient is maximum at the frequency where the particle velocity distribution is maximum at the incident surface. Thus, the positions where the particle velocity is maximum are λ/4, 3λ/4, 5λ/4,... from the rigid wall, if the wavelength at a certain frequency is λ. Therefore, if a nonwoven fabric sheet is placed in a position that satisfies these conditions, a sound-absorbing peak will be observed at the desired frequency. However, it is also known that a sound absorption dip appears at frequencies that least satisfy these conditions [4,5]. The relationship between the first-order sound absorption peak frequency fpeak and wavelength, and between the first-order sound absorption dip frequency fdip and wavelength are shown in Equations (1) and (2), respectively.
where c is the speed of sound.
Figure 3a shows the particle velocity distribution at the first-order sound absorption peak frequency fpeak. The first-order sound absorption peak was obtained by placing the nonwoven fabric sheet at position λ/4, corresponding to the fpeak. The first-order sound absorption dip frequency fdip became 2fpeak, and Figure 3b shows the particle velocity distribution at 2fpeak [Hz]. It is estimated that adding a nonwoven fabric sheet at exactly half the back air space thickness (i.e., the position of the maximum particle velocity distribution) would eliminate the first-order sound absorption dip. Thus, a sample such as that shown in Figure 3b was produced. Figure 3c,d show the particle velocity distribution at a secondary sound absorption dip frequency of 4fpeak. It is estimated that primary and secondary sound absorption dips can be improved by adding a nonwoven fabric sheet so that the back air space thickness is divided into 1:3 or 3:1 at a 4fpeak [Hz]. Thus, the samples shown in Figure 3c,d were produced.
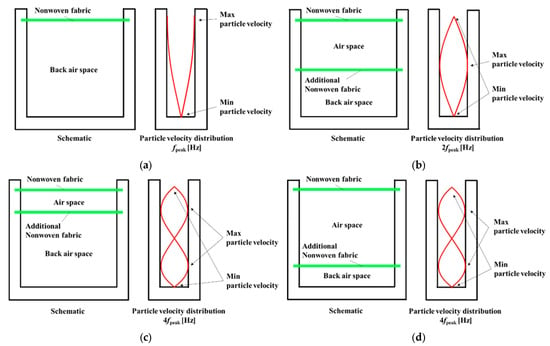
Figure 3.
Schematic of measured sample and particle velocity distribution: (a) particle velocities at fpeak [Hz]; (b) 2fpeak [Hz]; (c) 4fpeak [Hz] (upper); (d) 4fpeak [Hz] (lower).
3. Theoretical Analysis
3.1. Analytical Models Corresponding to the Proposed Sound Absorption Structure
Here, the sound absorption coefficient was derived via a theoretical analysis using the transfer matrix method for sound pressure and volume velocity for the samples presented in Section 2.
Figure 4a,b shows the equivalent circuits represented by electrical four-terminal networks corresponding to the samples shown in Figure 3a–d. The equivalent circuit shown in Figure 4a corresponds to a sound-absorbing structure comprising a single nonwoven fabric sheet and a back airspace. The equivalent circuit shown in Figure 4b corresponds to a sound-absorbing structure comprising two nonwoven fabric sheets and two back air spaces. Thus, two transfer matrices for the nonwoven fabric sheets and two for the back air spaces are used.
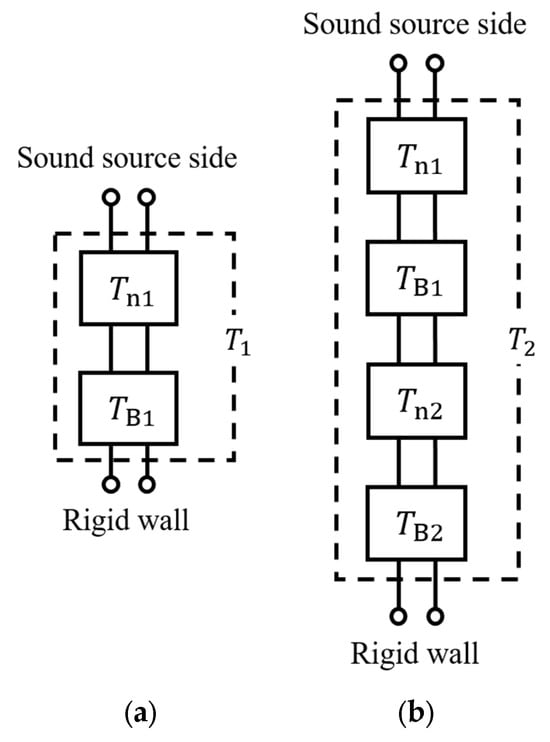
Figure 4.
Equivalent circuits corresponding to test samples: (a) single; (b) double layer.
Each four-terminal network is cascaded from the sound wave incident surface. The transfer matrices of the nonwoven fabric sheets are Tn1 and Tn2, and those of the back airspaces are TB1 and TB2.
3.2. Transfer Matrix Based on One-Dimensional Wave Equation
For plane wave propagation in the current samples, the transfer matrix is described by the one-dimensional wave equation. Let p1 and u1 denote the sound pressure and particle velocity at the incident surface of the sound wave, respectively. At the end face of the sample holder, which acts as a rigid wall, the corresponding sound pressure and particle velocity are represented by p2 and u2, respectively. The cross-sectional area of the sample holder is denoted by S. The transfer matrix T for the sound pressure and volume velocity between the incident and end faces is as follows [14].
where the four-terminal constants A, B, C, and D in the transfer matrix T are expressed by the one-dimensional wave equation as follows:
where γ is the propagation constant, Zc is the characteristic impedance, and l is the length of the acoustic element.
3.3. Transfer Matrices for Nonwoven Fabric Sheets
The nonwoven fabric sheet is treated as a porous material and represented by a transfer matrix. The propagation constants γn1 and γn2 and characteristic impedances Zn1 and Zn2 of each nonwoven sheet are expressed using the Rayleigh model [7] as follows:
where j is the imaginary unit, and σn1 and σn2 are the flow resistivities of each nonwoven sheet.
The transfer matrices Tn1 and Tn2 for each nonwoven sheet were obtained by substituting Equations (5)–(8) into Equation (4) as follows.
where Sn1 and Sn2 are the areas of each nonwoven sheet, and tn1 and tn2 are the thicknesses of each nonwoven sheet.
3.4. Transfer Matrices for Back Airspace
The transfer matrices TB1 and TB2 for each back airspace can be expressed by neglecting attenuation in the transfer matrices based on the one-dimensional wave equation in Equation (4) as follows.
where k is the wave number, ρ is the density of air, c is the speed of sound in air, and L1 and L2 are the lengths of each air space.
3.5. Entire Transfer Matrix and Sound Absorption Coefficient
The overall transfer matrix of the acoustic system was obtained by sequentially multiplying the transfer matrices of individual components, starting from the sound wave incident side. For instance, as illustrated in Figure 4a, when Tn1 and TB1 are connected in series from the incident side, the transfer matrix T1 representing the entire acoustic system is determined by:
When Tn1, TB1, Tn2, and TB2 are connected in order from the sound wave incident side (Figure 4b), the transfer matrix T2 of the entire acoustic system is as follows.
The sound absorption coefficient for transfer matrices T1 and T2 were calculated. The four terminal constants of T1 and T2 corresponded to the four terminal constants A, B, C, and D of the transfer matrix T in Equation (3). Owing to the condition of the terminal rigid wall, u2 = 0, and Equation (3) is expressed as
The specific acoustic impedance Z of the acoustic system, as viewed from the plane of incidence, is determined by
where p = p1, and Su1 = Su. The specific acoustic impedance Z is expressed as
Here, the relationship between Z and the reflectance R is as follows:
The sound absorption coefficient α is expressed using R as follows:
4. Comparison of Experimental and Theoretical Values
4.1. Sensitivity Analysis of Sound Absorption Coefficient with Additional Nonwoven Fabric Sheet Position and Ventilation Resistance
Figure 5a–d, Figure 6a–d, and Figure 7a–d show the sensitivity analysis results on the position of the additional nonwoven fabric sheet and ventilation resistance. As shown in Figure 5, Figure 6 and Figure 7, the position at which the nonwoven fabric sheet is added was varied. Figure 5, Figure 6 and Figure 7 show the theoretical values corresponding to Figure 3b, Figure 3c and Figure 3d, respectively. For Figure 5, Figure 6 and Figure 7, the ventilation resistances and thicknesses corresponding to RW2100, 3A01A, 3701B, and 3A51AD, respectively, were used for the nonwoven fabric sheets on the incident surfaces.
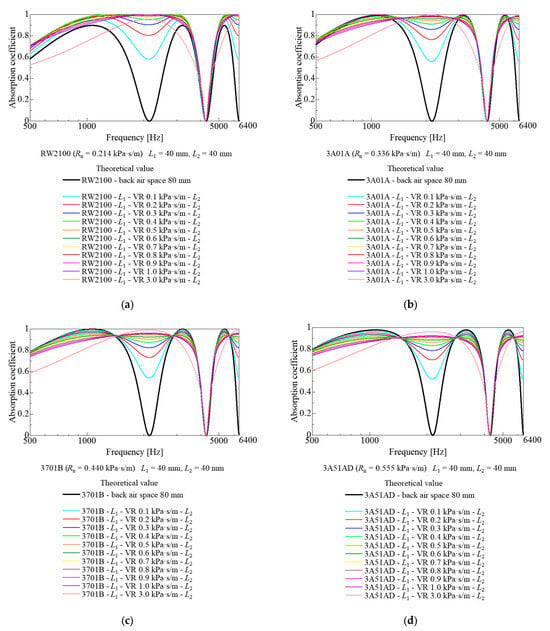
Figure 5.
Sensitivity analysis by ventilation resistance (VR) of lower nonwoven fabric sheet (L1 = airspace, 40 mm; L2 = back airspace, 40 mm): (a) RW2100; (b) 3A01A; (c) 3701B; (d) 3A51AD on the upper layer.
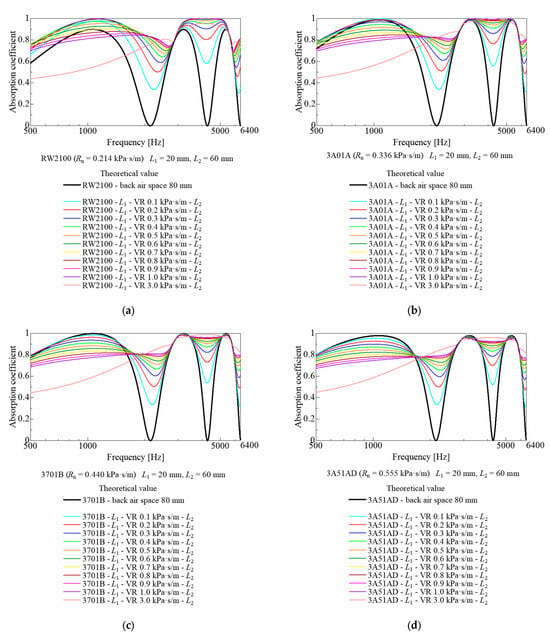
Figure 6.
Sensitivity analysis by ventilation resistance (VR) of lower nonwoven fabric sheet (L1 = airspace, 20 mm; L2 = back airspace, 60 mm): (a) RW2100; (b) 3A01A; (c) 3701B; (d) 3A51AD on the upper layer. VR (Ventilation Resistance).
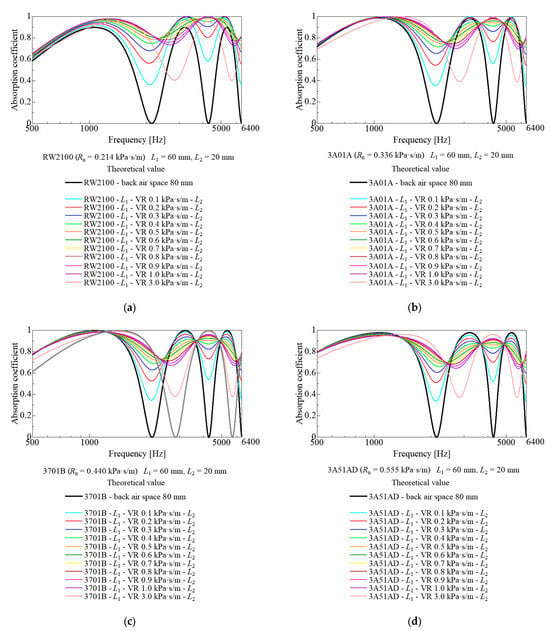
Figure 7.
Sensitivity analysis by ventilation resistance (VR) of lower nonwoven fabric sheet (L1 = airspace, 60 mm; L2 = back airspace, 20 mm): (a) RW2100; (b) 3A01A; (c) 3701B; (d) 3A51AD on the upper layer. VR (Ventilation Resistance).
The sound absorption coefficient curves in Figure 5 show that the first-order sound absorption dip can be effectively eliminated for the four types of upper-layer nonwoven fabric sheets. Figure 5 also shows almost no decrease in the sound absorption coefficient of the first-order sound absorption peak. Thus, the additional nonwoven sheet prevented deterioration in the sound absorption characteristics. In addition, under the conditions shown in Figure 5, it is estimated that the second-order sound absorption dip frequency remained since the nonwoven sheet was added at the position where the particle velocity at the first-order sound absorption dip frequency was at its maximum, as shown in Figure 3b. The second-order sound absorption dip remained in the theoretical values shown in Figure 5. An increase in ventilation resistance improves the first-order sound absorption dip. However, when the ventilation resistance exceeds a certain threshold, the sound absorption curve converges with that of a 40 mm back air layer with only a single nonwoven fabric sheet, as the additional nonwoven fabric sheet effectively functions as a rigid wall.
The sound absorption coefficient curves shown in Figure 6 show that adding a nonwoven sheet at 3/4 wavelength of the second-order sound absorption dip frequency from the rigid wall improved the first- and second-order sound absorption dips, although to obtain a sufficient improvement effect, the ventilation resistance of the nonwoven sheet to be added should be increased to an extent. However, with an increase in the ventilation resistance of the added nonwoven sheet, the sound absorption coefficient of the first-order sound absorption peak, which is the sound absorption effect of the nonwoven sheet on the sound wave incident side, decreased.
Figure 7 show that adding a nonwoven sheet at a 1/4 wavelength of the second-order sound absorption dip frequency from the rigid wall (where the particle velocity is at its maximum) improved the first- and second-order sound absorption coefficient dip and maintained the sound absorption performance achieved when only the nonwoven fabric sheet on the incident side was used.
The dip between the first- and second-order sound absorption coefficients improved when the ventilation resistance was increased to a specific value. However, when the ventilation resistance exceeded a specific value, the impedance of the added nonwoven fabric sheet became excessive (closer to a rigid wall). Furthermore, the sound absorption coefficient approached that of a 60 mm back airspace and only one nonwoven fabric sheet. Sensitivity analysis in a preliminary study has shown that the ventilation resistance of the nonwoven fabric sheet was 0.662 kPa∙s/m when the first-order sound absorption coefficient dip was most improved, irrespective of the nonwoven fabric sheet type on the sound wave incident side.
4.2. Experimental and Theoretical Values Obtained When Nonwoven Fabric Sheets Are Added in the Arrangement Shown in Figure 3b
Figure 8a–d show the experimental and theoretical values of the sound absorption coefficient when a nonwoven fabric sheet is added at 1/4 wavelength of the first-order sound absorption dip frequency from the rigid wall (i.e., the arrangement shown in Figure 3b. Figure 8 shows cases where the nonwoven fabric sheets on the sound wave incident surface are RW2100, 3A01A, 3701B, and 3A51AD, respectively. For each theoretical analysis, the ventilation resistance and thickness of the nonwoven fabric sheet as shown in Table 1 were used. In Figure 8, the line color for each ventilation resistance in the sensitivity analysis of Figure 5 corresponds to the line color for each ventilation resistance of the actual nonwoven sheet, respectively. In the cases shown in Figure 8, the experimental and theoretical values were consistent with each other.
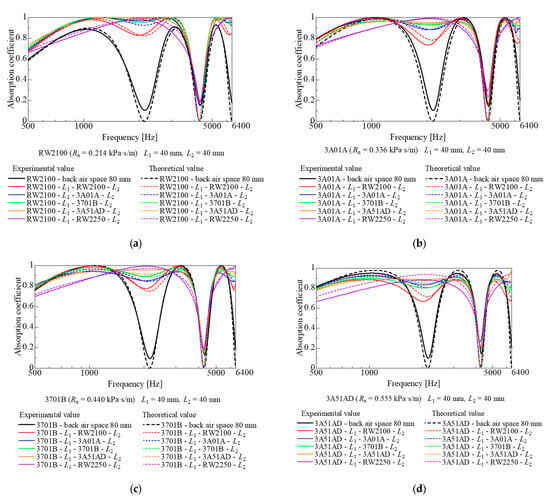
Figure 8.
Comparison of experimental and theoretical values (L1 = airspace, 40 mm; L2 = back airspace, 40 mm): (a) RW2100; (b) 3A01A; (c) 3701B; (d) 3A51AD on the upper layer.
Figure 8 shows that the higher the ventilation resistance of the added nonwoven sheet, the better the improvement in the primary sound absorption dip, regardless of the nonwoven sheet type on the incident surface. This arrangement, however, did not improve the secondary sound absorption dip, as observed in the sensitivity analysis shown in Figure 5.
Thus, only the primary sound absorption dip can be sufficiently removed by adding an appropriate nonwoven fabric sheet in the sample shown in Figure 3b.
4.3. Experimental and Theoretical Values Obtained When Nonwoven Fabric Sheets Are Added in the Arrangement Shown in Figure 3d
Figure 9a–d show the experimental and theoretical values of the sound absorption coefficient when a nonwoven fabric sheet is added at 1/4 wavelength of the second-order sound absorption dip frequency from the rigid wall (i.e., the arrangement shown in Figure 3d). Figure 9 shows cases where the nonwoven fabric sheets on the sound wave incident surface are RW2100, 3A01A, 3701B, and 3A51AD, respectively. In Figure 9, the line color for each ventilation resistance in the sensitivity analysis of Figure 7 corresponds to the line color for each ventilation resistance of the actual nonwoven sheet, respectively.
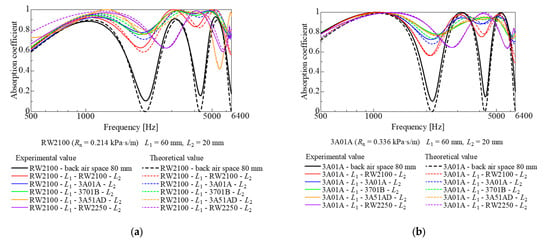
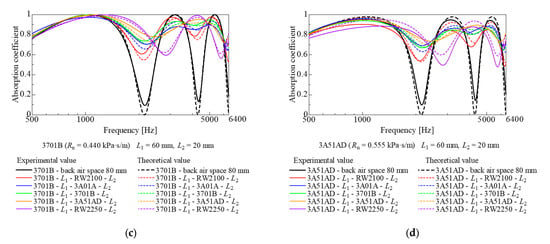
Figure 9.
Comparison of experimental and theoretical values (L1 = airspace, 60 mm; L2 = back airspace, 20 mm): (a) RW2100; (b) 3A01A; (c) 3701B; (d) 3A51AD on the upper layer.
Figure 9a–d show that the higher the ventilation resistance of the added nonwoven sheet, the more improved the sound absorption dip, regardless of the nonwoven sheet type on the incident surface, even in the combination shown in Figure 3d. In addition to the primary sound absorption dip, the secondary sound absorption dip was observed to have been eliminated. This is because the nonwoven fabric sheet was added at the position of the maximum particle velocity at the second-order sound absorption dip frequency. Furthermore, the position where the nonwoven fabric sheet was added was where the particle velocity was relatively high at the first-order sound absorption dip frequency.
When RW2250, a nonwoven fabric sheet with relatively high ventilation resistance, was added, as shown in the sensitivity analysis in the preceding section, the sound absorption coefficient was close to that of a 60 mm back airspace and only one nonwoven fabric sheet. This is because the impedance of the added nonwoven fabric sheet was large; thus, the reflectance increased according to Equation (8). This was thought to reduce the volume velocity on the surface of the nonwoven fabric sheet. Thus, it was difficult for the sound-absorbing effect of the added nonwoven fabric sheet to be apparent.
The sensitivity analysis in the preliminary study showed that the ventilation resistance of the added nonwoven fabric sheet of 0.662 kPa·s/m was the most capable of eliminating the sound absorption dip. Of the nonwoven fabric sheets used, the experimental values for 3A51AD, the nonwoven fabric sheet with a ventilation resistance closest to 0.662 kPa∙s/m, had the broadest sound absorption coefficient compared with the results for other nonwoven fabric sheets.
5. Conclusions
To improve the sound absorption dip in a nonwoven sheet with a back air space, another nonwoven sheet was added to divide the air space into layers, considering the particle velocity distribution in the air space. Comparisons between the theoretical and experimental values obtained in this case led to the following conclusions.
The sound absorption dip was improved by adding a nonwoven fabric sheet at an appropriate position, considering the particle velocity distribution.
The sound absorption dip of the first order was improved by placing a nonwoven sheet at a position half the thickness of the back air space. However, the sound absorption dip of the second order did not improve theoretically, and such a result was obtained during the experiment.
It was theoretically predicted that placing the nonwoven sheet at 1/4 of the back air space thickness from the rigid wall would improve the first- and second-order sound absorption dips. By selecting the conditions, a similar trend was observed during the experiments.
The higher the ventilation resistance of the added nonwoven fabric sheet, the more improved the sound absorption dip. Although above a certain ventilation resistance, the effect became less pronounced.
Sensitivity analysis can predict to an extent which nonwoven fabric sheets with which parameters are suitable for improving the sound absorption dip.
Author Contributions
Conceptualization, S.S.; data curation, G.M., Y.N., K.K. and N.T.; formal analysis, K.S. and G.M.; project administration, S.S.; software, K.S., Y.N., K.K. and N.T.; supervision, S.S. All authors have read and agreed to the published version of the manuscript.
Funding
This research received no external funding.
Data Availability Statement
Data are contained within the article.
Acknowledgments
Idemitsu Kosan Co., Ltd. and Toyobo Co., Ltd. provided the nonwoven fabric sheets used in this study. The authors appreciate their support.
Conflicts of Interest
The authors declare no conflicts of interest.
References
- Delany, M.E.; Bazley, E.N. Acoustic properties of fibrous absorbent materials. Appl. Acoust. 1970, 3, 105–116. [Google Scholar] [CrossRef]
- Sakagami, K.; Kiyama, M.; Morimoto, M.; Takahashi, D. Sound absorption of a cavity-backed membrane: A step towards design method for membrane-type absorbers. Appl. Acoust. 1996, 49, 237–247. [Google Scholar] [CrossRef]
- Sakagami, K.; Kiyama, M.; Morimoto, M.; Takahashi, D. Detailed analysis of the acoustic properties of a permeable membrane. Appl. Acoust. 1998, 54, 93–111. [Google Scholar] [CrossRef]
- Sakamoto, S.; Iizuka, R.; Nozawa, T. Effect of sheet vibration on the theoretical analysis and experimentation of nonwoven fabric sheet with back air space. Materials 2022, 15, 3840. [Google Scholar] [CrossRef] [PubMed]
- Sakamoto, S.; Nozawa, T.; Sato, K. Nonwoven fabric sheet with back air space serving as Helmholtz resonator. Noise Control. Eng. J. 2024, 72, 37–50. [Google Scholar] [CrossRef]
- Everest, F.A. Absorption of sound. In The Master Handbook of Acoustics, 4th ed.; McGraw-Hill: New York, NY, USA, 2001; p. 195. ISBN 0-07-136097-2. [Google Scholar]
- Rayleigh, J.W.S. The Theory of Sound, 2nd ed.; Dover: New York, NY, USA, 1945. [Google Scholar]
- Miki, Y. Acoustical properties of porous materials-modifications of Delany-Bazley models. J. Acoust. Soc. Jpn. 1990, 11, 19–24. [Google Scholar] [CrossRef]
- Komatsu, T. Improvement of the Delany-Bazley and Miki models for fibrous sound-absorbing materials. Acoust. Sci. Technol. 2008, 29, 121–129. [Google Scholar] [CrossRef]
- Kuttruff, H. Room Acoustics, 5th ed.; Spon Press: London, UK, 2009. [Google Scholar]
- Suzuki, H.; Omoto, A.; Fujiwara, K. Treatment of boundary conditions by finite difference time domain method. J. Acoust. Soc. Jpn. 2007, 28, 16–26. [Google Scholar] [CrossRef]
- Ferreira, N.; Hopkins, C. Using finite-difference time-domain methods with a Rayleigh approach to model low-frequency sound fields in small spaces subdivided by porous materials. J. Acoust. Soc. Jpn. 2013, 34, 332–341. [Google Scholar] [CrossRef]
- ISO 10534-2: 1998; Acoustics—Determination of Sound Absorption Coefficient and Impedance in Impedance Tubes—Part 2: Transfer-Function Method. International Standard: Geneva, Switzerland, 1998.
- Suyama, E.; Hirata, M. The four terminal matrices of tube system based on assuming of plane wave propagation with frictional dissipation: Acoustic characteristic analysis of silencing systems based on assuming of plane wave propagation with frictional dissipation part 2. J. Acoust. Soc. J. 1979, 35, 165–170. (In Japanese) [Google Scholar] [CrossRef]
Disclaimer/Publisher’s Note: The statements, opinions and data contained in all publications are solely those of the individual author(s) and contributor(s) and not of MDPI and/or the editor(s). MDPI and/or the editor(s) disclaim responsibility for any injury to people or property resulting from any ideas, methods, instructions or products referred to in the content. |
© 2025 by the authors. Licensee MDPI, Basel, Switzerland. This article is an open access article distributed under the terms and conditions of the Creative Commons Attribution (CC BY) license (https://creativecommons.org/licenses/by/4.0/).