Article

The Adjusting Effects of Trees on Cfa-Climate Campus Acoustic Environments and Thermal Comforts in the Summer

1
School of Civil Engineering and Architecture, Southwest University of Science and Technology, Mianyang 621010, China
2
China Southwest Architectural Design and Research Institute Co., Ltd., Chengdu 610000, China
3
School of Literature and Arts, Southwest University of Science and Technology, Mianyang 621010, China
*
Author to whom correspondence should be addressed.
Acoustics 2024, 6(4), 887-910; https://doi.org/10.3390/acoustics6040050
Submission received: 26 June 2024 / Revised: 26 September 2024 / Accepted: 3 October 2024 / Published: 16 October 2024
(This article belongs to the Special Issue Acoustical Comfort in Educational Buildings)

Abstract

:
This study explores the effects of trees on the acoustic and thermal environment in addition to people’s responses to trees in different contexts. Through field measurements conducted during the summer of 2023 at the campus of the Southwest University of Science and Technology in Mianyang, residents’ neutral points were locally found to be 52.2 dBA (acoustic) and 23.8 °C (thermal). Further, at their maximum, the trees were able to reduce heat stress by 4 °C (indicated by the physiologically equivalent temperature—PET) and the noise level by 10 dBA (indicated by the A-weighted sound pressure—LAeq); this was achieved by trees with a crown diameter of 20 m. Subjective acoustic and thermal responses varied depending on the context. Acoustically, their neutral LAeq values toward the sounds of traffic, teaching, sports, and daily life were 46.9, 52.5, 51.0, and 52.7 dBA, respectively. Thermally, pedestrians’ neutral PET values were 24.2, 26.1, 22.3, and 25.1 °C, respectively, under the same conditions. These phenomena might be a consequence of the effects of sound frequencies. Future urban forestry research should focus on planting for environmental quality improvement.

1. Introduction

A comfortable outdoor environment regulates people’s moods and has a positive impact on mental health [1]. Poor environmental quality, in contrast, severely negatively affects people’s lives [2]. This includes various physical factors [3], including thermal and acoustic environments [4]. Extremely hot and/or noisy environments affect subjects psychologically [5], physically [6], and perceptively [7]. Therefore, determining ways to address these problems is crucial. Scholars have confirmed that vegetation significantly affects heat [8] and sound pressure [9] mitigation.
The positive influences of vegetation (especially trees) are multifaceted. Trees reduce the temperature of the surrounding area [10] through evapotranspiration, shade, and heat radiation absorption or reflection [11]. Further, they regulate urban microclimates to improve outdoor thermal comfort (OTC) [12]. Their positive effects can be expressed as various thermal indices, including the air temperature (Ta) [13], the universal thermal climate index (UTCI) [14], mean radiant temperature (MRT) [15], and physiologically equivalent temperature (PET) [16]. This is also evidenced by the reduction in subjective stress, i.e., the reduction in the thermal sensation vote (TSV) [8]. Additionally, their effects on acoustic environments should not be ignored [17]; densely planted trees can mitigate noise very effectively [18]. Moderately dense roadside vegetation reduces traffic noise by 9–11 dBA [19]. The tree height, canopy size, and species affect the degree of noise reduction [20], a fact that has been confirmed in thermal environment studies [21].
Subjects are sensitive to different stimuli and respond differently to variations in these factors; standards have been proposed to evaluate these—ISO 7730 [22] and ASHRAE [23]. Thermal and acoustic sensations are usually evaluated using the thermal sensation vote (TSV) and acoustic sensation vote (ASV). They are usually linearly correlated with the environment indices. For instance, increasing LAeq from 60 to 80 dBA causes an ASV decline of about 0.8; the opposite trend is observed in the TSV [24]. This leads to neutral points of around 70 dBA (acoustic) and 22 °C (thermal), which are points where respondents are sensitive-free. The subjective responses also have mutual influences. People’s thermal perceptions vary with noise levels. Zhen, et al. [25] found that in Xi’an during spring, when the PET was 21 °C, people felt cold in the LAeq range of 45–50 dBA, yet their perception was neutral if the environment was 5 dBA louder.
The adjustment effect of trees on the environmental quality and factors affecting subjective perceptions has been broadly studied in recent years. The discoveries have been helpful in improving the environment. Nevertheless, the discoveries have only been partially investigated. Most earlier studies focused on one aspect of environmental quality factors, e.g., thermal stress [26] and noise mitigation [27]; however, these should be investigated in combination. This study attempted to investigate physical factors that adjust the environment in multiple aspects. The entire study follows these steps:
  • A well-forested area is found as the sample for investigating vegetation effects on environment quality and subjective sensations towards them;
  • A few points (sites) are chosen around the area with certain properties for field surveys (measurement);
  • The environmental qualities and physical characteristics of all selected points are measured, and subjective responses towards the current environment quality are collected through questionnaires;
  • Data of various aspects are associated with each other to determine their interactive statistical correlations;
  • Proper strategies in urban planning and forestry are proposed for improving local environment quality and subjective comfort levels.

2. Methodology

2.1. Study Area

This study was conducted in Mianyang (30° N, 103° E), northwest Sichuan, China. It is the second largest city in Sichuan. According to the Köppen Climate Classification, Mianyang is a city in the Cfa climate zone, which refers to a subtropical humid monsoon climate [28]. Summers are hot and rainy, while winters are dry and cold. The average monthly temperatures throughout the year range from 0 °C to 18 °C, and the average temperature of the hottest month exceeds 22 °C. The four seasons are significantly distinguishable year-round [29]. Mianyang has experienced rapid economic development, but has also experienced various environmental problems, such as increased noise pollution [30].

2.2. Site Selection

The environmental quality is defined by various parameters, including physical factors [31] and chemistry [32]. Poor acoustic [4] and thermal [33] environments are directly and seriously affecting humans’ living quality, inducing physiological and psychological stress. Their impacts are hard to control in outdoor spaces. Therefore, in this study, these two aspects of environmental quality were selected for further analysis. This study conducted field surveys at the campus of the Southwest University of Science and Technology in China (SWUST). This campus was selected because a large number of students could participate in the questionnaire. Further, these sites are significantly affected by poor thermal and/or acoustic conditions (with various types of noise).
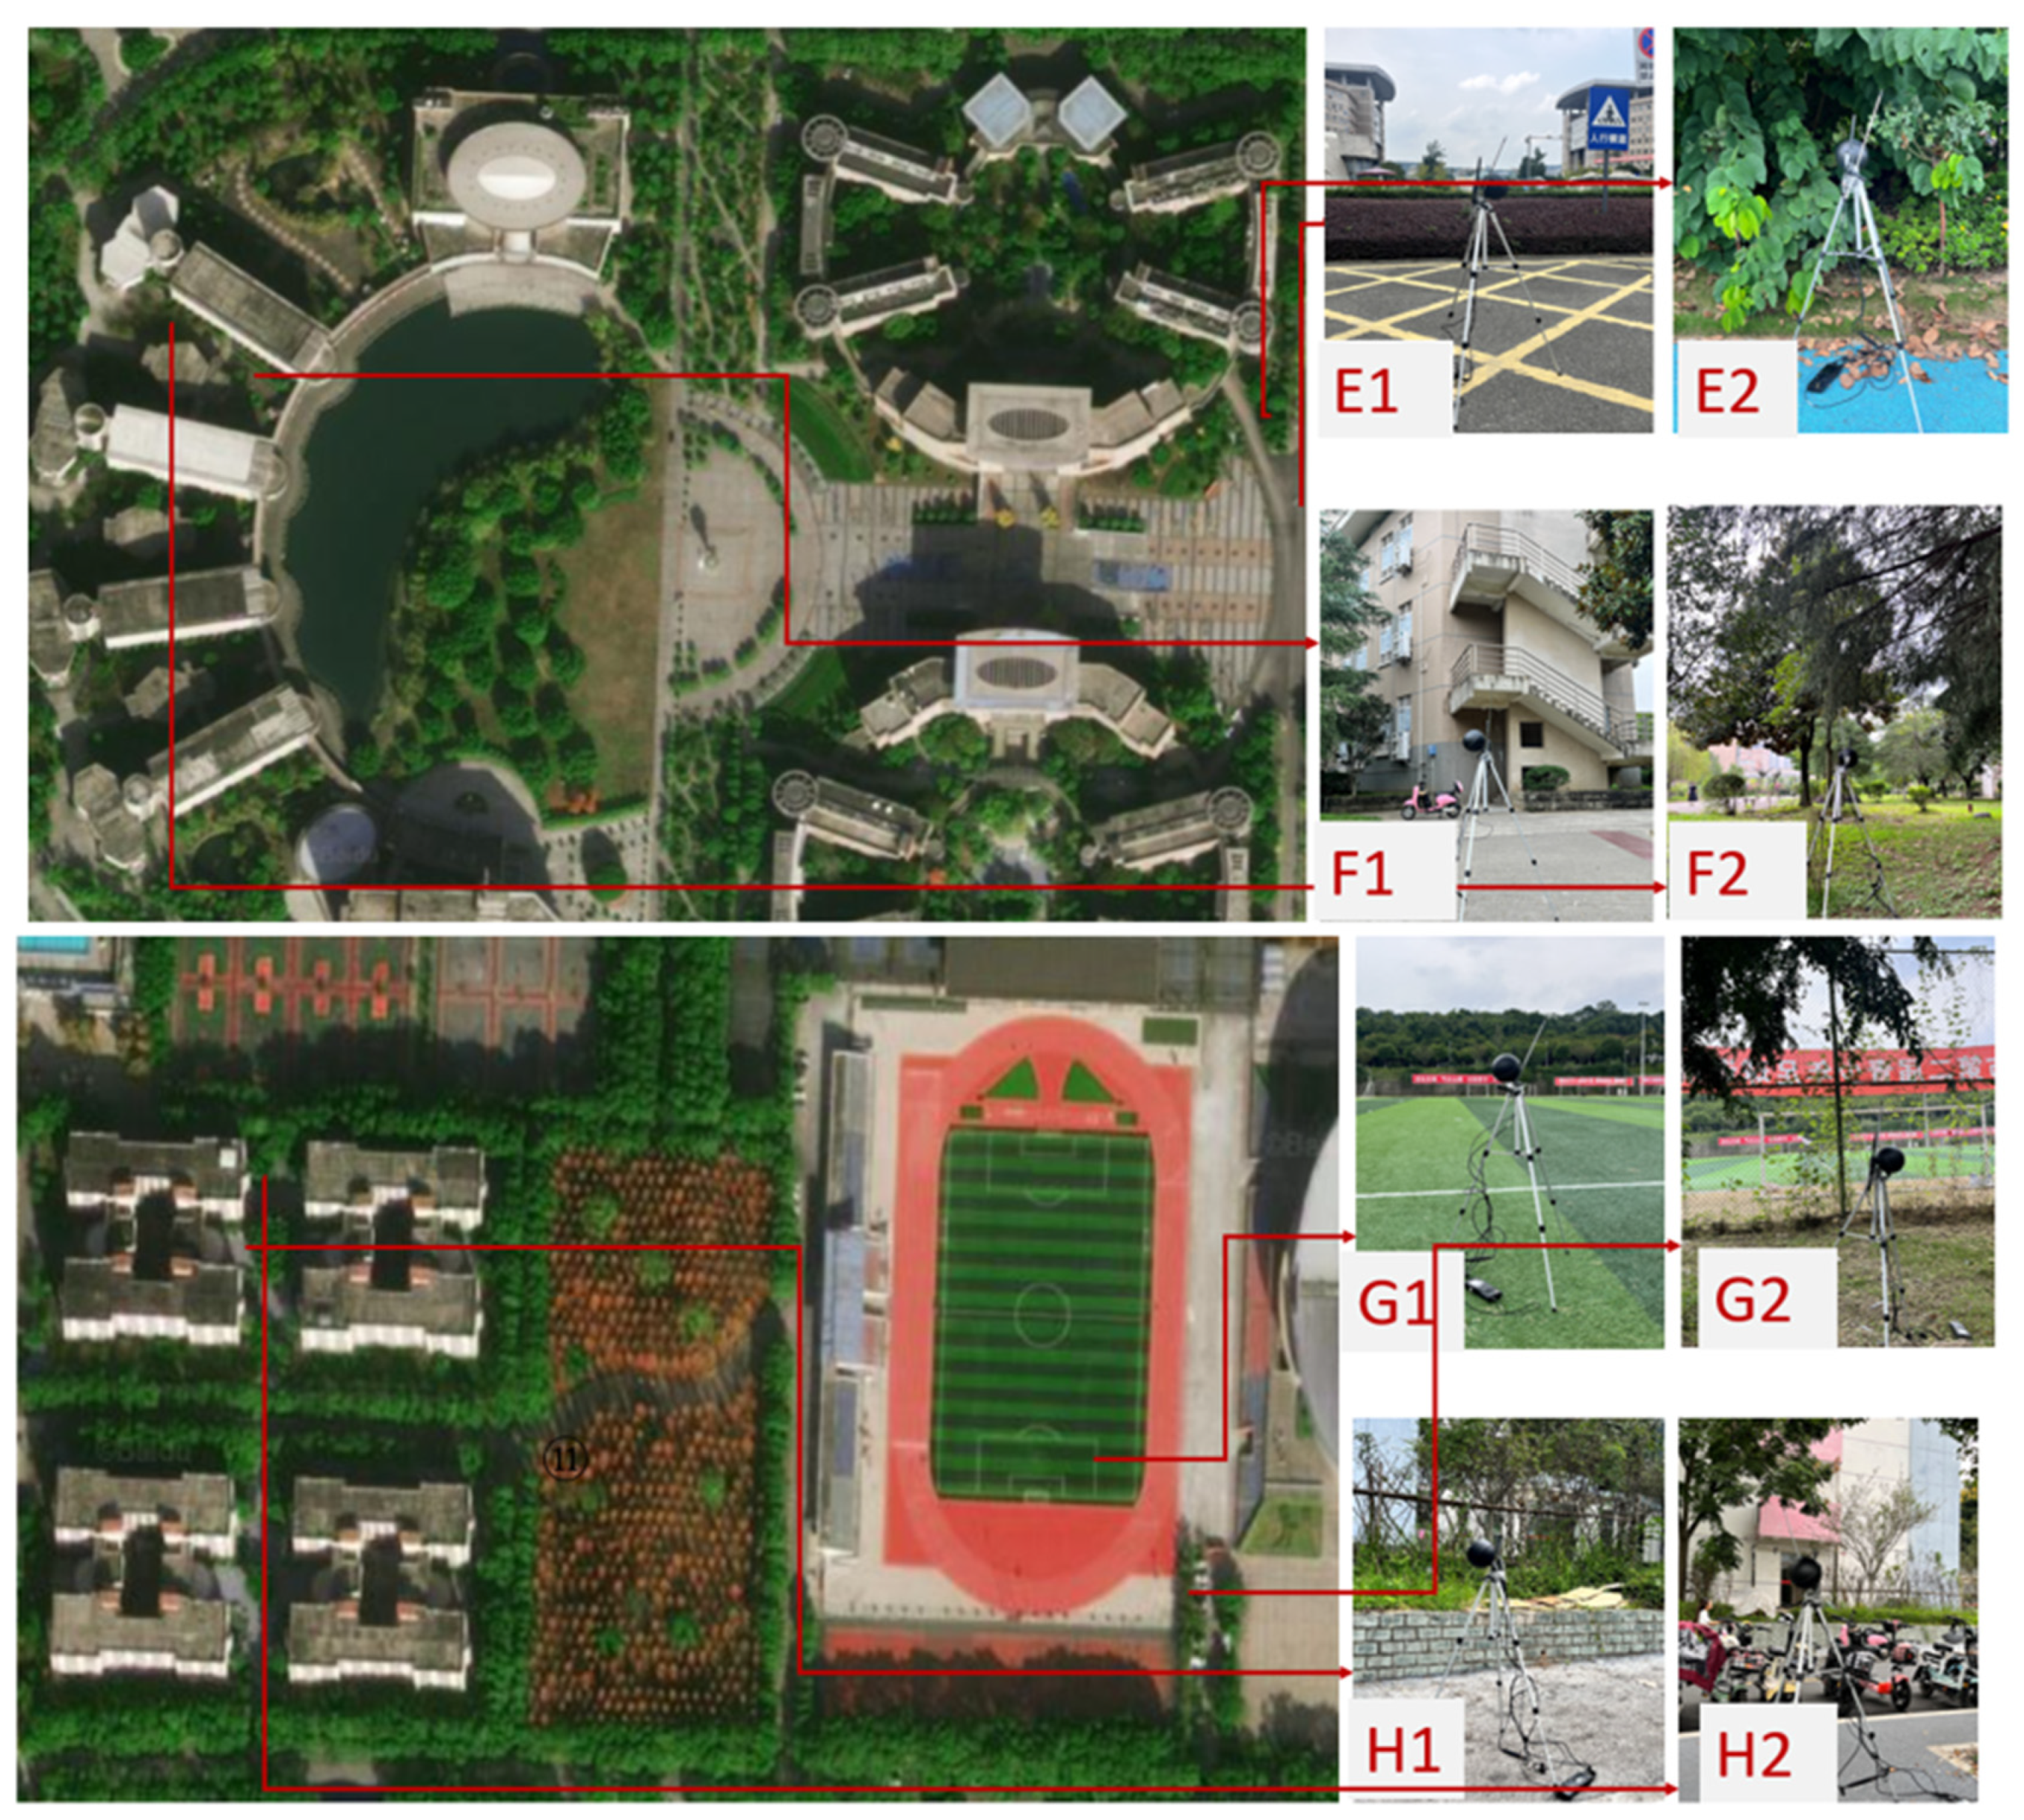
The campus of SWUST comprises two zones—the West Zone (WZ) and the East Zone (EZ). They differ in terms of landform and altitude, leading to different environmental properties. Four sites in each zone were selected as samples, yielding a total of eight sites (defined as A to H; Figure 1 and Figure 2). They were selected considering (surrounding) land use, including nearby expressways, student residences, education buildings, and sports fields. This caused various acoustic backgrounds to be surveyed (traffic, education, campus life, and sports). There were two nearby subpoints at each site measured simultaneously; one was under a tree and the other was in an open space. They were defined as Subpoint 1 (open) and Subpoint 2 (tree-canopied), respectively, as shown in Figure 1 and Figure 2. Different acoustic and thermal environments exist at each subpoint due to the effects of trees. Therefore, pedestrians at Subpoints 1 and 2 would have different perceptions towards both sound and heat.

2.3. Environmental Quality Parameters

This study involved two aspects of environmental quality—acoustic and thermal environments, which are defined as environmental quality in physics (EQP). There were a vast number of indicators available; in this study, PET and LAeq were selected.

2.3.1. Thermal Environment

Thermal comfort is affected by a variety of climatic factors, including the air temperature (Ta), wind speed (Va), relative humidity (RH), globe temperature (Tg), etc. Meteorological sensors were used to collect these parameters, which can be used for mean radiant temperature (MRT) calculation (Equation (1)) [34].
MRT = [ ( T g + 273.15 ) 4 + ( 1.10 × 10 8 v 0.6 ) ( T g T a ) D 0.4 ] 1 / 4 273.15
where Tg, Ta, and Va refer to the globe temperature (°C), air temperature (°C), and wind speed (m/s); D and ε are the diameter of the globe (0.15 m) and the emissivity (0.95). The calculated MRT is used to determine the physiologically equivalent temperature (PET) in the RayMan model [35], which is frequently used as an OTC index [36]. The cooling intensities of canopied sites were expressed by ΔPET, which is defined as the difference in the PET between two nearby subpoints. Generally, the proportions of trees had an effect on ΔPET [37]. People were found to be sensitive to PET; an increase from 25 to 45 °C caused the TSV to increase from 0 to 3 [38]. Trees with larger crowns could reduce PET by around 10 °C (with a ΔPET of around 10 °C [39]).

2.3.2. Sound Environment

The acoustic environment significantly affects pedestrian comfort [1]. Noise could arise due to industry, construction, traffic, and daily life [40]. Irregular vibrations and sounds above a certain threshold act as noises affecting pedestrians’ perceptions in many aspects, such as their psychology [41]. Sound is generally evaluated in terms of the sound pressure level (decibel level, dB). The A-weighted equivalent continuous sound pressure level (LAeq dBA [42]) is often used in this field, and can be calculated using Equation (2) [43].
LAeq = 10 log 1 T 0 T   ( P t P 0 ) 2 dt
where LAeq is the A-weighted equivalent continual sound (dBA), T is the time at which a particular sound is played (s), and Pt and P0 refer to the equivalent continual sound (dBA) and the time at which a particular sound is played at the reference sound pressure (20 Pa), respectively [25].
Additionally, the frequency of the sound also varies [44], and is a result of the properties of various sound sources. Each type of sound has a certain frequency range that depends on the voicing resources. For simplicity, they are defined as high-, medium-, and low-frequency sounds. They might lead to perceptions despite similar LAeq values, which is explained in Figure 3.1-4 and Figure 3.1-5 in [45]. Usually, traffic noise is medium-frequency [46], while daily living, sports, and conversations have lower frequencies [47]. Furthermore, materials can absorb or reflect sounds according to their own acoustic properties, evaluated by the acoustic absorption coefficient (AAC) [48], which varies with the sound frequency [49]. Therefore, the effects of underlying surfaces (grass, concrete, asphalt pavement, and plastic runway) could be determined, and are shown in Figure 1 and Figure 2, and Table 1. Previous studies have confirmed that subjective acoustic perceptions vary with different noise types. This might result from variations in their frequencies. Vegetation was found to have an effect, owing to acoustic absorption or reflection. Hence, sites canopied by trees might be quieter. The sound reduction effects of trees were evaluated by the LAeq differences (ΔLAeq) between two nearby subpoints.

2.3.3. Physical Properties of Sites Affecting Environmental Quality

Trees provide up to 70% of cooling through shading [50]. They intercept short-wave radiation from the sun by absorbing, reflecting, and transmitting through leaves [51]. In general, one layer of leaves can absorb 80% of visible radiation; the more layers of leaves a tree has, the more solar radiation it can intercept [52]. Several factors affect the cooling performances of trees. The tree crown diameter (TCD) and leaf area index (LAI) are relatively cooling/acoustic-significant [21]. Therefore, this paper utilises them as tree indicators.
Land surface cover affects the EQP in several ways. Thermally, materials were able to absorb and reflect heat radiation, causing temperature changes. This phenomenon is evaluated using albedo [53]. Sites with higher albedo conserve less heat, mitigating additional temperature increases. Acoustically, surface materials adjust the EQP by absorbing and/or reflecting sound, which is evaluated by AAC. Substances with higher AACs consume more sound energy, relatively reducing sound pressure. This is a branch of building physics [54].
For sites canopied by trees, the openness was significantly correlated with the tree crown size. Nevertheless, sample sites in this study had different land uses, such as for compact teaching buildings and open sports fields. They have different obstructions blocking the sky in addition to trees, causing variations. The sky view factor (SVF) was used to compensate for this. The SVF refers to the visible ratio of the sky in the hemisphere above the ground, ranging from 0 (fully canopied) to 1 (totally open). This parameter is usually supportive of forestry and agriculture studies. Recently, it has been frequently used in OTC studies. Values of SVF can be calculated via the WinSCANOPY [55] software (version 2017a), as shown in Table 1. In addition to summarising the SVF values, Table 1 also includes the albedo and absorption coefficients corresponding to each measurement point. A material surface with a higher albedo lead to lower temperatures [56]. Further, there might be differences in the SVF between the two calculated subpoints shown in Figure 3. SVF also has a significant impact on environmental quality and comfort, such as the OTC [57].

2.4. Field Measurement

The field measurements were carried out on sunny summer days (late July and early September 2023). August was avoided since very few students stayed on campus during the summer vacation. Two subpoints were measured each day. The measuring time was from 9:00 to 20:00 every day. The instruments were installed referencing the ASHRAE [23] and ISO 7730 [22] (the instrument was aimed at the subject’s head, 1.5 m above the ground and data were collected every 1 m). EQP parameters collected thermally included Ta, RH, wind speed (Va), and globe temperature (Tg), and those collected acoustically included the A-weighted sound pressure level (LAeq). The tree crown diameter (TCD) [21] was measured with a tape measure. The sensor properties of the instruments are shown in Table 2.
Subjects responded differently to various EQPs. Questionnaires were administered simultaneously during measurement. Subjective data about current sensations and the factors that influenced them were collected. People’s sensations towards the environments included the thermal sensation vote (TSV), acoustic sensation vote (ASV), and acoustic comfort vote (ACV). This study used a 7-point scale to assess thermal and acoustic comfort votes [23] and a 5-point scale to assess sound comfort [59]. In addition to the environment, gender, height, weight, age, clothing, and activity were all perceptively influential. Respondents wearing insulations and working loads were defined as ‘clo’ and ‘met’ [60]. They were all considered in the questionnaire, as shown in Box 1 [61]. The fieldwork was conducted on campus, so the volunteers were mostly college students. A total of 1372 questionnaires were collected.
Box 1. Questionnaire survey.
1. What is your current location?
A1 A2; B1 B2; C1 C2; D1 D2; E1 E2; F1 F2; G1  G2; H1 H2;
2. What is current time?
:           ;             dd            mm            yyyy
3. What are you wearing currently?
0.3 clo, Short trousers and short  (T-)shirt/skirt;             0.5 clo, Long trousers and short (T-)shirt;
0.8 clo, Long trousers and thin coat;                               1.0  clo, Long trousers and thick coat;
4. Please tell your gender.
M/F
5. Please tell your body conditions and age
Weight:                    Height:                   age:                  
6. What was your activity condition 10 min  ago?
1.0 Steady sitting;                1.4 Steady  standing;                2.2 Slightly walking;
3.0 Fast walking;                 8.0 Running  / Strong sports
1. What is your current thermal perception  (TSV)?
−3 Cold;     −2 Cool;     −1 Slightly cool;     0 Neutral;     1 Slightly warm;     2 Warm;     3 Hot;
Acoustics 06 00050 i001
2. How is your current perception of sound  (ASV)?
−3 Very  noisy ;  −2 Noisy ;  −1 Slightly noisy ;  0 Reasonable ;  1 Slightly  quieter ;  2 quiet ;  3 Very quiet;
Acoustics 06 00050 i002
  3. What is your current level of sound  comfort (ACV)?
−2 Very Uncomfortable; −1 Uncomfortable; 0  Neutral; 1 Comfortable; 2 Very Comfortable;
            Acoustics 06 00050 i003

2.5. Data Analysis

A few statistical models (multiple linear regression—MLR—and artificial neural network—ANN) were used in this study.
MLR [62] was used to predict the linear correlation between a dependent variable and one or more independent variables, and the correlation data were analysed and processed. People’s perceptions were found to be influenced by the EQP, and the EQP parameters were defined as the independent variables. Responses towards them (TSV, etc.) were the dependent variables. This process was viable to determine people’s neutral temperatures (NTs) and neutral A-weighted sound pressure levels (NLAeq), which implies their thermal/acoustic free points. Their preferred sound conditions (PLAeq) were from ACV. Linear or polynomial regression models were used, depending on practical conditions. A more significant correlation should be selected.
ANN models were used to determine the effects of multiple factors against EQP [63]. There was a broad spectrum of physical factors that influenced EQP. This study utilised cooling and noise mitigation intensities, which are evaluated through ∆PET and ∆LAeq. The adjustment degrees of EQP indicators (ΔPET and ΔLAeq) were calculated using the daily mean values (Subpoint 1 minus Subpoint 2). In the ANN model, the relative and normalised importance (NI) of each variable was reported, and the total importance value of all the variables was summed, yielding a value of 1. The whole model can be divided into three parts—the input layer, the hidden layer, and the output layer [64]. The input layer transmits the data to the hidden layer, which processes the data to determine the final output values. This study analysed ∆PET and ∆LAeq using two different ANN models, each of which has different neurons in the hidden layer, including TCD, ∆SVF, ∆Albedo, and ∆AAC. Factors with higher relative importance are more EQP-adjustable. Additionally, a validation test was required to determine the significances of the models. This was processed by associating the original data with that predicted by ANN models via linear regression independently. Further, the factor with the highest NI value would be further analysed through linear regression. This helped determine the change trends and intensities towards the influencing factor(s).

3. Results

3.1. Data Description

3.1.1. Thermal Comfort Index Ranges of All Subpoints

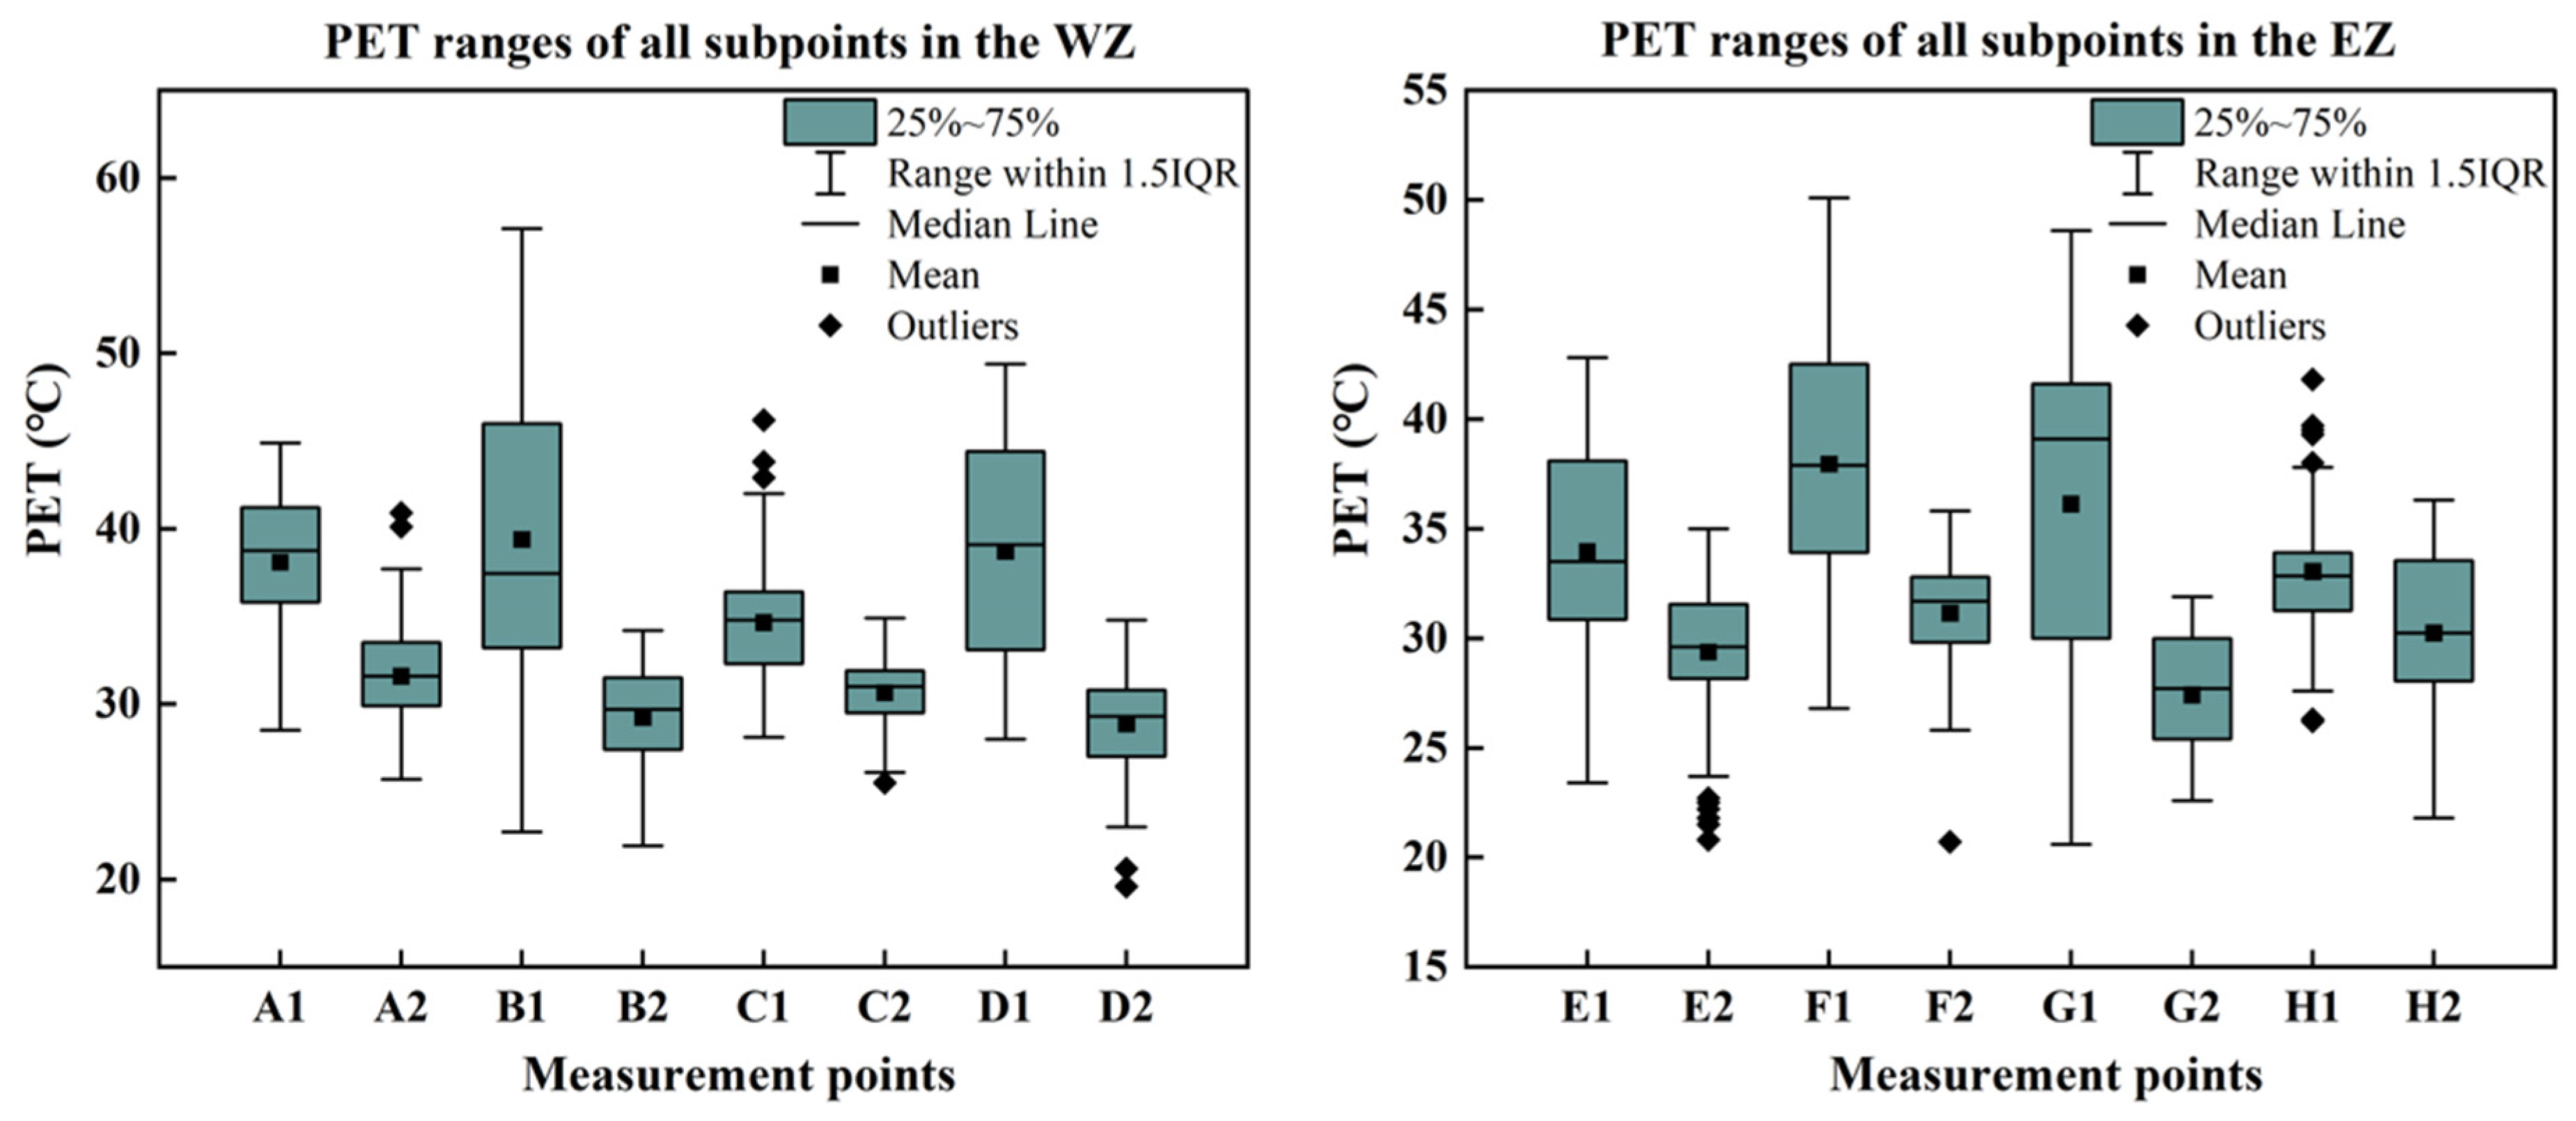
Figure 4 illustrates the daily ranges of PET at all sites. Generally, the PET ranges differed; more noticeable ranges were witnessed at Subpoint 1. Subpoint 1 was warmer than Subpoint 2 at each site. High cooling intensities of trees were found at Sites B, D, and G. PET at Subpoints 1 was higher by approximately 7 °C (B), 10 °C (D), and 13 °C (G) on average.

3.1.2. LAeq Ranges of All Subpoints

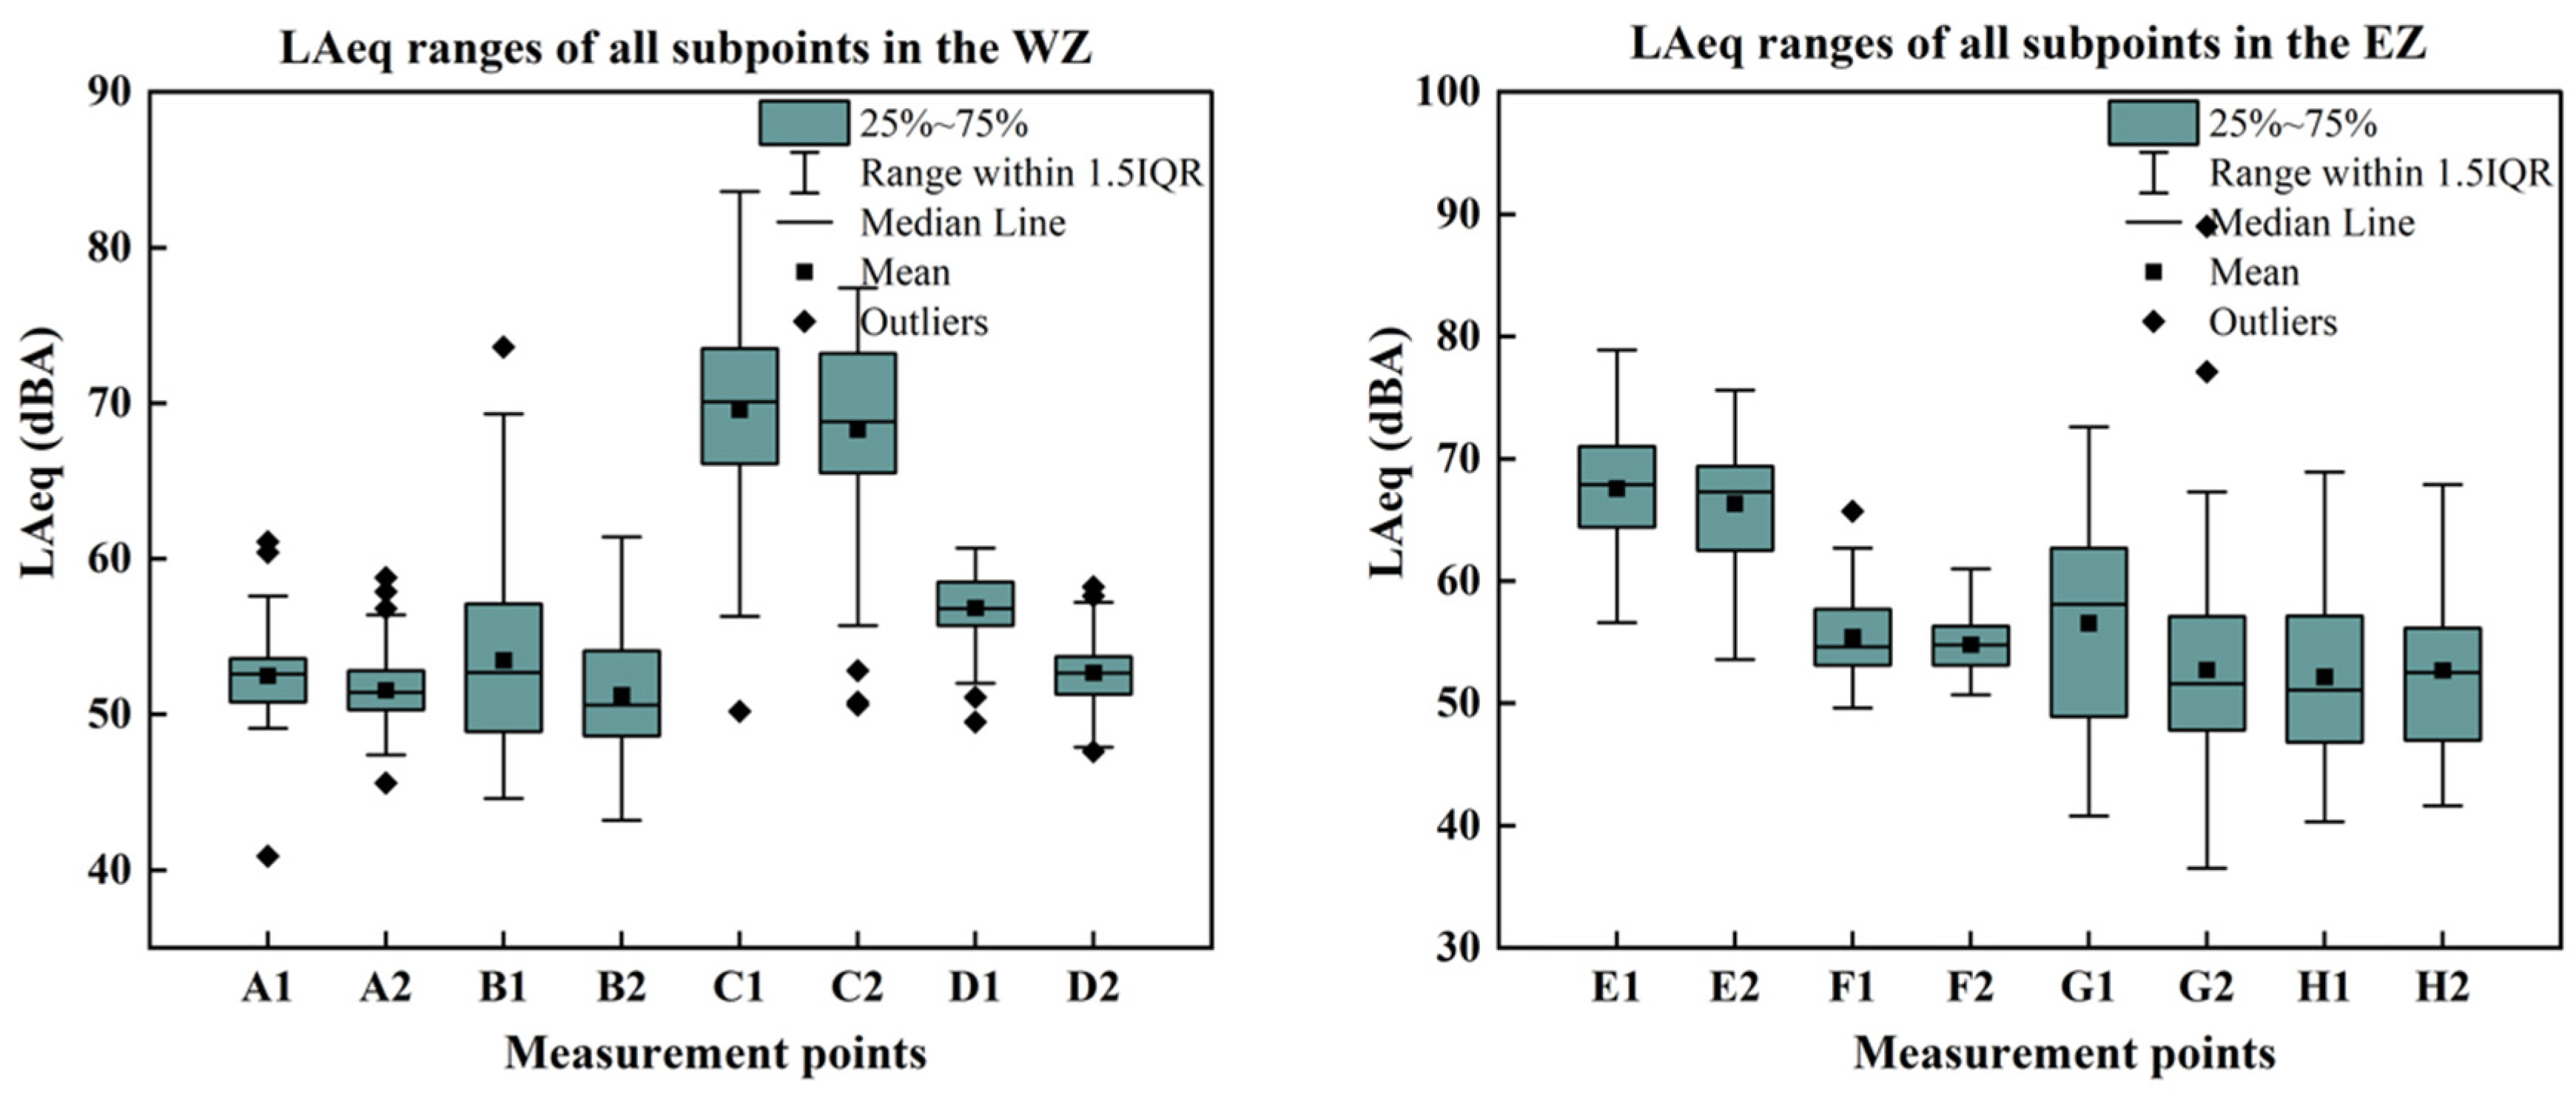
In comparison to PET, LAeq slightly differed between two nearby subpoints, although Subpoint 1 usually had higher values (Figure 5). Sites C and E were the loudest among all in the WZ and EZ, respectively, with maximums at 83 (C1), 75 (C2), 79 (E1), and 76 (E2) dBA. More considerable variation was witnessed at Site C. In addition, a remarkably louder Subpoint 1 emerged at Site D as well, despite it generally being quiet (57 dBA at D1 and 53 dBA at D2, on average). Moreover, the mean values of both F1 and F2 were close to 54 dBA, with insignificant variation. The noise levels of all points varied insignificantly.

3.2. Multiple Analyses for Physical Factors Affecting Environmental Qualities

3.2.1. Artificial Neural Network Models for ΔPET and ΔLAeq

The ΔPET values of all sites were associated with possible physical factors by ANN models, as shown in Table 3. They were crucially correlated (R2 = 0.72 and sig. = 0.00 in reliability tests). It can be seen that TCD had the most essential effects, with an NI of 100%. Additionally, the albedo difference was also significantly influential (NI = 91.7%). The ΔSVF was only slightly impactive.
Factors relating to sounds were analysed. Their statistical correlation was valid (R2 = 0.53 and sig. = 0.00 in the reliability test), as shown in Table 4. Trees still played the most significant role in noise decline (NI = 100%). The rest of the factors were similar (NI = around 40%).

3.2.2. Linear/Polynomial Effects of Significant Factors

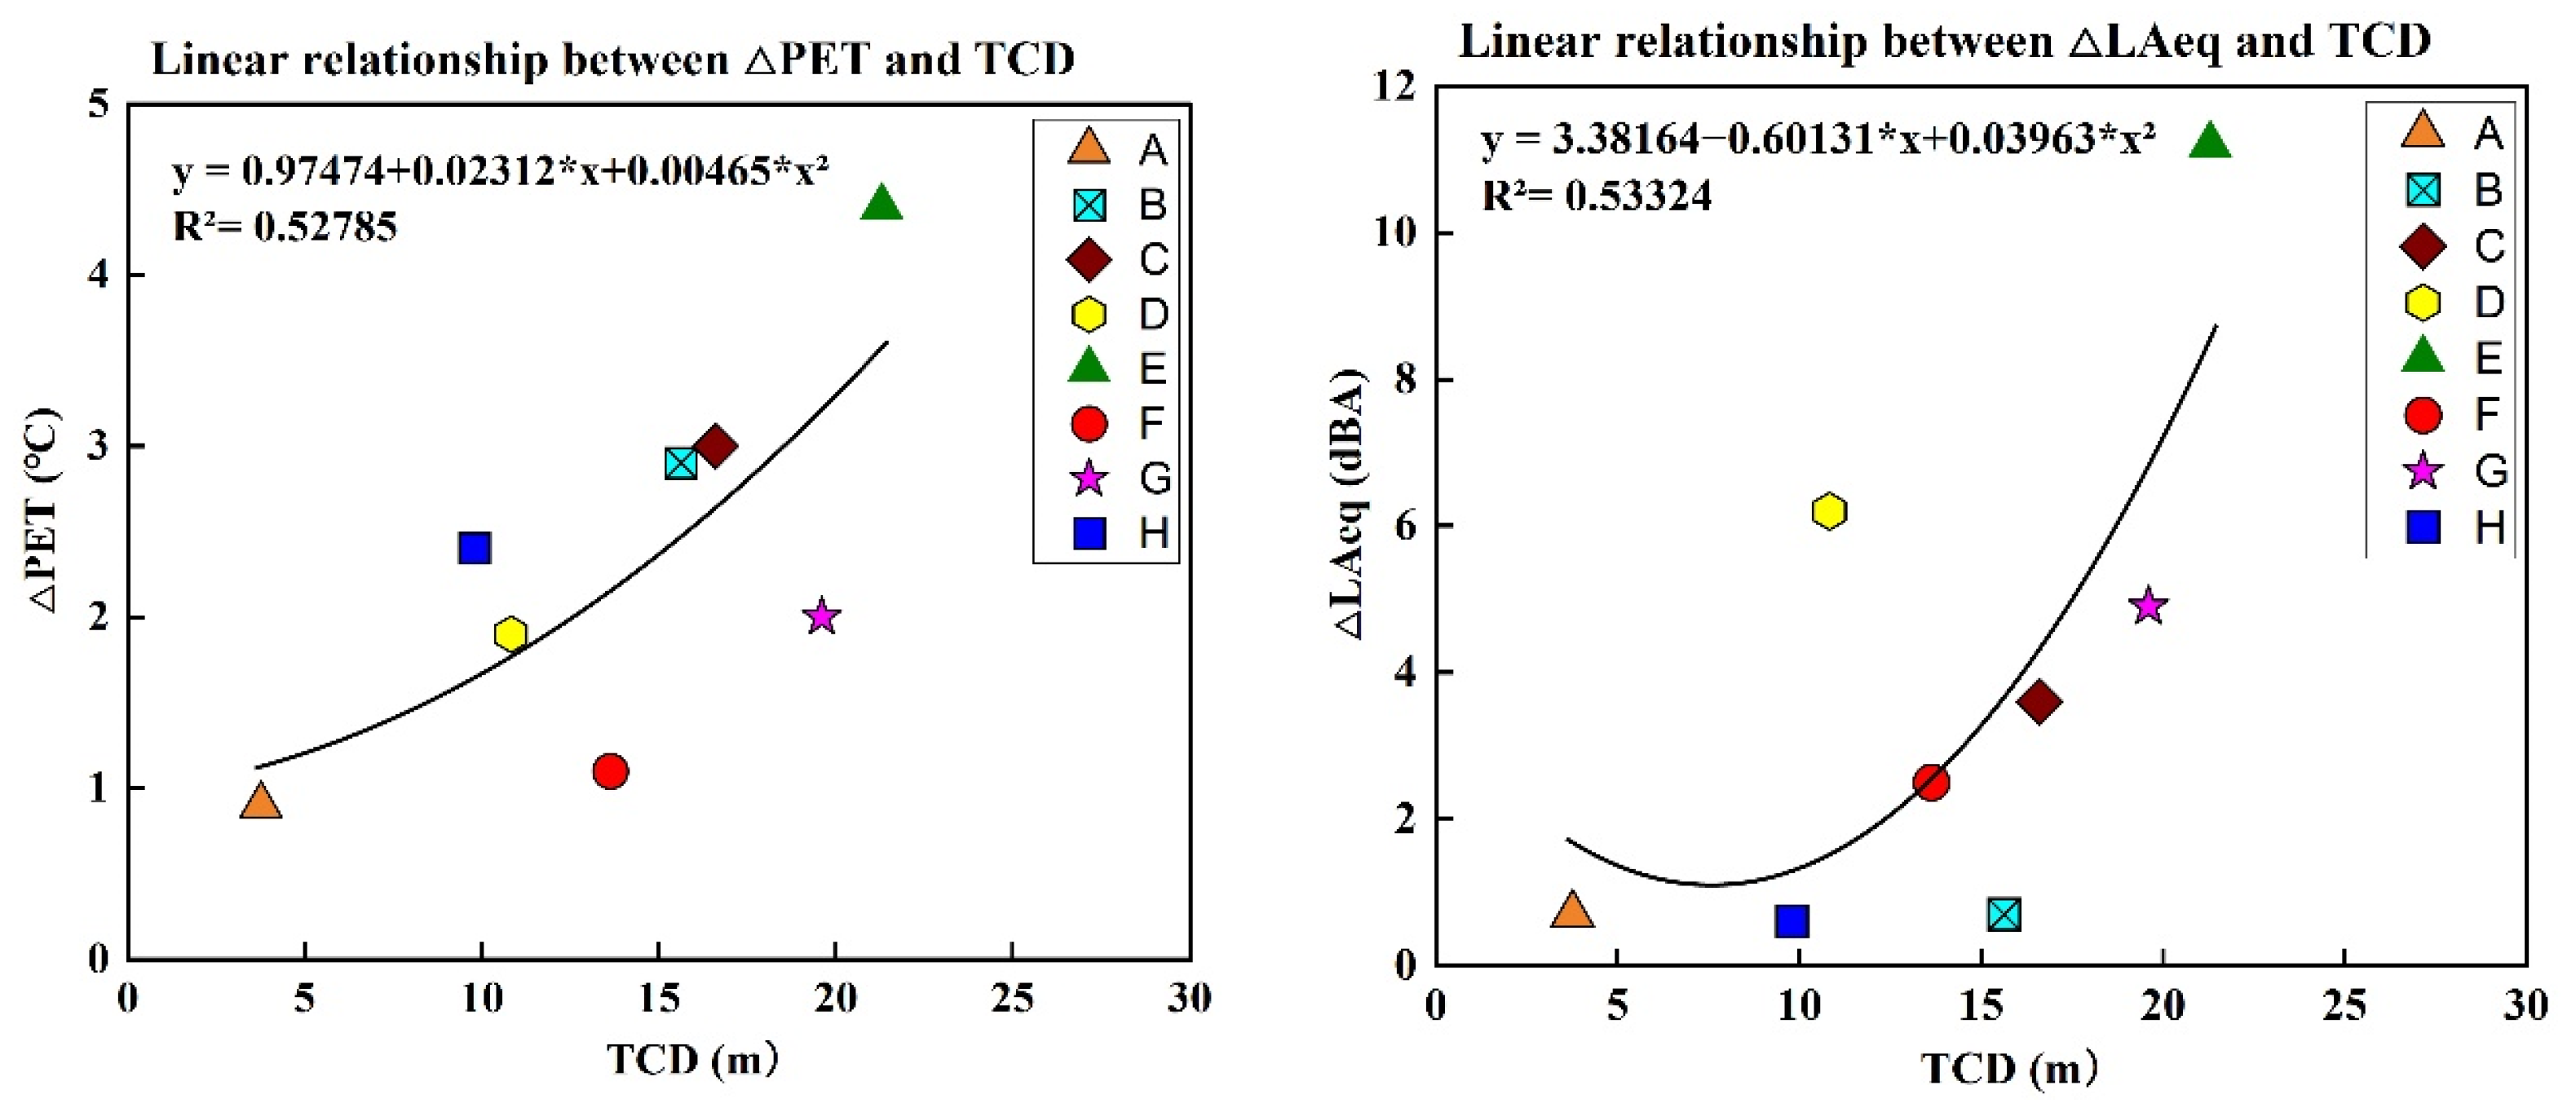
According to the results of the ANN model, TCD has a significant correlation with ΔPET and ΔLAeq. They were further analysed in regression models, and their correlations are shown in Figure 6. Positive correlations between TCD and ΔPET and ΔLAeq (R² = 0.53) can be found. With larger crowns, the effect of sound level reduction is still clear, yet the effect is not as strong as it is between no trees and small crowns. For every 20 m increase in TCD, ΔPET decreased by 3.3 °C and ΔLAeq decreased by 7.2 dBA. It can be concluded that trees play an important role in outdoor cooling and noise reduction.

3.3. General Data Analyses

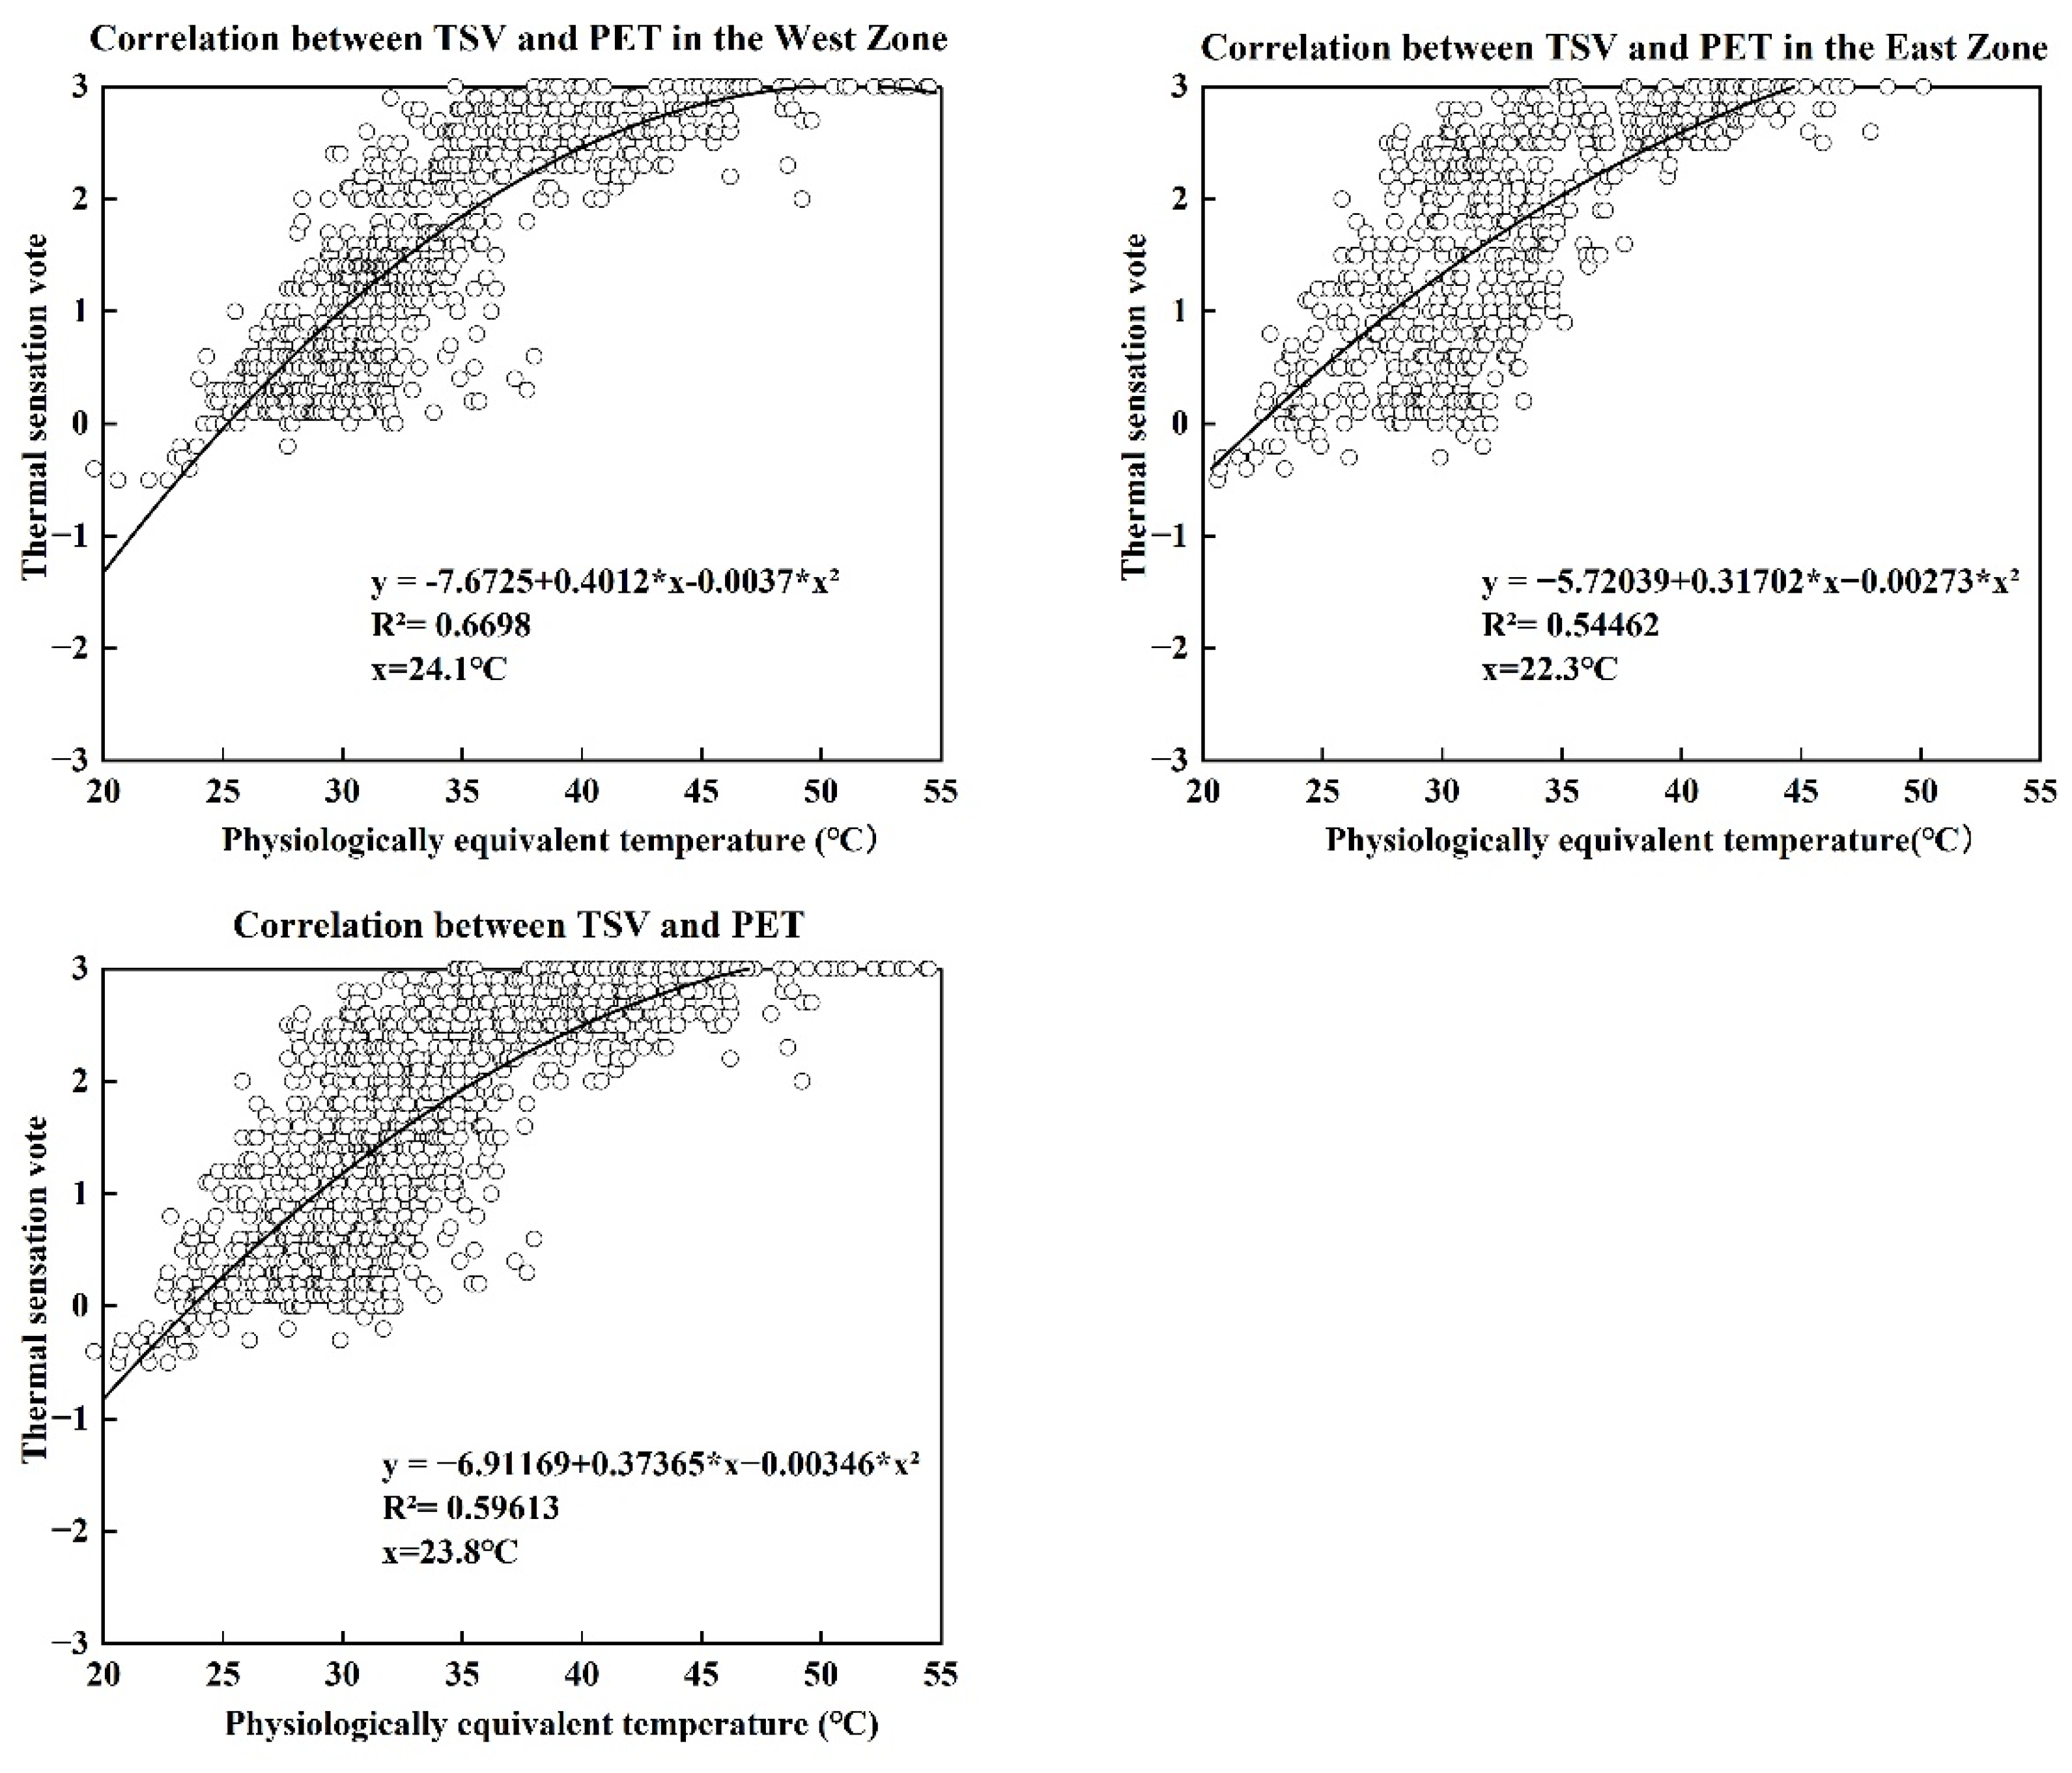
Figure 7 illustrates the correlations between PET and TSV in various scopes (WZ, EZ, and the whole area). Polynomial regressions were applied as more significant correlations. They showed significant (R2 = 0.67, 0.54, and 0.60) positive correlations. They output NTs of 24.1 °C (WZ), 22.3 °C (EZ), and 23.8 °C (overall). The thermal response at the WZ and EZ was slightly different, which might result from the differences in the physical conditions between the two zones.
The soundscape has significant impacts on people’s perceptions and comforts. People were highly sensitive to the acoustic environment, and changes in the LAeq caused variations in perception. ASV and ACV were used to analyse the correlation with LAeq, as shown in Figure 8. The results showed that ASV and ACV were negatively correlated to LAeq (R² = 0.72 and 0.71, respectively). In addition, similar phenomena were found in the ASV and ACV models in the West and East regions (R² = 0.7 in the WZ and R² = 0.77 and 0.76 in the EZ). Respondents felt good neutrality at a sound pressure of approximately 52.2 dBA, with slightly different comfort values (53.3 dBA in the WZ and 50.9 dBA in the EZ). Further, respondents’ preference for NLAeq was 53.7 dBA (54.8 dBA and 52.4 dBA).

3.4. Thermal and Acoustic Responses towards Various Acoustic Conditions

3.4.1. Correlation between LAeq and TSV in Different Voice Types

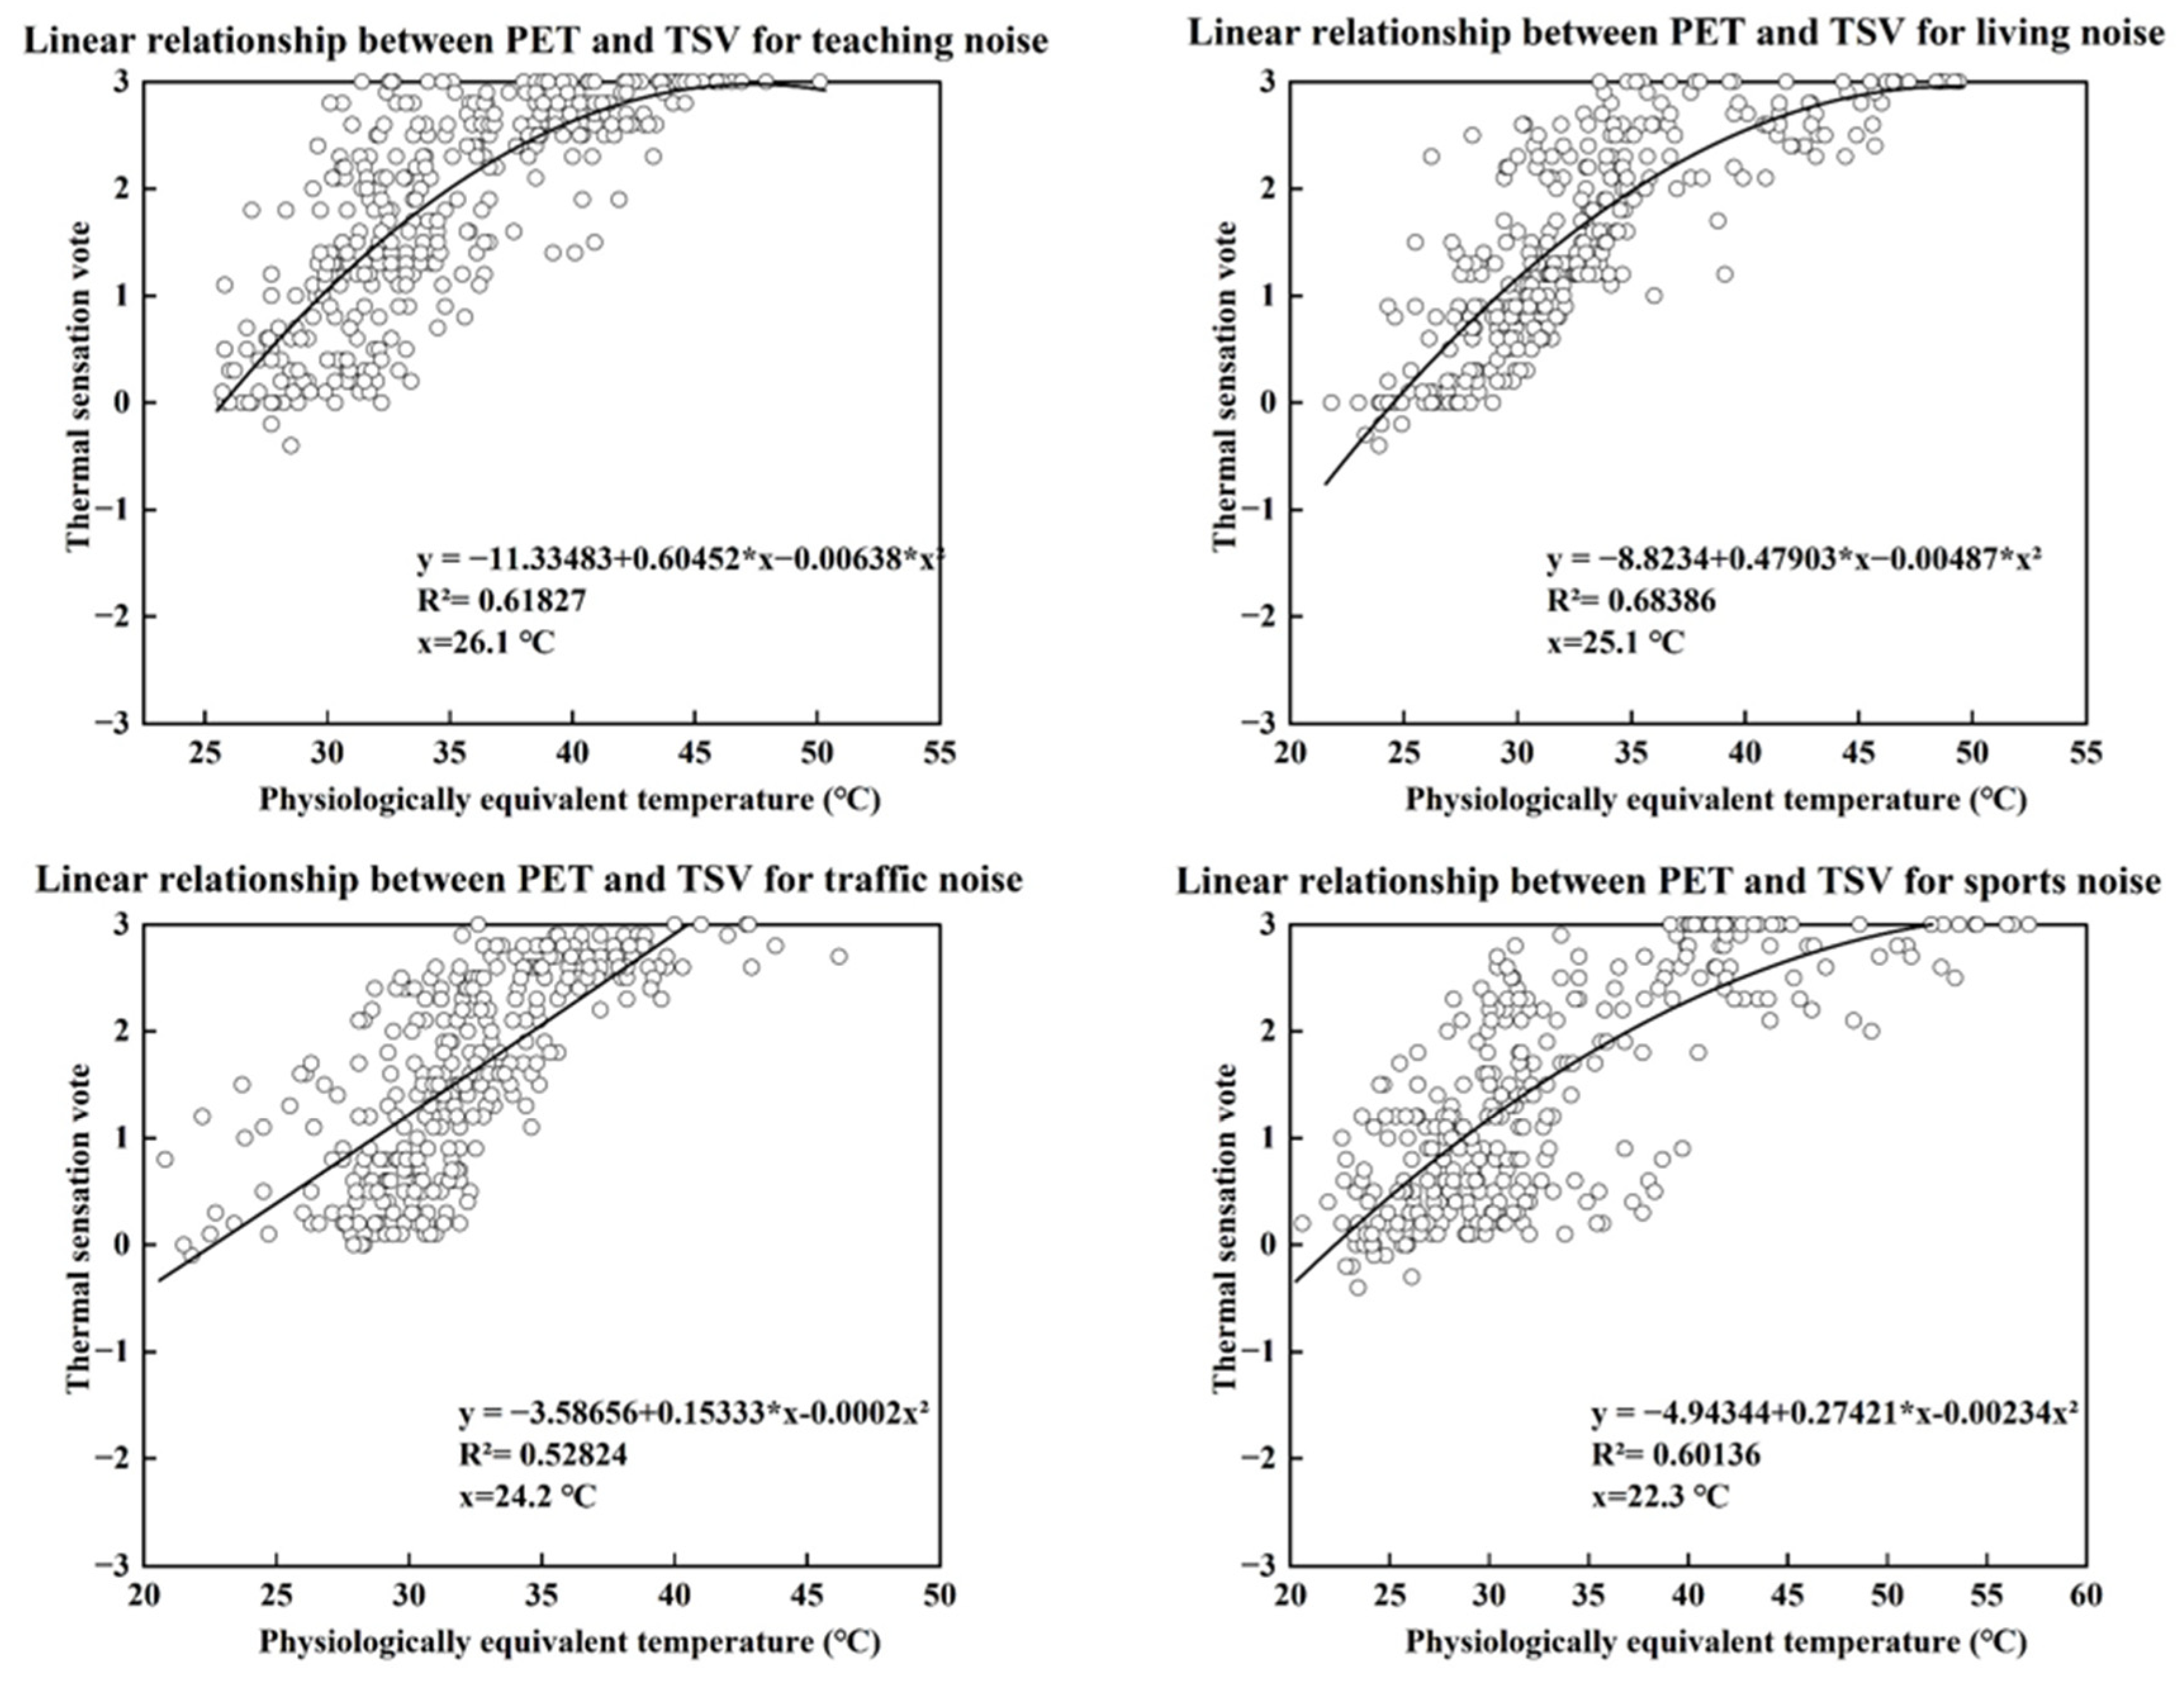
Noise caused irritation for subjects, which led to emotional variation [65]. Therefore, noises of different types caused various subjective feelings, including thermal perceptions. Thermal responses were associated with the index under different noise contexts through polynomial regressions for the combination of two zones, as shown in Figure 9. They exhibited significantly positive correlations (R² > 0.5) under different noise backgrounds. This caused various NTs—26.1 °C (teaching), 25.1 °C (daily life), 22.3 °C (sports), and 24.2 °C (traffic). Students were mostly thermal tolerant towards the noise of education, whereas they were less tolerant to that of sports and traffic.
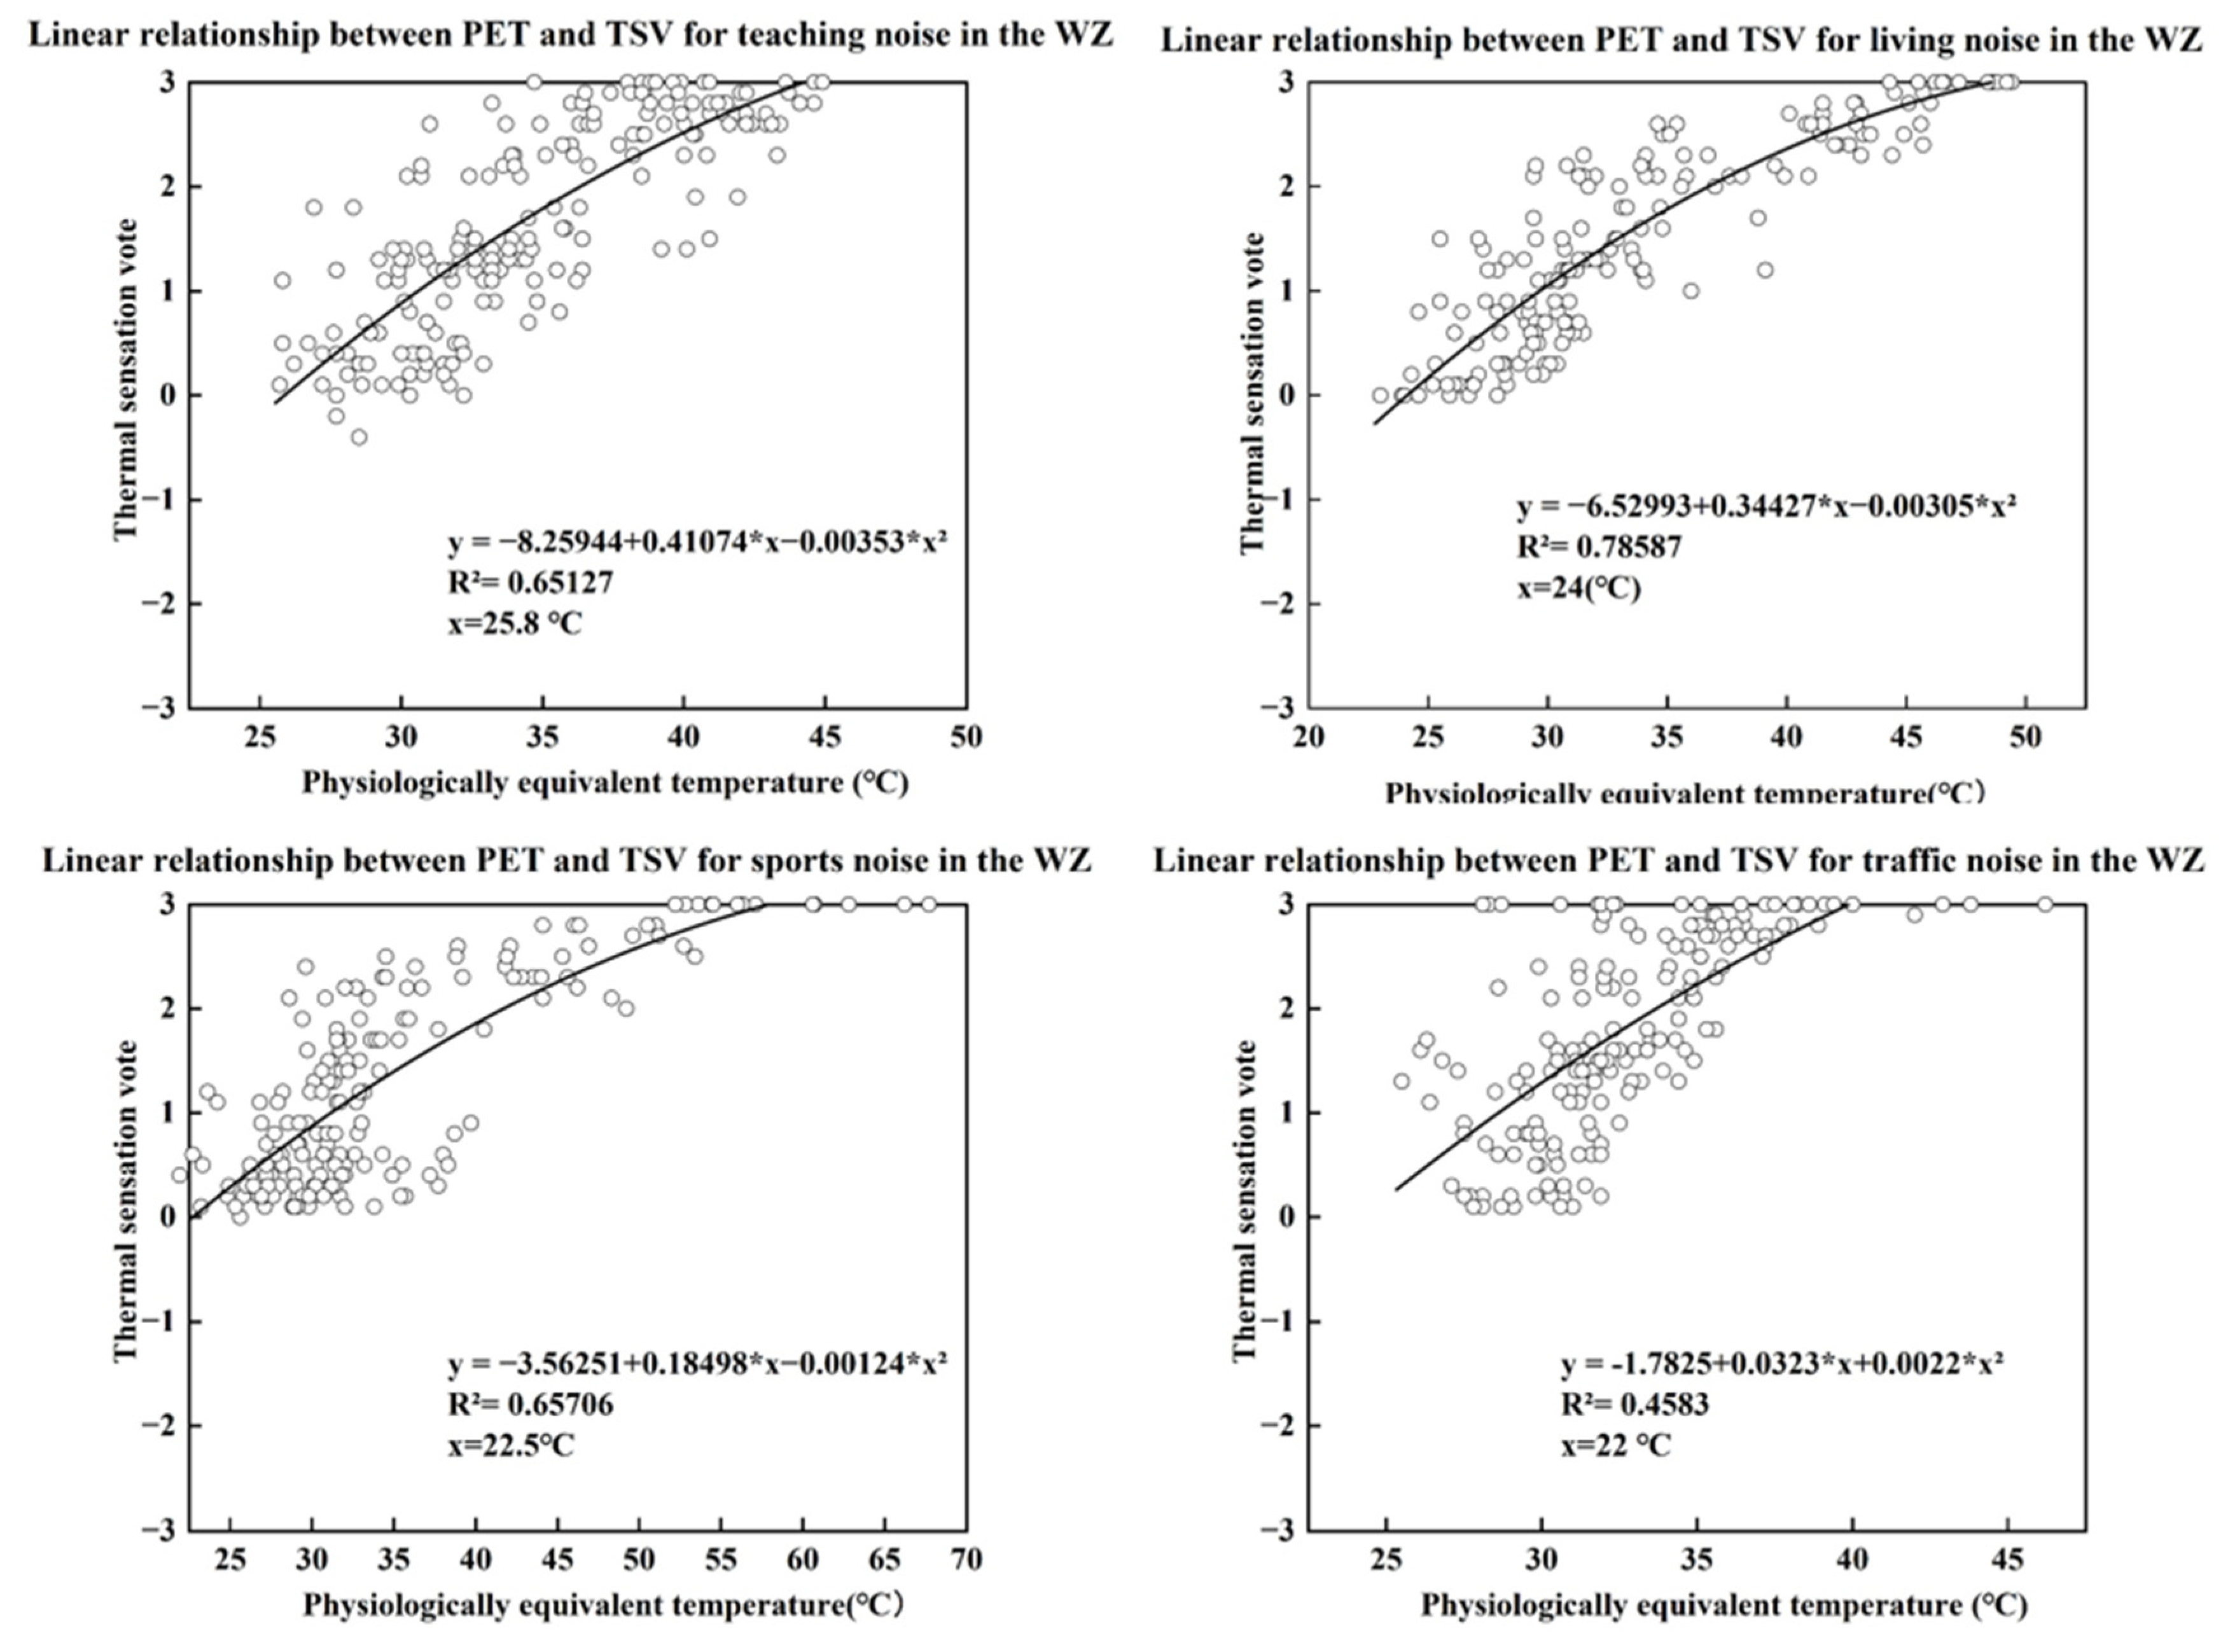
The two zones were analysed separately for further exploration. Figure 10 (WZ) and Figure 11 (EZ) show their polynomial correlations. Generally, they had similar trends to the entire campus. NTs with different noisy backgrounds in the WZ were 25.8 °C (teaching), 24.0 °C (daily life), 22.5 °C (sports), and 22 °C (traffic). In contrast, those in the EZ were 25.6 °C (teaching), 24.2 °C (daily life), 25.3 °C (sports), and 22.7 °C (traffic). The values in the two zones differed slightly. Yet, they presented similar overall trends with the entire campus data.

3.4.2. Correlation between LAeq and ASV in Different Voice Types

People had different sensitivities to sounds of various types. This could be verified by their variation in NLAeq in different acoustic contexts. ASV was regressed with LAeq in various noise types for the entire campus, which is reflected in Figure 12. They were evidently negatively correlated, yielding an NLAeq of 52.5 (teaching; R2 = 0.77), 52.7 (daily life; R2 = 0.87), 51.0 (sports; R2 = 0.82), and 46.9 dBA (traffic; R2 = 0.78). Participants were adaptive with noises of domestic life but less accepting to that of traffic (reflected in the values of NLAeq).
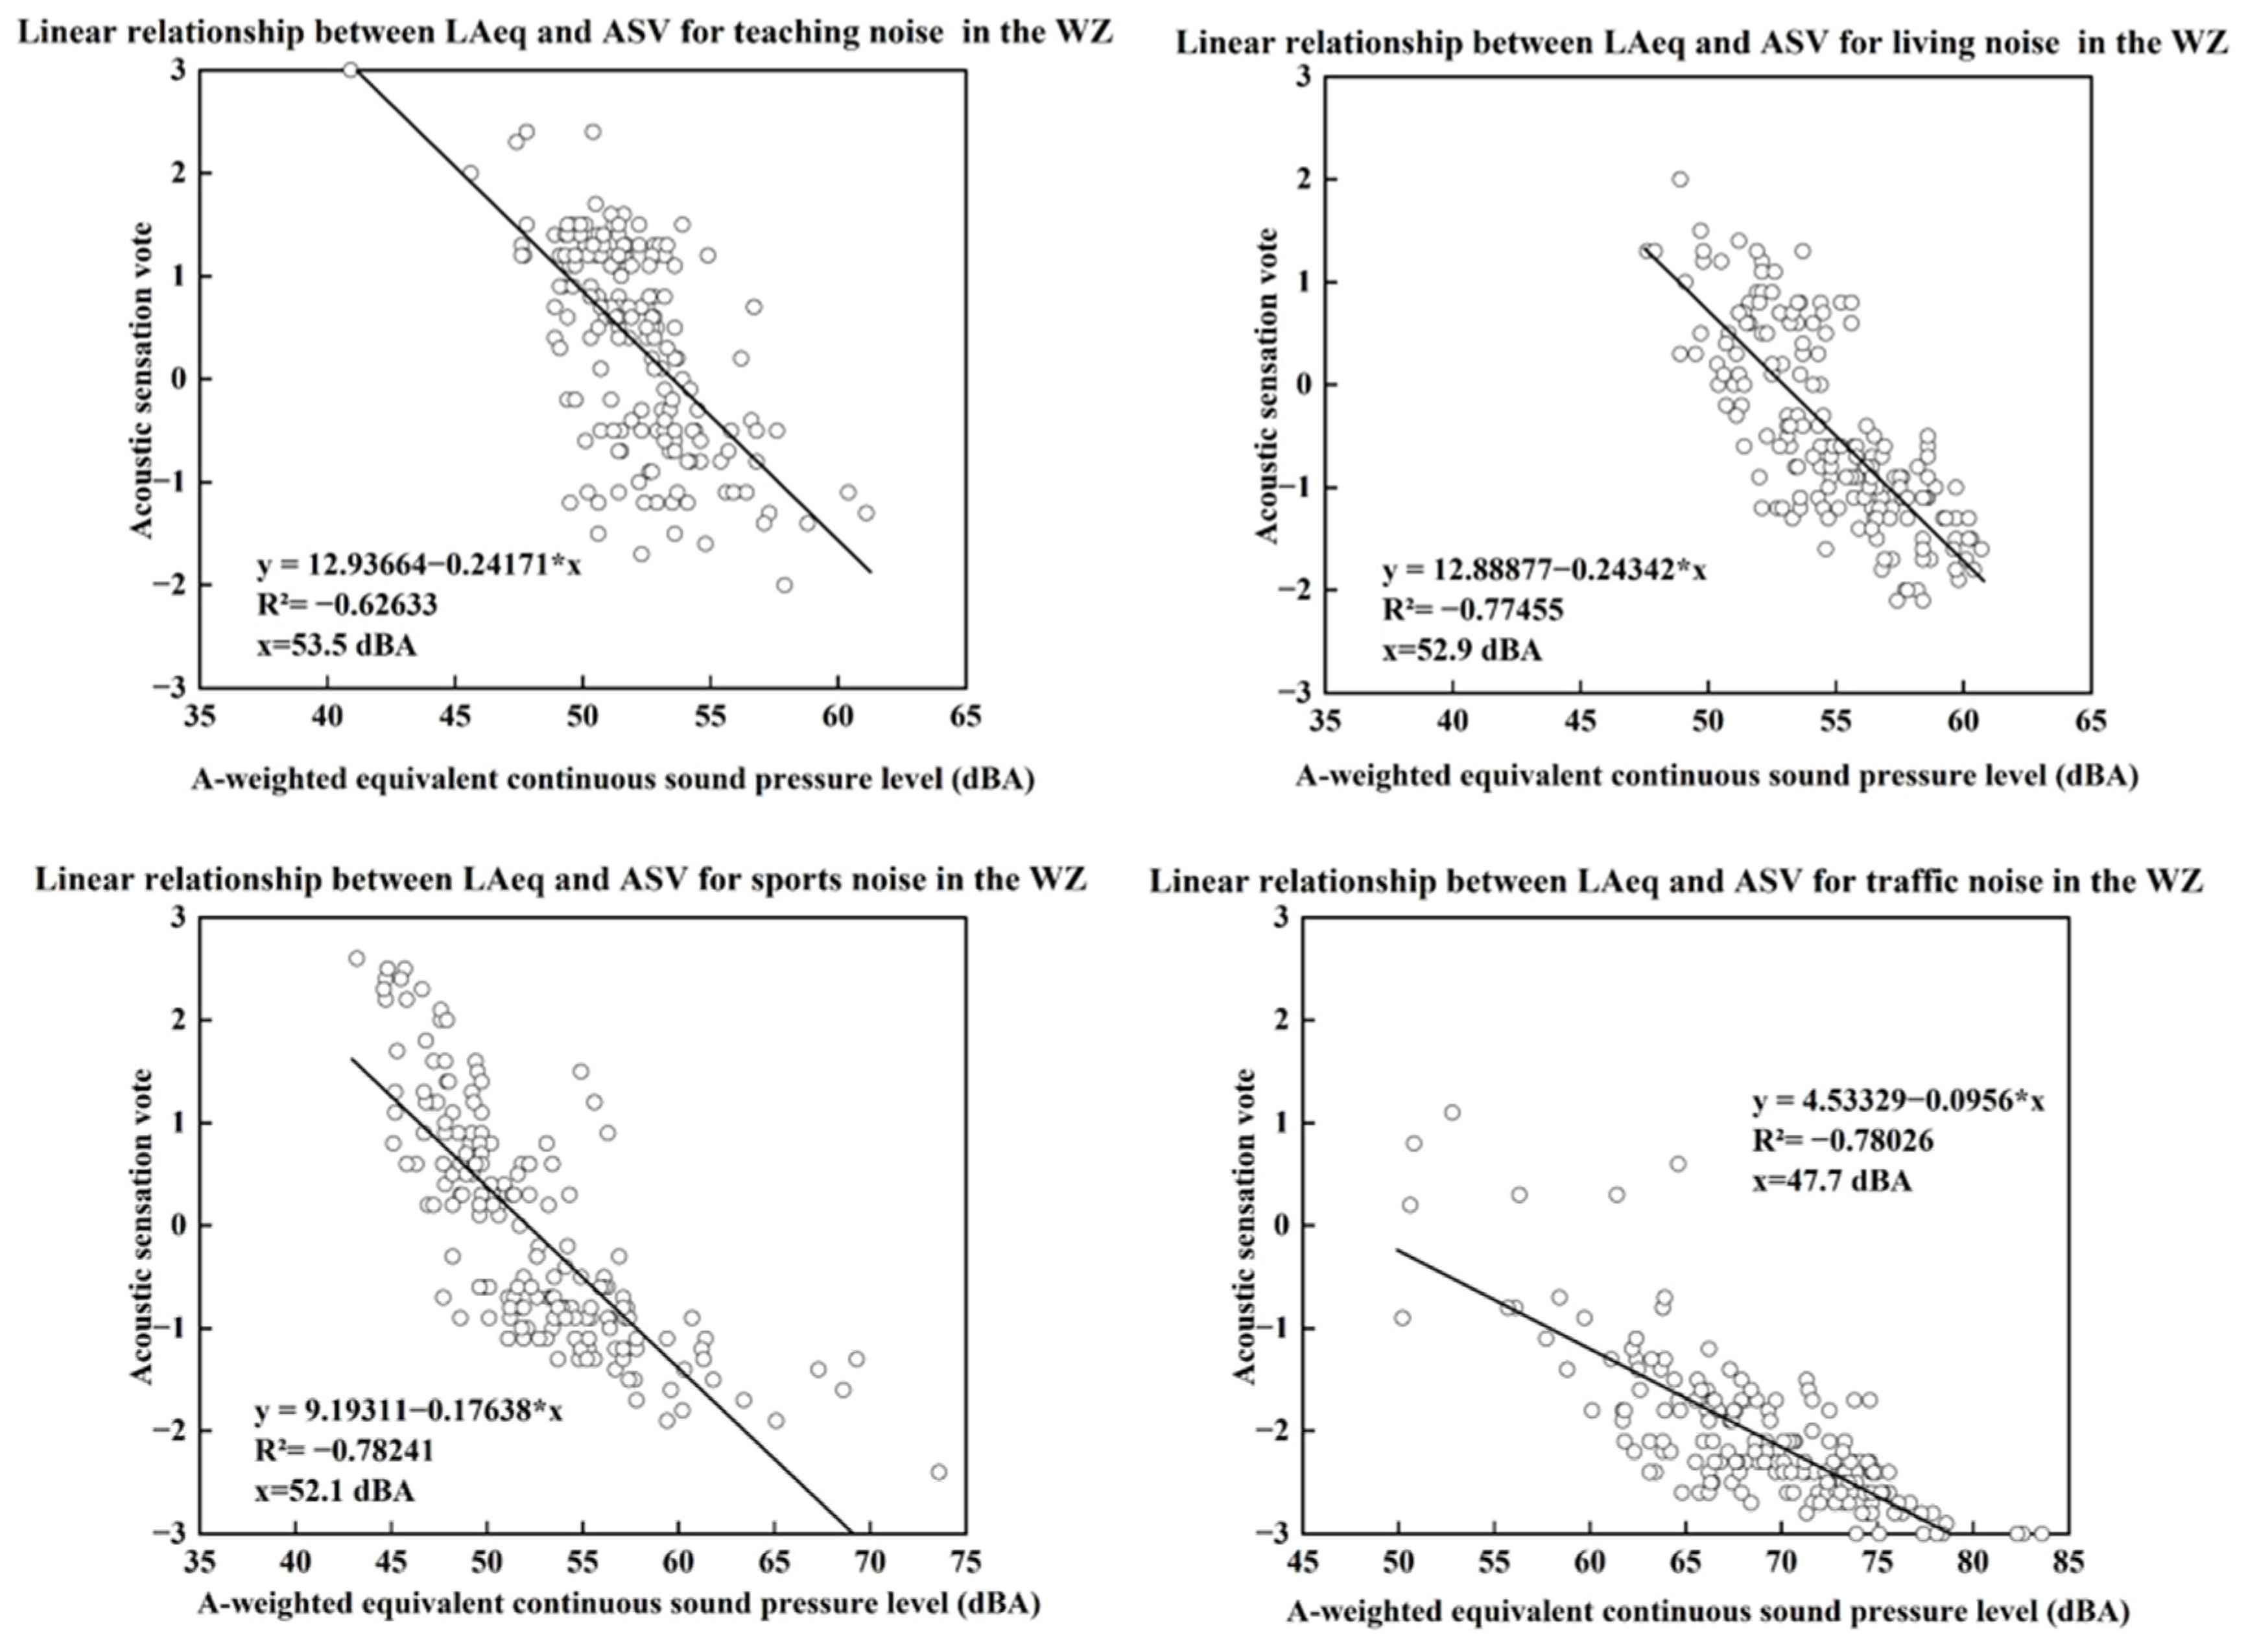
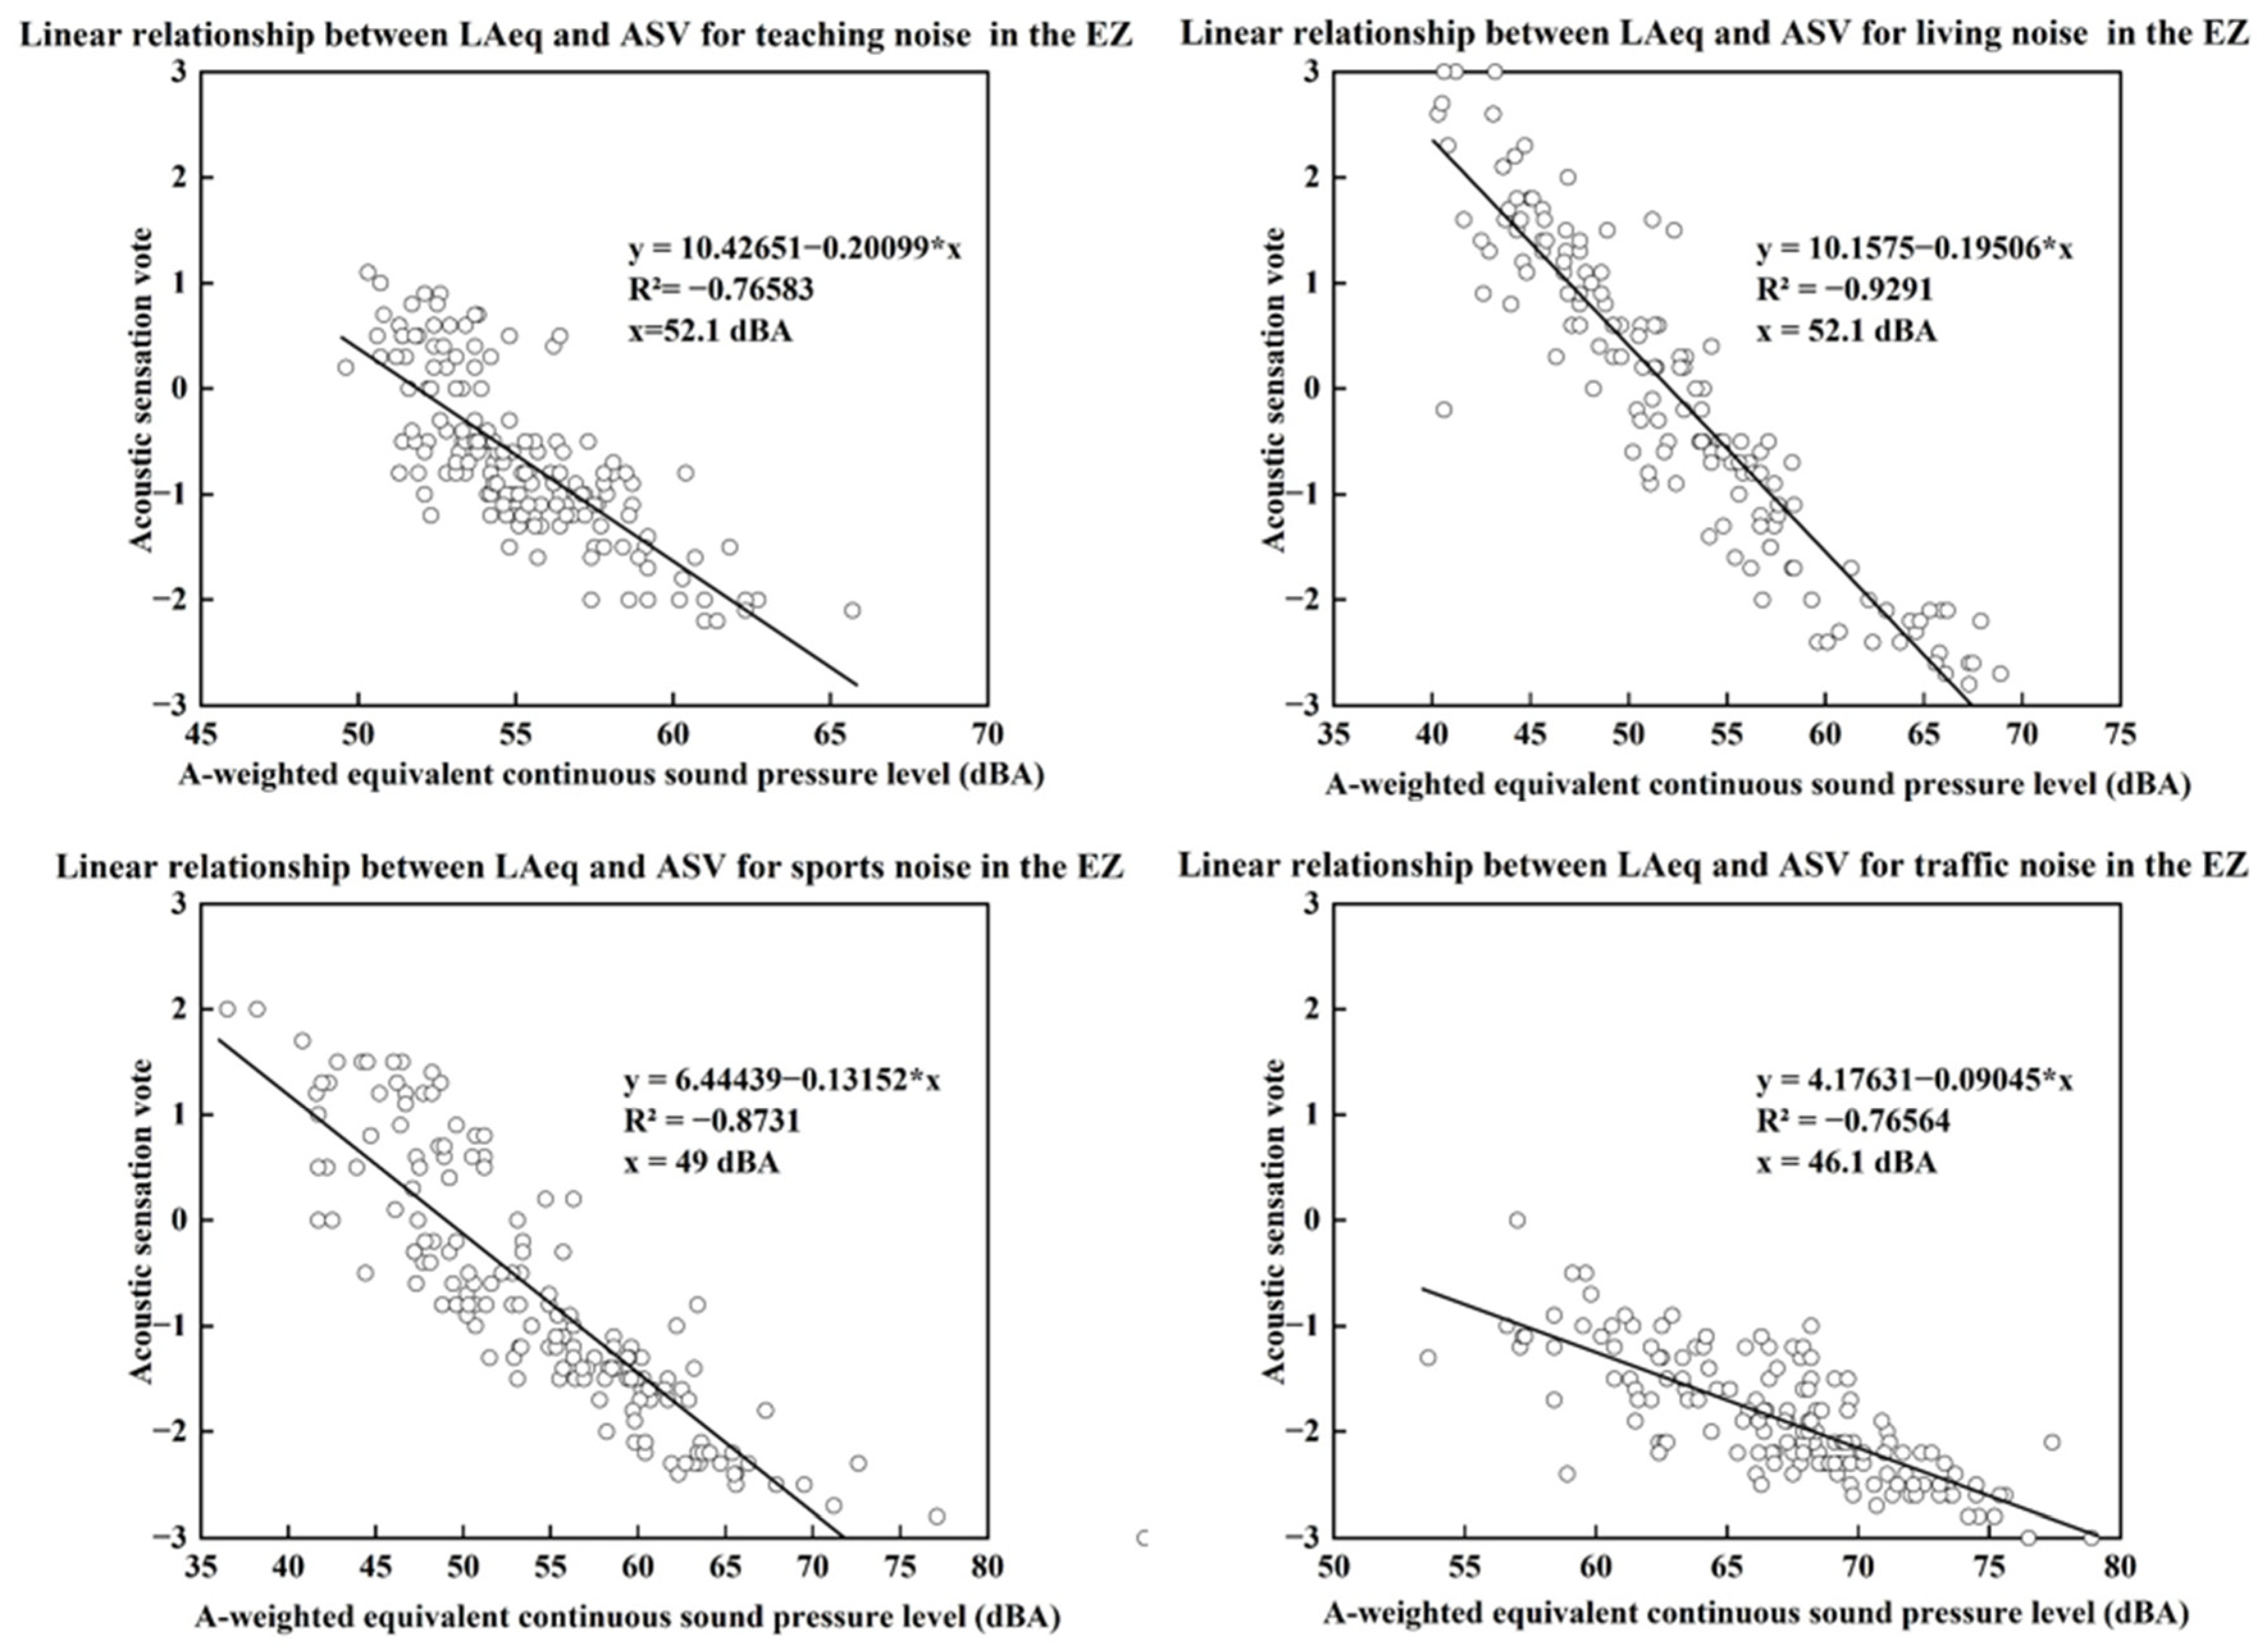
Data in the two zones were analysed independently for more detailed exploration, as shown in Figure 13 and Figure 14. They insignificantly differed from the results in Figure 12. The NLAeq values towards teaching (53.5 at WZ, and 52.1 dBA at EZ), daily life (52.9 dBA at WZ, and 52.1 dBA at EZ), sports (52.1 at WZ dBA, and 49.0 dBA at EZ), and traffic (47.7 at WZ dBA, and 46.1 dBA at EZ) were exported. Although slightly varied, volunteers were still the least accepting of traffic noises.

3.4.3. Correlation between LAeq and ACV in Different Voice Types

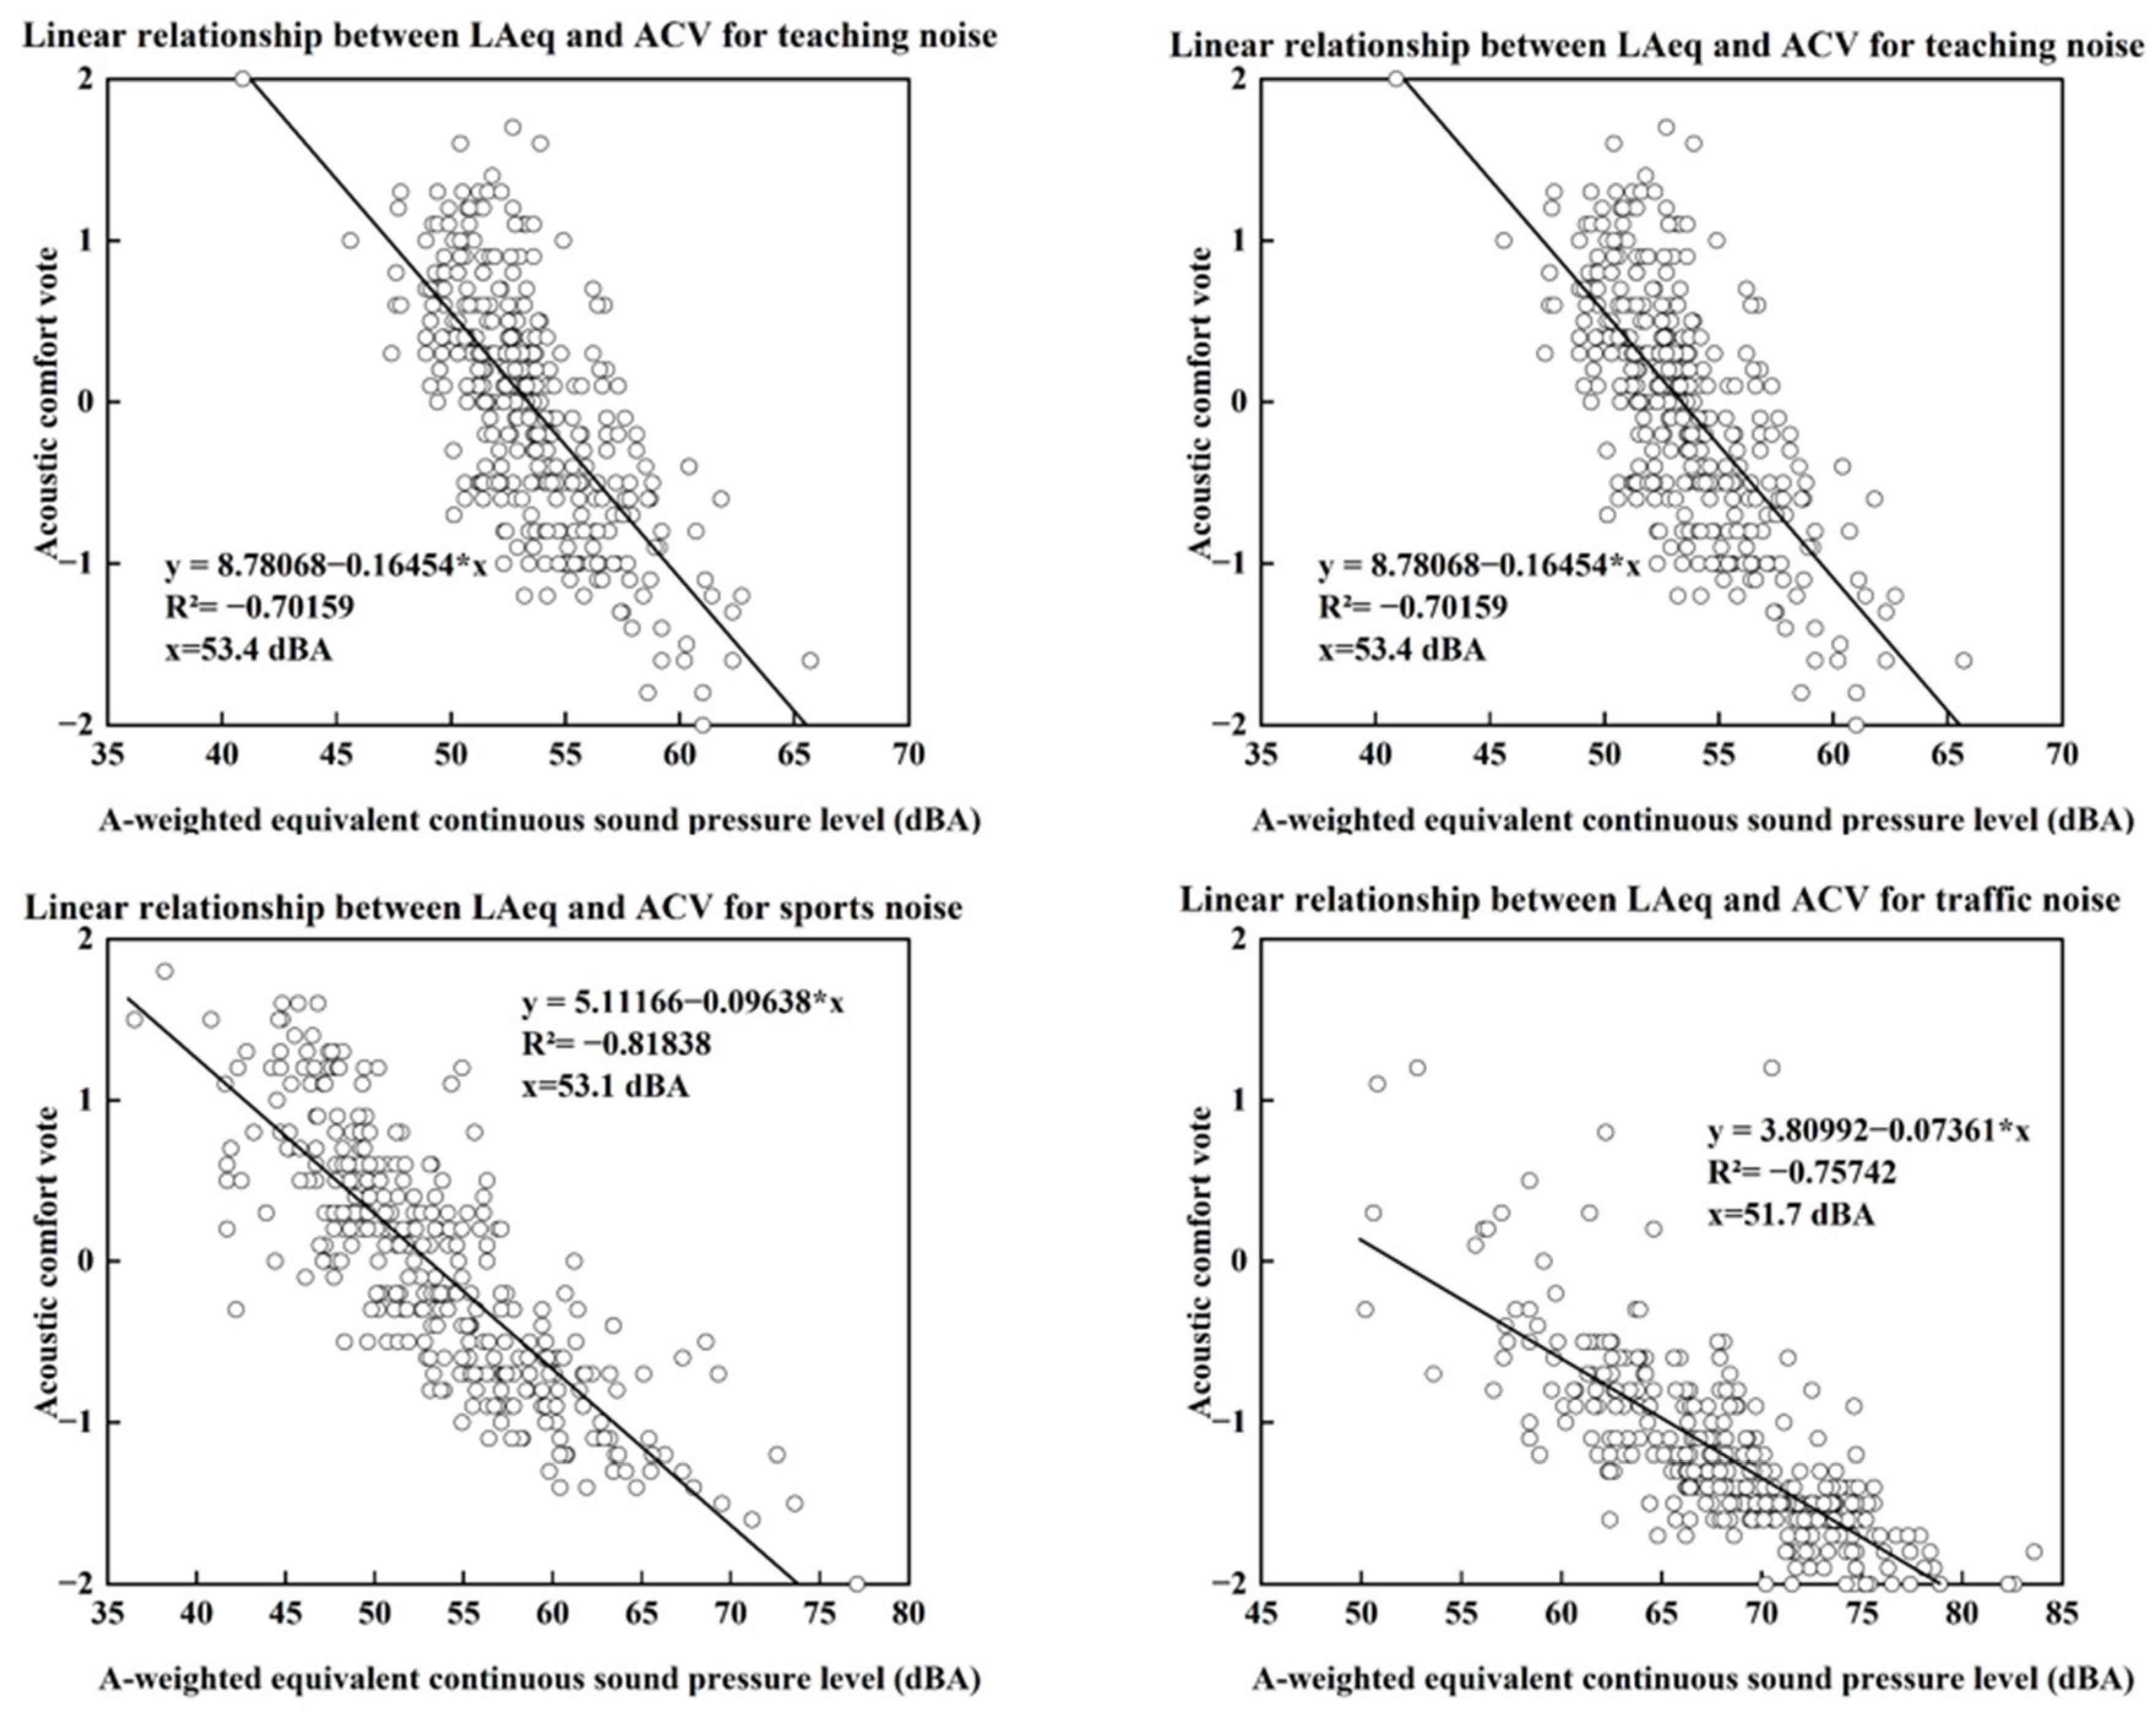
Soundscapes cause comfortable feelings. This could be evaluated by the ACV, yielding Figure 15 through linear regression. Residents’ preferred LAeq (PLAeq) values were 53.4 (teaching), 53.3 (daily life), 53.1 (sports), and 51.7 dBA (traffic) for the whole campus. The PLAeq values were relatively low against traffic noises, while the other three were insignificantly different.
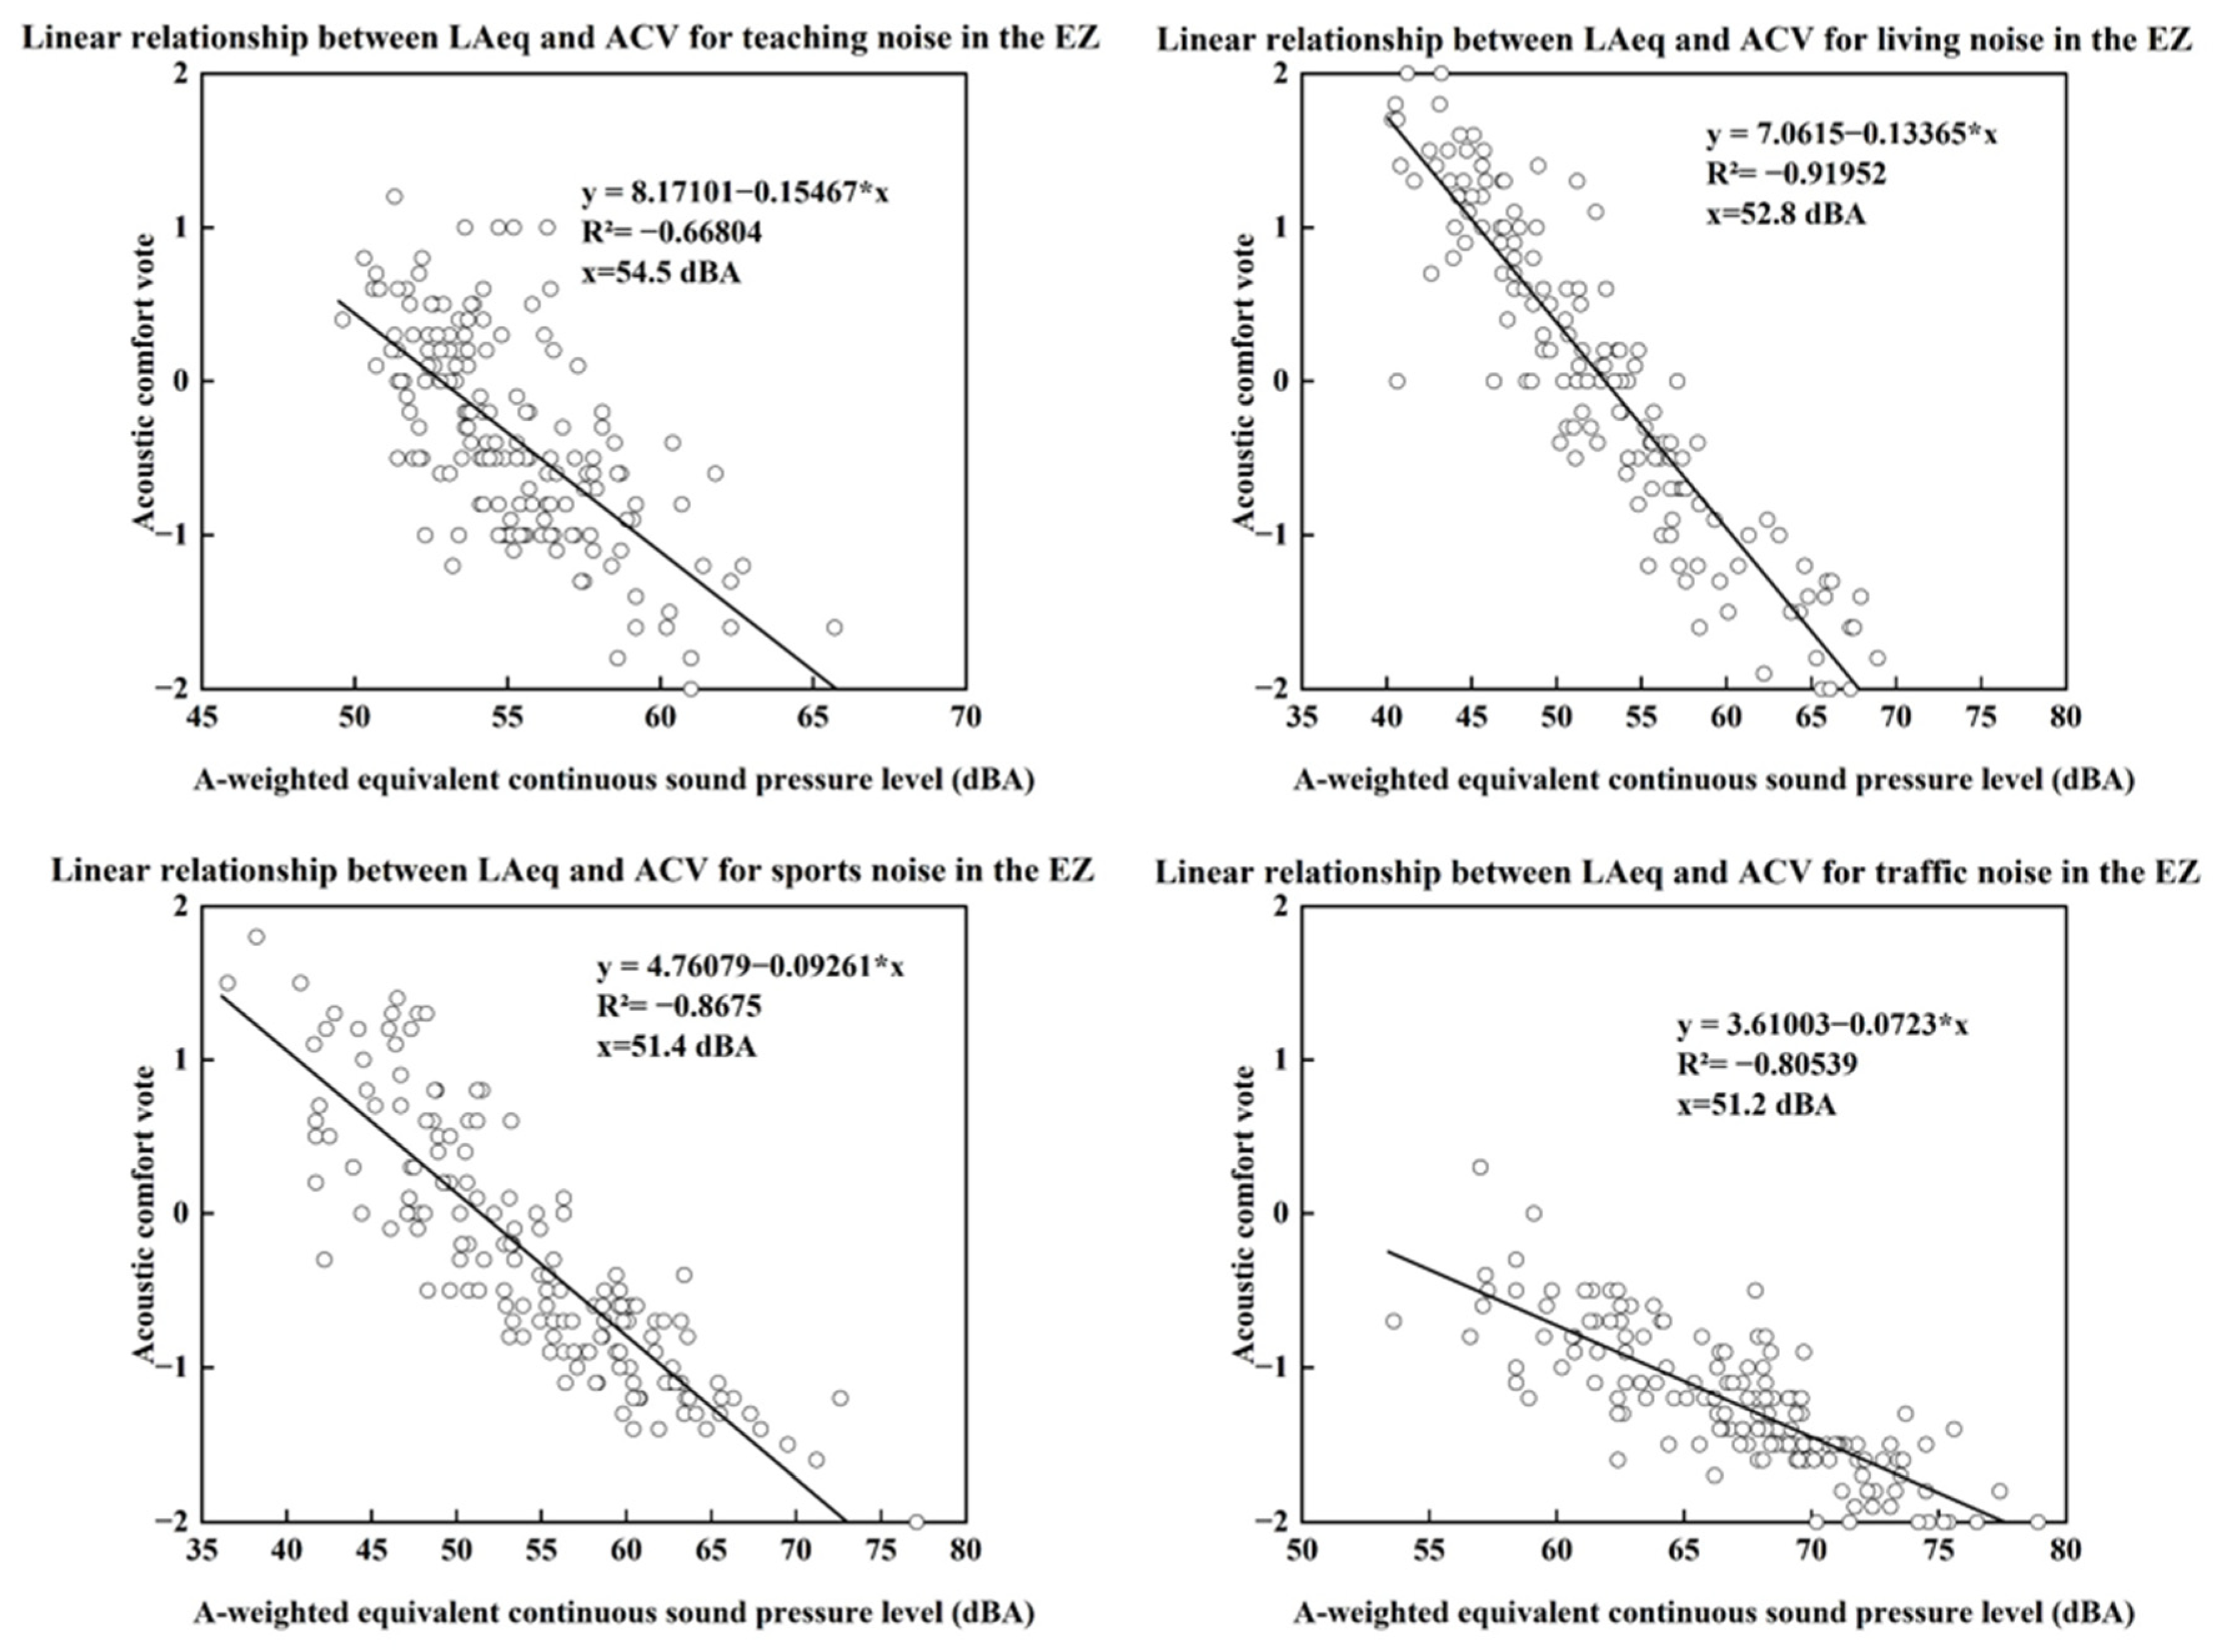
Similar to thermal responses, thermal comforts were associated with LAeq in each zone separately, as shown in Figure 16 and Figure 17. Subjective preferred LAeq values under acoustic types were 56.7 and 54.5 dBA (teaching), 53.8 and 52.8 dBA (daily life), 54.6 and 51.4 dBA (sports), and 53.3 and 51.2 dBA (traffic), respectively. In comparison to results for the whole campus, they differed to some degree, yet traffic noise contributed to the lowest PLAeq value. Higher values were seen in the WZ. This might result from variations in the physical environment. The PLAeq was slightly higher or lower than the NLAeq at any scope. This reflects the differences in residents’ perceptions of the soundscape. Nevertheless, they exhibited similar variations with the NLAeq. The traffic caused the lowest values as well.

3.5. Trees Meeting People’s Needs

Section 3.1 and Section 3.2 showed the important roles of trees in cooling and noise reduction. By comparing the point under shade and the point without shade, the values of the PET range and the LAeq range of the two points were found to differ quite significantly, and the values of the PET range and the LAeq range of the two points were significantly lower than those of the non-shaded points. Through neural network analysis, it can be seen that TCD has the greatest influence among the selected physical influencing factors. The canopy reduces the PET value by shading the sun. The sound absorption effect of the tree canopy is used to reduce noise and improve the outdoor thermal comfort. Therefore, planting and greening should be reasonably planned to create a comfortable outdoor environment.
The effects of physical factors on EQP adjustments and subjects’ responses towards them have been discussed above. Certain environmental qualities can be estimated using the factors. Integrating pedestrians’ responses into the practically generated EQP conditions might more accurately evaluate their improvement performances. Figure 4 and Figure 5 illustrate the scopes of the two indices. A better environment was created by trees, which presents as lower values of the indices. There were several trees resulting in a PET below 25 °C, with a few of them as low as 20 °C (B, D, H, etc.). They were able to yield thermal conditions that meet people’s needs (NPET = 23.8 °C) to some extent. Nevertheless, PET values were close to individual thermal preferences very infrequently during the hot season. In fact, the mean values of PET under trees were mostly above 25 °C, which is relatively warm. Relatively cool environments were witnessed at Points E and G only as a result of their wider crowns. Therefore, it is difficult to determine good thermal environments through trees only in the summer. Trees with crown widths of 20 m in this study could sometimes achieve that. Other factors should be considered to create thermal comfort. Acoustically, the LAeq of all samples varied significantly. This resulted from the variation in functions in different sites. Their acoustic environments were more significantly affected by site uses, rather than trees. Trees were able to achieve partial reduction, although a lower value was measured at other sites.

4. Discussion

This study has explored the effects of different environmental quality factors on acoustic and thermal comfort. Due to the differing environmental qualities and different types of noise, the acoustic thermal responses also differed. Further, the individual thermal susceptibility varied with the noise intensity.
Figure 6 expresses that areas canopied by trees were cooler than their nearby open subpoints, as indicated by PET. A similar phenomenon was also found by Zhang, et al. [66]. Generally, the cooling effects of trees are well understood [67]. They had an effect on the factors of temperature [68], radiation [69], and wind [70]. This could be explained by the physical [11] and biological [69] impacts—trees generate shade for covered sites, which are cooler than those in the sunshine [10]. In addition, the transpiration effects of trees [71] absorb atmospheric heat (photosynthesis [72]) and generate water molecules (evaporation [73]) in the air. These two processes can mitigate heat radiation and increase the RH. Trees with larger crowns can create more and/or solid shade, reducing the temperature more significantly [21]. Meanwhile, larger crowns have larger leaves, and generate more efficient biological effects [74], reducing the temperature better. The findings of this study reflect these principles.
Sound could be reduced by the friction and resistance of air molecules [75]. This phenomenon is more significant in enclosed and small spaces [76]. There were various processes that reduced tree sounds resulting from leaves [77] and tree trunks [78]. The reduction intensities were positively correlated with the space sizes and quantities [45]. There were gaps between leaves and branches in the crowns. The noises are transmitted into the open spaces between the gaps, transforming into energy. Further, there are more and larger gaps among trees with larger crowns (20 m). The crowns of larger sizes bear more leaves, leading to stronger air resistance [79]. Further, trees were able to mitigate noise from either point or line sources [80]. The results of this study echoed the findings of Zhao, Prieur, Liu, Kneeshaw, Lapointe, Paquette, Zinszer, Dupras, Villeneuve, Rainham, Lavigne, Chen, van den Bosch, Oiamo and Smargiassi [17]. Nevertheless, trees are insignificantly sound-mitigatable, and the LAeq values between the nearby subpoints varied slightly (Figure 5). Consequently, trees had a limited capacity to reduce noise [78].
Human responses towards thermal and acoustic environments were explored in this study. They were evaluated at neutral points, which have previously been investigated in other cities (Table 5). The NPET and NLAeq values found in this study were close to some of those values. That is, people have similar responses towards the environment, even in different areas.
Noises of different types have different impacts on human hearing organs. This may result from the variation in voice (shaking) frequencies [47]. Various frequent shakes impact people’s ears differently. As a result, they have different tolerances towards noises of different frequencies. Hence, they were perceptively different, expressed by neutral points towards the LAeq (e.g., Figure 10). Different thermal responses were also found (various NPETs in different soundscapes; Figure 12). People’s lowest NTs emerged under the background of traffic flow [87]. The traffic was defined as high-frequency voices [47]. This was also expressed in the noise levels [31]. In fact, the noises were all confirmed to have an influence on thermal perceptions. Impactive voices will also cause poor thermal comfort. The findings herein confirm these principles.
Plants regulate the air temperature to improve outdoor thermal comfort conditions [14] through heat absorption, shade, and evaporation [88]. The noise intensity is reduced through the scattering of sound waves and the absorption of leaves [89]. Therefore, planting and greening should be reasonably planned to improve the design of the outdoor environment. However, this study has certain limitations. There was little comprehensive effect on the multiple design factors of the environment in the experiment, which had a certain impact on the results. Furthermore, some important parameters (such as the sound frequency [44]) were from online resources, rather than on-site sensing. This might be the reason for the poor accuracy of non-linear models for NLAeq calculations. Therefore, in future studies, technological improvements should be made.
Future studies could be improved through various aspects, as follows: (1) there should be instruments to survey values of sound frequency instead of acquiring data from online resources; (2) as a result, human thermal perceptions should be analysed under the context of various-frequency noises; (3) further, the sound absorption effects of trees should be explored for different sound frequency types; and (4) although the sound reduction effects of vegetation were broadly proved, other parameters affect the decrease intensity, such as the areas and/or density, which should be considered in the future.

5. Conclusions

This study explores the acoustic and thermal responses of the environment with trees under different environmental factors and different background sounds. The results are expressed through a response to the factors. Some of the important findings are listed as follows.
  • The PET and LAeq values in the shade of trees were lower than those in open space, and TCD was the most important environmental factor affecting ΔPET and ΔLAeq; the decrease in PET and LAeq was stronger with increases in the TCD.
  • The average outdoor neutral temperature of Mianyang in summer is 23.8, the neutral sound is about 52.2, and the preferred sound is 53.7.
  • Under different background sounds, the lowest NPET was 24.2 °C for traffic and sports, and the lowest NLAeq and preferred sound for traffic were 46.9 dBA and 51.7 dBA, respectively.
  • Trees have a strong cooling and noise-reduction effect, which is crucial for daily living.
Trees affect the EQP acoustically and thermally although it is difficult to achieve people’s comfort scopes. They can be used as key planning factors for improving urban EQP. The findings of this study validate methods to improve the EQP.

Author Contributions

Formal analysis, H.Y.; data curation, T.Z., F.Z. and T.L.; writing—original draft, A.X.; writing—review and editing, W.L., Y.C. and J.Z.; supervision, J.Z.; funding acquisition, W.L. All authors have read and agreed to the published version of the manuscript.

Funding

This research was funded by Southwest University of Science and Technology in China (23zx7107).

Institutional Review Board Statement

The study was conducted in accordance with the Declaration of Helsinki and approved by the Institutional Review Board (or Ethics Committee) of Southwest University of Science and Technology in China (protocol code 23zx7107, 1 April 2023).

Data Availability Statement

The data presented in this study are available on request from the corresponding author, due to being used in another study; please contact the corresponding author if further needs.

Conflicts of Interest

Y.C. was employed by the China Southwest Architectural Design and Research Institute Co., Ltd. The remaining authors declare that the research was conducted in the absence of any commercial or financial relationships that could be construed as a potential conflict of interest.

Abbreviations

OTCoutdoor thermal comfort
EQPenvironmental quality in physics
NT(s)neutral temperature(s) (°C)
SWUSTSouthwest University of Science and Technology
A/TSVacoustic/thermal sensation vote [-]
ACVacoustic comfort vote [-]
PETphysiologically equivalent temperature (°C)
NPETneutral physiologically equivalent temperature (°C)
LAeqA-weighted equivalent continuous sound pressure level (dBA)
NLAeqneutral A-weighted equivalent continuous sound pressure level (dBA)
PLAeqpreferred A-weight equivalent continuous sound pressure level (dBA)
Taair temperature (°C)
Tgglobe temperature (°C)
Vaair velocity (m/s)
MRTmean radiant temperature (°C)
MLRmultiple linear regression [-]
RHrelative humidity (%)
SVFsky view factor [-]
W/EZWest/East Zone
TCDtree crown diameter (m)
AACacoustic absorption coefficient [-]
NInormalised importance (%)
ANNartificial neural network
LAIleaf area index
UTCIuniversal thermal climate index (°C)

References

  1. Geng, Y.; Hong, B.; Du, M.; Yuan, T.; Wang, Y. Combined effects of visual-acoustic-thermal comfort in campus open spaces: A pilot study in China’s cold region. Build. Environ. 2022, 209, 108658. [Google Scholar] [CrossRef]
  2. Cleary-Gaffney, M.; Espey, B.; Coogan, A.N. Association of perceptions of artificial light-at-night, light-emitting device usage and environmental noise appraisal with psychological distress, sleep quality and chronotype: A cross sectional study. Heliyon 2022, 8, e11284. [Google Scholar] [CrossRef] [PubMed]
  3. Nitidara NP, A.; Sarwono, J.; Suprijanto, S.; Soelami, F.N. The multisensory interaction between auditory, visual, and thermal to the overall comfort in public open space: A study in a tropical climate. Sustain. Cities Soc. 2022, 78, 103622. [Google Scholar] [CrossRef]
  4. Wu, H.; Wu, Y.; Sun, X.; Liu, J. Combined effects of acoustic, thermal, and illumination on human perception and performance: A review. Build. Environ. 2020, 169, 106593. [Google Scholar] [CrossRef]
  5. Zierke, O.; Goerke, P.; Maier, J.; Hoermann, H.-J. Influence of personal control on thermal comfort: A psychological effect or just the “right” temperature? Energy Build. 2023, 295, 113334. [Google Scholar] [CrossRef]
  6. Lam, C.K.C.; Hang, J.; Zhang, D.; Wang, Q.; Ren, M.; Huang, C. Effects of short-term physiological and psychological adaptation on summer thermal comfort of outdoor exercising people in China. Build. Environ. 2021, 198, 107877. [Google Scholar] [CrossRef]
  7. Dong, Y.; Shi, Y.; Liu, Y.; Rupp, R.F.; Toftum, J. Perceptive and physiological adaptation of migrants with different thermal experiences: A long-term climate chamber experiment. Build. Environ. 2022, 211, 108727. [Google Scholar] [CrossRef]
  8. Zhang, J.; Gou, Z. Tree crowns and their associated summertime microclimatic adjustment and thermal comfort improvement in urban parks in a subtropical city of China. Urban For. Urban Green. 2021, 59, 126912. [Google Scholar] [CrossRef]
  9. Zhu, X.-F.; Lau, S.-K.; Lu, Z.; Ow, L.F. Enhancement of sound absorption via vegetation with a metasurface substrate. Appl. Acoust. 2020, 165, 107309. [Google Scholar] [CrossRef]
  10. Tochaiwat, K.; Rinchumphu, D.; Sundaranaga, C.; Pomsurin, N.; Chaichana, C.; Khuwuthyakorn, P.; Phichetkunbodee, N.; Chan, Y.-C. The potential of a tree to increase comfort hours in campus public space design. Energy Rep. 2023, 9, 184–193. [Google Scholar] [CrossRef]
  11. Bowler, D.E.; Buyung-Ali, L.; Knight, T.M.; Pullin, A.S. Urban greening to cool towns and cities: A systematic review of the empirical evidence. Landsc. Urban Plan. 2010, 97, 147–155. [Google Scholar] [CrossRef]
  12. de Abreu-Harbich, L.V.; Labaki, L.C.; Matzarakis, A. Effect of tree planting design and tree species on human thermal comfort in the tropics. Landsc. Urban Plan. 2015, 138, 99–109. [Google Scholar] [CrossRef]
  13. Cheung, P.K.; Jim, C.Y.; Hung, P.L. Preliminary study on the temperature relationship at remotely-sensed tree canopy and below-canopy air and ground surface. Build. Environ. 2021, 204, 108169. [Google Scholar] [CrossRef]
  14. Meili, N.; Acero, J.A.; Peleg, N.; Manoli, G.; Burlando, P.; Fatichi, S. Vegetation cover and plant-trait effects on outdoor thermal comfort in a tropical city. Build. Environ. 2021, 195, 107733. [Google Scholar] [CrossRef]
  15. Li, Z.; Feng, X.; Sun, J.; Li, C.; Yu, W.; Fang, Z. STMRT: A simple tree canopy radiative transfer model for outdoor mean radiant temperature. Build. Environ. 2023, 228, 109846. [Google Scholar] [CrossRef]
  16. Klemm, W.; Heusinkveld, B.G.; Lenzholzer, S.; Jacobs, M.H.; Van Hove, B. Psychological and physical impact of urban green spaces on outdoor thermal comfort during summertime in The Netherlands. Build. Environ. 2015, 83, 120–128. [Google Scholar] [CrossRef]
  17. Zhao, N.; Prieur, J.-F.; Liu, Y.; Kneeshaw, D.; Lapointe, E.M.; Paquette, A.; Zinszer, K.; Dupras, J.; Villeneuve, P.J.; Rainham, D.G.; et al. Tree characteristics and environmental noise in complex urban settings—A case study from Montreal, Canada. Environ. Res. 2021, 202, 111887. [Google Scholar] [CrossRef]
  18. Gilbert, K.E. Book Review. J. Sound Vib. 2008, 315, 367. [Google Scholar] [CrossRef]
  19. Ow, L.F.; Ghosh, S. Urban cities and road traffic noise: Reduction through vegetation. Appl. Acoust. 2017, 120, 15–20. [Google Scholar] [CrossRef]
  20. Baldauf, R. Roadside vegetation design characteristics that can improve local, near-road air quality. Transp. Res. Part D Transp. Environ. 2017, 52, 354–361. [Google Scholar] [CrossRef]
  21. Zhang, J.; Gou, Z.; Zhang, F.; Shutter, L. A study of treecrown characteristics andtheir cooling effects in asubtropical city ofAustralia. Ecol. Eng. 2020, 158, 106027. [Google Scholar] [CrossRef]
  22. ISO 7730; Ergonomics of the Thermal Environment Analytical Determination and Interpretation of Thermal Comfort Using Calculation of the PMV and PPD Indices and Local Thermal Comfort Criteria. International Standard Organization: Geneva, Switzerland, 2005.
  23. ASHRAE Standard 55-2004; Thermal Environmental Conditions for Human Occupancy. American Society of Heating, Refrigerating and Air-Conditioning Engineers, Inc.: Atlanta, GA, USA, 2004.
  24. Du, X.; Zhang, Y.; Zhao, S. Research on interaction effect of thermal, light and acoustic environment on human comfort in waiting hall of high-speed railway station. Build. Environ. 2022, 207, 108494. [Google Scholar] [CrossRef]
  25. Zhen, M.; Chen, Z.; Zou, Q. Combined effects of thermal and acoustic environments on outdoor human comfort in university campus. Urban Clim. 2023, 49, 101566. [Google Scholar] [CrossRef]
  26. Teshnehdel, S.; Akbari, H.; Di Giuseppe, E.; Brown, R.D. Effect of tree cover and tree species on microclimate and pedestrian comfort in a residential district in Iran. Build. Environ. 2020, 178, 106899. [Google Scholar] [CrossRef]
  27. Gil-Lopez, T.; Medina-Molina, M.; Verdu-Vazquez, A.; Martel-Rodriguez, B. Acoustic and economic analysis of the use of palm tree pruning waste in noise barriers to mitigate the environmental impact of motorways. Sci. Total Environ. 2017, 584–585, 1066–1076. [Google Scholar] [CrossRef]
  28. Means, T. Köppen Climate Classification System, Science. 2019. Available online: https://www.thoughtco.com/the-worlds-koppen-climates-4109230 (accessed on 14 August 2023).
  29. Report, W. Monthly Temperatures of 2023 in Mianyang. 2023. Available online: https://www.tianqi.com/qiwen/city_mianyang/ (accessed on 5 September 2023).
  30. BEEM. The Annual Environment Quality Condition Report of the Metropolitan Districts of Mianyang in 2021. Available online: https://sthjj.my.gov.cn//myssthjj/c105839/202205/b600a6194c6a4dc0bbf8197139c3c8a9.shtml (accessed on 21 January 2024).
  31. Monteith, J.L.; Unsworth, M.H. Principles of Environmental Physics, 4th ed.; Academic Press: Cambridge, MA, USA, 2014. [Google Scholar]
  32. Wieczerzak, M.; Namieśnik, J.; Kudłak, B. Bioassays as one of the Green Chemistry tools for assessing environmental quality: A review. Environ. Int. 2016, 94, 341–361. [Google Scholar] [CrossRef]
  33. Zhang, S.; Zhang, X.; Niu, D.; Fang, Z.; Chang, H.; Lin, Z. Physiological equivalent temperature-based and universal thermal climate index-based adaptive-rational outdoor thermal comfort models. Build. Environ. 2023, 228, 109900. [Google Scholar] [CrossRef]
  34. Thorsson, S.; Lindberg, F.; Eliasson, I.; Holmer, B. Different methods for estimating the mean radiant temperature in an outdoor urban setting. Int. J. Climatol. 2007, 27, 1983–1993. [Google Scholar] [CrossRef]
  35. Höppe, P. The physiological equivalent temperature – a universal index for the biometeorological assessment of the thermal environment. Int. J. Biometeorol. 1999, 43, 71–75. [Google Scholar] [CrossRef]
  36. Gál, C.V.; Kántor, N. Modeling mean radiant temperature in outdoor spaces, A comparative numerical simulation and validation study. Urban Clim. 2020, 32, 100571. [Google Scholar] [CrossRef]
  37. Morakinyo, T.E.; Kong, L.; Lau, K.K.-L.; Yuan, C.; Ng, E. A study on the impact of shadow-cast and tree species on in-canyon and neighborhood’s thermal comfort. Build. Environ. 2017, 115, 1–17. [Google Scholar] [CrossRef]
  38. Xiong, J.; Cheng, B.; Zhang, J.; Liu, Y.; Tan, X.; Shi, M.; He, X.; Guo, J. A study of waterside microenvironmental factors and their effects on summer outdoor thermal comfort in a Cfa-climate campus. J. Therm. Biol. 2023, 117, 103700. [Google Scholar] [CrossRef]
  39. Wang, S.; Chen, B.; Suo, J.; Zhao, J.R. Impact of building morphology and outdoor environment on light and thermal environment in campus buildings in cold region during winter. Build. Environ. 2021, 204, 108074. [Google Scholar] [CrossRef]
  40. The People’s Government of Dehua County, Q.C. What Are the Classifications of Ambient Noise? 2023. Available online: http://www.dehua.gov.cn (accessed on 5 January 2024).
  41. Dzhambov, A.M.; Dimitrova, D.D. Green spaces and environmental noise perception. Urban For. Urban Green. 2015, 14, 1000–1008. [Google Scholar] [CrossRef]
  42. NoiseNet. Noise—Terms—Energy Averaging [LAeq]. 2000. Available online: http://www.noisenet.org/Noise_Terms_Leq.htm#:~:text=The%20results%20of%20calculations%20or%20measurements%20Such%20measurements,is%20the%20main%20unit%20used%20for%20assessingOccupational%20Noise (accessed on 4 November 2023).
  43. Law Insider, Ltd. 2023. Available online: https://www.lawinsider.com/dictionary/laeq-t#:~:text=The%20total%20equivalent%20continuous%20Aweighted%20sound%20pressure%20level,on%20board%20over%20a%20period%20of%2024%20hours (accessed on 4 November 2023).
  44. Zhang, W.; Xin, F. Broadband low-frequency sound absorption via Helmholtz resonators with porous material lining. J. Sound Vib. 2024, 578, 118330. [Google Scholar] [CrossRef]
  45. Liu, X. Building Physics; China Architecture & Building Press: Beijing, China, 2010; Volume 023793. [Google Scholar]
  46. Motors, P. Whether the Noise of a Car on the Road Is High or Low. 2024. Available online: https://www.pcauto.com.cn/jxwd/2519/25199089.html# (accessed on 25 January 2024).
  47. Zhihu. What Is the General Range of Intensity and Frequency of Noise in Social Life? 2021. Available online: https://www.zhihu.com/question/500891443 (accessed on 25 January 2024).
  48. Lee, C.C.H.; Jeong, D. Measurements of sound absorption coefficients of raked audience seating in a rectangular scale model room. Appl. Acoust. 2024, 217, 109872. [Google Scholar]
  49. Environmental Safety Technology. Noise Prediction Sound Absorption Volume, Sound Absorption Coefficient Value Reference. 2019. Available online: http://www.ihamodel.com/?p=14981 (accessed on 25 January 2024).
  50. Tan, P.Y.; Wong, N.H.; Tan, C.L.; Jusuf, S.K.; Chang, M.F.; Chiam, Z.Q. A method to partition the relative effects of evaporative cooling and shading on air temperature within vegetation canopy. Urban Econ. 2018, 4, juy012. [Google Scholar] [CrossRef]
  51. Zhang, T.; Hong, B.; Su, X.; Li, Y.; Song, L. Effects of tree seasonal characteristics on thermal-visual perception and thermal comfort. Build. Environ. 2022, 212, 108793. [Google Scholar] [CrossRef]
  52. Kotzen, B. An investigation of shade under six different tree species of the Negev desert towards their potential use for enhancing micro-climatic conditions in landscape architectural development. J. Arid. Environ. 2003, 55, 231–274. [Google Scholar] [CrossRef]
  53. Smith, I.A.; Fabian, M.P.; Hutyra, L.R. Urban green space and albedo impacts on surface temperature across seven United States cities. Sci. Total Environ. 2023, 857, 159663. [Google Scholar] [CrossRef]
  54. Yang, Y.; Tang, M.; Xie, H.; Ran, M.; Chen, Z.; Kang, J. Building Physics (Graphic Edition II); China Architecture & Building Press: Beijing, China, 2020. [Google Scholar]
  55. WinSCANOPY. WinSCANOPY 2017a Is Used for Canopy Analysis; Regent Instrument Inc.: Québec, QC, Canada, 2017; Available online: https://regentinstruments.com/ (accessed on 3 November 2023).
  56. Elnabawi, M.H.; Hamza, N.; Raveendran, R. ‘Super cool roofs’: Mitigating the UHI effect and enhancing urban thermal comfort with high albedo-coated roofs. Results Eng. 2023, 19, 101269. [Google Scholar] [CrossRef]
  57. Amani-Beni, M.; Zhang, B.; Xie, G.-D.; Xu, J. Impact of urban park’s tree, grass and waterbody on microclimate in hot summer days: A case study of Olympic Park in Beijing, China. Urban For. Urban Green. 2018, 32, 1–6. [Google Scholar] [CrossRef]
  58. Testo 480. Multi-Function Measuring Instrument Testo 480 for Norm-Compliant VAC Measurements. 2023. Available online: https://www.testo.com/en/testo-480/p/0563-4800 (accessed on 4 November 2023).
  59. Jeon, J.Y.; Hong, J.Y. Classification of urban park soundscapes through perceptions of the acoustical environments. Landsc. Urban Plan. 2015, 141, 100–111. [Google Scholar] [CrossRef]
  60. Choi, H.; Jeong, B.; Lee, J.; Na, H.; Kang, K.; Kim, T. Deep-vision-based metabolic rate and clothing insulation estimation for occupant-centric control. Build. Environ. 2022, 211, 109345. [Google Scholar] [CrossRef]
  61. ISO 7726; Ergonomics of the Thermal Environment—Instruments for Measuring Physical Quantities. Available online: https://cdn.standards.iteh.ai/samples/14562/0f8ba16a6e4d454f95d38708649e538a/ISO-7726-1998.pdf (accessed on 2 October 2024).
  62. Uyanık, G.K.; Güler, N. A Study on Multiple Linear Regression Analysis. Procedia-Soc. Behav. Sci. 2013, 106, 234–240. [Google Scholar] [CrossRef]
  63. Zhang, J.; Zhang, F.; Gou, Z.; Liu, J. Assessment of macroclimate and microclimate effects on outdoor thermal comfort via artificial neural network models. Urban Clim. 2022, 42, 101134. [Google Scholar] [CrossRef]
  64. Lee, Y.Y.; Kim, J.T.; Yun, G.Y. The neural network predictive model for heat island intensity in Seoul. Energy Build. 2016, 110, 353–361. [Google Scholar] [CrossRef]
  65. Zhihu. Types and Hazards of Noise. 2021. Available online: https://zhuanlan.zhihu.com/p/369781901 (accessed on 21 January 2024).
  66. Zhang, J.; Gou, Z.; Zhang, F.; Yu, R. The tree cooling pond effect and its influential factors: A pilot study in Gold Coast, Australia. Nat.-Based Solut. 2023, 3, 100058. [Google Scholar] [CrossRef]
  67. Wang, C.; Ren, Z.; Chang, X.; Wang, G.; Hong, X.; Dong, Y.; Guo, Y.; Zhang, P.; Ma, Z.; Wang, W. Understanding the cooling capacity and its potential drivers in urban forests at the single tree and cluster scales. Sustain. Cities Soc. 2023, 93, 104531. [Google Scholar] [CrossRef]
  68. Dong, Q.; Xu, X.; Zhen, M. Assessing the cooling and buildings’ energy-saving potential of urban trees in severe cold region of China during summer. Build. Environ. 2023, 244, 110818. [Google Scholar] [CrossRef]
  69. Huang, J.; Kong, F.; Yin, H.; Middel, A.; Liu, H.; Zheng, X.; Wen, Z.; Wang, D. Transpirational cooling and physiological responses of trees to heat. Agric. For. Meteorol. 2022, 320, 108940. [Google Scholar] [CrossRef]
  70. Yuan, W.; Zhu, N.; Zhang, L.; Tong, R.; Miao, Y.; Zhou, F.; Geoff Wang, G.; Wu, T. Three-dimensional aerodynamic structure estimation and wind field simulation for wide tree shelterbelts. For. Ecol. Manag. 2024, 559, 121813. [Google Scholar] [CrossRef]
  71. Kim, J.; Khouakhi, A.; Corstanje, R.; Johnston, A.S.A. Greater local cooling effects of trees across globally distributed urban green spaces. Sci. Total Environ. 2024, 911, 168494. [Google Scholar] [CrossRef]
  72. Cabon, A.; Ameztegui, A.; Anderegg, W.R.L.; Martínez-Vilalta, J.; De Cáceres, M. Probing the interplay of biophysical constraints and photosynthesis to model tree growth. Agric. For. Meteorol. 2024, 345, 109852. [Google Scholar] [CrossRef]
  73. Wang, Z.; White, J.D.; Hockaday, W.C. The molecular composition of leaf lipids changes with seasonal gradients in temperature and light among deciduous and evergreen trees in a sub-humid ecosystem. Org. Geochem. 2024, 187, 104709. [Google Scholar] [CrossRef]
  74. Sharmin, M.; Tjoelker, M.G.; Pfautsch, S.; Esperon-Rodriguez, M.; Rymer, P.D.; Power, S.A. Tree crown traits and planting context contribute to reducing urban heat. Urban For. Urban Green. 2023, 83, 127913. [Google Scholar] [CrossRef]
  75. Zhihu. Absorption of Sound Energy. 2024. Available online: https://zhuanlan.zhihu.com/p/684396685# (accessed on 18 March 2024).
  76. Zhihu. Basic Types of Sound-Absorbing Materials (Porous and Resonant). 2021. Available online: https://zhuanlan.zhihu.com/p/354959542 (accessed on 18 March 2024).
  77. Ding, L.; Van Renterghem, T.; Botteldooren, D.; Horoshenkov, K.; Khan, A. Sound absorption of porous substrates covered by foliage: Experimental results and numerical predictions. J. Acoust. Soc. Am. 2013, 134, 4599–4609. [Google Scholar] [CrossRef]
  78. Li, M.; Van Renterghem, T.; Kang, J.; Verheyen, K.; Botteldooren, D. Sound absorption by tree bark. Appl. Acoust. 2020, 165, 107328. [Google Scholar] [CrossRef]
  79. Van Renterghem, T.; Forssén, J.; Attenborough, K.; Jean, P.; Defrance, J.; Hornikx, M.; Kang, J. Using natural means to reduce surface transport noise during propagation outdoors. Appl. Acoust. 2015, 92, 86–101. [Google Scholar] [CrossRef]
  80. Attenborough, K.; Van Renterghem, T. Predicting Outdoor Sound; CRC Press: Boca Raton, FL, USA, 2021; Volume 134. [Google Scholar]
  81. Bai, Y.; Jin, H. Effects of visual, thermal, and acoustic comfort on the psychological restoration of the older people in a severe cold city. Build. Environ. 2023, 239, 110402. [Google Scholar] [CrossRef]
  82. Rychtáriková, M.; Jedovnický, M.; Vargová, A.; Glorieux, C. Synthesis of a Virtual Urban Soundscape. Buildings 2014, 4, 139–154. [Google Scholar] [CrossRef]
  83. Baquero Larriva, M.T.; Higueras, E. Health risk for older adults in Madrid, by outdoor thermal and acoustic comfort. Urban Clim. 2020, 34, 100724. [Google Scholar] [CrossRef]
  84. Cohen, P.; Shashua-Bar, L.; Keller, R.; Gil-Ad, R.; Yaakov, Y.; Lukyanov, V.; Bar, P.; Tanny, J.; Cohen, S.; Potchter, O. Urban outdoor thermal perception in hot arid Beer Sheva, Israel: Methodological and gender aspects. Build. Environ. 2019, 160, 106169. [Google Scholar] [CrossRef]
  85. Abdollahzadeh, S.M.; Heidari, S.; Einifar, A. Evaluating thermal comfort and neutral temperature in residential apartments in hot and dry climate: A case study in Shiraz, Iran. J. Build. Eng. 2023, 76, 107161. [Google Scholar] [CrossRef]
  86. Middel, A.; Selover, N.; Hagen, B.; Chhetri, N. Impact of shade on outdoor thermal comfort—A seasonal field study in Tempe, Arizona. Int. J. Biometeorol. 2016, 60, 1849–1861. [Google Scholar] [CrossRef]
  87. Jin, Y.; Jin, H.; Kang, J. Combined effects of the thermal-acoustic environment on subjective evaluations in urban squares. Build. Environ. 2020, 168, 106517. [Google Scholar] [CrossRef]
  88. SOHU.com. What Are the Roles and Functions of Urban Greening? 2019. Available online: https://www.sohu.com/a/327689078_120035296 (accessed on 25 January 2024).
  89. Ba, M.; Kang, J. Effect of a fragrant tree on the perception of traffic noise. Build. Environ. 2019, 156, 147–155. [Google Scholar] [CrossRef]
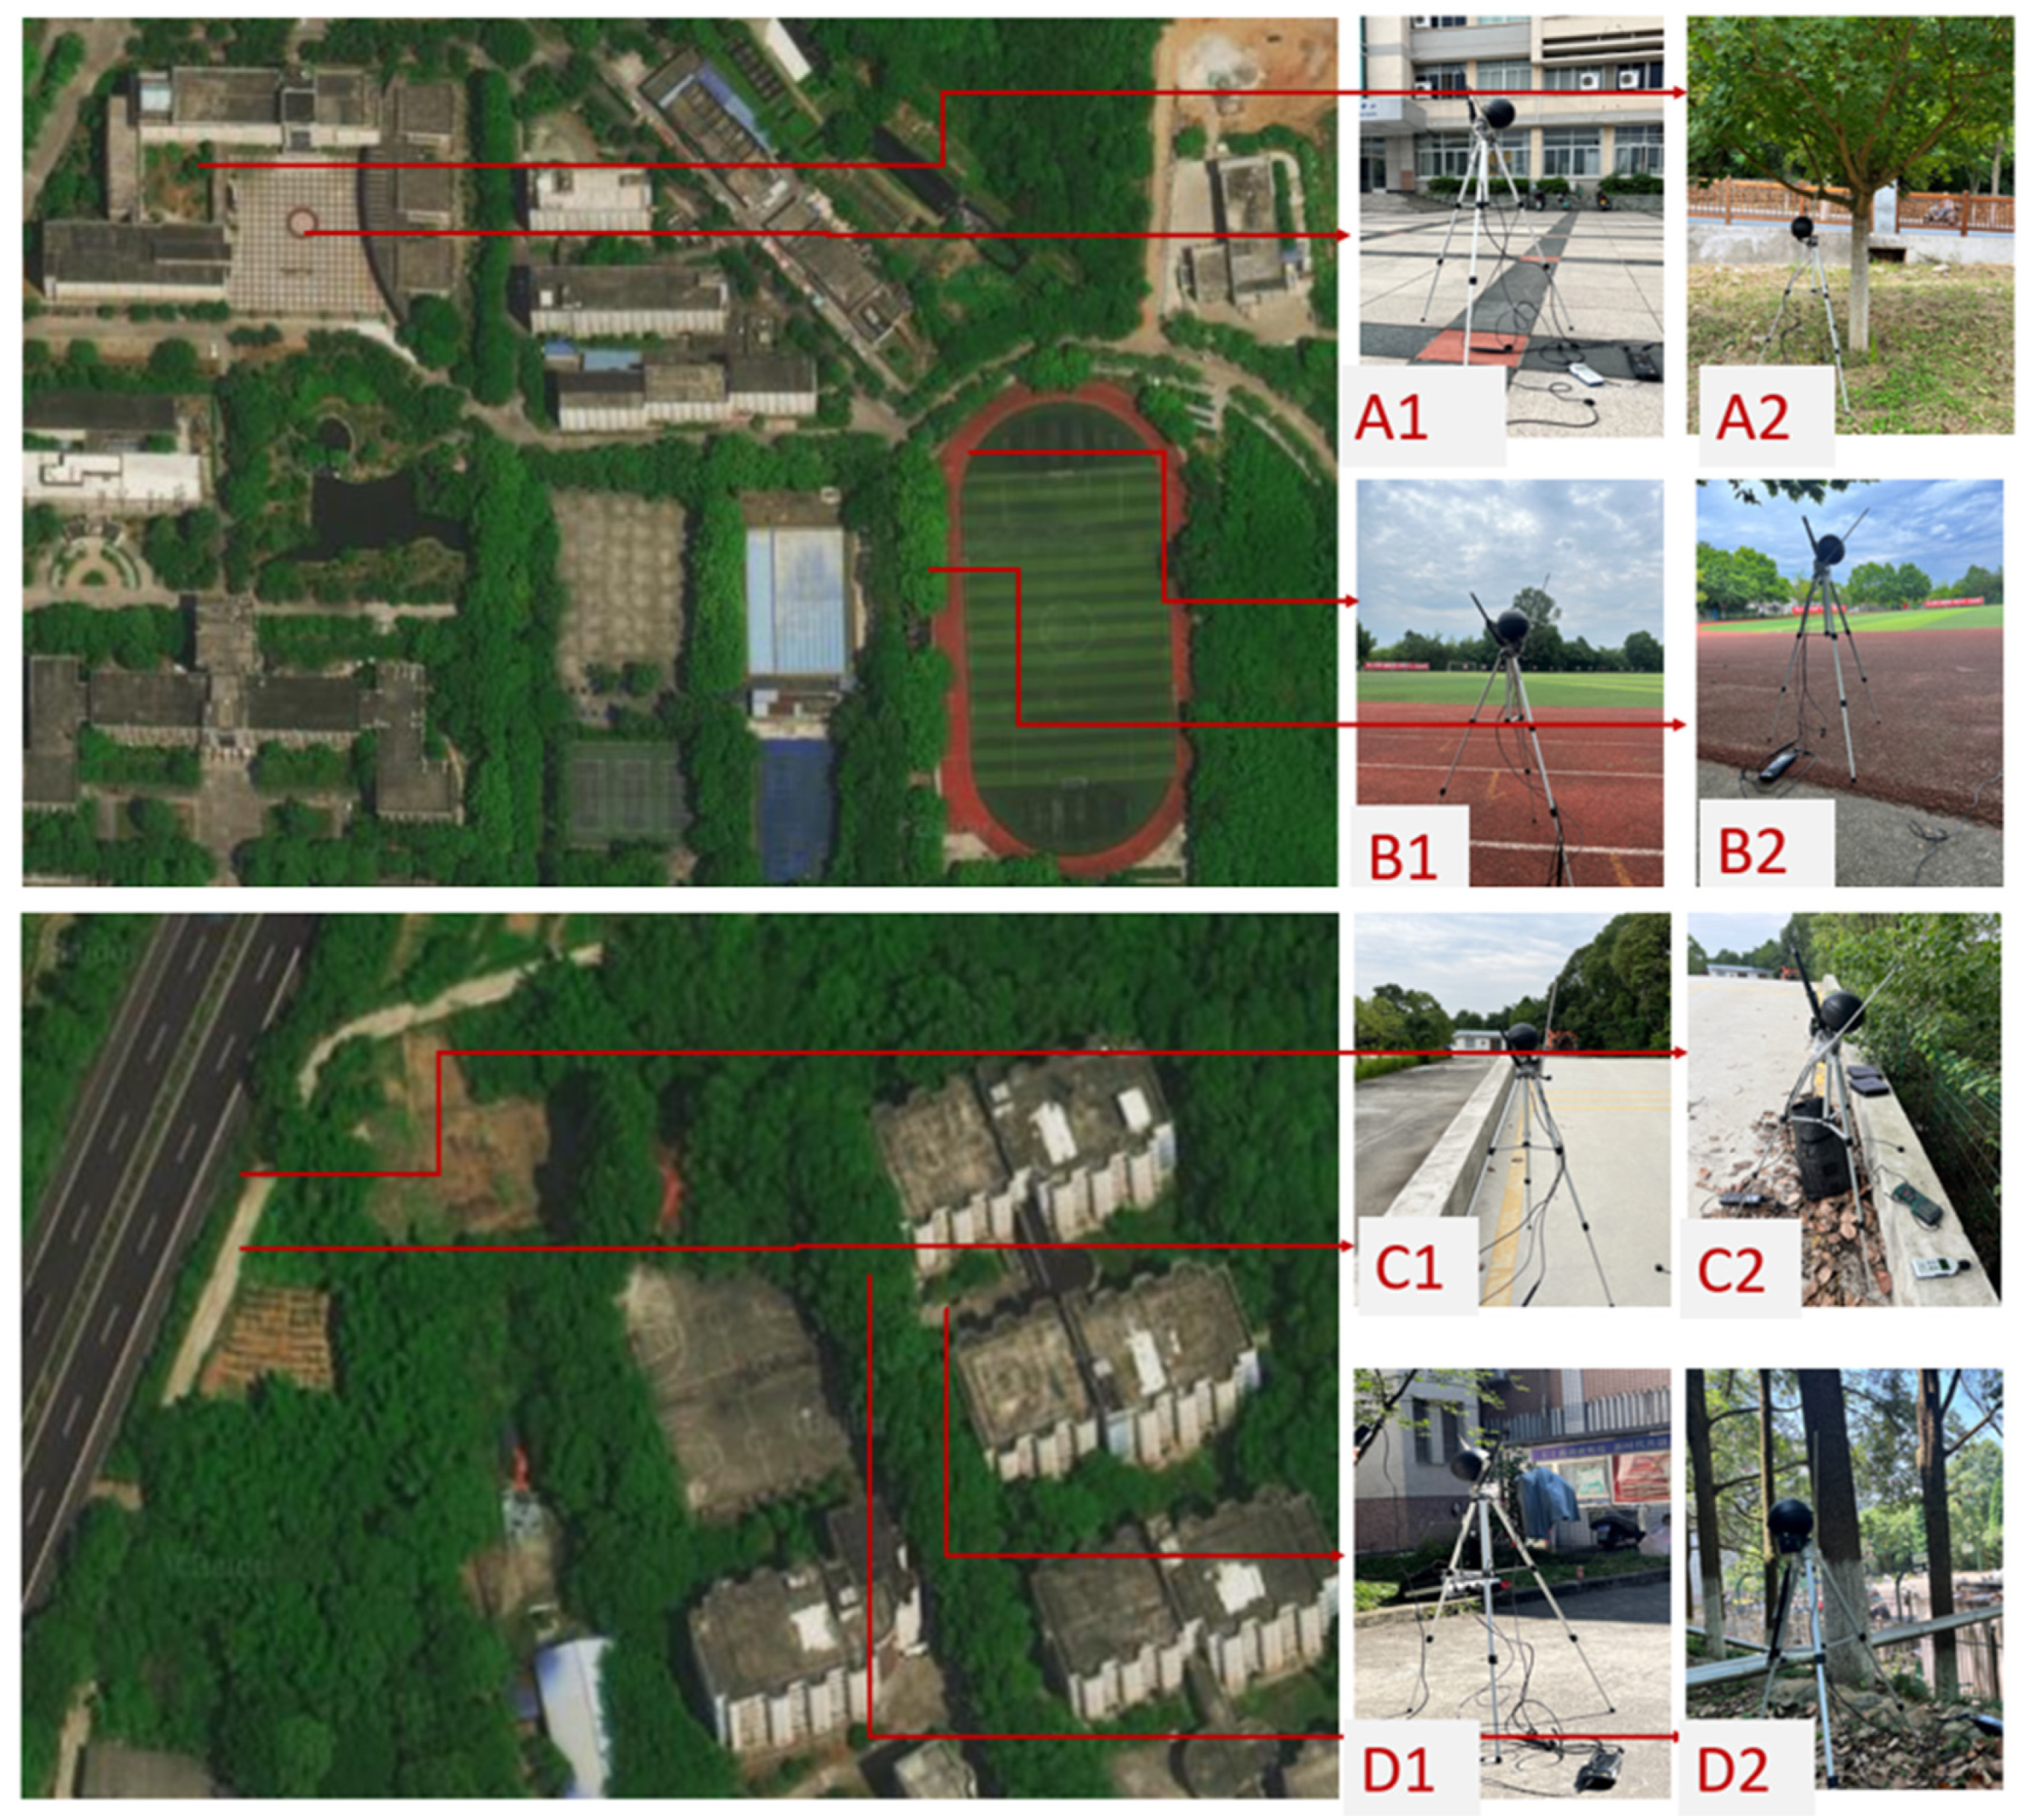
Figure 1. Locations of Points A–D and their surrounding environments (A, the education area; B, the sport field; C, nearby the express way; D, the residence space) [31].
Acoustics 06 00050 g001
Figure 2. Locations of Points E–H and their surrounding environments (E, nearby the express way; F, the education area; G, the sport field; H, the residence space) [31].
Acoustics 06 00050 g002
Figure 3. SVF images of all measured sites.
Acoustics 06 00050 g003
Figure 4. PET ranges of all points in the WZ and EZ.
Acoustics 06 00050 g004
Figure 5. LAeq ranges of all points in the WZ and EZ.
Acoustics 06 00050 g005
Figure 6. Polynomial relationships between ΔPET and ΔLAeq and TCD.
Acoustics 06 00050 g006
Figure 7. Correlations between PET and TSV in different scopes (polynomial).
Acoustics 06 00050 g007
Figure 8. Relationship of LAeq to ASV and ACV in the WZ and EZ and overall.
Acoustics 06 00050 g008
Figure 9. Polynomial correlations between TSV and PET under various types of noises for the whole campus.
Acoustics 06 00050 g009
Figure 10. Polynomial correlations between TSV and PET under various types of noises in the WZ.
Acoustics 06 00050 g010
Figure 11. Polynomial correlations between TSV and PET under various types of noises in the EZ.
Acoustics 06 00050 g011
Figure 12. Linear correlations between ASV and LAeq under various types of noises in the whole campus.
Acoustics 06 00050 g012
Figure 13. Linear correlations between ASV and LAeq under various types of noises in the WZ.
Acoustics 06 00050 g013
Figure 14. Linear correlations between ASV and LAeq under various types of noises in the EZ.
Acoustics 06 00050 g014
Figure 15. Linear correlations between ACV and LAeq under various noise backgrounds for the whole campus.
Acoustics 06 00050 g015
Figure 16. Linear correlations between ACV and LAeq under various noise backgrounds in the WZ.
Acoustics 06 00050 g016
Figure 17. Linear correlations between ACV and LAeq under various backgrounds in the EZ.
Acoustics 06 00050 g017
Table 1. The measurement dates and characteristics of all points.
DatePointSpace CharacteristicsSpecies of TreeType of NoiseSVF (-)Albedo (-)Acoustic Absorption Coefficient (-)
1 JulyA1Next to the school buildingLigustrum lucidum Ait. (evergreen broad-leaved plant)Teaching0.53 0.20.02
1 JulyA2A tree in the lawnTeaching0.10.180.63
5 JulyB1Next to the sports fieldPaulownia tree (deciduous tree)Sports0.110.250.36
5 JulyB2A tree in the lawnSports0.090.250.36
6 JulyC1Next to the highwayBroussonetia papyrifera (deciduous tree)Tran0.40.20.02
6 JulyC2A tree in the lawnTran0.230.20.02
7 JulyD1Next to the dormitory buildingCinnamomum camphora (evergreen broad-leaved plant) Dormitory0.170.20.02
7 JulyD2A tree in the lawnDormitory0.020.180.63
5 SeptemberE1Next to the highwayMetasequoia (deciduous tree)Teaching0.570.10.65
5 SeptemberE2A tree in the lawnTeaching0.040.10.65
6 SeptemberF1Next to the school buildingBauhinia purpurea L. (evergreen tree)Tran0.610.20.02
6 SeptemberF2A tree in the lawnTran0.160.180.36
13 SeptemberG1Next to the sports fieldGleditsia sinensis Lam (deciduous tree)Sports0.140.250.36
13 SeptemberG2A tree in the lawnSports0.040.180.63
14 SeptemberH1Next to the dormitory buildingCinnamomum camphora (evergreen broad-leaved plant) Dormitory0.420.10.65
14 SeptemberH2A tree in the lawnDormitory0.060.10.65
Table 2. Properties of all sensors [1,58].
InstrumentParametersRangePrecision
Testo 480Air temperature 0–50 °C±0.5 °C
Relative humidity0–100%±(1.8% RH + 0.7%)
Globe temperature0–120 °C±(0.3 + 0.1%)
Air velocity0–20 m/s±(0.03 + 0.5%)
AWA5688A-weighted sound pressure level28–133 dBA/
Table 3. Analysis results using the ANN model between ΔPET and impacting factors.
Dependent VariableΔPETΔPET
ImportanceNormalised Importance
TCD0.465100%
ΔSVF0.10923.5%
ΔAlbedo0.42691.7%
Validation testy = 0.70247x + 0.95426 R² = 0.72015, Sig. = 0.000
Table 4. Analysis results using the ANN model between ΔLAeq and impacting factors.
Dependent VariableΔLAeqΔLAeq
ImportanceNormalised Importance
TCD0.546100%
ΔSVF0.22541.4%
ΔAcoustic absorption coefficient0.22941.7%
Validation testy = 0.51044x + 2.08533 R² = 0.52982, Sig. = 0.000
Table 5. Comparison of NPET and NLAeq in summer in different cities.
CityLocal Climate ClassificationSummer NPET (°C) Summer NLAeq (dBA)
Xi’anCwa\68.6 (seniors)Bai and Jin [81]
LeuvenCfb\50–55 dBA (pleasant); 60–66 dBA were just acceptableRychtáriková, et al. [82]
MadridBSk\>55Baquero Larriva and Higueras [83]
Beer ShevaBSh22.8\Cohen, et al. [84]
Shiraz BSk27.1\Abdollahzadeh, et al. [85]
Tempe, ArizonaBWh26.3\Middel, et al. [86]
MianyangCfa23.852.2This study
Disclaimer/Publisher’s Note: The statements, opinions and data contained in all publications are solely those of the individual author(s) and contributor(s) and not of MDPI and/or the editor(s). MDPI and/or the editor(s) disclaim responsibility for any injury to people or property resulting from any ideas, methods, instructions or products referred to in the content.