Article

Acoustics in Baroque Catholic Church Spaces

by
Enedina Alberdi
1,
Miguel Galindo
2,*,
Angel L. León-Rodríguez
1 and
Jesús León
1
1
Instituto Universitario de Arquitectura y Ciencias de la Construcción (IUACC), Departamento de Construcciones Arquitectónicas 1, Universidad de Sevilla, Av. Reina Mercedes 2, 41012 Seville, Spain
2
Instituto Universitario de Arquitectura y Ciencias de la Construcción (IUACC), Departamento de Física Aplicada II, Universidad de Sevilla, Av. Reina Mercedes 2, 41012 Seville, Spain
*
Author to whom correspondence should be addressed.
Acoustics 2024, 6(4), 911-932; https://doi.org/10.3390/acoustics6040051 (registering DOI)
Submission received: 25 July 2024 / Revised: 20 September 2024 / Accepted: 23 October 2024 / Published: 30 October 2024
(This article belongs to the Special Issue Building Materials and Acoustics (2nd Edition))

Abstract

:
After the Council of Trent (1545–1563), the Catholic Church undertook a profound renovation, which affected the spatial configuration of the churches to adjust to the spirit of the Counter-Reformation. The acoustic cultural heritage in these spaces have been studied by different researchers, proposing the joint analysis of 66 Catholic churches from the Baroque period. This study delves into the global characterisation of the sample and establishes correlations between geometric and acoustic parameters. From the acoustic analysis, it is clear that the central floor typology, as opposed to Latin cross churches, presents better average values of musical clarity in relation to their volume. The analysis of the relationship between acoustic and geometric parameters, when the sample of churches is discriminated by typology, allows for the establishment of appropriate correlations for Latin cross floor plans, single naves and basilicas, but not when the analysis is carried out for the entire sample. These correlations are a tool that allows us to evaluate acoustic parameters not measured in situ in Catholic churches of the Baroque period in a predictive way as a function of other measured acoustic or geometric parameters.

1. Introduction

The Baroque style in Europe was born from the religious confrontation between Protestants and Catholics, prompting changes in mentality that were unequivocally reflected in cultural aspects, and in turn, in the definition of buildings, especially churches. This new style, which emerged in Europe, spread to South America as part of the inevitable transfer of knowledge that had been taking place between both continents since the arrival of Europeans in the Americas.
At the Council of Trent (1545–1563), convened in response to the Protestant Reformation, decisions were made regarding aspects other than Catholic doctrine and rites. As Navarro and Sendra [1] highlighted, while in Protestant churches, everything revolves around the word, the aspect of visibility must also be considered in Catholic churches as the word is accompanied by ritual gesture. In any case, both Catholic and Protestant churches show a greater concern for the intelligibility of the word, and during the Baroque period, this concern spread to other areas such as theatre, where elements such as the proscenium arch [2] were introduced.
In the final sessions of the Council, questions were raised concerning the architectural characteristics of the churches, as detailed by the Jesuit Carlos Borromeo in his book Fabricae et Supellectilis Ecclesiasticae [3]. In the case of floor plans, the cross shape, preferably Latin and single-nave, is proposed as a symbol of Christianity and favoured over the central floor plan, which was considered more appropriate by Renaissance architects.
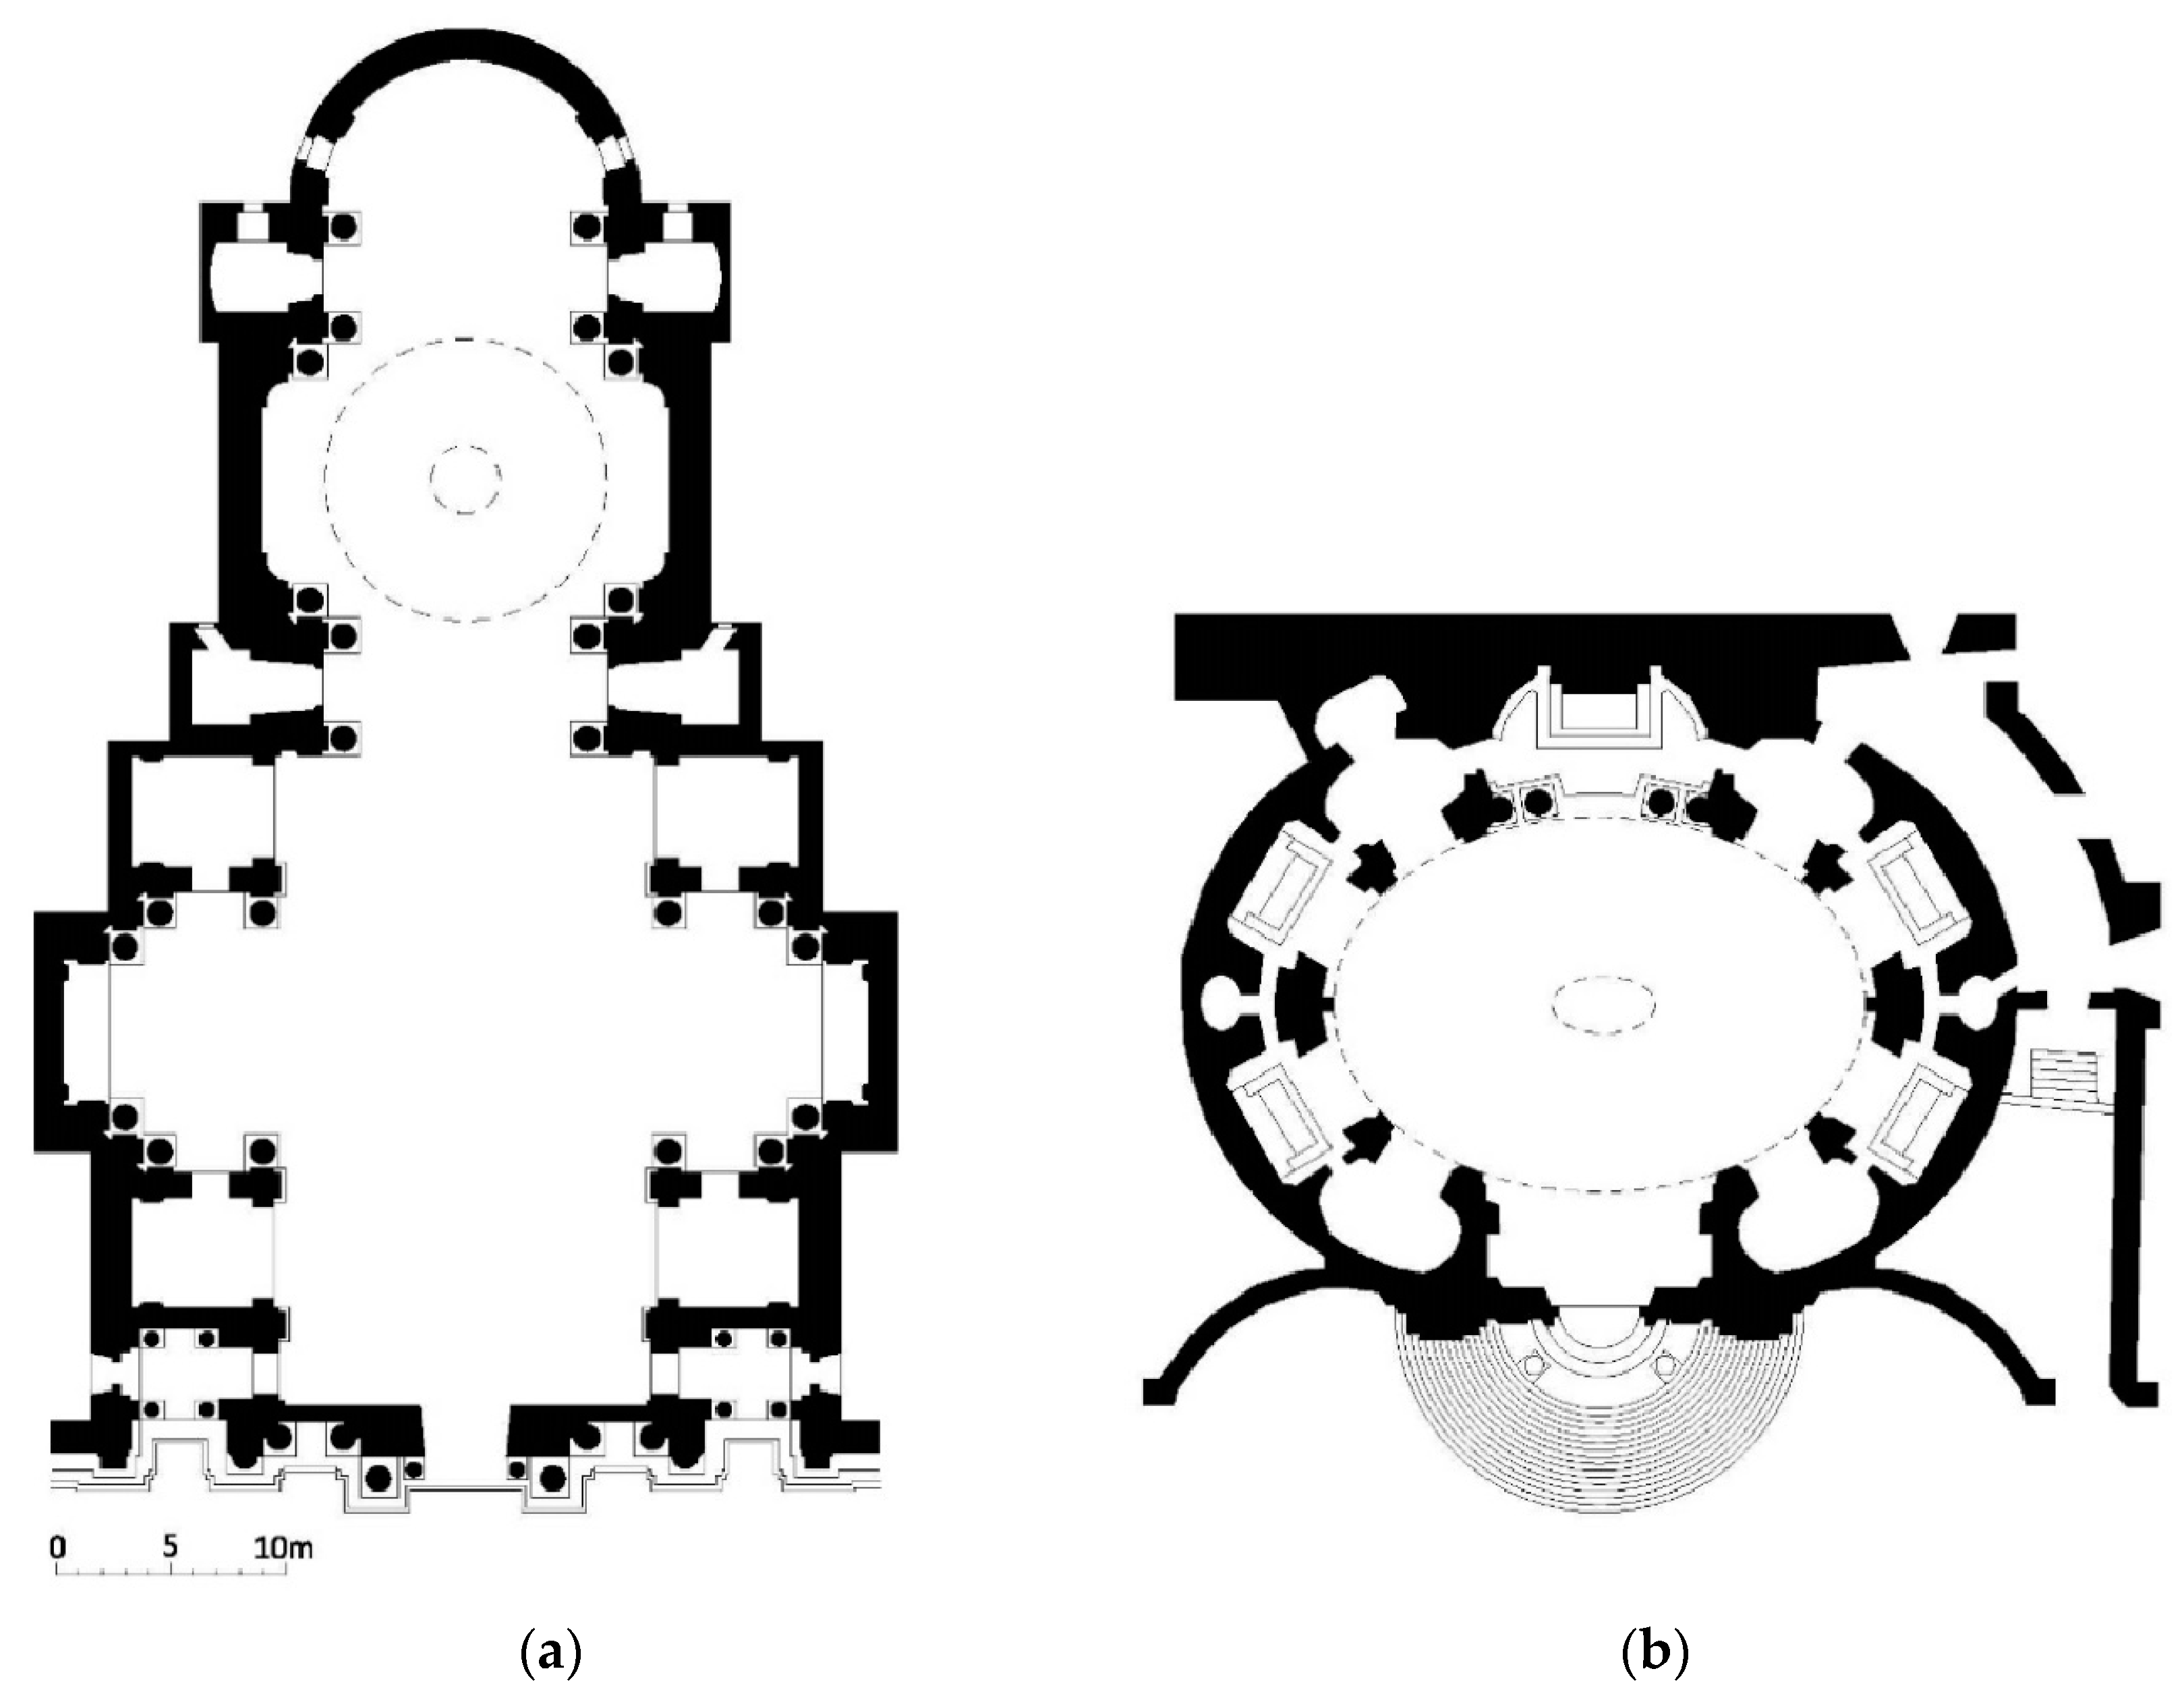
The starting point of Baroque churches can be traced back to the church of Il Gesú in Rome. Churches with a central longitudinal plan or elongated central plan are based on this model, while the dome appears as the centralising element in larger churches. The smaller churches and chapels are resolved on many occasions with a central plan organised on a longitudinal axis [4], developed from three types: circular, Greek cross and oval. According to Sendra and Navarro [1], when examining typologies, we can take the church of Santa Maria in Campitelli, by the architect Carlo Rainaldi, as an example as it clearly follows the longitudinal plan scheme, while the oval plan of San Andrea al Quirinale by Bernini, also in Rome, corresponds to the central plan model (Figure 1).
This church by Bernini is a clear example of the substitution of rectilinear forms for curved forms in a concave and convex succession aiming to create a greater overall dynamic effect. Bernini achieves a non-centripetal space in an oval-shaped central plan by lengthening the transversal axis of the oval and placing pilasters at the ends instead of chapels. For Wittkober, R. [5], this model paved the way for the solution of central floor plans suited to liturgical needs, something that had not been the case until then.
The influence of Baroque architecture, which had originated in Rome, reached Central Europe, where it can be clearly seen in examples such as Karlskirche in Vienna (Austria, 1715–1737), by the architect J.B. Fischer von Erlach, or the pilgrimage church of Wieskirche in Wies-bei-Steingaden, (Germany, 1745–1757), designed by Zimmermann. The Baroque style, which spread through Europe following its creation in Italy, adapts to the materials and constructive capacities of individual regions, at times displaying unique features. This was the case in Andalusia (Spain) with the development of the Andalusian Baroque, where local artists blended the Mudejar and Baroque traditions, combining them with a clear Italian influence. This fusion of styles also spread to Latin America, where it was widely developed.
In terms of acoustics, especially high-pitched sounds, as indicated by Navarro and Sendra [1], the conditions in Baroque churches improved with respect to the earlier Renaissance churches, mainly due to ornamentation. The mouldings, pilasters, entablatures, cornices, capitals, wooden altarpieces and other decorative elements contribute to the better diffusion of high-frequency sounds, while the larger side chapels result in a greater diffusion of low-pitched sounds. Thus, they show that the extensive ornamentation used in churches during the 17th and 18th centuries, especially in large religious celebrations, results in modified characteristics for the acoustic absorption of the walls, accommodating musical and choral performances.
In the last 50 years, different research groups have carried out numerous studies aimed at ascertaining the acoustic conditions of places of worship of different characteristics and periods. Many of these were collected in the study carried out by Girón [6] et al., which offers a comprehensive review of acoustics in churches over time. In this work, we will focus exclusively on the comprehensive review of the acoustics of the Catholic religious spaces of the Baroque period between the second half of the 16th century and the first half of the 18th century.
In the field of acoustics concerning Catholic Baroque church spaces, it is worth highlighting the studies by Lottermoser [7], who analysed the reverberation times by frequency in five Baroque churches belonging to abbeys in Swabia and Alsace (Germany), noting that the acoustic properties are especially favourable in these enclosures (Figure 2).
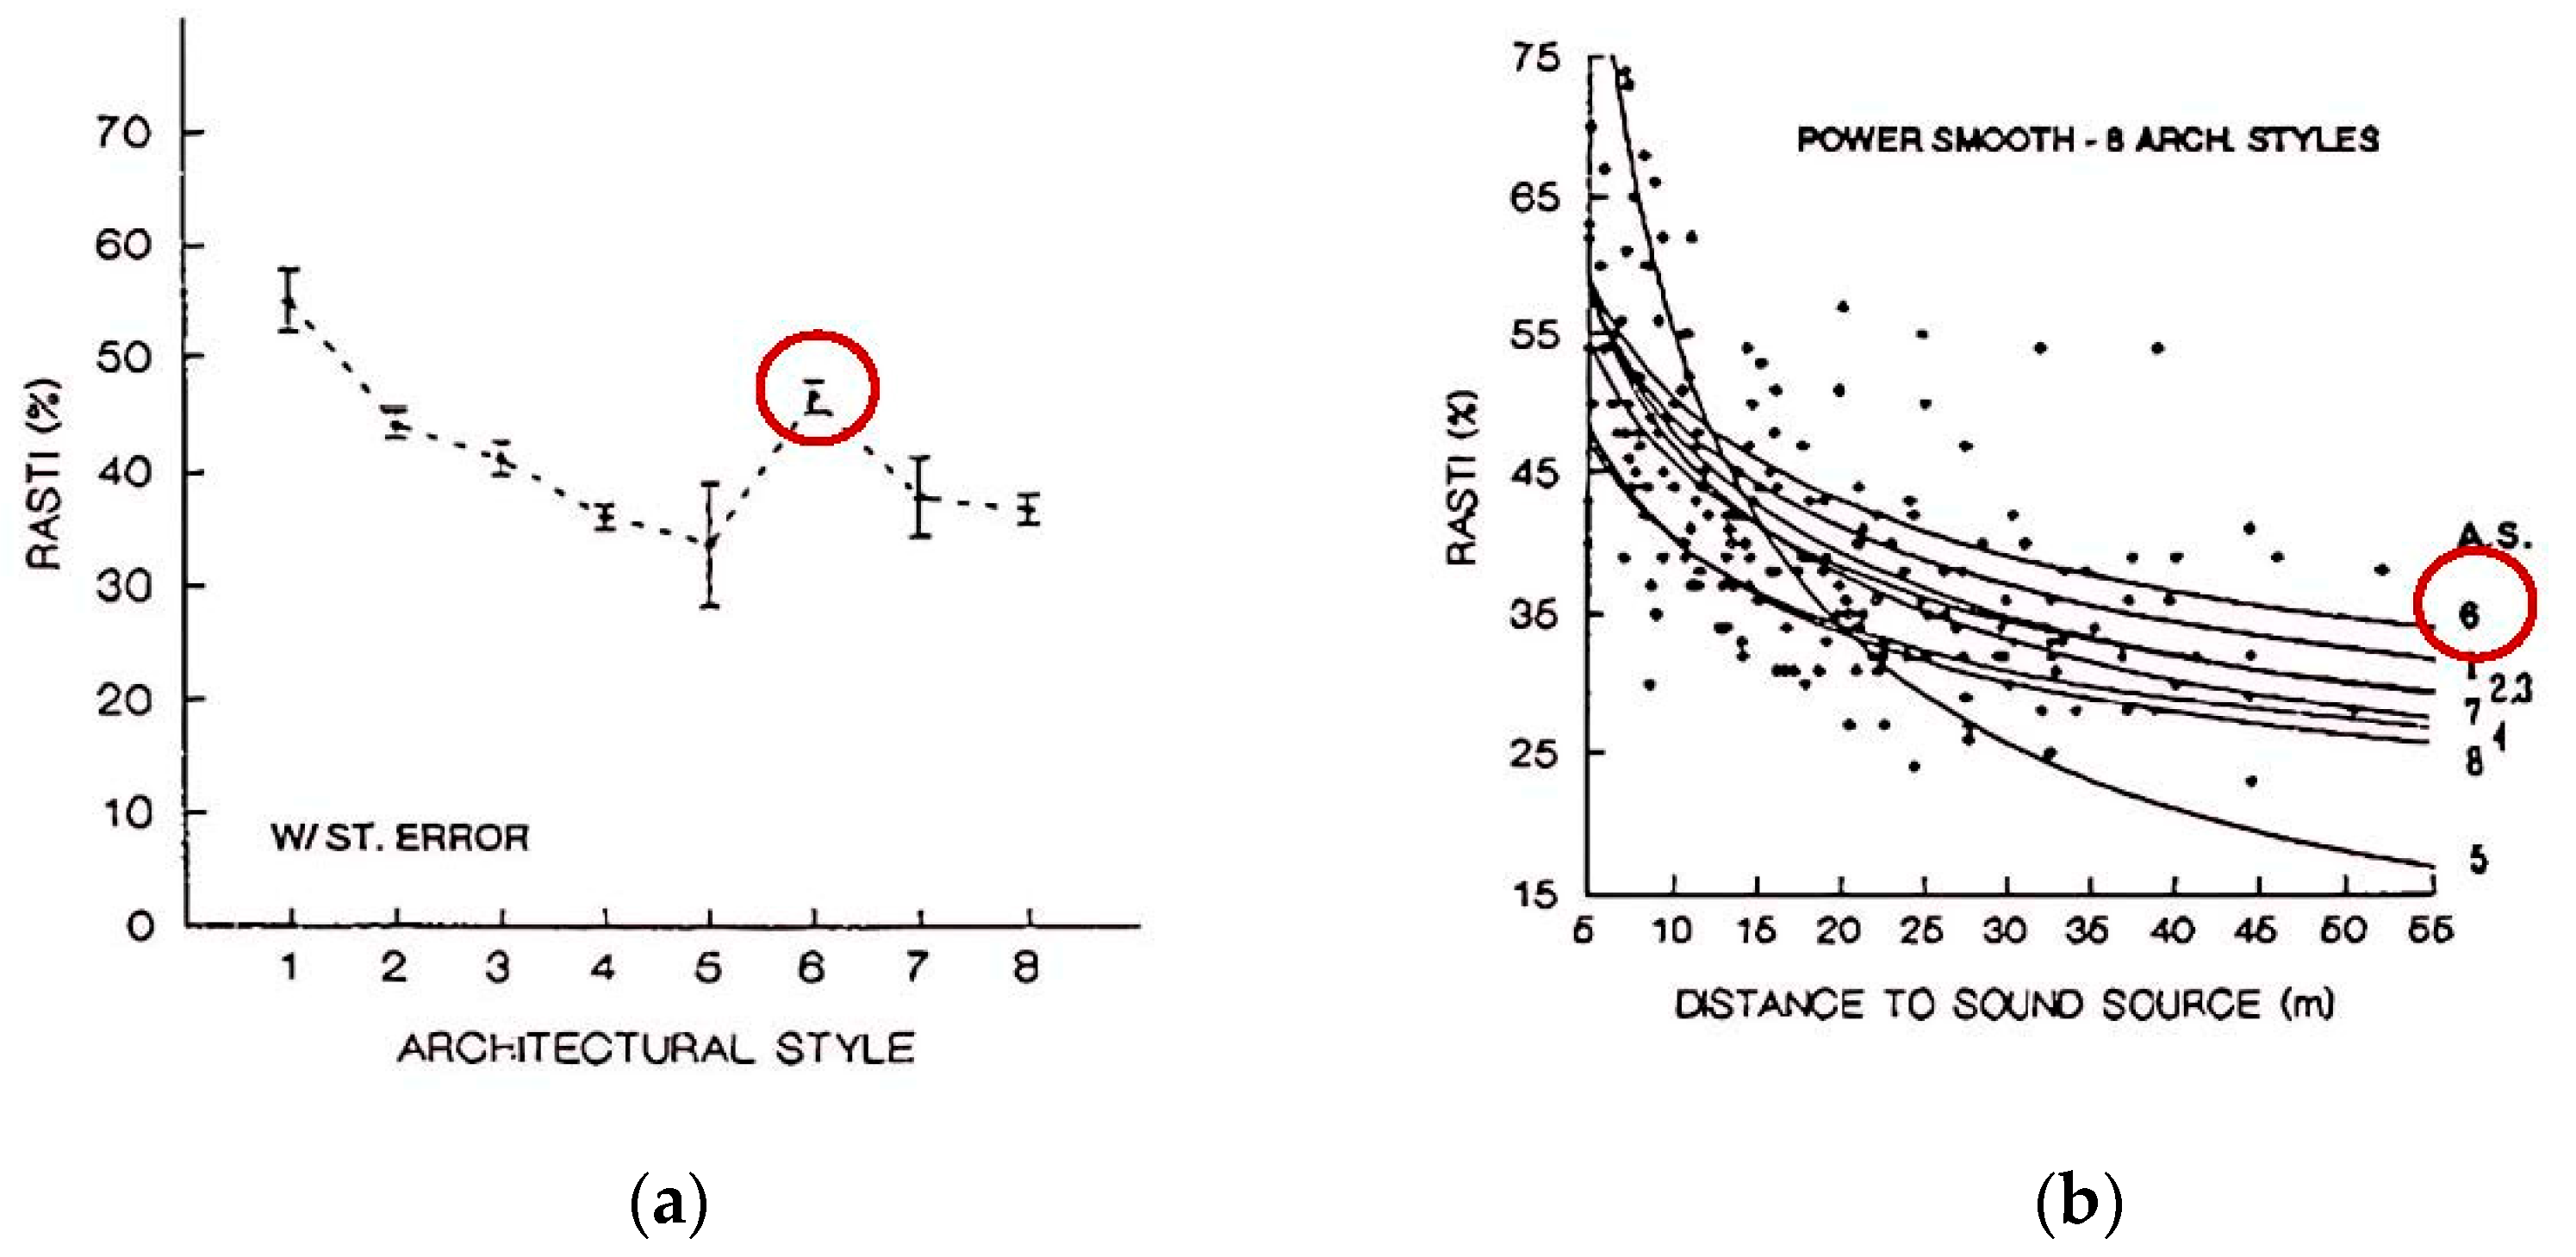
In Portugal, Carvalho and Desarnaulds [8,9] analysed a wide sample of Portuguese Catholic churches of different styles, including at least eight Baroque churches from the 17th and 18th centuries. In his studies, monaural and binaural parameters were analysed, observing improved speech intelligibility in churches from the Baroque period. The studies focusing on the analysis of the average RASTI values stand out, as these decreased from the Visigoth period to the Renaissance, later increased in the Baroque, and decreased again until the present (Figure 3).
A large group of researchers in Italy has analysed the acoustics of church buildings. In addition, the studies carried out by Shankland [10] on patriarchal basilicas show that the large number of diffusing surfaces found in Baroque decoration contribute to increased absorption, while also increasing the potential presence of coupled spaces in the side naves of churches. Cirillo-Martellotta [11] carried out an interesting analysis of liturgy, architecture and acoustics, studying a group of thirty-one churches, six of which are in the Baroque style. The construction process, architectural characteristics, interior materials and main dimensions of the individual characteristics are presented to ultimately contribute a single-number value of the main acoustic parameters related to the subjective characteristics of human hearing. Among the main conclusions, it is worth highlighting the volume of the enclosures for the architectural style, which, with an average volume of 14,000 m3 for the sample of Baroque churches, is smaller than in previous architectural styles. When comparing the reverberation time against the architectural style, a decrease can be observed in relation to its predecessors, as reflected by Carvalho in the Portuguese churches.
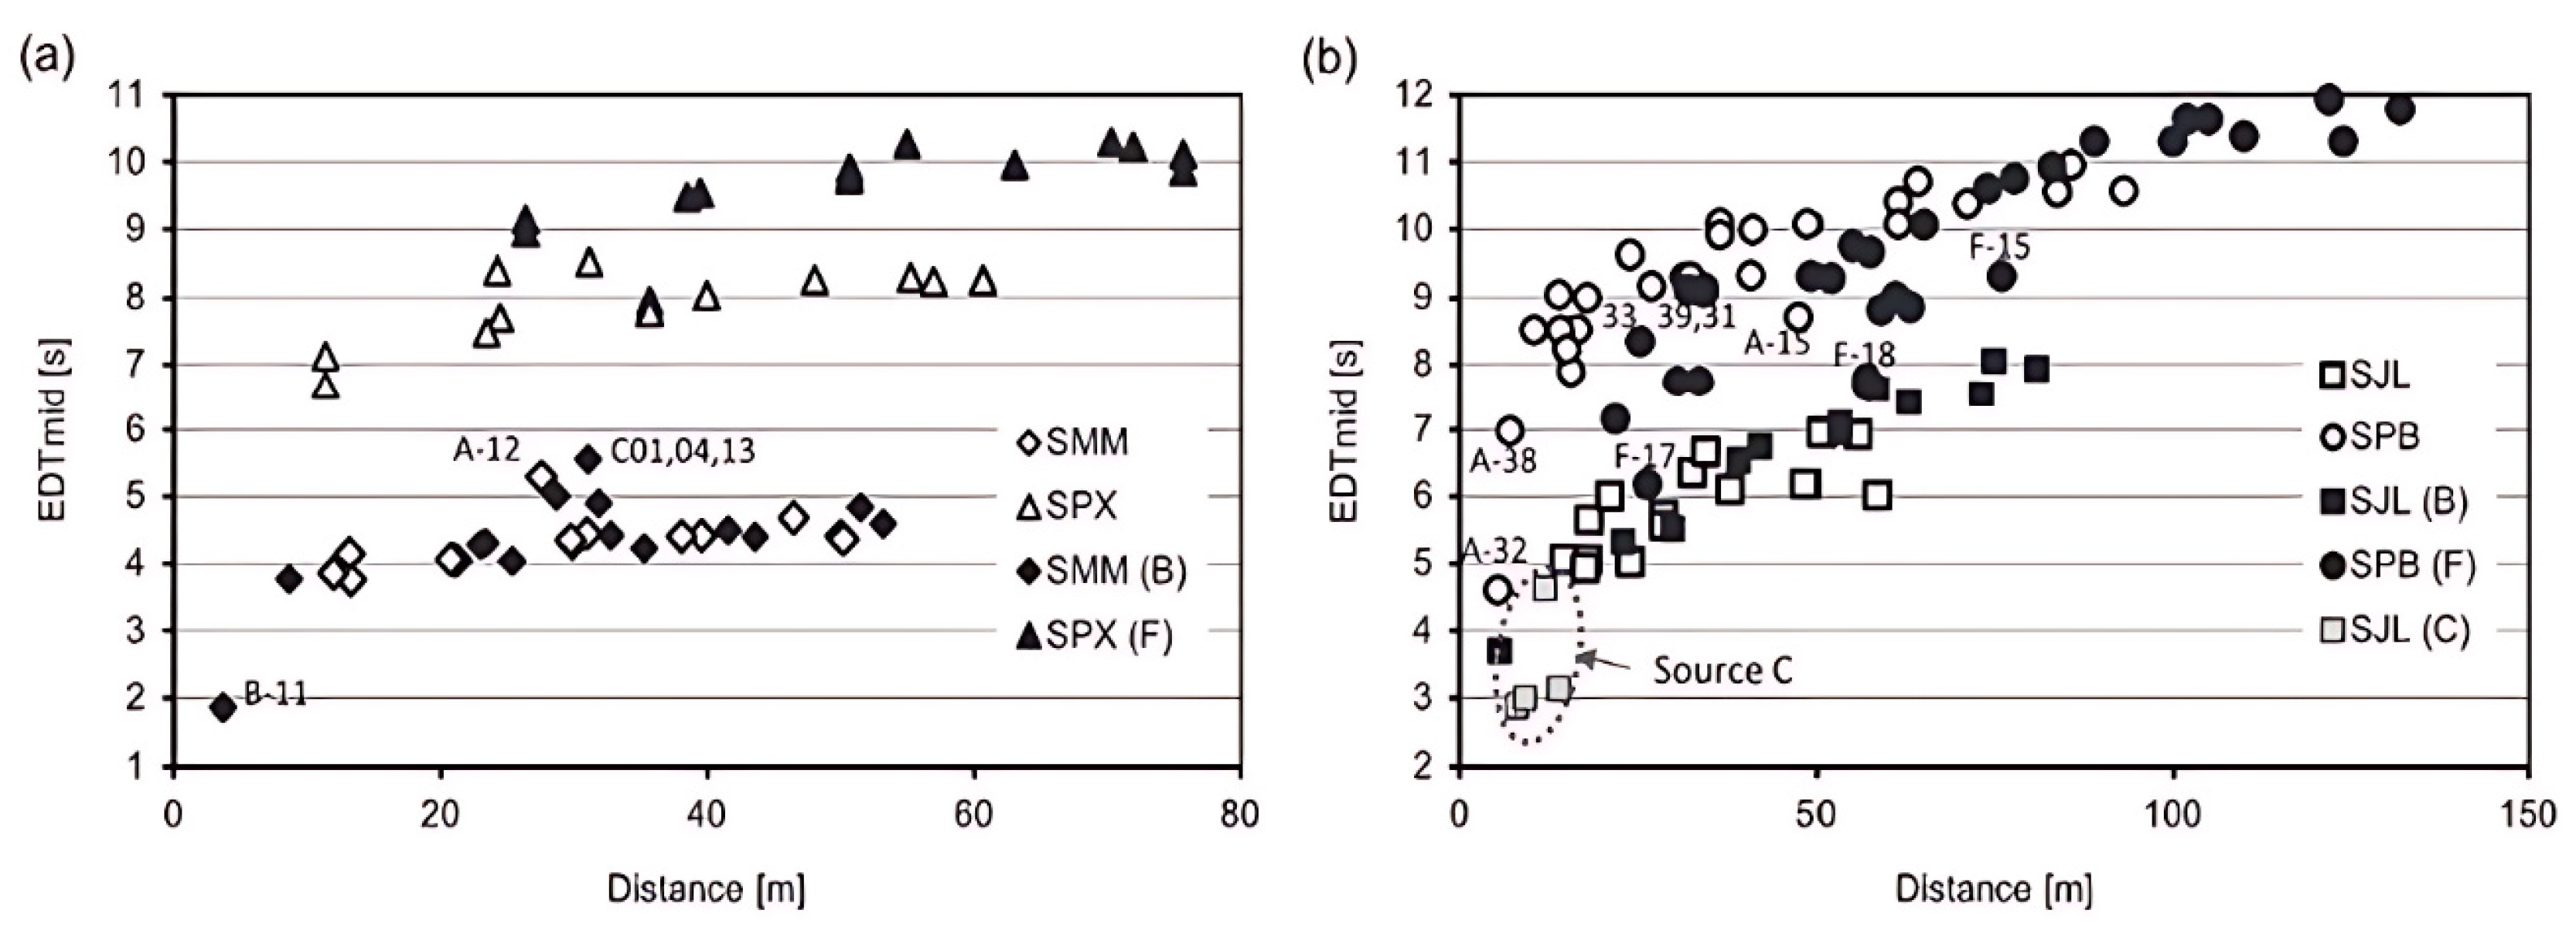
Furthermore, when Martellotta [12] returns to study the basilica spaces of Rome using a Bayesian analysis through the algorithm proposed by Xiang et al. [13], he investigates the existence of double slope behaviour as a consequence of coupled spaces, extremely common in this type of large enclosure, along with the presence of domes, side naves and numerous chapels. In order to explain the anomalies that were observed in the distribution of the energy parameters in each church in the analysis carried out, the basilicas were considered a system of acoustically coupled volumes, while secondary spaces such as corridors and chapels played a different role depending on the amount of sound absorption in the main hall. It is concluded that the presence of coupled spaces does not always imply a drop in reverberation time. This study evidenced the trend in the early reverberation time (EDT) as a function of the source–receiver distance, with lower values at distances close to the source due to the presence of direct sound and very energetic early reflections and a gradual increase the further removed from the source as a consequence of low or no energetic early reflections (Figure 4).
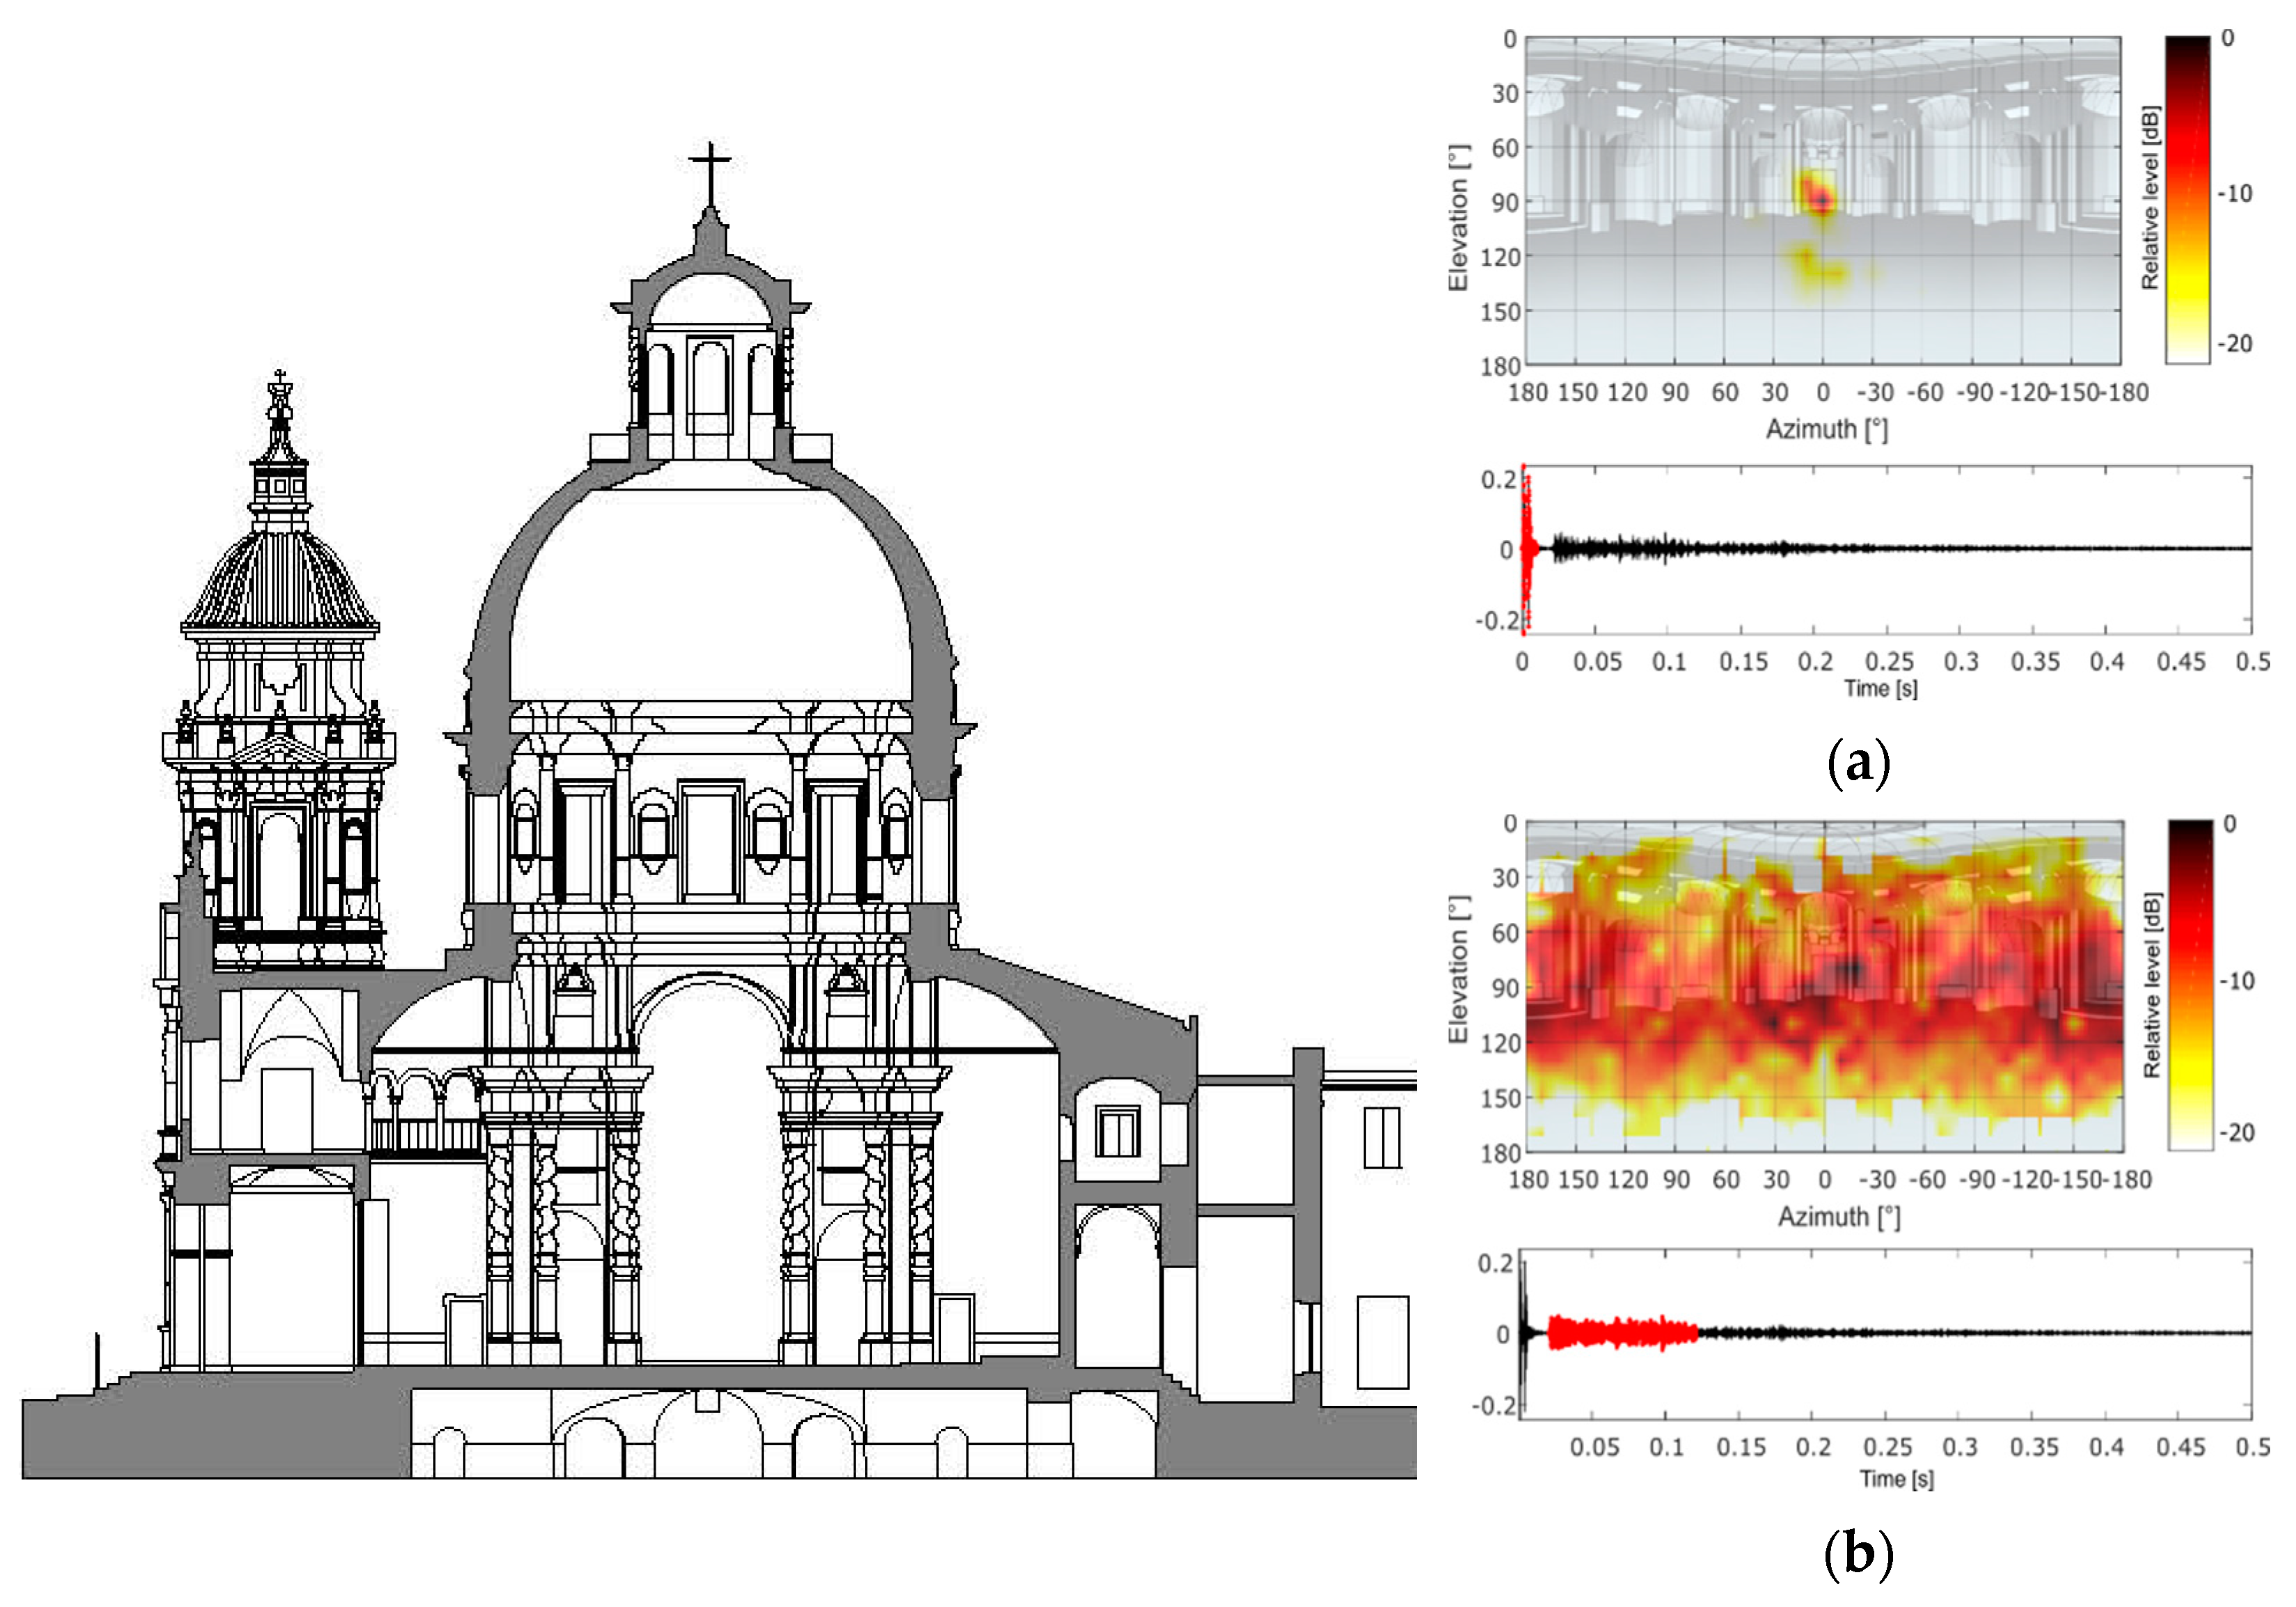
This behaviour, typical of coupled volumes, is also found in spaces with a single volume, such as central floor plans, as observed in the study by Alberdi et al. [14] on the Baroque church of San Luis de los Franceses (Seville, Spain), in which the shape of the concave dome can give rise to unexpected acoustic phenomena, such as focalizations that can increase the sound pressure level or cause colorations in the sound or echoes.
The studies carried out by Álvarez-Morales and Martellotta [15], analysing the effect of the occupation and the position of the sound source of several Christian churches through acoustic simulations including the Baroque church of Santi Luca, conclude that the position of the pulpit, a common element from the 15th century onwards, produces better results due to the decrease in source–receiver distances.
The studies by Magrini and Ricciardi [16,17] focus on a group of churches in the Italian city of Genoa, built between the 11th and 16th centuries. Three of these churches can be considered to have a totally Baroque interior finish. The values of reverberation time, clarity and definition versus frequency are presented, and it can be observed that the churches of S.S. Annunziata and S.M. delle Vigne, more similar in terms of typology, display similar tendencies. In addition, Ricciardi presents studies carried out on a group of churches with a central floor plan, including three Baroque churches with a Greek cross plan. Among the Italian researchers we highlight the contributions made by Caniato et al. [18] on the study of Baroque churches with a central floor plan. This study analysed the church of San Lorenzo in Turin, with a profusely decorated interior, which resulted in a high diffusion of sound.
This octagonal church is made up of two connected spaces: the main room, subdivided into two spaces, and the chapel of the Crucifix. The authors analyse reverberation times, clarity and definition for three source positions, one of them under the dome, observing anomalous behaviours at various points, which seem to suggest the possibility of non-linear energy decay curves and/or coupled spaces (Figure 5).
In Spain, we highlight the work carried out by Segura et al. [19] on the Basilica of Sant Jaume, where the results obtained are compared using different commercial programmes for the measurement of impulse responses and two acoustic simulation programmes. This comparison of the results obtained uses the subjective values of perception, just noticeable difference (JND), as a reference for comparison. Garcia et al. [20] and Planells et al. [21] carry out acoustic research on its current state and the initial stages of the basilica of Santa María de Elche. To do so, they simulate the representation of the “Misteri d’Élx”, which has been carried out continuously since the 15th century, showing the importance of ephemeral assemblies for festivities, prevalent in the Baroque period. Finally, auralisations of this choral representation are generated.
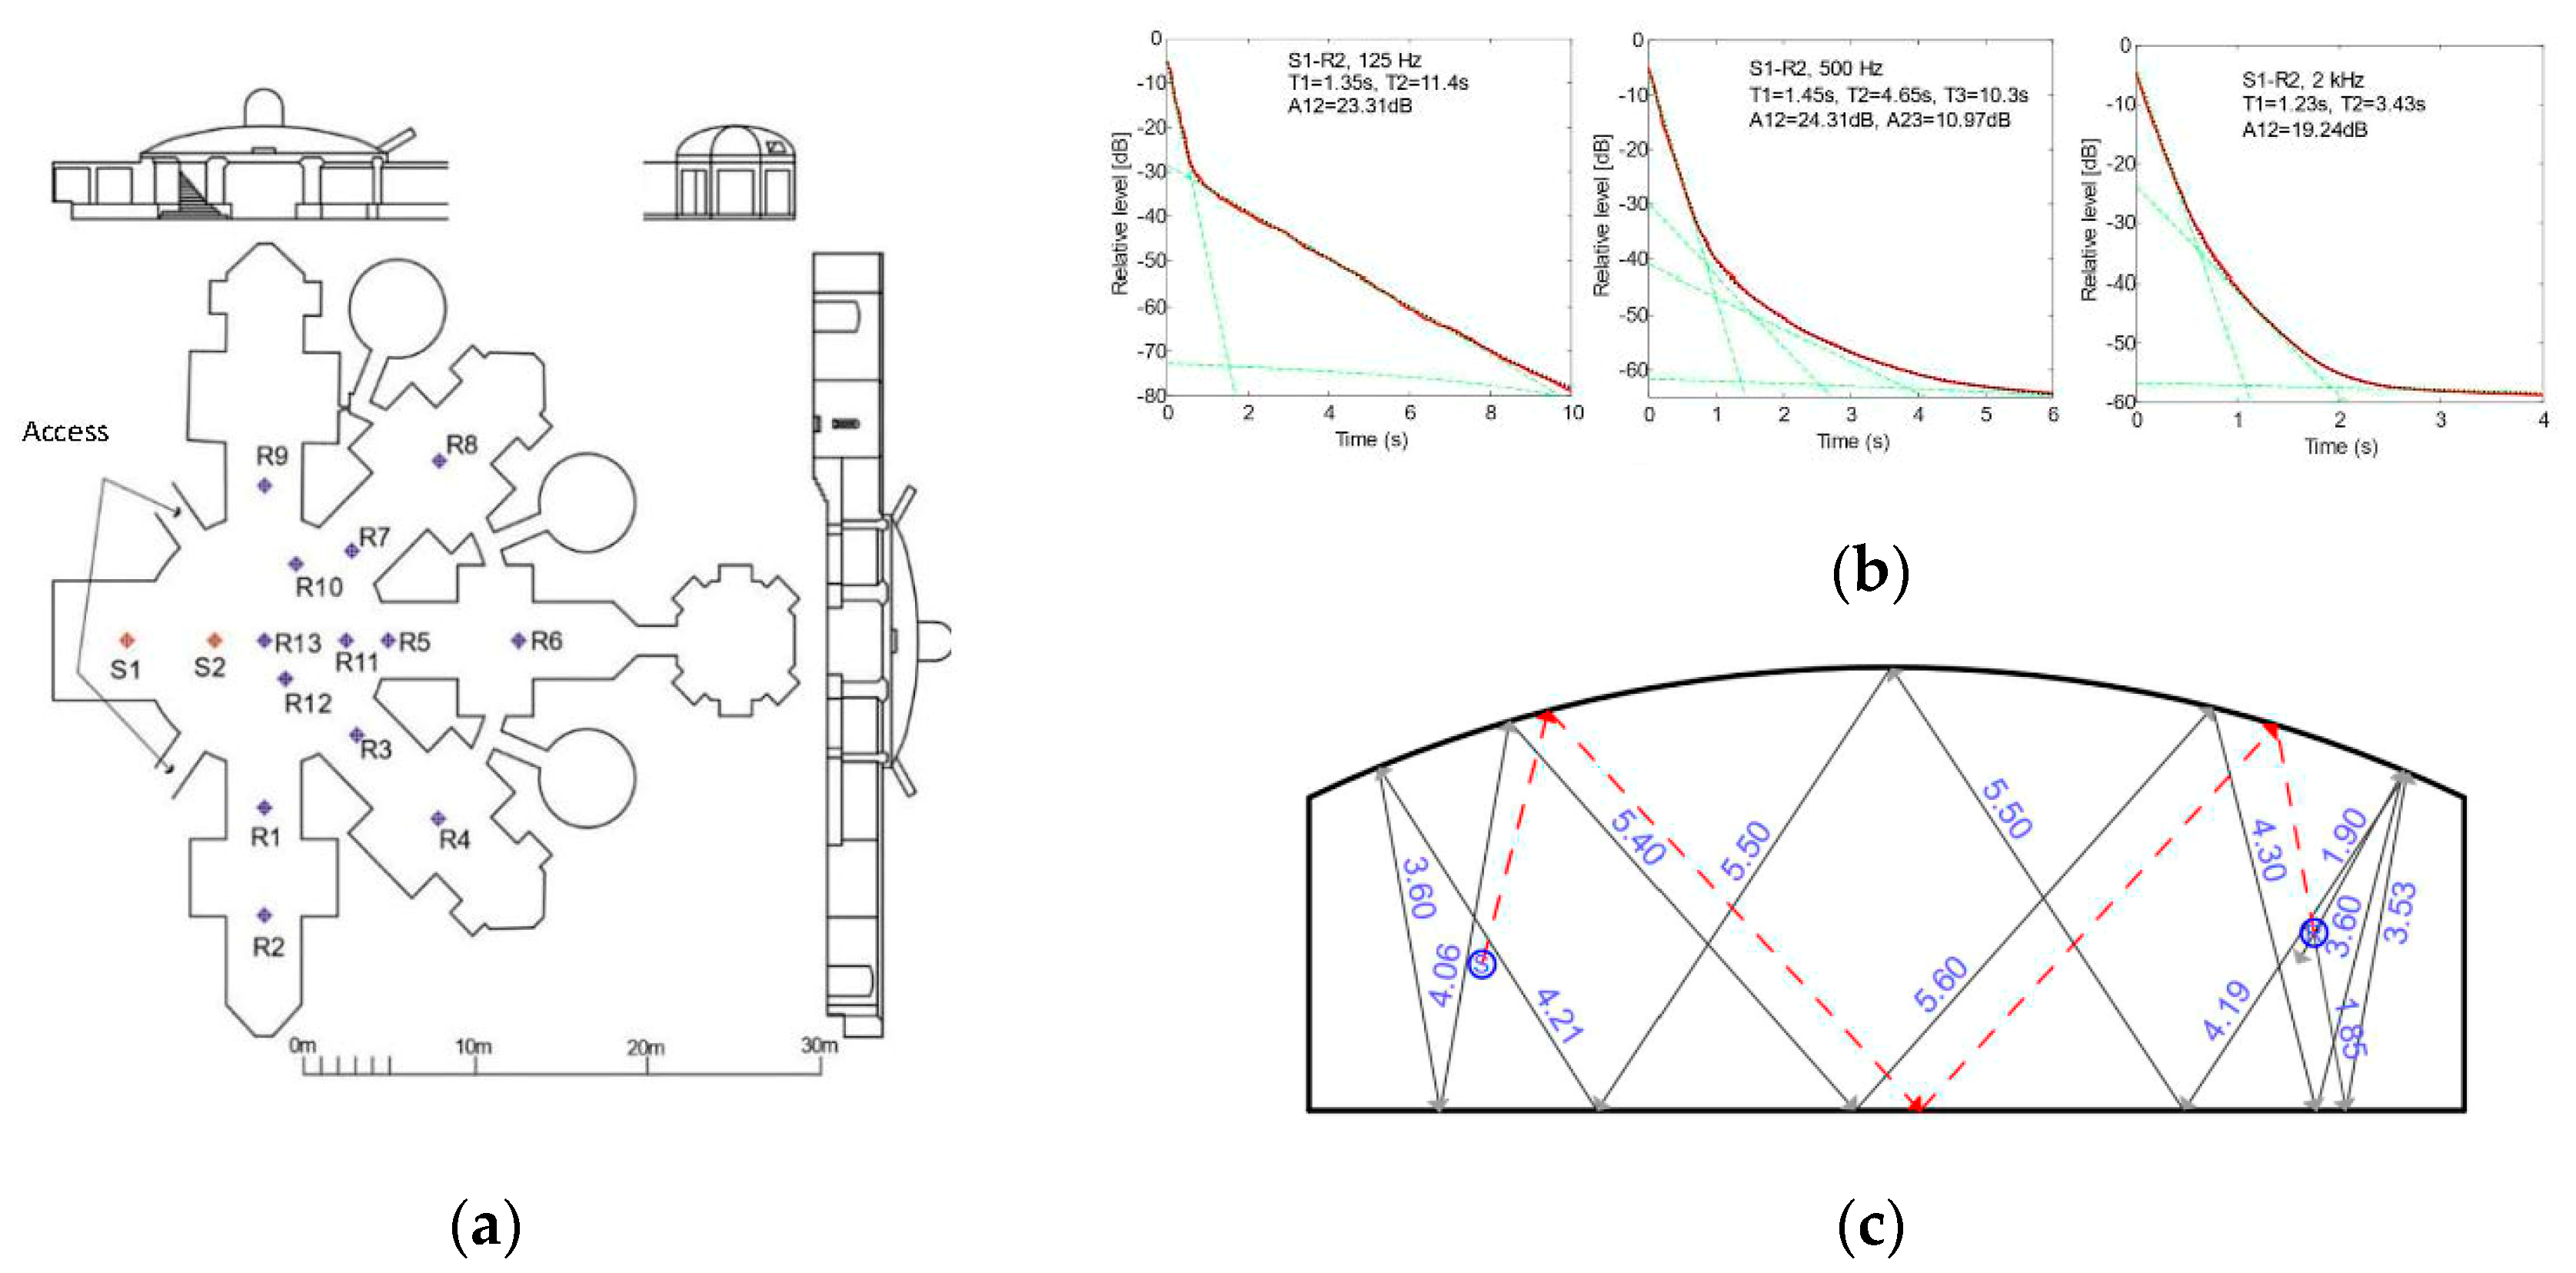
Within the research project carried out on acoustics in Spanish cathedrals, the Baroque-style cathedral of Cádiz is analysed by Álvarez et al. [22]. According to this study, when the source is located in the back choir, the intelligibility can be defined as fair, which suggests that this associated space is suitable for the celebration of certain activities requiring a good understanding of the spoken message. Moreover, it is confirmed that the use of the pulpit slightly improves both music and speech in the audience area and has no influence on the subjective sound level or spatial impression. As for central spaces, the cathedral, which has a crypt consisting of a circular rotunda covered with a low dome, is connected to radial galleries linked to the main space through multiple small openings, resulting in almost unique acoustic characteristics in this space. The acoustic study carried out by Martellotta et al. [23] on this space using a Bayesian analysis showed a late fall appearing in the crypt at a rate different to that observed in the cathedral. Therefore, the acoustic coupling of different volumes was ruled out. Directional intensity maps obtained showed that the late fall originated from the rotunda where a repetitive pattern of reflections appeared between the ground and the dome, causing flutter echoes and a longer reverberation time (Figure 6).
Finally, the studies carried out by Alberdi et al. focus on Andalusian Baroque-style churches in the city of Seville. These analyse central spaces such as the church of San Luis de los Franceses [14], where the presence of the dome can be associated with an uneven distribution of direct sound energy caused by acoustic coupling between different sub-volumes (Figure 7).
In addition to the analysis of different church typologies, both with a Latin cross and a single-nave plan [24], the study is complemented with an archaeoacoustic analysis of these churches and their different spatial configurations, as well as the positions of sources and receivers, from the time of construction up to the present day [25]. In addition, for the church of Santa María Magdalena, several positions of simultaneous sources are considered based on polychoral musical compositions typical of the 18th century. An analysis of the most favourable source combinations shows how the use of different source combinations improves the subjective sensation of sound, tending to homogenise the ranges in all parameters, except for EDT [26].
It is worth noting the research by Niemas [27], Engel [28,29] and Kosala [30] in Poland on a wide sample of churches, some of them Baroque, contributing to the calculation of an objective global index for the word and music.
In the case of studies carried out in Baroque churches in Latin America, the work by Queiroz et al. [31] in Brazil on the Baroque church of Nossa Senhora do Rosário is especially noteworthy for the acoustic measurements and simulations carried out. According to the results obtained, simulation, applying the engineering precision level combined with the Lambert sound diffusion method to all materials, provides a better prediction than in situ measurements (Figure 8).
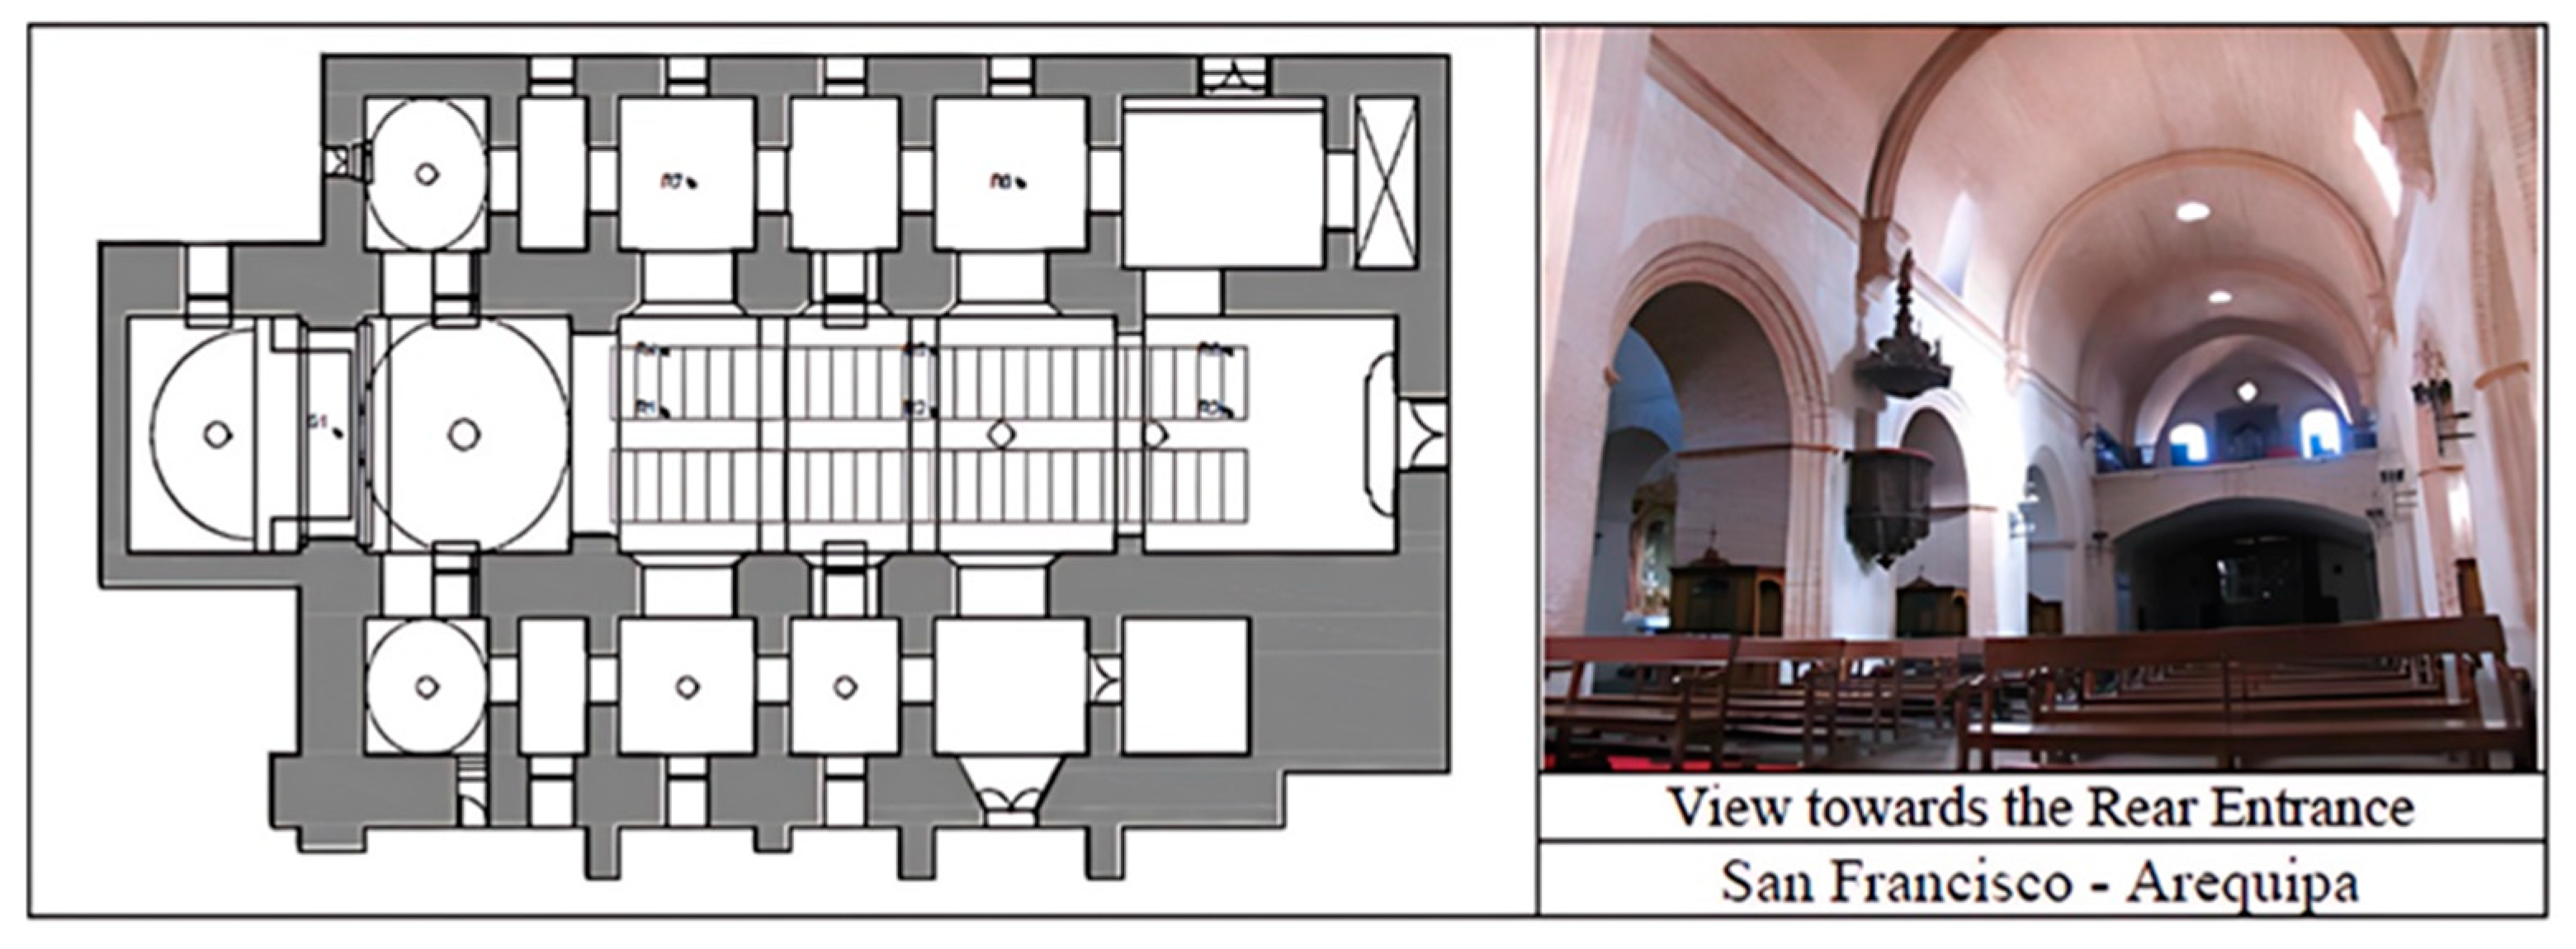
In Peru, the doctoral thesis by Jimenez Dianderas [32] studies a large sample of 52 churches, 28 of which are Baroque. Some of the aspects investigated include the relationships of the geometrical and acoustic parameters and were analysed by architectural style. It is observed how the architectural changes affect the means of the objective acoustic parameters, which improved from the Renaissance to the Baroque. Based on these results, the three styles of the Renaissance, Baroque and Neoclassical [33] are compared in search of correlations between acoustic and architectural parameters. The correlations established are not significant, even when dealing with churches in the same style. Furthermore, together with Carvalho [34], Jimenez Dianderas analysed the acoustic behaviour of 10 Portuguese and 10 Peruvian churches, dating from a period when both countries were ruled by the same king (1580–1640). Most of the churches selected are in the Baroque style and therefore follow the same architectural patterns. Based on the statistical analysis of the dispersion and regression values (r2) between the acoustic parameters of reverberation time and musical clarity and the geometrical parameters of the churches (maximum height and volume), it was ascertained that in all cases r2 values were lower and non-significant in the churches of Peru than in Portugal. The investigation concludes that this could be due mainly to the different construction procedures and materials typically used in churches in Peru (Figure 9).
Finally, the work of Abadía Succi [35], studying Jesuit churches in Argentina, four of which are Baroque, should also be noted. In this study, data about their acoustic characteristics are provided and audience surveys are carried out on acoustic and psychoacoustic parameters, with a very good correlation observed between reverberation times and all subjective parameters, as well as with the average responses obtained in the surveys.
The aim of this work is to provide an overview of the acoustics of baroque Catholic churches worldwide, based on results contributed by researchers in prestigious journals and conferences. A total of 66 Catholic churches with five different typologies in eight countries are analysed. From these data, the possible relationships between acoustic parameters and geometrical characteristics, and the dependencies between acoustic parameters, will be analysed. The analysis of the relationships between the different acoustic and geometric parameters could make it possible to evaluate acoustic parameters not measured in situ in Catholic churches of the Baroque period in a predictive way as a function of other measured acoustic or geometric parameters.

2. Methods

This section presents the selection of the study sample and establishes the criteria for grouping the churches considered for the analysis of the different acoustic parameters defined in the study.

2.1. Selection of the Study Sample

A selection of the churches that make up the sample was compiled based on the results obtained by the different research groups to allow a joint analysis of the ecclesial acoustics of the Baroque in the countries studied (Table 1).
The number of churches built during the Baroque period was very large, partly due to the Reformation and Counter-Reformation of the Catholic Church after the Council of Trent. The Catholic and Protestant rites differed, and this had an impact on the spatial configuration of the churches. For this reason, Protestant, Orthodox and Anglican churches have been excluded from the selection of the sample of Baroque churches analysed. The churches studied share the Latin rite, which was the first criterion for the selection of the sample. Furthermore, churches with a volume of less than 150,000 m3 are studied, so that churches with higher volumes, such as Saint Peter’s Basilica in Rome, are not included in the study as they display different acoustic behaviours. Based on the criteria detailed, a total of 66 Catholic churches were selected in 8 countries—Spain, Portugal, Italy, Germany, Poland, Peru, Argentina and Brazil.
Table 1 shows all the churches in the sample, classified by country and research group, providing a chronology, typology in plan and main construction system in the area of audience for each one. All the churches are in the Baroque style, the large majority built during the 17th–18th centuries. However, three of these dated to the second half of the 16th century, a time of change following the Council of Trent, and displayed a configuration that falls within the Baroque style.
The analysis of the church sample shows that it is made up of five typologies classified according to the configuration of the floor plans (Figure 10).
In the selected sample, the assertion made by Navarro and Sendra [1] becomes clear, observing a majority of longitudinal church plans with domes that centralise the space and, on the other hand, central plans, while in the case of the larger churches, they tend to derive from the traditional basilica plan. The predominant floor plan is the Latin cross, present in all countries except Brazil, where the sample is limited to a church with a single nave. The churches with a Greek cross plan, all Italian, were in the minority during the Baroque period, as this architectural device was not developed in other countries. The sample of churches with central floor plans is reduced to four, where the configuration answers to the interest in plans with the dome as the central element. Single-nave churches, mostly in Latin American countries, are also generally smaller, in response to smaller programmatic needs. Finally, the basilica churches, which follow a plan model with three naves, are larger. Four of these churches are Italian basilicas from earlier periods, whose original configuration was modified through important adaptation projects during the Baroque period. Table 2 provides the ranges of lengths of the main axis, ground floor surfaces and volumes of the sample classified by typology.
The evangelising work of the main religious orders after the Council of Trent greatly encouraged the construction of new churches during this period. Table 1 shows the churches promoted by the main orders. The Jesuits stand out among these as they had a particular interest in speech intelligibility, reflected in their proto-acoustic treatises [36] or the studies carried out by the Jesuit Bettini, as indicated by Briatore, S. [37]. The study sample includes ten Jesuit churches, the most represented, followed by eight Dominican and six Franciscan churches.
The covering of the interior space of the churches was the subject of debate since the Renaissance. As Barbieri [38] points out, the memorandum of the church of San Francesco della Vigna (Venice, 1535) by Francesco Zorzi, prescribes covering the chapels and cancel with vaults and the main nave, where the sermon is preached, with a wooden ceiling. In the second half of the 16th century, as preaching acquired greater emphasis as a consequence of the Counter-Reformation, the use of coffered ceilings was considered a suitable form of church roofing. The Jesuit church of the Gesù in Rome sparked a debate on the most appropriate way to cover these spaces. The Jesuit Tristano preferred to cover the nave with a coffered ceiling, while Cardinal Farnese opted for a barrel vault, as Vignola finally did, with architectural criteria prevailing over other aspects. This predilection is evident in the Baroque churches. Of the 66 churches studied, 3 churches are covered with wooden coffered ceilings (1 in Portugal, 2 in Italy) and 5 in Peru, which finish their roofs with a system of jointed rafters. This only represents 12% of the sample studied, compared to 88% of the sample built with vaults/domes.
It should be noted that in the sample, there are variables that are not controlled due to lack of information or unavoidable variables that are part of the error associated with the proposed analysis, such as the temperature and humidity of the air, the restorations carried out after fires or earthquakes, the material available and the wealth of the citizens who financed it, among others.

2.2. Acoustic Parameters Analysed

The preliminary analysis of the study sample established a group of 66 Catholic churches in the Baroque style built during the 16th and 17th centuries, classified into five typologies and mostly covered with vaults and domes. Since the results of the in situ acoustic measurements were carried out by different researchers, only those results corresponding to source positions on the main altar, and therefore on the main symmetry axis of the churches, were selected. The receivers are always located on the ground floor in positions corresponding to the audience area. All acoustic measurements were taken in empty churches. Most of the authors have followed ISO 3382 [39] in its different temporary versions, with the logical exceptions of those carried out before the existence of the standard [7,28]. The type of signals used to obtain the impulse response correspond fundamentally to those included in the aforementioned standard: MLS, exponential sweep signal and in some cases pistol shots and balloons.
The analysis of the set of acoustic parameters obtained from each study established those found in the largest number of churches in the sample. This is the case of reverberation, from the T30 values and the perceived reverberation from the early decay time (EDT), which is more closely linked to the subjective sensation, and the perceived sound clarity, through the musical clarity (C80), the definition (D50) and the central time (TS), considering the single-number frequency averaged values, calculated according to ISO 3382-1:2009 [39], as shown in table A.1 of Annex A. Other researchers have used a similar methodology to analyse the acoustics in churches [8,11,12,16,17,32,33,34,40,41,42], although mixing churches of different architectural styles, without the homogenising factor of being Catholic churches and from the Baroque period. Desarnaulds and Carvalho studied 63 baroque churches but mixed Catholic, Protestant and Orthodox confessions. Only Meyer [43] found a logarithmic correlation between reverberation time and volume. Cirillo and Martellotta [44] also found a correlation between reverberation time and volume for Romanesque churches and significant linear correlations (r2 > 0.8) between the mean values of the parameters T30, D50, C80 and TS, but not with the geometrical parameters. They also found non-linear correlations between C80, D50 and TS as a function of reverberation time. A lack of published data made it impossible to analyse the parameters per receiver, while the subjective level of sound, apparent source width and listener envelopment could not be analysed either. Cirillo and Martellotta [44] presented a more detailed analysis by presenting the values of the acoustic parameters measured at each reception point for Romanesque. This analysis of the individual position results showed that EDT, G, C80, D50, TS and RASTI measured in each church proved to be related to source–receiver distance. The use of the single-number mean value could introduce considerable dispersion in the parameter values depending on the different source–receiver distances involved, even though, as mentioned above, the source position is common in all cases and the receivers are always in the listening area. To mitigate this possible dispersion, we will also analyse, where possible, depending on the number of churches and available acoustic parameters, the single-number frequency averaged values by typology, where the drop in acoustic parameters in relation to distance is common to all of the churches in the group [45,46]. In addition, more homogeneous samples will be analysed within each subgroup where possible (Latin cross and single-nave), based on geometrical and acoustic data, in order to obtain better approximations when determining the acoustic dependencies of the selected sample.
When obtaining the average absorption coefficient of the studied enclosures from Sabine’s reverberation time equation, the Latin cross, single-nave and basilical typologies show values around 0.5–0.6, while the central and Greek Cross typologies are around 0.9, showing that the average values do not show a preferential typology.
Table 3 shows the number of churches for which each individual parameter is evaluated, classified according to the different typologies. Sigmaplot v14 software [47] was used for the processing and statistical analysis of the data obtained, and for the creation of graphs.
The study is carried out for the whole sample and for the different parameters, including a typological analysis when the sample size allows. Likewise, possible subgroups are established (Latin cross and single-nave) in each typology, according to acoustic and geometrical characteristics, in order to analyse more homogeneous samples, obtain better approximation and identify the acoustic dependence of the selected sample.

3. Results

This section develops a confrontational statistical analysis of main acoustic parameters. Three fundamental objectives are established to analyse the acoustics of the Baroque Catholic churches in the selected sample. Firstly, the sample as a whole is analysed on the basis of the typologies and acoustic parameters selected. Secondly, the relationships between the geometrical parameters (volume (V), plan area (S), length of the main axis (L) and V/S) and the acoustic parameters are studied. Finally, relationships between the acoustic parameters in the study sample are established.

3.1. Typological Analysis of the Sample

Using box diagrams, a statistical analysis is performed by calculating the percentile levels and the mean value. The analysis was based on the acoustic parameters common to the different measurements carried out in the churches.
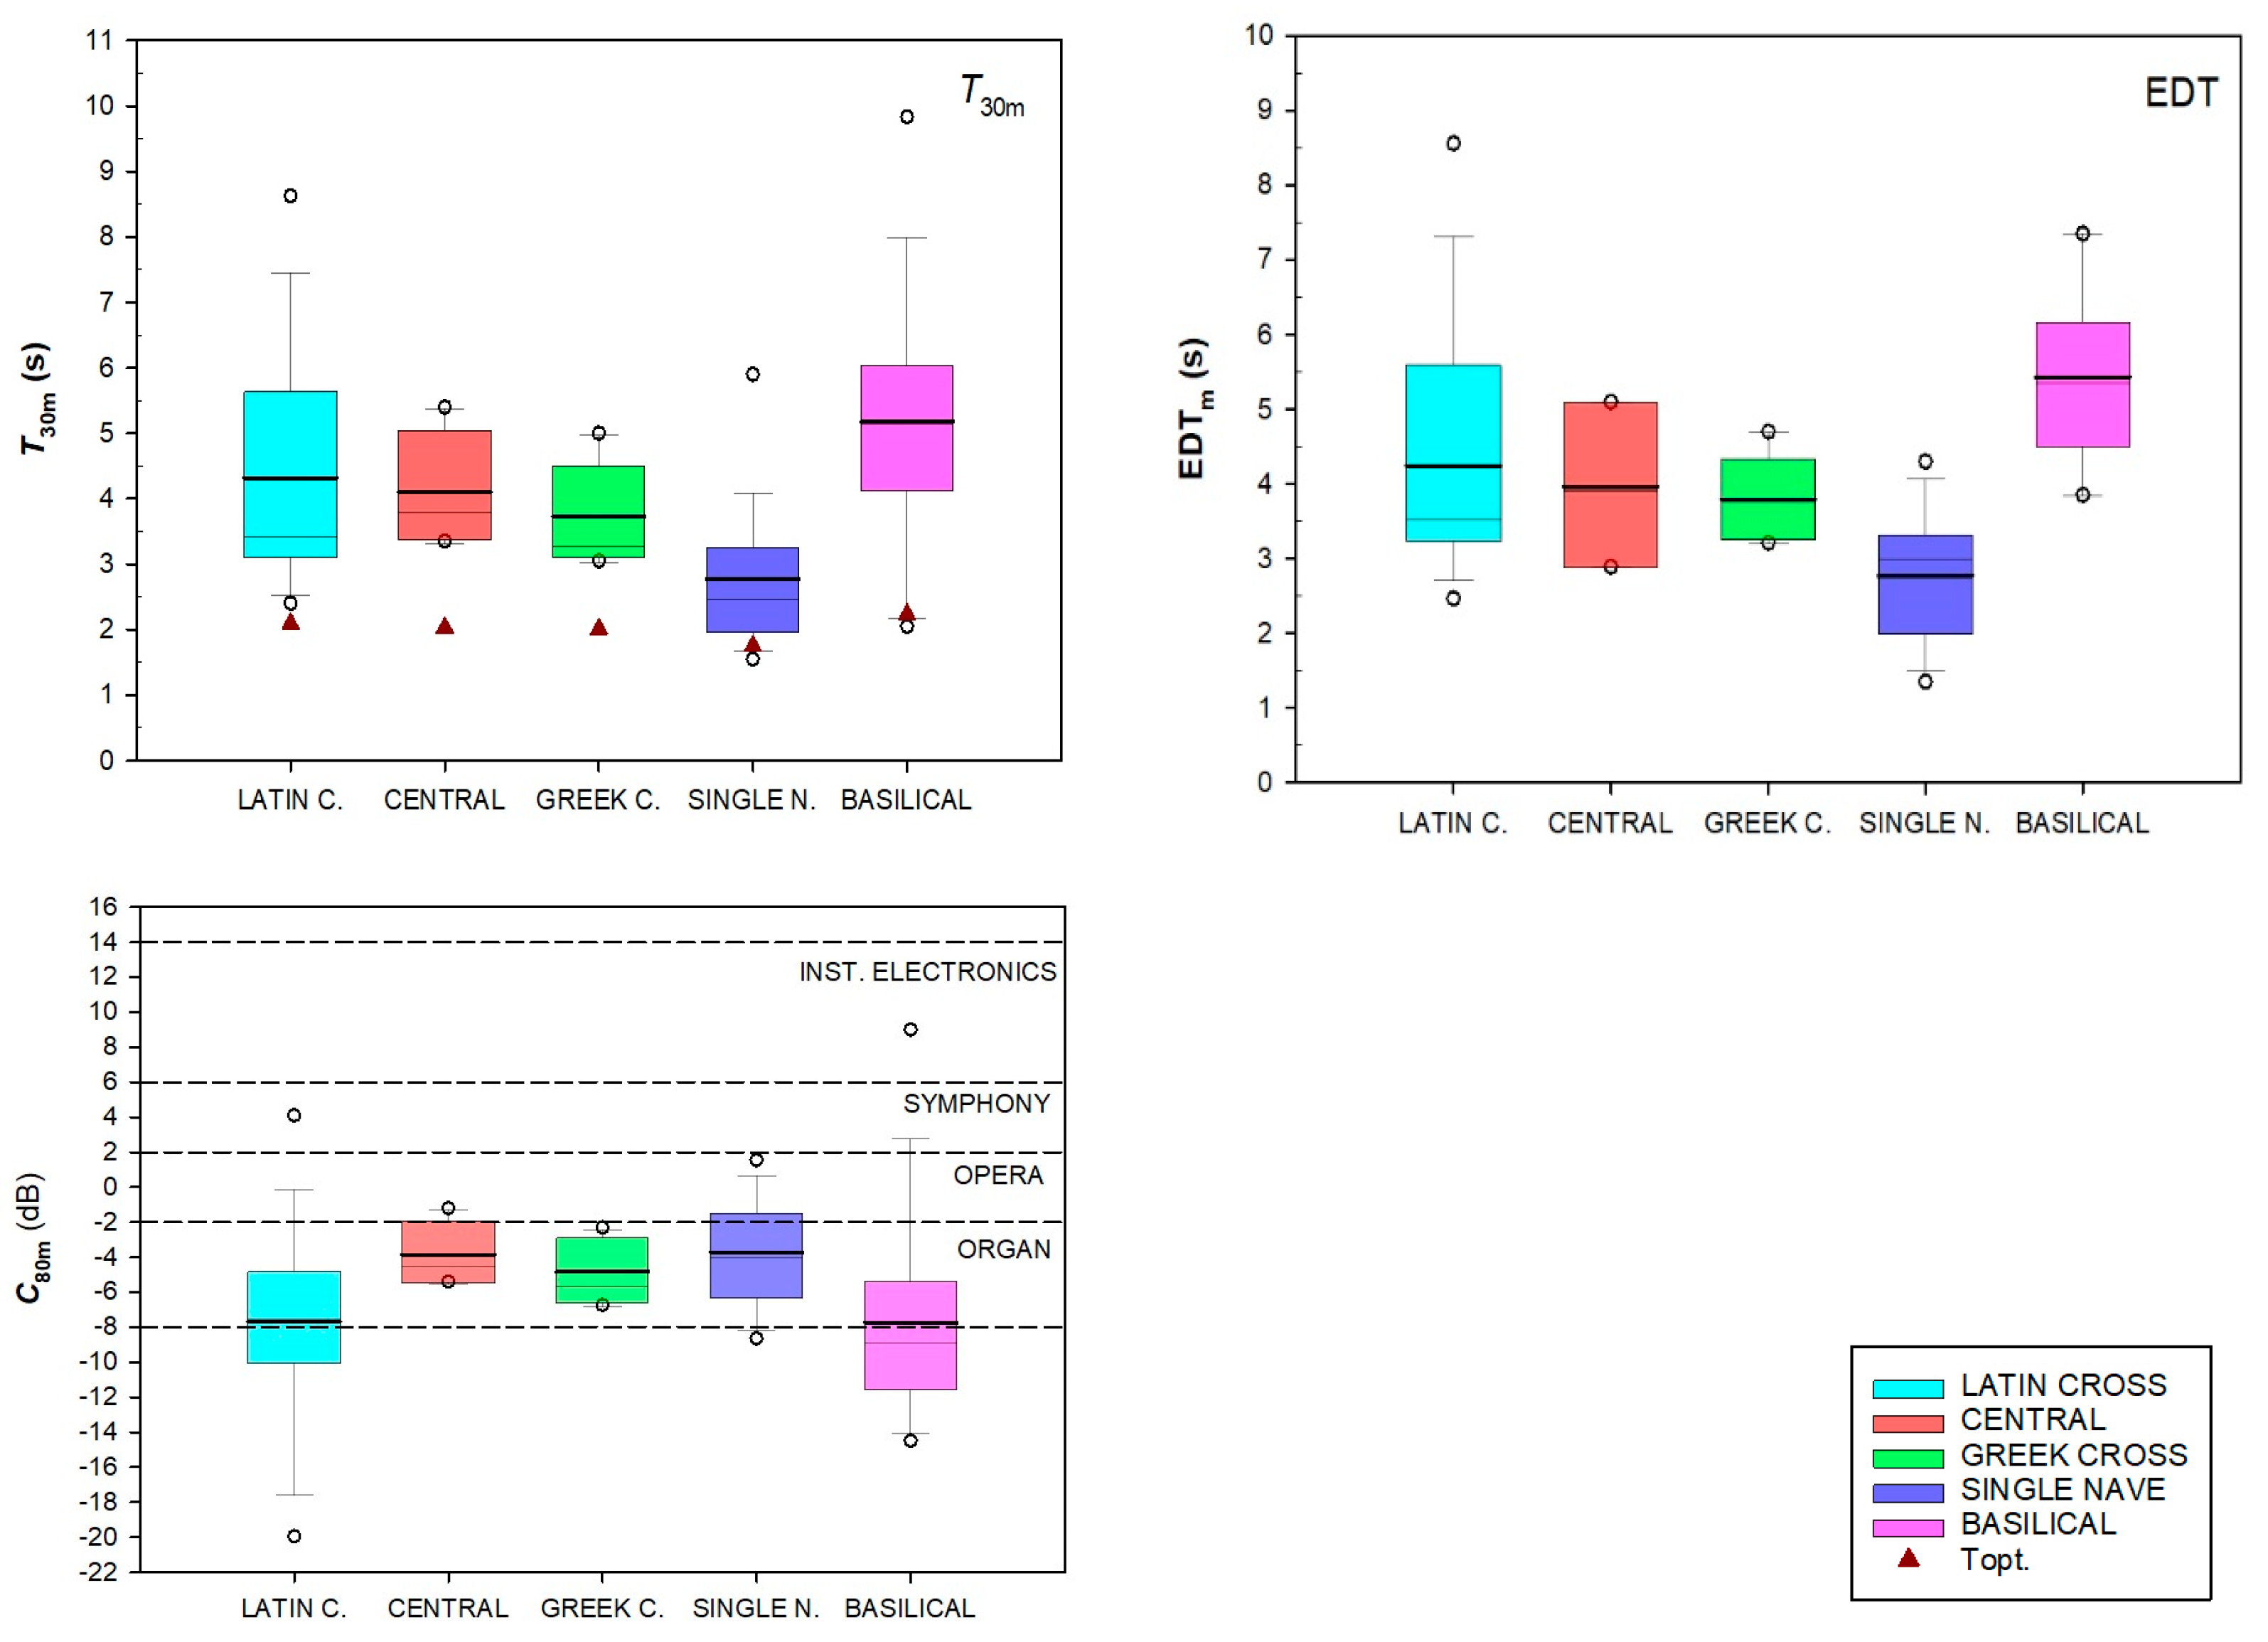
Figure 11 shows the results for the values that define the reverberation of the church (T30m and EDTm) and the clarity based on musical clarity (C80m) (see Table 3). The 25th percentile is shown at the bottom of the box, followed by the 50th percentile, and, finally, the 75th percentile. The black line inside the graph marks the median, and the whiskers (error bars) below and above the box mark the 10th and 90th percentiles. The points at the ends of the graphs are the 5th and 95th percentiles.
When analysed discretely according to the different typologies, the reverberation, according to the parameters T30 and EDT, is less homogeneous for the Latin cross plan, with a better distribution observed for the Basilica typology. However, the highest reverberation times are observed in the basilica churches, while the single-nave churches, with the lowest volume range, have the lowest reverberation times. Furthermore, the reverberation results are similar for churches with central, Greek cross and Latin cross floor plans, although there is a greater variability of results for churches with Latin cross floor plans. The graph corresponding to T30 includes the average values of the optimum reverberation time by typology, with consideration given to the optimum values defined by Beranek [48] for religious music (Topt = 0.55 log (V) − 0.14). In all cases, the median obtained for all typologies is found to be significantly above the values defined by Beranek as optimal. In the case of the behaviour of the sample for musical clarity (C80m), especially for the Latin cross and single-nave typologies, greater uniformity is observed in the results of the acoustics measurements. The single, central and Greek nave models display the best results, while the basilica plan churches provide the worst results. A comparison of the results obtained for musical clarity with the scale established by Marshall [49], which evaluates the suitability of music according to the value of C80 (3), indicates that churches with a central plan, Greek cross and single nave are generally conducive to organ music.

3.2. Statistical Correlation with Geometrical Variables

A statistical study was carried out to establish the relationships between the acoustic parameters, spatially averaged and single-number frequency averaged [39], and the main geometrical characteristics of the Baroque churches analysed, using linear and non-linear regression methods. The most significant dependencies are represented by the inclusion of the coefficient of determination, R2, excluding correlations where R2 < 0.5. The significant p values have also been calculated.
To avoid the analysis being a purely mathematical exercise, an additional analysis is needed to verify whether the physical nature of the acoustic parameters studied is respected. For example, if in a correlation the value of T30 increases while the volume decreases, this should be discarded.
No significant dependence was found between the values of the acoustic parameters and one of the geometrical variables, which seems logical considering the different typologies studied.
When the study was extended to two variables, only T30 presented a weak correlation (R2) as a function of the S and V/S or the L and V/S (0.58, 0.50). As expected, the reverberation increases as the S and V/S or the L and V/S increase.
These correlations are non-linear regressions with the significant p level exceeded and the best fitting surface types are paraboloids (see Table 4).

3.3. Statistical Correlation Between Acoustic Parameters

Linear and non-linear regressions have been obtained between pairs of acoustic parameters, including spatially averaged and single-number frequency averaged.
Only two combinations are obtained, and the best correlations are cubic and linear, with the significant p level exceeded for T30-EDT (R2 = 0.73) and TS (ms)-EDT (R2 = 0.60), as shown in (Equations (1) and (2)):
T 30 = 0.3158 + 1.3185 E D T 0.0740 E D T 2 + 0.0045 E D T 3
T S = 18.4808 93.3430 E D T
In Peru, Dianderas [32] found significant linear regressions between these parameters.
When extending the analysis to the relationships of one parameter with another two of those studied, the number of correlations increases (11 in total with R2 ≥ 0.5) and better results are obtained for the individual parameters.
T30 can be obtained from the rest of the parameters in three of the six combinations possible, EDT in four, D50 in three, TS in one and C80 in no single combination. All of these are of the surface type described in Table 4.
Table 5 shows the best correlations between one acoustic parameter and another two of the remaining ones, the coefficients of the surface type and their coefficient of determination.
By way of example, Figure 12 shows a 3D view of the best correlation found between the acoustic parameters.
Again, as found in the 2D analysis, the temporal unit parameters show the best correlation. Clarity is the parameter with no correlation. TS appears as a common variable for determining the rest of the parameters. This parameter, closely related to the fine structure of the energy, presents a great spatial variability. The importance of the chosen variables should also be noted, since in the estimation of T30 and EDT, the three parameters involved are the same, albeit with significant differences in the value of R2.

3.4. Statistical Correlation with Geometrical Variables by Typology

The different typologies studied require a detailed analysis of individual cases, as shown in the two sections above. The central and Greek cross typologies have been ruled out due to the low number of cases of each. No correlations have been found for the single-nave typology. Only correlations with R2 ≥ 0.65 and exceeding a significant p level are presented.

3.4.1. Latin Cross Typology (Geometrical Variables)

For the same typology, no 2D or 3D correlations are found, even when extending the study to two variables.
The study sample is large, so more homogeneous and smaller solutions are sought. In our case, almost the whole sample shares the common elements of a vault and similar coatings, so that variability, together with the values of the acoustic parameters, can occur depending on the countries and volumes involved. The most significant sample corresponds to 10 churches in Peru, studied by Dianderas [32], which in general showed very low dependencies, so we have chosen to analyse them in terms of volume. The intervals chosen are as follows: (I) V < 10,000 m3, (II) 10,000 m3V ≤ 20,000 m3 and (III) V > 20,000 m3. Only correlations with R2 ≥ 0.75 exceeding a significant p level are presented.
Only one cubic high 2D correlation is found in the (II) interval (Table 6). As expected, EDT increases when V/S increases.
When extending the study to two variables, the number of dependencies increases significantly for T30 and EDT only in interval (II) (seven cases). As expected, the increase in variables increases functions. The best correlations, the geometrical variable, the coefficients of the equation and their determination coefficient are all presented in Table 7.
The inclusion of two geometrical parameters does not significantly improve the correlations obtained with a single variable for EDT.

3.4.2. Basilica Typology

For this typology, no 2D correlations are found, although when the study is extended to two variables, correlations are found for T30 and TS. The best correlations, surface type, coefficients of the equation and their determination coefficient are presented in Table 8.

3.5. Statistical Correlation Between Acoustic Parameters by Typology

The central and Greek cross typologies have been ruled out due to the low number of cases for each of them. For basilica churches, the correlations obtained make no physical sense for the parameters analysed. Only correlations with R2 ≥ 0.65 are presented.

3.5.1. Latin Cross Typology (Acoustics Parameters)

Only two correlations are obtained with the time parameters (T30-EDT and EDT-T30). The correlations between two individual acoustic parameters, equation type, the coefficients of the equation and their coefficient of determination are presented in Table 9.
The logarithm (3rd order) function is (Equation (3)):
y = y 0 + a l n x + b l n x 2 + c l n x 3
When extending the study to two variables, the number of cases increases (six) again for T30 and EDT (Table 10).
The inclusion of two geometrical parameters does not significantly improve the correlations obtained with a single variable.
The more homogeneous sample is analysed for the different volume intervals: (I) V < 10,000 m3, (II) 10,000 m3V ≤ 20,000 m3 and (III) V > 20,000 m3. Only correlations with R2 ≥ 0.75 exceeding a significant p level are presented.
High correlations are found in interval (I) for both T30 and EDT combinations and in interval (II) (five combinations for T30, EDT, D50 and TS, none for C80) (Table 11).
The polynomial (inverse 3rd order) function is (Equation (4)):
y = y 0 + a / x + b / x 2 + c / x 3
No significant correlations are found with two acoustic parameter variables in the volume intervals.

3.5.2. Single-Nave Typology

Only one 2D correlation (polynomial, cube) is obtained (Table 12).
When extending the study to two variables, only three correlations are found. The best correlations, surface type, coefficients of the equation and their determination coefficient are presented in Table 13.
In all cases, the two variables correspond to the combination of a time parameter and an energy parameter. The inclusion of two geometrical parameters does not significantly improve the D50 correlation obtained with a single variable.
A smaller, more homogeneous sample is desirable. In this case, almost the whole sample has a vault as a common element and similar coatings, so that variability, together with the values of the acoustic parameters, can occur depending on the countries and volumes involved. Again, as in Latin cross churches, the most significant sample corresponds to churches in Peru, studied by Dianderas [32], which, in general, showed very low dependencies, so we have chosen to analyse these in terms of volume. The intervals chosen are (I) V < 2500 m3 and (II) V ≥ 2500 m3. Only correlations with R2 ≥ 0.75 exceeding a significant p level are presented. For brevity, when analysing dependencies between two or three acoustic parameters, only the best correlation of the two or nine possible combinations is presented. The best correlations between two acoustic parameters, surface type, coefficients of the equation and their determination coefficient are presented in Table 14.
Considering the Pseudo-Voigt, 5-Parameter and Modified Gaussian equations, the 5-Parameter functions are, respectively, shown in (Equations (5) and (6)):
y = y 0 + a · ( c · ( 1 / ( 1 + ( ( x x 0 ) / b ) 2 ) ) + ( 1 c ) · e x p ( 0.5 · ( ( x x 0 ) / b ) 2 ) )
y = y 0 + a · e x p ( 0.5 · a b s x x 0 b c )
No significant correlations are found with two acoustic parameter variables in the volume intervals.

4. Discussion

Linear and non-linear regressions were obtained between pairs of acoustic and geometrical parameters or between one acoustic parameter and a pair of geometrical parameters. The acoustic parameters are spatially averaged and single-number frequency averaged. No significant 2D correlations are found. When the analysis extends to the relationships of a single parameter with two of the other geometrical parameters studied, only two weak paraboloid correlations are found. This low or non-dependence with geometrical parameters is due to the different typologies of the sample, which is why a typological study is necessary.
Therefore, an analysis of the sample by typology was carried out, excluding the churches with a central plan and a Greek cross as not enough of these appear within the sample analysed. The correlation between geometrical variables and typologies and the best (or unique) correlations are presented in Table 6, Table 7 and Table 8. Only correlations with R2 > 0.65 exceeding the significant p level are analysed in Latin cross and basilica typologies. Overall, the dependence of acoustic parameters on geometric parameters remains low. The study of more homogeneous samples finds some dependencies with parameters related to reverberation in Latin cross churches with a volume of between 10,000 and 20,000 m3 (R2 > 0.75) In general, the inclusion of two geometrical parameters does not significantly improve (or worsen) the correlations obtained with a single variable.
Lastly, the relationships between acoustic parameters were analysed. When analysing the complete sample, useful 2D and 3D correlations are found for all the acoustic parameters with the exception of C80 (Equations (1) and (2) and Table 5). A typological analysis was carried out on Latin cross and single-nave typologies and the results are presented in Table 9, Table 10, Table 12 and Table 13. Again, the inclusion of two acoustic parameters as variables does not improve the correlations obtained with a single variable, nor does it yield any correlations. The study of a more homogeneous sample, in volume intervals, for Latin cross and single-nave churches found high 2D correlations, as shown in Table 11 and Table 14. Again, no significant 3D correlations are found in these intervals.

5. Conclusions

Baroque churches, both in Europe and Latin America, reflected the Catholic Church’s response to Protestant doctrine by emphasising contrasts of light, alternating concave and convex forms, and rich decoration. This research has analysed the acoustics of these spaces, taking a sample of 66 Catholic churches across eight countries with five types of plans (Latin cross, central, Greek cross, single-nave and basilica). These have been analysed by different research groups, comparing the results of the sample as a whole. For the analysis of the sample, we have considered the single-number acoustic parameters for which the sample is larger. The reverberation was analysed using the T30m parameter, and the initial reverberation (EDTm) and the clarity of the sound was analysed using musical clarity (C80m), definition (D50m) and central time (Tsm).
When analysing the sample according to typology, it can be seen that the floor plans with three naves, such as the basilica churches, have higher reverberation times (T30m) with an average value of 5.17 s, while the single-nave churches are at the opposite end of the scale with an average volume more than seven times lower and an average T30m of 2.81 s. The proposal made during the Council of Trent, based on the Latin cross plan model developed from the Il Gesú model in Rome, or central plans, resolved as central or Greek cross plans, have similar average reverberation time values (4.39 Latin cross; 4.10 s central; and 3.79 s Greek cross), even though the average volume of the Latin cross churches (20,670 m3) is practically double the average volume of the central churches (10,983 m3) or Greek cross churches (11,308 m3). For the Latin cross plans, corresponding to a more diverse sample, a higher variability of results is also observed. However, the use of central floor plans (central and Greek cross) in smaller churches during the Baroque period improves musical clarity compared to the Latin cross typology, with average values for C80m of −3.85 and −4.83 dB, respectively, compared to −7.69 dB for Latin cross churches. The central configurations (central and Greek cross), with volumes three times higher than the single-nave floors, have similar musical clarity, with an average value of C80m for single-nave churches of −3.70 dB. Comparing the sample means for musical clarity in the two highest volume typologies (Latin cross (−7.79 dB) and basilica (−7.73 dB)), the results are similar. In general, the central plan and Greek cross configurations are those with the most suitable average C80m values when related to the average volume of the sample of each typology.
No significant dependence (R2 ≥ 0.5 exceeding the significant p level) was found between the values of the acoustic parameters and one of the geometrical variables for the whole sample due to the different typologies studied. The same can be said when the study was extended to two geometrical variables. When the linear and non-linear regressions studied were obtained between a pair of acoustic parameters or one acoustic parameter with another two of those studied, correlations with R2 ≥ 0.61 are obtained for all the acoustic parameters with the exception of C80m.
Due to the clear typological differences, the analysis was carried out on an individual basis, excluding the central plan and Greek cross churches as the sample size was too small, while the Basilica was analysed for acoustic parameter dependencies. Only correlations with R2 ≥ 0.65 exceeding the significant p level are presented.
For the Latin cross typology and acoustic or geometrical variables, only 2D correlations with reverberation parameters (T30 and EDT) are found. In the case of more homogeneous samples, churches with volumes of between 10.000 and 20.000 cubic metres, 2D correlations are found with acoustic variables for all the acoustic parameters with the exception of C80m (R2 ≥ 0.75).
For the basilica typology, only one correlation between one acoustic parameter and two geometrical variables is obtained for T30.
For the single-nave typology, only significant dependencies between acoustic parameters are found. These are especially significant between pairs of acoustic parameters when the sample is analysed by volumetric intervals.
In Latin cross and basilica churches, the 2D typological analysis between acoustic parameters shows significant results, when the sample is analysed in volumetric intervals, compared to the full sample.
The 3D typological analysis between acoustic parameters does not yield significant results compared to the full sample.
Author Contributions

Conceptualization, E.A., M.G., A.L.L.-R. and J.L.; methodology, E.A., M.G., A.L.L.-R. and J.L.; software, E.A., M.G., A.L.L.-R. and J.L.; validation, E.A., M.G., A.L.L.-R. and J.L.; formal analysis, E.A., M.G., A.L.L.-R. and J.L.; investigation, E.A., M.G., A.L.L.-R. and J.L.; resources, E.A., M.G., A.L.L.-R. and J.L.; data curation, E.A. and M.G.; writing—original draft preparation, E.A., M.G., A.L.L.-R. and J.L.; writing—review and editing, E.A., M.G., A.L.L.-R. and J.L.; visualisation, E.A., M.G., A.L.L.-R. and J.L.; supervision, E.A., M.G., A.L.L.-R. and J.L.; project administration, E.A., M.G. and A.L.L.-R. All authors have read and agreed to the published version of the manuscript.

Funding

This research received no external funding.

Data Availability Statement

Data will be made available upon formal request to the correspondence author (Miguel Galindo del Pozo) due to privacy reasons.

Conflicts of Interest

The authors declare no conflicts of interest.

References

  1. Sendra, J.; Navarro, J. La Evolución de las Condiciones Acústicas en las Iglesias del Paleocristiano al Tardobarroco; Instituto Universitario de Ciencias de la Construcción, Universidad de Sevilla: Sevilla, Spain, 1997; pp. 81–83. [Google Scholar]
  2. D’orazio, D.; Nannini, S. Towards Italian Opera Houses: A Review of Acoustic Design in Pre-Sabine Scholars. Acoustics 2019, 1, 252–280. [Google Scholar] [CrossRef]
  3. Borromeo, C. Instructionum fabricae et supellectilis ecclesiasticae libri duo. In Monumenta Studia Instrumenta Liturgica, 8; Della Torre, S., Marinelli, M., Eds.; Libreria Editrice Vaticana: Vatican City, Italy, 2000. [Google Scholar]
  4. Norberg-Schulz, C. Arquitectura Barroca; Aguilar, S.A.: Madrid, Spain, 1989; p. 22. [Google Scholar]
  5. Wittkower, R. Sobre la Arquitectura en la Edad del Humanismo: Ensayos y Escritos; Gustavo Gili: Barcelona, Spain, 1979; pp. 92–94. [Google Scholar]
  6. Girón, S.; Álvarez-Morales, L.; Zamarreño, T. Church acoustics: A state-of-the-art review after several decades of research. J. Sound. Vib. 2017, 411, 378–408. [Google Scholar] [CrossRef]
  7. Lottermoser, W. Nachhallzeiten in Barockkirchen. Acustica 1952, 2, 109–111. [Google Scholar]
  8. Carvalho, A. Influence of Architectural Features and Styles on Various Acoustical Measures in Churches; Universidad de Florida: Gainesville, FL, USA, 1994. [Google Scholar]
  9. Desarnaulds, V.; Carvalho, A. Analysis of reverberation time values in churches according to country and architectural style. In Proceedings of the 8th ICSV, Hong Kong, China, 2–6 July 2001. [Google Scholar]
  10. Shankland, R.S.; Shankland, H.K. Acoustics of St. Peter’s and Patriarchal Basilicas in Rome. J. Acoust. Soc. Am. 1971, 50, 389–396. [Google Scholar] [CrossRef]
  11. Cirillo, E.; Martellotta, F. Worship, Acoustics and Architecture; Multi-Science Publishing: Brentwood, CA, USA, 2006. [Google Scholar]
  12. Martellotta, F. Understanding the acoustics of Papal Basilicas in Rome by means of a coupled-volumes approach. J. Sound. Vib. 2016, 382, 413–427. [Google Scholar] [CrossRef]
  13. Xiang, P.R.N.; Googgans, P.; Jasa, T. Bayesian characterization of multiple-slope sound energy decays in couple-volume system. J. Acoust. Soc. Am. 2010, 129, 741–752. [Google Scholar] [CrossRef]
  14. Alberdi, E.; Martellotta, F.; Galindo, M.; León, Á.L. Dome sound effect in the church of San Luis de los Franceses. Appl. Acoust. 2019, 156, 56–65. [Google Scholar] [CrossRef]
  15. Alvarez-Morales, L.; Martellotta, F. A geometrical acoustic simulation of the effect of occupancy and source position in historical churches. Appl. Acoust. 2015, 91, 47–58. [Google Scholar] [CrossRef]
  16. Magrini, A.; Ricciardi, P. An Experimental Study of Acoustical Parameters in Churches. Int. J. Acoust. Vib. 2002, 7, 177–183. [Google Scholar] [CrossRef]
  17. Magrini, A.; Ricciardi, P. Churches as auditoria: Analysis of acoustical parameters for a better understanding of sound quality. Build. Acoust. 2003, 2, 135–157. [Google Scholar] [CrossRef]
  18. Caniato, M.; Bettarello, F.; Masoero, M. The Royal Church of San Lorenzo in Turin: Guarino Guarini and the Baroque architectural acoustics. J. Acoust. Soc. Am. 2008, 123, 3612. [Google Scholar] [CrossRef]
  19. Segura, J.; Giménez, A.; Romero, J.; Cerdá, S. A comparison of different techniques for simulating and measuring acoustic parameters in a place of worship: Sant jaume basílica in Valencia, Spain. Acta Acust. United Acust. 2011, 97, 155–170. [Google Scholar] [CrossRef]
  20. Garcia, F.; Planells, A.; Cerdá, S.; Montell, R.; Giménez, A.; Segura, J.; Cibrián, R. Archeological acoustics of the venue of the ‘Misteri d’Elx’, Oral and Intangible Cultural Heritage (UNESCO): Basilica de Santa María de Elche. In Proceedings of the Forum Acusticum, Krakow, Poland, 7–12 September 2014; 12 September 2014. [Google Scholar]
  21. Planells Pérez, A.; Segura Garcia, J.; Cerdá Jordá, S.; Barba Sevillano, A.; Cibrian Ortiz de Anda, R.M.; Giménez Pérez, A. Acústica virtual patrimonial. Aplicación a la auralización del Misteri d’Elx. Rev. Acústica 2016, 47, 3–9. [Google Scholar]
  22. Álvarez-Morales, L.; Girón, S.; Galindo, M.; Zamarreño, T. Acoustic environment of Andalusian cathedrals. Build. Environ. 2016, 103, 182–192. [Google Scholar] [CrossRef]
  23. Martellotta, F.; Álvarez-Morales, L.; Girón, S.; Zamarreño, T. An investigation of multi-rate sound decay under strongly non-diffuse conditions: The crypt of the Cathedral of Cadiz. J. Sound. Vib. 2018, 421, 261–274. [Google Scholar] [CrossRef]
  24. Alberdi, E.; Galindo, M.; León, A.L.; Bueno, A. El Ambiente Sonoro en la Capilla de San Telmo de Sevilla. In Proceedings of the European Symposium on Smat Cities and Enviroment Acoustic. Tecniacústica, Murcia, Spain, 29–31 October 2014. [Google Scholar]
  25. Alberdi, E.; Galindo, M.; León-Rodríguez, Á.L. Evolutionary analysis of the acoustics of the baroque church of san luis de los franceses (Seville). Appl. Sci. 2021, 11, 1402. [Google Scholar] [CrossRef]
  26. Alberdi, E.; Galindo, M.; León-Rodríguez, A.L.; León, J. Acoustic behaviour of polychoirs in the Baroque church of Santa María Magdalena, Seville. Appl. Acoust. 2021, 175, 107814. [Google Scholar] [CrossRef]
  27. Niemas, J.S.M.; Engel, Z. Acoustic issues of sacral structures. Arch. Acoust. 1998, 23, 87–104. [Google Scholar]
  28. Engel, Z.; Kosala, K. Acoustic Properties of the Selected Churches in Poland. Mechanics 2005, 24, 173–181. [Google Scholar]
  29. Engel, Z.W.; Kosała, K.; Engel, J.R. Problems of sound quality in sacral objects. In Proceedings of the Forum Acusticum Budapest 2005: 4th European Congress on Acustics, Budapest, Hungary, 29 August–2 September 2005. [Google Scholar]
  30. Kosała, K.; Engel, Z.W. Assessing the acoustic properties of Roman Catholic churches: A new approach. Appl. Acoust. 2013, 74, 1144–1152. [Google Scholar] [CrossRef]
  31. De Sant’Ana, D.Q.; Zannin, P.H.T. Acoustic evaluation of a baroque church through measurements, simulation, and statistical analysis. Can. Acoust. 2014, 4, 3–21. [Google Scholar]
  32. Dianderas, C.R.J. Correlación Entre Parámetros Acústicos Objetivos y Características Físico Arquitectónicas en Templos Católicos del Período Colonial en Ciudades Representativas del Perú; Poliitecnica de Madrid University: Madrid, Spain, 2010. [Google Scholar]
  33. Dianderas, C.R.J. Comparison of the acoustical behaviour of colonial churches of three architectural styles in Peru. Build. Acoust. 2013, 4, 255–263. [Google Scholar] [CrossRef]
  34. Dianderas, C.R.J.; Carvalho, A.P.O. Acoustics of churches from Portugal and Peru when they were once the same country. In Proceedings of the 19th International Congress on Sound and Vibration 2012, ICSV 2012, Vilnius, Lithuania, 8–12 July 2012; International Institute of Acousitcs and Vibration (IIAV): Southampton, UK, 2012. [Google Scholar]
  35. Abadía, L. Acústica de las iglesias jesuíticas como parte del patrimonio integral en Córdoba y San Ignacio Miní; Polictenica de Madrid, University: Madrid, Spain, 2015. [Google Scholar]
  36. Biancani, G. Sphaera Mundi seu Cosmographia, ac Facili Methodo Tradita; Seastiano Bonomi for Georonimo Tamburini: Bologna, Italy, 1540. [Google Scholar]
  37. Briatore, S. Suono e acustica nella trattatistica gesuitica del Seicento. Il caso di Mario Bettini. Forum Ital. J. Ital. Stud. 2015, 49, 322–337. [Google Scholar] [CrossRef]
  38. Barbieri, P. The estate of architectural acoustics in the late renaissance. In Architettura e Musica Nella Venezia del Rinascimento; B. Mondadori: Milan, Italy, 2006. [Google Scholar]
  39. ISO 3382-1:2009(E); Acoustics-Measurement of Room Acoustic Parameters-Part 1: Performance Spaces. International Organisation for Standardisation: Geneva, Switzerland, 2009.
  40. Carvalho, A.P.O. Relations between rapid speech transmission index (RASTI) and other acoustical and architectural measures in churches. Appl. Acoust. 1999, 58, 33–49. [Google Scholar] [CrossRef]
  41. Elicio, L.; Martellotta, F. Acoustics as a cultural heritage: The case of Orthodox churches and of the ‘Russian church’ in Bari. J. Cult. Herit. 2015, 16, 912–917. [Google Scholar] [CrossRef]
  42. Martellotta, F.; Cirillo, E. Acoustics and architecture in Italian Catholic churches. In Proceedings of the International Symposium on Room Acoustics, Seville, Spain, 10–12 September 2007. [Google Scholar]
  43. Meyer, J. Kirchenakustik; Verlag Erwin Bochinsky GmbH & Co. KG: Frankfurt am Mai, Germany, 2003. [Google Scholar]
  44. Cirillo, E.; Martellotta, F. Acoustics of apulian-romanesque churches: Correlations between architectural and acoustic parameters. Build. Acoust. 2003, 1, 55–76. [Google Scholar] [CrossRef]
  45. Galindo, M.; Zamarreño, T.; Girón, S. Acoustic simulations of Mudejar-Gothic churches. J. Acoust. Soc. Am. 2009, 126, 1207–1218. [Google Scholar] [CrossRef] [PubMed]
  46. Martellotta, F. A multi-rate decay model to predict energy-based acoustic parameters in churches. J. Acoust. Soc. Am. 2009, 125, 1281–1284. [Google Scholar] [CrossRef]
  47. SigmaPlot, Version 14.0, Systat Software, Inc.: San Jose, CA, USA, 2022.
  48. Beranek, L. Acoustics; Acoustical Society of America: New York, NY, USA, 1993. [Google Scholar]
  49. Marshall, L.G. An acoustics measuement program for evaluating auditoriums based on the early/late sound energy ratio. J. Acoust. Soc. Am. 1994, 96, 2251–2261. [Google Scholar] [CrossRef]
Figure 1. (a) Floor plan of the church of Santa Maria in Campitelli. (b) Floor plan of the church of San Andrea al Quirinale (Rome).
Acoustics 06 00051 g001
Figure 2. Reverberation times by frequency. Obermarchtal (OB), Ottobeuren (OM), Ochsenhausen (OH), Rot an der Rot (RT) and Ebersmunster (EM) [7]. (a) Obermachtal Church [Mythos Schwäbische Alb]. (b) Ottobeuren Church [delso.photo, License CC-BY-SA].
Acoustics 06 00051 g002
Figure 3. Carvalho. Measurements of RASTI speech transmission index [9]. (a) RASTI, with standard error for different architectural styles. (b) RASTI index based on distance for different periods. Regression lines. Both graphs show the Baroque period in red.
Acoustics 06 00051 g003
Figure 4. Martellotta. Graphs showing EDT at mid frequencies (500–1000 Hz) [12]. (a) Basilicas of Santa Maria Maggiore (SMM) and Saint Paul Outside the Walls (SPX). (b) Basilicas of Saint John Lateran (SJL) and Saint Peter’s (SPB).
Acoustics 06 00051 g004
Figure 5. Caniato. Church of San Lorenzo in Turin [18]. (a) Floor plan and positions of sources (S) and receivers (1 to 16) of the measurements. (b) Comparison of average reverberation time for source S1 and the values obtained for each receiver.
Acoustics 06 00051 g005
Figure 6. Martellotta. Crypt of Cádiz Cathedral [23]. (a) Floor plan of the crypt. Location of sources (S) and receivers (R). (b) Bayesian analysis. Source S1 Receiver R2. (c) Schema of flutter echoes. Source S2. Receiver S11.
Acoustics 06 00051 g006
Figure 7. Alberdi. Church of San Luis de los Franceses [14]. Cross section. Directional intensity maps. (a) 10 ms after direct sound (b) 20 to 120 ms.
Acoustics 06 00051 g007
Figure 8. Queiroz-de-Sant’Ana. Igreja Nossa Senhora do Rosário de São Benedito [31]. Floor plan showing position of sources (S1 and S2) and receivers (1 to 8). Graph showing reverberation time T30 for source position S1.
Acoustics 06 00051 g008
Figure 9. Jiménez-Dianderas and Carvalho [34]. Baroque churches. Church of San Francisco, Arequipa (Peru).
Acoustics 06 00051 g009
Figure 10. Architectural typologies analysed.
Acoustics 06 00051 g010
Figure 11. Box diagrams for different acoustic single-number parameters (T30m, EDT, C80m) and typologies. The 5th (down) and 95th (up) dot percentile. The 10th and 90th error bars. Box with 25th, 50th, 75th percentile lines and median bold line. Optimal reverberation time (Topt) by Beranek.
Acoustics 06 00051 g011
Figure 12. Three-dimensional plotted graph. EDT (Gaussian) and Ts (Plane).
Acoustics 06 00051 g012
Table 1. Churches selected in the sample.
Country (Cases)Researcher (Churches)Churches
Spain (6)Segura et al. (1)St. Jaume (1550–1582 *, B, V) (Valencia)
Planells et al. (1)Santa María de Elche (1672–1784, LC, B) (Murcia)
Alberdi et al. (3)Santa María Magdalena (1694–1709, LC, B), San Luis de los Franceses (1699–1731, C, D), San Telmo (1721–1724, SN, V) (Sevilla)
Alvarez-Morales et al. (1)Cádiz Cathedral (1722–1838, LC, V) (Cádiz)
Portugal (8)Carvalho (8)Estrela (1779–1790, LC, V), St Roque (1590–1619, LC, V) (Lisboa). Mosterio de Bustelo (1633, LC, V) (Penafiel), Dos Clérigos (1732, C, D) (Oporto), Misericordia (1554–1574, SN, V) (Évora), Monastery Tibaes (17th–18th c, LC, V) (Braga), Matriz (16th–17th c., LC, W) (Vila do Bispo), St. Lourenzo (17th c., SN, V) (Azeitao)
Italy (15)Cirillo et al. (6)Santi Luce e Martina (1634–1664, GC, D) Santa Agnese in Agone (1652–1657, GC, D), Santa Croce in Gerusalem (1740–1758 *, B, V) (Rome), San Lorenzo, Superga (1634–1680, C, D) (Turín), San Martino (1747–1775, LC, V) (Martina Franca)
Magrini et al. (4)N.S. Consolazione (1684–1706, B, V) (S.M. Vigne (1642 *, B, V), Annunziata (1615 *, B, V), St Cosma and Damiano (1684 *, B, V), (Genoa)
Ricciardi (3)St. Luca (1634–1664, GC, D), St Croce and St. Camillo (1667–1695, GC, D), Gesú (16th c., GC, D) (Genoa)
Martellotta (2)St Giovanni in Laterano (1646–1649 *, B, W), St. Maria Maggiore (1740–1758 *, B, W) (Roma)
Germany (2)Lottermoser (2)Monastery of Weingarten (1715–1724, LC, V), Monastery of Ottobeauren (1748, LC, V)
Poland (2)Engel et al. (2)Reformati Fathers (18th c., SN, V) (Wieliczka), St. Peter and St. Paul (1597–1619, LC, V) (Krakow)
Peru (28)Jimenez Dianderas (28)Nuestra Señora de la Merced (1647, LC, V), Convento San Francisco (16th c., LC, V), Santa Rosa de Santa María (1747, SN, V), Santo Domingo (1677–1680, LC, V), La Compañía de Jesús (1654–1698, LC, V) (Arequipa), Compañía de Jesús (1645, LC, V), Pampa San Agustín (16th c., SN, W) San Juan de Dios (1627, SN, V), Santa Ana (1748, LC, V), Santa María Magdalena (1558, LC, W), Santo Domingo (1548–1649, LC, V) (Ayacucho), Belén (1650, SN, V), Cathedral (1559–1659, B, V) Compañía de Jesús (1654–1671, LC, V), Merced (1651–1659, B, V), San Antonio Abad (1678–1699, SN, W), San Francisco (1651, B, V), San Pedro (1688–1699, LC, V), San Sebastián (17th c., SN, W), Santa Catalina (1651–1654, SN, V), Santa Teresa (1673–1676, SN, V), Santiago (17th c., SN, W), Santo Domingo (1680, B, V), Virgen de la Almudena (1698, LC, V), (Cusco), Carmen de la Legua (17th c., SN, V) San Francisco El Grande (17th c., B, V) (Lima), San Francisco de Asís (1677–1696, B, V), San Pedro (16th c., LC, V) (Puno)
Argentina (4)Abadía Succi, L. (4)Santa Catalina (1754, LC, V), Alta Gracia (1767, LC, V), La Compañía de Jesús (1645, LC, W) (Córdoba), San Isidro Labrador (1729, LC, V) (Jesús María)
Brazil (1)Queiroz (1)Nossa Senhora do Rosário de São Benedito (18th c., LC, V) (Paraty)
(Date, X, Y); * Remodelled in the Baroque period. X: typology (LC, C, GC, SN, B); Y: Main audience area coverage (V (vault), D (dome), W (Wood)). Religious orders: Jesuits, Dominicans, Franciscans, Carmelites, Benedictines, Mercedarians, Augustinians.
Table 2. Sample study. Dimensional ranges (). Values of individual cases.
Latin Cross (LC)Central (C)Greek Cross (GC)Single Nave (SN)Basilical (B)
No. churches27451614
Length (m)25–8930–5925–6621–52 (83)23–126
Surface area (m2)321–2970273–650140–1580174–597 (1870)241–5800
Vol. (103 m3)1.9–1304.8–222.4–25.60.7–8.59.1–120
Table 3. Data available for the sample. Typology and acoustic parameter.
(LC)(C)(GC)(SN)(B)Total
T30m2745161466
EDTm2035121050
C80m2445161463
D50m2223151052
TSm202314746
Table 4. Best fitting surface types and their equations.
Surface TypeEquation
Plane z = z 0 + a x + b y
Paraboloid z = z 0 + a x + b y + c x 2 + d y 2
Gaussian z = a e 0.5 x x 0 b 2 + y y 0 c 2
Lorentzian z = a 1 + x x 0 b 2 1 + y y 0 c 2
Table 5. Best correlations between one acoustic parameter and another two parameters, the coefficients of the surface type and their determination coefficient.
ParameterSurface TypeVariableCoefficients
T30ParaboloidEDT, TS z 0 = 0.9387 ,   a = 0.7267 ,   b = 0.0011 ,  
c = 0.0214 ,   d = 2.2279 · 10 7 ,   R 2 = 0.78
EDTGaussianT30, TS z 0 = 11.3568 ,   y 0 = 722.9645 ,   a = 9.1560
b = 6.7779 ,   c = 533.7480 ,   R 2 = 0.87
D50ParaboloidC80, TS z 0 = 0.3533 ,   a = 0.0179 ,   b = 0.0005 ,  
c = 0.0005 ,   d = 4.4410 · 10 7 ,   R 2 = 0.67
TSPlaneT30, EDT z 0 = 24.7522 ,   a = 26.8540
b = 116.2150 ,   R 2 = 0.61
Table 6. Best correlations between one acoustic parameter and a geometrical variable, the coefficients of the equation and their determination coefficient.
ParameterVariableCoefficients
EDTV/S y 0 = 72.6052
a = 15.8495
b = 1.1003
c = 0.0255
R 2 = 0.997
Table 7. Best correlations between one acoustic parameter and another two geometrical parameters and the coefficients of the surface type and their determination coefficient. Latin Cross typology.
ParameterSurface TypeVariableCoefficients
T30ParaboloidV, V/S z 0 = 8.2704 ,   a = 0.0009 ,   b = 1.7042 ,  
c = 3.1090 · 10 8 ,   d = 0.0633 ,   R 2 = 0.91
EDTParaboloidS, V/S z 0 = 37.3904 ,   a = 0.0039 ,   b = 4.5453 ,  
c = 2.3165 · 10 6 ,   d = 0.1575 ,   R 2 = 0.99
Table 8. Best correlations between one acoustic parameter and another two geometrical parameters and the coefficients of the surface type and their determination coefficient. Basilica typology.
ParameterSurface TypeVariableCoefficients
T30ParaboloidV, V/S z 0 = 4.2176 ,   a = 3.0026 · 10 5 ,   b = 1.3185 ,  
c = 6.0367 · 10 10 ,   d = 0.0429 · 10 6 ,   R 2 = 0.66
TSParaboloidS, V/S z 0 = 2597.8576 ,   a = 10.0082 ,   b = 913.1179
c = 0.0031 ,   d = 36.7648 ,   R 2 = 0.98
Table 9. Best correlations between pair of acoustic parameters, the coefficients of the equation type and their determination coefficient.
ParameterVariableEquation TypeCoefficients
T30EDTPolynomial (Cubic) y 0 = 1.0622 ,   a = 1.8296 ,   b = 0.2249 ,  
c = 0.0171 ,   R 2 = 0.98
EDTT30Logarithm (3rd Order) y 0 = 4.5769 ,   a = 7.3837 ,   b = 6.9055 ,  
c = 1.2362 ,   R 2 = 0.97
Table 10. Best correlations between one acoustic parameter and another two ones, the coefficients of the surface type and their determination coefficient.
ParameterSurface TypeVariableCoefficients
T30ParaboloidEDT, TS z 0 = 8.3135 ,   a = 0.0001 ,   b = 0.2326 ,  
c = 6.9291 · 10 10 ,   d = 0.0022 ,   R 2 = 0.74
EDTGaussianT30, TS z 0 = 12.5575 ,   a = 9.5165 · 10 5 ,   b = 0.3647 ,  
c = 6.6241 · 10 10 ,   d = 0.0033 ,   R 2 = 0.84
Table 11. Best correlations between two acoustic parameters, volume interval, equation type, the coefficients of the equation and their determination coefficient. Latin Cross typology.
ParameterVariableV (m3)Equation TypeCoefficients
T30EDT<104Polynomial (Linear) y 0 = 0.2682 ,   a = 1.0417 , R 2 = 0.98  
EDTT30<104Polynomial (Linear) y 0 = 0.3183 ,   a = 0.9418 , R 2 = 0.98
T30EDT104V ≤ 2∙104Polynomial (Linear) y 0 = 0.2237 ,   a = 1.0001 , R 2 = 0.996
EDTT30104V ≤ 2∙104Polynomial (Linear) y 0 = 0.2415 ,   a = 0.9955 , R 2 = 0.996
D50TS104V ≤ 2∙104Polynomial (cubic) y 0 = 0.0781 ,   a = 0.0027 ,
b = 8.8432 · 10 6 ,  
c = 8.1714 · 10 9 ,   R 2 = 0.87
TSD50104V ≤ 2∙104Polynomial (inverse 3rd Order) y 0 = 4998.4231 ,   a = 1742.0565 ,  
b = 205.0782 , c = 7.5684 ,   R 2 = 0.86
Table 12. Correlation between two individual acoustic parameters, the coefficients of the equation and their determination coefficient.
ParameterVariableCoefficients
D50C80 y 0 = 0.4106 ,   a = 0.0818
b = 0.0069  
c = 0.0002 ,   R 2 = 0.95
Table 13. Best correlations between two individual acoustic parameters, the coefficients of the surface type and their determination coefficient.
ParameterSurface TypeVariableCoefficients
D50ParaboloidEDT, C80 z 0 = 0.4929 ,   a = 0.1359 ,   b = 0.0407 ,  
c = 0.0277 ,   d = 0.0014 ,   R 2 = 0.94
TSParaboloidEDT, D50 z 0 = 453.1379 ,   a = 160.5536 ,   b = 1728.3538
c = 45.1449 ,   d = 4446.0818 ,   R 2 = 0.93
Table 14. Best correlations between two acoustic parameters, volume interval, equation type, the coefficients of the equation and their determination coefficient. Single-Nave typology.
ParameterVariableV (m3)Equation TypeCoefficients
T30C80<2500Pseudo-Voigt, 5-Parameter y 0 = 3.7705 ,   x 0 = 0.0625 , a = 2.0094  
b = 3.1063 , c = 0.8045 , R 2 = 0.97
C80D50<2500Polynomial (cubic) y 0 = 21.2656 ,   a = 213.7030 ,
b = 833.4227
c = 1145.2392 ,   a = 0.9418 , R 2 = 0.95
TSC80<2500Polynomial (cubic) y 0 = 123.0558 ,   a = 4.5771 ,
b = 15.2778
c = 3.6348 ,   a = 0.9418 , R 2 = 0.85
EDTT30V ≤ 2500Modified Gaussian, 5-Parameter y 0 = 3366.9459 ,   x 0 = 4.3420 ,
a = 3371.9446  
b = 3371.9446 , c = 1.0133 , R 2 = 0.90
T30C80V ≤ 2500Polynomial (cubic) y 0 = 2.5834 ,   a = 1.3545 ,   b = 0.5072 ,  
c = 0.0453 · 10 9 ,   R 2 = 0.85
D50C80V ≤ 2500Modified Gaussian, 5-Parameter y 0 = 1.7601 ,   x 0 = 7.5000 , a = 1.6503  
b = 22.4887 , c = 1.0007 , R 2 = 0.96
TSEDTV ≤ 2500Polynomial (inverse 3rd Order) y 0 = 1303.1102 ,   a = 5643.5922 ,  
b = 9145.4647 , c = 4674.0578 ,  
R 2 = 0.92
Disclaimer/Publisher’s Note: The statements, opinions and data contained in all publications are solely those of the individual author(s) and contributor(s) and not of MDPI and/or the editor(s). MDPI and/or the editor(s) disclaim responsibility for any injury to people or property resulting from any ideas, methods, instructions or products referred to in the content.