Abstract
Objective speech intelligibility estimations undertaken in natural acoustics speech communications (NAS) scenarios require the utilization of a speech source that approximates the acoustic characteristics of a human talker. Only a limited number of special speech sources that conform to the specifications in the relevant guidelines are available in the market; however, they can be deemed expensive by professional practitioners and other users. Non-special and affordable loudspeakers are often used in NAS investigations in place of standardized special speech sources without the knowledge of their suitability and results validity. This study aims to examine the suitability of a range of representative common and affordable non-special loudspeakers as a potential alternative to standardized speech sources in NAS indicative or pilot investigations. Frequency response and Speech Transmission Index Public Address (STIPA) experimental results obtained from a reference standardized speech source were compared against results from various non-special loudspeakers measured utilizing diverse and real-world representative combinations of NAS acoustic conditions under controlled laboratory conditions. STIPA mean absolute errors for the alternative speech sources were generally lower than the STIPA method uncertainty and one Just Noticeable Difference (0.03 STI). The findings of this study will inform practitioners of the suitability of affordable loudspeakers when standardized special test loudspeakers are not available.
1. Introduction
1.1. Background
In numerous indoor spaces, speech communications are essential for the purpose and type of activities undertaken inside them (e.g., airport lounges, train ticket halls, museums, lecture theatres, assembly halls, and workshops). Hence, an adequate level of speech transmission quality is required for the effective and safe accomplishment of those activities. Depending on the use, size, and configuration of the space or room, the speech can be generated and transmitted unamplified by a human talker (natural acoustics speech) or be supported in its generation and transmission by an amplified speech reinforcement system (SRS).
Natural acoustics speech communication (NAS) is comprised of the human talker (speech sound source), the room (transmission channel), and the listeners (receivers). This system (also called “Direct” or “Person to Person” communication []) is characterized by the source and receiver being in the same environment and by the absence of electroacoustic speech reinforcement devices such as microphones, amplifiers, or loudspeakers (Figure 1). The NAS system is widely employed in a variety of spaces of small to moderate sizes where speech transmission quality and the resulting speech intelligibility is of critical importance [,]. Examples of these specialist spaces include courtrooms, control rooms, offices, theatres, conference rooms, interview rooms, operation theatres, and classrooms.
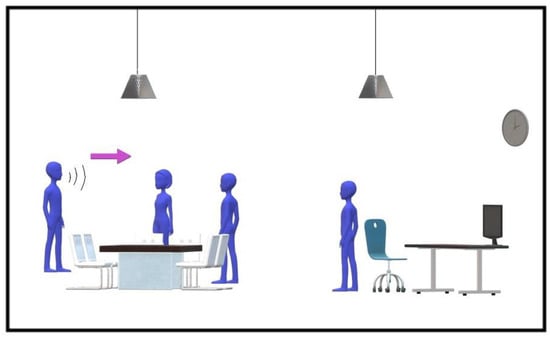
Figure 1.
Person-to-person natural acoustics speech communication system (NAS) scenario.
The evaluation of the potential speech intelligibility attained in these spaces is crucial in the establishment of their suitability for the intended use. The Speech Transmission Index Public Address (STIPA) [] is a globally accepted standardized method [,] that can be applied to objectively determine the potential speech intelligibility in NAS applications. The STIPA metric is a subset version of the parent full Speech Transmission Index (STI) method [] and employs only two modulation frequencies for each of the seven frequency octave bands of interest (125 Hz–8 kHz) to determine the level of modulation degradation of the test signal between source and receiver caused by the transmission channel. It was originally developed to suit field speech intelligibility estimations of Public Address systems (PA), shorten the measurement time, and be implemented into a portable meter. Both the full STI and subset STIPA method rate the estimated speech intelligibility of the transmission channel between 0 and 1, where “0” corresponds to total unintelligibility and “1” to a maximum or total intelligibility.
The STIPA method in NAS applications requires the STIPA speech-like test signal to be reproduced acoustically by a sound source that simulates a talker’s natural speech production. Hence, the relevant standard IEC 60268-16:2020 [] recommends the use of a suitable test loudspeaker or a special electroacoustic sound source to emulate the speech acoustical characteristics of a human talker. To that purpose, the physical size, directivity, orientation, and frequency response of the speech sound source are the key parameters to consider in its application.
1.2. Specifications for Special Test Loudspeaker
The relevant standard [] provides the following suitability criteria for the special test loudspeaker or suitable sound test loudspeaker (e.g., artificial mouth) in STIPA testing in SRS and NAS scenarios:
- (a)
- The test signal source should exhibit the 1/3 octave frequency response within ±1 dB over the frequency range 88 Hz to 11.6 kHz (the limits of the 125 Hz and 8 kHz octave bands) when measured in a free field;
- (b)
- The individual octave band Leq levels over the range 125 Hz to 8 kHz are within ±1 dB and preferably ±0.5 dB of the values for the male spectrum signal given in the standard when using a STIPA or other speech-shaped test signal conforming to the STI spectrum.
1.3. Special Test Loudspeaker
Special test loudspeakers that conform to the suitability criteria given in Section 1.2 exist in three configurations: artificial mouth, Head and Torso Simulator (HATS), and Talkbox. Their names refer to the way they encase a high-grade loudspeaker. They are designed to provide highly accurate, repeatable, and reliable reproduction of speech acoustic signals.
An artificial mouth (or mouth simulator), shown in Figure 2a, is an electroacoustic device that simulates the acoustic field created by a human mouth in the near field. The relevant standard ITU-T Recommendation P.51 (08/1996) [] provides recommended specifications for its electrical and acoustics characteristics. The device is formed of a precision loudspeaker (and often a built-in amplifier) encased in a specialist housing to produce a radiation and directivity pattern comparable to those of the average person’s mouth []. It is mainly utilized in electroacoustic testing of telephonic and close-talk communication devices. However, it can also be employed for the purposes of measuring the STIPA rating in SRS and NAS applications []. The typical price of an artificial mouth is GBP 2500.
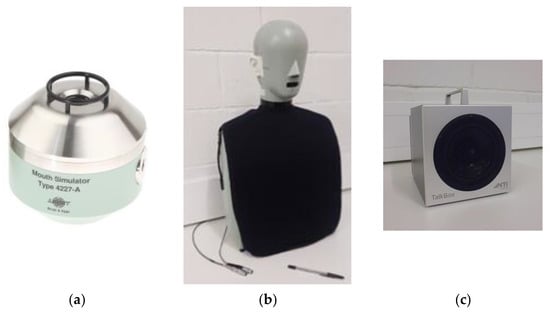
Figure 2.
(a) B&K artificial mouth; (b) B&K Head and Torso Simulator (HATS); (c) NTI Talkbox. Photograph (a) courtesy of Hottinger Brüel & Kjær (B & K).
A Head and Torso Simulator (HATS), shown in Figure 2b, is a half-bodied manikin incorporating an artificial mouth and two ear simulators that replicate the acoustics characteristics and sound diffraction effects of the median head and torso of an adult person. Due to the realistic representation of the human shape, structure, and size, a HATS is mainly intended for electroacoustic field testing on communication devices such as headphones, telephone handsets, hearing aids, headsets, headphones, and communication helmets. The relevant standard, ITU-T Recommendation P.58 [] gives specifications on the electroacoustic characteristics of the HATS for telephonemetric use. However, due to its electroacoustic characteristics conforming to requirements by the relevant standard [], it can be employed as a suitable speech test source for the purposes of measuring the STIPA rating in SRS and NAS applications []. The typical price of a HATS is GBP 20,000.
A Talkbox (shown in Figure 2c) is an electroacoustic device consisting of a precision loudspeaker and built-in amplifier; both encased in a specialist enclosure constructed to produce the sound directivity and radiation pattern comparable to those of an average adult person’s head. It generates a calibrated frequency response for reproduced test signals []. A Talkbox is the ideal speech sound source for the majority of STIPA testing in NAS scenarios [,], where the acoustic signal source does not need to incorporate the shape and size of a person’s head and torso. It precisely produces the STIPA reference test signal at the calibrated output level and frequency response flatness specified by the relevant standard []. The typical price of a TalkBox is GBP 1600.
1.4. Alternative Speech Sound Sources
The same standard, IEC 60268-16:2020, provides guidance specifications for “suitable transducers” as alternative speech sound sources [] when special sources described in Section 1.3 are not available. This suitable sound source should be formed of a small, single-source, high-quality loudspeaker with a driver cone diameter not exceeding 65 mm to approximate the sound directivity of a human talker (the previous version of the standard [] limited the recommended cone diameter to 100 mm). If this alternative source is employed, it should be described in the result section of a report. Moreover, the alternative source should exhibit the following requirements:
- (a)
- The directionality should match that of a human talker;
- (b)
- The shape of the test signal spectrum measured at 50 mm from the source should not deviate from the defined STI spectrum shape (Table A.4 of the standard) by more than ±2.5 dB when measured at the specified reference point of 250 mm or 500 mm (as nominated by the manufacturer);
- (c)
- The distortion characteristics associated with the system (e.g., driver excursion, amplifier power capacity, enclosure vibrational modes) should be sufficiently low so that the m values (in the STI Modulation Transfer Matrix) are unity (so no modulation degradation) when measured under anechoic conditions at the reference position with the maximum corrected speech level.
1.5. Rationale and Aim
A limited number of special speech sound sources that conform to the relevant standard specified criteria are available in the market. They are expensive devices and can be deemed unaffordable for a sector of industry/research practitioners and professional and non-professional users. Likewise, the onerous requirements for alternative speech sources indicated in the relevant standard [] can make it difficult for those users to find, test, or construct alternative sources that conform with the standard specifications. A similar rationale and insights were found in an investigation [], which explored the suitability of utilizing low-cost common directional loudspeakers in impulse response measurements in place of a standardized reference dodecahedron omnidirectional sound source.
On the other hand, very limited research is reported in the literature related to the suitability of non-special loudspeakers as speech sound sources in NAS testing applications. Only one related study was found that employed non-special test loudspeakers as speech sources. However, the results provided [] were based on room acoustic computer simulation methods involving limitations on the virtual characterization data of the loudspeakers employed.
This lack of reliable information and guidance in the literature leads to non-special loudspeakers being employed in the relevant industry and academia in place of standardized special speech test loudspeakers for the purposes of preliminary studies, survey-grade speech intelligibility investigations, or practical experiments without the knowledge of their practical suitability and validity of results.
This study aims to examine the performance suitability of a representative range of non-special and affordable self-amplified loudspeakers when employed in place of a standardized special speech test loudspeaker (reference) in objective measurement (estimations) of speech intelligibility in natural acoustics speech communications.
2. Materials and Methods
For the purposes of this study, the examination of the suitability of non-special loudspeakers was principally based on the analysis of several parameters’ results when compared against data obtained from the reference.
Speech intelligibility and electroacoustic parameters were tested in tun experimentally under controlled laboratory conditions representative of potential NAS applications. Results from three representative non-special and affordable loudspeakers were compared against the results from a standardized special loudspeaker speech source taken as the reference. Absolute error is defined in this study as the arithmetic difference in decibels between the reference value and the value for the non-special loudspeaker under testing.
The basic description of the loudspeakers and the reference source (speech sources) tested in this study are presented in Table 1. Figure 3 shows photos of the four built-in amplified speech sources.

Table 1.
Description of the speech sources tested.
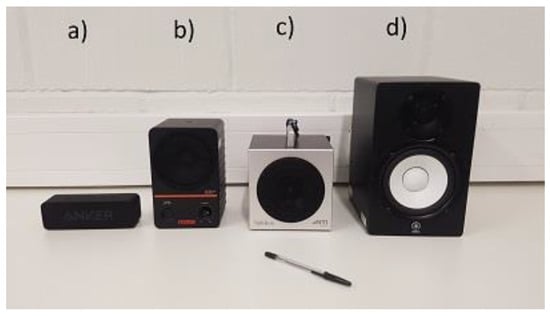
Figure 3.
The four speech sources from left to right: (a) Anker, (b) Fostex, (c) Talkbox, and (d) Yamaha.
Measurements of the background noise sound pressure level (SPL), frequency response, and STIPA were performed in turn on each of the speech sources in two different controlled acoustic environments. A fully in-calibration NTI-Audio XL2 acoustic analyzer incorporating an NTI M2215 microphone was employed to take SPL and frequency response measurements (receiver SLM1). Another fully in-calibration XL2 class-I analyzer incorporating an NTI M2211 microphone was used as the receiver to take STIPA readings (receiver SLM2). Both measuring systems fully conformed with class-I specifications of sound level meters international standard IEC 61,672:2013 []. A fully in-calibration test signal generator (NTI-Audio Minirator, MR-Pro) provided the pink noise and STIPA test signals via an XLR cable connection into the line-in input of Yamaha and Fostex sources. Pink noise and STIPA signals were provided to the Anker source line-in input from a Toshiba Portege laptop via a mini-jack cable. The Yamaha and Fostex are studio-quality monitors. For the purposes and scope of this study, their reproducibility was deemed to be sufficient to employ only one unit of each model. The Anker model, however, is a low-cost general-purpose loudspeaker, and discrepancies in reproduction performance can be expected from unit to unit. Hence, three Anker units of the same model were tested to evaluate its reproducibility.
The first acoustic environment (semi-reverberant test room) consisted of the reverberation chamber at London South Bank University (LSBU) of 204 m3 of volume, including 10 m2 of highly sound-absorbing material (mineral wool) exposed on one of the chamber’s walls (Figure 4a and Figure 5a). The mid-frequencies average (500 Hz, 1 kHz, and 2 kHz) reverberation time RT30midfreq of the semi-reverberant test room measured to ISO 3382-1:2009 [] was 1.7 s. The second acoustic environment (anechoic test room) was the LSBU full anechoic chamber of 145 m3 (excluding volume occupied by wedges). These two environments represented a range of real-world NAS acoustic conditions.
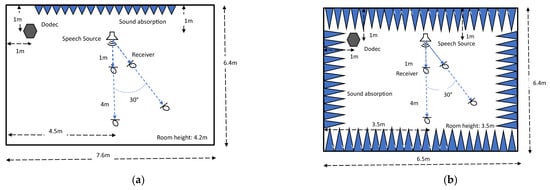
Figure 4.
(a) Semi-reverberant room test layout; (b) anechoic room test layout (plan view, not to scale).
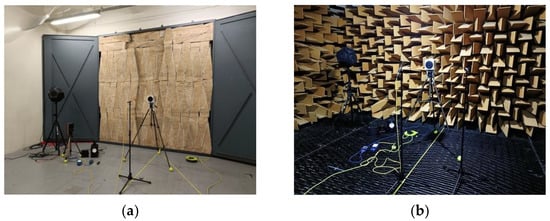
Figure 5.
(a) Photo of semi-reverberant room test layout; (b) photo of anechoic room test layout.
Temperature and relative humidity (RH) were monitored in those two rooms during measurements. They remained fairly constant with insignificant fluctuations at around 20 °C and 56%, respectively.
The frequency response to the pink noise test signal was measured for each speech source in turn in the anechoic chamber. Leq10sec was the parameter chosen to capture the frequency response in 1/3 octave bands. The source position consisted of a reference mark point set at 1.6 m height from the floor. This mark acted as a guide to situate with precision the approximate geometrical center of each speech source. The receiver consisted of the SLM2 microphone set also at 1.6 m height from the floor and situated at 1 m on axis (0°) from the source position point (Figure 4b and Figure 5b). The receiver SLM2 body was connected remotely to its microphone via an XLR extension cable to avoid contaminating reflections from the analyzer’s or operators’ bodies. The overall output level at the receiver was adjusted for each speech source to match the standardized overall output signal from the Talkbox (reference speech source) pink noise test signal in the Lombard level option (70 dBA measured on-axis at 1 m from the source position).
STIPA measurements were performed in both rooms following the test procedure specified in the latest version of relevant standard IEC 60268-16:2020 []. Each speech source under test was fed in turn with the STIPA test signal (5th version) specified in the latest version of the relevant standard. The output level of the test signal was adjusted in the anechoic chamber for each source to measure 70 dBA at the SLM2 receiver with its microphone positioned on-axis at 1 m from the speech source position. This calibration adjustment was performed to match the fixed signal output from the Talkbox (reference source) STIPA test signal Lombard level option. This selected output signal level corresponds to raised vocal effort exerted by talkers to overcome noisy backgrounds (Lombard effect). In line with the standard IEC 60268-16:2020 test procedure, 70 dBA was chosen for this study as representative level of raised vocal effort expected to be exerted by a person addressing a group of people situated at different distances in an indoor or outdoor NAS scenario. Once the speech sources’ output levels were calibrated, they remained unchanged for the duration of the entire measurement session.
Sets of five consecutive STIPA measurement cycles were taken in turn by the receiver (SLM2) at the following four receiver positions in each room: at 1 m on-axis, at 1 m 30° off-axis, at 4 m on-axis, and at 4 m 30° off-axis (Figure 4 and Figure 5). Each source and receiver microphone height in both rooms was set at 1.6 m from the floor (i.e., adult average standing ear and mouth height) []. During STIPA measurements in both rooms, pink noise was emitted by an ANV dodecahedron sound source (Dodec) positioned at 4 m from the nearest receiver position at 1.6 m from the floor, acting as a background noise source. The level of this controlled background noise was set in both rooms to measure 35 dBA at each receiver position to represent interference background noise (e.g., mechanical ventilation airflow noise) at a level typical of STIPA measurements in NAS situations (e.g., open plan office, classroom) [].
3. Results
3.1. Speech Sources Data
Table 2 shows details of a set of representative sound sources that might be employed for NAS speech intelligibility measurements. In Table 2, Cone refers to the loudspeaker driver cone. Commercial prices stated were approximate as of 2022.

Table 2.
Comparative of speech test sources information.
Models 1, 2, 3 are dedicated precision-calibrated sound sources that exhibit similar directivity characteristics to those of a human talker. They conform to the specifications of the relevant standard IEC 60268-16:2020 for special test loudspeakers. Models 4 and 5 are consumer-quality studio monitors. Model 4 comprises two drivers of different sizes to reproduce the full audio range using a two-way arrangement. Model 6 is a portable consumer, highly affordable two-way loudspeaker featuring three driver cones of two different sizes.
For the purposes of this study, Model 3 (NTI -Talkbox) was employed as the reference standardized speech test loudspeaker. Its frequency response flatness and calibrated reference test signal level comply with the relevant standard IEC 60268-16:2020. Moreover, its radiation pattern is comparable to those of the average adult person’s head and complies with the ITU-T P.51 [] standard in wide ranges.
In Table 2, it can be seen that speech test sources conforming to the relevant standard (model numbers 1, 2, and 3) are between 625 and 10.6 times more expensive than the non-special loudspeakers. Model 1 (HATS) is the most expensive, has the largest volume, and is the heaviest of all models, making it the least portable and logistically convenient of all the models for practical NAS speech intelligibility field surveys.
3.2. Frequency Response
Figure 6a presents the frequency response in 1/3 octave bands for the four speech test loudspeakers under test when measured at 1 m on the axis. The Anker green trace represents the average of the values from the three Anker units tested, and the error bars indicate the standard deviation. Mean absolute errors in frequency response from reference values are shown in Figure 6b.
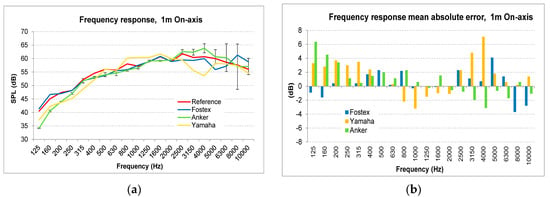
Figure 6.
(a) Frequency response; (b) mean absolute error for the four speech test sources measured on axis at 1 m.
At 1/3 octaves below 125 Hz, the Anker model produced levels more than 10 dB below the reference. Hence, for readability and clarity in Figure 5a,b, data corresponding to 1/3 octave bands 80 Hz and 100 Hz have not been included.
3.3. STIPA
STIPA and corresponding mean absolute error values obtained at different distances and angles from each non-special loudspeaker in the two test rooms are presented in Figure 7, Figure 8, Figure 9 and Figure 10. The error bars indicate the standard deviation for each set of five STIPA reading cycles. The red dotted lines indicate a range of ±0.3 STI which is the uncertainty associated with the STIPA method []. This value is also widely accepted as approximately the Just Noticeable Difference (JND) for the STI and STIPA [,].
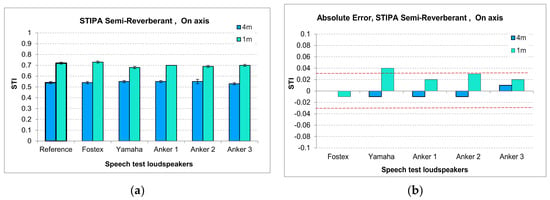
Figure 7.
(a) STIPA values measured in the semi-reverberant test room on axis at 1 m from the various non-special loudspeakers. (b) STIPA mean absolute error values.
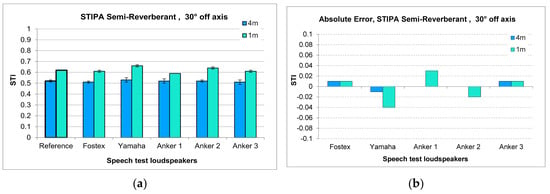
Figure 8.
(a) STIPA values measured in the semi-reverberant test room 30° off axis at 1 m from the various non-special loudspeakers. (b) STIPA mean absolute error values.
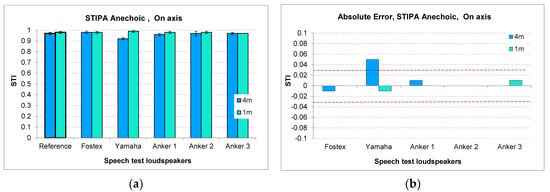
Figure 9.
(a) STIPA values measured in the anechoic test room on axis at 1 m from the various non-special loudspeakers. (b) STIPA mean absolute error values.
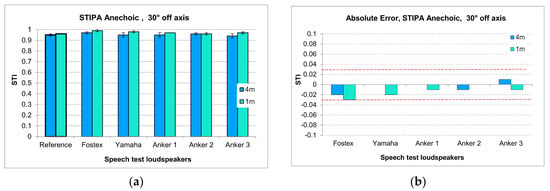
Figure 10.
(a) STIPA values measured in the anechoic test room 30° off axis at 1 m from the various non-special loudspeakers. (b) STIPA mean absolute error values.
4. Discussion
In Figure 6a, it can be observed that the overall frequency response shape and frequency range of the three non-special loudspeakers are similar to those of the reference. The largest discrepancies from the reference (i.e., errors) were seen on the Anker and Yamaha responses in Figure 6b at low frequencies below 250 Hz and between 2.5 kHz and 5 kHz, although the mean absolute error in those ranges was within 4.8 dB.
The Anker frequency responses for the three units were surprisingly uniform, featuring a standard deviation (std) of less than 1.2 dB across a wide range (125–3150 Hz). However, in the higher end of the spectrum (4–10 kHz), this low-cost loudspeaker displayed average-level inconsistencies (std) of 4.2 dB and up to 8 dB in the 8 kHz band. These inconsistencies could be explained by the fact that loudspeaker frequency response fluctuation at high frequencies is more susceptible to variance in loudspeaker components’ quality, manufacturing, and assembly processes than at lower frequencies [,].
STIPA mean absolute error values obtained for the three non-special loudspeakers in the semi-reverberant test room in the on-axis condition shown in Figure 7b were surprisingly low. When the source–receiver distance was 4 m, the error showed for all the loudspeakers was within 0.01 of STI and within 0.03 STI (or one JND) at 1 m, except for the Yamaha, which showed an error of 0.04 STI. The STIPA measurement uncertainty for each loudspeaker and for each set of five reading cycles expressed in terms of std is shown in Figure 7a. It can be observed that the measurement uncertainty was very low (average 0.01 STI) for all the loudspeakers when tested at both 1 m and 4 m.
Those on-axis results in the semi-reverberant room are also true for the 30° off-axis situation (Figure 8a,b).
STIPA mean absolute error values obtained for the three non-special loudspeakers in the anechoic test room in the on-axis condition shown in Figure 9b were also remarkedly low. For both source–receiver distances (1 m and 4 m), the error showed for all the loudspeakers was within 0.01 STI except for the Yamaha, which showed an error of 0.04 STI only at 4 m. The STIPA measurement uncertainty for each loudspeaker and for each set of five reading cycles is shown in Figure 9a. It can be observed that the measurement uncertainty again was very low for all the loudspeakers when tested at both 1 m (average 0.01 STI) and 4 m (average 0.02 STI).
STIPA mean absolute error values for the anechoic test room in the 30° off-axis condition were within 0.02 STI for both distances, except for Fostex, which showed an error of 0.03 STI only at 1 m (Figure 10b). Measurement uncertainty for all loudspeakers in this test room and source–receiver angle was an average of 0.01 STI for 1 m and an average of 0.02 STI for 2 m (Figure 10a).
The level of agreement between STIPA values obtained from non-special loudspeakers and those from the reference was remarkedly high. This finding was consistently observed in all test combinations of acoustic environments, source–receiver distance, and angles. Mean absolute errors were generally below one JND, which could be interpreted as the measured discrepancies with the reference are non-perceivable and, therefore, negligible. The high measurement certainty consistently observed at all test combinations provides further confidence in the above finding.
From these conclusive results, it could be preliminarily implied that the STIPA metric, when employed in close/mid-range NAS situations, might allow for less restrictive tolerances in the speech test loudspeaker than is currently specified in the relevant standard.
However, further work is necessary to ascertain this conjecture and to quantify the maximum allowable tolerances.
It is expected that the findings and insights provided in this study could influence future speech test loudspeaker product design and development. This study will inform practitioners, academics, consultants, and researchers who employ affordable non-special loudspeakers in preliminary NAS investigations when standardized special test loudspeakers are not available.
5. Conclusions
Three non-special loudspeakers and a reference standardized special speech test loudspeaker were employed in turn as speech test sources during frequency response and STIPA measurements under various combinations of natural acoustics speech communication (NAS) scenarios.
The measurement mean absolute errors for the three non-special loudspeakers for all combinations were generally lower than the STIPA method uncertainty (0.03 of the STI) or one JND. The measurement uncertainty observed for three non-special loudspeakers for all combinations was generally within 0.01 of the STI—the same value as for the reference. This remarkable performance agreement with the reference suggests that some affordable common loudspeakers could be suitable as speech test signal sources in pilot- or survey-grade natural acoustic speech intelligibility investigations when a standardized speech test loudspeaker is not available.
The findings of this study will provide practitioners for the first time with knowledge on the potential suitability of utilizing non-specialist loudspeakers in NAS investigations. Further work will aim to expand the scope of test scenarios and combinations of influencing factors to consolidate the findings of this study and provide guidance on suitable affordable non-special loudspeakers.
Author Contributions
Conceptualization L.G.-A.; methodology L.G.-A. and L.S.T.M.; validation L.G.-A. and H.A.; formal analysis L.G.-A., H.A. and L.S.T.M.; writing—original draft preparation L.G.-A.; writing—review and editing, L.G.-A. and H.A. All authors have read and agreed to the published version of the manuscript.
Funding
This research received no external funding.
Data Availability Statement
The data of this study are available within the article.
Conflicts of Interest
The authors declare no conflict of interest.
References
- ISO 9921:2003; Ergonomics—Assessment of Speech Communication. International Organization for Standardization: Geneva, Switzerland, 2003.
- D’Orazio, D.; Rossi, E.; Garai, M. Comparison of different in situ measurements techniques of intelligibility in an open-plan office. Build. Acoust. 2018, 25, 111–122. [Google Scholar] [CrossRef]
- Zhu, P.; Tao, W.; Mo, F.; Guo, F.; Lu, X.; Liu, X. Experimental comparison of speech transmission index measurement in natural sound rooms and auditoria. Appl. Acoust. 2020, 165, 107326. [Google Scholar] [CrossRef]
- IEC 60268-16:2020; Sound System Equipment—Part 16: Objective Rating of Speech Intelligibility by Speech Transmission Index. International Electrotechnical Commission: Geneva, Switzerland, 2020.
- ITU-T Recommendation P.51 (08/96); Telephone Transmission Quality. Objective Measuring Apparatus: Artificial Mouth. International Telecommunication Union: Geneva, Switzerland, 1996.
- ITU-T Recommendation P.58 (05/2013); Terminals and Subjective and Objective Assessment Methods, Objective Measuring Apparatus: Head and Torso Simulator for Telephonometry. International Telecommunication Union: Geneva, Switzerland, 2013.
- Bilzi, P.; Bozzoli, F.; Farina, A. Influence of artificial mouth’s directivity in determining speech transmission index. In Proceedings of the 119th Audio Engineering Society Convention, New York, NY, USA, 7–10 October 2005. [Google Scholar]
- IEC 60268-16:2011; Sound System Equipment—Part 16: Objective Rating of Speech Intelligibility by Speech Transmission Index. International Electrotechnical Commission: Geneva, Switzerland, 2011.
- Papadakis, N.M.; Stavroulakis, G.E. Low cost omnidirectional sound source utilizing a common directional loudspeaker for impulse response measurements. Appl. Sci. 2018, 8, 1703. [Google Scholar] [CrossRef]
- Mapp, P. Simulating talker directivity for speech intelligibility measurements. In Proceedings of the 136th Audio Engineering Society Convention, Berlin, Germany, 26–29 April 2014. [Google Scholar]
- A3102_Soundcore_Manual. Available online: https://ankertechnologycompanyltd.my.salesforce.com/sfc/p/#5g000004DkWQ/a/5g000000g2Ph/59RV_pJzzRkbKvQQDXVfbQgXKdcI0tdbrsBp6QSiMvc (accessed on 19 May 2023).
- Fostex 6301N Series. Available online: https://fostexinternational.com/docs/products/6301N_Series.shtml (accessed on 19 May 2023).
- NTI Audio Talkbox. Available online: https://www.nti-audio.com/en/products/noise-sources/talkbox (accessed on 19 May 2023).
- Yamaha Manuals. Available online: https://uk.yamaha.com/en/products/contents/music_production/downloads/manuals/index.html?l=en&c=music_production&k=HS50M (accessed on 19 May 2023).
- IEC 61672:2013; Electroacoustics—Sound Level Meters—Part 1: Specifications. International Electrotechnical Commission: Geneva, Switzerland, 2013.
- ISO 3382-1:2009; Acoustics–Measurement of Room Acoustic Parameters–Part 1: Performance Spaces. International Organization for Standardization: Geneva, Switzerland, 2009.
- BS 8233:2014; Guidance on Sound Insulation and Noise Reduction for Buildings. British Standards Institution: London, UK, 2014.
- Bruel and Kaejer. Head and Torso Simulator (HATS). Available online: https://www.bksv.com/en/transducers/simulators/head-and-torso/hats-type-4128c (accessed on 19 May 2023).
- Bruel and Kaejer. Type 4227+422-A Mouth Simulator. Available online: https://www.bksv.com/en/transducers/simulators/ear-mouth-simulators/4227 (accessed on 19 May 2023).
- Bradley, J.S.; Reich, R.; Norcross, S.G. A just noticeable difference in C50 for speech. Appl. Acoust. 1999, 58, 99–108. [Google Scholar] [CrossRef]
- Bellini, M.C.; Farina, A. Loudspeakers performance variance due to components and assembly process—Field Assessment. In Proceedings of the 144th Audio Engineering Society Convention, San Francisco, CA, USA, 8–10 September 2017. [Google Scholar]
- Bellini, M.C.; Farina, A. Woofer performance variance due to components and assembly process. In Proceedings of the Audio Engineering Society Conference on Automotive Audio, Milan, Italy, 23–26 May 2018. [Google Scholar]
Disclaimer/Publisher’s Note: The statements, opinions and data contained in all publications are solely those of the individual author(s) and contributor(s) and not of MDPI and/or the editor(s). MDPI and/or the editor(s) disclaim responsibility for any injury to people or property resulting from any ideas, methods, instructions or products referred to in the content. |
© 2023 by the authors. Licensee MDPI, Basel, Switzerland. This article is an open access article distributed under the terms and conditions of the Creative Commons Attribution (CC BY) license (https://creativecommons.org/licenses/by/4.0/).