1. Introduction
Hazardous noise exposure is one of the most widespread workplace issues, having numerous negative consequences for workers. It may be responsible for physiological and psychological changes that affect the workers’ job performance, safety, and quality of life [
1,
2]. It is well-known that noise exposure may have both auditory and extra-auditory impacts on individuals. To prevent hearing loss, the Noise Directive 2003/10/EC [
3] established the exposure limits values (L
ex,8h = 87 dB(A); p
peak = 200 Pa) above which no worker may be exposed, as well as the upper exposure action values (L
ex,8h =85 dB(A); p
peak = 140 Pa) and lower exposure action values (L
ex,8h = 80 dB(A); p
peak = 112 Pa) to adopt preventive actions for the reduction of worker risks [
3,
4]. On the other hand, subjective responses to noise depend on various acoustic characteristics such as duration of noise exposure, sound pressure level, spectral shape, and short-term temporal level variation.
In the past several, studies have been conducted on the effects of different types of noise on human wellbeing, performance, and annoyance. Schäffer et al. [
5] investigated the impact of some acoustic characteristics of broadband noise on short-term annoyance and found that an increase of energy content in the low-frequency range and depth of periodic amplitude modulation led to an increase in annoyance. Similar annoyance changes would be evoked by sound pressure level changes of up to 8 dB. Pawlaczyk-Luszczynska et al. [
6] investigated whether exposure to low-frequency noise at about 50 dB(A) could negatively affect human mental performances and impair work. They found that low-frequency noise negatively affects tasks requiring perceptual skills and concentration, and tasks requiring visual differentiation and selective or continuous attention. Prashanth and Sridhar [
7] investigated the relationship between frequency components of noise and psychophysiological effects in 93 workers of six major industries in Mysore (India). They were continuously exposed to noise with dominant components in the octave bands with low and medium center frequencies. Among the most evident psychological symptoms, they found that irritability was highly associated with these noises.
Similarly, Fletcher et al. [
8] investigated the association between adverse symptoms and the exposure to very high-frequency sound/ultrasound (VHFS/US). A pure tone was set to reach the hearing threshold level of 63 dB SPL, and then the participants were subjected to VHFS/US (at frequencies ranging from 13.5 to 20 kHz and sound pressure levels ranging from 82 to 92 dB) and a 1 kHz reference stimulus, both at 25 dB above their hearing threshold. The results showed that the overall subjecting ratings of discomfort are higher in VHFS/US than in the reference condition. In contrast, no difference was observed between the two audio conditions regarding the performance on the attention task or electrodermal activity. Abbasi et al. [
9] investigated the physiological and mental effects caused by exposure to low-frequency noise (at 55, 65, 70, and 75 dBA) by assessing Heart Rate (HR), brain electrical activity and working memory. Thirty-five male students from Hamadan University of Medical Sciences participated in the study. The results showed that mental performances were reduced at high sound pressure levels of low-frequency noise. At the same time, heart rate increased with increasing sound pressure levels, showing a significant difference in the number of heartbeats from baseline under different audio conditions.
The specific changes in the autonomic nervous system caused by physical or psychological threats can be assessed measuring the heart rate variability (HRV), the electrodermal activity (EDA), and pupillometry. Wearable biosensors can be used for basic research, clinical applications, or during daily routines in real-life situations and are able to monitor, acquire and evaluate physiological responses to stressors in real-time [
10]. Generally, heart rate measurements are preferred to have a more comprehensive picture of sympathetic and parasympathetic activity, whereas electrodermal activity measurements provide a more direct representation of sympathetic activation. Moreover, the changes in electrodermal activity can be easily correlated to a specific stimulus, while the variability of heart rate can also reflect changes in muscle tonus or respiratory sinus arrhythmia [
11].
EDA and HRV measurements have been used to assess different types of threats and psychological or environmental stressors.
Christopoulos et al. [
12] investigated EDA measurements methods used to assess emotions, cognitive aspects, adaptive decision-making, fear conditioning and other specific mechanisms. Eisenbarth et al. [
13] investigated the brain bases of HR and EDA responses during social threat, discovering that social threat results in multiple autonomic responses in different body systems rather than a unitary autonomic response. Ahmed et al. [
14] used EDA measurements to study the user’s emotional states during a competitive virtual reality game, finding that the user EDA was higher when the adversaries were angry, while no evidence was shown for HRV. Dawson et al. [
15] examined EDA monitoring to investigate the roles of conscious and non-conscious cognitive processes in the gambling task. They concluded that EDA could be predictive of negative outcomes.
Park et al. [
16] studied the HR and EDA changes from floor impact noises and road traffic noises for the low and high noise sensitivity subject groups, finding for EDA strong habituation over time after 30 s of noise exposure. Conversely, more recently Shu and Ma [
17] analyzed the HRV and EDA changes during exposure to several urban park soundscapes after having had a preliminary stressful task. Results of their work indicate a significant stress reduction of the participants was observable by the decrease in the EDA, while heart rate did not significantly change. Alvarsson et al. [
18] demonstrated how the EDA recovery after a stressful mental arithmetic task differs depending on the type of noise exposure. They specifically looked at the effects on EDA recovery time of a natural sound of 50 dB(A), a road traffic noise of 80 dB(A) and 50 dB(A), and the ambient noise of a quiet backyard at 40 dB(A) compared to the initial baseline. Compared to the other sounds, they discovered that the natural sound was rated as the most pleasant and allowed for faster stress recovery. At 80 dB(A), road traffic noise was rated as the least pleasant and most eventful sound, and it allowed the slowest stress recovery. Although the previous research was limited to specific natural and urban sound stimuli, their findings suggest how different noise characteristics may affect individuals’ physiological responses. In the case of an industrial environment, where noise can have a potential negative impact on workers’ wellbeing and cognitive functions, resulting in hearing loss, increased irritability, fatigue, and stress, as well as a reduction in performance, errors, and the potential for an increase in accidents, the EDA and HRV responses may be used to understand how various type of noise may moderate different stressor level. Then, in this study, we decided to investigate if and how different types of industrial noise (low frequency, high frequency, and modulated noise) at different sound pressure levels may affect the changes in electrodermal activity (EDA) and HRV.
2. Materials and Methods
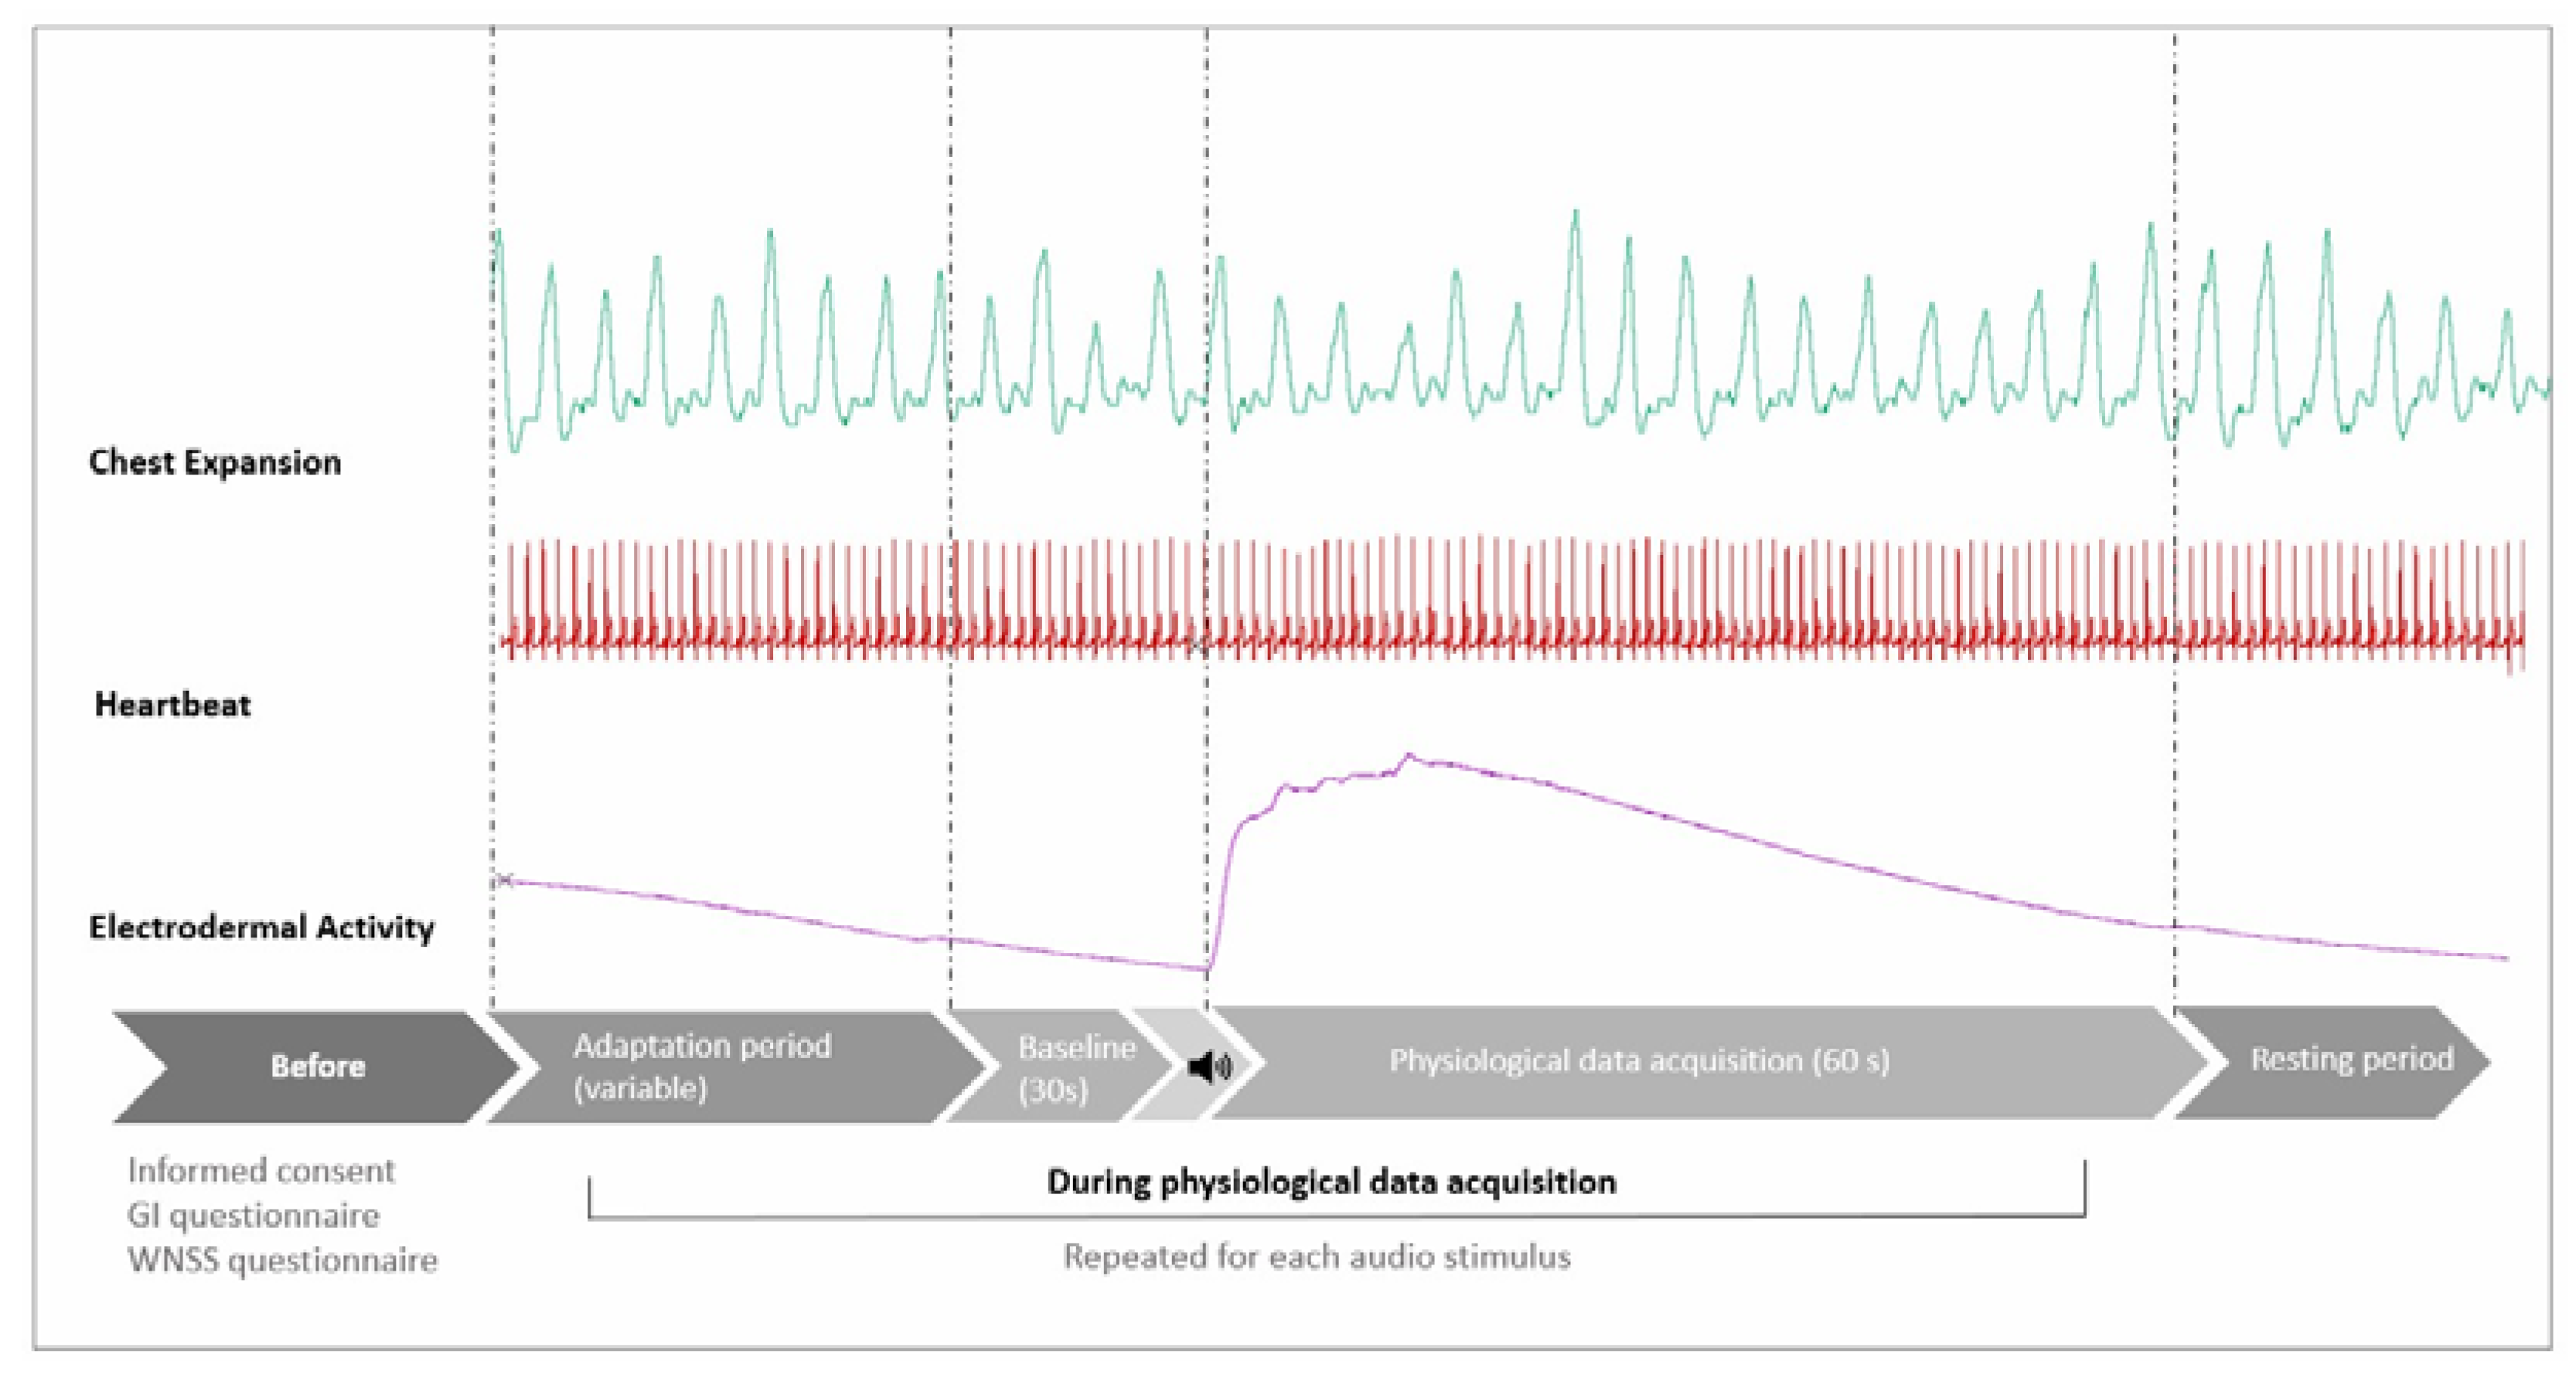
A 3 × 3 factorial design combining three different common industrial noise: Low-frequency (LF), High-frequency (HF) and Modulated (MOD), at three equivalent sound levels: Low Level (LL), Medium Level (ML) and High Level (HL), were prepared. The audio stimuli were organized according to a Latin Square Balanced Sequence. Twelve audio protocols were created in Audacity and administered in a laboratory listening test. Heartbeat, chest expansion, and electrodermal activity were recorded during all the listening sessions. After acquiring an initial 30 s baseline of the signals, the playback of the 60 s audio stimulus started. The time between each audio stimulus was variable. After each stimulus and before playing back the next audio stimulus, the experimenter allowed the subject to rest, waiting for the EDA to return stable again at the new baseline (
Figure 1).
For the electrodermal activity measurement, we focused on EDA reactivity, defined as the level of the EDA change from its baseline [
19], without breaking it down into its components: skin conductance level (SCL) and skin conductance response (SCR). Due to the sensitivity of the electrodermal activity signal to possible artefacts (e.g. body movements, respiration) in the case of each of the participants, we decided to limit the analysis of the percentage variation (%) of EDA between the phase under the stimulus and the baseline to 60 s of the acquired signals. The chest expansion was used to detect possible respiratory artefacts by inspection of electrodermal activity and respiratory curves, as shown by Bouchsein in [
20].
Since the best option for electrodermal activity was to consider short data acquisitions, similarly, for heart rate variability, the measurements were focused on ultra-short-term RR interval. As reported in the literature, ultra-short-term measurements (t < 5 min) [
21,
22] can be considered as good surrogates for short-term HRV measurements (5 min < t < 24 h), which best reflect the complex interaction between the sympathetic and parasympathetic branches [
23]. Consequently, we decided to exclude the index LF/HF ratio, which represents the cardiac sympatho-vagal balance, for which recordings of at least 5 min are needed.
2.1. Material
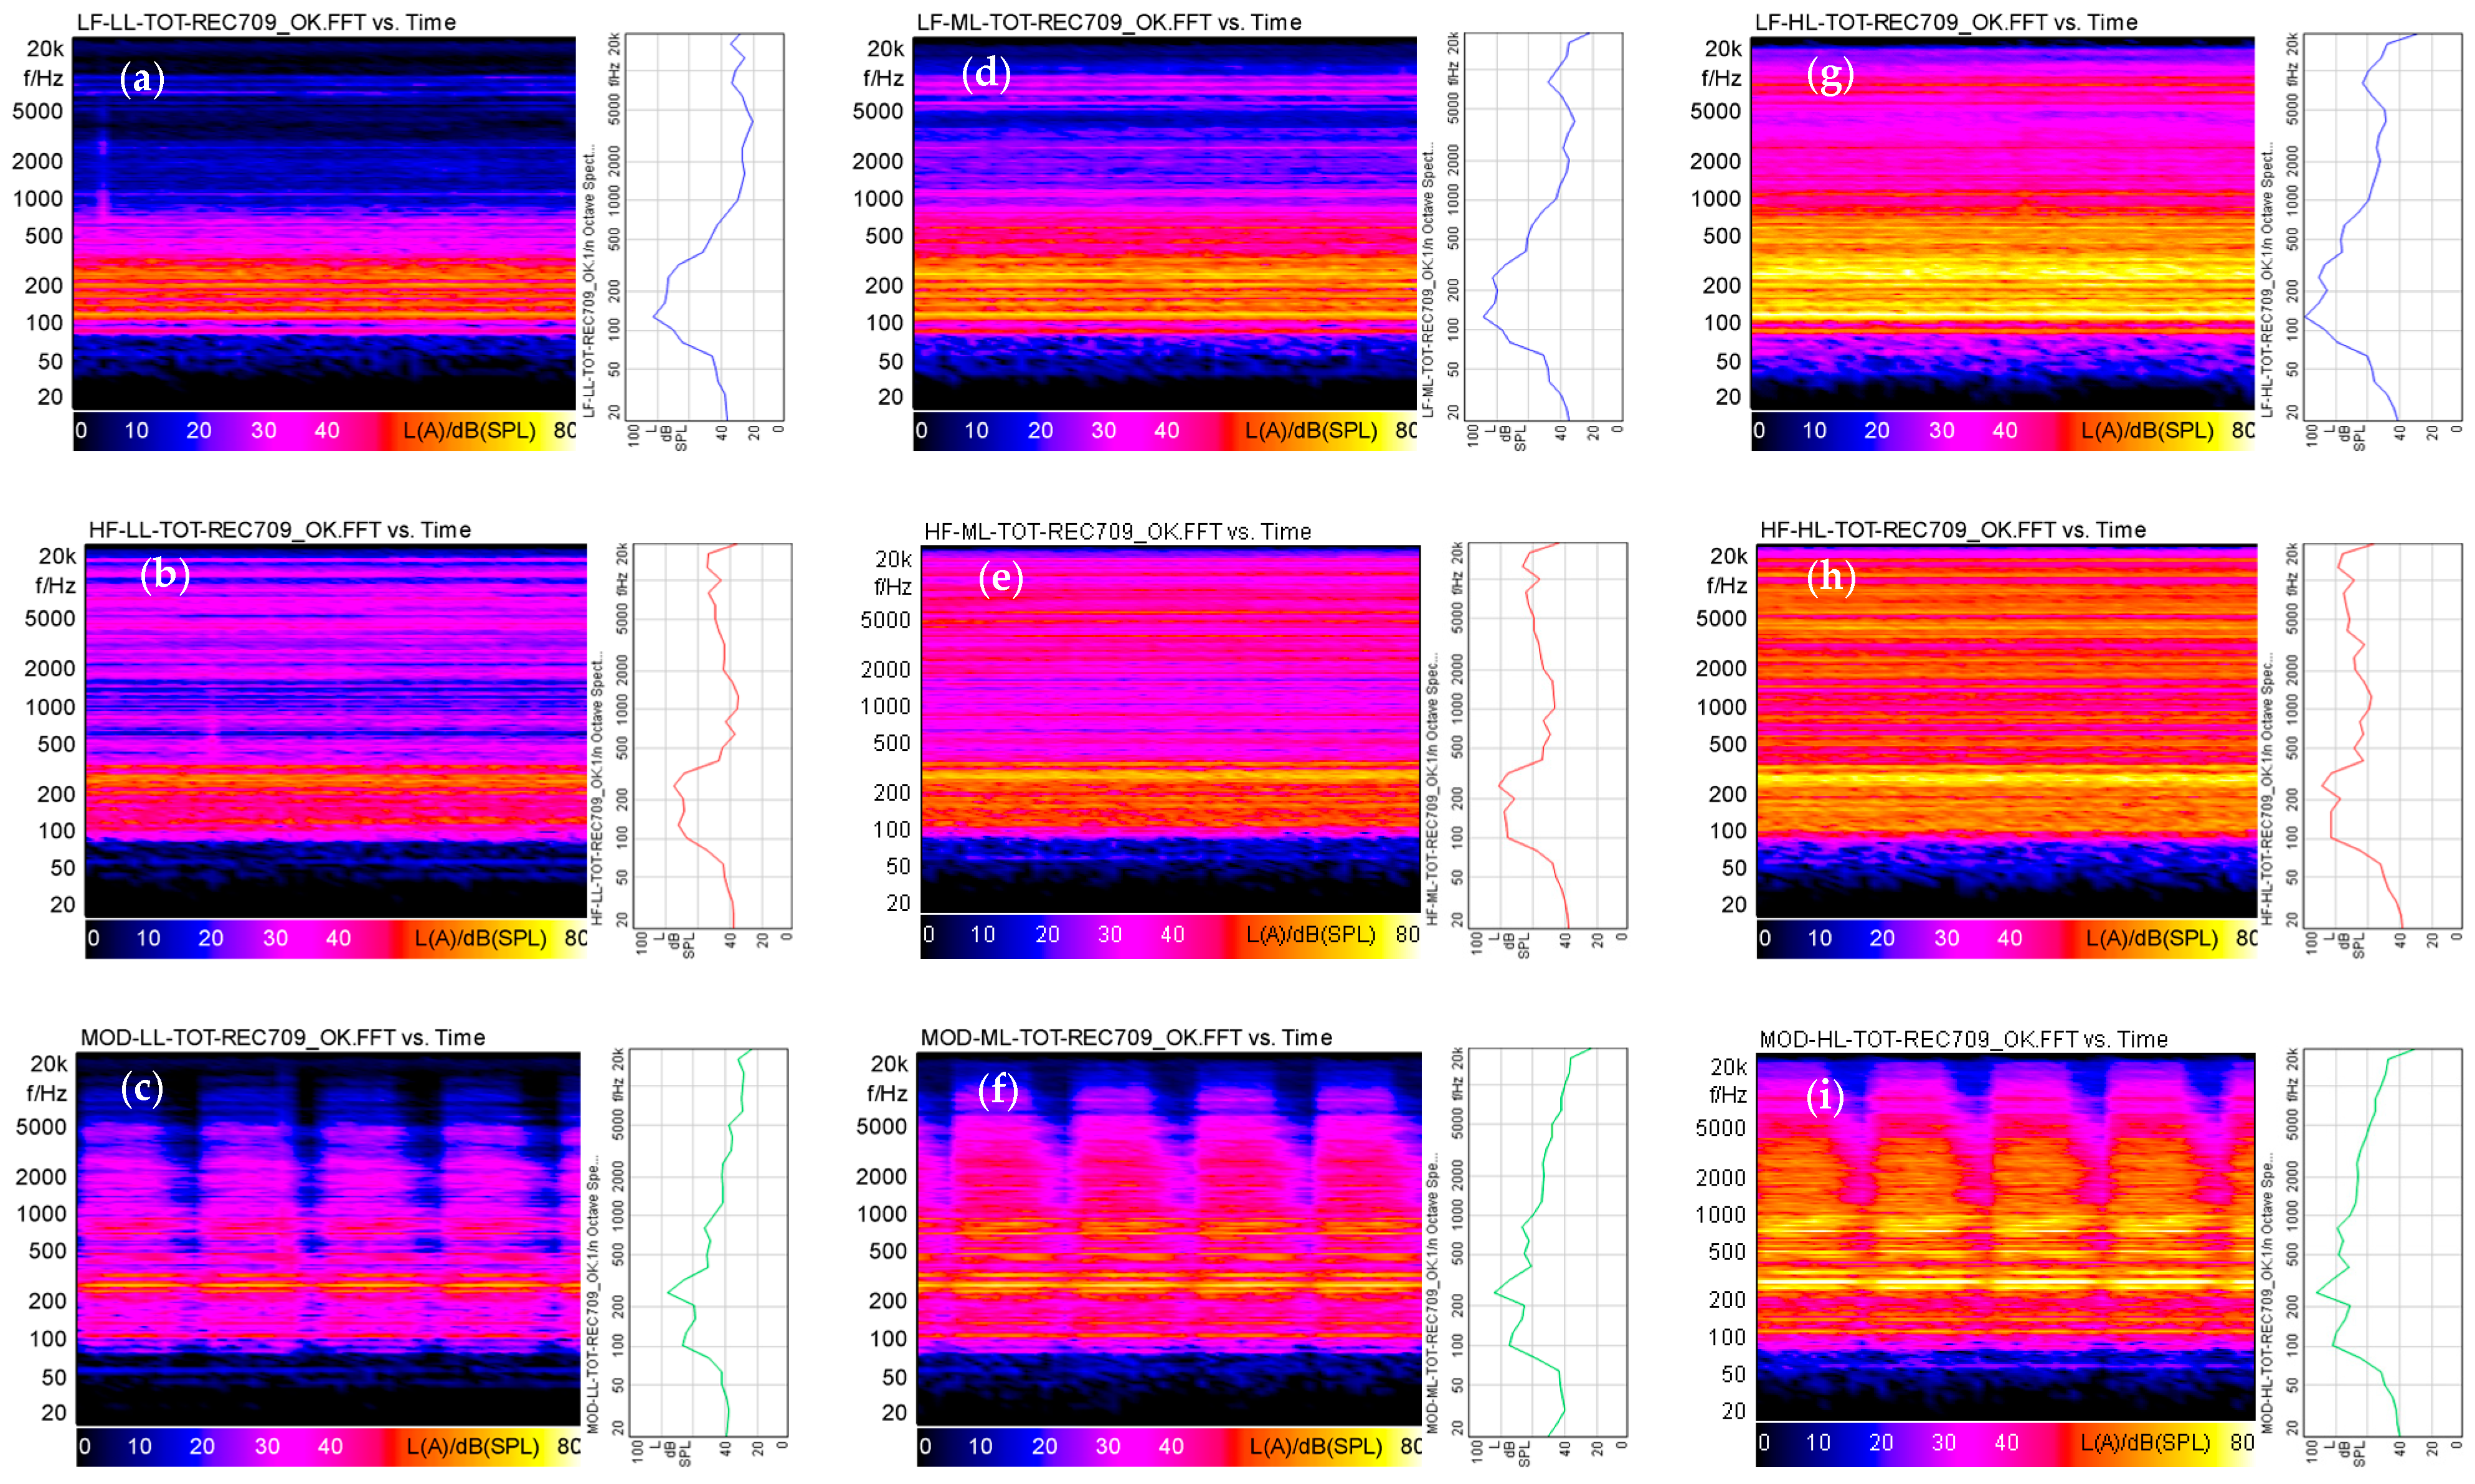
The three audio stimuli which were selected represent: (1) the noise of a big heating unit with low-frequency content (LF); (2) an industrial noise with high-frequency whistle content (HF); and (3) a deep roaring alarm siren (MOD). Each soundtrack was set to approximately the following A-weighted equivalent sound pressure levels: 70 dB(A) (Low Level, LL), 78 dB(A) (Medium Level, ML), and 87 dB(A) (High Level, ML) (High Level, HL). The standard deviation among the conditions was less than 1.5 dB. Each soundtrack was further characterized acoustically in terms of linear or A-weighted sound equivalent levels (L, L(A)) and of the average values and some percentiles of the main psychoacoustics indices: Loudness (N), Sharpness (S), Roughness (R), Fluctuation Strength (F), and Tonality (T) (
Figure 2;
Table 1).
2.2. Participants
A General Information questionnaire and the Weinstein Noise Sensitivity Scale questionnaire (WNSS) [
24,
25,
26] were used to describe participants’ socio-demographic characteristics (Sex, Age, Qualification) and involve participants with similar noise sensitivity. A third 9-point Likert scale questionnaire was also prepared to have the participants rate how they perceived each noise at different conditions. It consisted of 8 items assessing the main dimension of the Axelsson model [
27]: Pleasantness, Unpleasantness, Eventfulness, Uneventfulness, Interesting, Boring, Chaotic and Calm, plus two items which investigated the perceived Annoyance and Loudness.
This study involved 24 subjects (15 males and 9 females) aged between 24–42 years (Mean = 30.4; st. dev. = 4.9) selected among personnel and students of the Department of Architecture and Industrial Design. Subjects with heart disease or other significant medical conditions (e.g., diabetes), defibrillator or pacemaker implants, or skin irritations or lesions in the sites where the Equivital belt was applied were excluded. Subjects with specific hearing issues were also excluded based on self-reported status.
In addition, before getting involved in the study, subjects were asked to complete the Weinstein Noise Sensitivity Scale questionnaire. For the study, participants with similar noise sensitivity were selected. In contrast, subjects with very low or high noise sensitivity were excluded. Participants in the study had a mean noise sensitivity value of 3.8 (st. dev. = 0.59).
The day before the experiment, subjects were asked to avoid staying up late and not to drink alcohol or other caffeinated beverages. On the day of the experiment, participants were asked to not smoke. Before starting the test, the subjects were also asked to read and sign the informed consent documents concerning the data processing, the use of the Equivital Belt to monitor physiological parameters, and the rules for access to the laboratory due to the COVID-19 pandemic situation.
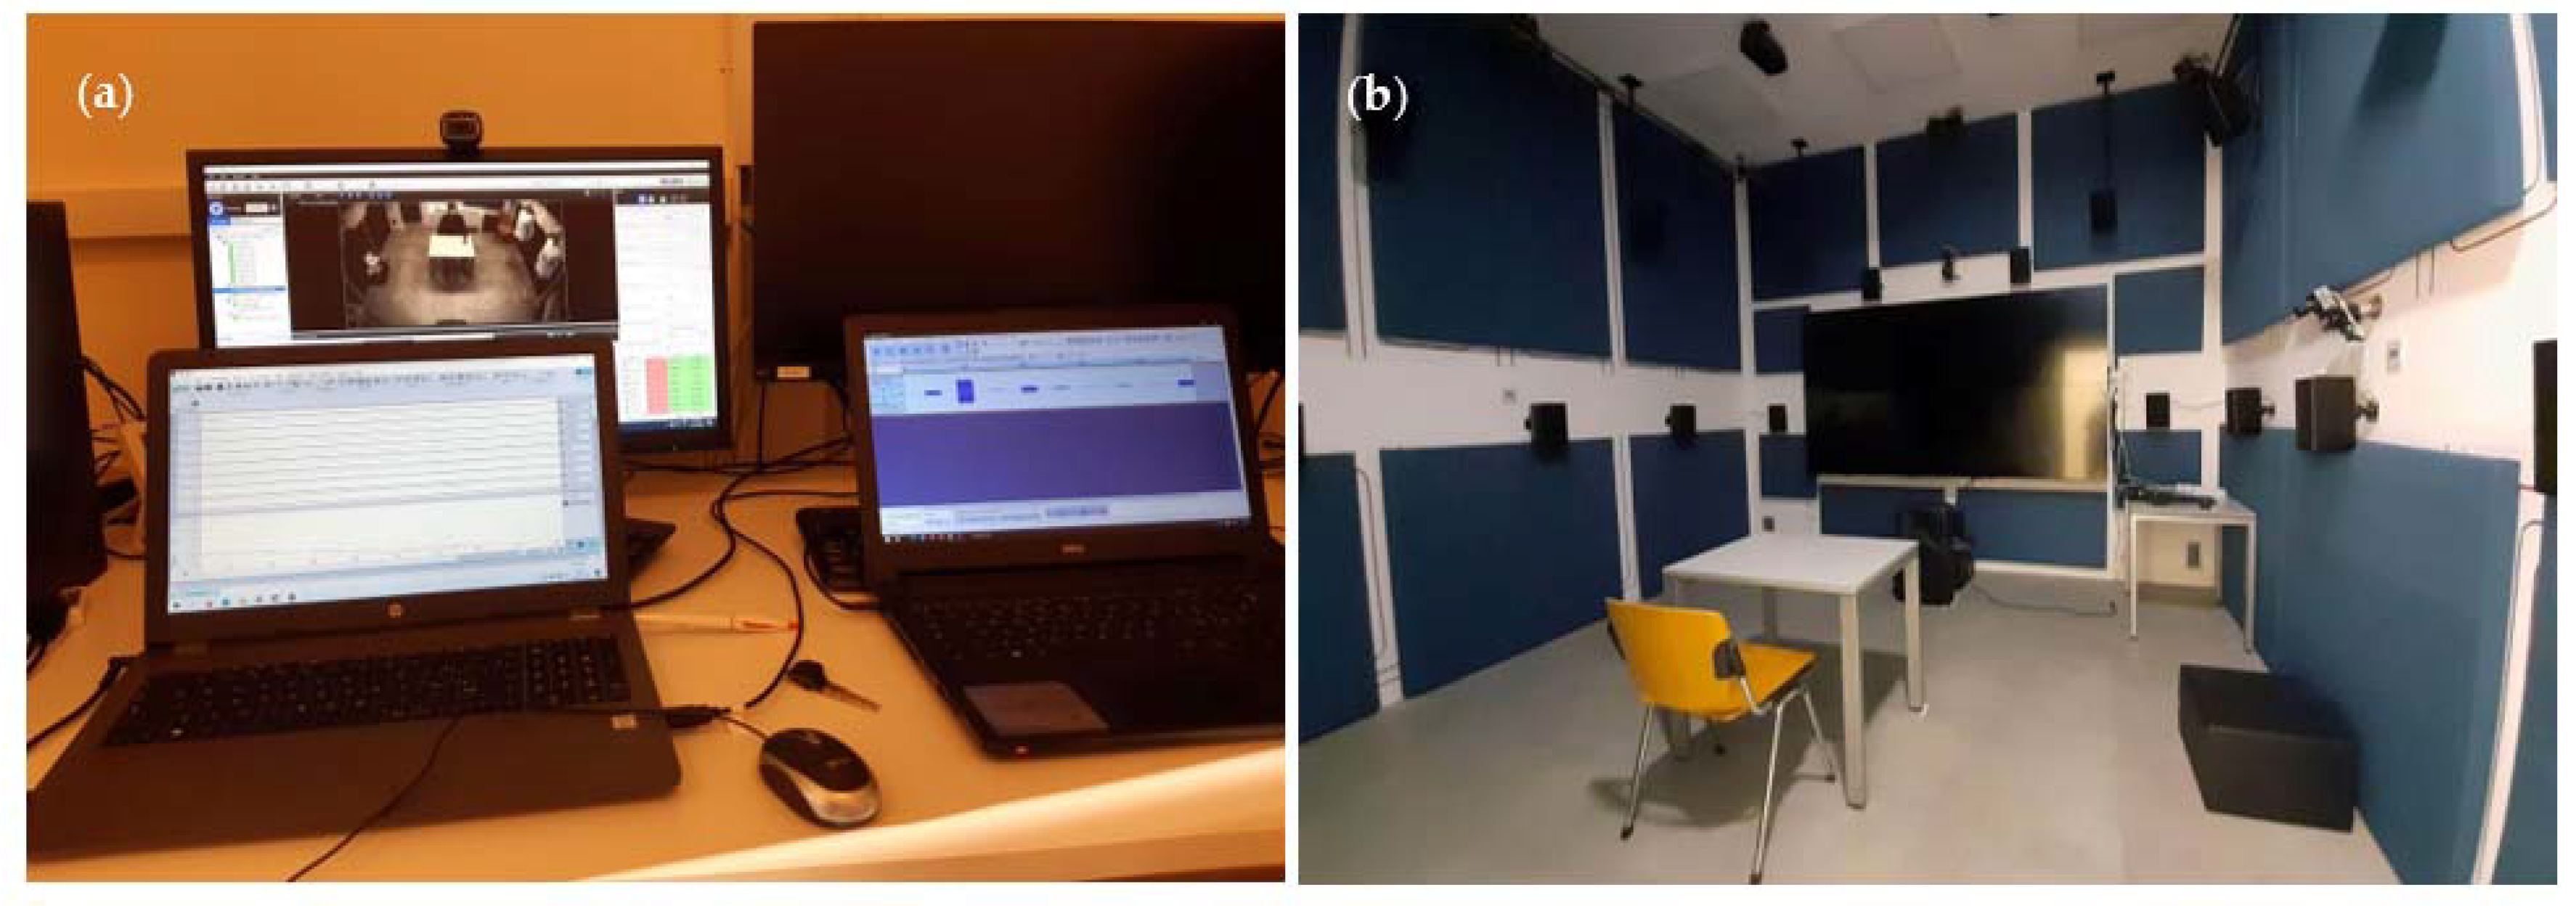
2.3. Test Room
The experiment was conducted in the SENS i-Lab of the Department of Architecture and Industrial Design of the Università degli Studi della Campania “Luigi Vanvitelli”. The test room is about 4 m × 4 m × 4 m and allows for the reproduction and monitoring of human interactions with most physical and environmental stimuli. A listening position was set up by placing a desk and a chair at the centre of the room and a loudspeaker (Opera MK2) in front of the listening position. The audio reproduction system was calibrated using an Mk1-Cortex mannequin, a Symphonie card 01 dB and a laptop. The test room temperature was set at 23 ± 1 °C, with relative humidity at 40 ± 5%.
Physiological signals were recorded by the EquivitalTM monitoring system, which consists of a Sensor Electronics Module (SEM) device, belts of various sizes and an ancillary device that allows through LabChart 8 software the acquisition of the data related to the Electrodermal Activity (EDA), Heart Rate Variability (HRV), and Chest Expansion. The SEM was configured using the Equivital Manager Software, selecting the clinical mode for heart rate and the frequency of 16 Hz for EDA data acquisition.
Before administering the test, the experimental procedure was explained to the subjects and any doubts clarified. Then, the Equivital Belt of the correct size was given to the subject. The experimenter explained how to wear it correctly. After putting on the belt, the Ag/AgCl pre-gelled electrodes (36 mm × 45 mm) were placed on the index and middle fingers of the subject’s left hand 15–20 min before starting the experiment, allowing the skin–electrolyte interface to stabilize. The electrodes and their wires were fixed to provide continual skin-to-electrolyte contact and to prevent artefacts caused by the wires being tugged. Then, the SEM device was connected, and the correct functioning of the Equivital Belt was checked.
Moreover, before starting the experiment, subjects were instructed to lay the left hand with the electrodes in a resting position with the palm up or down to avoid frequent and/or deep breaths and any kind of movement. After that, the experimenter left the subject alone in the experimental room. The audio playback system was started via a PC positioned outside the test room, and at the same time, the acquisition of physiological parameters was started. The experiment was monitored the entire time via the cameras (lateral view/top view) installed in the testing room, allowing the experimenter to add comments onto the EDA curve (e.g., start and end of the audio stimuli, events that can cause possible artefacts in the data collection) (
Figure 3). The subjective evaluation of the nine audio stimuli was performed at the end of the acquisition of the physiological parameters by asking the subjects to listen to the audio tracks again and fill in the noise perception questionnaire.
3. Results
RR intervals and EDA were analyzed using LabChart 8 software for each of the three levels of the factor NOISE (LF, HF and MOD) and the factor SPL (LL, ML and HL). The data were averaged in six 10 s intervals (0–10; 10–20; 20–30; 30–40; 40–50; 50–60). The percentage variation (%) from the baseline values before the audio stimulus was then calculated.
A Two-Way Repeated Measures Analysis of Variance (ANOVA) was carried out separately on EDA and the RR-interval variation to verify how the NOISE and SPL factors affect human physiological responses. An additional Repeated Measures ANOVAs to analyze the NOISE and SPL effects during the TIME has also been performed. All analyses were carried out using the software OriginPro 2021 (v.9.8.0.200, Northampton, MA, USA).
Two further analyses were carried out: a correlation analysis among the physiological measurements, the psychoacoustics metrics and the subjective rating, and a Principal Component Analysis, to identify the most important perceptual dimension characterizing the different industrial noises and their correlations with the EDA and RR-interval variation.
3.1. Analysis of Variance for EDA and RR Interval Variation
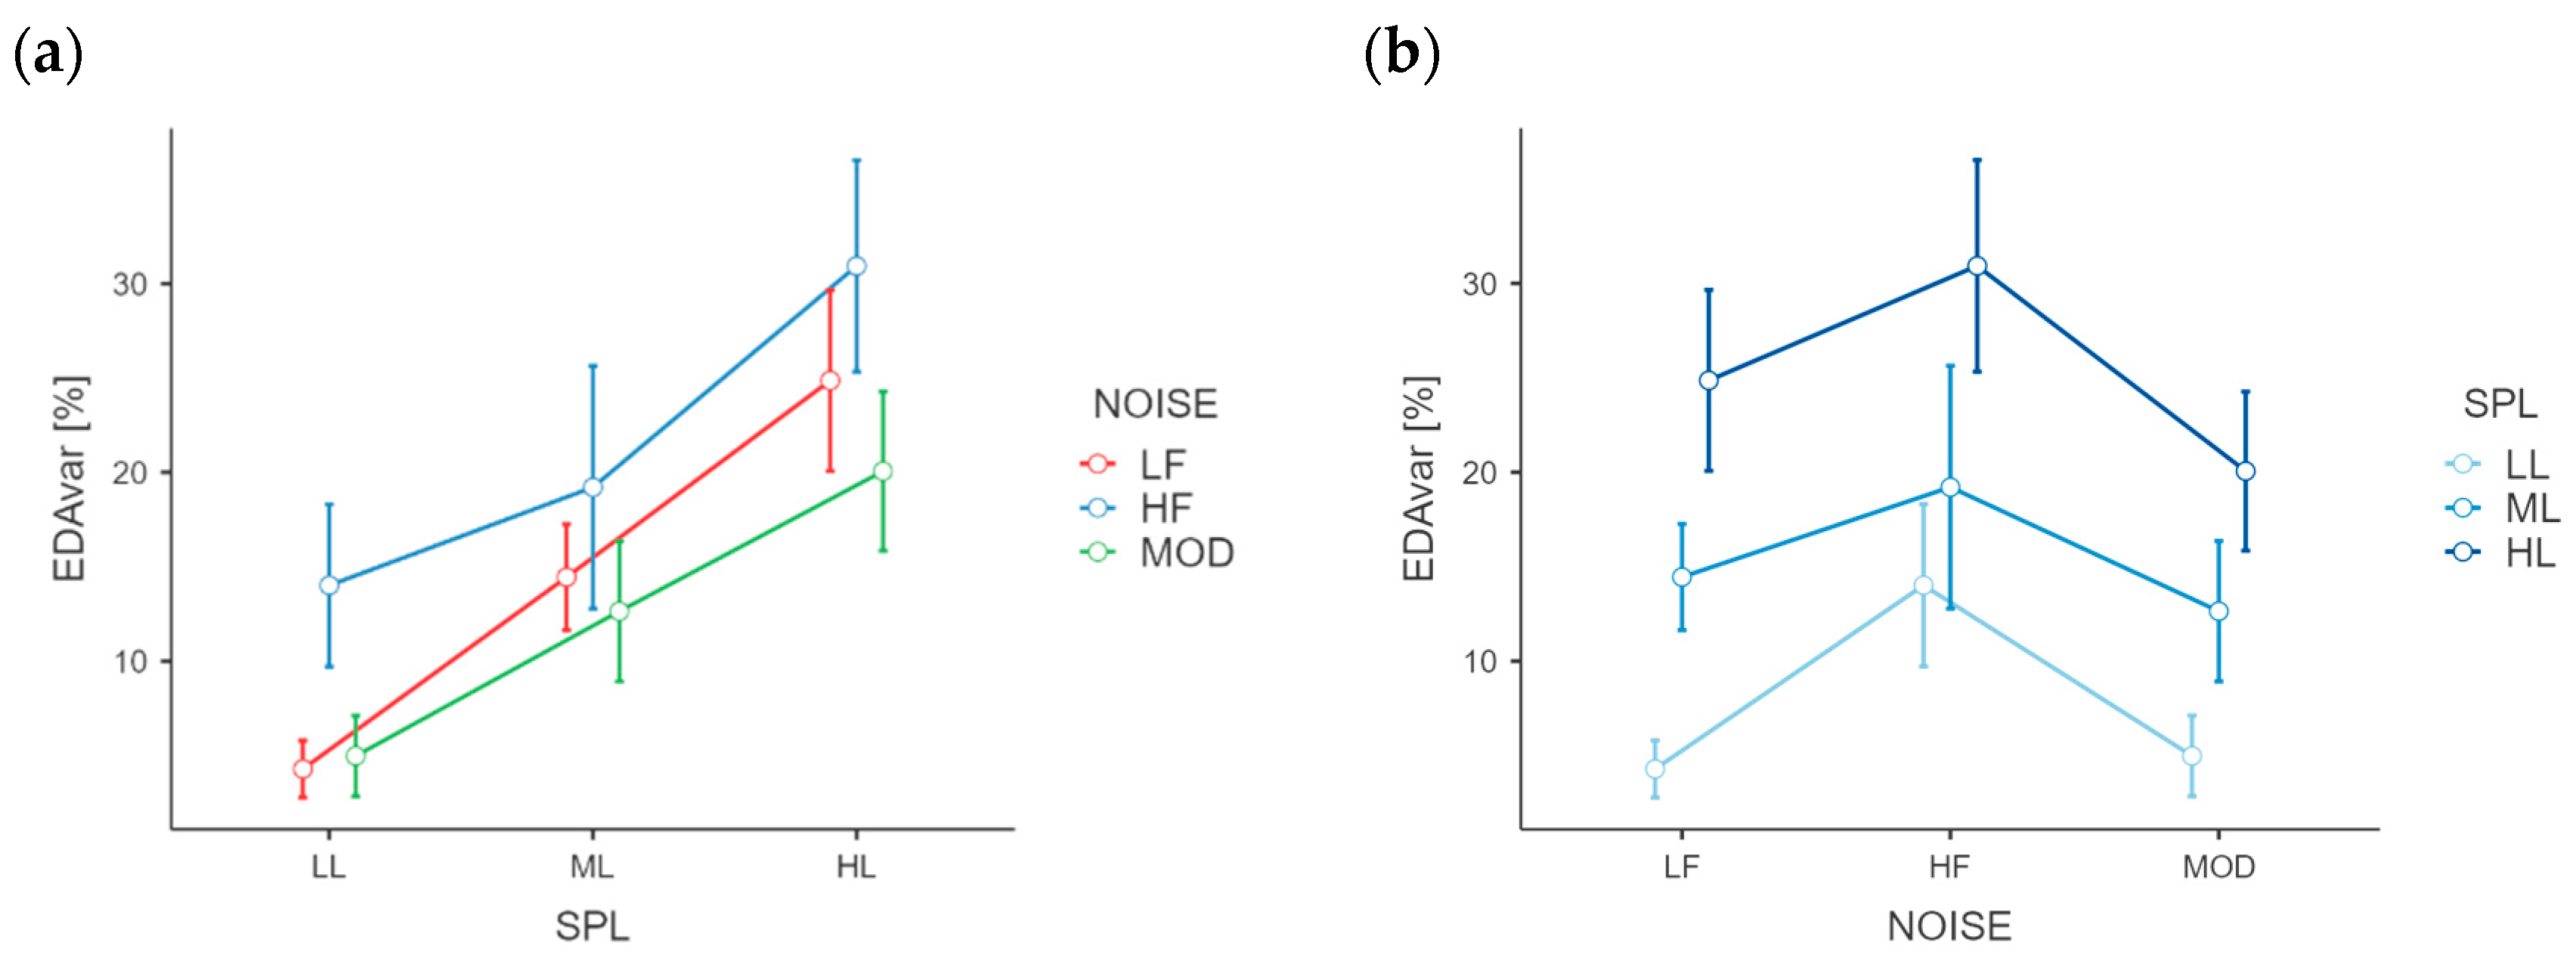
EDA variation revealed the significant main effects of the types of NOISE, F(2, 46)= 3.544,
p < 0.05, ƞ
p2= 0.134) and SPLs, F(2, 46)= 16.436,
p < 0.001, ƞ
p2 = 0.417) (
Figure 4). The interactions NOISE*SPL showed no significant differences. Regarding the main effect of NOISE, the Holm-Bonferroni post hoc test revealed that the percentage variation was higher for HF noise (M
HF = 21.39) than LF (M
LF = 14.53) and MOD (M
MOD = 12.56). The same post hoc test, on SPL, revealed that the percentage variation increases as the SPL increases (M
70 = 7.76; M
80 = 15.43; M
90 = 25.28).
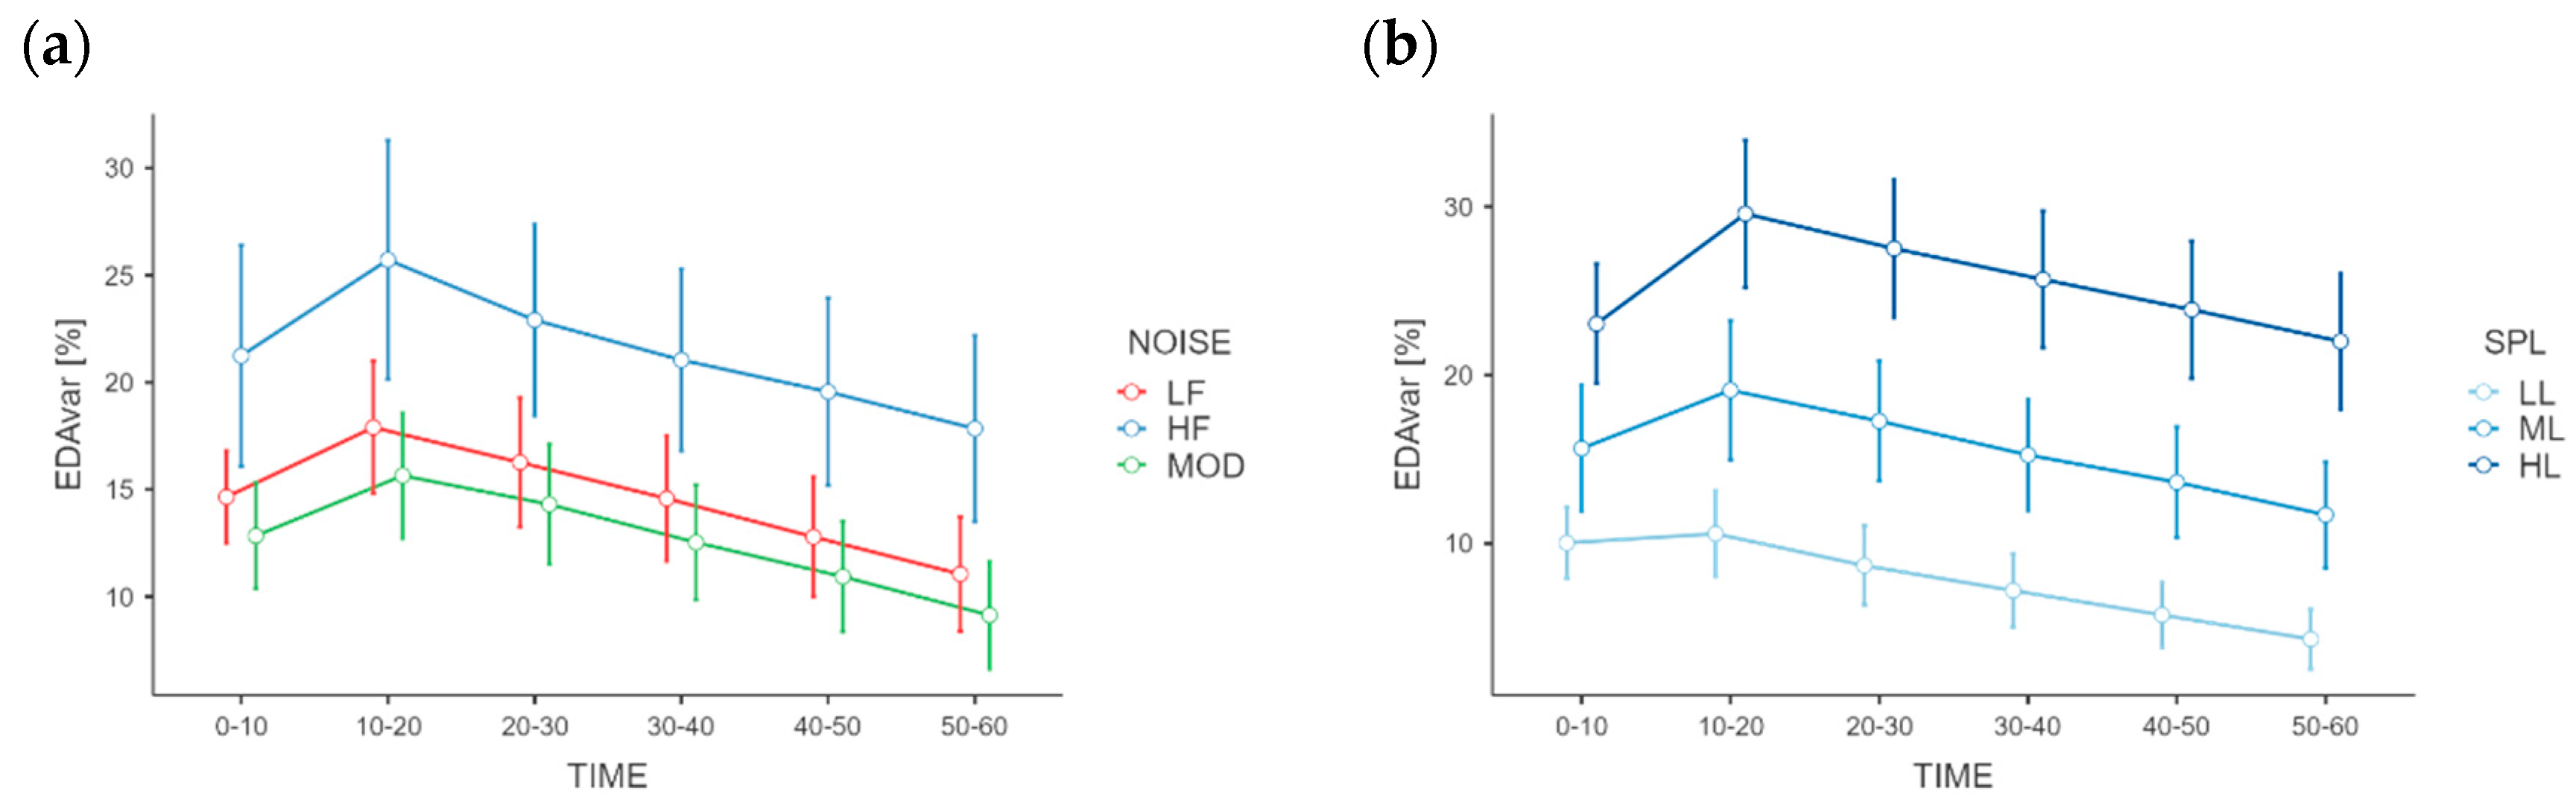
The EDA variation produced significantly different results for the TIME factor as well, F(5, 115)= 6.3646,
p < 0.001, ƞ
p2 = 0.217), while the interactions NOISE*TIME and SPL*TIME showed no significant differences (
Figure 5). Regarding the TIME main effect, the Holm–Bonferroni post hoc test revealed that the percentage variation was highest at the interval 10–20 s after the noise activation (M
10–20 = 19.75) and decreased as the time increased (M
20–30 = 17.82; M
30–40 = 16.05; M
40–50 = 14.42; M
50–60 = 12.67). The RR-interval percentage variations differed not significantly among NOISE and SPL conditions, nor for the TIME factor.
3.2. Correlation Analysis Results
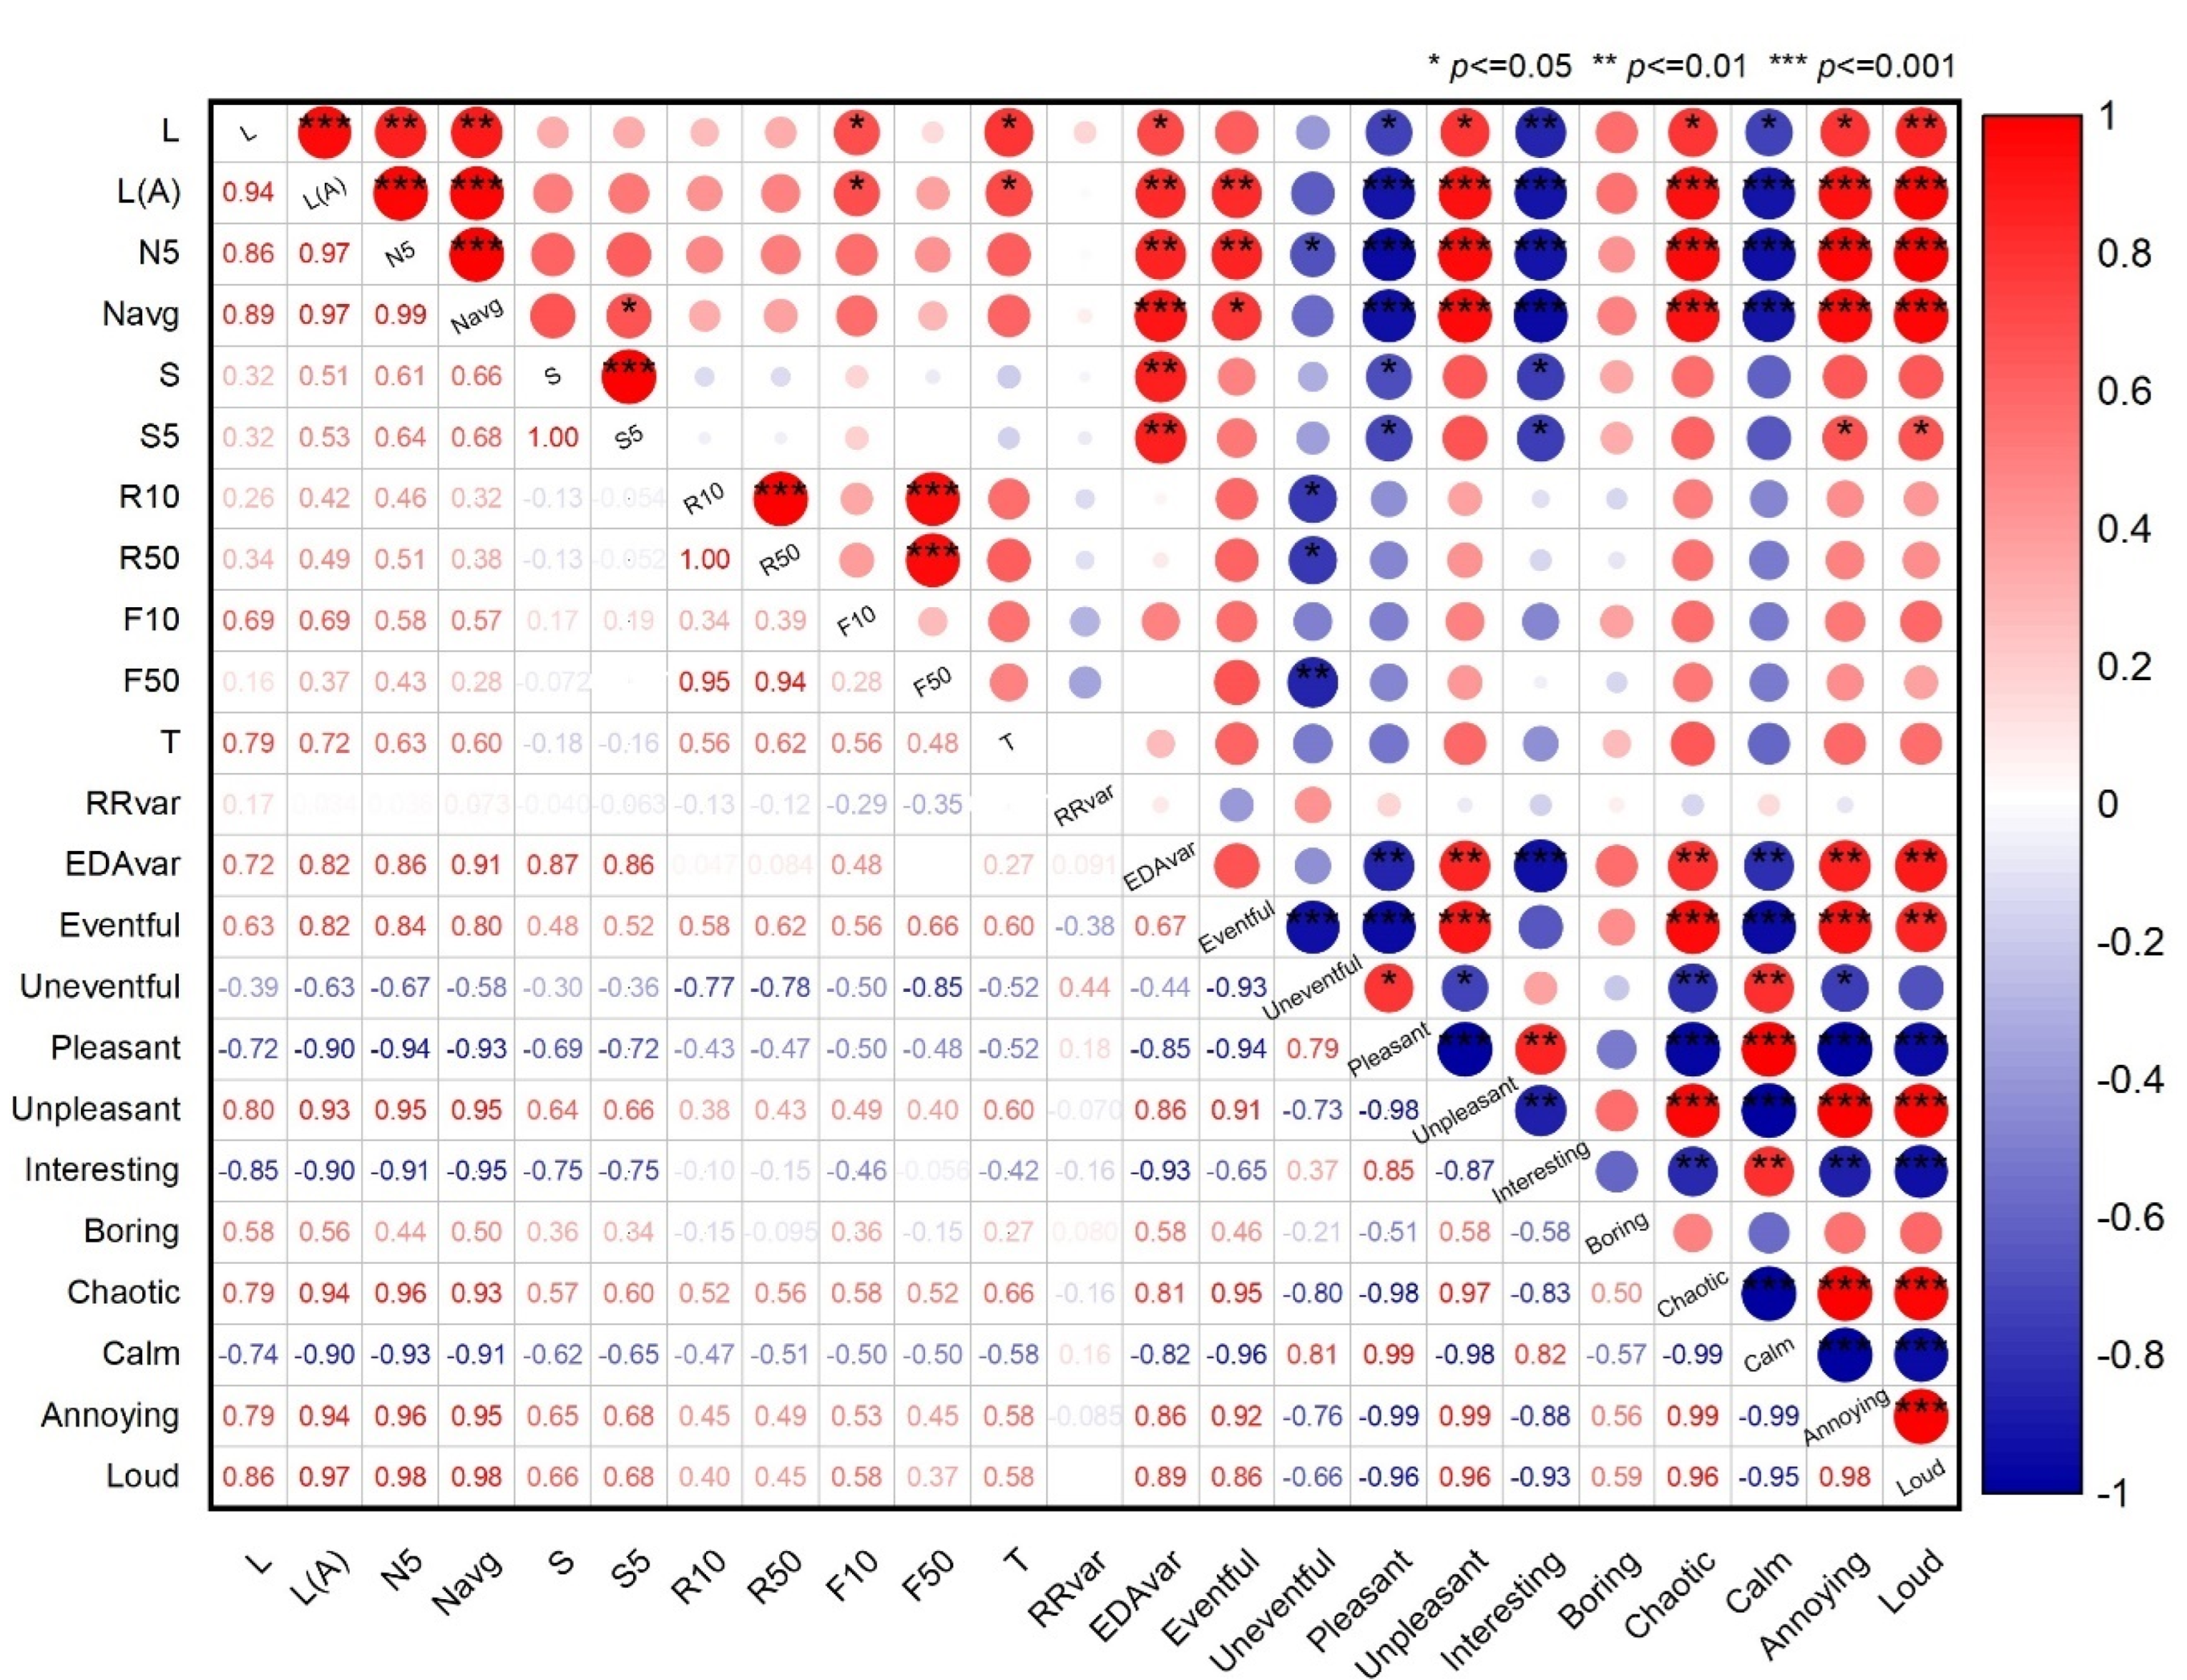
The Pearson correlations between the average values obtained from the subjective rating, psychoacoustics metrics and the physiological measure of EDA and RR interval variation at the nine conditions are shown in the correlation matrix of
Figure 6. The matrix shows the correlations coefficients existing among the aforementioned variables in the lower triangle, and the significance level, if existing, in the upper triangle.
The results of the correlation matrix show that, for the EDA variation significative positive correlations exist with the some negative judgment of noise: Unpleasant (r = 0.86, p < 0.05), Chaotic (r = 0.81, p < 0.05), Annoying (r = 0.86, p < 0.05) and Loud (r = 0.89, p < 0.05), while significative negative correlations exist with some positive judgment of noise: Pleasantness (r = −0.85, p < 0.01), Interesting (r = −0.93, p < 0.001) and Calm (r = −0.82, p < 0.01). No significant correlations emerged for RR interval.
At the same time
Figure 6 shows that EDA variation has positive correlations with the sound level, L (r = 0.72,
p < 0.05), the A-weighted sound level, L
A (r = 0.82,
p < 0.01), the 5th percentile loudness, N
5 (r = 0.86,
p < 0.01), the average Loudness, N
avg (r = 0.91,
p < 0.001), and with the 5th percentile, S
5 (r = 0.87,
p < 0.01) and average S (r = 0.86,
p < 0.01), Sharpness levels. Also in this case, no significant correlations emerged for RR interval.
3.3. Principal Component Analyses Results
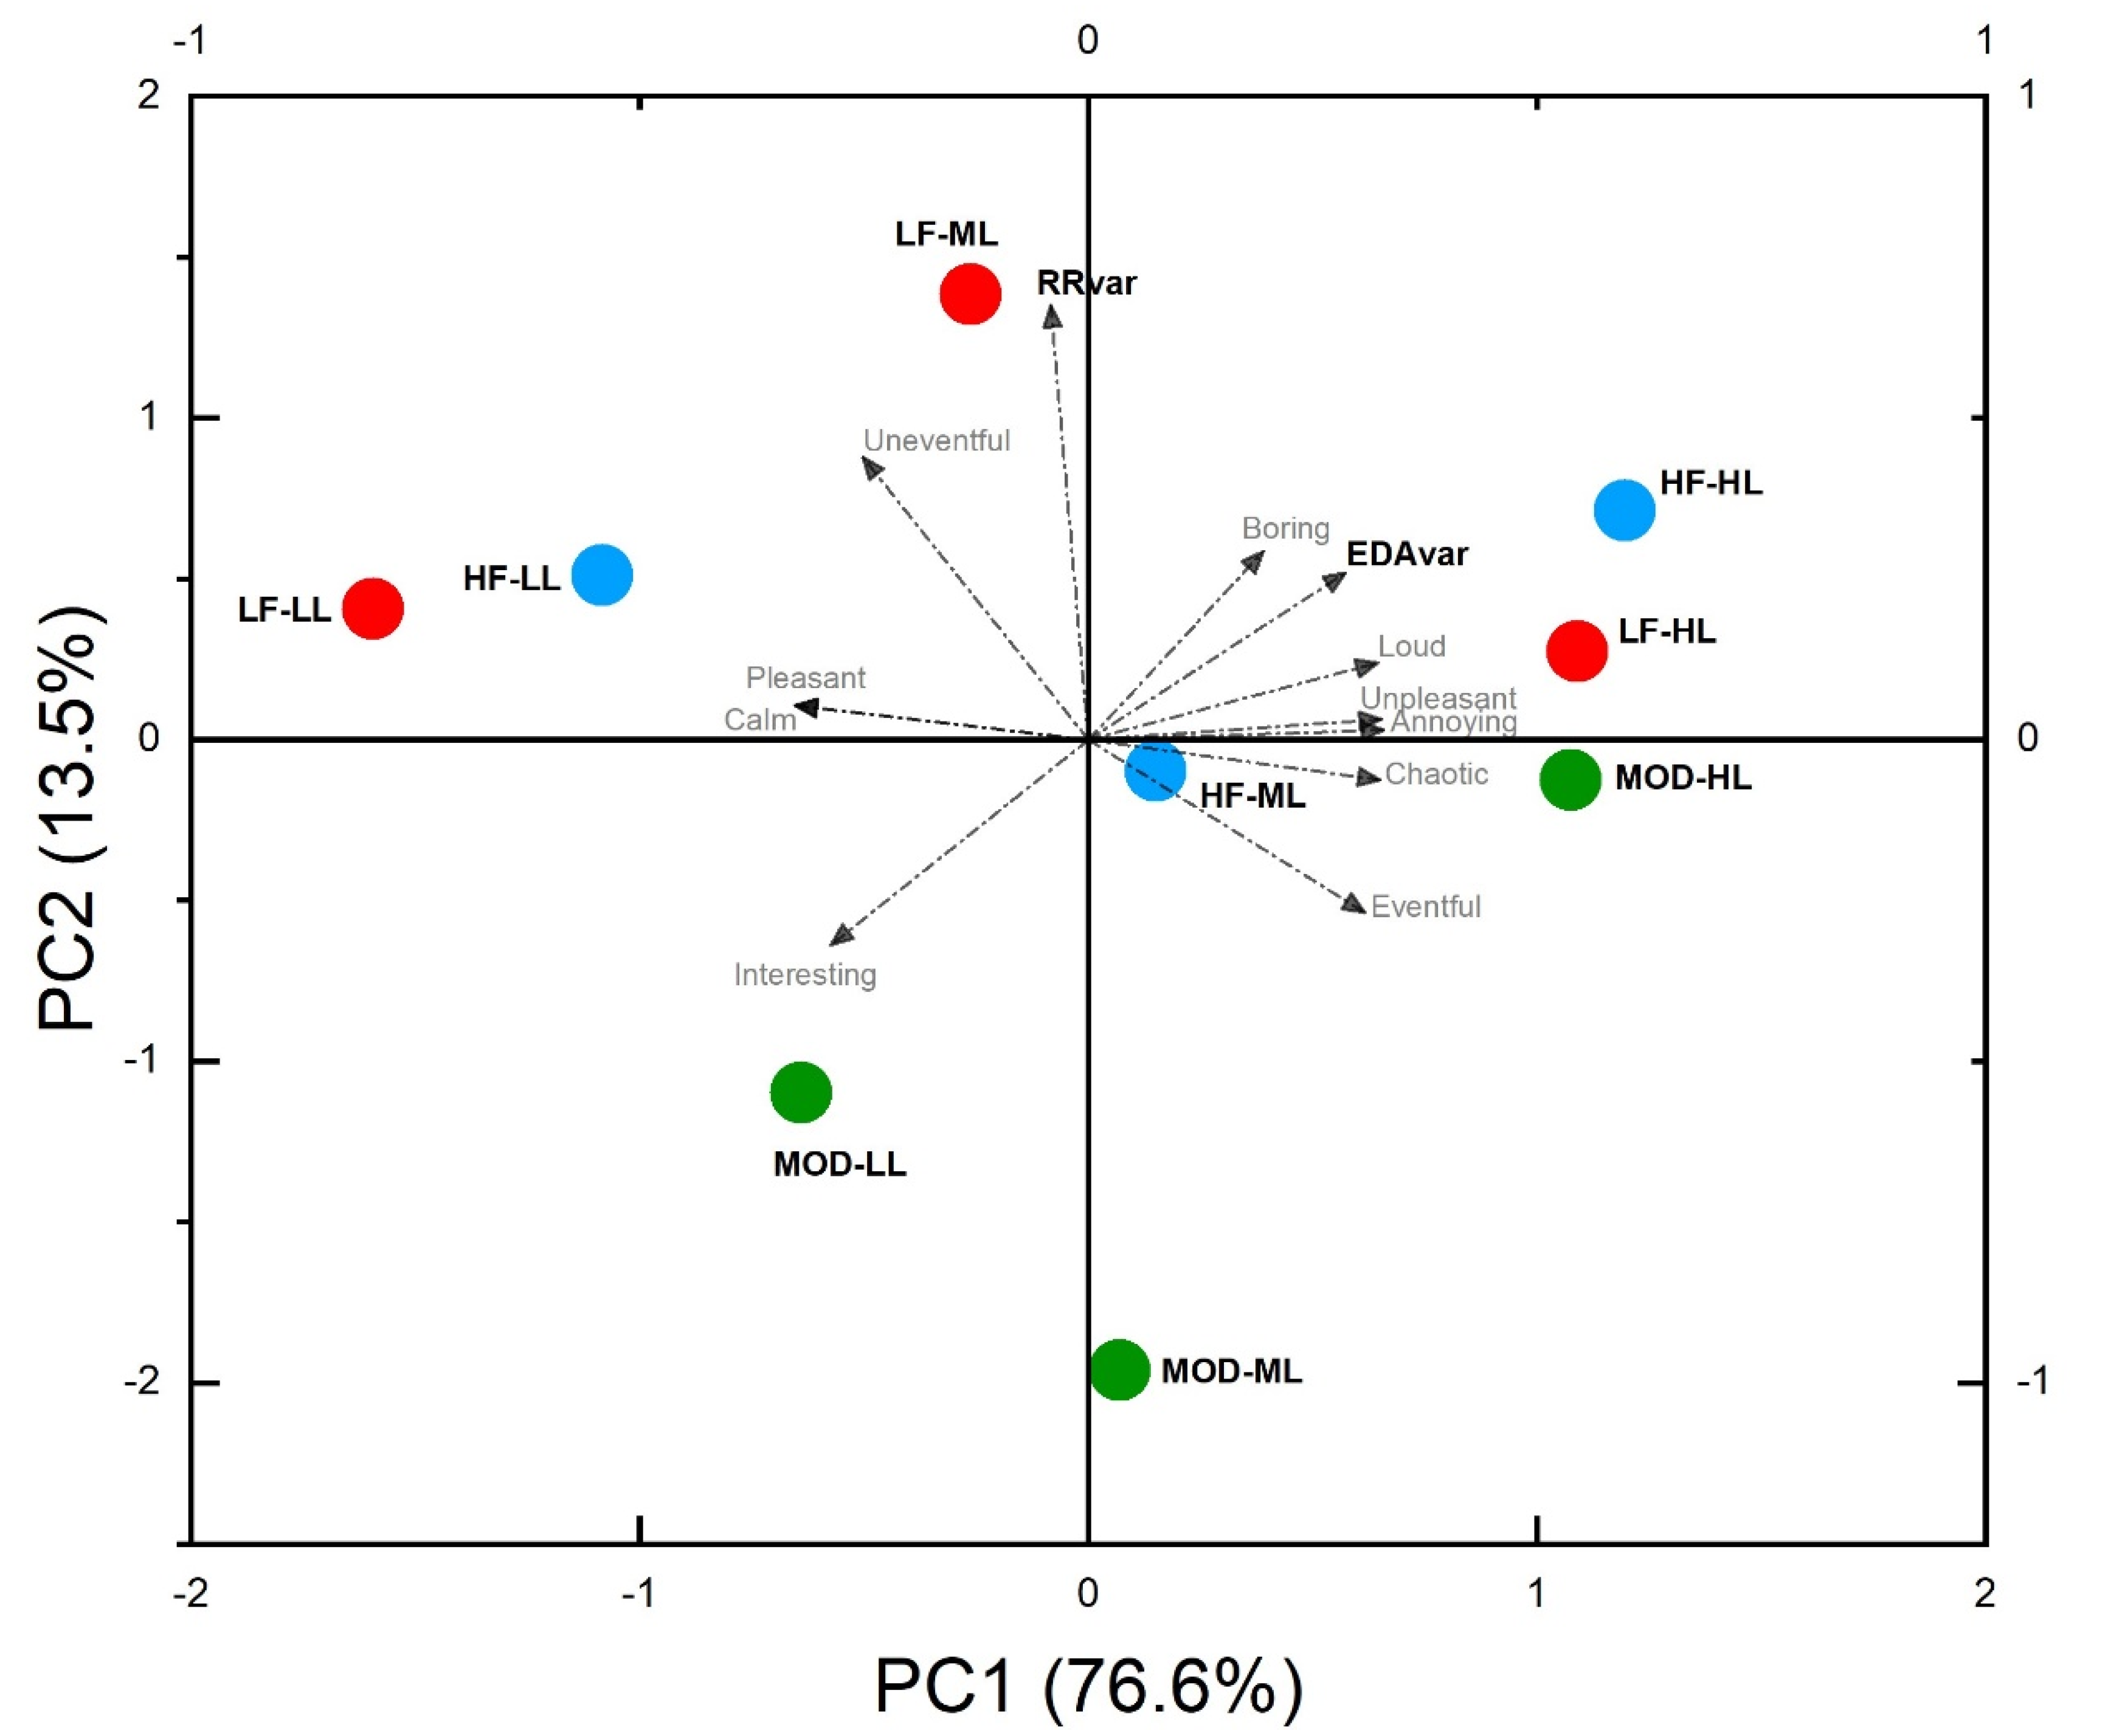
The results of the Principal Component analysis (
Table 2) showed that the first two perceptual components can explain about 90.1% of the variance, describing mainly two dimensions of the noise perception that can be associated with the concept of Valence (76.6%) and Arousal (13.5%). In particular, while the RR interval increases are associated mainly with Arousal dimension, the results show that, the EDA increases are positively correlated with Loud, Boring, Unpleasant and Annoying noises. Biplot graph of
Figure 7 shows also that the noises at the low levels are well correlated with negative EDA variations, while RR-intervals decrease in case of exposure to modulated noise.
4. Discussion
Despite the results obtained for electrodermal activity descriptor, they cannot be compared with studies focused on industrial noises. In the literature, it is only possible to find studies conducted to investigate the EDA changes with the soundscape [
28,
29] or with very high-frequency sounds and ultrasounds. Some similarities can be found with the study conducted by Park et al. [
16], who investigated the EDA changes between groups with different noise sensitivity when they were exposed to different building noises (i.e., trampling of a man and a child with bare feet, the sound of a ball falling from a height of 1 m and the noise of a motorway). Although the lower tested sound levels (L
Aeq,5 min = 29 to 60 dBA) did not show significant effects of the noise levels and types within the groups with the same noise sensitivity, when comparing the time variations of the electrodermal activity, a common behavior can be observed. The EDA increases in the first 30 s of sound exposure. It then decreases steadily over the rest of the measurements. Both repeated ANOVAs revealed that the duration of noise significantly affects the mean percentage changes in terms of electrodermal activity.
The observation of the HRV descriptor yielded no evidence. Our HRV results are based on data collected in less than 5 min and, although these ultra-short-term HRV measurements (<5 min) are important to estimate the HRV status, these measures are subject to more restrictions. Age, health, measurement condition, artifact detecting procedures, and the concurrent-validity criteria used may have a greater impact on ultra-short-term measurements than on longer recordings [
23]. For ultra-short time measures, there are methodological limitations; although for some researchers they are good surrogates of short-term HRV measurements [
22], others are still trying to assess their validity [
21,
30]. Studies which used short-term measures to assess the effects of noise on Heart Rate had valuable outputs, such as in the study conducted by Abbasi et al. [
9]. In their study, they measured the HR (Bpm) and LF/HF ratios with recording of 5 min before, during and after subjects’ exposure to low frequency noise in three conditions of workload (low, medium, and high) at noise pressure levels of 55, 65, 70, and 75 dB(A). The physiological indices revealed that, as the workload and noise pressure level increased, so did the rate of HR changes, with a significant difference between HR changes at different levels compared to the baseline mode. Moreover, Kalantary et al. [
31] investigated the effects of occupational noise on blood pressure and heart rate of two groups of workers involved in different functional units of automotive parts industries. They measured and recorded for 1 min the Heart Rate and the blood pressure twice in a day (before starting the shift and after noise exposure during the work shift) of two groups of workers exposed to low (53 dB) and high levels of noise (85–108 dB). The ANCOVA results revealed significant differences between the two groups of workers’ mean changes in heart rate, systolic blood pressure, and diastolic blood pressure. Workers exposed to high noise levels experienced, compared to the resting condition, a mean of 14 bpm change after noise exposure during the work shift. Whereas, for the low-exposure group, the difference was considerably smaller. However, other studies such as the one conducted by Lu et al. [
32], investigating the effects of three different industrial noises at 75 dB and 90 dB, found significant differences in blood pressure but not in heart rate.
Furthermore, some physiological adaptation effects could occur in workers who work in industrial facilities daily which are not considered in this study focused on non-expert workers, which are not typically exposed to industrial noise. This means that the results must be referred mainly to groups of workers who are new to the job (lack of experience of working; lack of familiarity with the job and the work environment) or for which job is temporary. Moreover, although the results of this laboratory test cannot be extended directly to real-world conditions, where the sensory stimuli of the surrounding environment are more complex and overlapped, they represent an important reference on how the stress levels change in those conditions where noise stimulus is more predominant than others (microclimate, lighting, vibrations). The attempts to extend this work to more complex conditions explored in previous studies have been performed, but different limitations have been pointed out [
33,
34,
35,
36] that need to be investigated in the future.
5. Conclusions
The purpose of this study was to highlight the potential changes in two important physiological indicators, EDA and RR-interval, when different industrial noise typologies were activated at different equivalent sound pressure levels on a sample of 24 subjects in a laboratory test.
As the results showed, changes in the electrodermal activity of the participants have been found to depend on the equivalent sound levels of the noise stimuli. Indeed, as the noise levels increase the electrodermal activity increase. The EDA variation [
37,
38,
39] was linked to the Arousal of the individuals and their stress levels. It is expected that activation of noise sources induces an increase in the electrodermal activity of the baseline by 5% to 30%. EDA variation increases from one to three times the value at Low and Medium levels at High levels.
Most importantly, the results showed that this variation seems to be noise-type-dependent: high-frequency noise induces a higher EDA increase at all noise levels. Although at first sight the results could seem to be due to the higher sensitivity of human hearing in the middle–high frequency region (3000–5000 Hz), where the high-frequency noise has the most part of its acoustic energy, deducing that it depends on the different loudness among the different type of noises, it must be considered that the authors kept the average loudness (N
avg) as similar as possible within each of the different noise conditions and among the three levels (N
avg,LL: 17.5 ÷ 21.9 sones; N
avg,ML: 33.9 ÷ 38.6 sones; N
avg,HL: 64.3 ÷ 69.9 sones) while their average sharpness varied importantly (S
avg,LL: 0.96 ÷ 2.61 acum; S
avg,ML: 1.47 ÷ 3.67 acum; S
avg,HL: 2.53 ÷ 5.25 acum). The role of this sharpness emerged also through the significant correlation with EDA variation showed in
Figure 6. Moreover, by observing the electrodermal activity variation during the time it can also be noted that the magnitude of this increase occurs in the first 10–20 s of the activation of the noise, while the decay is approximatively constant over all the first minute of exposure.
On the other side, no evidence has been found through the observation of the HRV descriptor.
The self-reported assessment of the noise stimuli confirms that the Valence and the Arousal of the stimulus can explain a vast part of the variance in the self-reporting. The Valence of sound may explain the most part, 83.41%, while the remaining 10.04% is explained by Arousal. The results also underline how the EDA variation is strongly associated with these two factors. In particular, an increase in EDA can be associated with an unstable and annoying noise environment.
Work-related stress is widespread nowadays, and it has significant negative consequences for both individuals and organizations. Results indicate that noise control in industrial environments is not only a noise level matter. Stress-increasing conditions have been observed at each noisy event or activation, and sharpness seems to deserve particular attention. More generally, noise control interventions oriented to improving the perceived Valence may reduce the magnitude of stress in individuals.
Much more studies could help understand the link between the noise characteristics, the magnitude of physiological responses and the increase in negative effects on health or the accident, providing more adequate design tools for assessing and managing stress factors at work.


