A Case Study on Soundscape Analysis for the Historical and Ethnic Village of Dong Nationality in Zhaoxing County
Abstract
1. Introduction
2. Methods
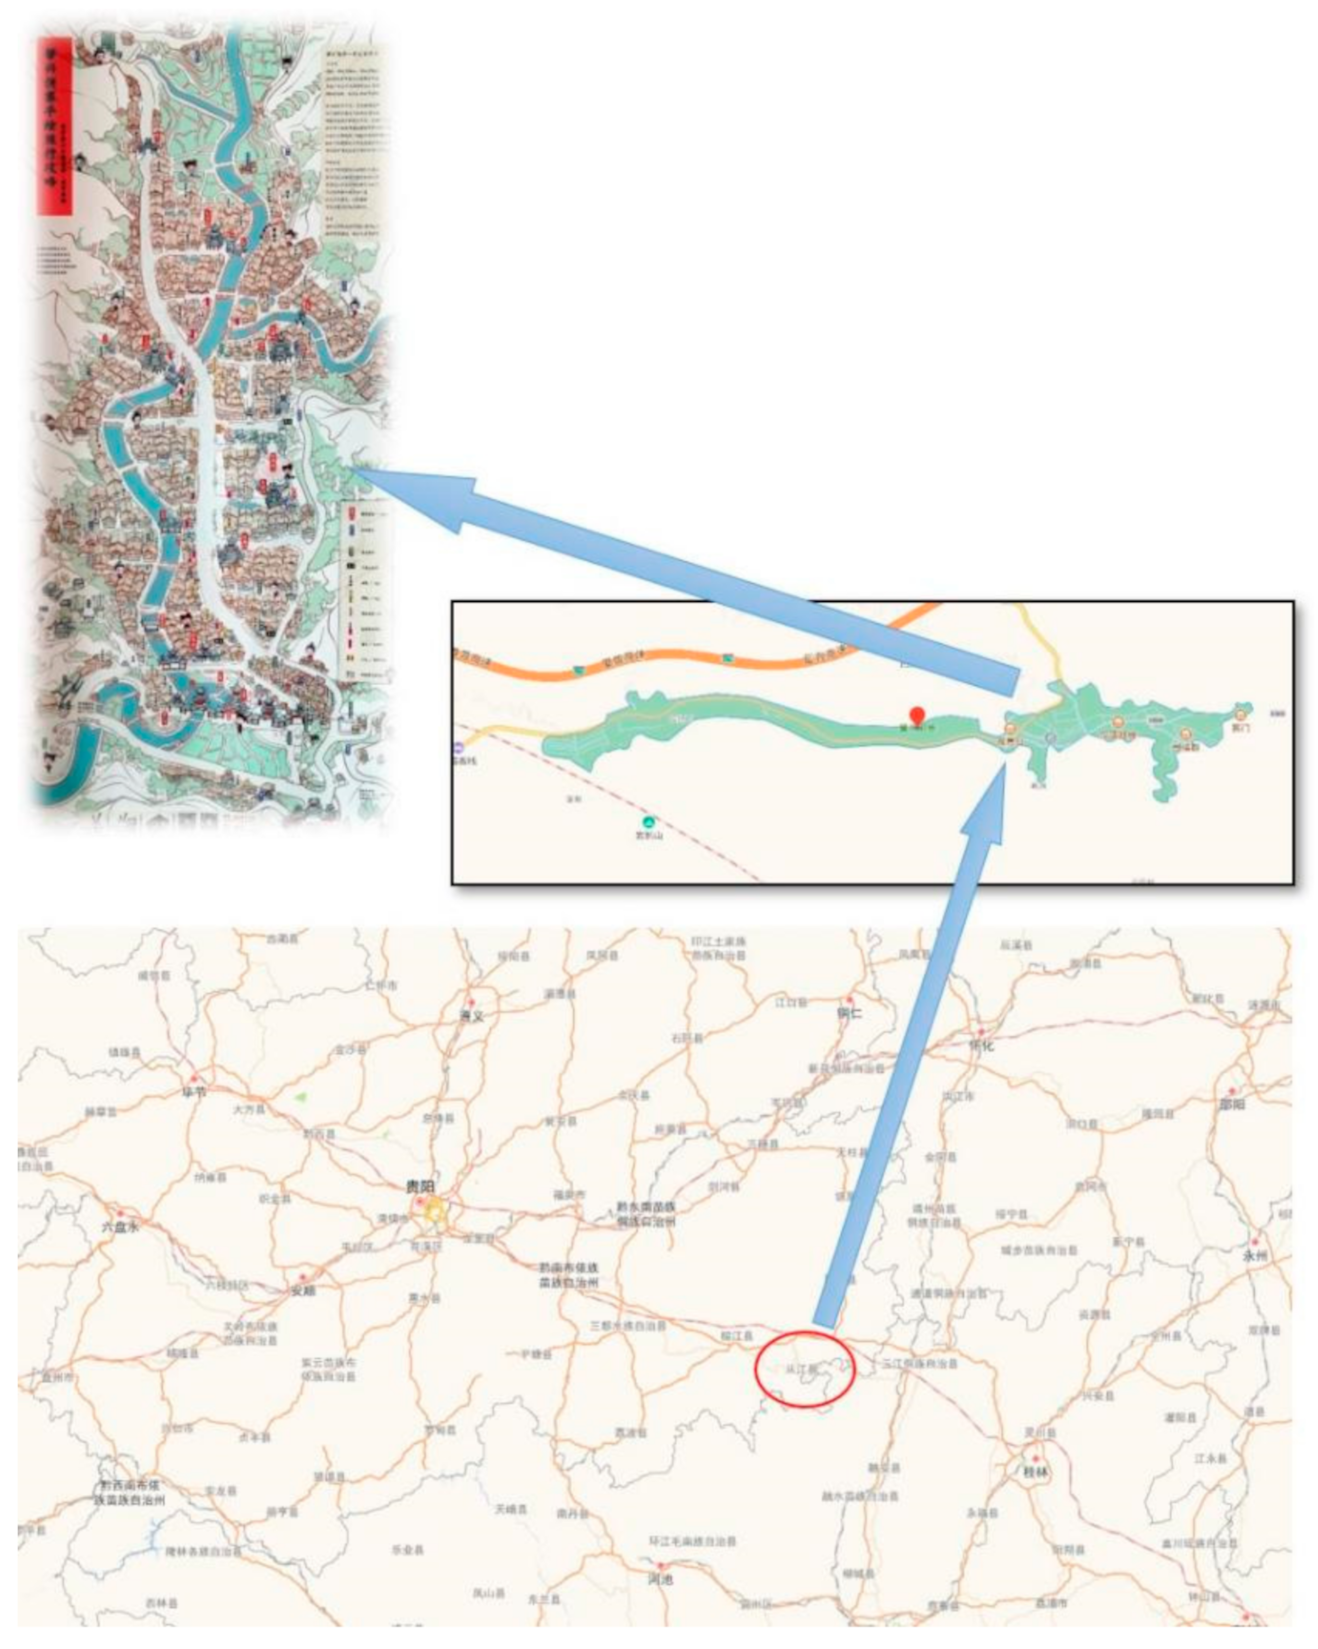
2.1. Case Study Area and Samples
2.2. Algorithm of Acoustic Parameter LAeq
2.3. Recording and Measuring Techniques
2.4. Subjective Evaluation and Its Curve-Fit Method
2.5. Soundscape Features
- Keynote
- Sound Signal
- Soundmark
3. Results
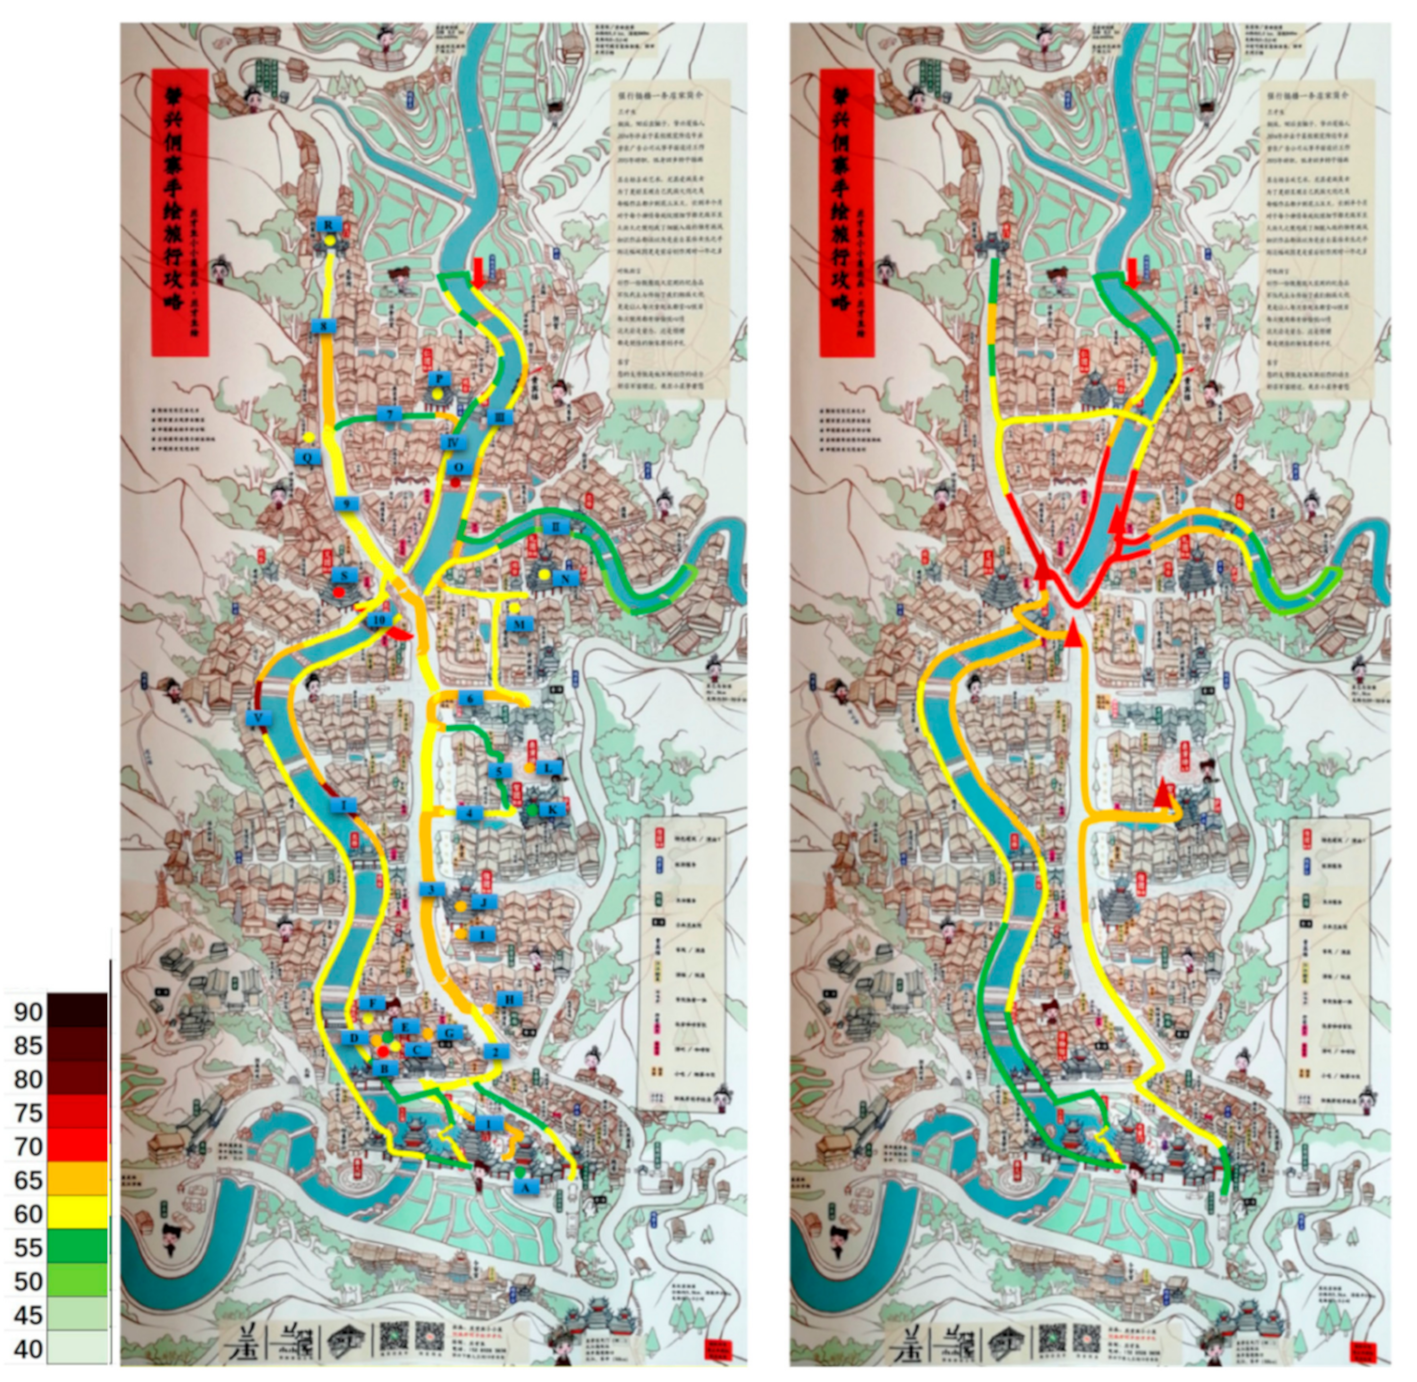
3.1. Sound Level Mapping
3.2. Soundscape Features Analysis
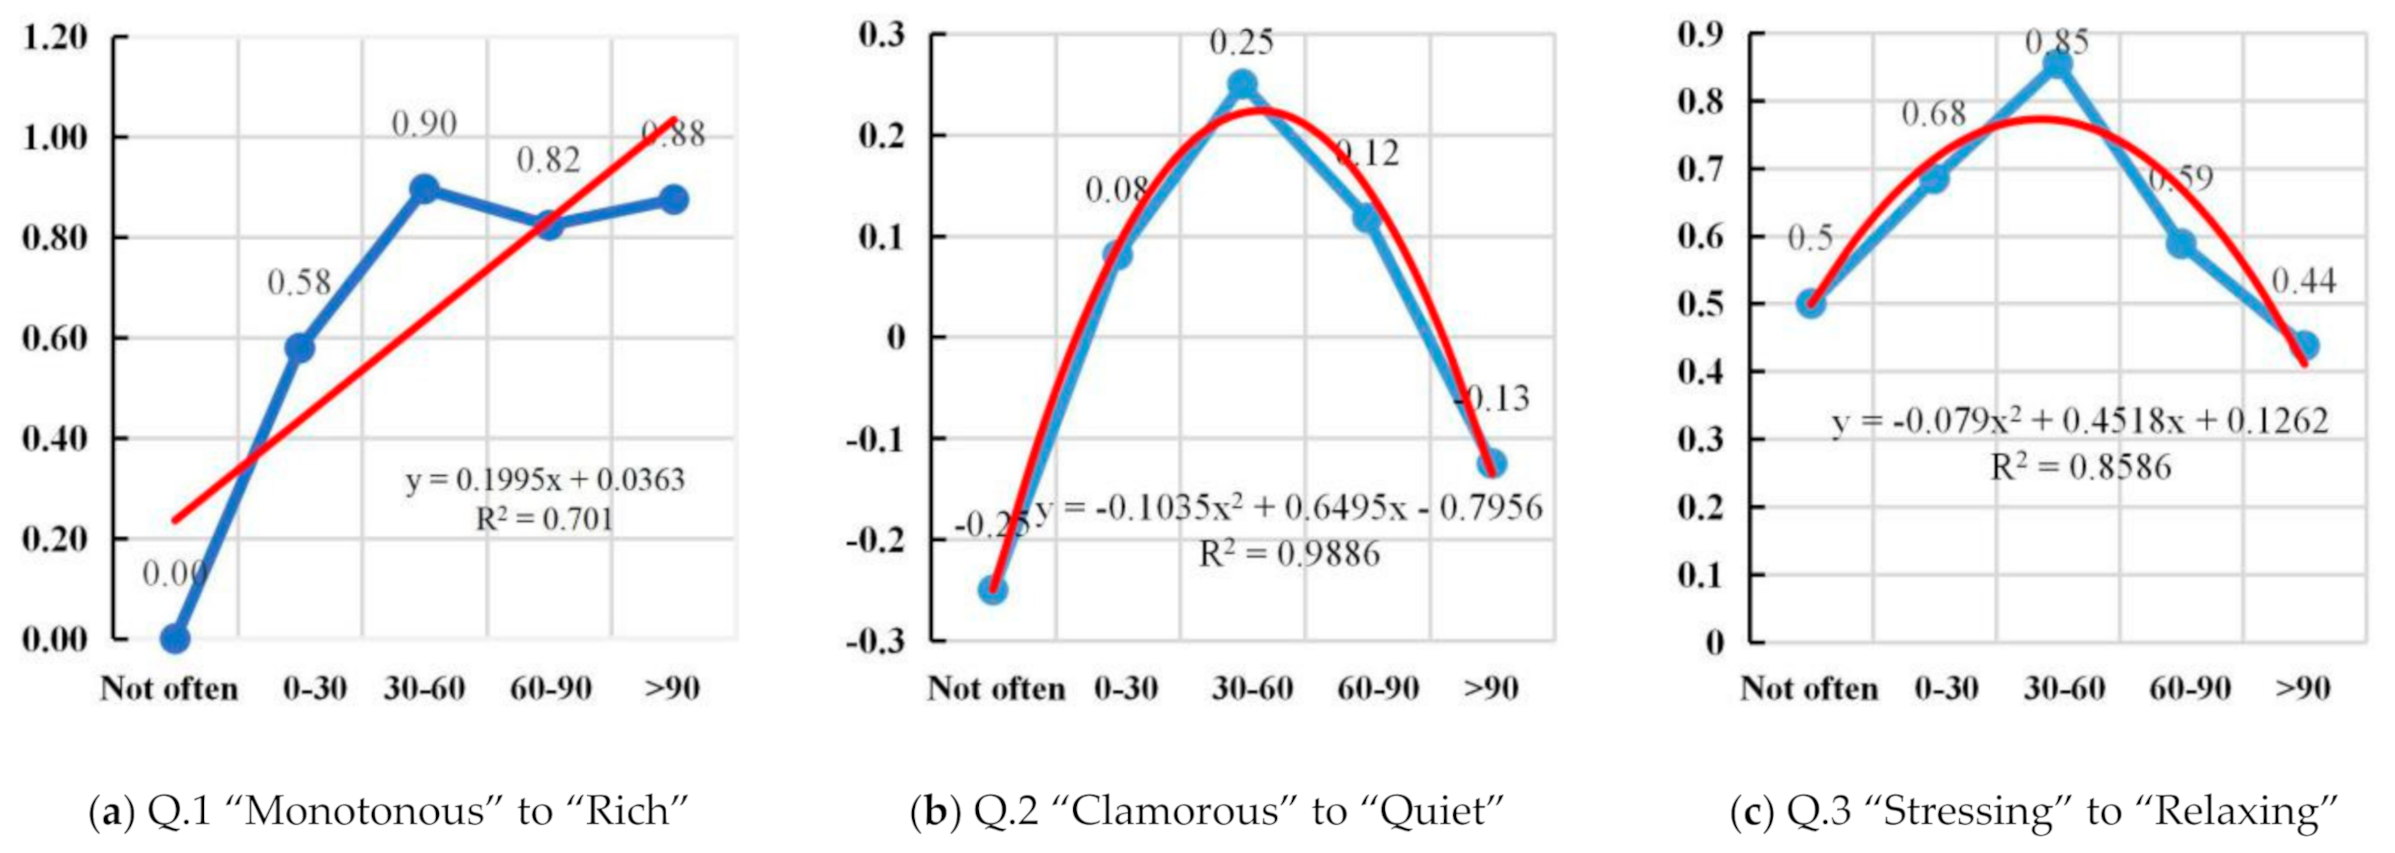
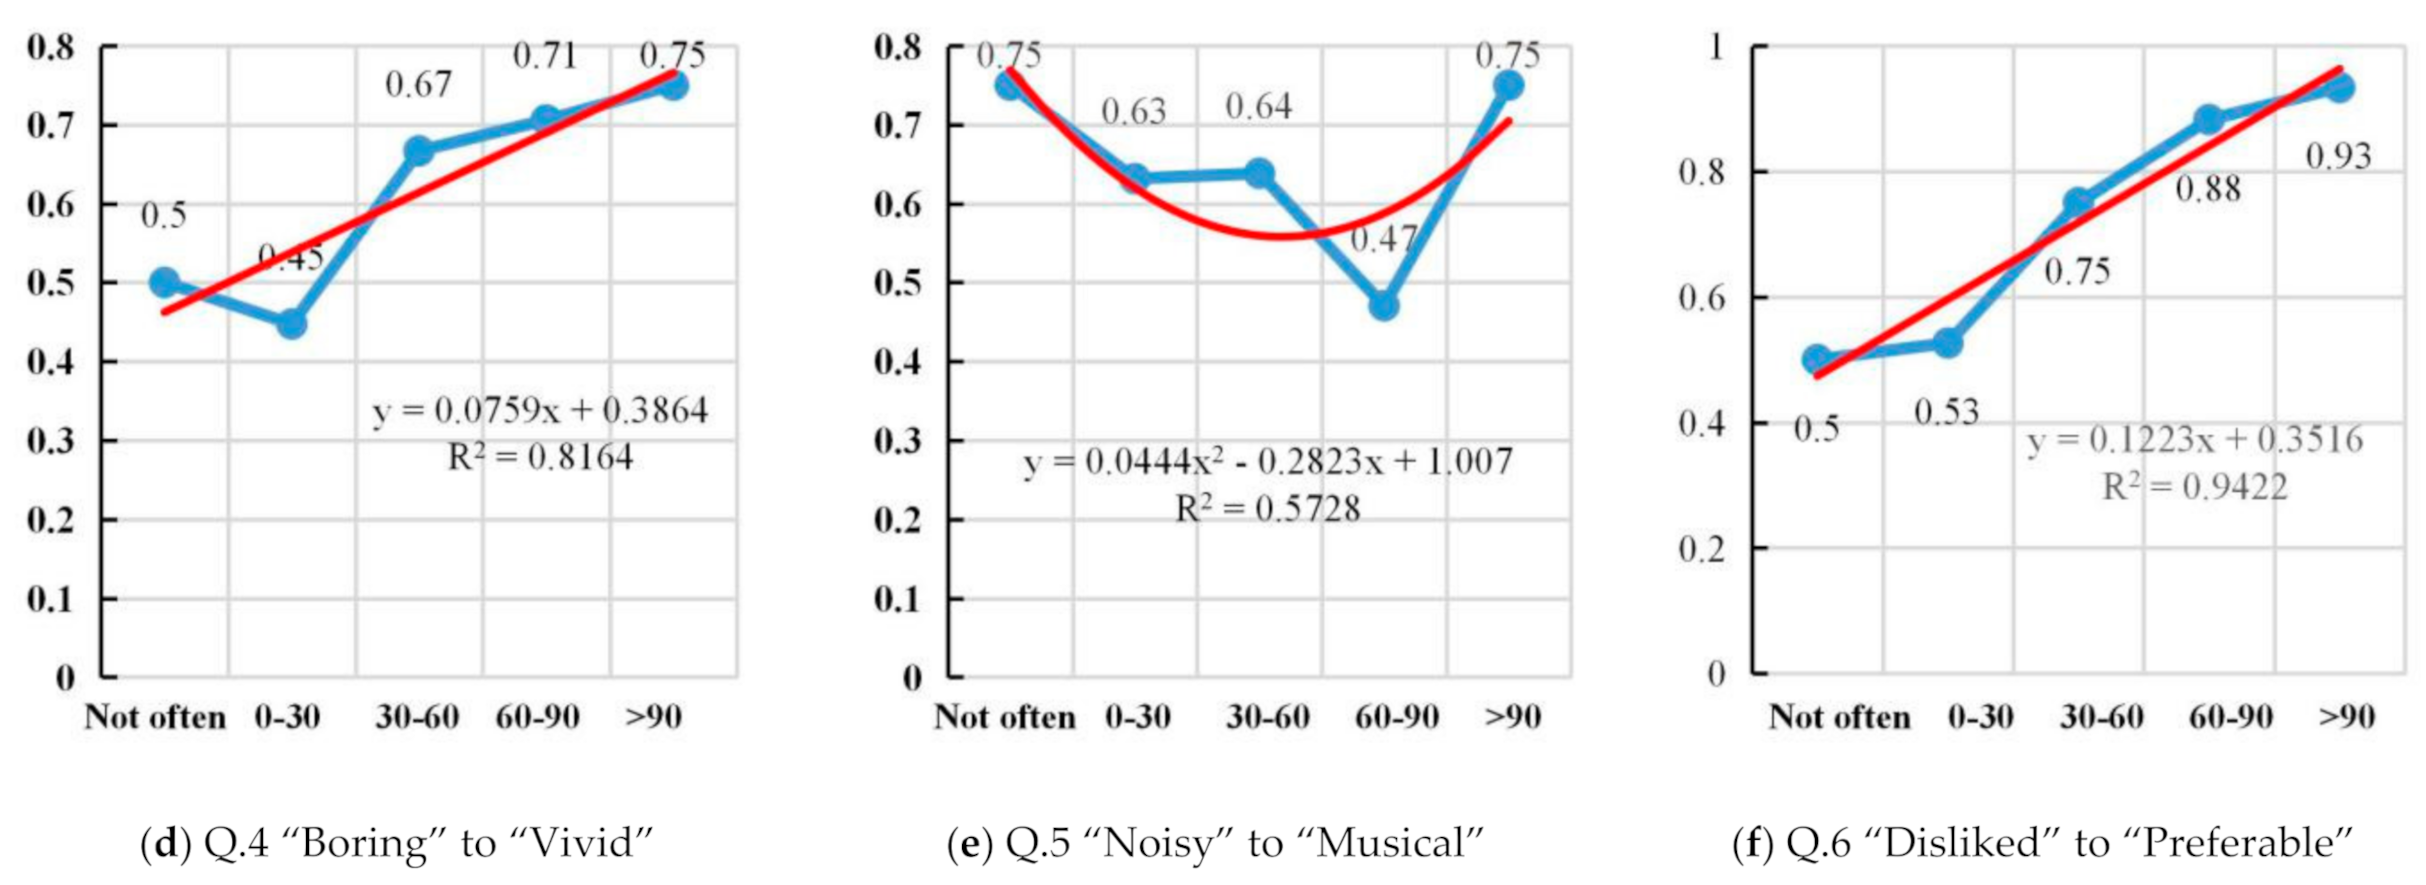
3.3. Curve-Fit Mapping
4. Discussions
4.1. Soundscape Features Analysis
4.2. Relationships between Length of Listening and the Semantics
4.2.1. The Linear Increasing
4.2.2. The Optimal Threshold
4.2.3. The Worst Threshold
5. Conclusions
Author Contributions
Funding
Institutional Review Board Statement
Informed Consent Statement
Conflicts of Interest
References
- Schafer, R.M. Introduction. In The Soundscape: Our Sonic Environment and the Tuning of the World; Alfred Knopf: New York, NY, USA, 1997; pp. 3–12. [Google Scholar]
- International Organization for Standardization. ISO 12913-1:2014 Acoustics—Soundscape—Part 1: Definition and Conceptual Framework; ISO: Geneva, Switzerland, 2014. [Google Scholar]
- Qin, Y. The Domain of Soundscape. Build. Technol. 2005, 1, 45–46. [Google Scholar]
- Deng, Z.; Liu, A. A Soundscape Methodology for the Ritual Music. Chin. Music 2019, 3, 54–60. [Google Scholar]
- Liu, A. Soundscape and its application in research of tourism geography: A new perspective. Geogr. Res. 2013, 32, 1132–1142. [Google Scholar]
- Torija, A.J.; Ruiz, D.P.; Ramos-Ridao, A.R. Required stabilization time, short-term variability and impulsiveness of the sound pressure level to characterize the temporal composition of urban soundscapes. Appl. Acoust. 2011, 72, 89–99. [Google Scholar] [CrossRef]
- Aletta, F.; Kang, J. Historical Acoustics: Relationships between People and Sound over Time. Acoustics 2020, 2, 128–130. [Google Scholar] [CrossRef]
- Liu, A.; Liu, F.; Deng, Z.; Chen, W. Relationship between soundscape and historical-cultural elements of Historical Areas in Beijing: A case study of Qianmen Avenue. In Proceedings of the Internoise 2014 Conference, Melbourne, Australia, 16–19 November 2014. [Google Scholar]
- Deng, Z.; Liu, A.; Zhou, G.; Hua, W. Case Studies. In Lineage, Settlement, Sound: From a Cultural View of Soundscape; Tourism Education Press: Beijing, China, 2015; Chapter 5; pp. 88–211. [Google Scholar]
- Zhou, Z.; Kang, J.; Jin, H. Factors that influence soundscapes in historical areas. Noise Control Eng. J. 2014, 62, 60–68. [Google Scholar] [CrossRef]
- Kang, J.; Zhang, M. Semantic differential analysis of the soundscape in urban open public spaces. Build. Environ. 2010, 45, 150–157. [Google Scholar] [CrossRef]
- Deng, Z.; Liu, A.; Chen, H. Semantic analysis for the soundscape of historical and cultural areas: An approach of human geography. Hum. Geogr. 2014, 29, 35–42. [Google Scholar]
- Dong, Z. Village Sketch Travel Strategy. 2018. Available online: https://www.trip.com/travel-guide/liping/zhaoxing-village-86372/ (accessed on 22 March 2021).
- Deng, Z.; Liu, A.; Zhou, G.; Hua, W. 2. The time-spatial identifiability of soundscape; 3.1. The time-spatial identifiability of soundscape composition. In Lineage, Settlement, Sound: From a Cultural View of Soundscape; Tourism Education Press: Beijing, China, 2015; pp. 34–44. [Google Scholar]
- Schafer, R.M. Introduction, Glossary of Soundscape Terms. In The Soundscape: Our Sonic Environment and the Tuning of the World; Alfred Knopf: New York, NY, USA, 1997; pp. 9–10. [Google Scholar]
| Questions | Adjective Pairs in Likert Five Scale (Without Unit) | ||||
|---|---|---|---|---|---|
| −2 | −1 | 0 | 1 | 2 | |
| 1. The music or sound environment here makes you feel: | Monotonous | - | Rich | ||
| 2. What do you think of the sound volume here? | Clamorous | - | Quiet | ||
| 3. The music or sound environment here makes you feel: | Stressing | - | Relaxing | ||
| 4. The music or sound environment here makes you feel: | Boring | - | Vivid | ||
| 5. Do you think the sound environment here is musical? | Noisy | - | Musical | ||
| 6. How much do you like this music or sound environment? | Disliked | - | Preferable | ||
| Question for the Independent Variable (Length of Listening, LOL) | - | - | |||
| How long do you listen to music on average every day? (in minutes) | Not often | 0–30 | 30–60 | 60–90 | >90 |
| No. (Figure 2) | Native Location | Duration (mm:ss) | LAeq | Illustration | Analysis |
|---|---|---|---|---|---|
| Main Street and Its Sides Soundwalk | |||||
| 1 | Main Gate to Museum Entrance | 04:31 | 60–65 | 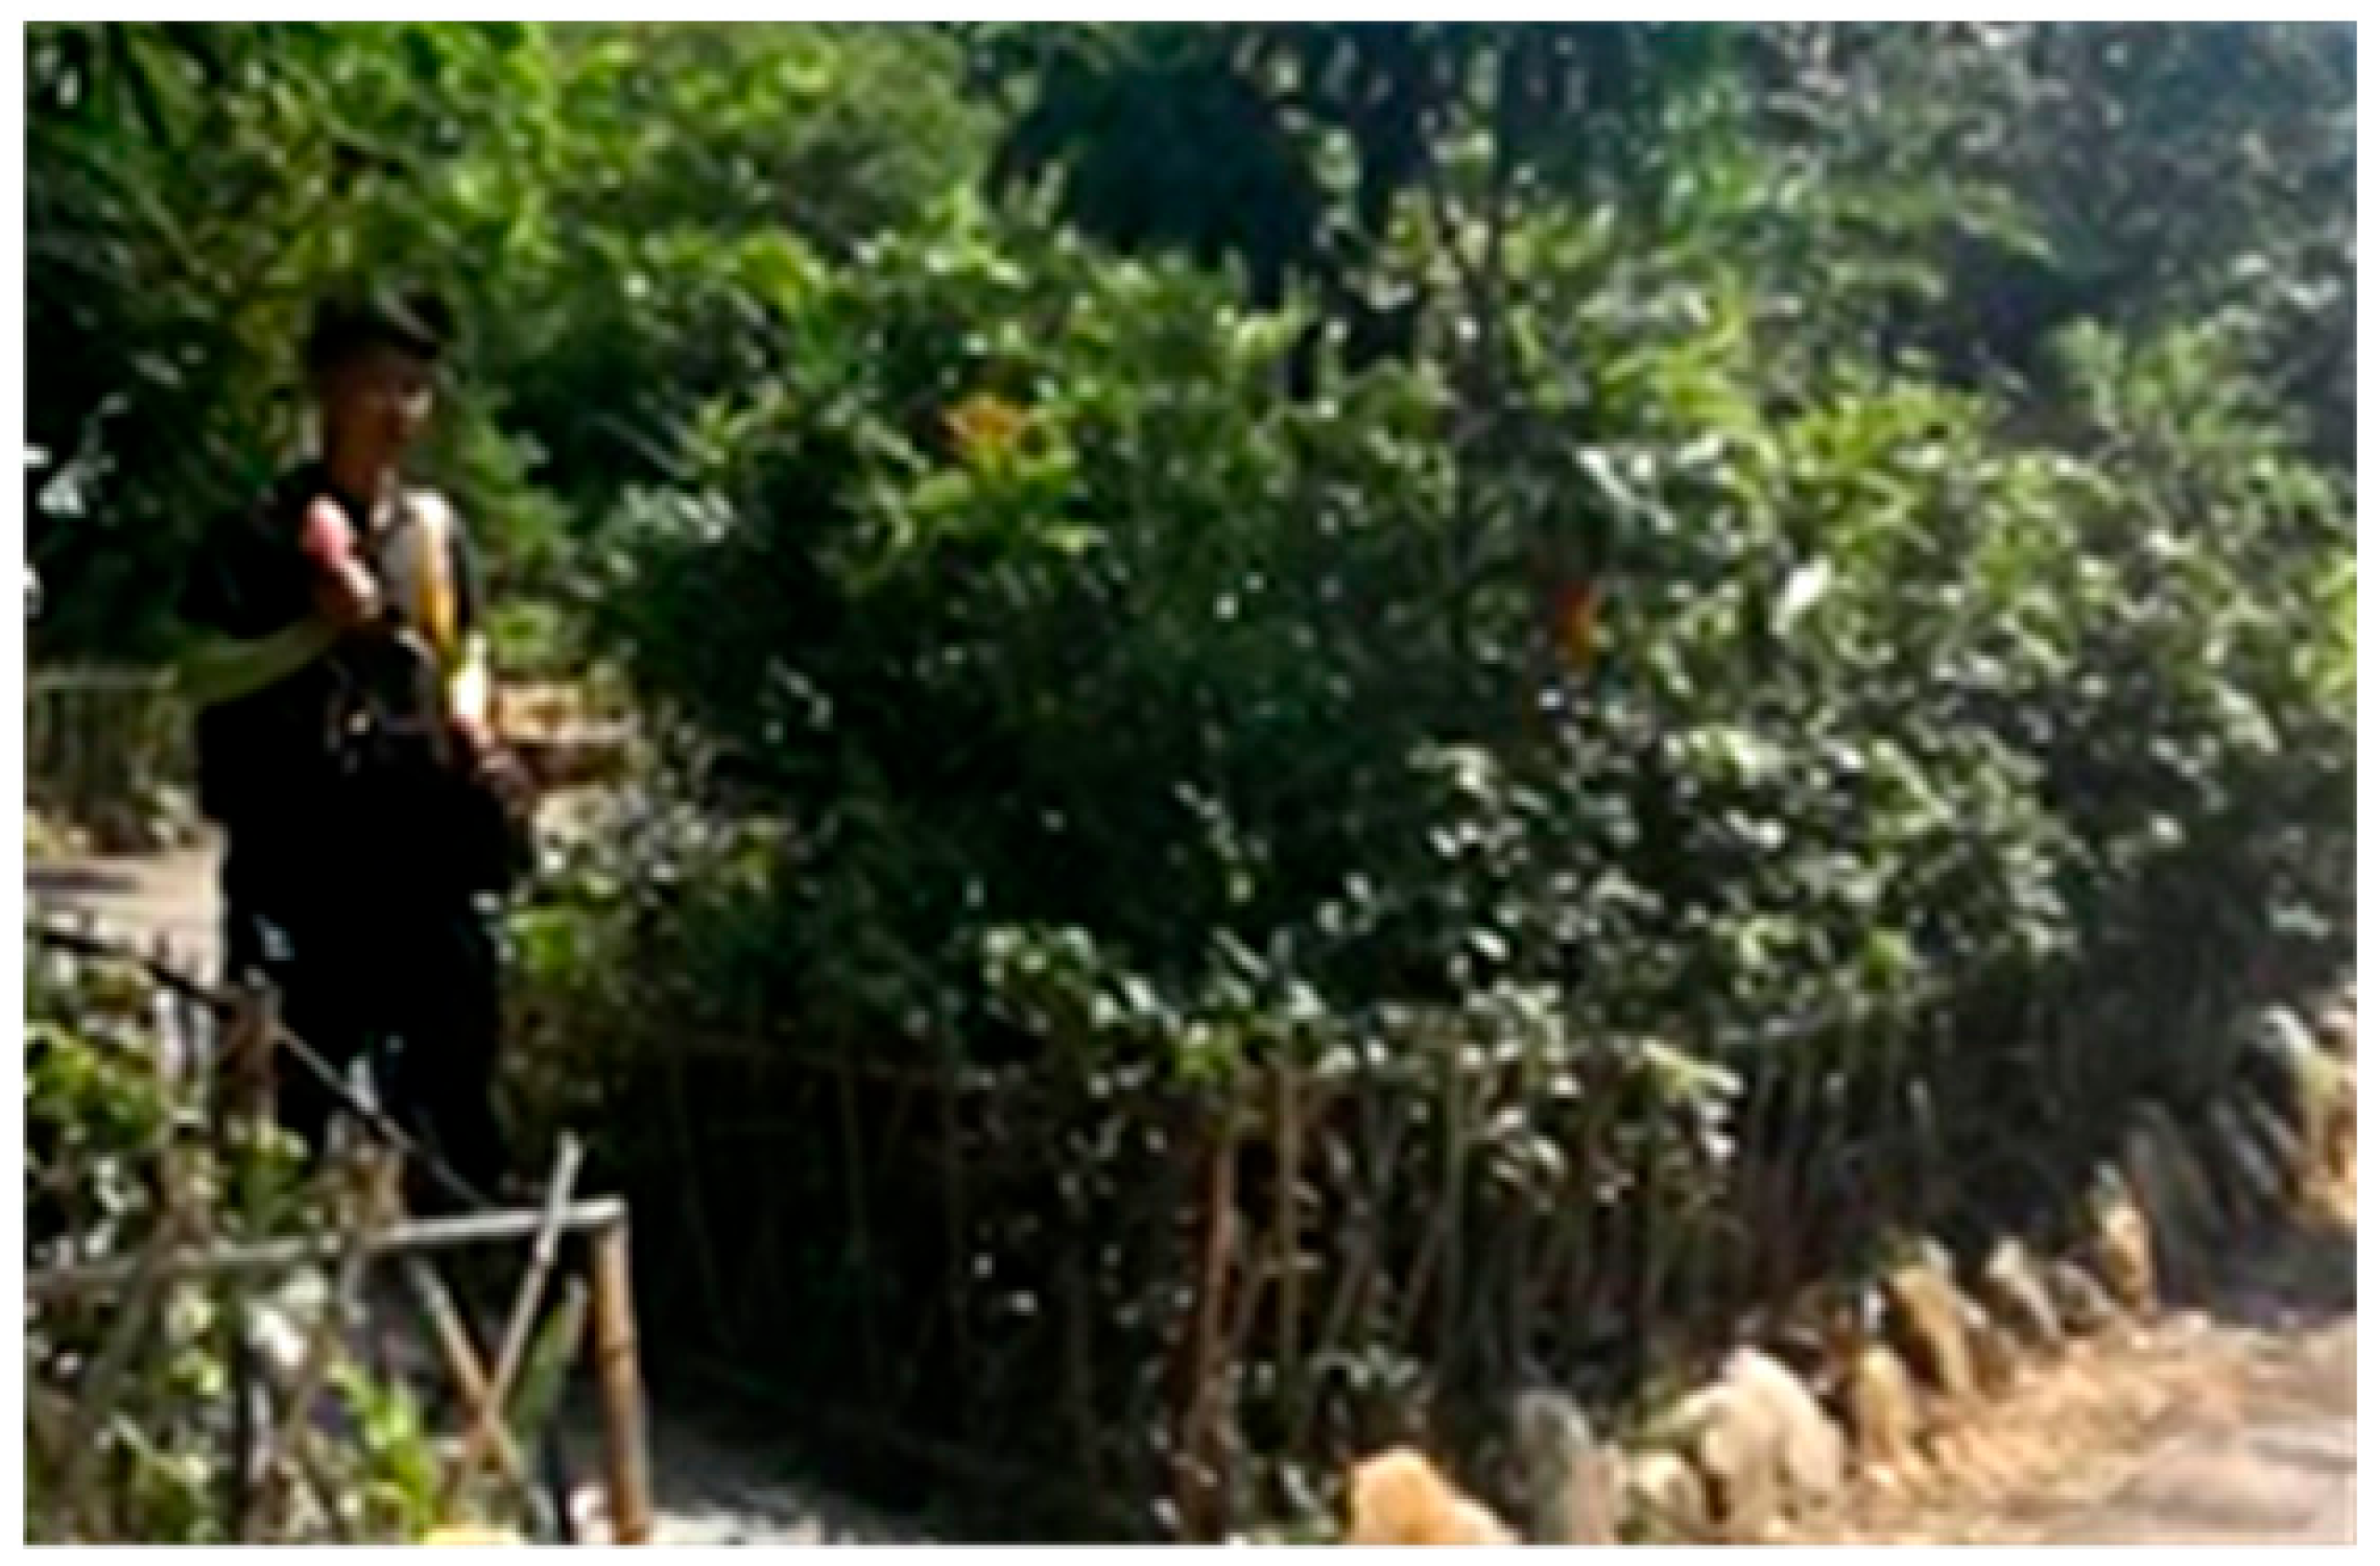 | Both sides of this small road are dominated by shops, restaurants and guesthouse. People often wear traditional clothes. The sound is relatively quiet mainly with the natural sounds with a few of people at night. Keynote: Wind, Chirps, Water flow, Crowd noise. Signals: The collision sound of Dong’s silverware. Soundmarks: None. |
| 2 | Museum Entrance to County Road 886 and Alley 1 | 04:23 | 65 | 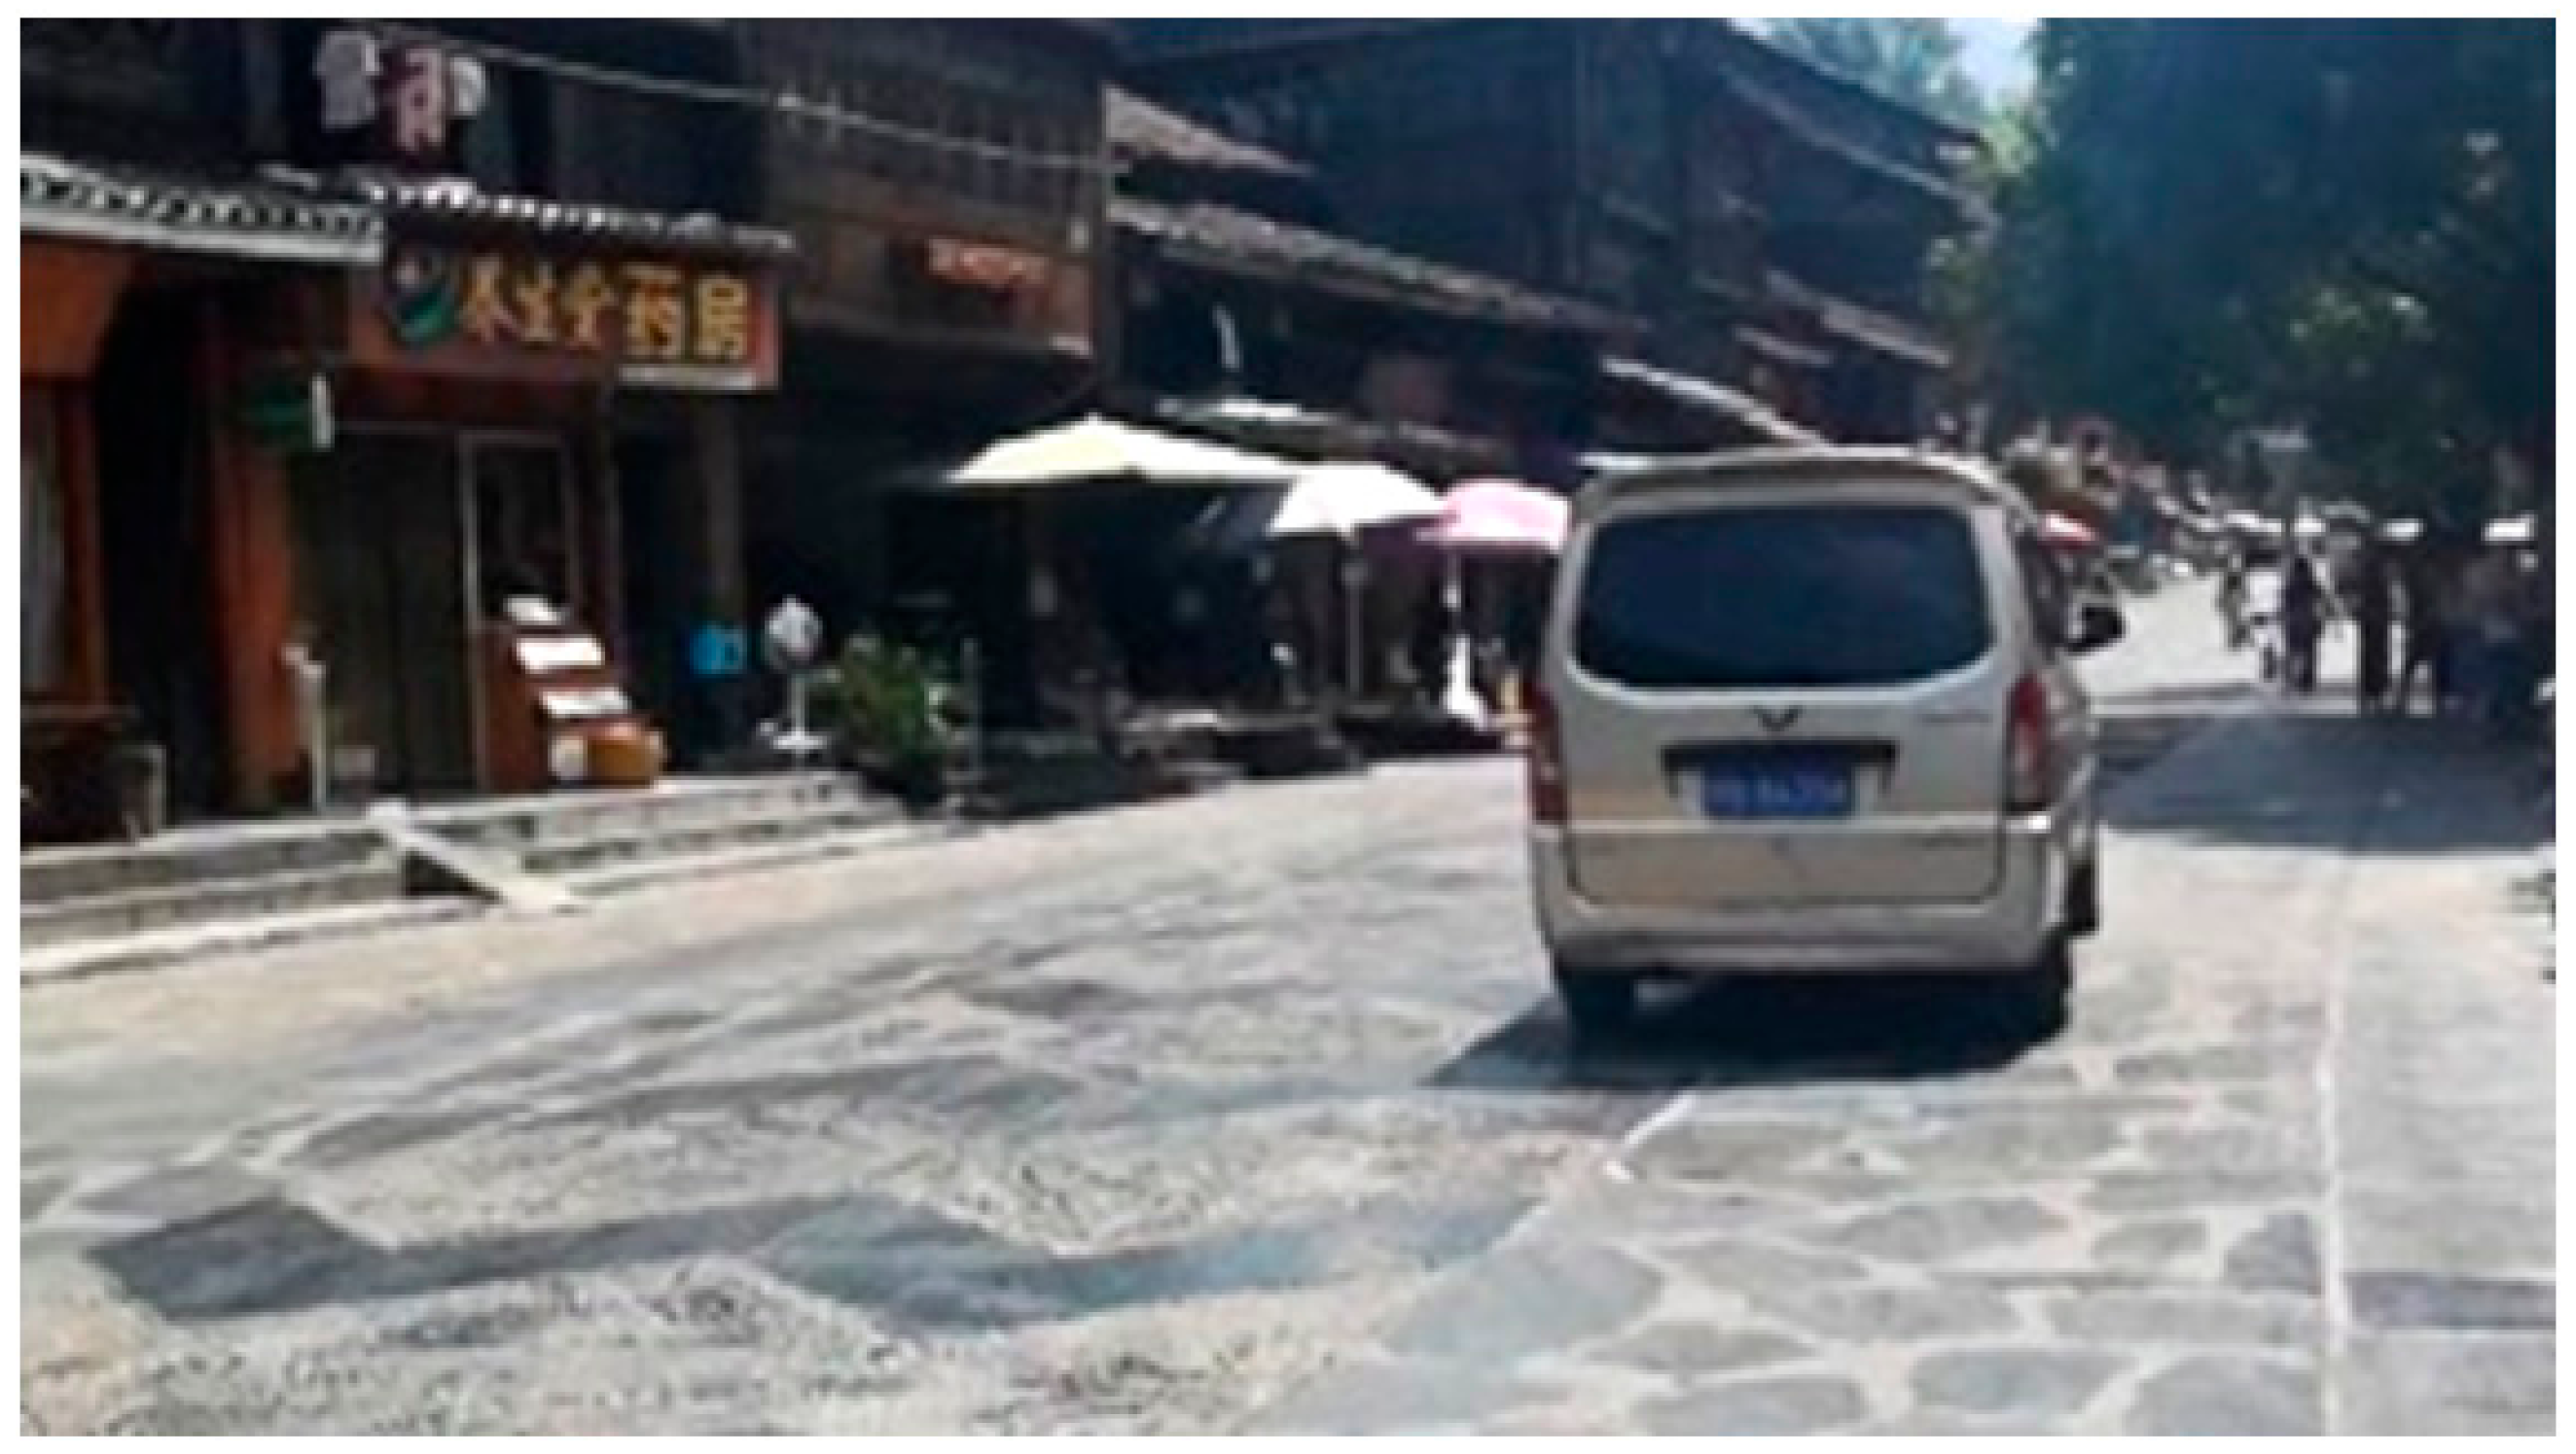 | This is a noisy road with many shops. Since County Road 886 is a main road, the traffic is busy and noisy. Keynotes: Crowd noise, Traffic noise. Signals: Car horn. Soundmarks: None. |
| 3 | County Road 886 and Alley 1 to County Road 886 and Alley 4 | 01:39 | 68 | 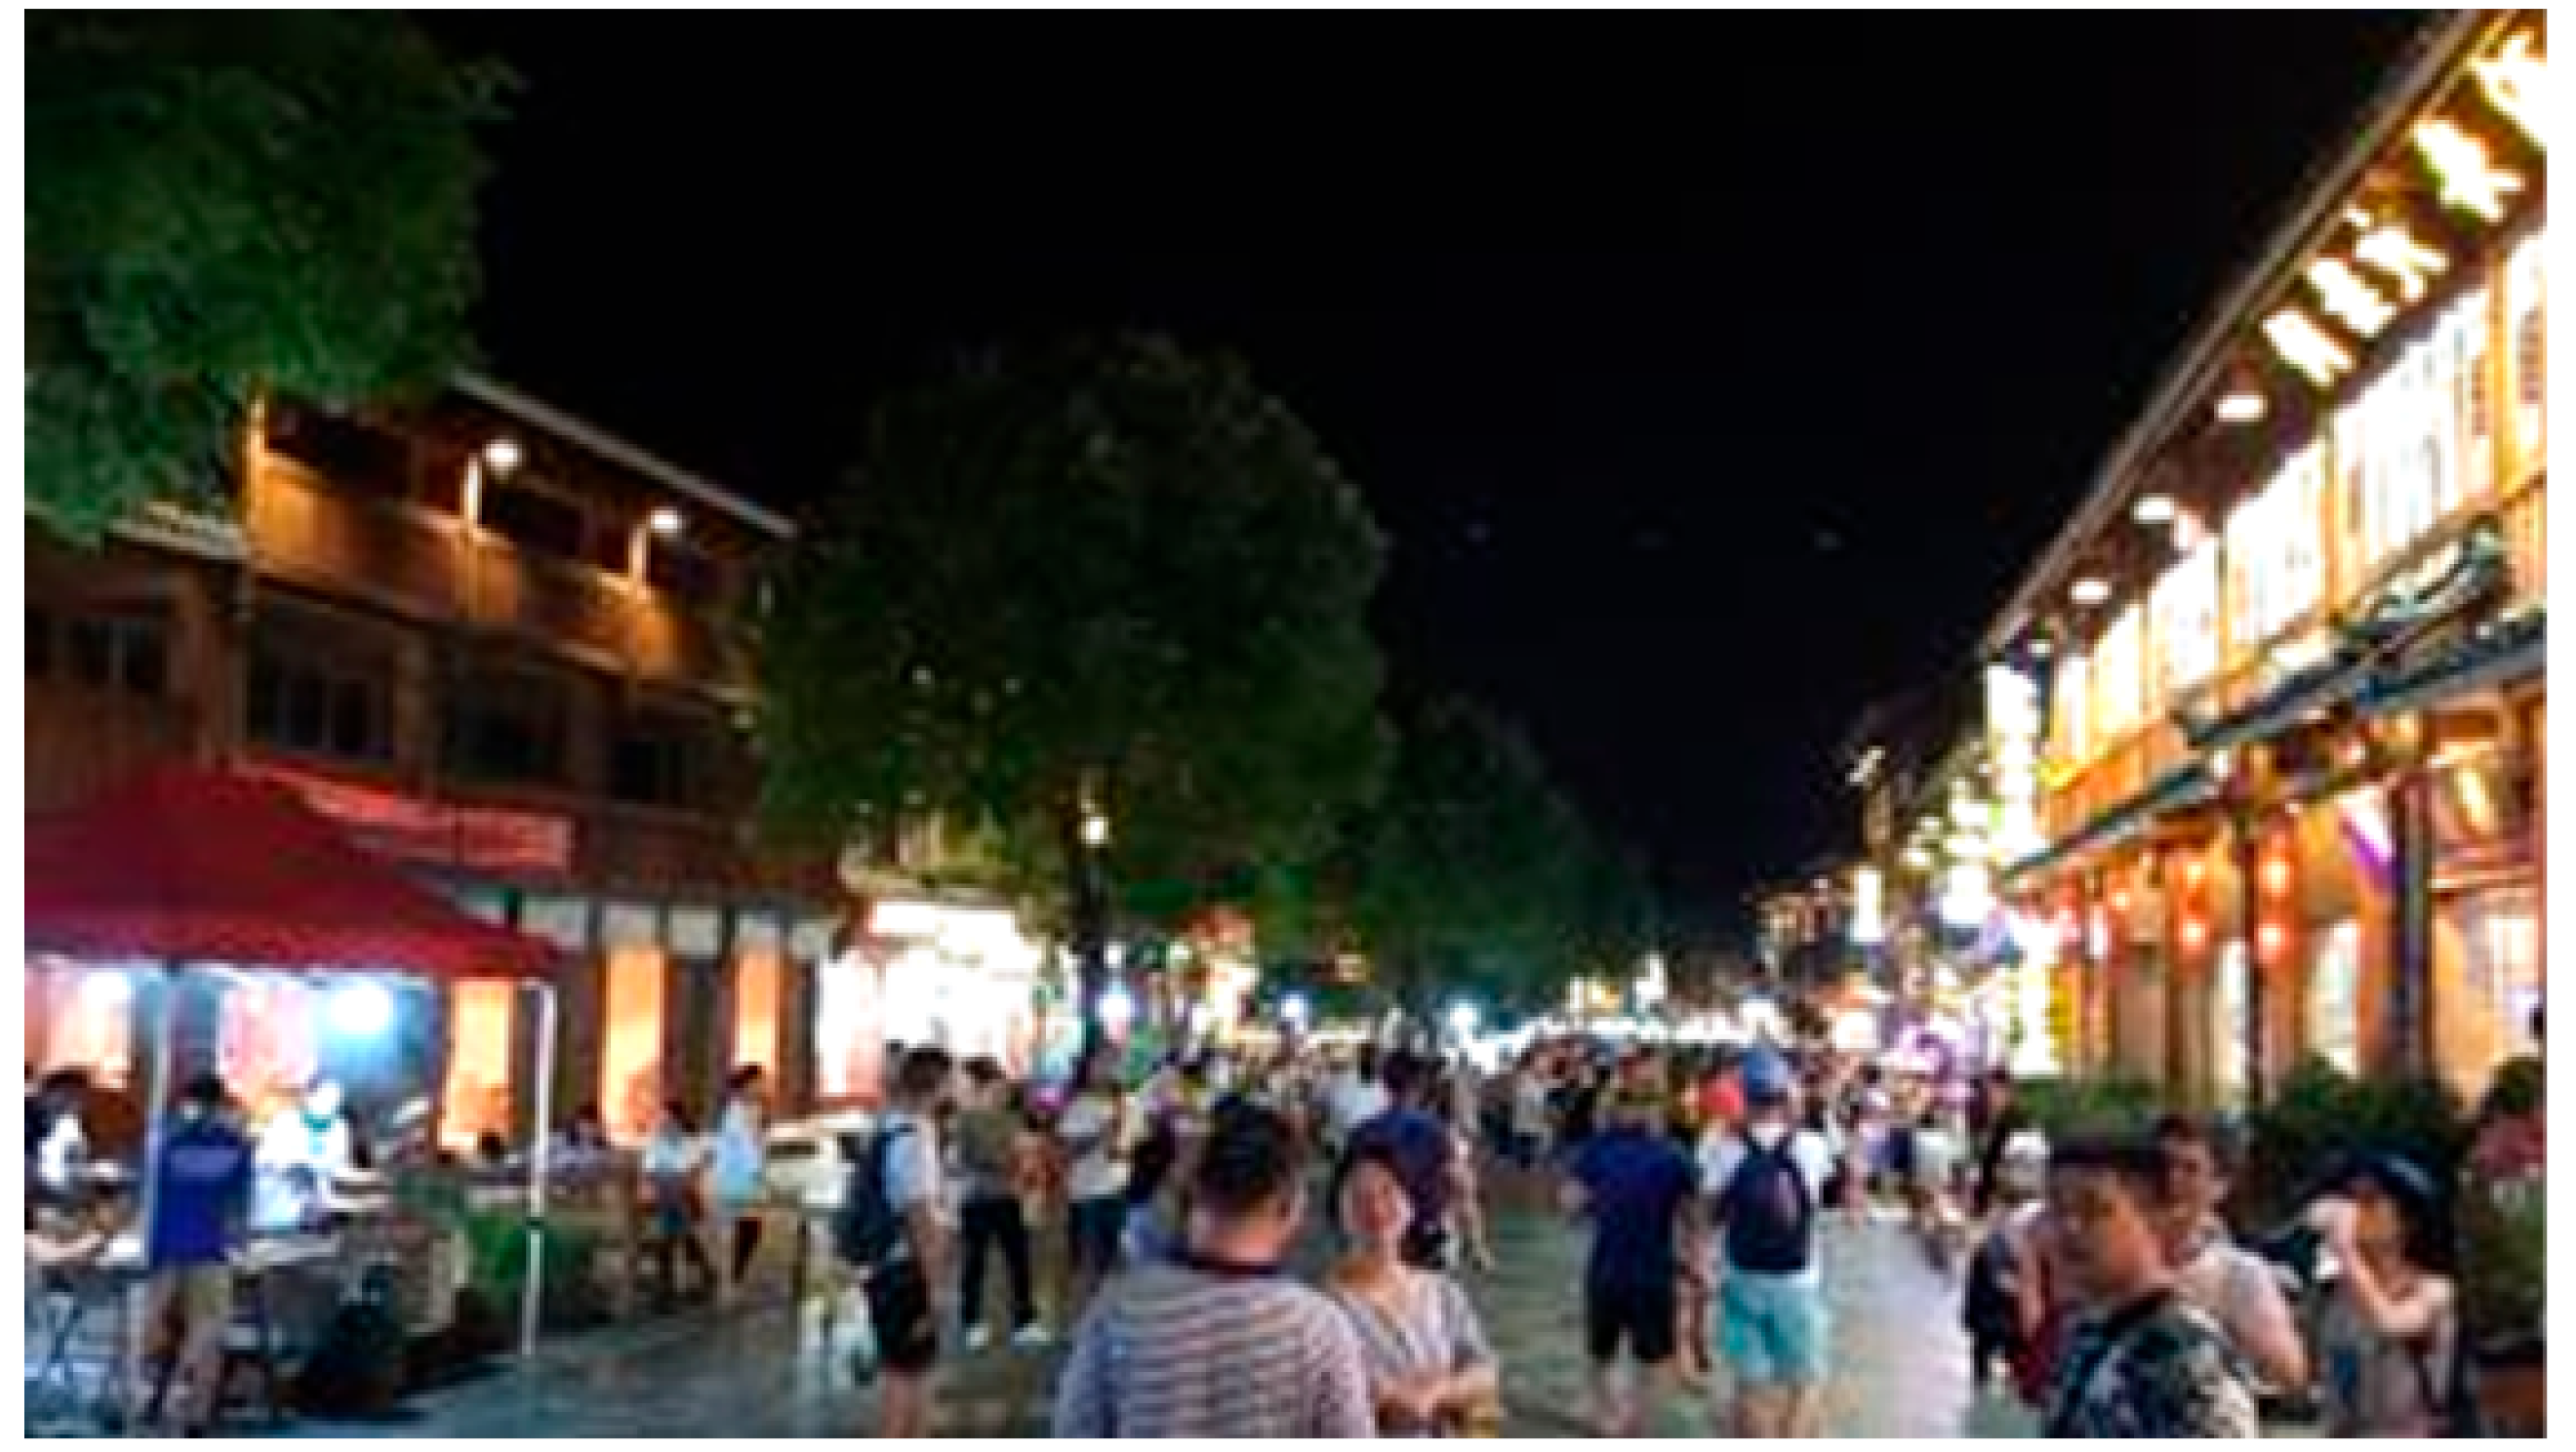 | This section of the road, with traffic, tourists and shops, is a main street of Zhaoxing Village. The overall sound environment is very noisy. Keynotes: Crowd and traffic noise, music amplified. Signals: Car horn. Soundmarks: None. |
| 4 | County Road 886 and Alley 4 to Zhituan Drum Tower | 01:26 | 60 | 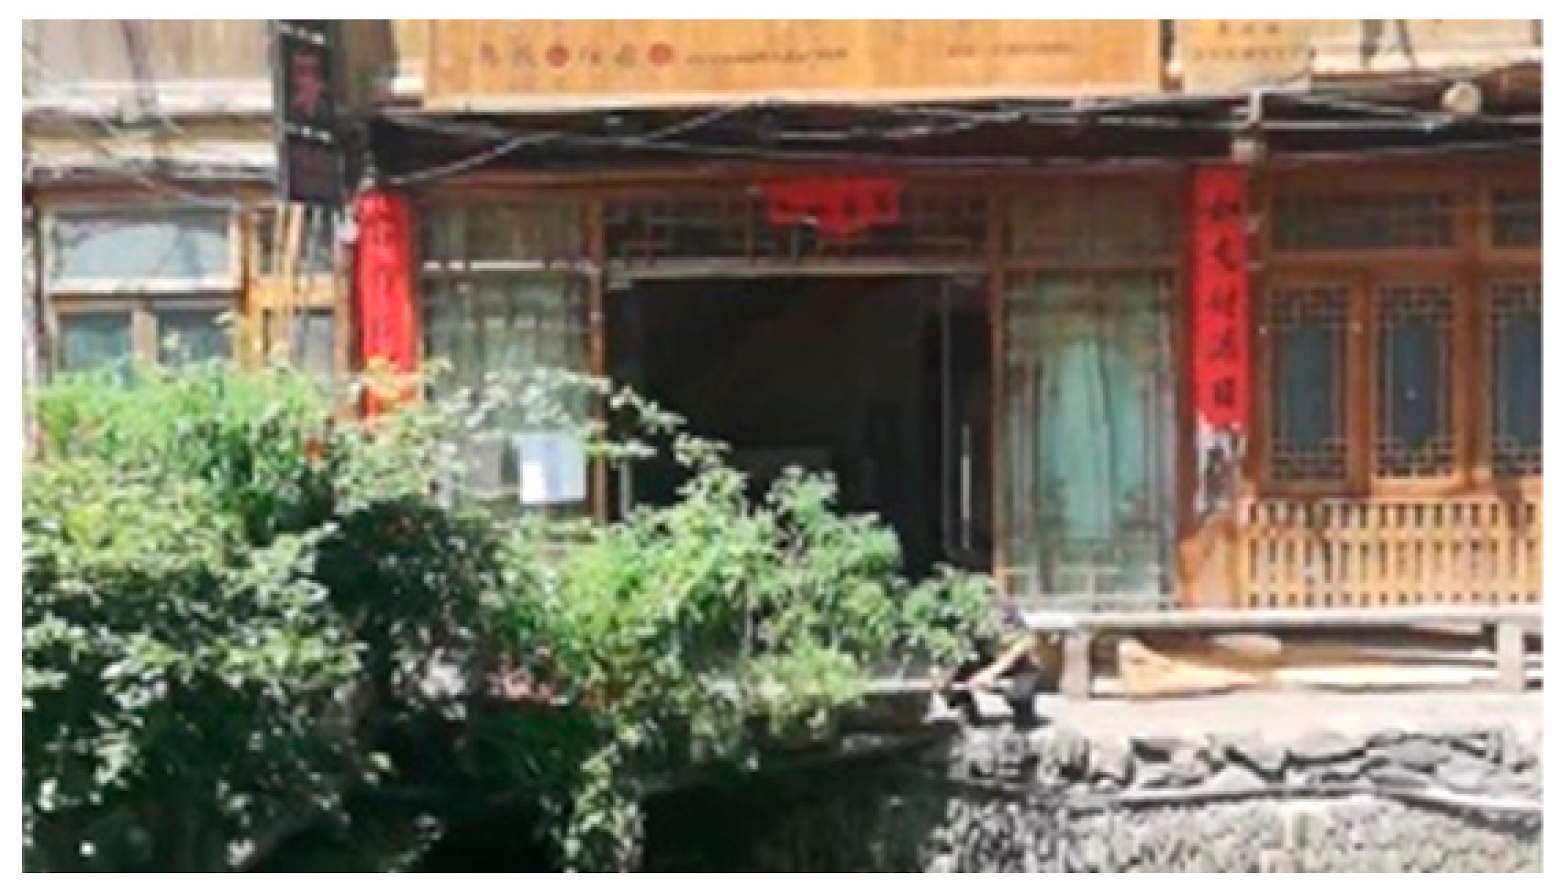 | This section to Zhituan Drum Tower is a small alley with lots of restaurants and hostels but fewer tourists on both sides of the river. The sound is dominated by the natural and the local people’s daily life sounds. Keynotes: Chirps, Water flow, Daily life. Signals: None. Soundmarks: Dialects (Dong Language). |
| 5 | Zhituan Drum Tower Trod | 01:15 | 53–57 | 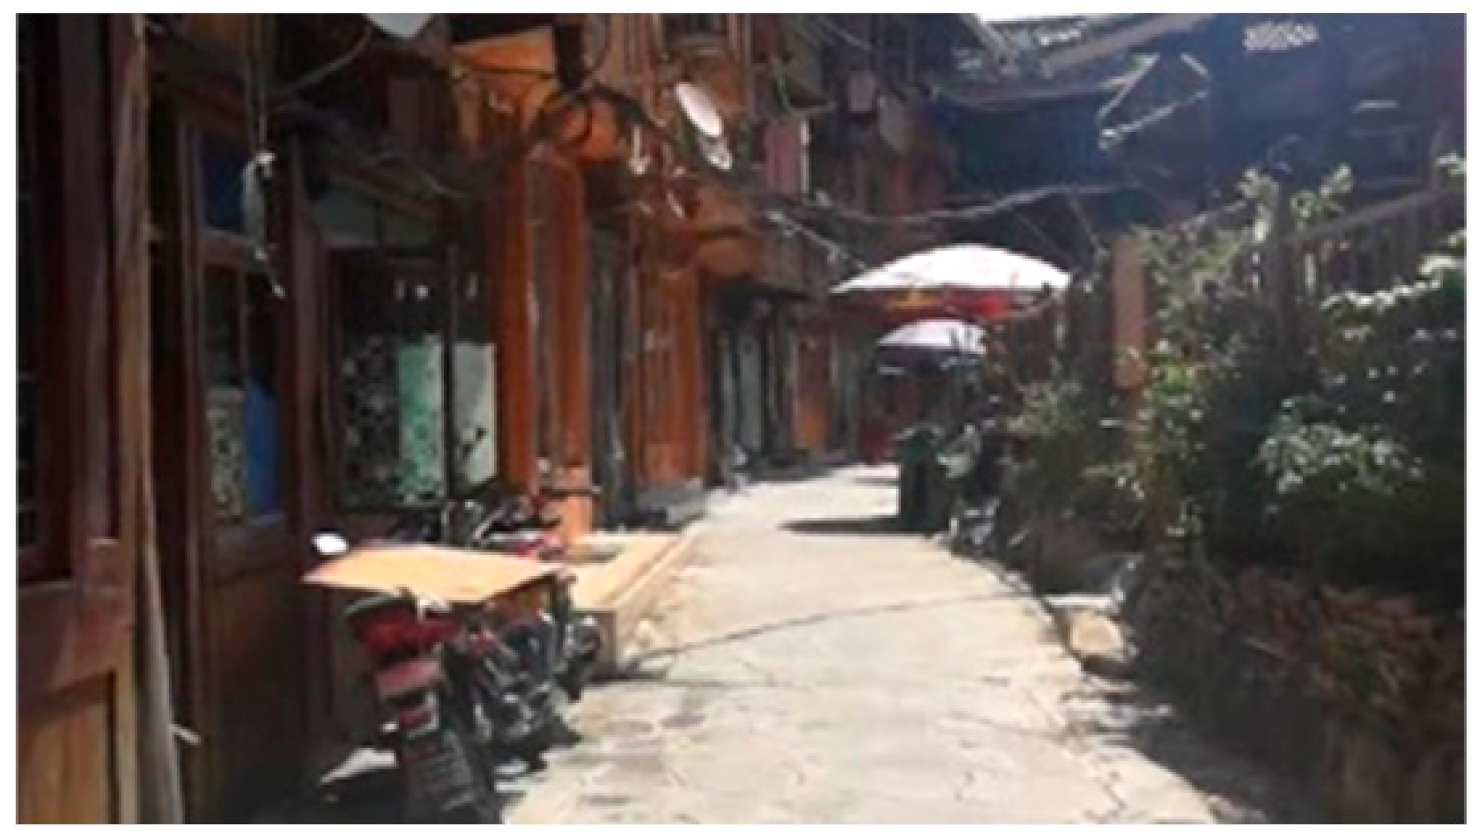 | The alleys opposite of Zhituan Drum Tower are mainly quiet resident areas with few tourists. Keynotes: Natural sounds, Crowd noise, Daily life. Signals: None. Soundmarks: Dialects. |
| 6 | County Road 886 and Alley 5 to Performing Area | 01:33 | 65 | 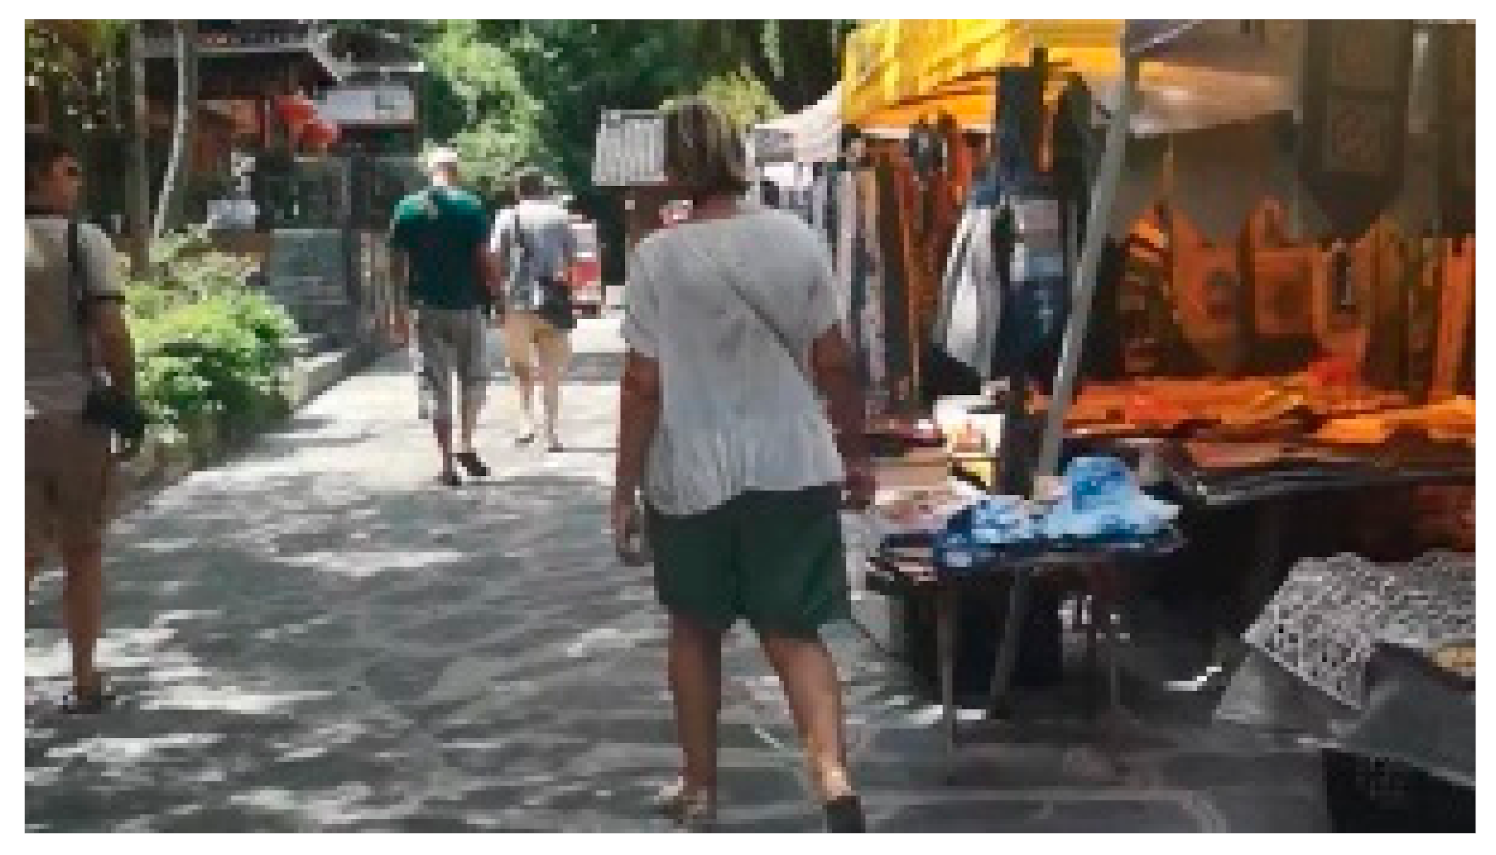 | This is a noisy road section with a lot of handcrafts or foods vendors. Keynotes: Tourists’ conversation, Traffic noise. Signals: Vendors’ broadcasting and barking sounds. Soundmarks: Sounds of hawking. |
| 7 | Zhituan Drum Tower to Xicai Alley | 06:23 | 58 | 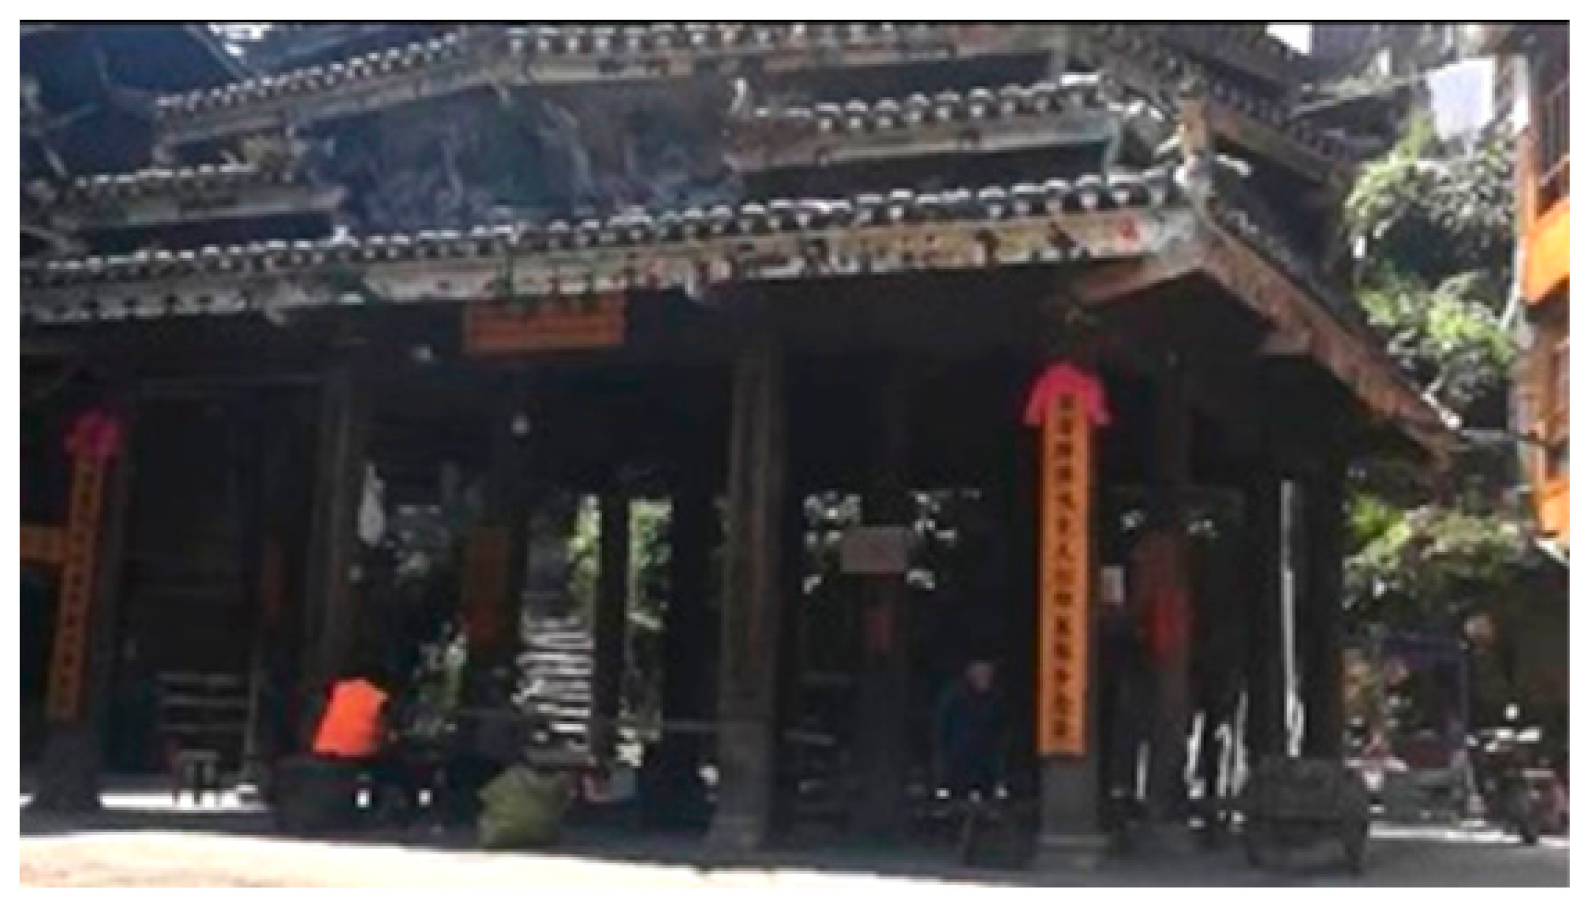 | This is a quiet alley with less local people. Keynotes: Natural sounds, Light dialects. Signals: None. Soundmarks: None. |
| 8 | Fork Road to North Gate | 03:24 | 66 | 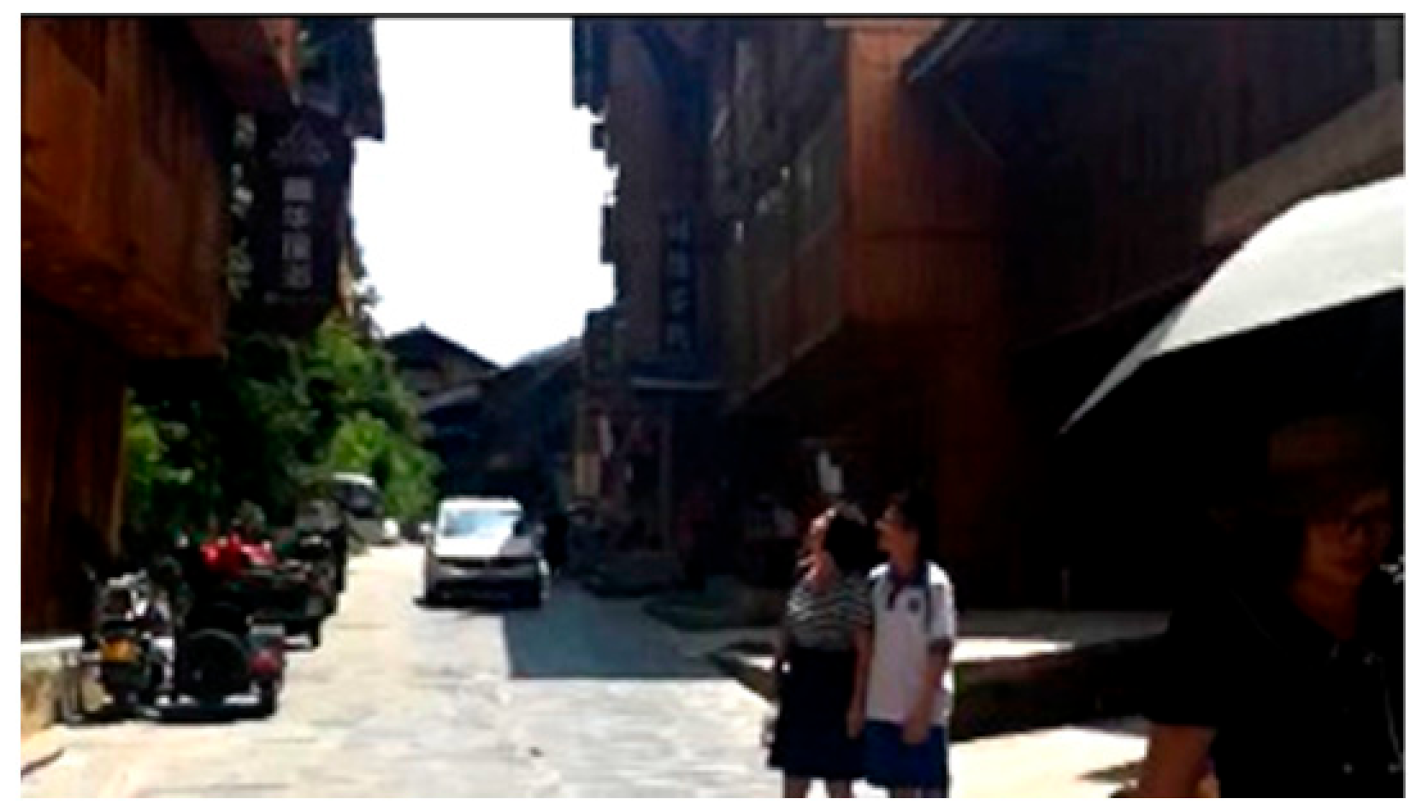 | This is a noisy resident section with lots of parking areas and a few guesthouses. Keynotes: Daily life, Traffic noise. Signals: None. Soundmarks: None. |
| 9 | Fork Road to Yituan Drum Tower | 05:22 | 62 | 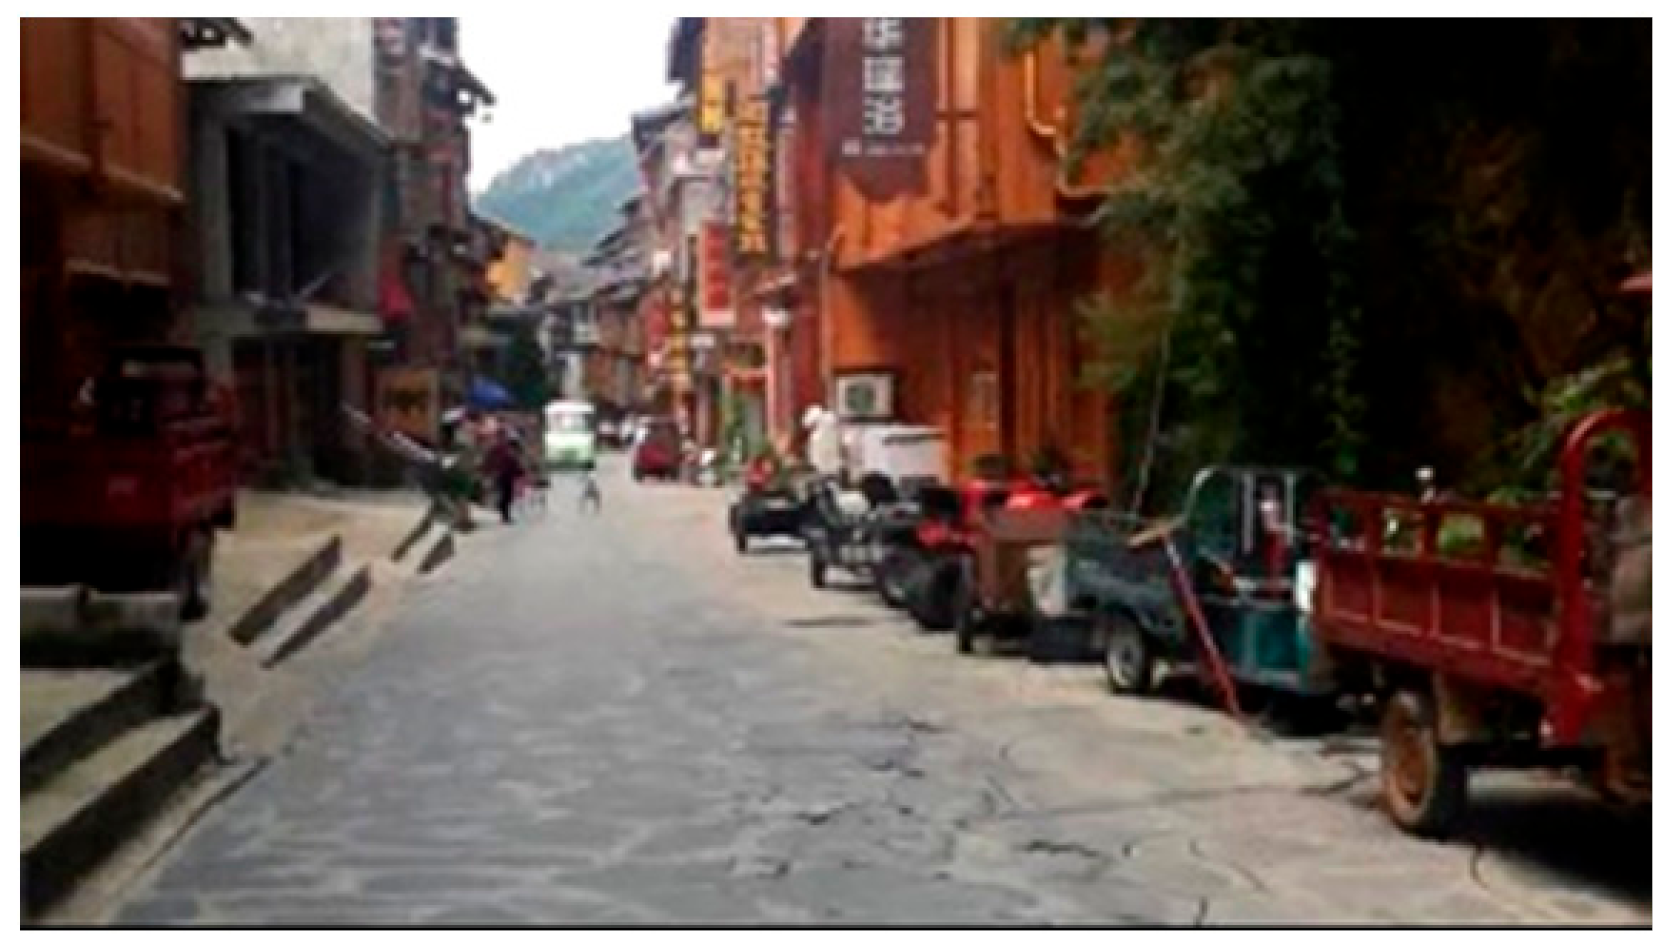 | This noisy section with a few shops, restaurants and many pedestrians is the eastern end of the main street. Keynotes: Natural sounds, Light dialects and traffic. Signals: None. Soundmarks: None. |
| 10 | Yituan Drum Tower to Main Street | 01:08 | 72 |  | This section is passing Yituan Huaqiao Bridge and a small market. Since the Yituan Drum Tower is close to the resident areas and the Main Street, the sound environment is relatively noisy. There are so many bars located across of the main street and the river, and they are full of people at night. Keynotes: Natural sounds, Business noise. Signals: None. Soundmarks: None. |
| Riverside Soundwalk | |||||
| I | Main Gate to Yituan Drum Tower (East side) | 11:58 | 55–75 | 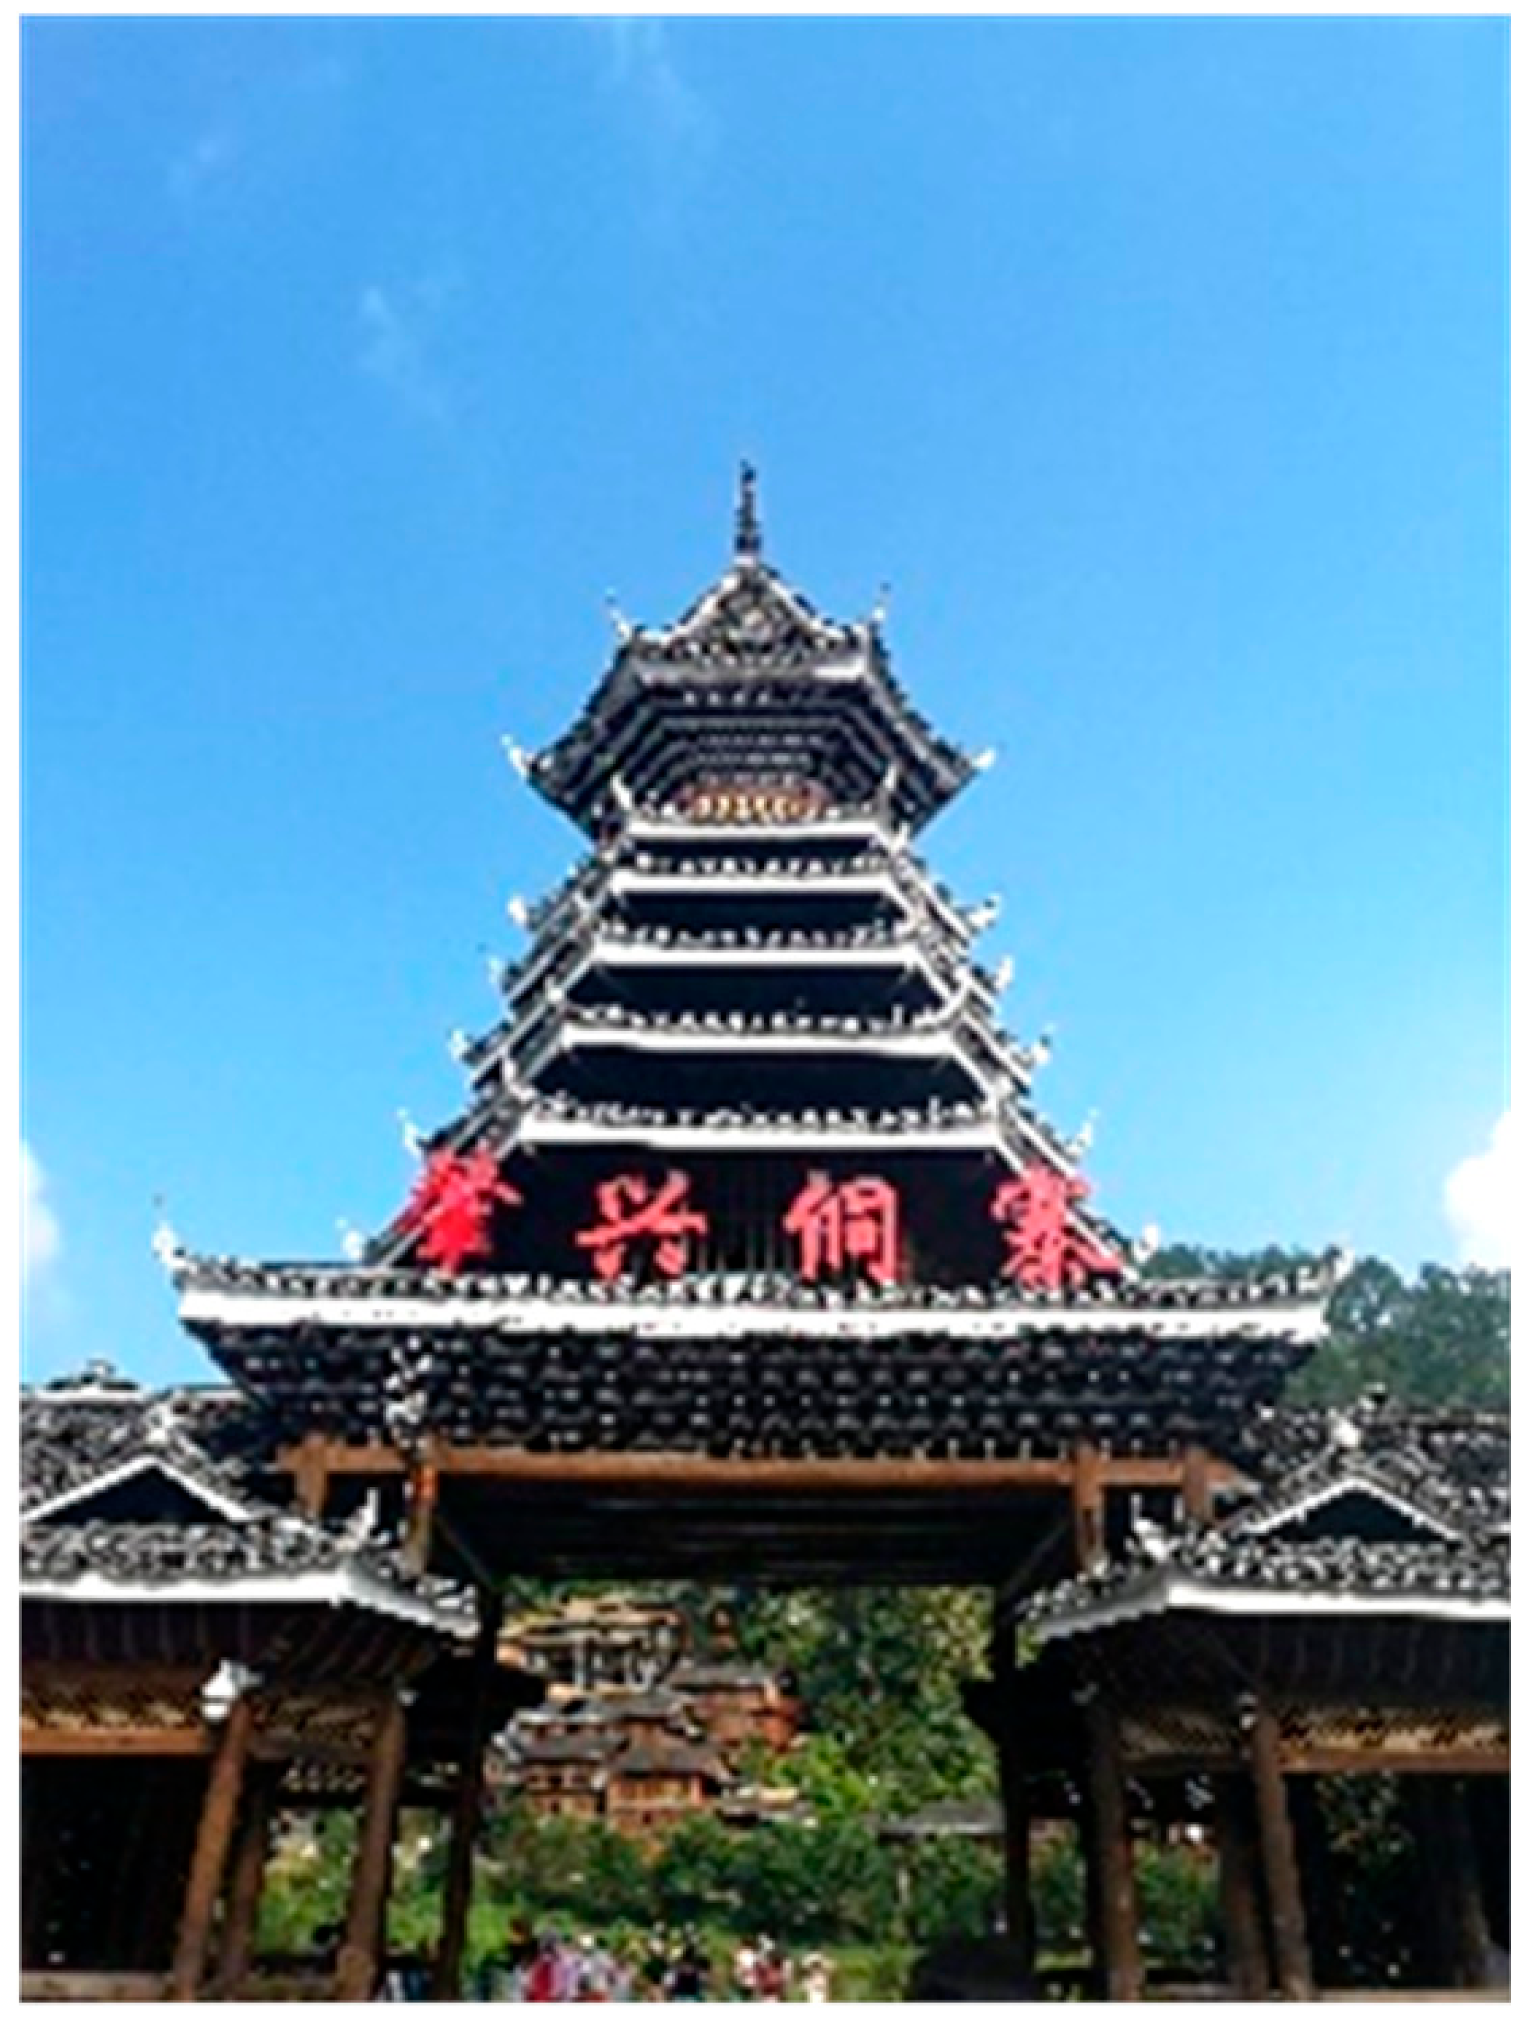 | This road is a trail along the river with the local house buildings on the left side, the river on the right side and a few shops on both sides. The sound environment is dominated by low-density natural and pedestrian sounds. The sound level starts at 55 dBA lower, then grows higher, and there is not a commercial atmosphere obviously. Keynotes: River sounds. Signals: Beat piling. Soundmarks: None. |
| II | Yituan Drum Tower to Bridgehead Bar | 04:13 | 50–55 | 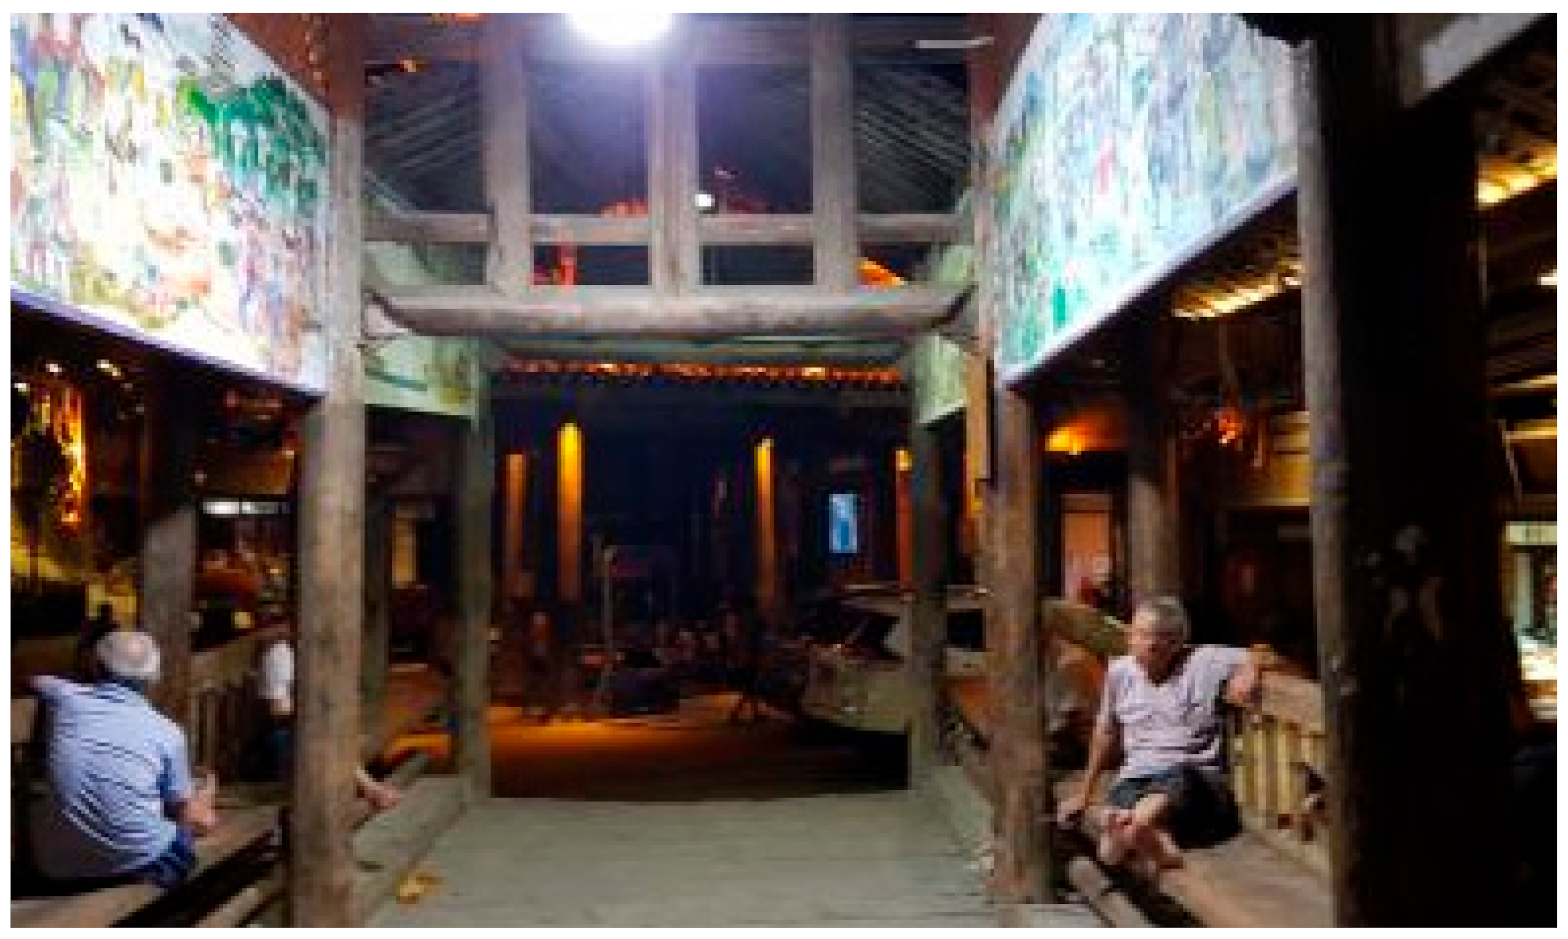 | With the river on the left side and a few inns on the right, this promenade is sparsely populated with high-density natural sounds as the main tone of an average sound pressure level of 55 dBA. Keynotes: River sounds. Signals: None. Soundmarks: None. |
| III | Bridgehead Bar to Dong Garden | 03:43 | 60–70 | 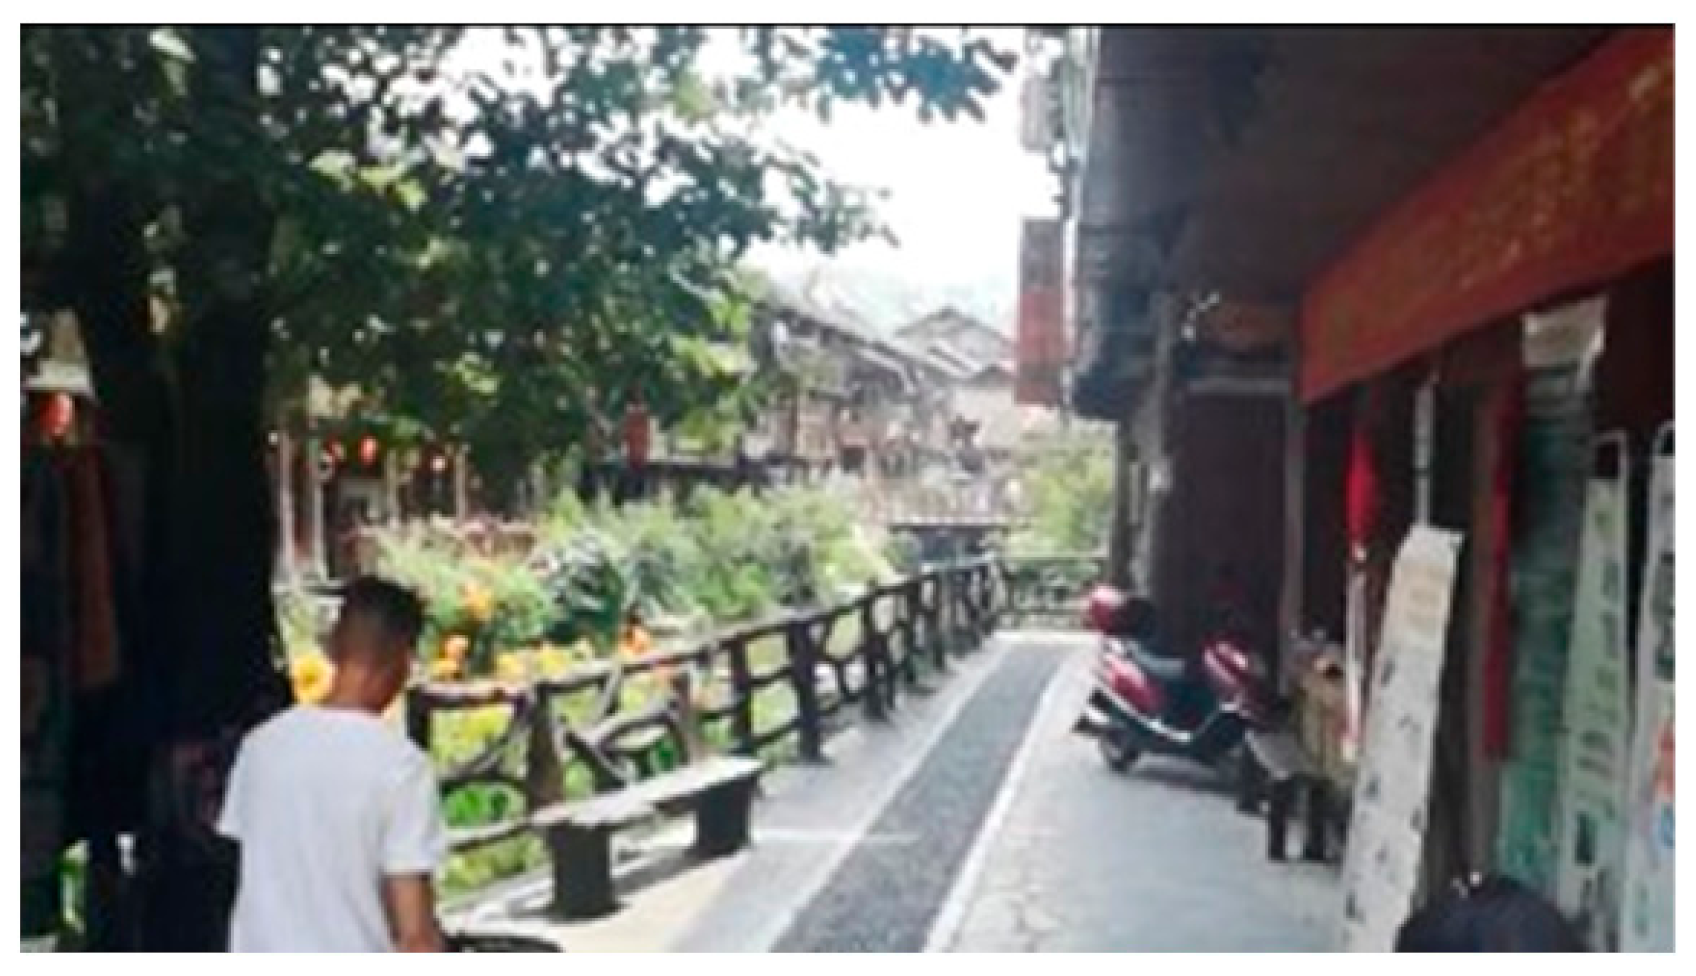 | This commercial route in the village with the natural and business sounds mostly around 70 dBA is mostly filled with tourists and shops. There are so many bars located across the main street and the river, and they are full of people at night. Keynotes: Natural sound; Business noise. Signals: None. Soundmarks: None. |
| IV | Dong Garden to Qifeng Pavilion | 09:13 | 55–65 | 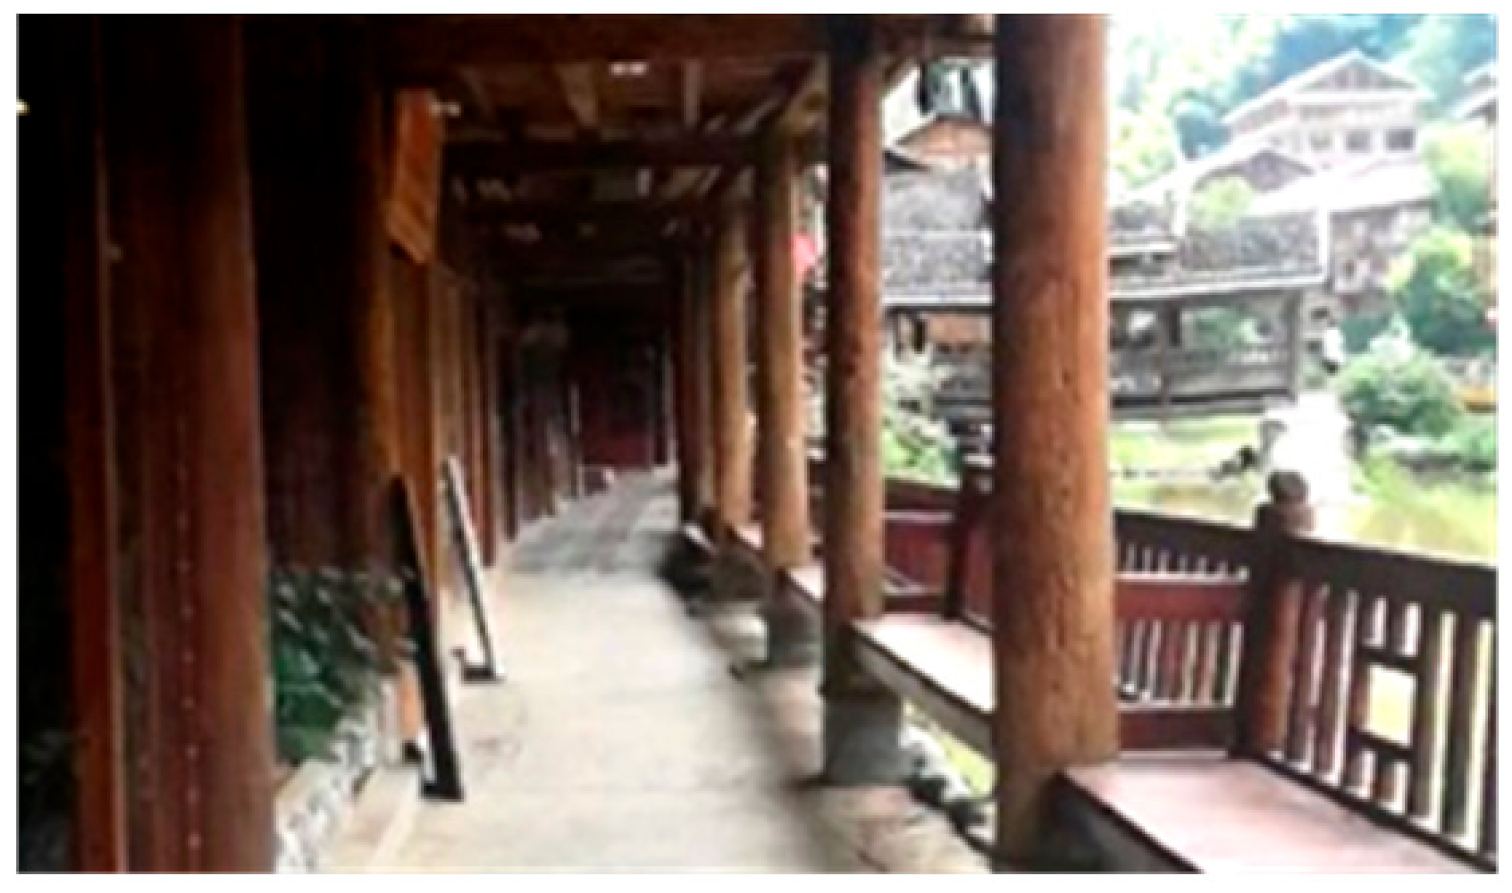 | This promenade is separated by a small river-branch but with the same atmosphere of business at a lower sound pressure level around 60 dBA. Keynotes: Natural sounds; Business noise. Signals: None. Soundmarks: None. |
| V | Yituan Drum Tower to Main Gate (West side) | 15:47 | 55–75 | 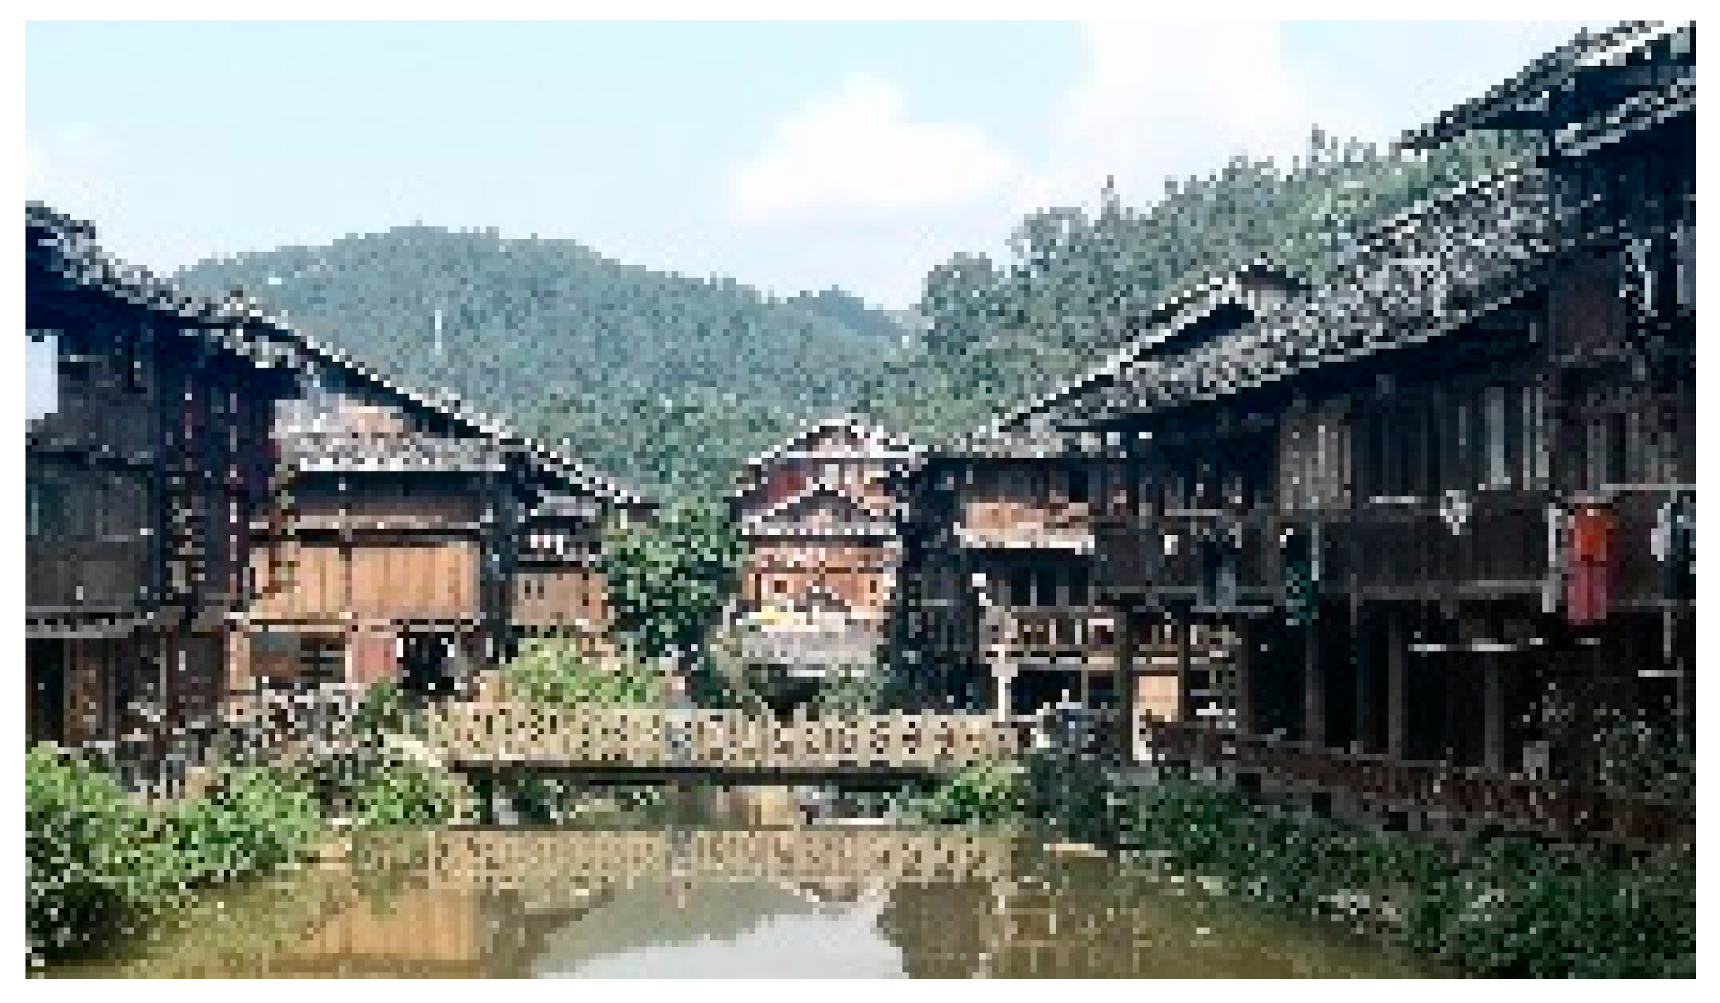 | There are mostly resident houses with low-density natural sounds, crowd noise and a few construction sounds in this area. Keynotes: Natural sounds, crowd noise. Signals: Construction sounds. Soundmarks: None. |
| Main Nodes | |||||
| A | Main Gate | 01:09 | 56 | 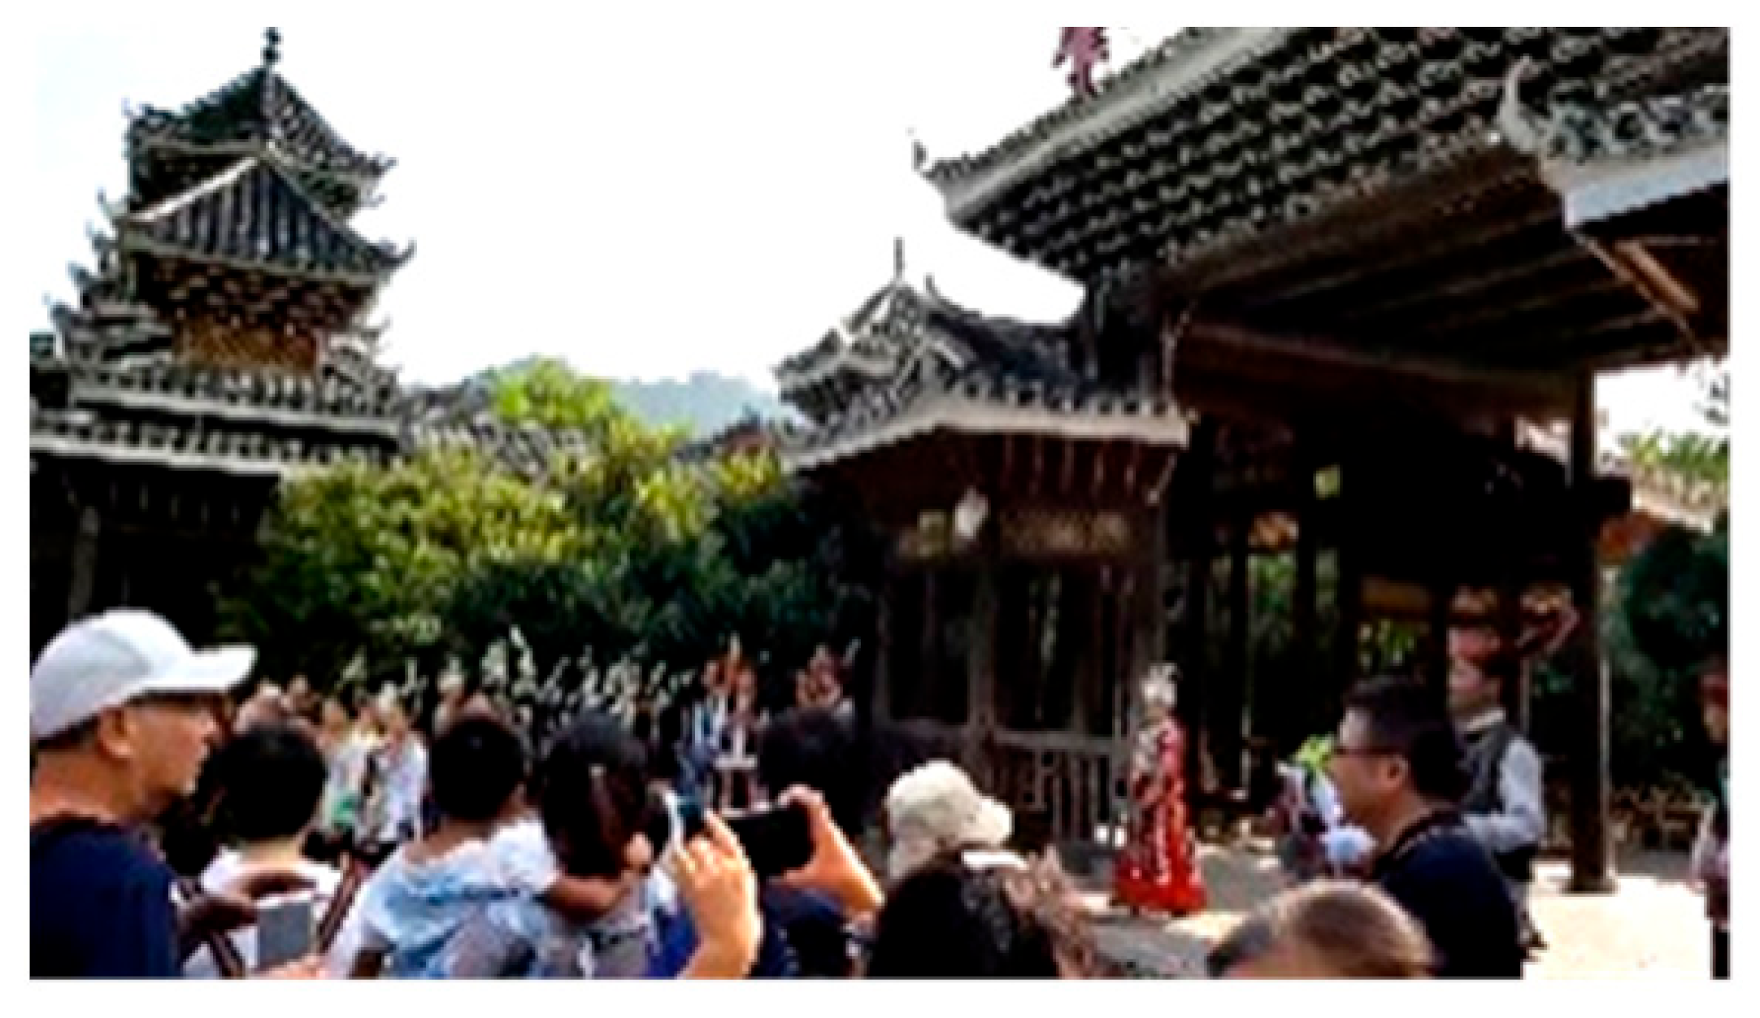 | The village gate is the entrance to Zhaoxing Dong. Every morning and noon, the people of the Dong ethnic group welcome guests from afar with an original ecological performance. Generally, the sound level is moderate, with the natural sound and the conversation sound of tourists. Few people access the village by the main gate at night. Keynotes: Winds, Water sounds, Tourists’ noise. Signals: Guide broadcasting. Soundmarks: Traditional music and dancing performance (at special times). |
| B–G | Museum Sound and Multimedia Installations | 05:25 | 51–68 |  | There are many sound and Multimedia Installations in this Museum, including Lusheng (68 dBA), Kuanyeu (56 dBA), Dong Opera (64 dBA), Kam Grand Choirs (Dong Grand Song, 51 dBA), a Wax Printing Craft performance (55 dBA) and a Dong Custom exhibition (59 dBA). Keynotes: Quiet and silence with low tourists’ noise. Signals: None. Soundmarks: Traditional music and sounds. |
| H | County Road 886 Intersection | 00:30 | 68 | 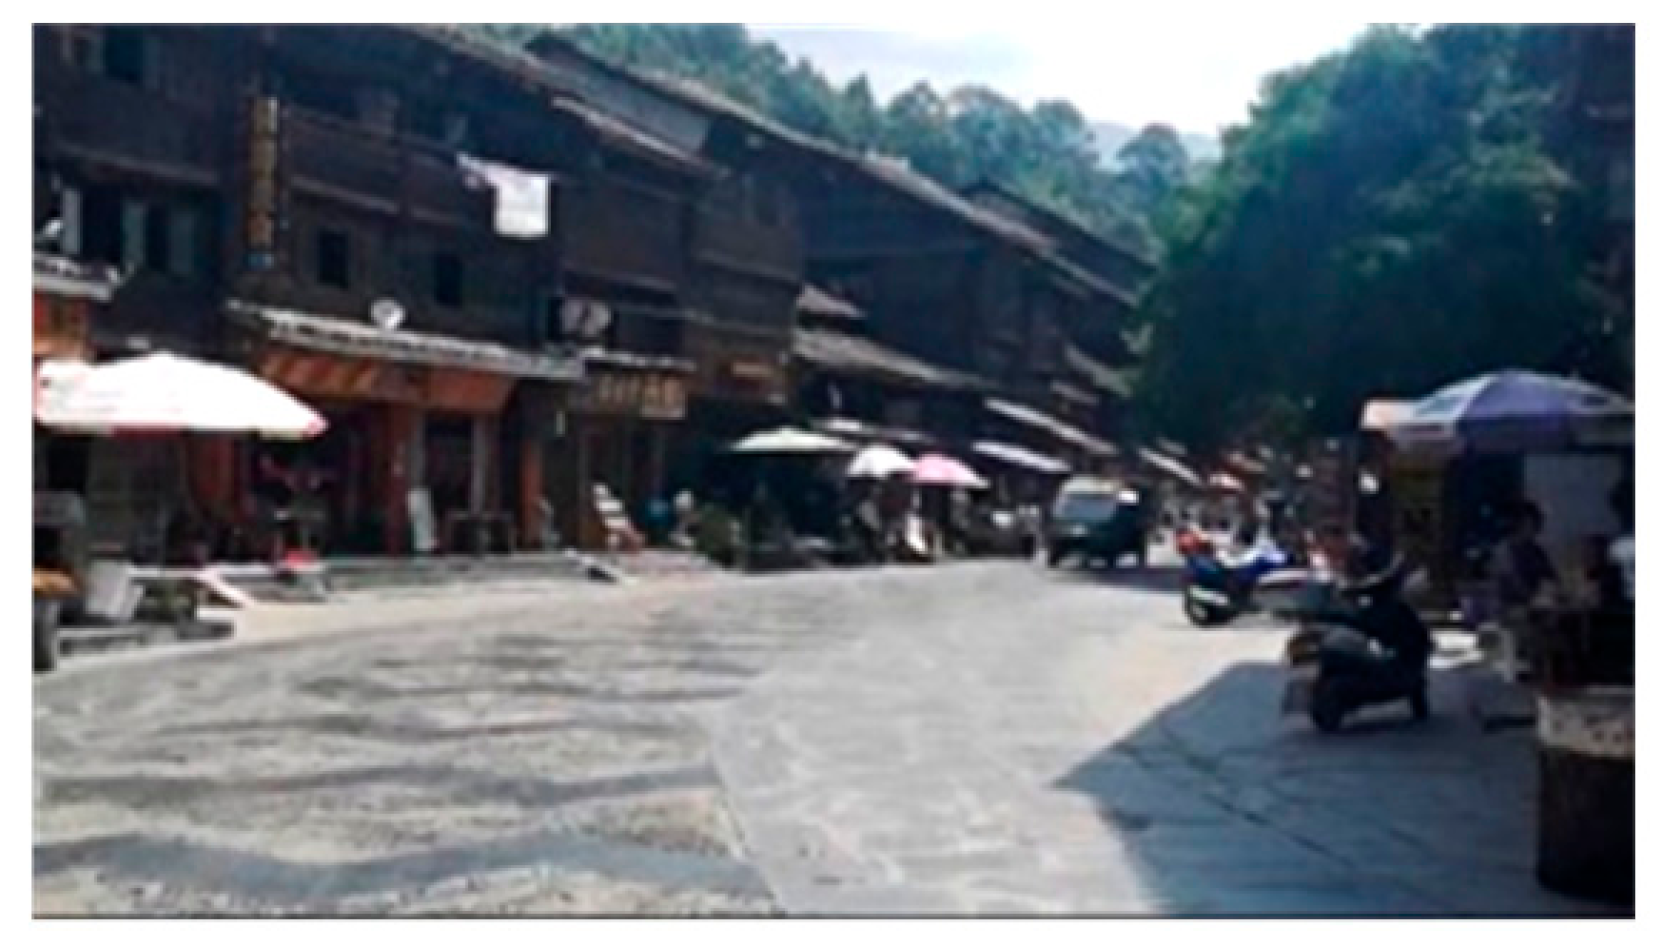 | This intersection is located at the junction of County Road 886 and Alley 1, where it is close to the vegetable market. Therefore, so many motors pass through and the sound pressure level is relatively higher. Keynotes: Traffic noise. Signals: None. Soundmarks: None. |
| I | Dong Tea Time | 00:44 | 69 | 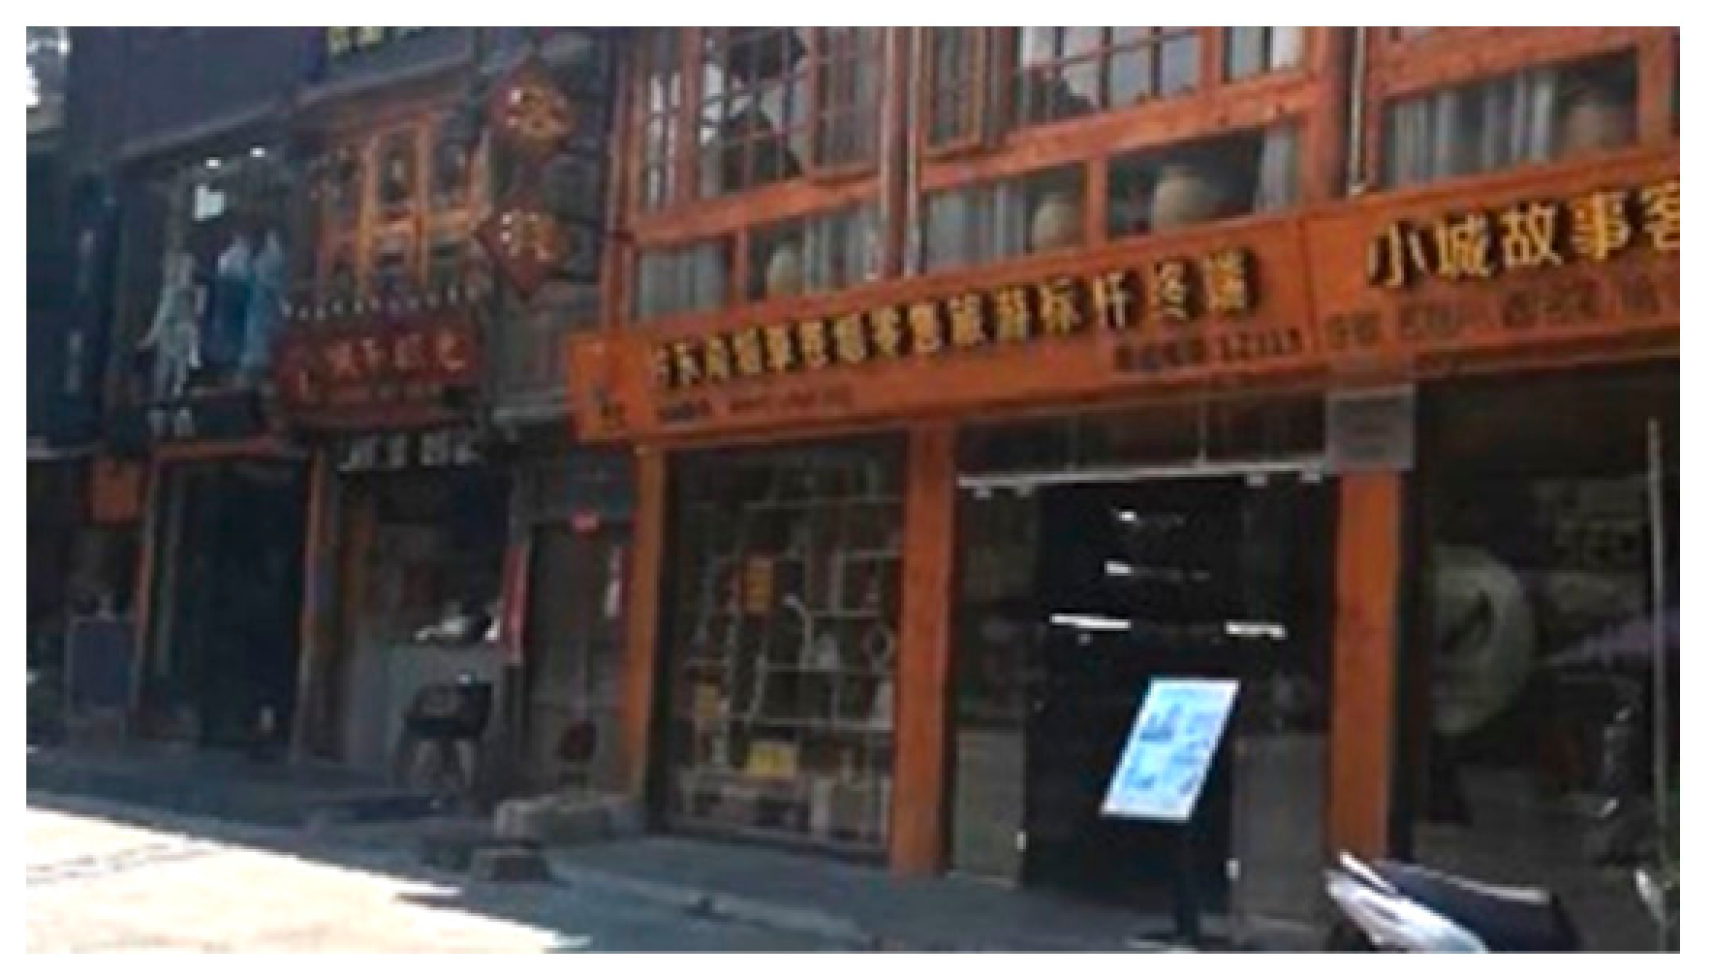 | Dong Tea Time is a milk tea shop with some pop music at a high sound pressure level. Keynotes: Loud background music, Crowd noise, Traffic noise. Signals: None. Soundmarks: None. |
| J | Xintuan Drum Tower | 00:30 | 68 | 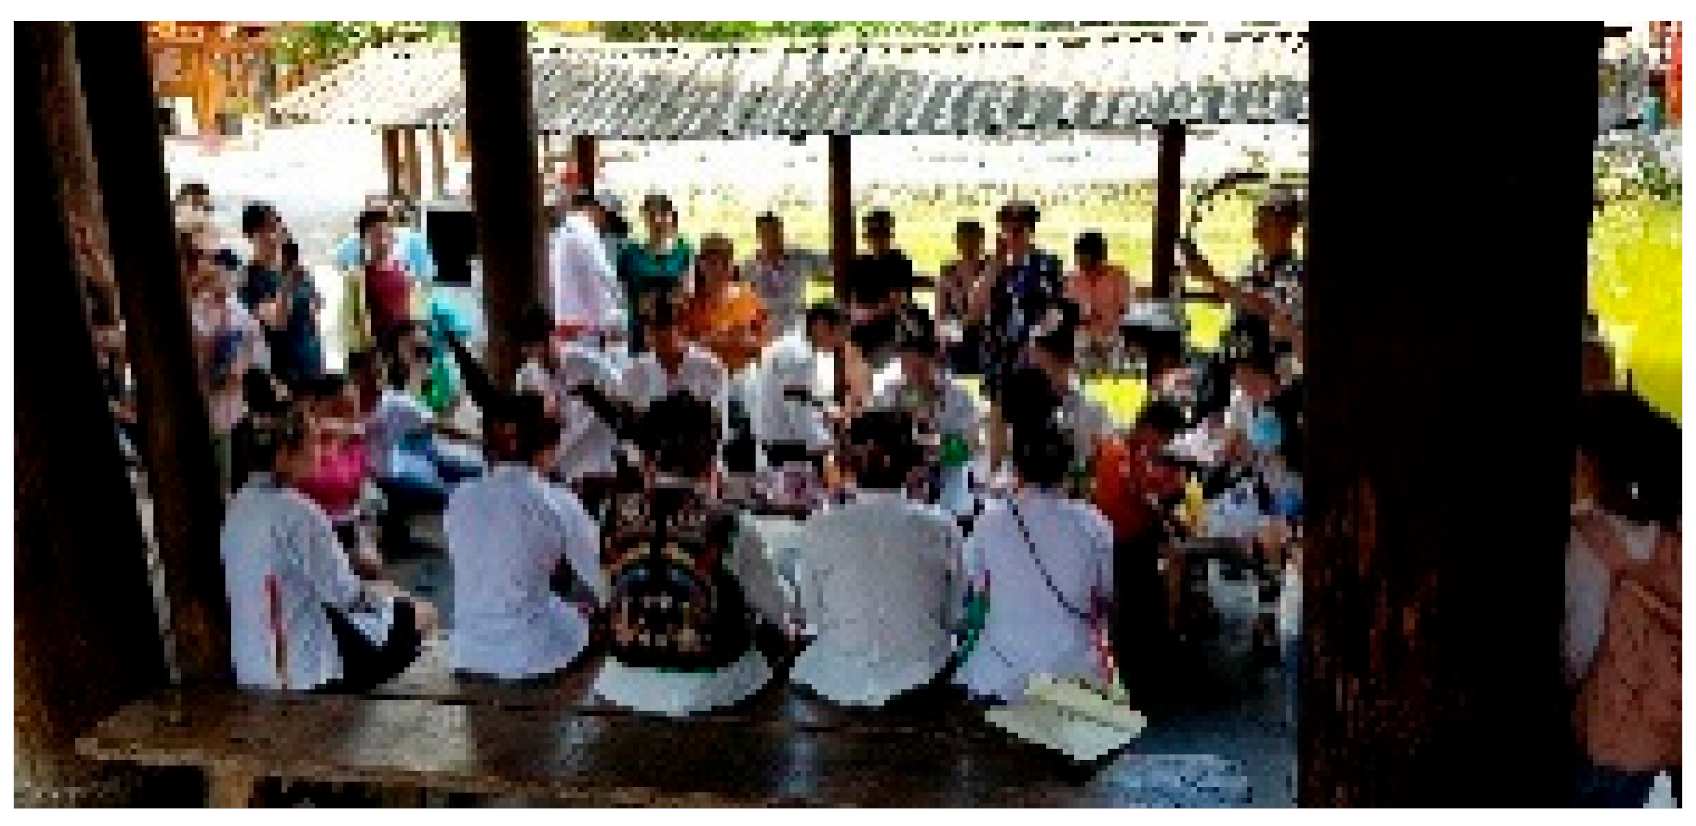 | Xintuan Drum Tower is the first drum tower that can be seen after the Main Gate. It is close to County Road 886 in a noisy sound environment. Keynotes: Noise, Traffic noise, Music amplified. Signals: Drum beat (at special times). Soundmarks: Traditional music and dancing performance (at special times), Dialects. |
| K | Zhituan Drum Tower | 00:37 | 59 |  | Zhituan drum tower is located in alleyway 4, adjacent to the river, with few tourists coming and going. Most of the locals take a rest here, and the sound environment is relatively quiet. Keynotes: Chirps, Daily life, Traffic noise, Music amplified. Signals: Drum beat (at special times). Soundmarks: Traditional music and dancing performance (at special times), Dialects. |
| L | Performance Area | 01:25 | 65 | 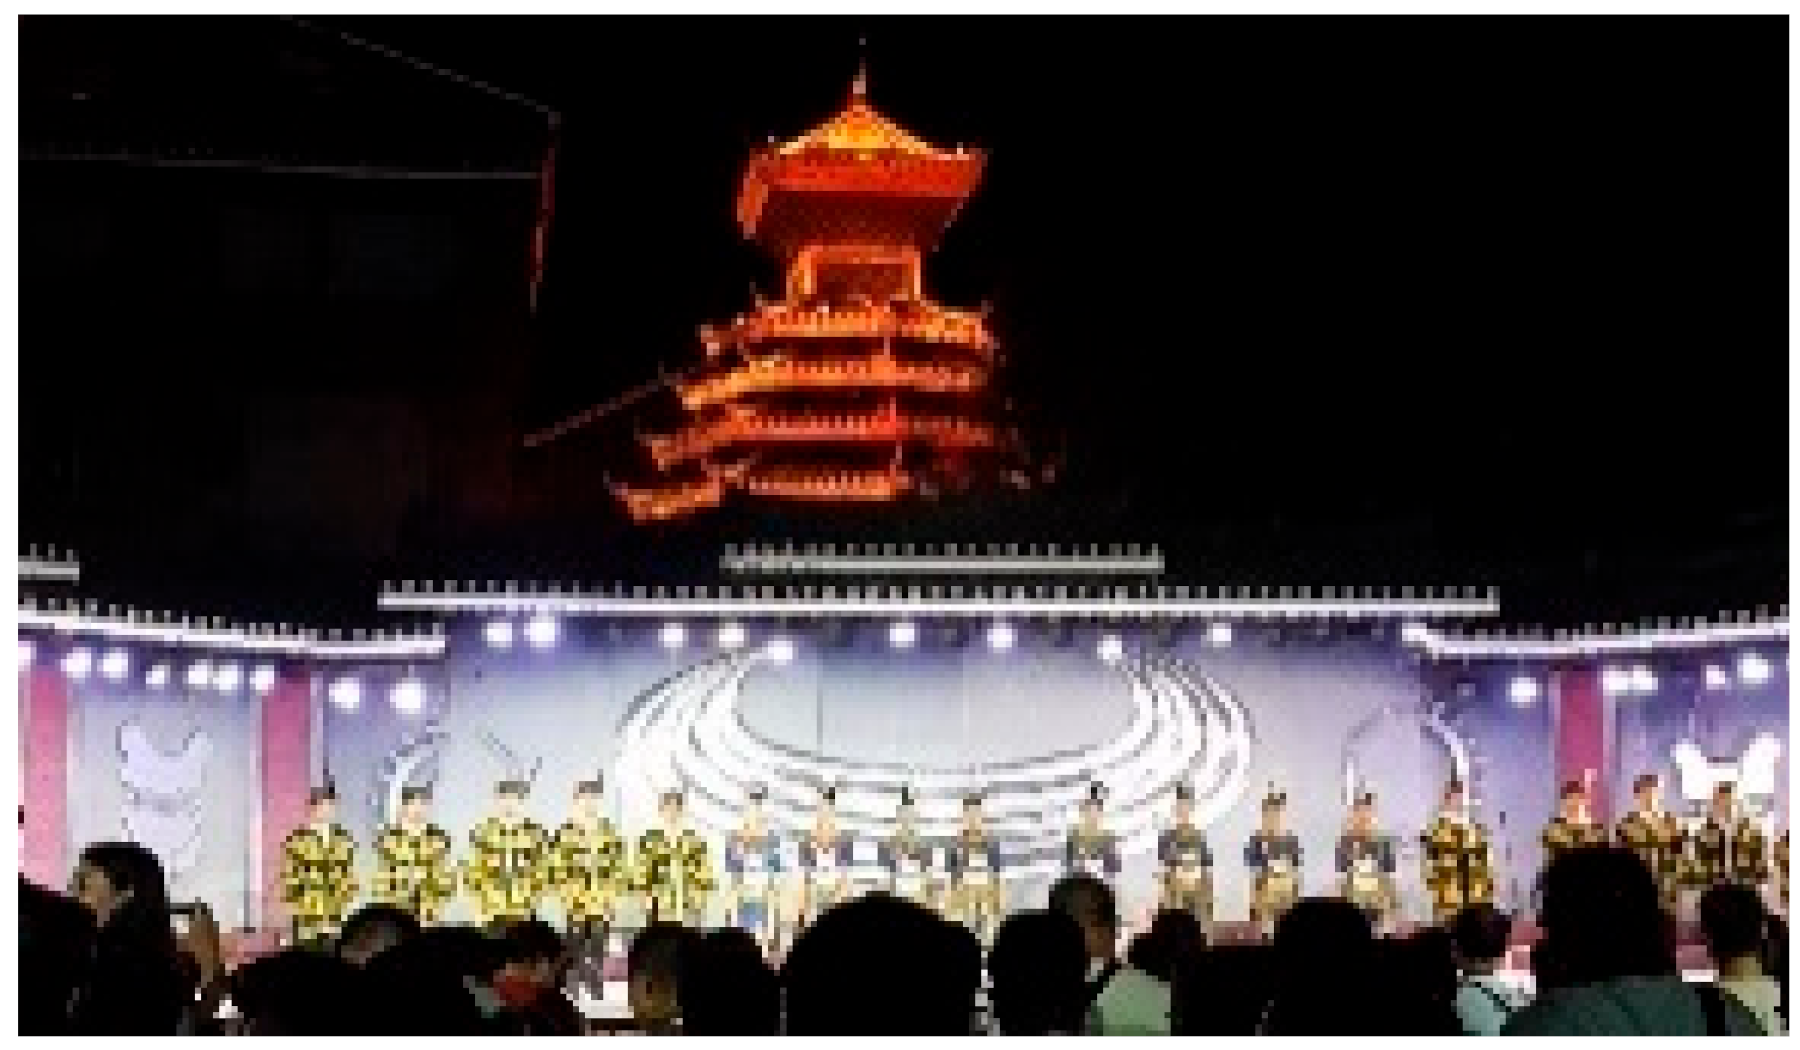 | The performance area at the back of the Zhituan Drum Tower is located in Alley 5. It is generally quiet in the daytime, but full of vivid traditional music and dancing performing sounds at night. Keynotes: Quiet (daytime), Live sounds (night). Signals: None. Soundmarks: Traditional music and dancing performance (at night). |
| M | Teaching House for the Dong Grand Song | 03:00 | 65 | 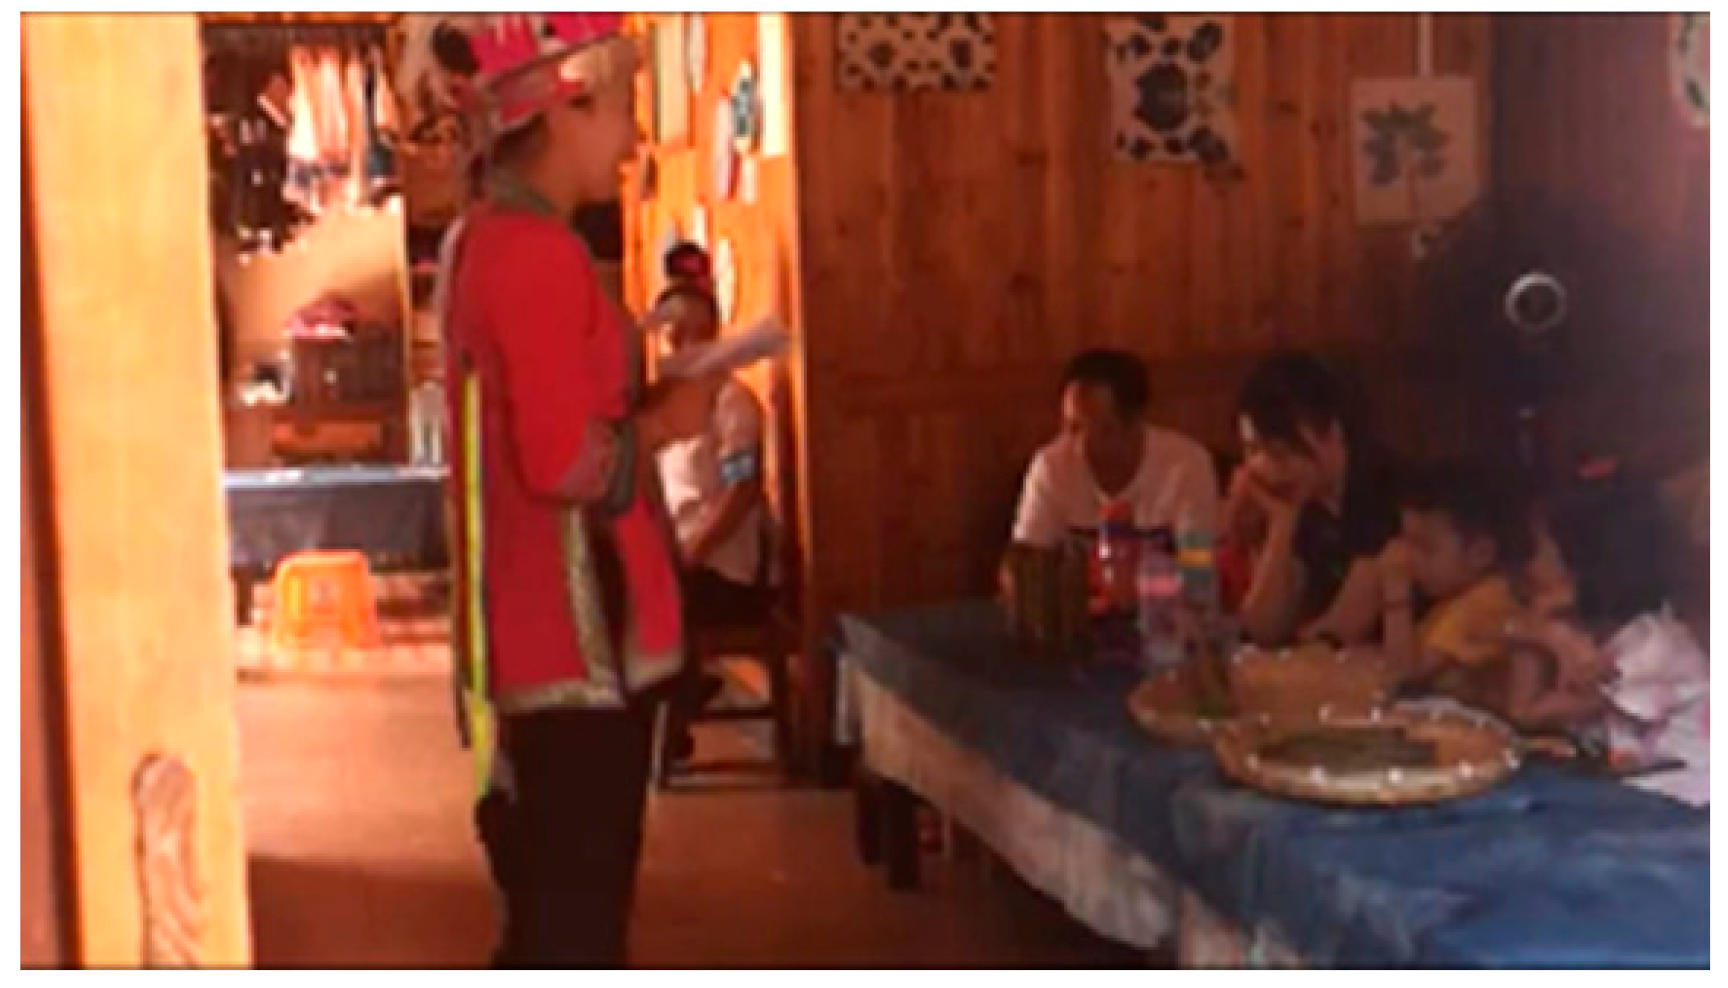 | The Teaching House for the Dong Grand Song is located in a small shop next to the Lituan Drum Tower. A local teaches children to learn how to the sing dong grand song. Lovely and musical songs and some chatting in dialects can be heard during the Dong Grand Song classes for the children. Keynotes: Unknown. Signals: None. Soundmarks: Dong Grand Song. |
| N | Lituan Drum Tower | 05:04 | 62 | 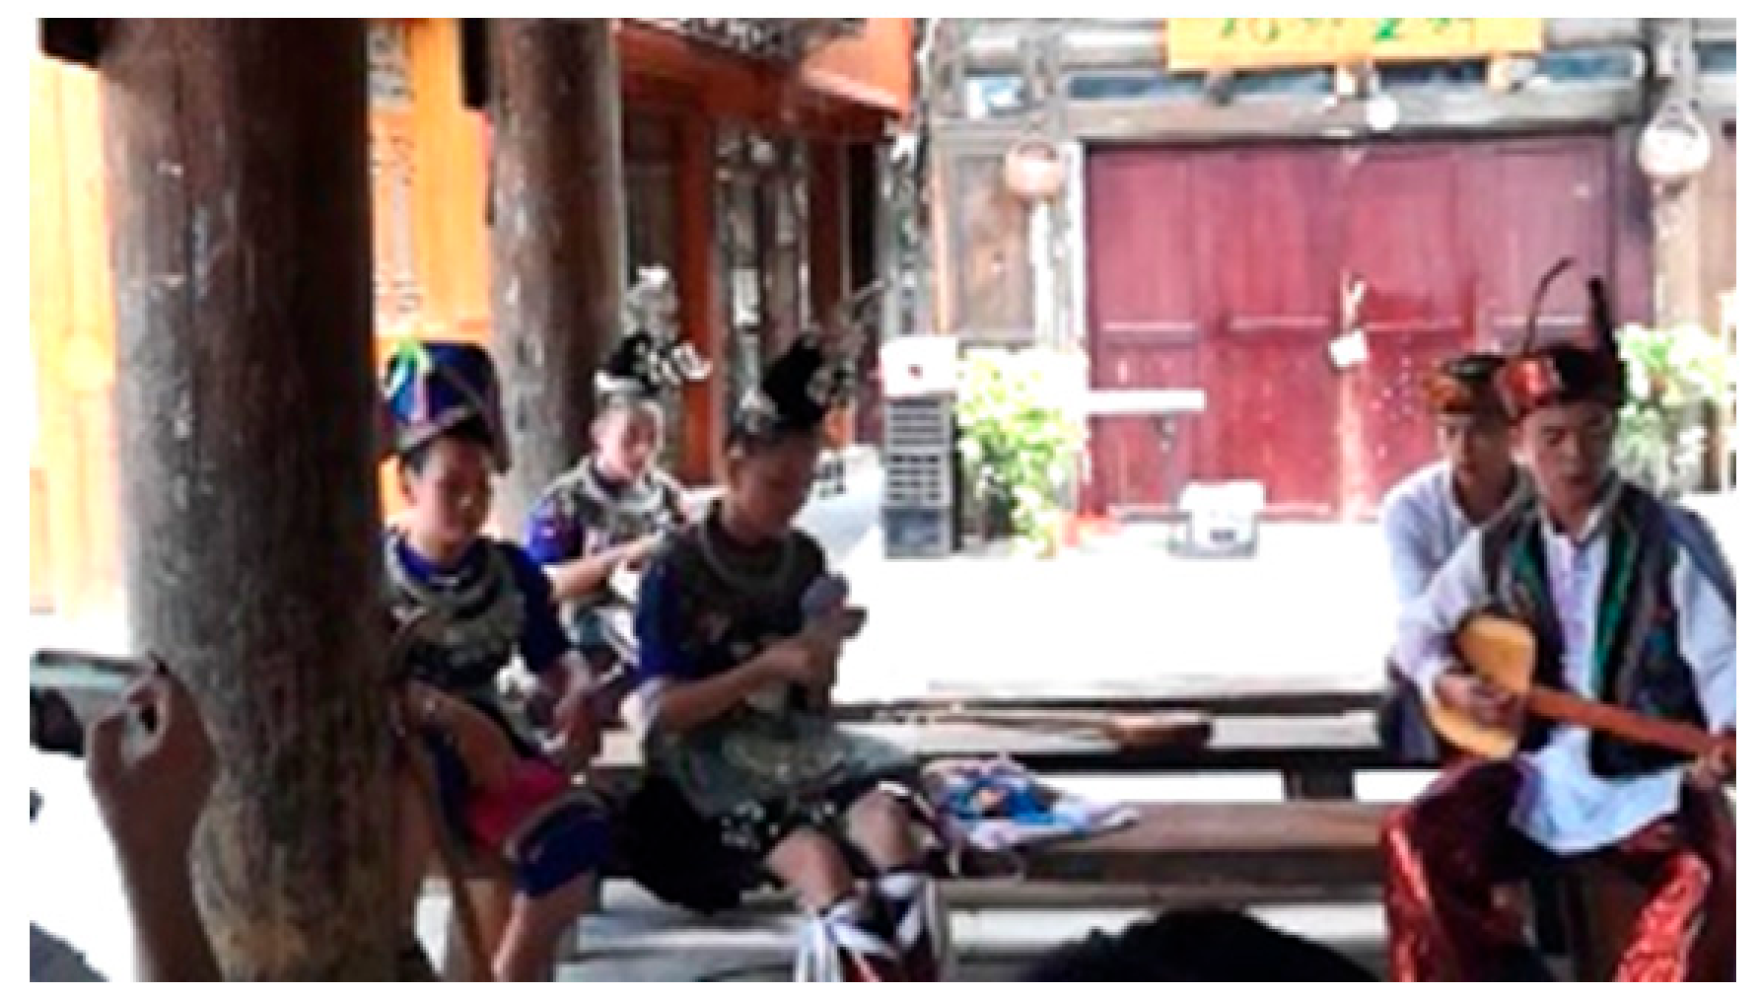 | Quiet Lituan Drum Tower with few tourists is located in Alley 6. Keynotes: Natural sounds. Signals: Drum beat (in special time). Soundmarks: Traditional music and dancing performance (in special time), Dialects. |
| O | Cascades | 00:25 | 82 | 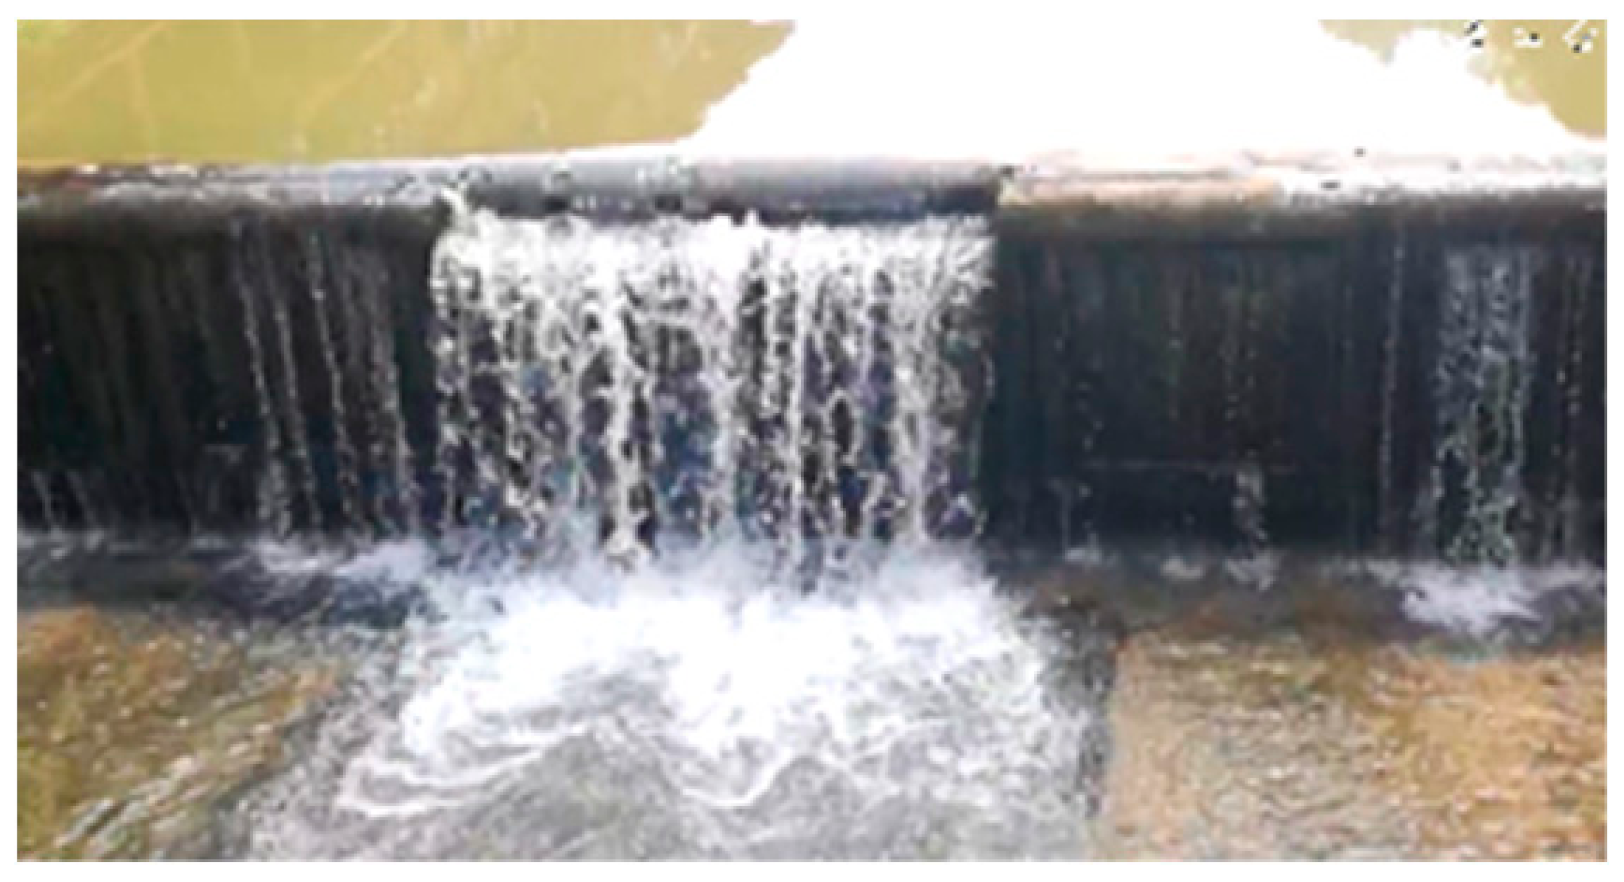 | There are so many natural or artificial sounds such as cascades in the river. When you pass through the bridge, you can feel the noisy but vivid sound of rushing water. Keynotes: Water. Signals: None. Soundmarks: None. |
| P | Rentuan Drum Tower | 03:36 | 62 |  | The most quiet Rentuan Drum Tower with few tourists is the easternmost drum tower of the village and close to the river. Keynotes: Natural sound, Daily life. Signals: Drum beat (in special time). Soundmarks: Traditional music and dancing performance (at special times), Dialects. |
| Q | The Fork | 00:29 | 65 | 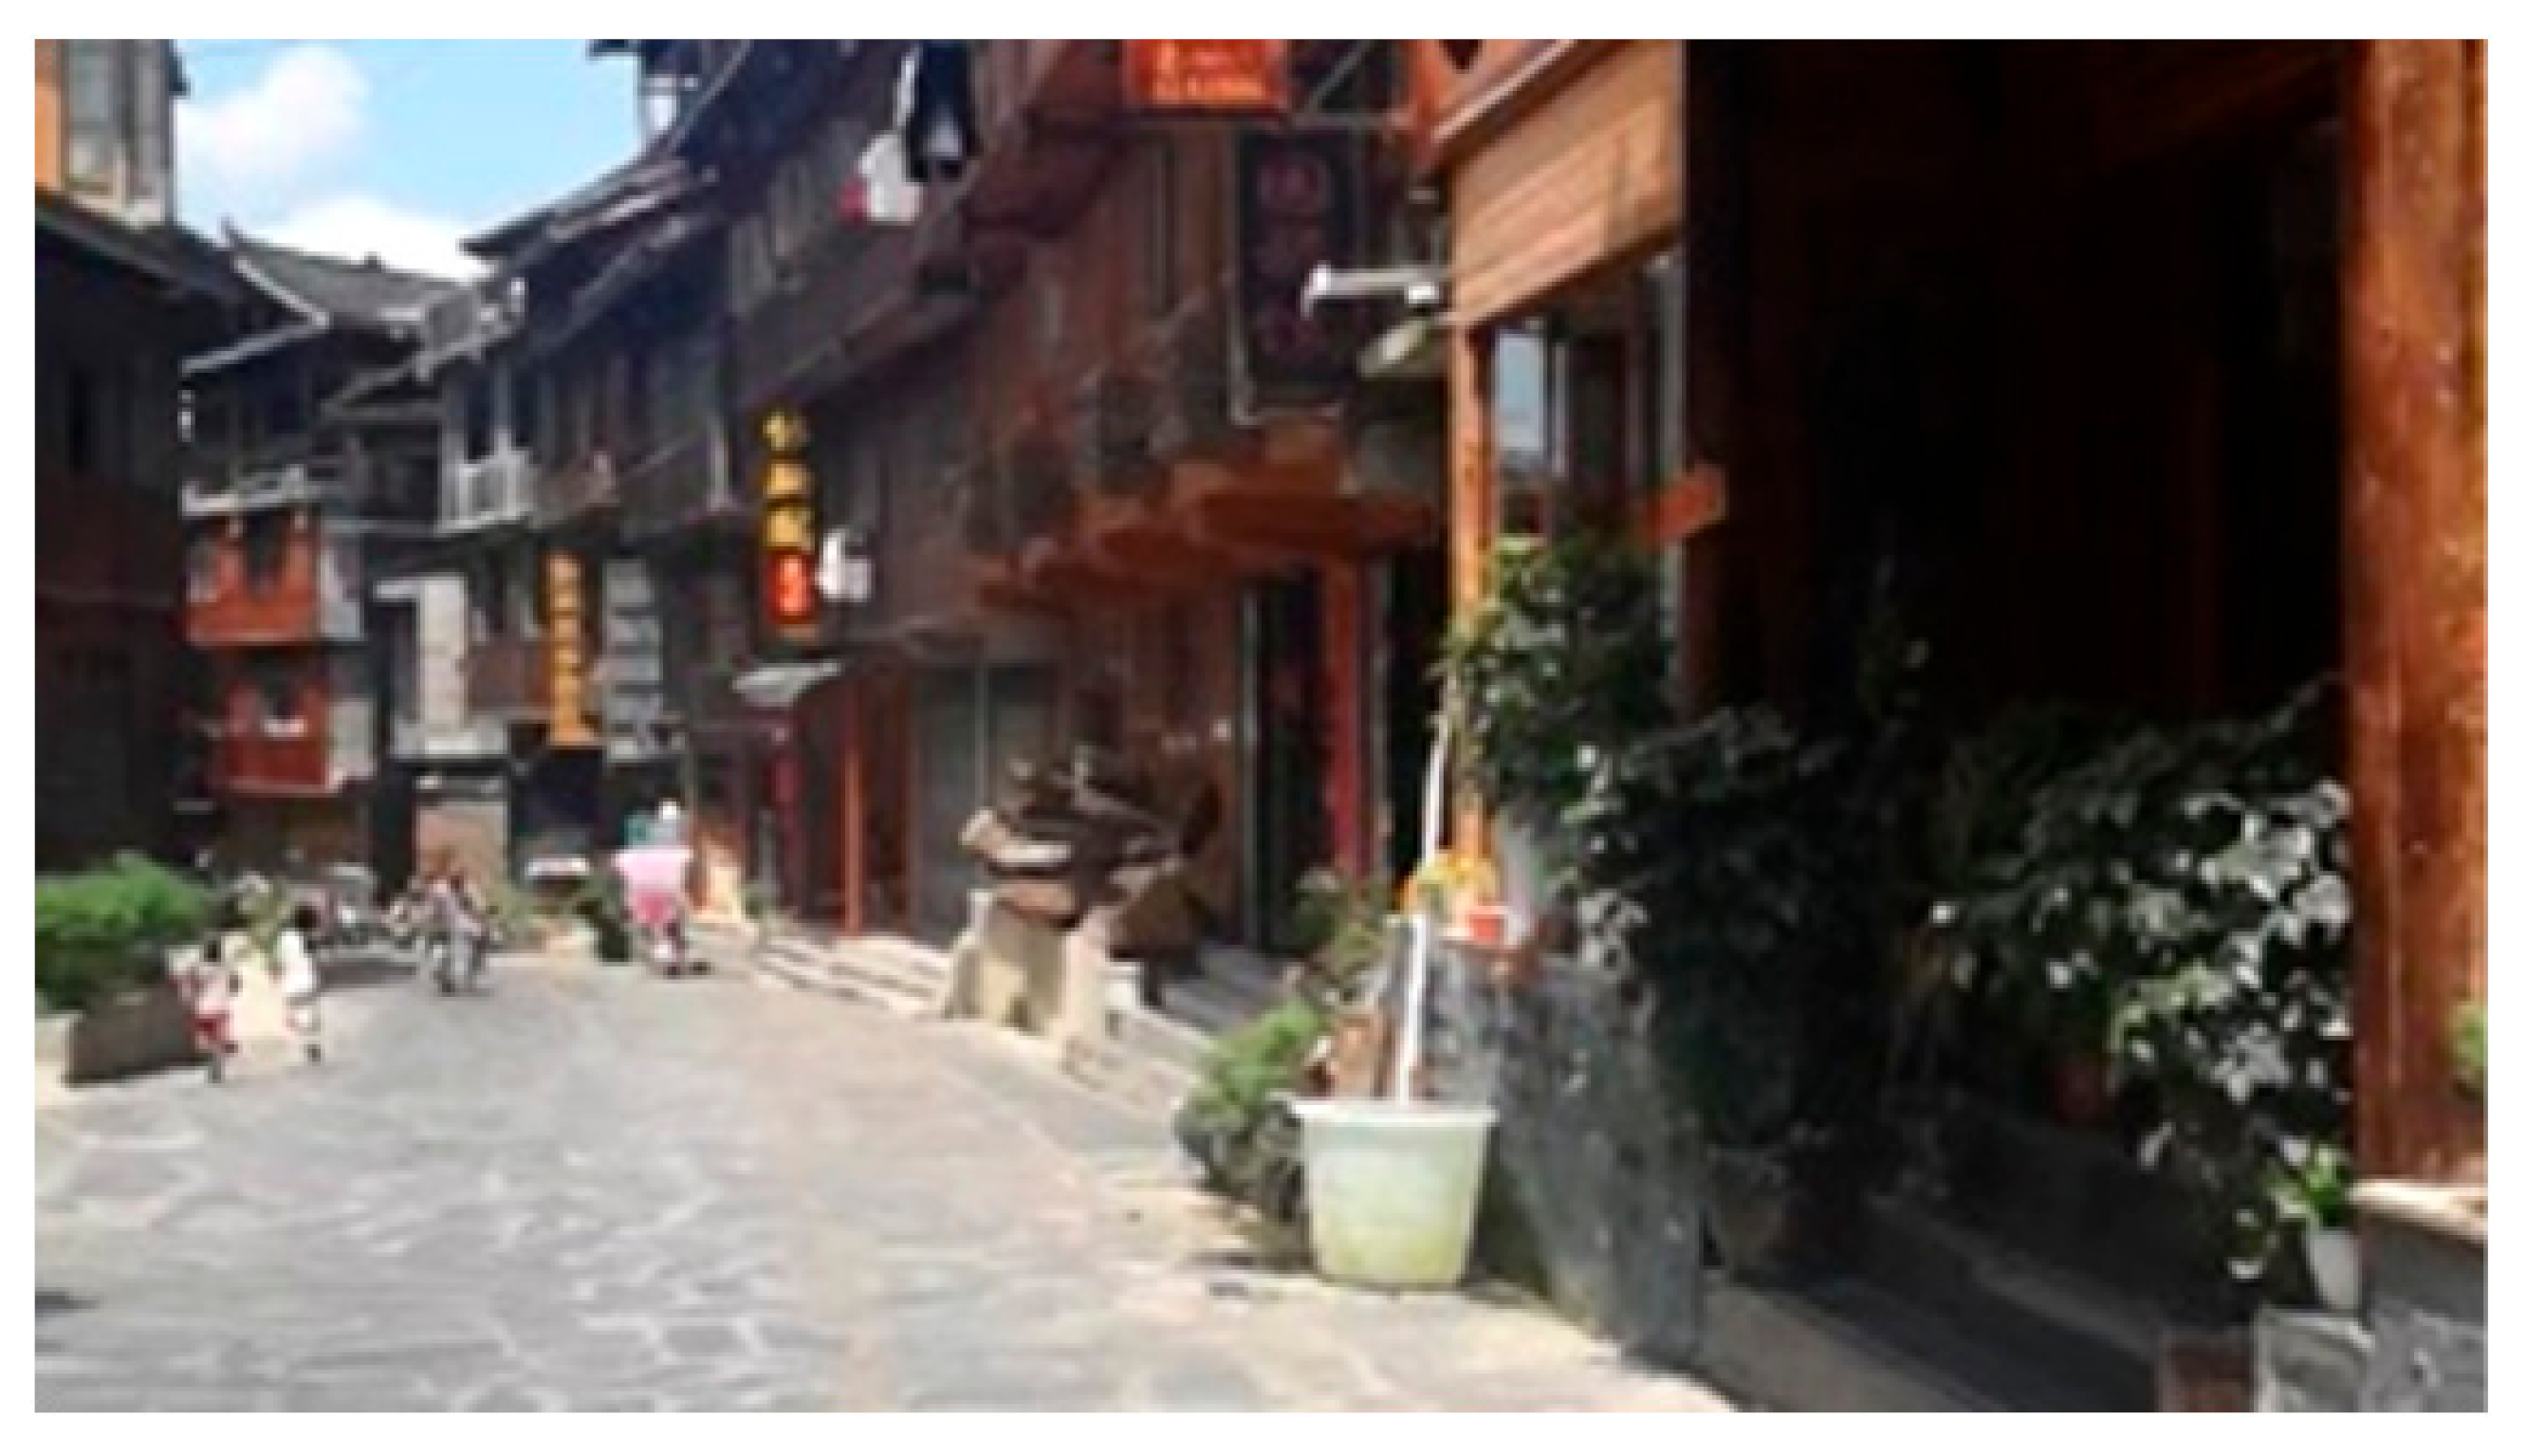 | In this village, many residents use a hose to divert water and a bucket to store it. The water is usually used for washing vegetables. Keynotes: Natural sounds. Signals: None. Soundmarks: Washing sounds. |
| R | North Gate | 00:56 | 61 | 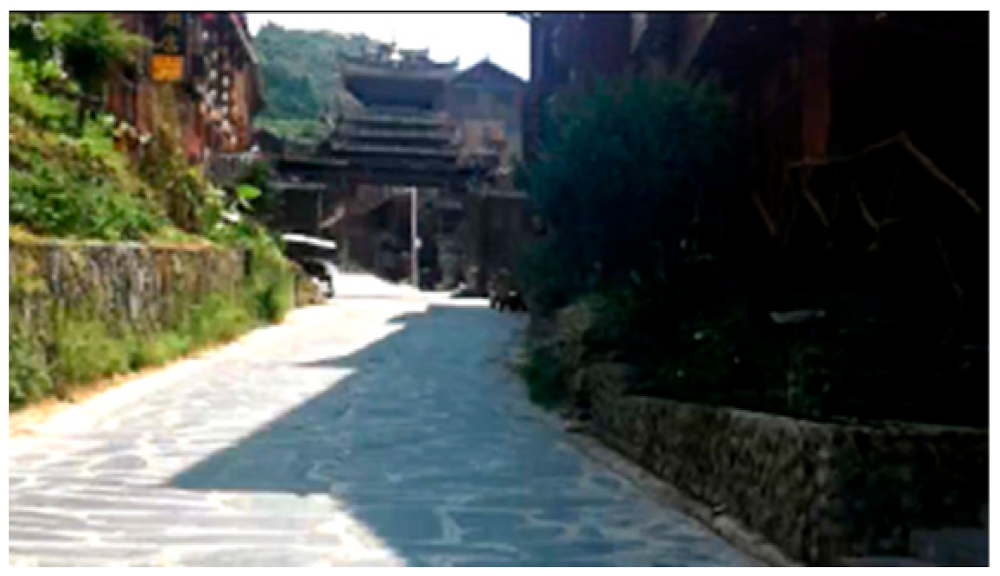 | The North Gate with few of pedestrians is located in the north-easternmost area of the village. It is mainly occupied by vehicles. Keynotes: Natural sounds, traffic noise. Signals: None. Soundmarks: None. |
| S | Yituan Drum Tower | 01:18 | 70 |  | The area around the Yituan Drum Tower is mainly inhabited by local residents. During the daytime, there are many locals resting and chatting. This tower is close to the river, and the vivid flowing water sound is integrated into the environment. Keynotes: Flowing water sound. Signals: Drum beat (in special time). Soundmarks: Traditional music and dancing performance (in special time), Dialects. |
| Question for the Independent Variable (Length of Listening, LOL) | |||||
|---|---|---|---|---|---|
| How Long Do You Listen to Music on Average Every Day? (in Minutes) | Not Often | 0–30 | 30–60 | 60–90 | >90 |
| Average Scores Q.1 | 0.00 | 0.58 | 0.90 | 0.82 | 0.88 |
| Q.2 | −0.25 | 0.08 | 0.25 | 0.12 | −0.13 |
| Q.3 | 0.50 | 0.68 | 0.85 | 0.59 | 0.44 |
| Q.4 | 0.50 | 0.45 | 0.67 | 0.71 | 0.75 |
| Q.5 | 0.75 | 0.63 | 0.64 | 0.47 | 0.75 |
| Q.6 | 0.50 | 0.53 | 0.75 | 0.88 | 0.93 |
Publisher’s Note: MDPI stays neutral with regard to jurisdictional claims in published maps and institutional affiliations. |
© 2021 by the authors. Licensee MDPI, Basel, Switzerland. This article is an open access article distributed under the terms and conditions of the Creative Commons Attribution (CC BY) license (http://creativecommons.org/licenses/by/4.0/).
Share and Cite
Deng, Z.; Dong, K.; Bai, D.; Tong, K.; Liu, A. A Case Study on Soundscape Analysis for the Historical and Ethnic Village of Dong Nationality in Zhaoxing County. Acoustics 2021, 3, 221-234. https://doi.org/10.3390/acoustics3020016
Deng Z, Dong K, Bai D, Tong K, Liu A. A Case Study on Soundscape Analysis for the Historical and Ethnic Village of Dong Nationality in Zhaoxing County. Acoustics. 2021; 3(2):221-234. https://doi.org/10.3390/acoustics3020016
Chicago/Turabian StyleDeng, Zhiyong, Kexin Dong, Danfeng Bai, Kaicheng Tong, and Aili Liu. 2021. "A Case Study on Soundscape Analysis for the Historical and Ethnic Village of Dong Nationality in Zhaoxing County" Acoustics 3, no. 2: 221-234. https://doi.org/10.3390/acoustics3020016
APA StyleDeng, Z., Dong, K., Bai, D., Tong, K., & Liu, A. (2021). A Case Study on Soundscape Analysis for the Historical and Ethnic Village of Dong Nationality in Zhaoxing County. Acoustics, 3(2), 221-234. https://doi.org/10.3390/acoustics3020016


