Article

Numerical Investigation of Influence of Entropy Wave on the Acoustic and Wall Heat Transfer Characteristics of a High-Pressure Turbine Guide Vane

1
School of Aeronautics and Astronautics, Zhejiang University, Hangzhou 310027, Zhejiang, China
2
Département de génie mécanique, Université de Sherbrooke, Sherbrooke, J1K2R1 QC, Canada
*
Author to whom correspondence should be addressed.
Acoustics 2020, 2(3), 524-538; https://doi.org/10.3390/acoustics2030028
Submission received: 3 June 2020 / Revised: 6 July 2020 / Accepted: 7 July 2020 / Published: 9 July 2020
(This article belongs to the Special Issue Aeroacoustics of Turbomachines)

Abstract

:
As an indirect noise source generated in the combustion chamber, entropy waves are widely prevalent in modern gas turbines and aero-engines. In the present work, the influence of entropy waves on the downstream flow field of a turbine guide vane is investigated. The work is mainly based on a well-known experimental configuration called LS89. Two different turbulence models are used in the simulations which are the standard k-ω model and the scale-adaptive simulation (SAS) model. In order to handle the potential transition issue, Menter’s ð-Reθ transition model is coupled with both models. The baseline cases are first simulated with the two different turbulence models without any incoming perturbation. Then one forced case with an entropy wave train set at the turbine inlet at a given frequency and amplitude is simulated. Results show that the downstream maximum Mach number is rising from 0.98 to 1.16, because the entropy waves increase the local temperature of the flow field; also, the torque of the vane varies as the entropy waves go through, the magnitude of the oscillation is 7% of the unforced case. For the wall (both suction and pressure side of the vane) heat transfer, the entropy waves make the maximum heat transfer coefficient nearly twice as the large at the leading edge, while the minimum heat transfer coefficient stays at a low level. As for the averaged normalized heat transfer coefficient, a maximum difference of 30% appears between the baseline case and the forced case. Besides, during the transmission process of entropy waves, the local pressure fluctuates with the wake vortex shedding. The oscillation magnitude of the pressure wave at the throat is found to be enhanced due to the inlet entropy wave by applying the dynamic mode decomposition (DMD) method. Moreover, the transmission coefficient of the entropy waves, and the reflection and transmission coefficients of acoustic waves are calculated.

1. Introduction

In the development of modern aeronautical gas turbines, combustion noise is getting more and more attention as it may lead to severe problems in both combustion chamber and turbine stages [1]. In the 1970s, Candel [2], Marble and Candel [3], and Cumpsty and Marble [4] showed that combustion noise comes in two types due to the different generation mechanisms. On the one hand, direct noise is created by the acoustic waves generated by the unsteady flame heat release and they propagate through the rest of the engine. On the other hand, indirect noise is generated when the temperature fluctuation or hot spots (so called entropy wave [5,6,7]) accelerate through the turbine stage (likely, primarily at the inlet guide vane of the first stage high pressure turbine).
For the entropy wave, many previous studies focused on its propagation and the associated acoustic effect. Marble and Candel [3] proposed an approach using the linearized Euler equations (LEE) to analyze the propagation of both acoustic and entropy waves through a quasi-1D nozzle, based on the compact nozzle hypothesis. Derived from the Marble and Candel’s work, Duran and Moreau [7] proposed a semi-analytical method to solve the wave propagation through the nozzle without the compact nozzle hypothesis. This method has shown correct results for the reference test case which was performed by Bake [8]. Besides, Leyko [9] studied several supersonic cases based on the same devices (entropy wave generators [8]), and found that the entropy-to-acoustic conversion was due to the strong mean velocity gradient in the nozzle, including the normal shock that stands just downstream of the throat. Considering the influence of turning flow, Cumpsty and Marble [4] extended the theory of Marble and Candel [3] to two-dimensional compact blade rows by using the Kutta condition at the blade trailing edge. This two-dimensional analytical method for low frequencies, or compact row assumption, was extended to consider the enthalpy jump through a rotating blade by Duran and Moreau [10]. In the present work, a simple turbine guide vane model is used, thus these analytical methods can be applied while investigating the propagation of inlet entropy waves. More recently, Wang [11] and Papadogiannis [12] evaluated the propagation mechanisms of the indirect combustion noise generated by entropy plane waves in the Oxford MT1 high pressure (HP) stage, and revealed the variation of the upstream and downstream entropy noise in the turbine guide vanes and blades. Besides, Ceci [13] used the large eddy simulation (LES) to analyze the blade acoustic response to forced temperature perturbations at the inlet, and found the dynamics of shocks emitted from the trailing edge was completely characterized by the inlet forcing frequency of the entropy waves. The present work investigated the variation of downstream acoustic characteristics of a turbine guide vane under the influence of the inlet entropy wave.
Moreover, as the entropy waves go through, the heat transfer conditions of the vane surface will also be modified. In practice, Becerril [14] considered the interaction of a realistic temperature or entropy spot with the MT1 HP stage. Wheeler [15] used direct numerical simulations (DNS) to investigate the influence of free stream turbulence intensity on the surface flow physics and heat transfer. Morata [16] and Gourdain [17] predicted the wall heat transfer of a high-pressure turbine blade by LES and proved that the increasing free-stream turbulence will enhance the heat transfer on the vane surface. Besides, Phan [18] found that the temperature distortion amplitude of a hot streak and its relative clocking position with the vane significantly affected the heat flux distribution. In this paper, the variation of heat transfer on vane surface under the influence of entropy wave is considered.
The paper is organized as follows: first, the geometry and mesh are introduced as well as the boundary conditions and the governing equations. Then, several baseline cases are shown comparing the two different turbulence models (the k- ω model [19] and the SAS model [20]). The distributions of both isentropic Mach number and heat transfer coefficients along the vane surface are investigated. After that, an entropy wave train with a fixed frequency and amplitude is set at the inlet. The variation of wall heat transfer and downstream pressure fields are investigated. To study the noise sources, the unsteady features of those cases are characterized by the Fourier analysis and dynamic mode decomposition (DMD [21,22]). Finally, main conclusions are drawn.

2. Numerical Setup

All the simulations are based on a well-known experimental facility [23], which is located at the Von Karman Institute (Rhode-Saint-Genèse, Belgium).
The test section is a turbine guide vane called LS89, which was largely investigated by Art, et al. [24]. The vane is mounted in a linear cascade, made of five profiles. In order to guarantee the periodic condition of velocity distributions and the convective heat transfer during the tests, only the central one is used in measurements. The sketch of numerical configuration is shown in Figure 1. The chord of the vane C is 67.647 mm and the pitch/chord ratio is 0.85. In order to limit the dependency of the solution to the inlet/outlet positions, the whole domain extends up to 0.6 C upstream and 1.5 C downstream the vane.
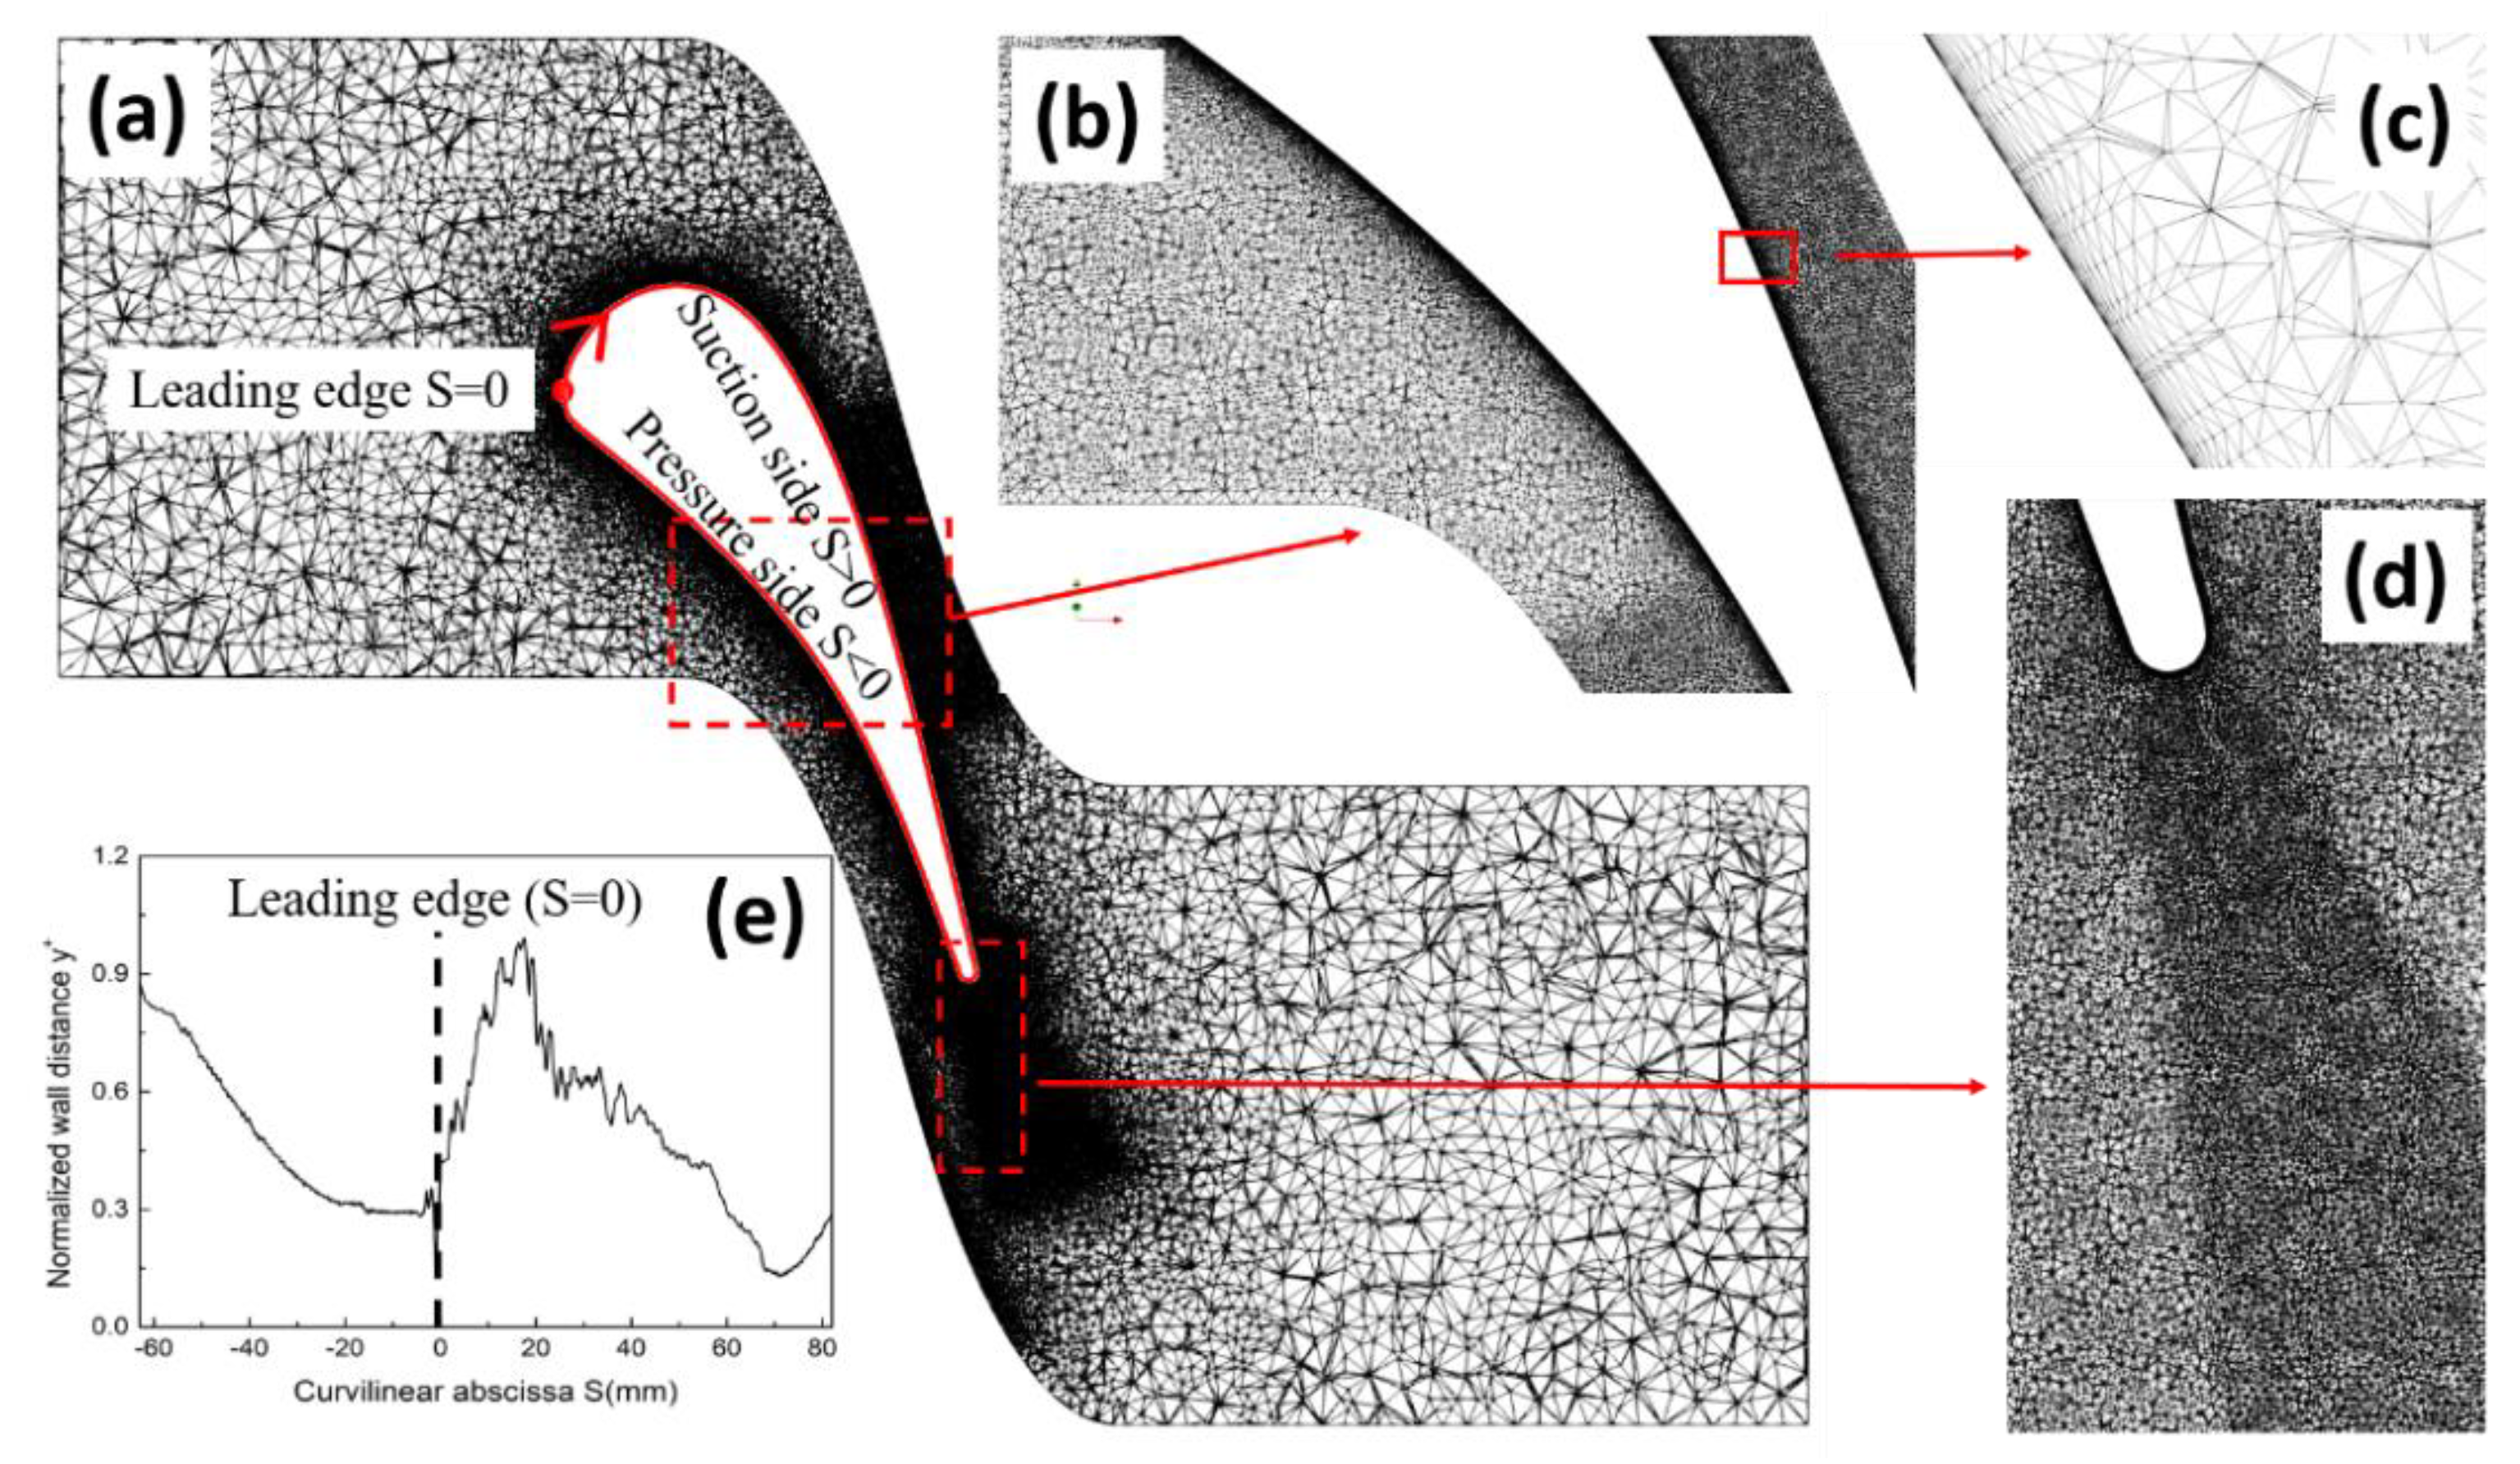
As indicated in Morata [16] and Pouangué’s work [25], unstructured and structured mesh show similar accuracy in numerical simulations, in the present work, an unstructured mesh is employed. The total number of mesh elements is about 11.8 million, including 4.1 million prism cells and 7.7 million tetrahedral cells, the number of total nodes is 3.5 million. The minimum tetrahedral volume is 1.7 × 10 5   m m 3 , the maximum tetrahedral aspect ratio is 5.8 and the maximum tetrahedral skew is 0.95. A sketch of coarse mesh and some details of the refined mesh in simulation are displayed in Figure 2, the mesh in the downstream wake and at the throat is refined. Besides, considering the heat transfer on the vane surface, 12 layers of prisms is set in the blade boundary layer which the thickness of the first mesh layer being 0.001 mm and the stretching ratio being 1.2. Figure 2e shows the evolution of the normalized wall distance y + . It indicates that the maximum value of y + is close to 1, and its position is near the leading edge (S = 0, red circle in Figure 2a) of the suction side (S > 0). y + is calculated by y + = u * y / ν , for u * is the friction velocity, ν is the kinematic viscosity, and y stands for the distance between the first grid and the wall. In other directions, the mesh spacings are also under acceptable values ( z + = x + = 100 y + ) [16,17].
In this paper, the ideal gas is assumed as the working fluid, thus the fluid viscosity follows Sutherland’s law, and the heat flux follows Fourier’s law.
The governing equations can be expressed as:
Continuity equation:
ρ t + x i ( ρ u i ) = 0
Momentum equation:
t ( ρ u i ) + x j ( ρ u i u j ) = x j ( p τ i j τ i j t )
Energy equation:
t ( ρ h ) + x j ( ρ u j h ) = x j [ u i ( p δ i j τ i j ) + λ T x j ]
where ρ is density, u i is velocity of the ideal gas, p is pressure; h is total enthalpy, T is temperature, λ is the thermal conductivity coefficient; τ i j is the viscosity tensor, given as
τ i j = μ ( u i x j + u j x i 2 3 δ i j u l x l )
Two different turbulence models are used in these simulations. One is the typical two-equation turbulence model named k ω model [19], which closes the Reynolds-averaged Navier–Stokes (RANS) equations by solving the k and ω equations. The other is the SAS model [20] which is regarded as a promising model in the CFD simulation and can reach a more accurate result than RANS models yet cost less computational resources [26,27,28]. The SAS model includes an additional SAS source term Q S A S which contains the second derivative of the resolved flow field, resulting in a length scale, which reacts to the von Karman length-scale in unsteady regimes.
In order to handle the potential transition problem, a Menter’s γ R e θ t transition criterion [29] which based strictly on the local variables is used in both models. The transition model forms a framework for the implantation of correlation-based models into general-purpose computational fluid dynamics (CFD) methods. Two other transport equations (one for the intermittency and one for the transition onset criterion) are adopted. The transport equations for the intermittency γ are defined as
( ρ γ ) t + ( ρ U j γ ) x j = P γ + x j [ ( μ + μ t σ γ ) γ x j ]
where P γ represents the transition sources.
The transport equation for the transition momentum thickness Reynolds number R e ˜ θ t is
( ρ R e ˜ θ t ) t + ( ρ U j R e ˜ θ t ) x j = P θ t + x j [ σ θ t ( μ + μ t ) R e ˜ θ t x j ]
where P θ t stands for the source term which forces the transported scalar to match the local value R e θ t of calculated from an empirical correlation outside the boundary layer.
All simulations have been performed with the ANSYS CFX (version 14.5) [30]. For the advection term, a high-resolution second order central difference scheme has been used. For heat transfer, the total energy model has been applied, including the viscous term.
There is a large range of flow conditions that have been tested experimentally, but the simulations in this paper are mainly based on three sets of cases. Table 1 shows the details of the test cases. For the baseline cases which without the entropy wave, the inlet total temperature is fixed as well as the temperature of the vane surface (Twall). In order to investigate the effect of an incoming flow entropy wave on the heat transfer of the vane surface and the downstream pressure field, an entropy wave train E(t) is given via a user defined function (UDF) at the inlet, while the total pressure stays the same as the experiments. Besides, two different turbulence models (k-ð and SAS model) are compared under different incoming flow conditions before setting the entropy wave.

3. Results and Discussions

3.1. Case without Entropy Wave

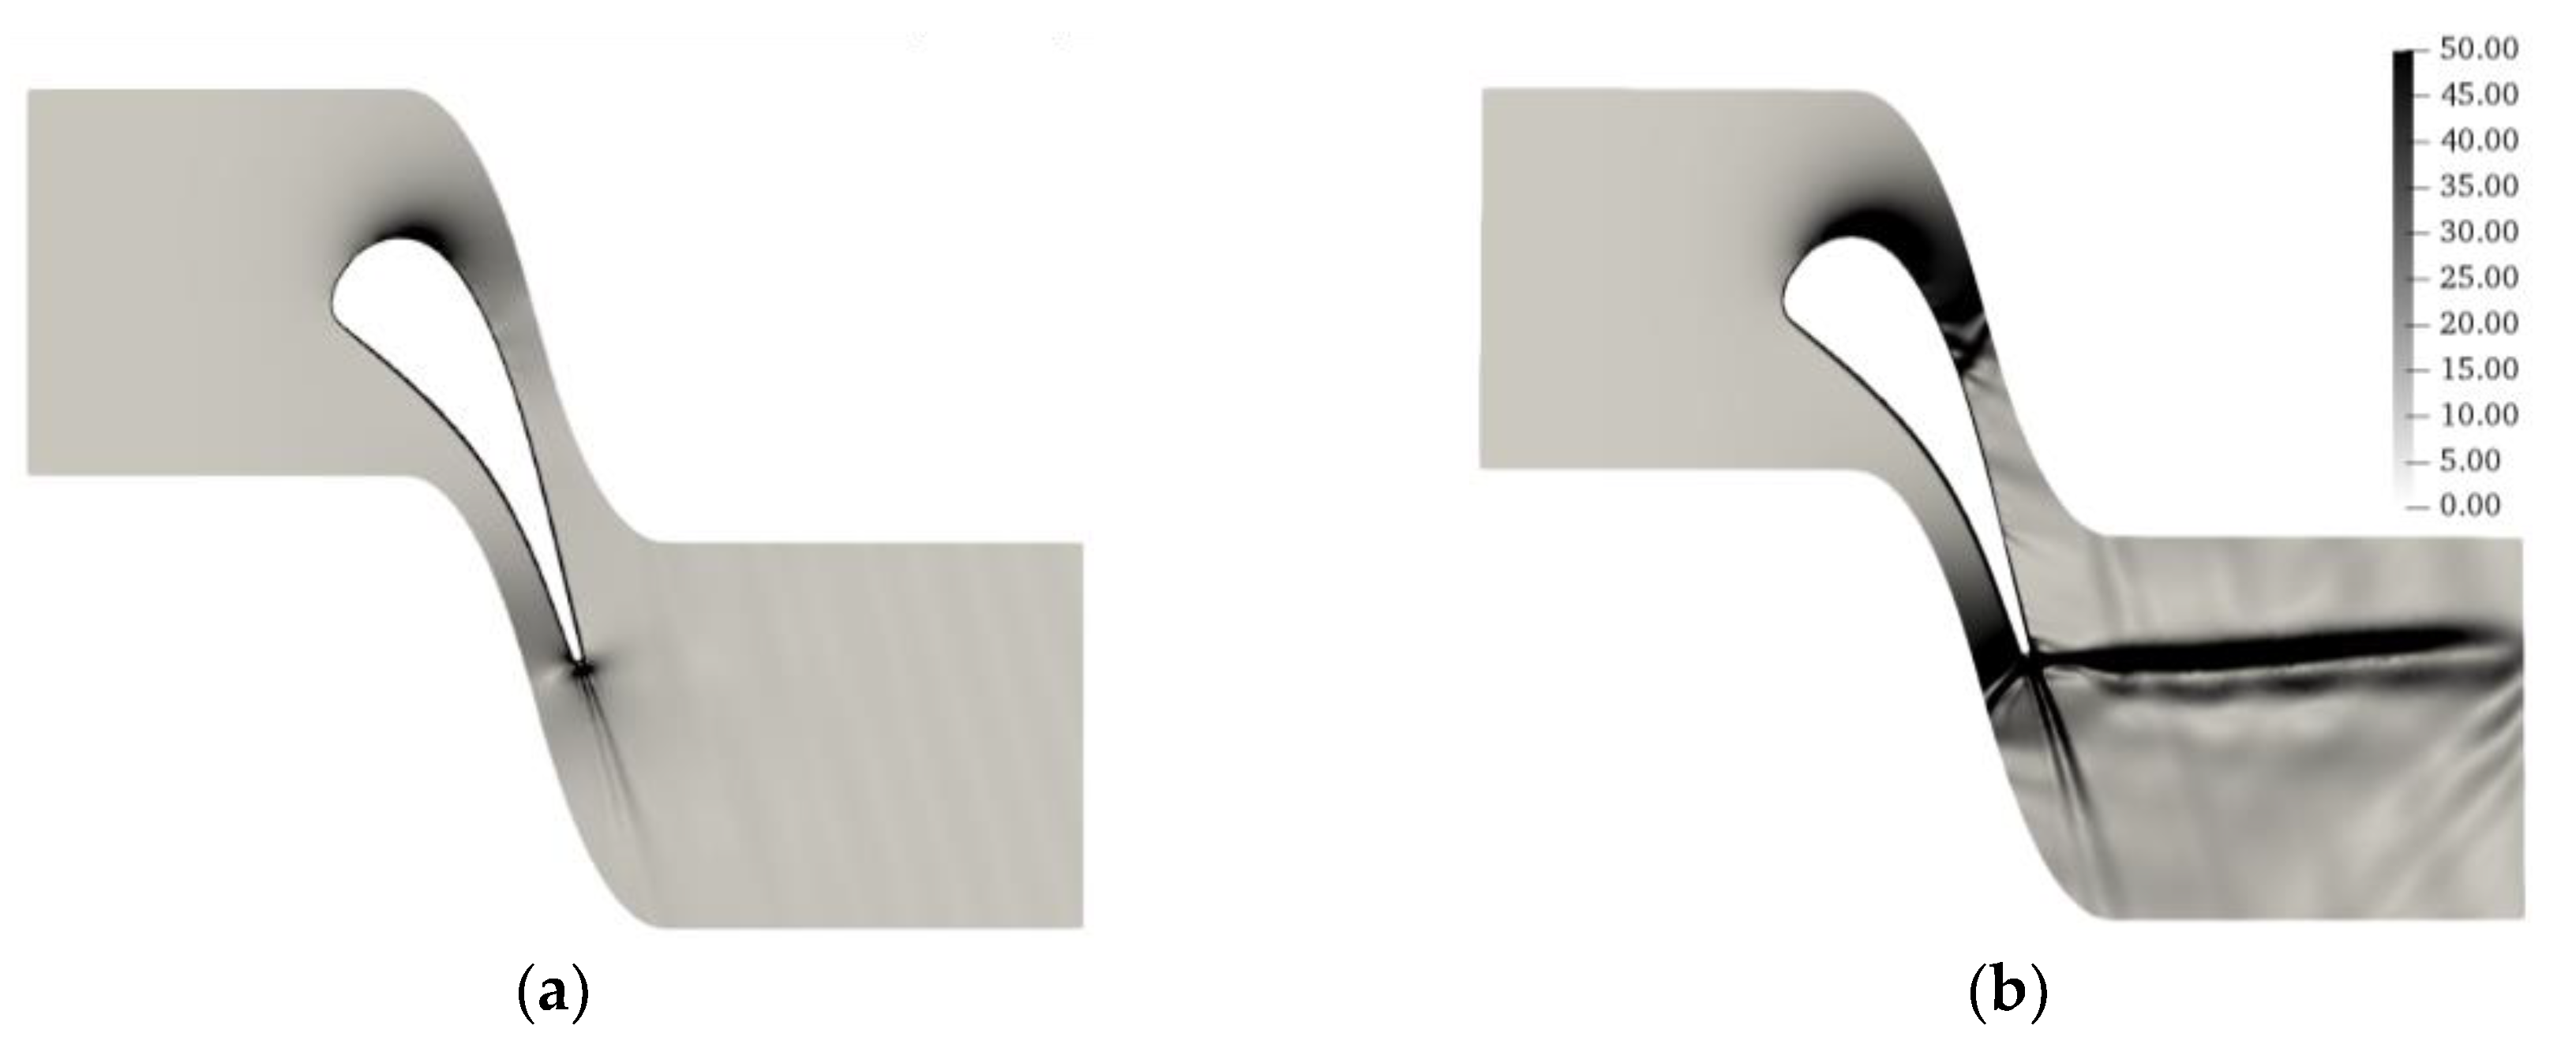
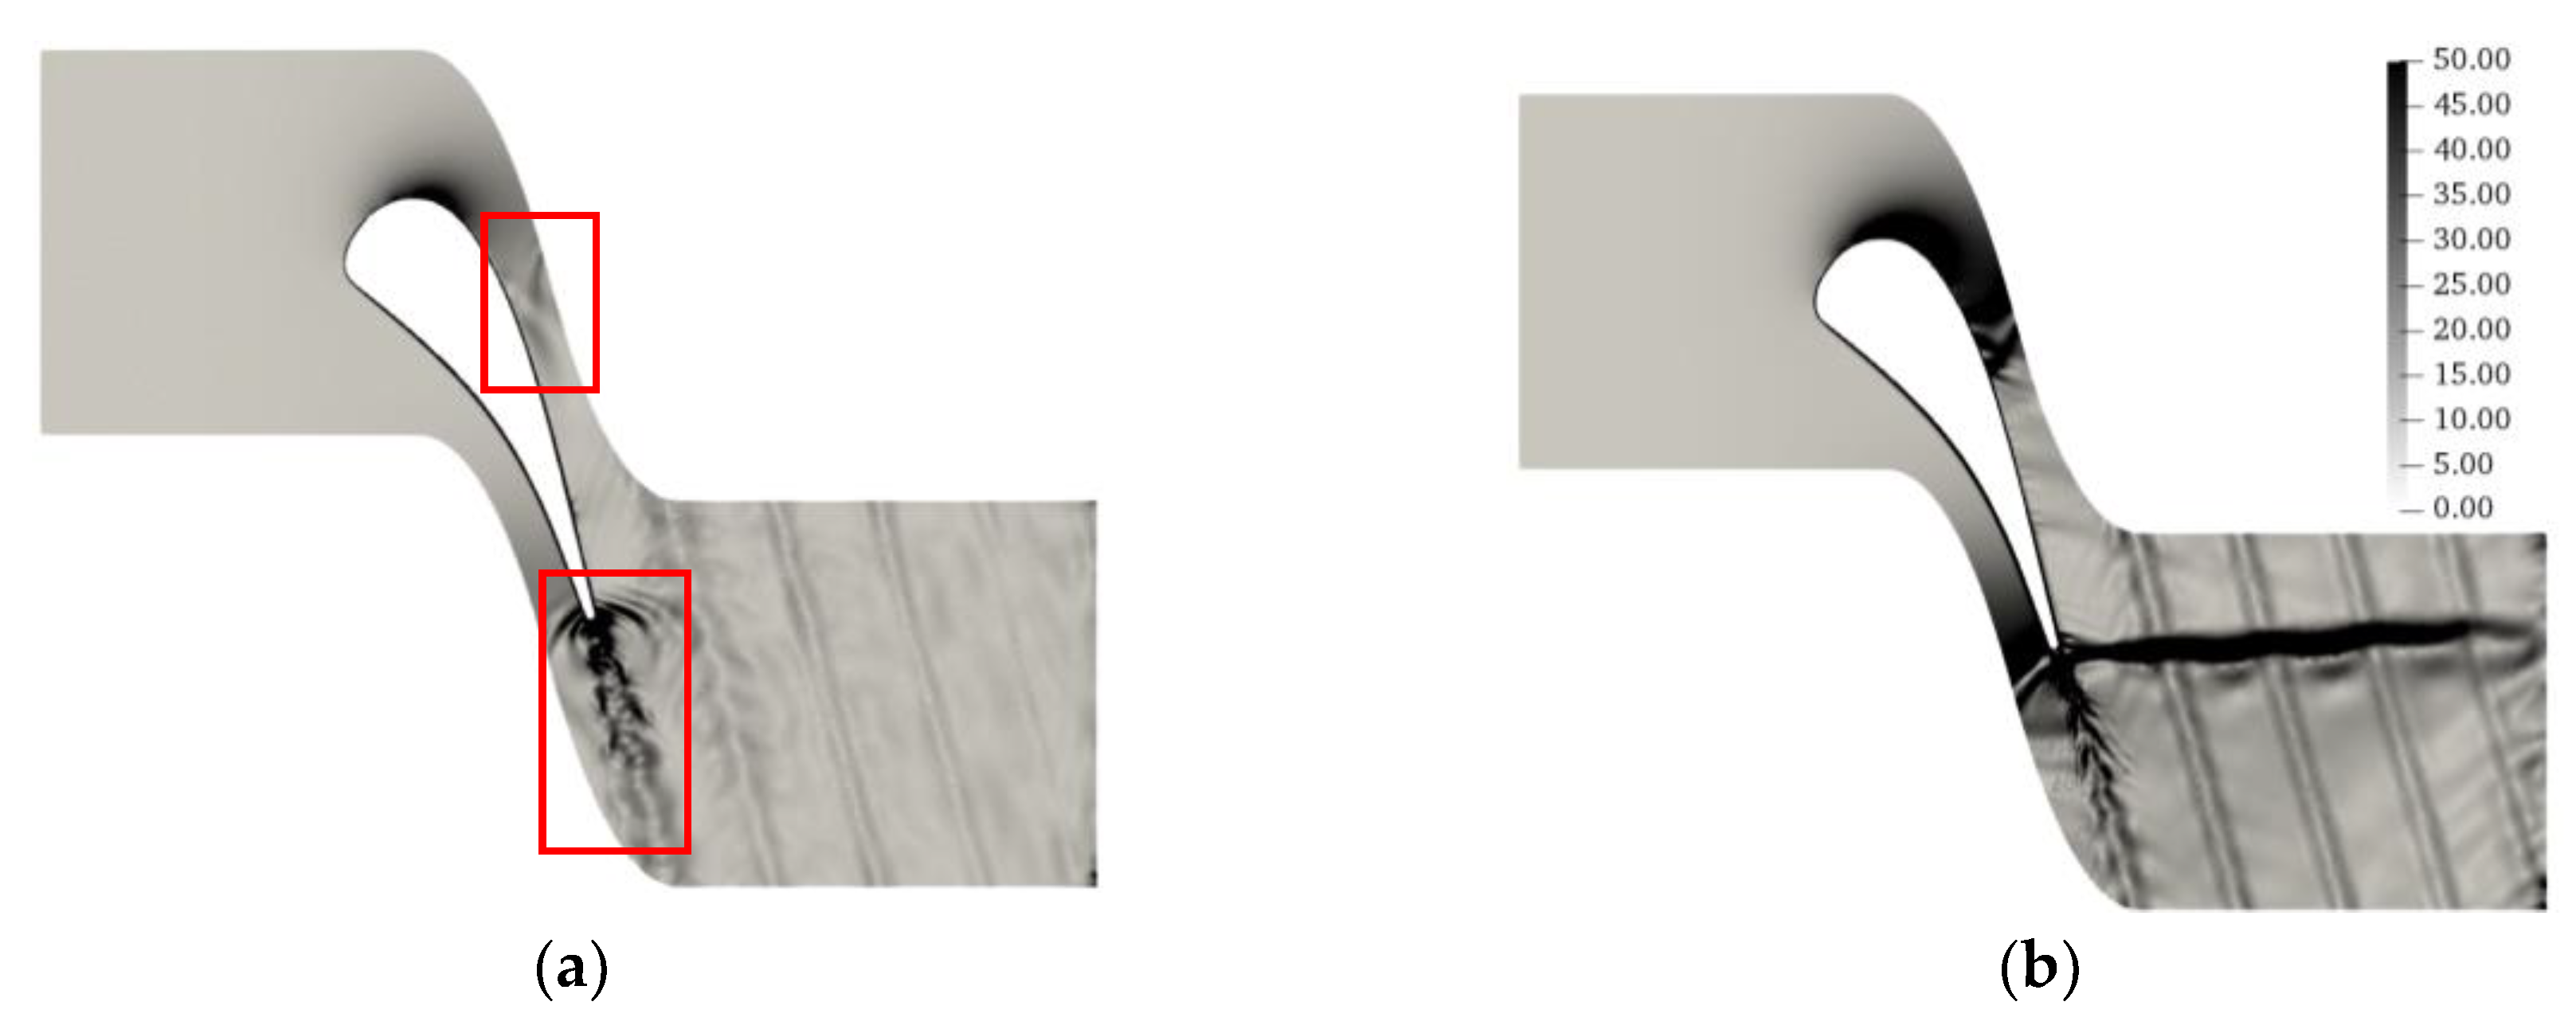
Figure 3 and Figure 4 display an overview of the flow calculated under the three baseline cases. For the MUR129_ k-ω and MUR129_ SAS, the flow remains in subsonic regime, and the main unsteadiness (highlighted by the red line box in Figure 4) is associated with the shedding vortexes from the trailing edge and the pressure waves reflecting at the throat (only under the SAS model). For the MUR241_ k-ω and MUR241_ SAS, there is a strong oblique shock near the blade trailing edge, which interacts with the downstream flow. For all three baseline cases, because the numerical modeling induces some losses and the downstream grids gradually become sparse, the vortex structure in the wake region begins to fade away in the downstream areas.
As one of the focuses of this work is the heat transfer on the vane surface, the isentropic Mach numbers along the vane are first calculated and shown in Figure 5 as a primary validation of the solver. All simulations yield similar results, in good agreement with experiments except for slightly slower flow on the rear part of the suction side because of a laminar to turbulent transition. The wall heat transfer coefficient H along the vane (S = 0 is the leading edge of the vane, S > 0 and S < 0 represent the suction and pressure sides, respectively) is calculated by
H = q w a l l T i , 0 T w a l l
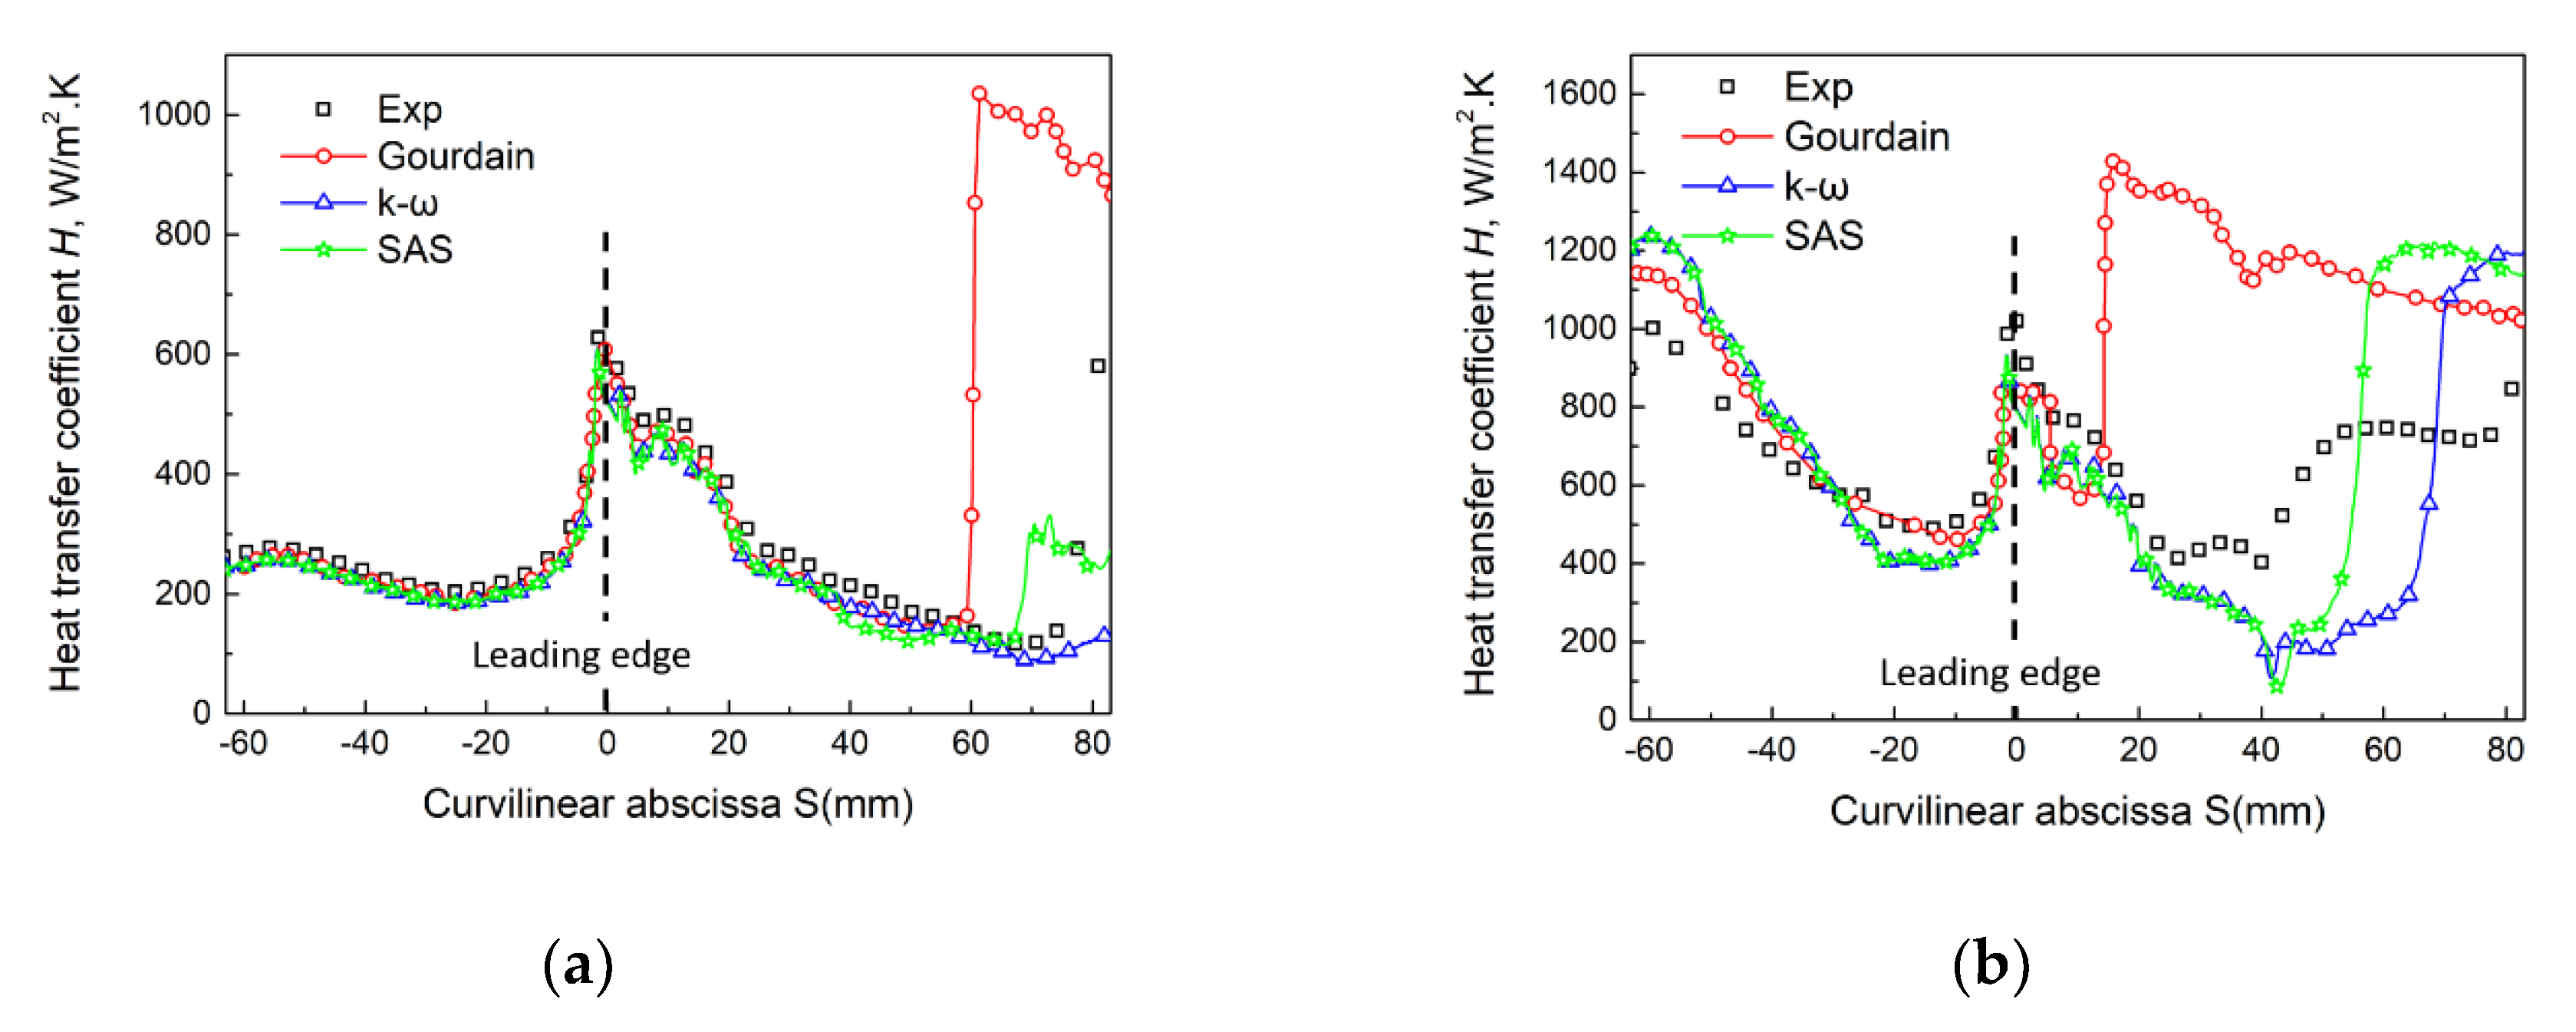
where Twall stands for the constant vane wall temperature and qwall is the wall heat flux. As Figure 6 indicates, for the test case MUR129, the results of both turbulence models match the experimental data on the pressure side, while on the suction side, a laminar to turbulent transition shows up and leads to a huge rise of heat flux. In the experiments, the transition position is estimated at S = 75 mm. Gourdain’s work (RANS) [18] predicted a transition position at S = 62 mm. Meanwhile, the transition position given by MUR129_SAS is about S = 67 mm, which is closer to the experimental measurement; however, the k-ω model misses this phenomenon. For the MUR241 test cases, the profiles of heat transfer coefficients on the pressure side are matching the experiments well. Yet, on the suction side, with the rising inlet turbulence intensity, the transition position could not be perfectly estimated by all RANS models. Clearly, an early or late prediction of transition would cause some big differences in heat transfer, as shown in Figure 6b. Overall, the heat transfer coefficients along the two vane surfaces simulated by the two models here in CFX seem to be better predicted than in the previous pioneering RANS simulations by Gourdain, et al. [17]. Even though LES can capture more flow physics and provide more accurate results, like in Morata’s work [16] on the same cases, the preliminary RANS results, notably those obtained with the SAS model, provide improved and reasonable agreement with the experiment, especially in the MUR129 case. As LES requires much higher computing resources and is much more costly to get convergence of the simulation for sufficient periods of inlet entropy waves, the SAS model is chosen to yield a numerical parametric investigation of the influence of entropy wave on the pressure field and wall heat transfer characteristics.

3.2. Case with Entropy Wave

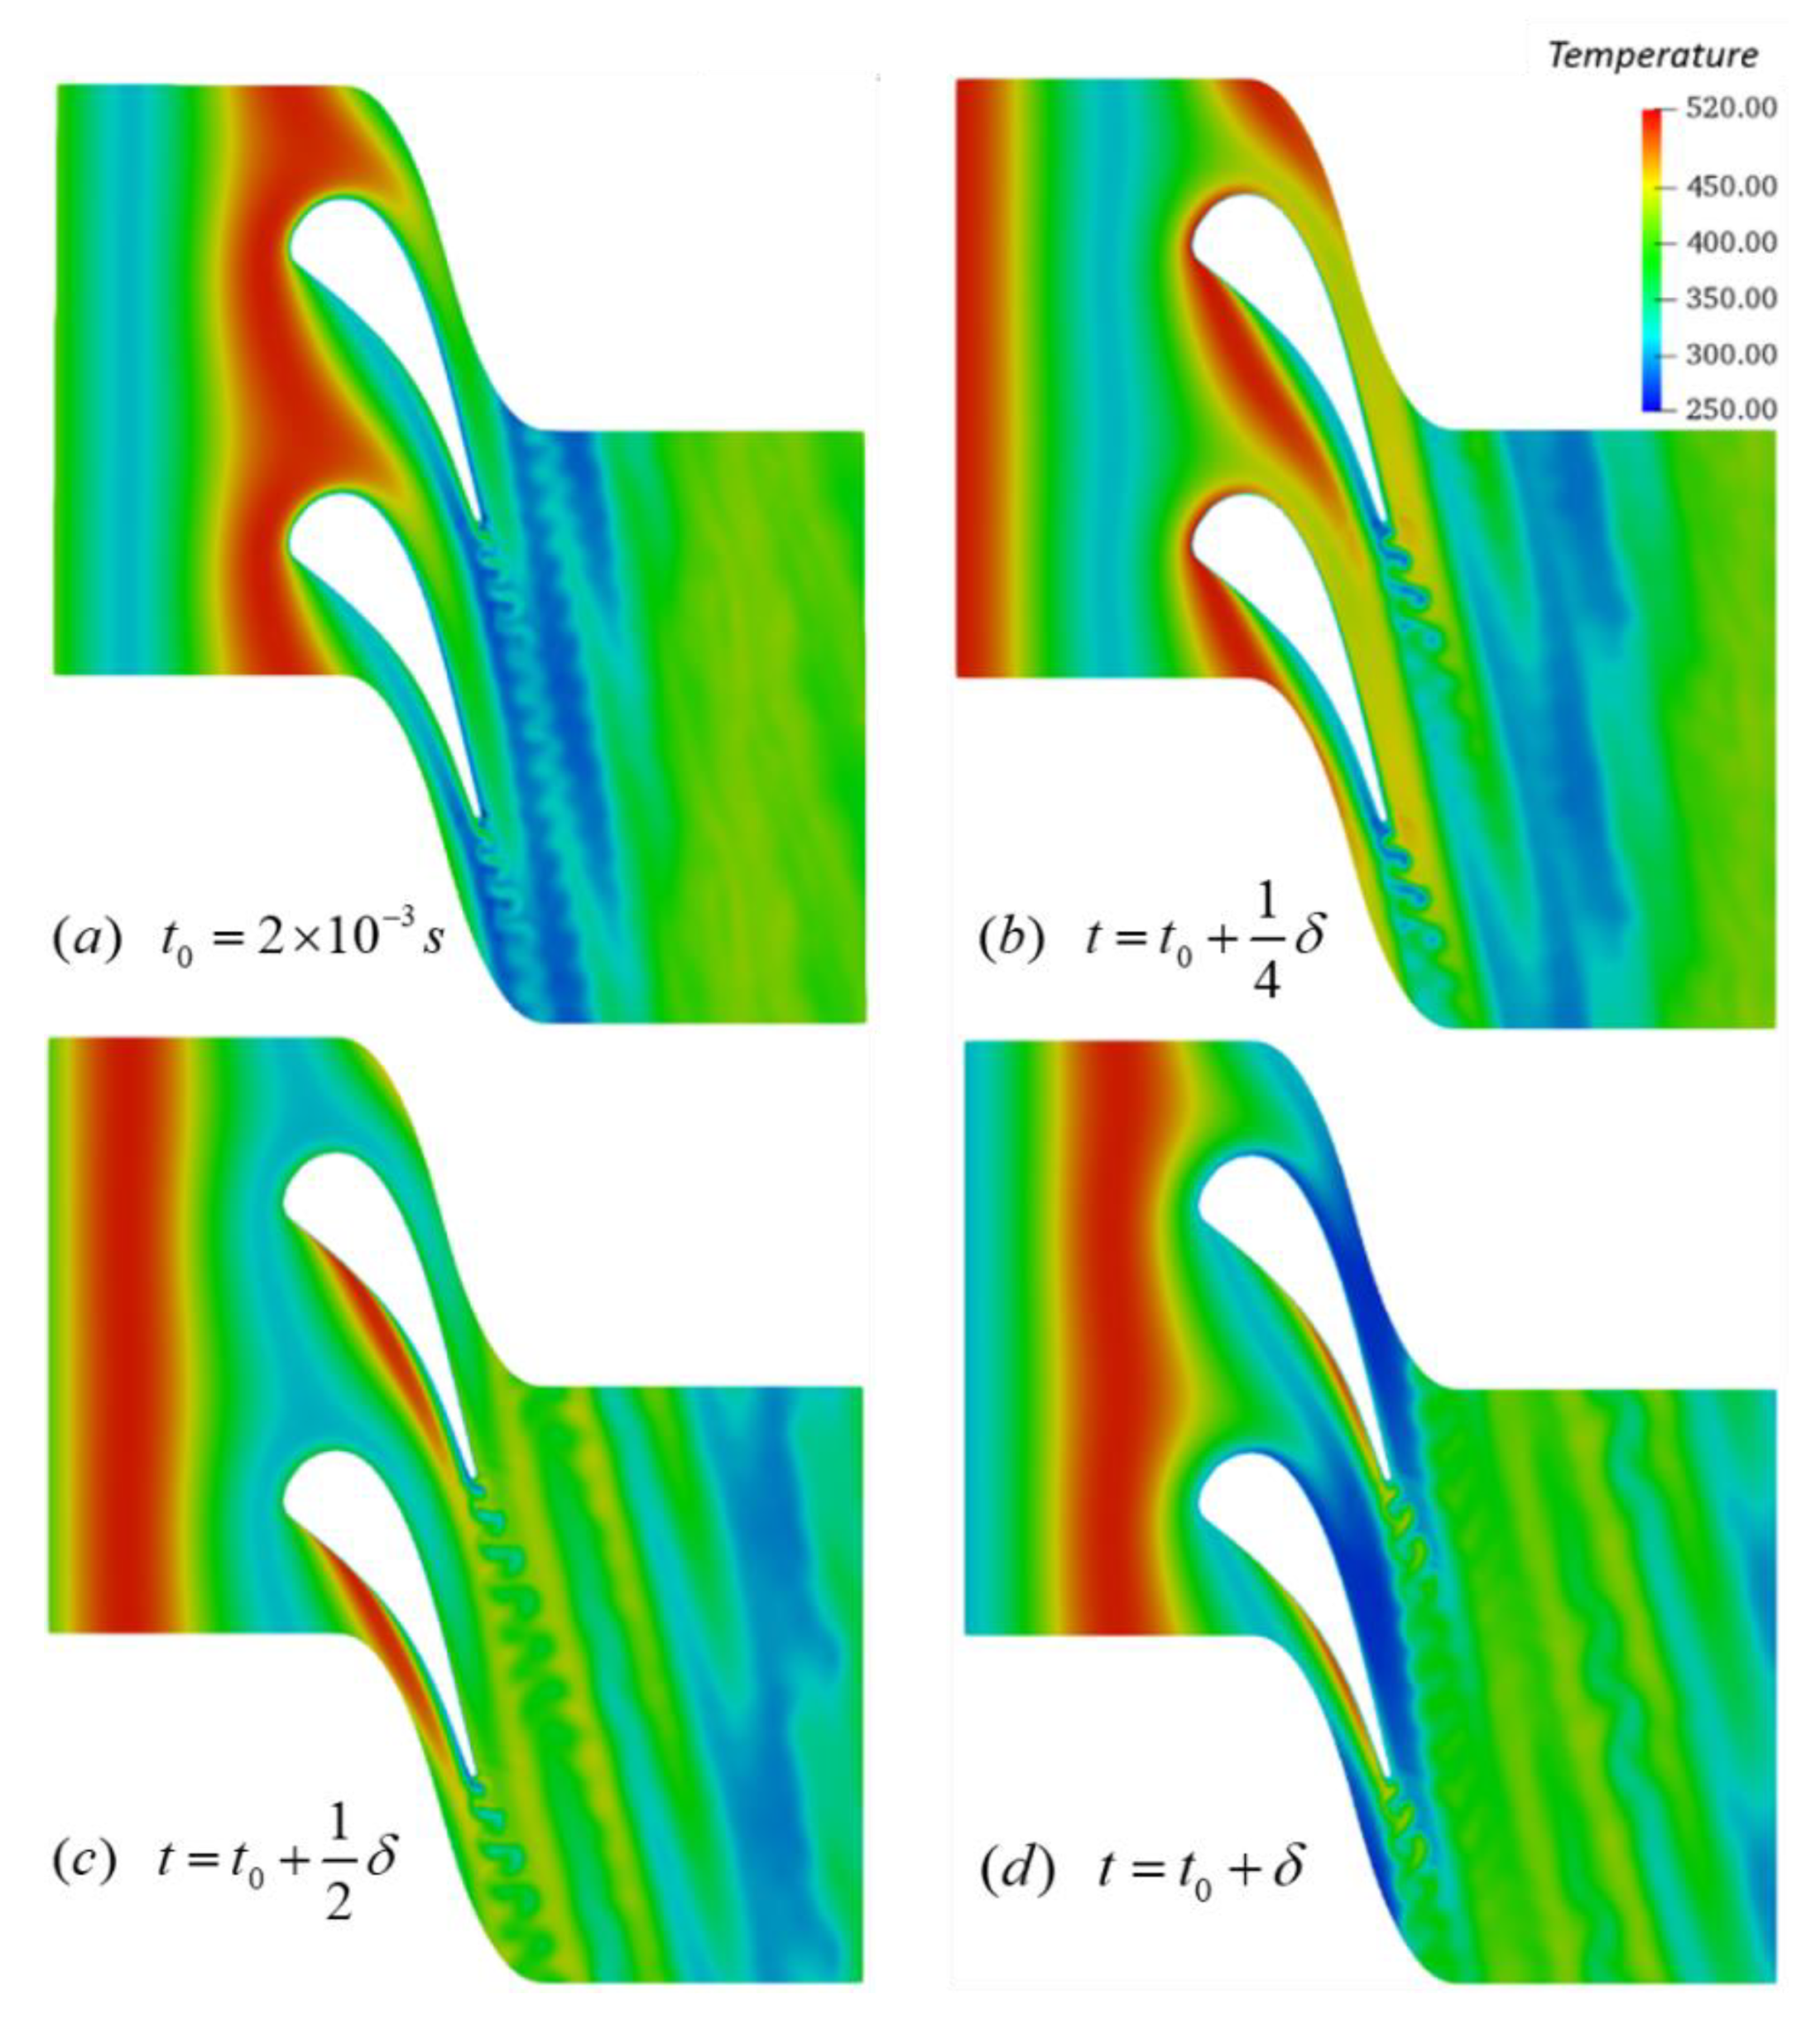
In all simulations, the inlet total pressure Pi,0 is set to a constant value (see Table 1), whereas the inlet total temperature is varied with the time. Figure 7 shows the distribution of instantaneous temperature field. The frequency of the inlet plane entropy wave is 1000 Hz, and t 0 = 2 × 10 3 s is defined as the moment when the entropy wave is just about to impinge on the vane leading edge. After the leading edge splits the entropy wave train into two parts, one each passing along the pressure and suction sides, the entropy wave interacts with the shed vortices, then goes out at the outlet.
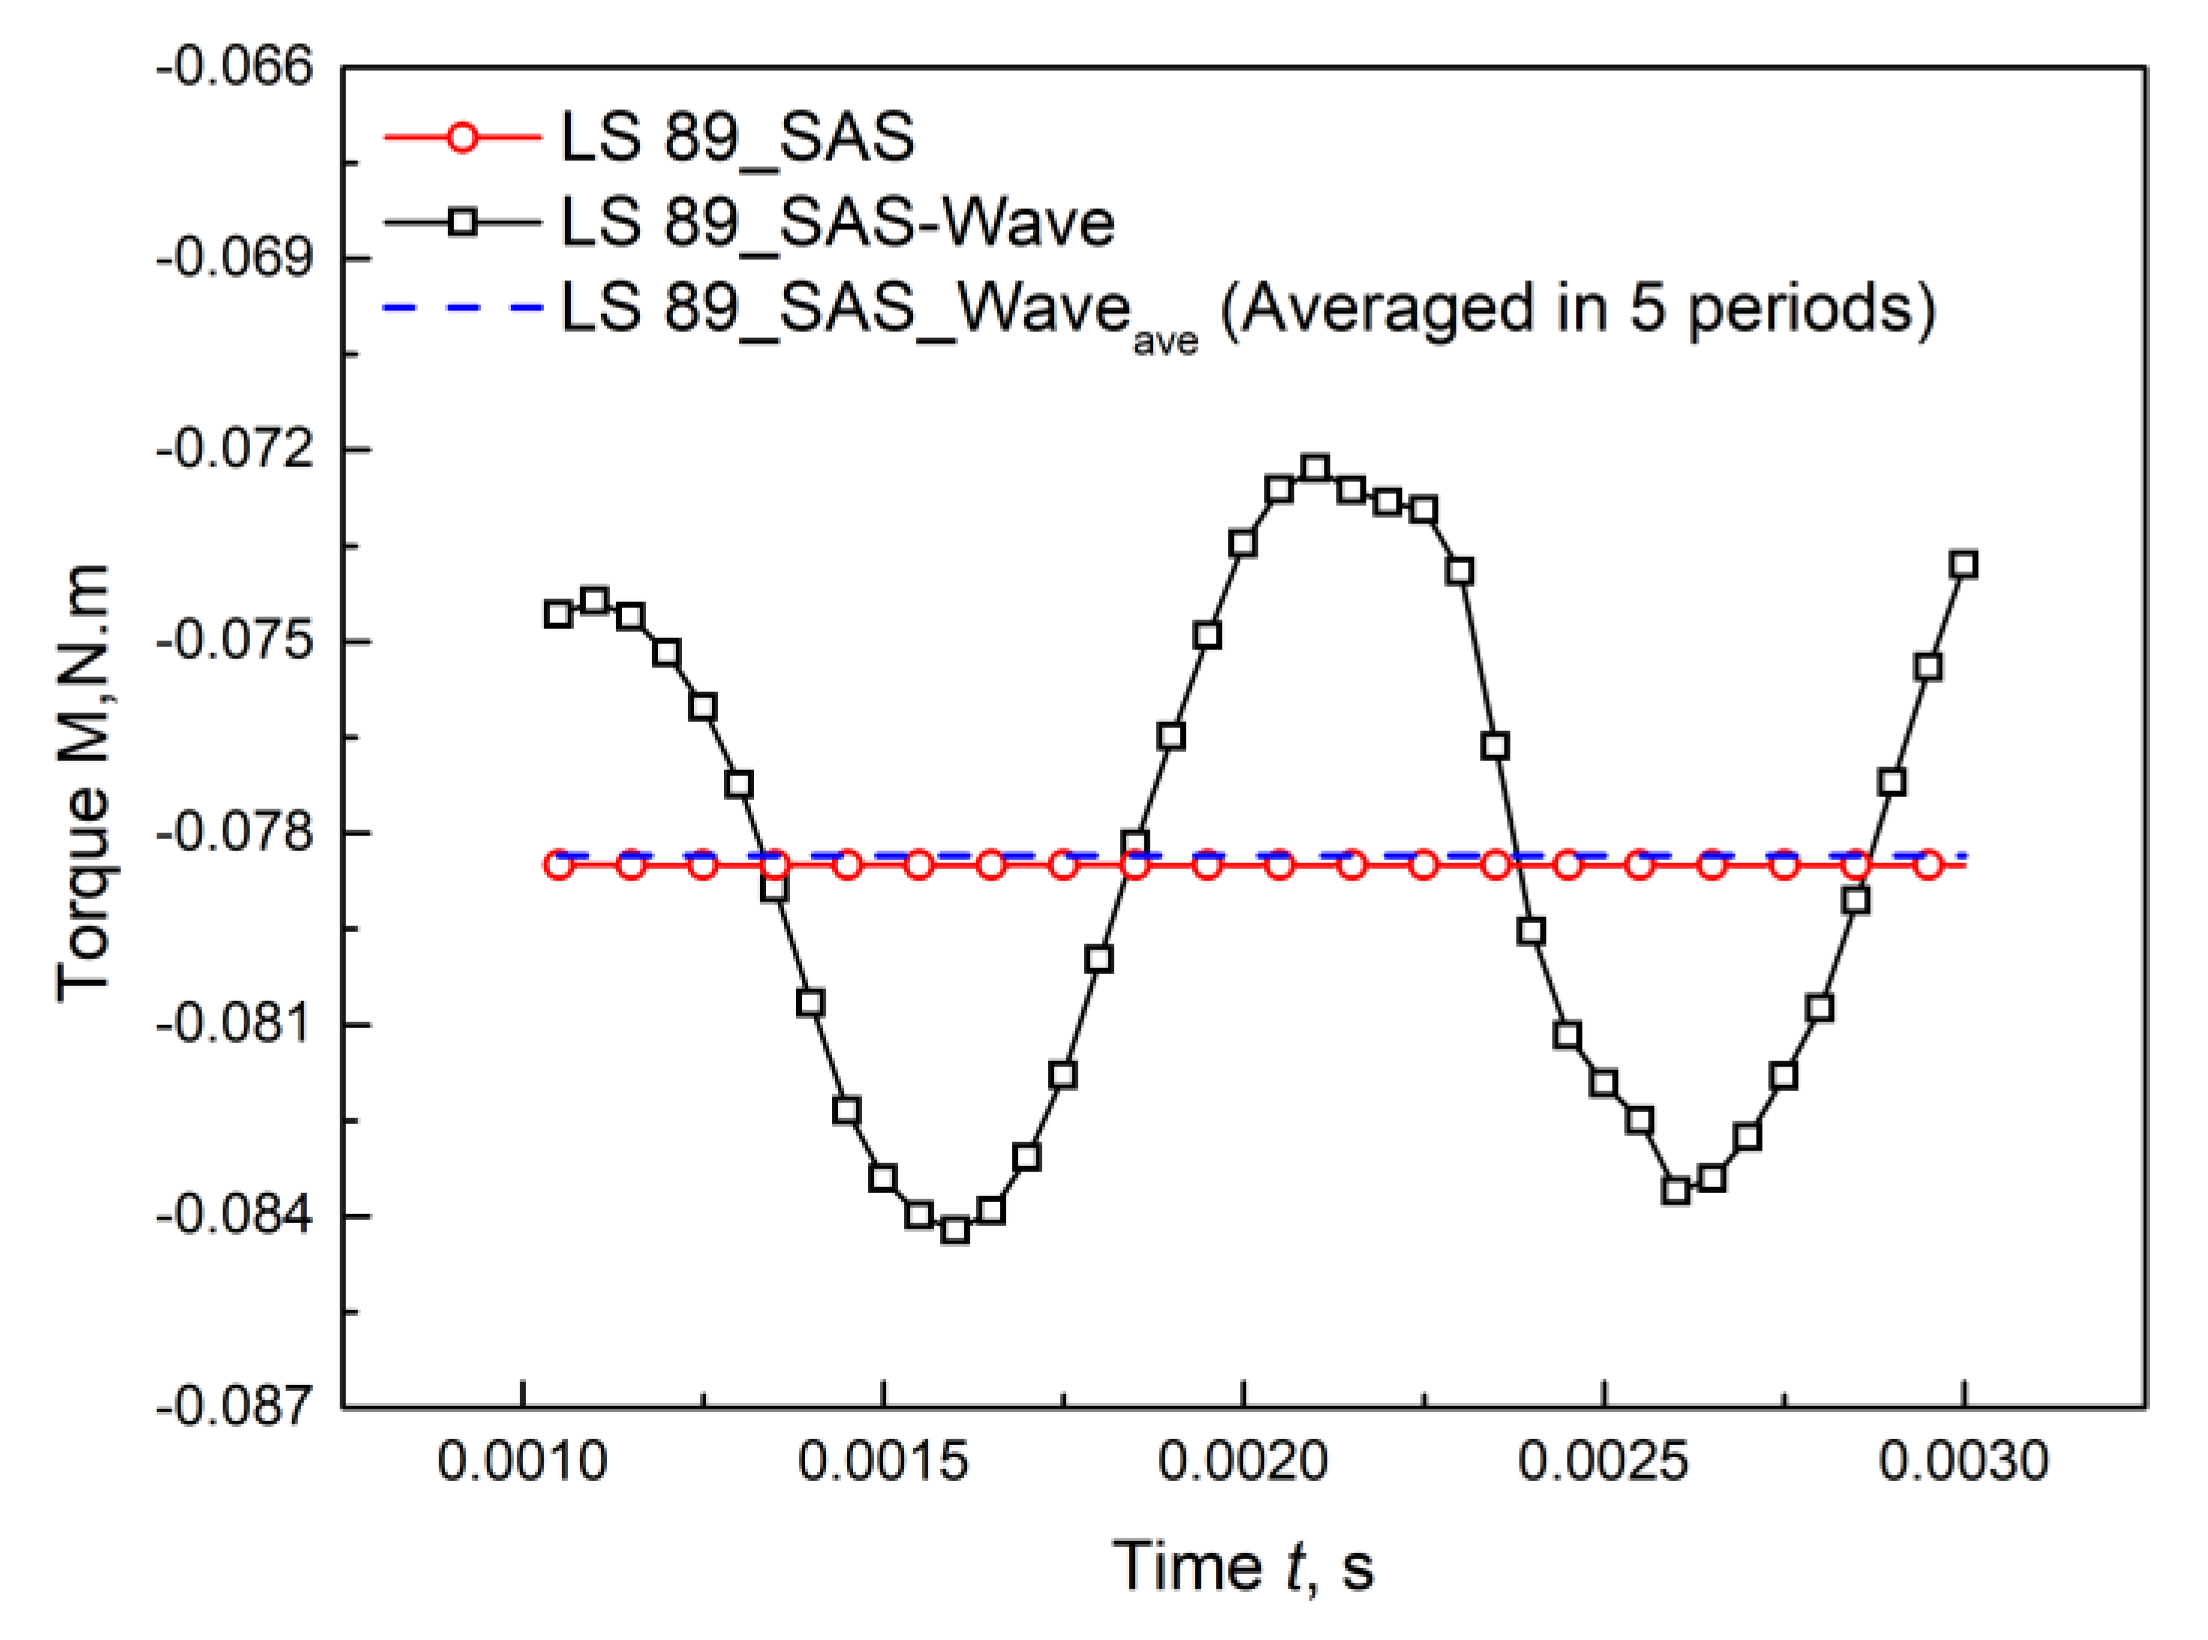
First of all, the variation of torque on the vane is plotted in Figure 8. The black square line represents the change of torque influenced by the entropy wave. The profiles show that the variation of the torque on the vane is not strictly sinusoidal as the imposing fluctuations. This may be caused by the interactions of two adjacent periodic entropy waves affecting the wall pressure distribution of the vane simultaneously. The oscillation magnitude of the torque equals 0.0057 N · m . However, the averaged torque (over five periods) ( M a v e = 0.07835 N · m , blue dash line) is approaching the results without entropy wave ( M = 0.07850 N · m , red circle line).
As the local temperature is increased by the entropy wave, the distribution of instantaneous Mach number is changed. The velocity of the flow is faster on the suction side than on the pressure side (as Figure 5 shows), as the temperature drops more quickly on the suction side. As shown in Figure 9, there appears some supersonic zones (highlighted by the black line box) in the trailing edge area. The largest Mach number in the passage rises from 0.98 to 1.16 when there is an incident entropy wave. Entropy wave may possibly enhance the trailing edge noise, as it presents massive distortions here.

3.2.1. Heat Transfer on the Vane Surface

Since the inlet temperature is modified by the entropy waves, a definition of normalized wall heat flux H’, similar to the concept of the heat transfer coefficients in Equation (7) but the reference temperature is chosen as the averaged inlet temperature, is used here to estimate the variation of the wall heat transfer T i , 0 ¯ = T 01 , as
H = q w a l l T i , 0 ¯ T w a l l
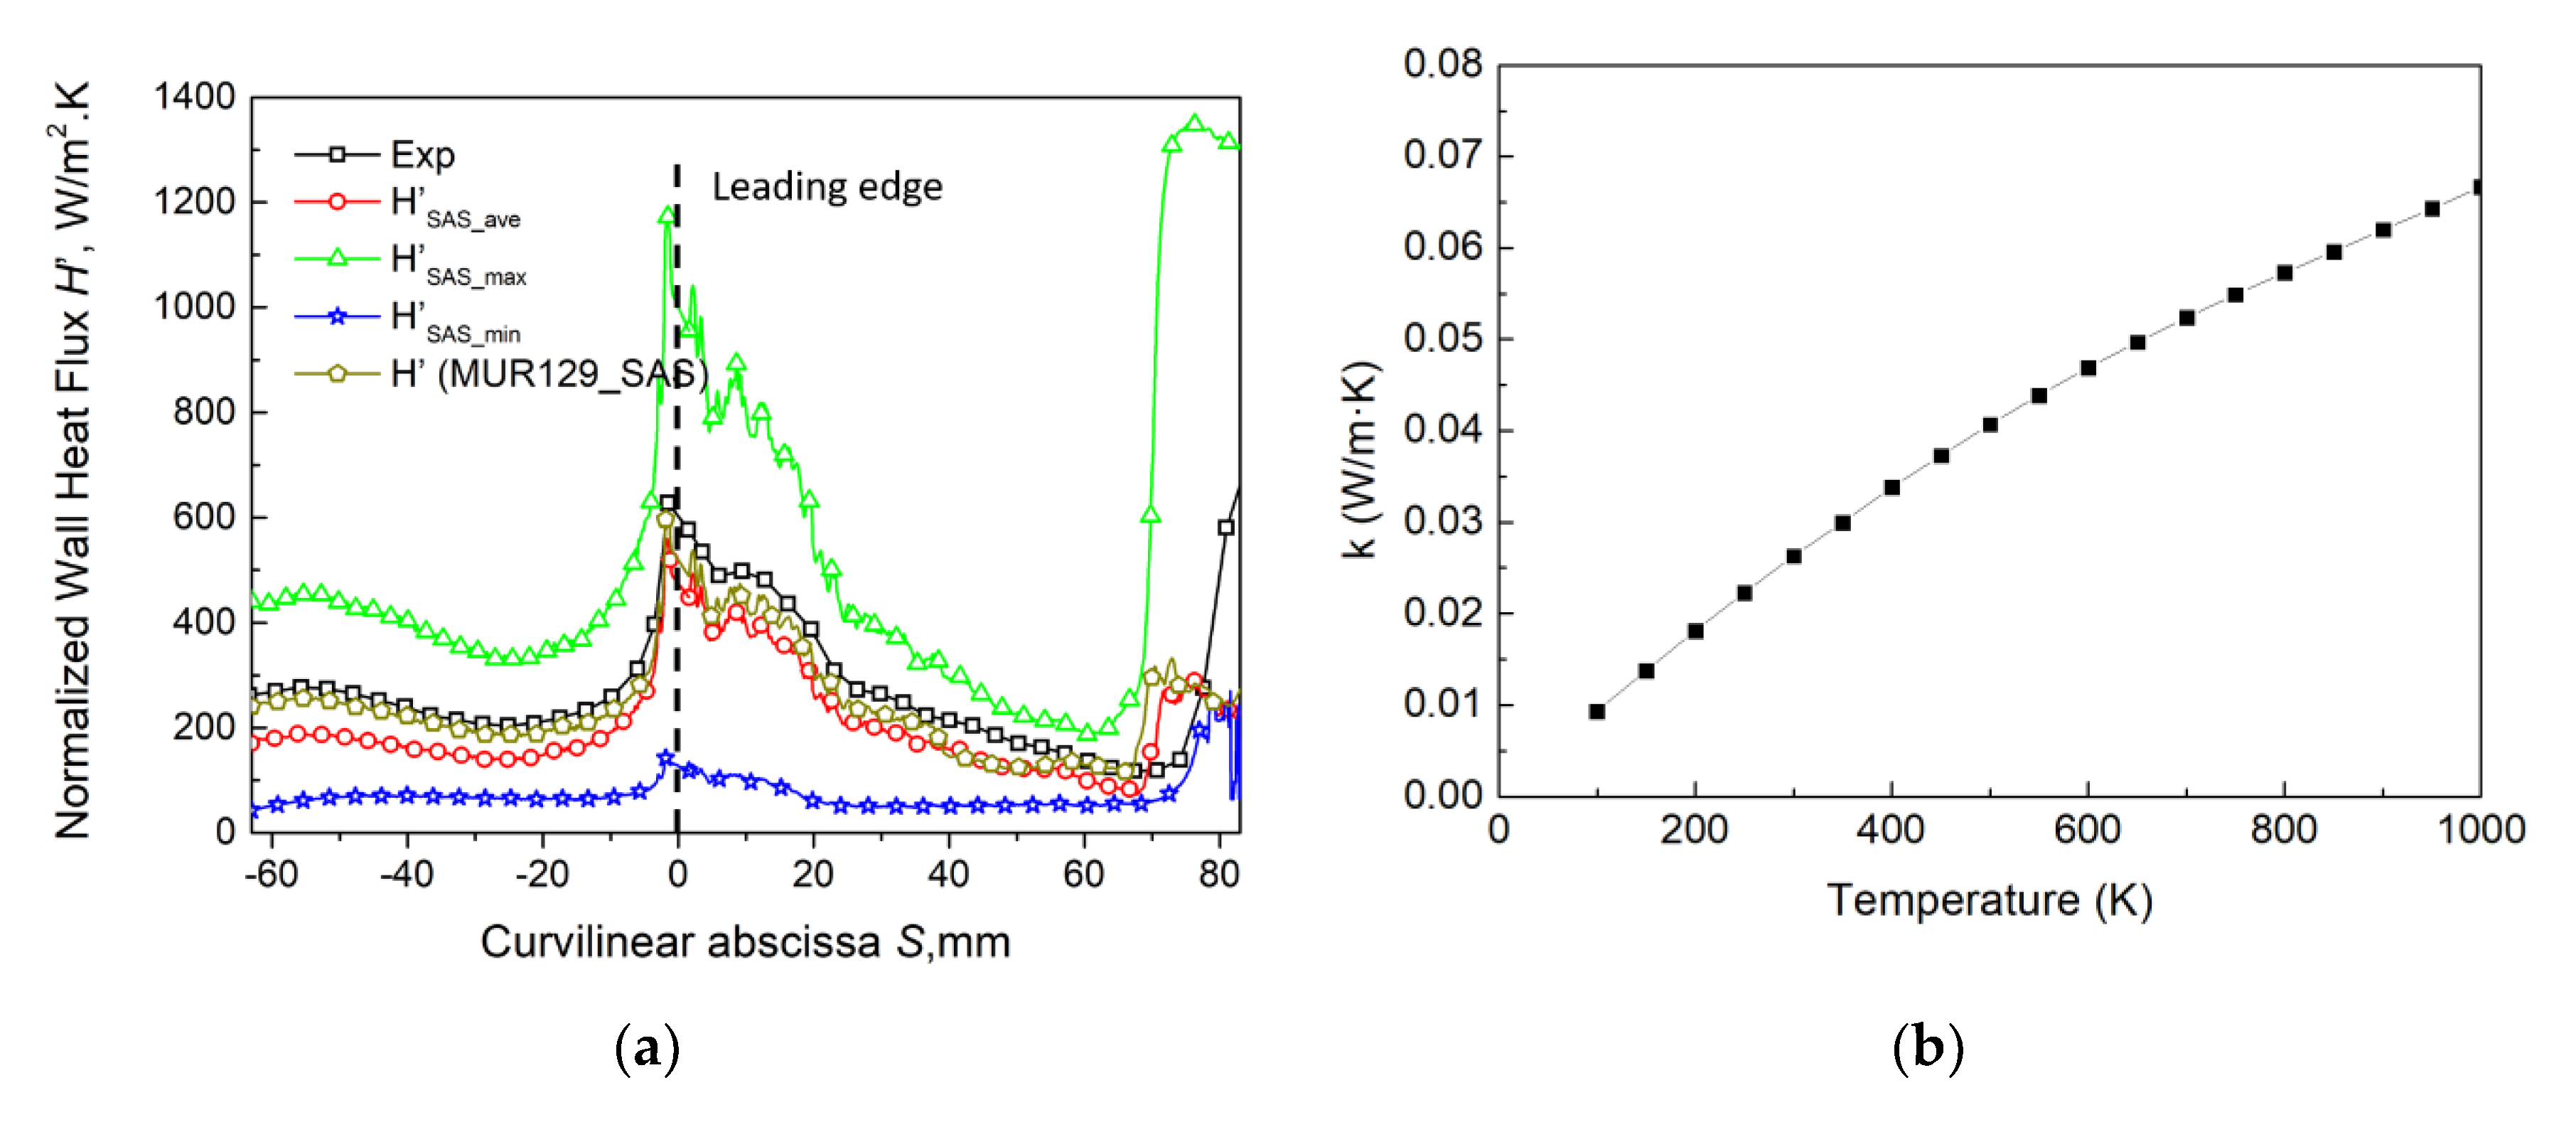
The maximum ( H S A S _ m a x , green triangle line), minimum ( H S A S _ m i n , blue pentagram line), and averaged ( H S A S _ a v e , red circle line) wall heat fluxes (due to the time variation) on the vane surface of the test case MUR129_SAS during five periods are shown in Figure 10a. Since the amplitude of entropy wave is set as 100 K and the inlet temperature is around 400 K, as indicated in Figure 10b, when the temperature rises from 400 K to 500 K or decreases to 300 K, the air thermal conductivity increases or decreases by 20%, thus it could be considered as a factor that affects the heat transfer on the vane surface because the averaged heat transfer coefficient H S A S _ a v e in the forced case increased by 30% relative to the baseline case (MUR129_SAS, Brown pentagon line) on the pressure side. However, with the influence of the inlet entropy wave, it is clear that both H S A S _ m a x and H S A S _ m i n have changed even more. For the maximum heat transfer coefficient ( H S A S _ m a x ), it has nearly doubled at the leading edge, while H S A S _ m i n stays at a small level (yet still reduced by nearly 75% at the leading edge) as the entropy waves pass through. Thus, another important reason for the variation of wall heat transfer is the temperature gradient of the vane surface, which means the thermal boundary layers are changed due to the imposing entropy waves. Moreover, the transition positions indicated by the H S A S _ m a x and H S A S _ m i n are slightly different. The transition position shown by H S A S _ m i n (S = 73 mm) is behind the baseline case (MUR129_SAS).
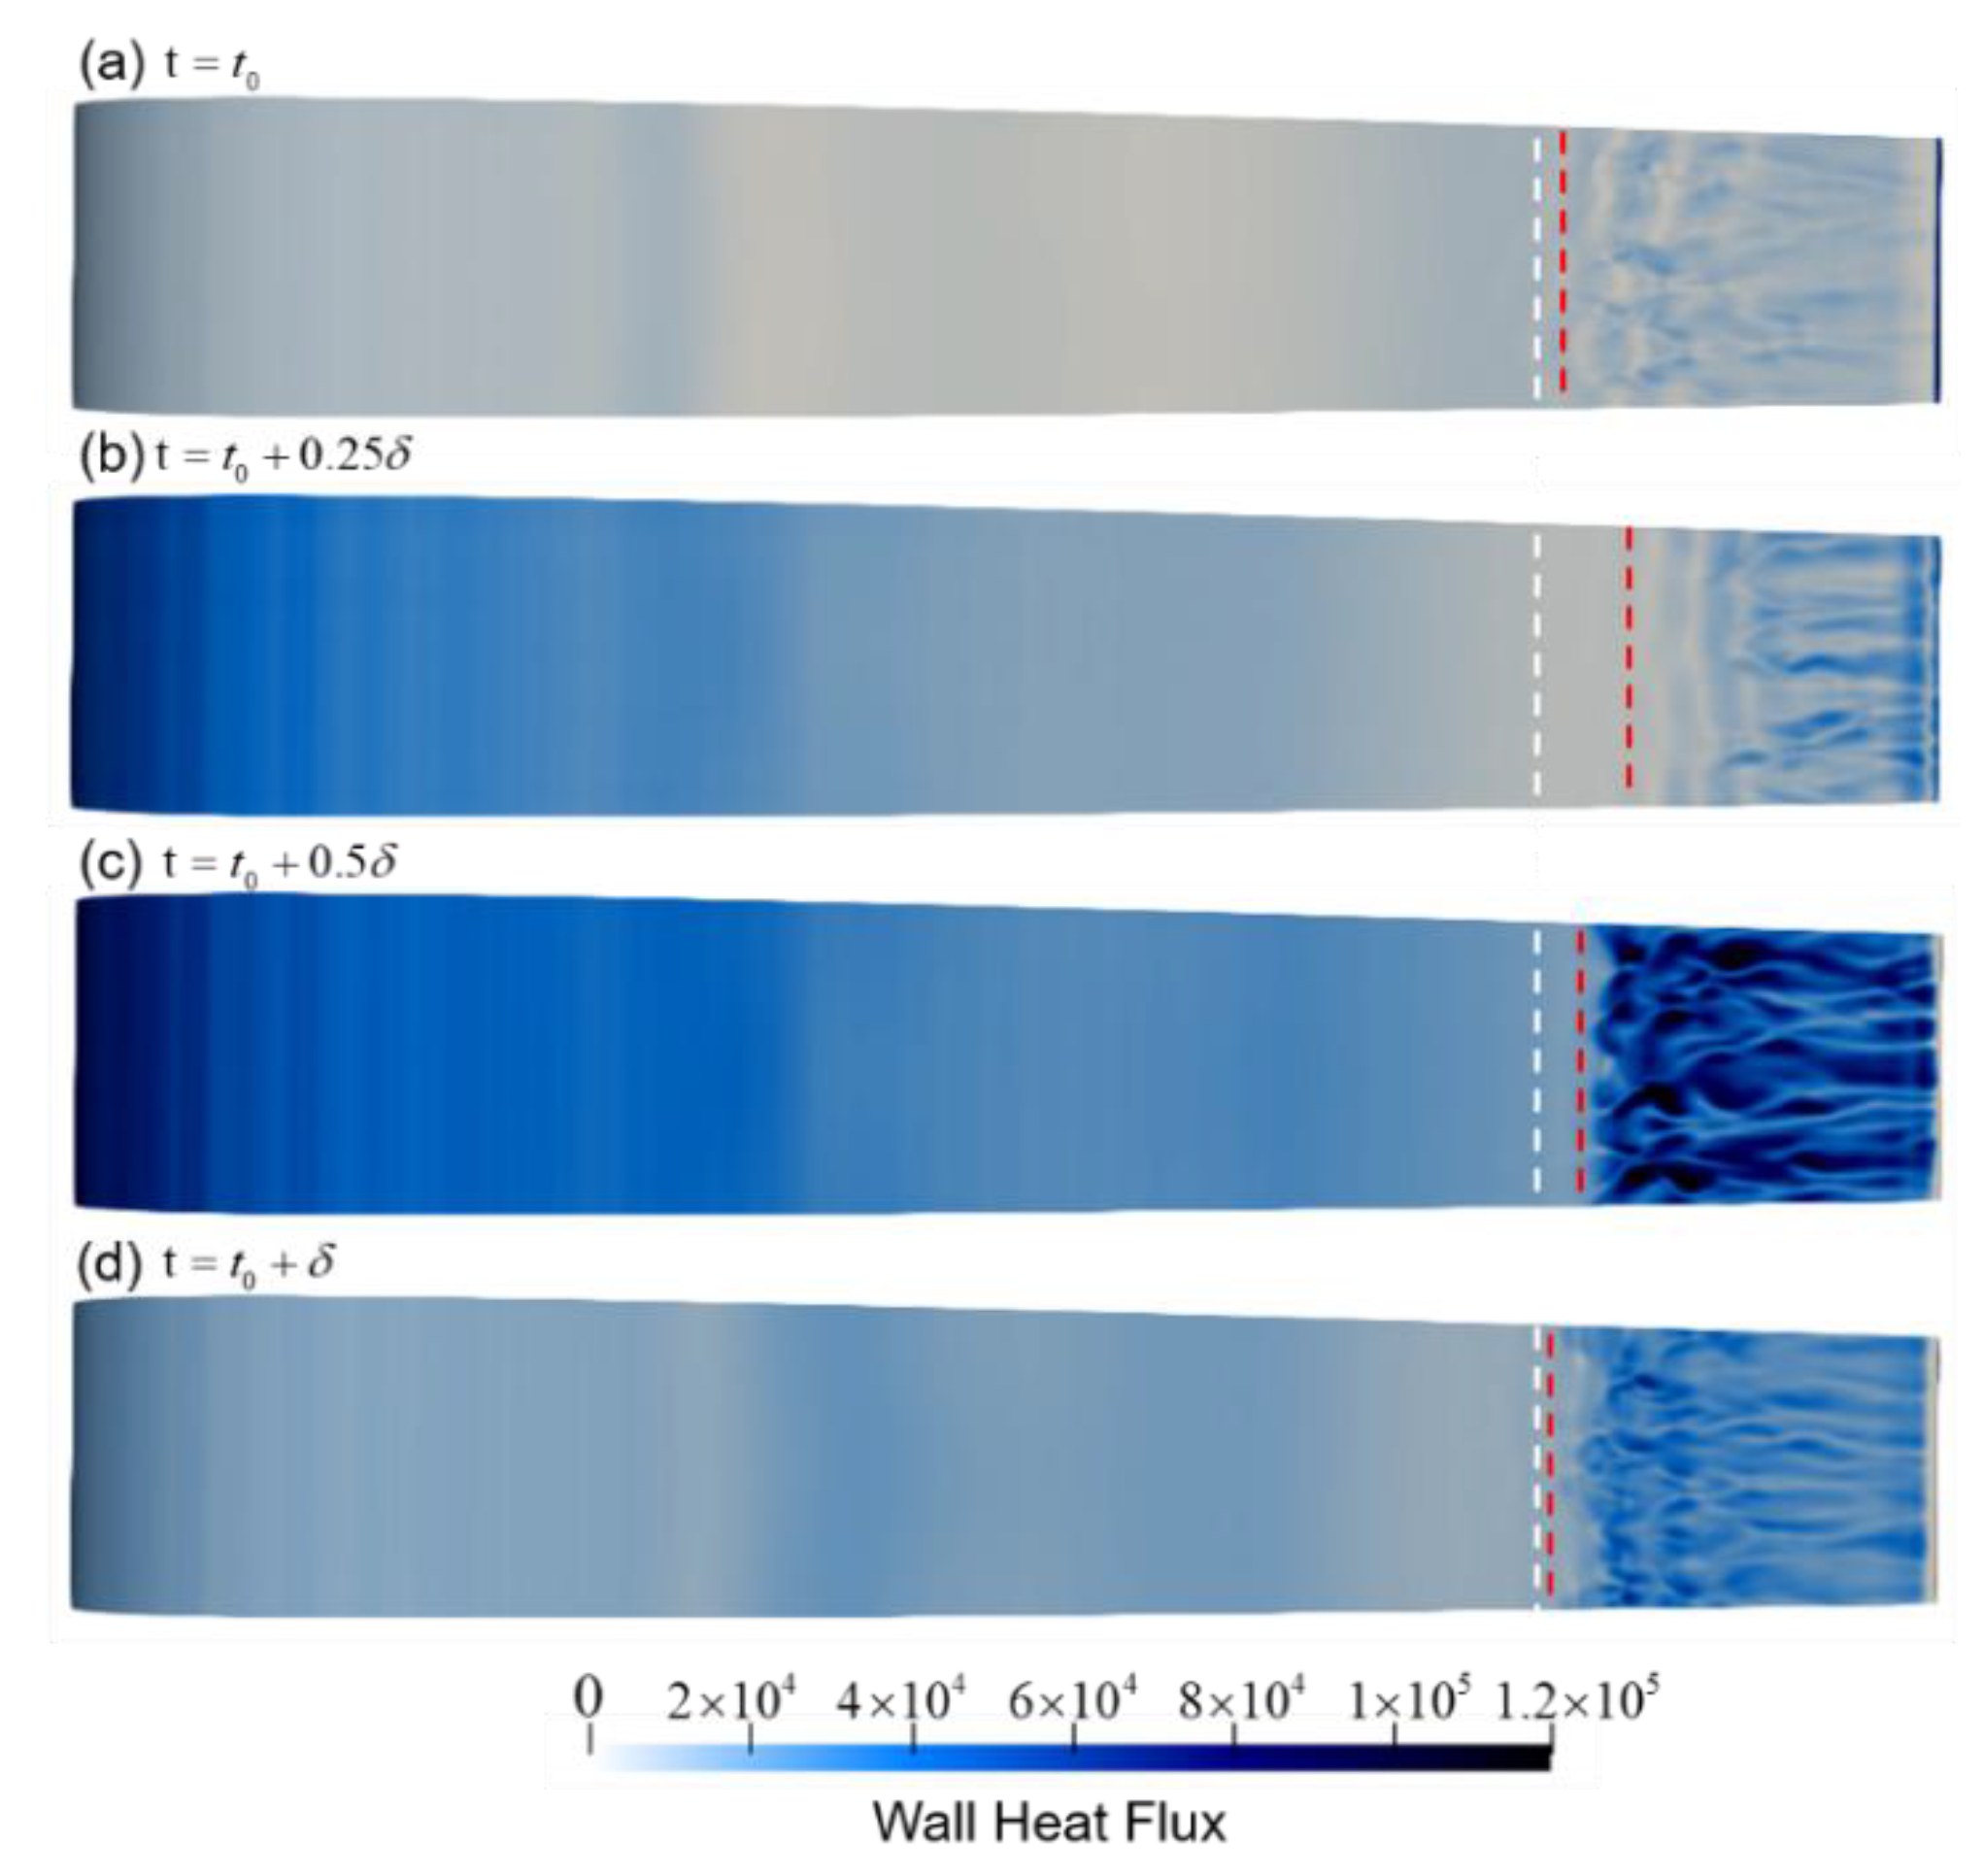
Figure 11 shows the distribution of wall heat flux on the suction side at different moments under the influence of entropy wave in further details. Notice that the white and red dash line represent the transition position of MUR129_SAS (without entropy wave) and MUR129_SAS_Wave (with entropy wave), respectively. After the entropy wave impinges the leading edge, the transition position moves downstream at the first 1/4 period, then the position moves upstream in the last 3/4 period. When t = t 0 + 0.25 δ , the transition position is closest to the trailing edge. In general, due to the effect of the inlet entropy wave, the transition position is delayed slightly compared to the baseline case.

3.2.2. Downstream Acoustic Field

Figure 12 shows the distribution of the instantaneous static pressure. Compared to the result of MUR129_SAS, not only in the throat, but also at the trailing edge area, the magnitude of pressure waves start to oscillate as the entropy wave goes through, the oscillation magnitude at the downstream plane (the black dash line) is around 3660 Pa. To investigate the effect of entropy waves on the pressure fields, the dynamic mode decomposition (DMD) [12] method is performed on the instantaneous data over five periods at mid-span.
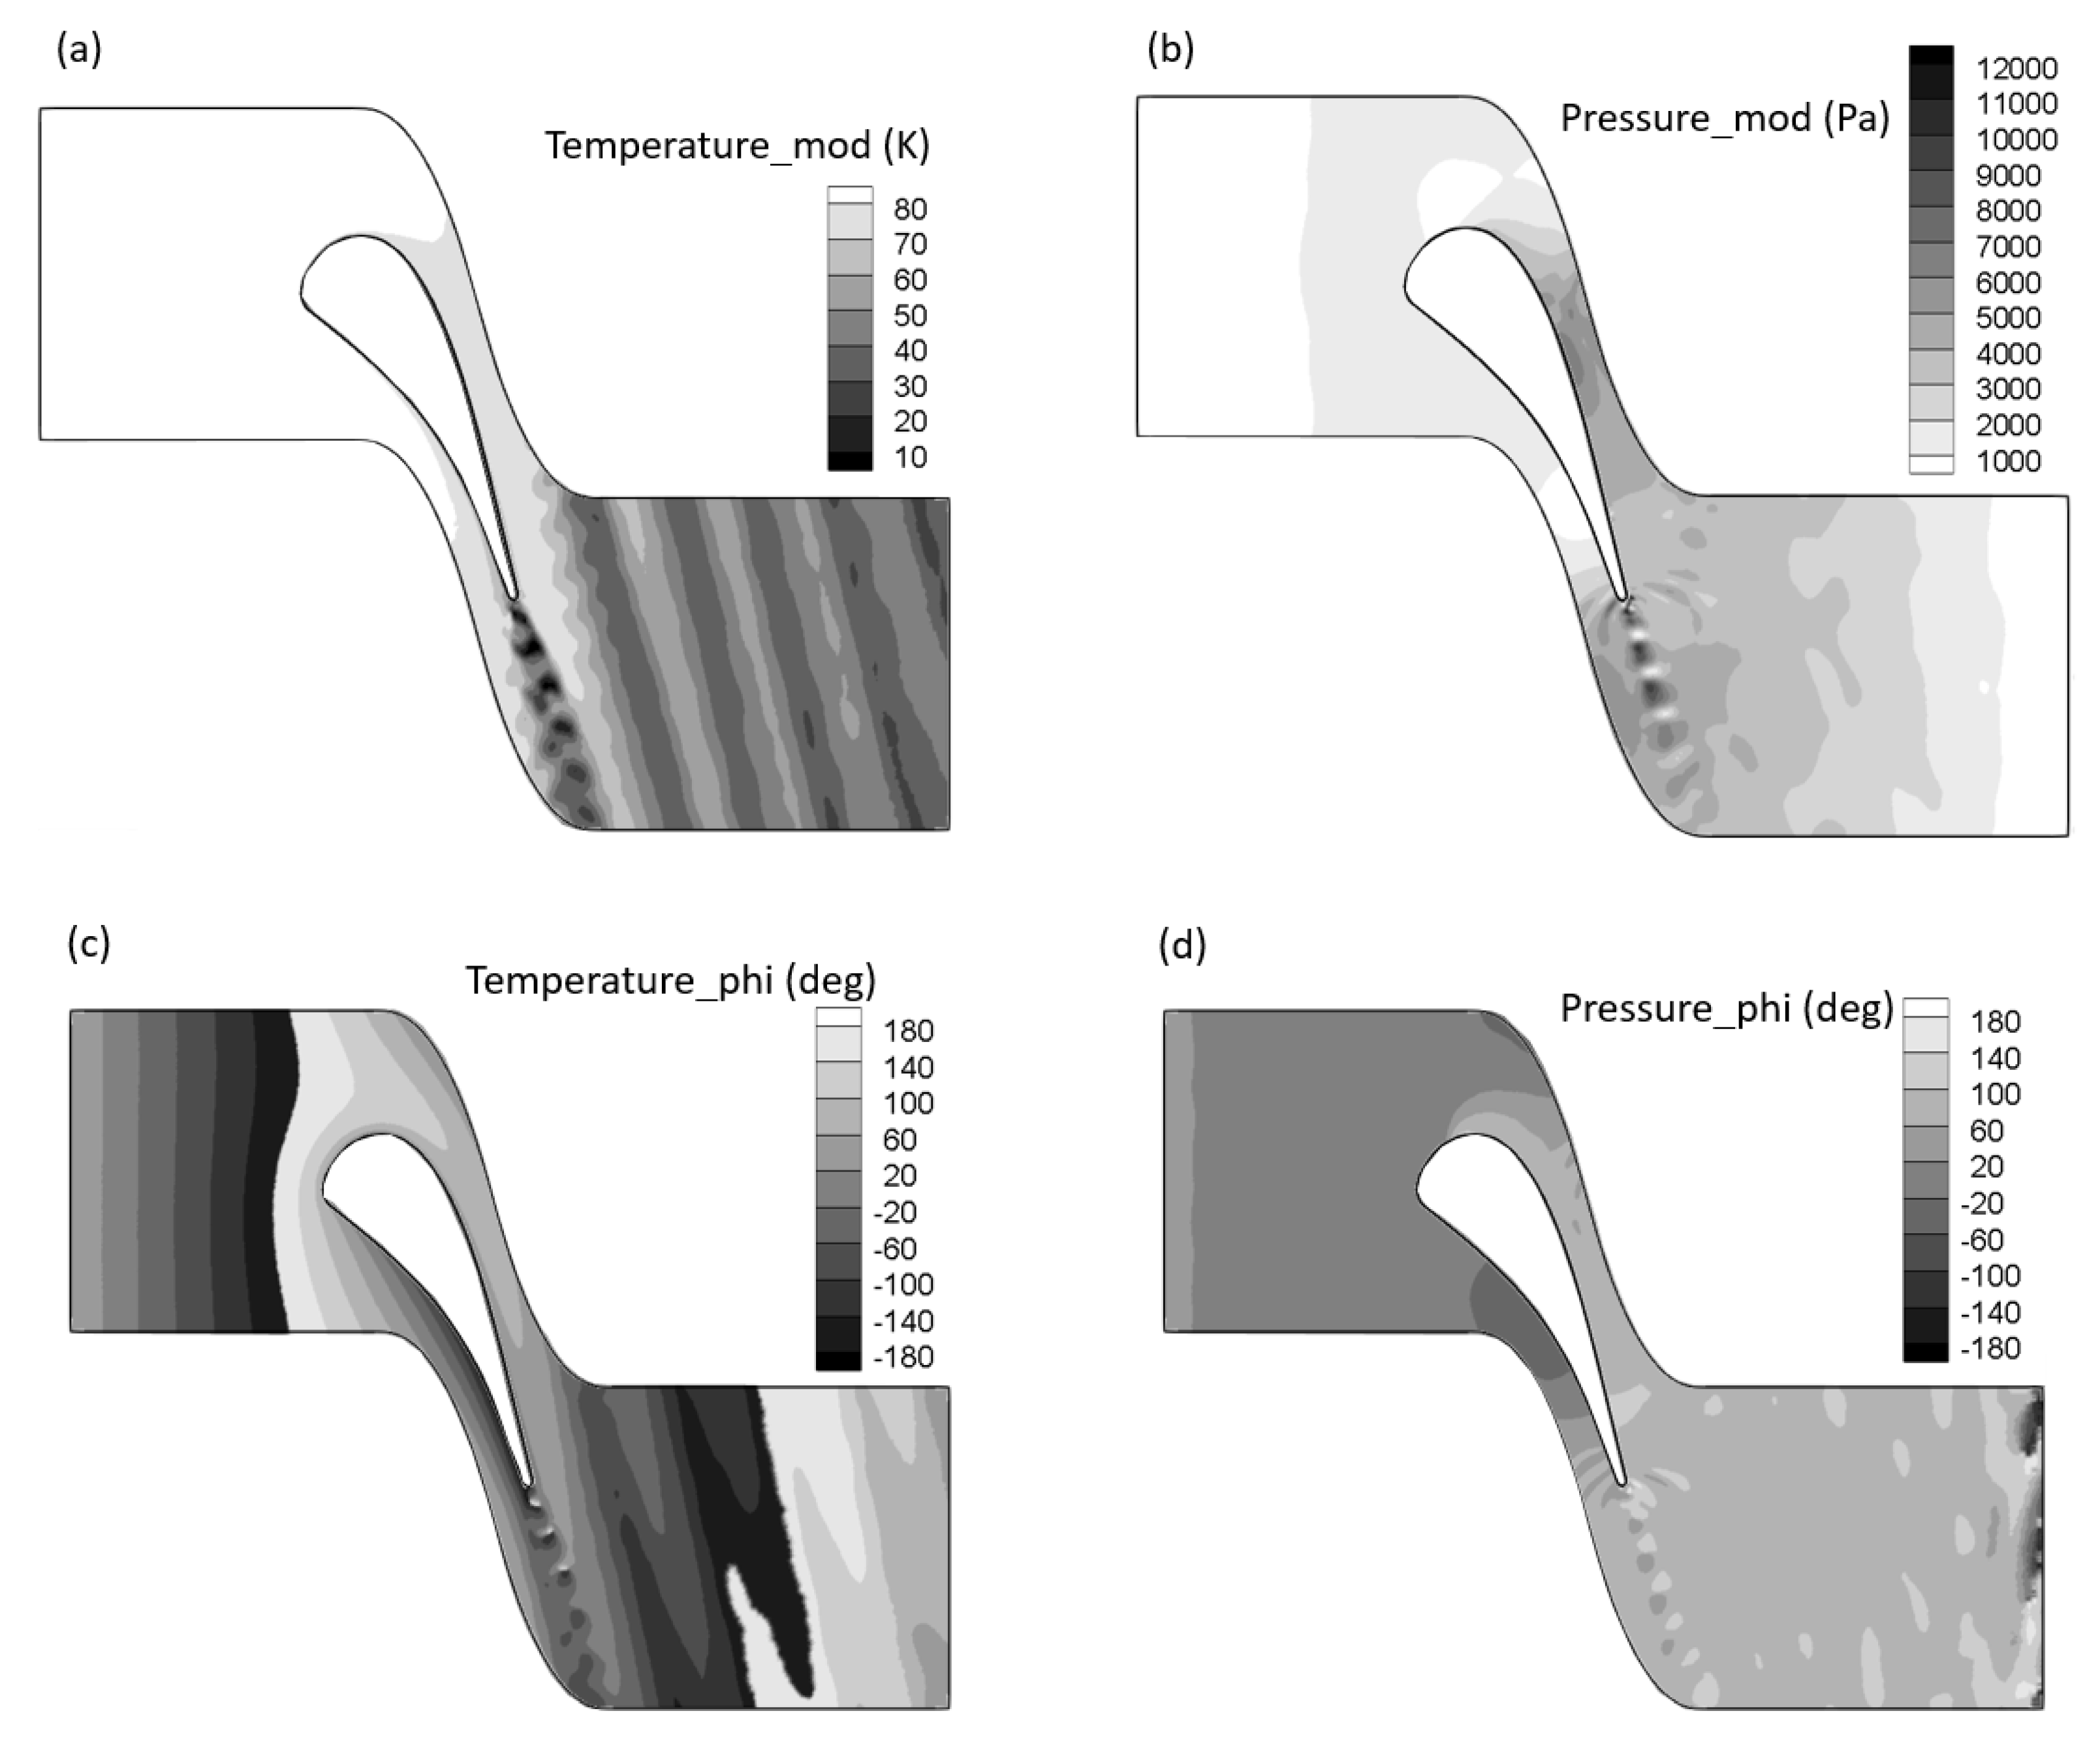
The modulus and phase of both temperature and pressure waves are shown in Figure 13 (under 1 kHz mode). First of all, the temperature modulus at the inlet (Figure 13a) is 100 K as expected from the imposed entropy waves. Similarly, the phase at the inlet section which is indicated by Figure 13c shows that the entropy wave stays in the plane wave form until it is about to impinge the leading edge of the guide vane. Then the modulus begins to distort as the (entropy wave) goes through. The phase also implies a different distortion between the pressure side and suction side, due to the different flow acceleration as the Figure 12A shown.
As seen in Figure 12, the oscillation magnitude of the pressure wave at the throat is increased. The modulus of pressure (Figure 13b) shows a peak on the suction side where the acceleration of the flow is strong. Meanwhile, the highest pressure modulus is found near the trailing edge area, which is most likely caused by the interaction with the wake. However, the phase stays almost the same in the throat around the suction side (Figure 13d).
Moreover, DMD is also performed in x-normal axial planes (represented by black dash lines in Figure 12) which are 20 mm from the inlet and the outlet to detect the propagation of the generated acoustic waves [11]. The interested variables (like pressure, density) are performed at same time. The downstream propagating acoustic wave can be described as w + = p / γ p ¯ + u / c ¯ , while the upstream propagating acoustic wave is given by w = p / γ p ¯ u / c ¯ . The entropy wave can be calculated by the equation w s = p / γ p ¯ ρ / ρ ¯ . The prime represents fluctuations and the overbar indicates time-averaged variables, γ stands for the heat capacity ratio, ρ is the flow density, and p is the static pressure. The entropy wave attenuation is defined as β s = w 2 s / w 0 s , and the acoustic wave reflection as β r = w 0 / w 0 s and the transmission as β t = w 2 + / w 0 s , where subscripts 0 and 2 represent the inlet and outlet of the domain (as indicated in Table 1), respectively. The calculated coefficients are given in Table 2 where they are also compared with the compact theory [7,31].
Regarding the entropy wave attenuation, the calculation coefficients processed by DMD indicate that the injected entropy wave has been dissipated a bit, while as the compact theory completely neglects the attenuation process during the transmitting. The residual entropy waves may still able to enhance the downstream noise as the highest-pressure modulus is found to be located at the trailing edge area. This could be caused by the relatively big temperature amplitude of the injected entropy wave (100 K). For the acoustic wave reflection, the coefficient is slightly smaller than the theoretical value, which may be because the high-pressure zones in the throat prevent the acoustic waves generated downstream from propagating upstream (inlet area). Moreover, for the acoustic wave transmission, the coefficient is bigger than the theoretical value, this is because, in the compact theory (2), assuming the entropy waves are just convecting through the turbine blades with no distortion might lead to the differences of results between the simulations and theory. The downstream propagating acoustic wave may get enhanced due to the wakes as the highest pressure modulus found near the trailing edge area.

4. Conclusions

This paper has investigated the pressure field and wall heat transfer characteristics of a high-pressure turbine guide vane. A complementary analysis, including the indirect combustion noise generation, has also been conducted by adding an entropy wave at the inlet at a constant frequency (1 kHz) with a typical amplitude (100 K). The transition of the boundary layer and the heat transfer of the vane surface has also been evaluated.
First, two different turbulence models—the k-ω and SAS models—have been compared by calculating two baseline cases. The isentropic Mach number along the vane surface shows essentially no difference between the two turbulence models. However, for the heat transfer coefficients, the results of the SAS model are in better agreement with the experimental data. In addition, the SAS model is capable of capturing more flow details such as the vortex shedding, reflecting pressure waves, and the transition position.
Second, after setting an entropy wave train at the inlet, wall heat flux of the vane surface is modified, as the entropy wave goes through the vane row. The maximum wall heat flux is nearly doubled at the leading edge, while the minimum wall heat flux remains relatively small. Moreover, influenced by the inlet entropy wave, the transition position is modified. The position implied by the three heat transfer coefficients (which are MUR129_k-ð, MUR129_SAS, and MUR129_SAS_Wave) are slightly different. The instantaneous position is modified periodically around the position of the baseline case. Besides, the torque on the vane is also changed, while the time averaged torque approaches the results of the baseline case.
Finally, the DMD method is applied to investigate the influence of entropy waves on the pressure fields. The oscillation magnitude of the pressure wave at the throat is enhanced due to the inlet entropy wave, some peak on the suction side can be observed as the acceleration of the flow is strong. The propagation coefficient of the entropy waves and the reflection and transmission coefficients of acoustic waves are calculated. Meanwhile, the highest-pressure modulus is found to be located at the trailing edge area, which may mean the entropy wave would probably enhance the trailing-edge noise. As the Marble’s [3] theoretical approach completely neglects the entropy wave attenuation process, the entropy waves are transmitted less efficiently to downstream fields than the theory. The reflected acoustic waves are slightly weaker than in the compact theory. However, the transmitted acoustic waves become stronger than the theoretical results, and may therefore amplify some potential acoustic instabilities in the flow field and likely induce some extra indirect noise.
Although the above two models (k-ω and SAS model) can get reasonable results in a relatively short time, a more accurate turbulence model that costs more computational resources named ‘large eddy simulation’ will be used in the future work. Meanwhile, entropy waves of different amplitudes and frequencies will be employed to obtain more systematic conclusions. Moreover, if the test cases can be conducted in the experiments, the conclusions of the present work will be more convincing.

Author Contributions

All the calculation and writing: K.H.; Data curation: Y.F.; Project administration: Y.Z.; Project administration, writing—review and editing: G.W., S.M. All authors have read and agreed to the published version of the manuscript.

Funding

This research was funded by National Natural Science Foundation of China (51976184, 91841302).

Conflicts of Interest

The authors declare no conflict of interest.

References

  1. Nesbitt, E. Towards a quieter low pressure turbine: Design characteristics and prediction needs. Int. J. Aeroacoustics 2010, 10, 1–15. [Google Scholar] [CrossRef]
  2. Candel, S. Analytical Studies of Some Acoustic Problems of Jet Engines. Ph.D. Thesis, California Institute of Technology, Pasadena, CA, USA, 1972. [Google Scholar]
  3. Marble, F.; Candel, S. Acoustic disturbance from gas non-uniformities convected through a nozzle. J. Sound Vib. 1977, 55, 225–243. [Google Scholar] [CrossRef]
  4. Cumpsty, N.; Marble, F. The interaction of entropy fluctuations with turbine blade rows; a mechanism of turbojet engine noise. Proc. R. Soc. Lond. A Math. Phys. Sci. 1977, 357, 323–344. [Google Scholar]
  5. Yoon, M. The entropy wave generation in a heated one-dimensional duct. J. Fluid Mech. 2019, 883, A44. [Google Scholar] [CrossRef]
  6. Morgans, A.S.; Duran, I. Entropy noise: A review of theory, progress and challenges. Int. J. Spray Combust. Dyn. 2016, 8, 285–298. [Google Scholar] [CrossRef] [Green Version]
  7. Moreau, S.; Duran, I. (Eds.) Analytical and Numerical Study of the Entropy Wave Generator Experiment on Indirect Combustion Noise. In Proceedings of the 17th AIAA/CEAS Aeroacoustics Conference (32nd AIAA Aeroacoustics Conference), Portland, OR, USA, 5–8 June 2011. [Google Scholar]
  8. Bake, F.; Kings, N.; Fischer, A. Experimental investigation of the entropy noise mechanism in aero-engines. Int. J. Aeroacoustics 2009, 8, 125–141. [Google Scholar] [CrossRef]
  9. Leyko, M.; Nicoud, F.; Moreau, S. Numerical and analytical investigation of the indirect combustion noise in a nozzl. Comptes Rendus Mécanique 2009, 337, 415–425. [Google Scholar] [CrossRef] [Green Version]
  10. Duran, I.; Moreau, S. Study of the Attenuation of Waves Propagating through Fixed and Rotating Turbine Blades. In Proceedings of the 18th AIAA/CEAS Aeroacoustics Conference (33rd AIAA Aeroacoustics Conference), Colorado Springs, CO, USA, 4–6 June 2012. [Google Scholar]
  11. Wang, G.; Sanjose, M.; Moreau, S.; Papadogiannis, D.; Duchaine, F.; Gicquel, L. Noise mechanisms in a transonic high-pressure turbine stage. Int. J. Aeroacoustics 2016, 15, 144–161. [Google Scholar] [CrossRef]
  12. Papadogiannis, D.; Wang, G.; Moreau, S.; Duchaine, F.; Gicquel, L.; Nicoud, F. Assessment of the indirect combustion noise generated in a transonic high-pressure turbine stage. J. Eng. Gas Turbines Power 2016, 138, 041503. [Google Scholar] [CrossRef]
  13. Ceci, A.; Gojon, R.; Mihaescu, M. Large Eddy Simulations for Indirect Combustion Noise Assessment in a Nozzle Guide Vane Passage. Flow, Turbul. Combust. 2019, 102, 299–311. [Google Scholar] [CrossRef] [Green Version]
  14. Becerril, C.; Moreau, S.; Gicquel, L. (Eds.) Study of Combustion Noise Generation in a Realistic Turbine Stage Configuration. In Proceedings of the ASME Turbo Expo 2018: Turbomachinery Technical Conference and Exposition, Oslo, Norway, 11–15 June 2018. [Google Scholar]
  15. Wheeler, A.P.; Sandberg, R.D.; Sandham, N.D.; Pichler, R.; Michelassi, V.; Laskowski, G. Direct numerical simulations of a high-pressure turbine vane. J. Turbomach. 2016, 138, 071003. [Google Scholar] [CrossRef]
  16. Morata, E.C.; Gourdain, N.; Duchaine, F.; Gicquel, L. Effects of free-stream turbulence on high pressure turbine blade heat transfer predicted by structured and unstructured LES. Int. J. Heat Mass Transf. 2012, 55, 5754–5768. [Google Scholar] [CrossRef]
  17. Gourdain, N.; Gicquel, L.Y.; Collado, E. Comparison of RANS and LES for prediction of wall heat transfer in a highly loaded turbine guide vane. J. Propuls. Power 2012, 28, 423–433. [Google Scholar] [CrossRef]
  18. Phan, H.M.; Duan, P.H.; Dinh, C.T. Numerical aero-thermal study of high-pressure turbine nozzle guide vane: Effects of inflow conditions. Phys. Fluids 2020, 32, 034111. [Google Scholar] [CrossRef]
  19. Menter, F.R. Two-equation eddy-viscosity turbulence models for engineering applications. AIAA J. 1994, 32, 1598–1605. [Google Scholar] [CrossRef] [Green Version]
  20. Menter, F.R.; Kuntz, M.; Bender, R. A Scale-Adaptive Simulation Model for Turbulent Flow Predictions. In Proceedings of the 41st Aerospace Sciences Meeting and Exhibit, Reno, NV, USA, 6–9 January 2003. [Google Scholar]
  21. Schmid, P.J. Dynamic mode decomposition of numerical and experimental data. J. Fluid Mech. 2010, 656, 5–28. [Google Scholar] [CrossRef] [Green Version]
  22. Antares Development Team, Antares Documentation Release 1.14.0. Available online: https://cerfacs.fr/antares/ (accessed on 3 June 2020).
  23. Consigny, H.; Richards, B. Short duration measurements of heat-transfer rate to a gas turbine rotor blade. J. Eng. Power 1982, 104, 542–550. [Google Scholar] [CrossRef]
  24. Arts, T.; Lambertderouvroit, M.; Rutherford, A. Aero-Thermal Investigation of a Highly Loaded Transonic Linear Turbine Guide Vane Cascade; Technical Note 174. Von Karman Institute for Fluid Dynamics: Sint-Genesius-Rode, Belgium, 1990. [Google Scholar]
  25. Pouangu, A.F.; Sanjos, M.; Moreau, S. Subsonic Jet Noise Simulations Using Both Structured and Unstructured Grids. AIAA J. 2015, 53, 55–69. [Google Scholar] [CrossRef] [Green Version]
  26. Hiller, S.; Seitz, P. Interaction Between a Fluidic Actuator and Main Flow Using SAS Turbulence Modelling. In Proceedings of the 3rd AIAA Flow Control Conference, San Francisco, CA, USA, 5–8 June 2006. [Google Scholar]
  27. Winkler, C.; Dorgan, A.; Mani, M. Scale Adaptive Simulations of Turbulent Flows on Unstructured Grids. In Proceedings of the 20th AIAA Computational Fluid Dynamics Conference, Honolulu, GA, USA, 27–30 June 2011. [Google Scholar]
  28. Wang, Y.; Liu, K.; Song, W.-P. Scale-Adaptive Simulations of Unsteady Flow around NACA0021 Airfoil at 60° angle of attack. In Proceedings of the AIAA Scitech 2019 Forum, San Diego, CA, USA, 7–11 January 2019. [Google Scholar]
  29. Menter, F.R. A Correlation-Based Transition Model Using Local Variables—Part I: Model Formulation. ASME J. Turbomach. 2006, 128, 413–42230. [Google Scholar] [CrossRef]
  30. Ansys CFX. CFX User Manual. Ansys Inc.: Canonsburg, PA, USA, 2017. [Google Scholar]
  31. Leyko, M.; Duran, I.; Moreau, S. Simulation and modelling of the waves transmission and generation in a stator blade row in a combustion-noise framework. J. Sound Vib. 2014, 333, 6090–6106. [Google Scholar] [CrossRef] [Green Version]
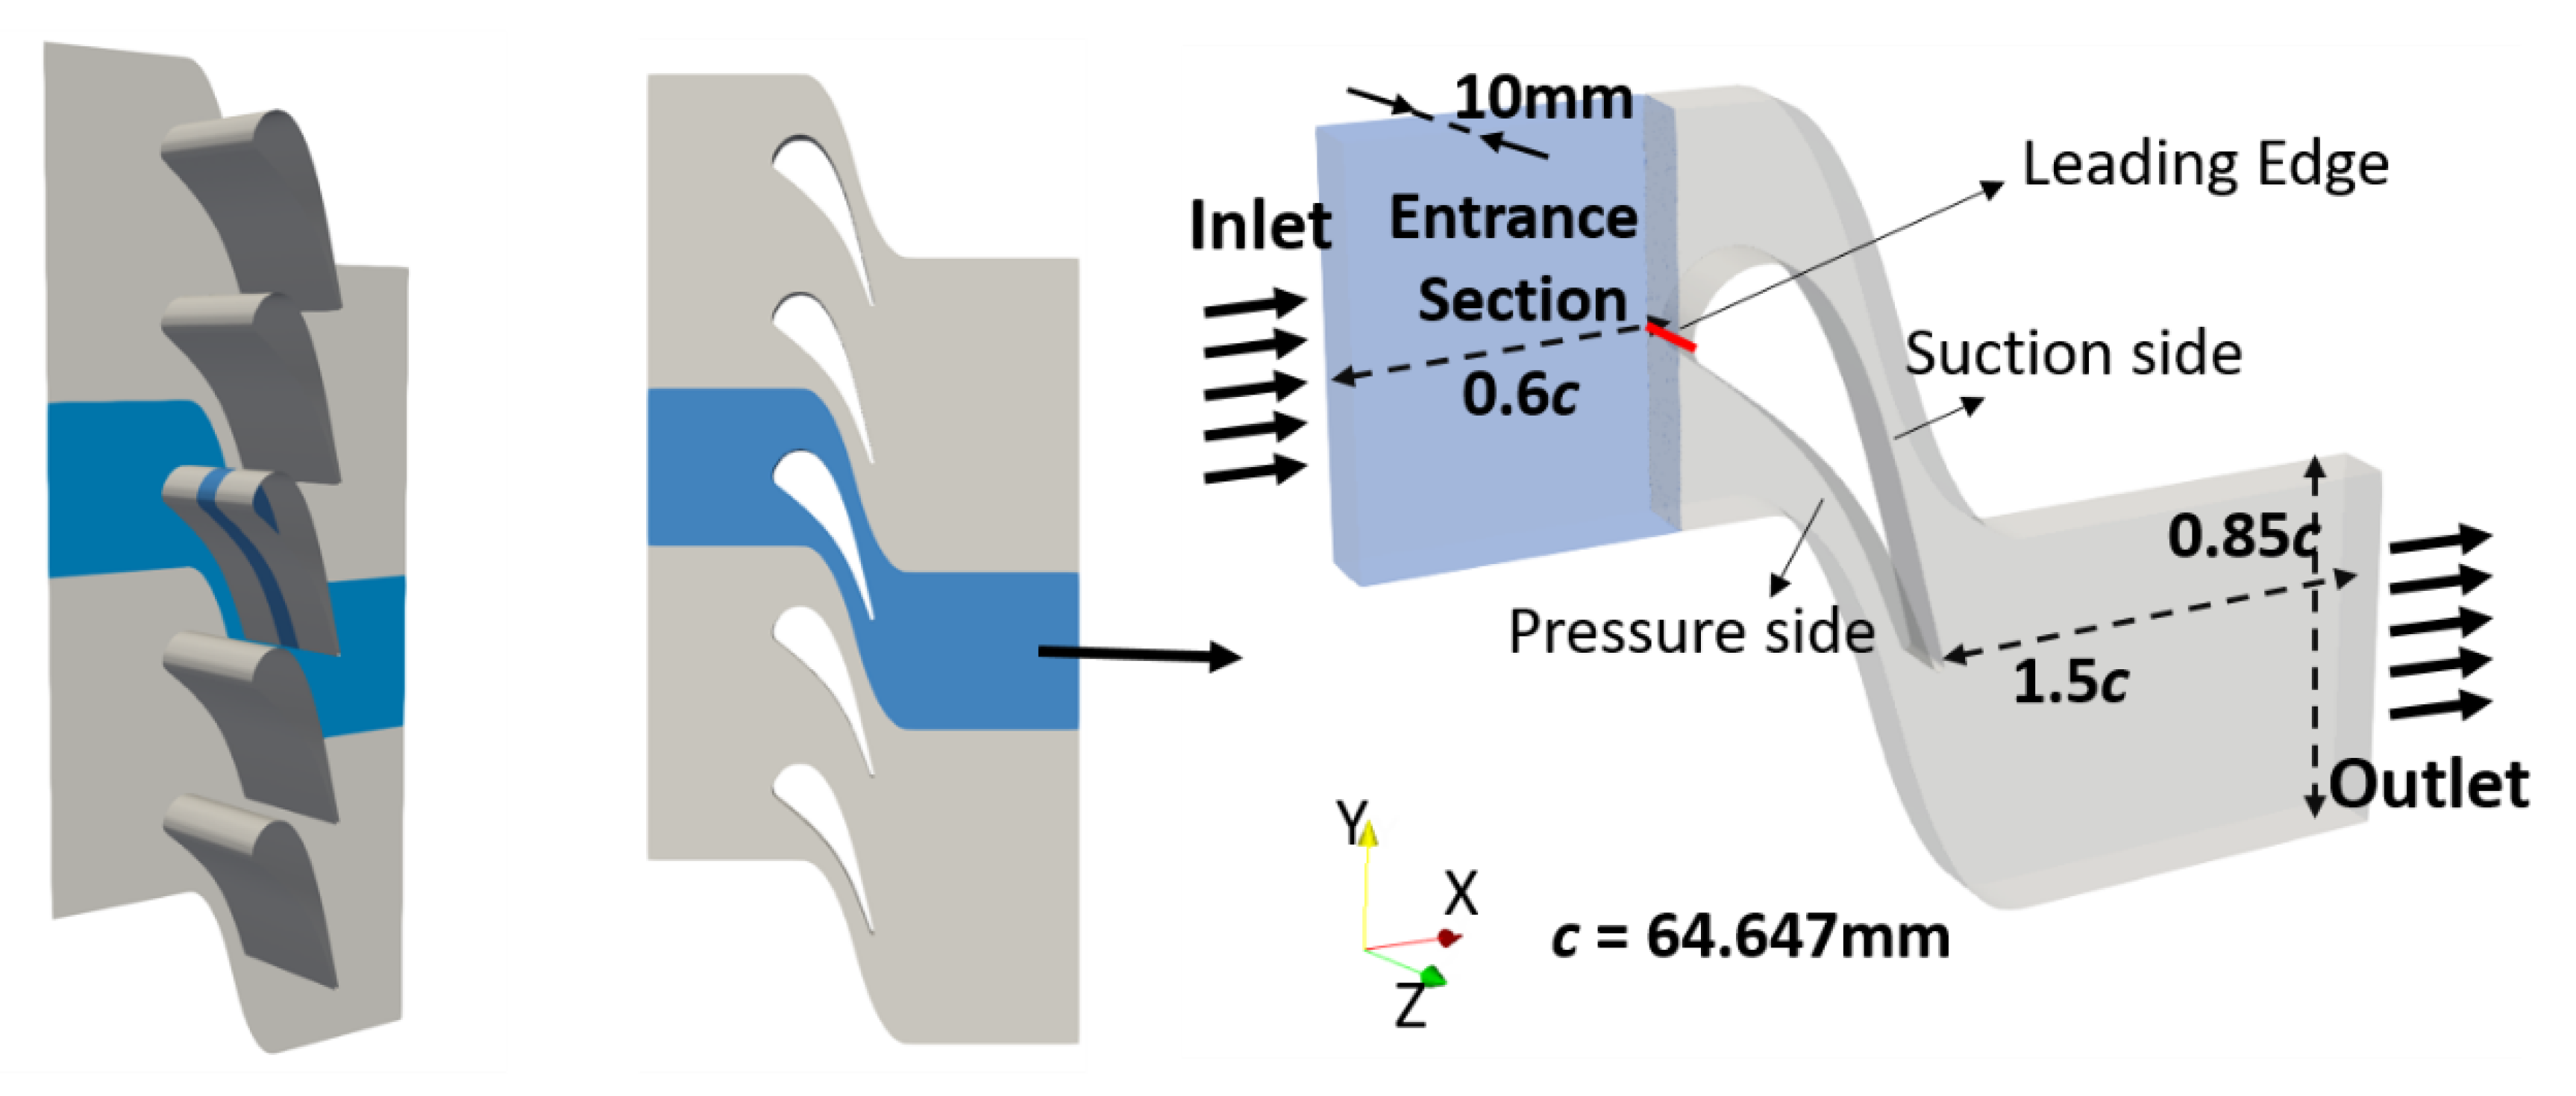
Figure 1. Sketch of the numerical configuration
Acoustics 02 00028 g001
Figure 2. Sketch of coarse mesh (a), details of the refined mesh in simulation (b), (c), (d) and the distribution of the normalized wall distance y+ (estimation based on result of MUR129_SAS) (e).
Acoustics 02 00028 g002
Figure 3. Contours of the normalized density gradient |▽ρ|/ρ: (a) MUR129_k-ω; (b) MUR241_k-ω.
Acoustics 02 00028 g003
Figure 4. Instantaneous contours of the normalized density gradient |▽ρ|/ρ: (a) MUR129_SAS; (b) MUR241_SAS.
Acoustics 02 00028 g004
Figure 5. Isentropic Mach number distributions along the vane: (a) MUR129; (b) MUR241.
Acoustics 02 00028 g005
Figure 6. Vane surface heat transfer coefficient H: (a) MUR129; (b) MUR241.
Acoustics 02 00028 g006
Figure 7. Distribution of instantaneous temperature fields at different times within one period δ = 2 π / ω 0 = 1   m s .
Acoustics 02 00028 g007
Figure 8. Influence of the entropy wave on the torque on the vane.
Acoustics 02 00028 g008
Figure 9. Distribution of instantaneous isentropic Mach number at different times within one period δ = 2 π / ω 0 = 1   m s ; the black line represents the Ma = 1).
Acoustics 02 00028 g009
Figure 10. Influence of the entropy wave on the wall heat transfer (a) and the variation of air thermal conductivity (b) with temperature.
Acoustics 02 00028 g010
Figure 11. Distribution of instantaneous wall heat flux on the vane suction side (top view of the vane).
Acoustics 02 00028 g011
Figure 12. (A): Distribution of instantaneous static pressure (without entropy wave); (B): Distribution of instantaneous static pressure at different times within one period with entropy ( δ = 2 π / ω 0 = 1   m s ) wave.
Acoustics 02 00028 g012
Figure 13. Modulus and phase of the temperature (a,b) and pressure (c,d)—DMD 1 kHz mode.
Acoustics 02 00028 g013
Table 1. Test cases and details of the flow conditions
CaseTwall (K)Pi,0 (Mpa) aP2 (Mpa) bTi,0 (K) c
MUR129_k-ω297.750.18490.1165409.20
MUR241_k-ω299.753.25701.5470416.40
MUR129_SAS297.750.18490.1165409.20
MUR241_SAS299.753.25701.5470416.40
MUR129_SAS_Wave297.750.18490.1165T1(t)c
a footnote i represents the isentropic quantities. b footnote 0 and 2 represents the inlet and outlet, respectively. c E ( t ) = T 0 + C sin   ( ω 0 · t ) , T 0 = 409.20   K , ω 0 = 2000 π , C = 100   K .
Table 2. Reflection and transmission coefficients for entropy wave frequency
CaseCalculationTheory
β s 0.63601
β r 0.05540.0617
β t 0.01660.0064