Article

Commissioning the Acoustical Performance of an Open Office Space Following the Latest Healthy Building Standard: A Case Study

1
Department of Civil and Environmental Engineering, University of Washington, Campus Box 352700, Seattle, WA 98195, USA
2
Department of Psychology, Vancouver Island University, Building 356, Room 364, Nanaimo, BC V9R 5S5, Canada
3
UW Tower Operations, Facilities Services, University of Washington, Campus Box 359405, Seattle, WA 98195, USA
4
UW Information Technology, University of Washington, Box 354841, Seattle, WA 98195, USA
*
Author to whom correspondence should be addressed.
Acoustics 2019, 1(3), 473-492; https://doi.org/10.3390/acoustics1030027
Submission received: 29 April 2019 / Revised: 27 June 2019 / Accepted: 2 July 2019 / Published: 9 July 2019
(This article belongs to the Special Issue Indoor Soundscape: Integrating Sound, Experience and Architecture)

Abstract

:
Healthy building design guides are cogent and necessary. While elements that contribute to healthy buildings are multifactorial, the perception of sound versus noise is subjective and difficult to operationalize. To inform the commissioning process, the acoustics in an open office was examined following the first international building certification system that focuses on the well-being of occupants. Results highlight the role facility managers play in ensuring acoustical quality and offer suggestions to optimize healthy building rating systems. Mixed empirical evidence concerning the advantages of open office designs exists, as does evidence that noise, and a lack of privacy, affects workers’ levels of distraction and dissatisfaction. Sound masking systems can lower stress levels and augment performance. However, the sound produced by these systems can also be disruptive; conflicting information exists for facility managers to use when making decisions. The results suggest that, although objective measurements and healthy building guidelines for designing satisfactory indoor acoustic environments are important, changes to the physical environment, and acoustical systems, in particular, require iterative subjective assessments within the retrofit process to bolster occupant satisfaction. Mixed-methodologies used in this study may aid facilities managers in capturing and interpreting occupant data about physical stimuli in the workplace and improving the commissioning process.

1. Introduction

Healthy buildings, designed to improve indoor environmental quality (IEQ), are becoming more popular for many cogent reasons [1,2]. From being better able to recruit a creative and collaborative workforce, to improving an organizational image, integrating modern technologies concerning indoor air quality, lighting, and acoustics into the built environment is becoming an expectation, especially in office settings [3]. Frequently, such upgrades are accompanied by changes in layout and systems. As a result, psychosocial outcomes often follow whereby occupant perceptions of productivity, satisfaction, and controllability are improved (e.g., [4]).
Healthy building standards were created to help owners assess design strategies to foster healthy workspaces [5,6,7]. Conventional strategies include selecting sites for buildings or spaces that provide active transportation options, incorporating physical and operational upgrades that enhance indoor environmental qualities, providing access to healthy food options, and enforcing company-wide policies and facility services to improve employee’s mental well-being. Many of these strategies combine the latest scientific research to create a scorecard to help owners evaluate the current status and possible improvements. While useful, the guideline does not specify the on-going commissioning and resolution efforts for achieving optimal performance when multiple metrics are used to measure occupant satisfaction.
Within healthy building indoor environments, more attention is being given to the acoustical performance of buildings. For open office designs, mixed empirical evidence concerning the advantages exists [8,9] while other evidence is mounting that distraction and dissatisfaction among workers are related to noise and a lack of privacy [10,11,12,13]. In particular, satisfaction with acoustics and privacy appears to be most strongly affected by workstation size and office type [14]. Open offices can lead to problems associated with noise, distraction, and a lack of privacy and control [13,15,16]. Kim and de Dear [13] found that enclosed private offices outperformed open-plan layouts in most aspects of IEQ, particularly in relation to acoustics, privacy, and proxemics. The benefits of enhanced “ease of interaction” for workers seem to be smaller than the penalties of increased noise level and decreased privacy resulting from the open-plan office configuration.
Moreover, when the number of individuals in a given amount of space is varied, it represents a change in “social density” [17]. Many studies indicate that an increase in social density can also increase individuals’ perceptions of crowding while decreasing perceptions of privacy (see [18]). Abbaszadeh et al. [19] found that a higher percentage of occupants in LEED-rated green buildings complain about others overhearing their private conversations.
To overcome many of these issues, sound masking systems are often added to work environments to protect occupants’ speech privacy. Properly-designed sound masking systems have been shown to lower stress levels and, therefore, affect performance on simple attention tasks [20,21,22,23]. However, these findings conflict with those outlining occupants’ increased annoyance with these systems and reports that they afford distractions [24] and health concerns [25]. It seems that even systems created to offset acoustical discomfort can create acoustical, as well as functional problems, rather than solutions, for some occupants.
While existing post-occupancy evaluations typically paint simplified, but worthwhile, pictures of occupant satisfaction concerning IEQ, iterations of commissioning and testing, followed by extensive feedback from occupants (and systematic content analyses of their responses), are often necessary to optimize an environment for its users. These steps are inter- and transdisciplinary, requiring expertise in psychometrics, statistics, as well as engineering knowledge. They are also important for the facilities management team to ensure a healthy open office work environment.

1.1. Research Questions

The present case study connects psychosocial variables with technology in a mixed methods approach by addressing two research questions. Findings from this study complement the existing body of work related to improving the soundscape in open office spaces. This study aimed to explore the following two questions:
  • Do results of objective measures of sound, using the latest healthy building frameworks as a guide, coincide with users’ subjective perceptions of sound in an office space?
  • What are some underlying themes that describe why users become dissatisfied with sound masking systems?

1.2. Background

Theoretical approaches to acoustical studies with sound masking systems often focus on evaluating the properties of sounds as environmental stimuli that affect occupants’ self-reported well-being in conjunction with objective measures of noise exposure [26,27,28]. For humans, the difference between “sound” and “noise” is subjective. Sound is often perceived by people as expected, wanted, and controllable auditory stimulation, whereas “noise” is unexpected, uncontrollable, disruptive, and offensive sound [17]. One limitation to acoustical studies is that they rely on standards to evaluate noise exposure and often lack direct measures of occupants’ environmental perceptions.
Similarly, a weakness in the relevant psychological research is a reliance on perceptual data without technical assessments of an environment. Psychoacoustical research combines the respective strengths of acoustical and psychological research approaches to better define the systematic relationship between noise exposure and occupant response to environmental stimulation. The next step in making this line of inquiry more comprehensive is to center research efforts on using interdisciplinary methodologies to understand how occupants respond to operational solutions at a granular level so that facilities managers can better evaluate success for office modernization programs that include acoustical solutions.
Field studies have also demonstrated that occupants assess indoor environmental qualities differently depending on the amount of personal space and type of spatial configuration in their workplace [13,14]. The strongest sources of dissatisfaction in open-plan offices are often found to be a lack of privacy [13,29,30], stuffy air [31], and noise level. Indeed, as one of the key elements in indoor environmental quality assessments, acoustical comfort has been studied in many different building types: religious [32], hypermarket [33], schools [34], hospitals [35] and offices [13,36]. It has also been studied in buildings in conjunction with different ventilation systems (i.e., mechanically conditioned and naturally ventilated) [37]. Regardless of occupancy classification or building system, these studies, and others, consistently demonstrate that noise exposure is associated with negative physiological effects on the human body, such as headache, fatigue, tinnitus, and hearing loss.
Achieving acoustical satisfaction in the workplace is important for a productive and healthy workforce. This is especially true in open-plan offices where large spaces dominate a setting with few walls or partitions between employees. Prior studies have demonstrated that acoustic quality in green buildings does not reliably show significant improvements in comparison to conventional buildings and that a properly-tuned sound masking system can provide adequate speech privacy [19,36]. Furthermore, positive effects of sound and using pleasant sounds that act as a noise masker could be one of the approaches when designing new open space offices. For example, Haapakangas et al. [20] tested various masking sounds and found the spring water sound to be most effective in terms of objective performance and occupant satisfaction. Through a field study, Abdalrahman and Galbrun [38] demonstrated that, when actual water features were added to an open office space, occupant’s satisfaction regarding soundscape increased. However, satisfactory indoor acoustics is generally difficult to achieve or sustain in open-plan office buildings. Few studies pertain to decentralized electronic masking systems and the long-term solutions to fostering productive workspaces and privacy is seldom discussed in research addressing sound masking systems in the context of open-plan layouts. The present paper combines objective and psychological methods in an office setting to further define success for building modernization programs that include acoustical solutions. Findings from this study will aid designers and facility managers alike as they make informed fiscal and design-related decisions about indoor acoustics.

2. Materials and Methods

Modernizations to an office space in a building on the University of Washington (UW) campus in Seattle provided an opportunity for an in situ study. The pre- and post-retrofitted acoustic conditions of a single floor for two connected buildings (i.e., C3 and O3) were examined. Buildings undergoing renovation are difficult to access, and construction schedules change frequently in ways that can often hinder research. Therefore, few studies similar to this exist in the literature. The study timeline is shown in Figure 1. No sound masking system had been installed prior to the refurbishment and, therefore, no extensive acoustics measures were physically performed in the space at Time 1.

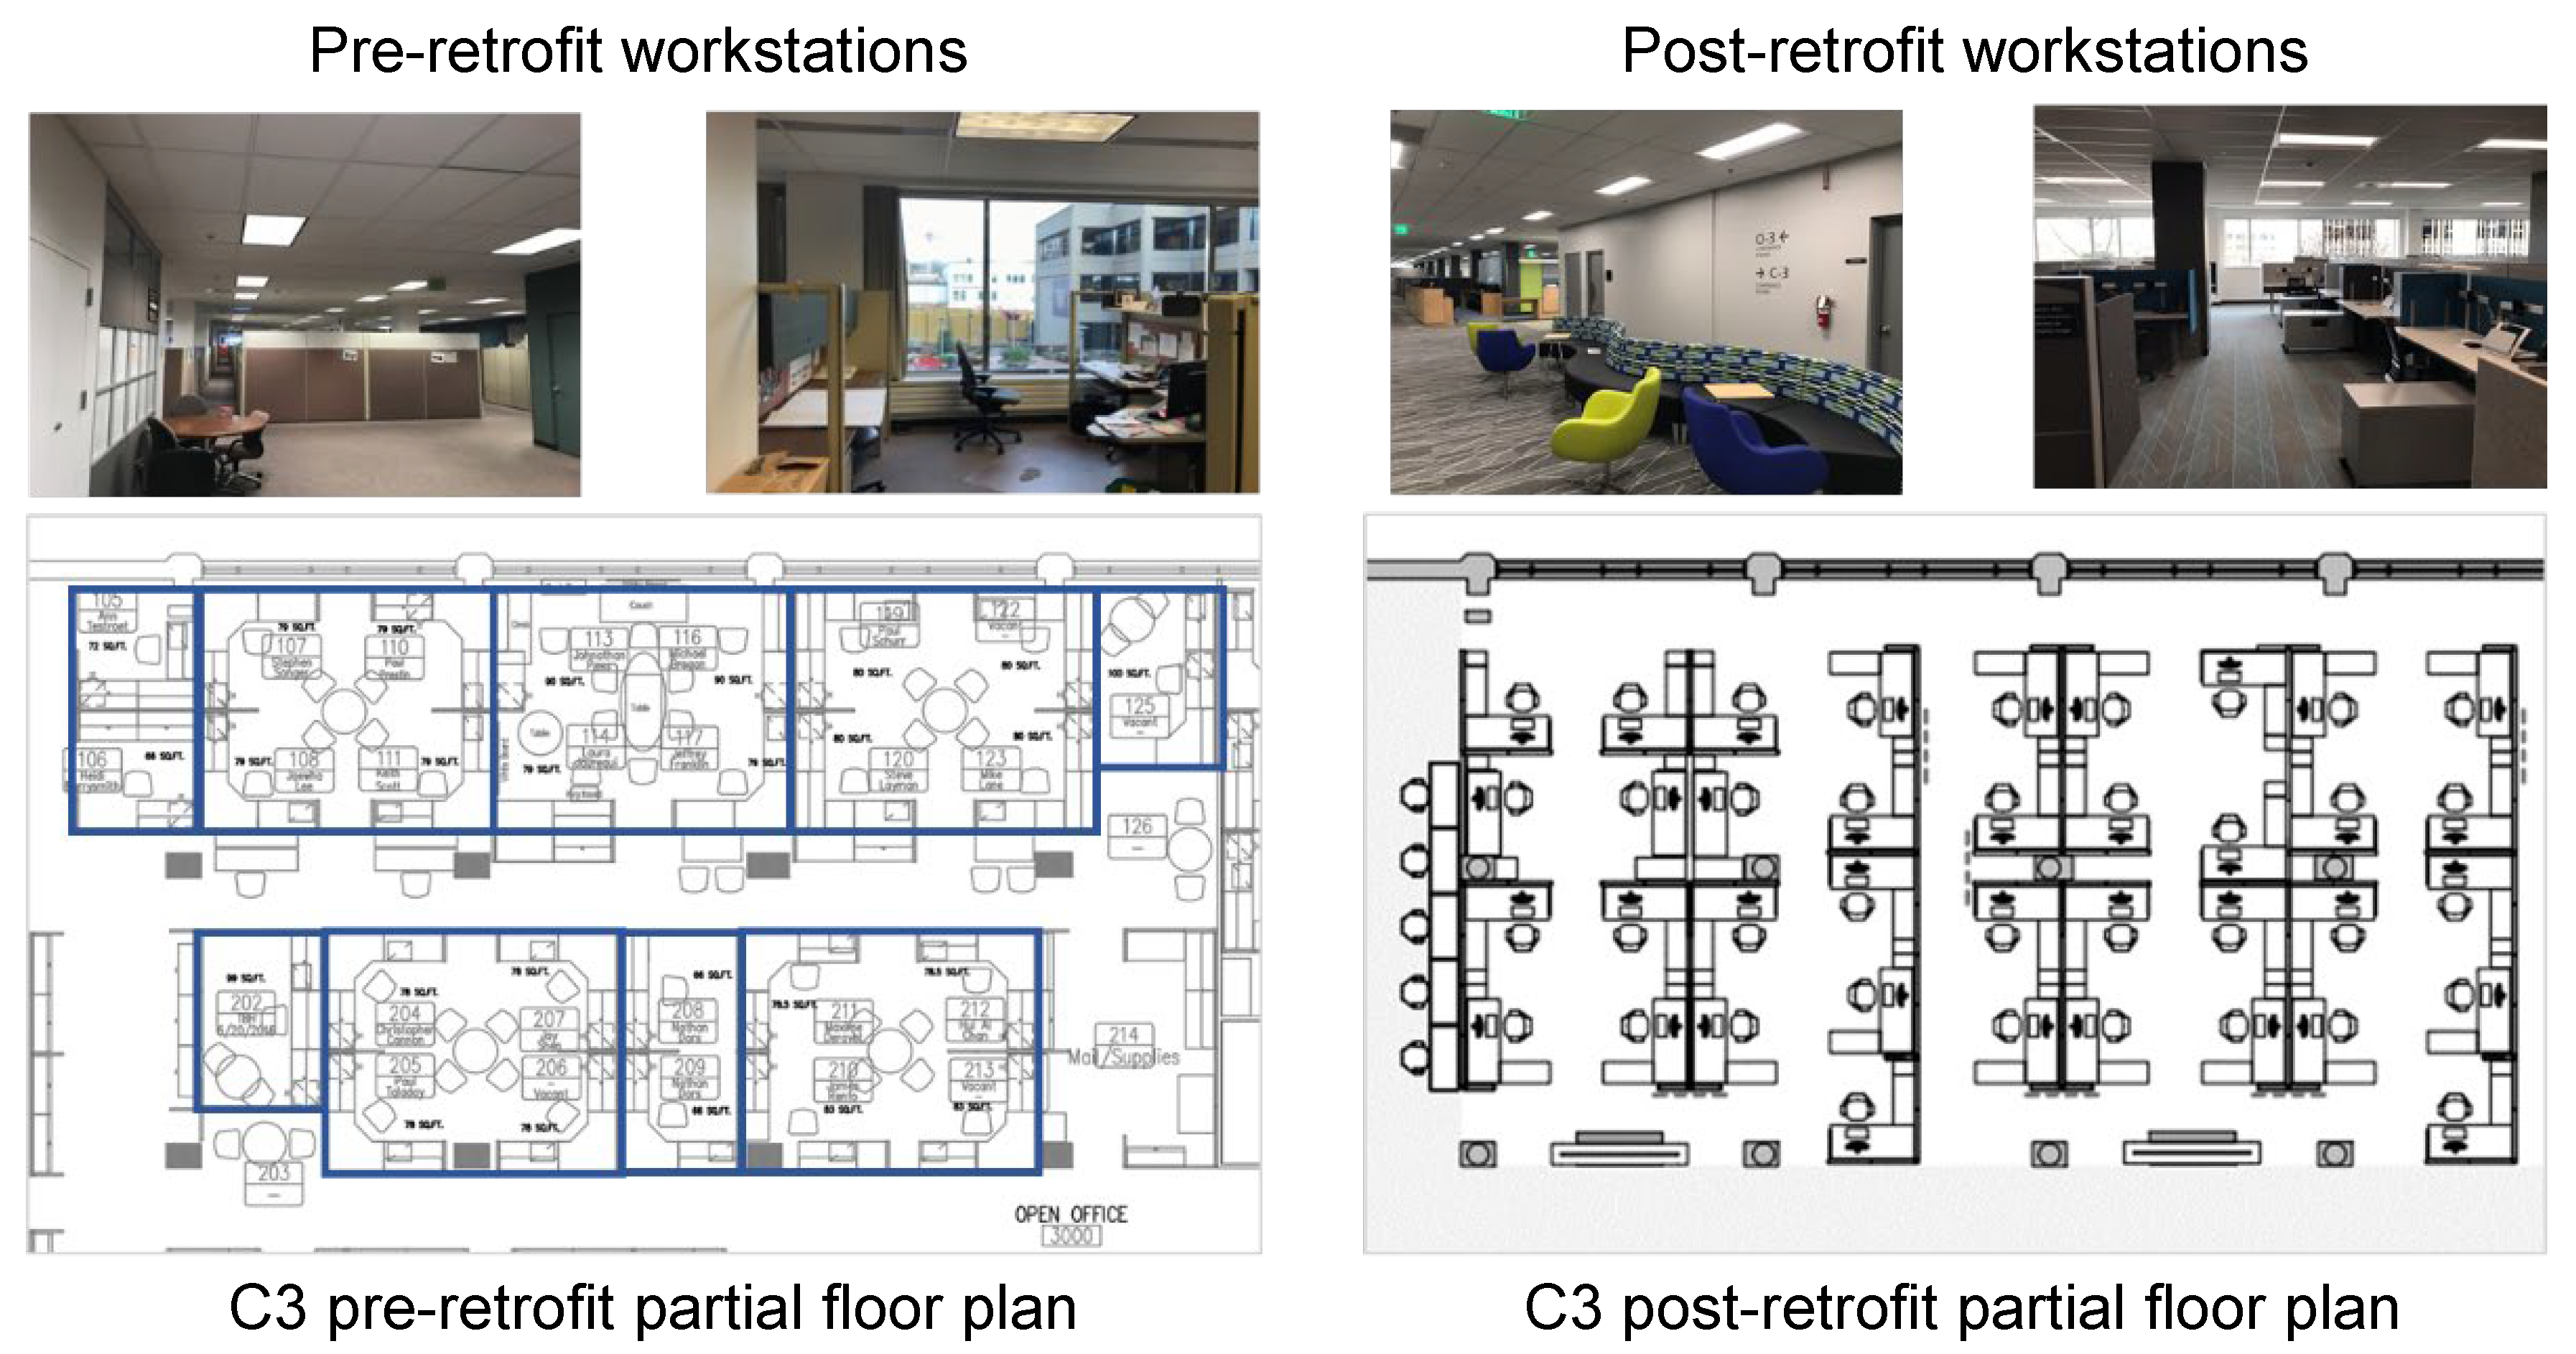
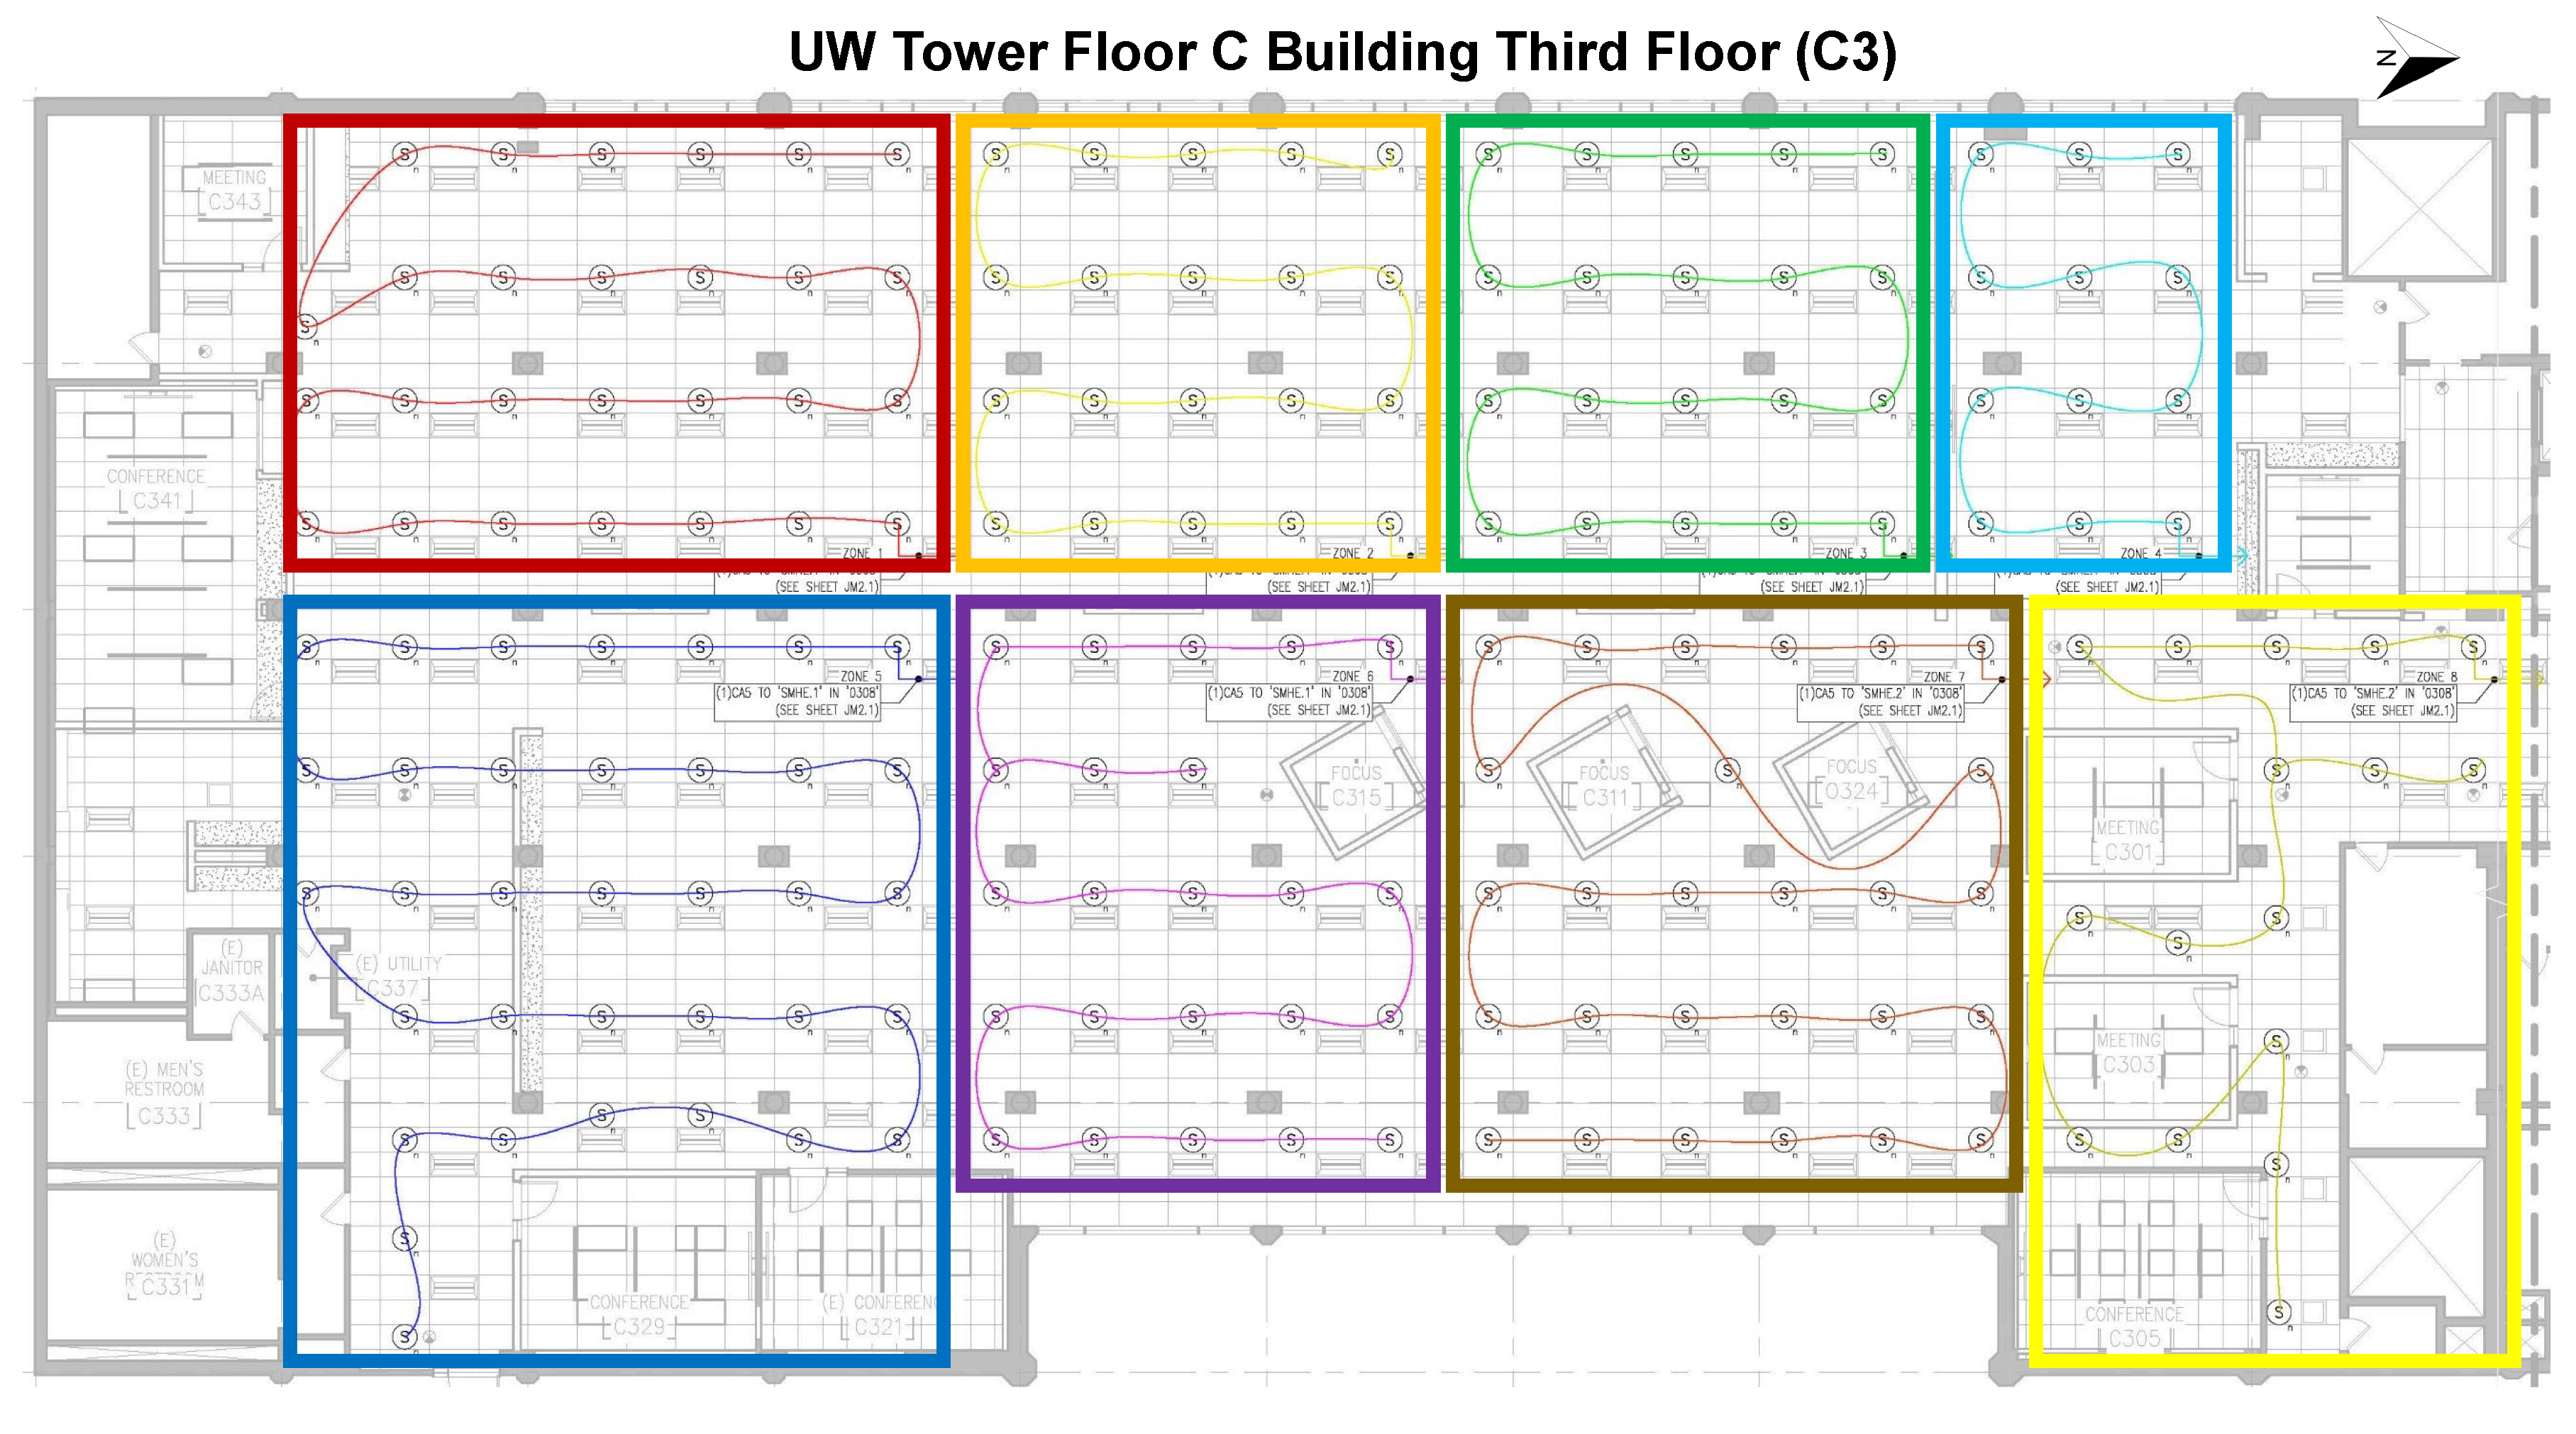
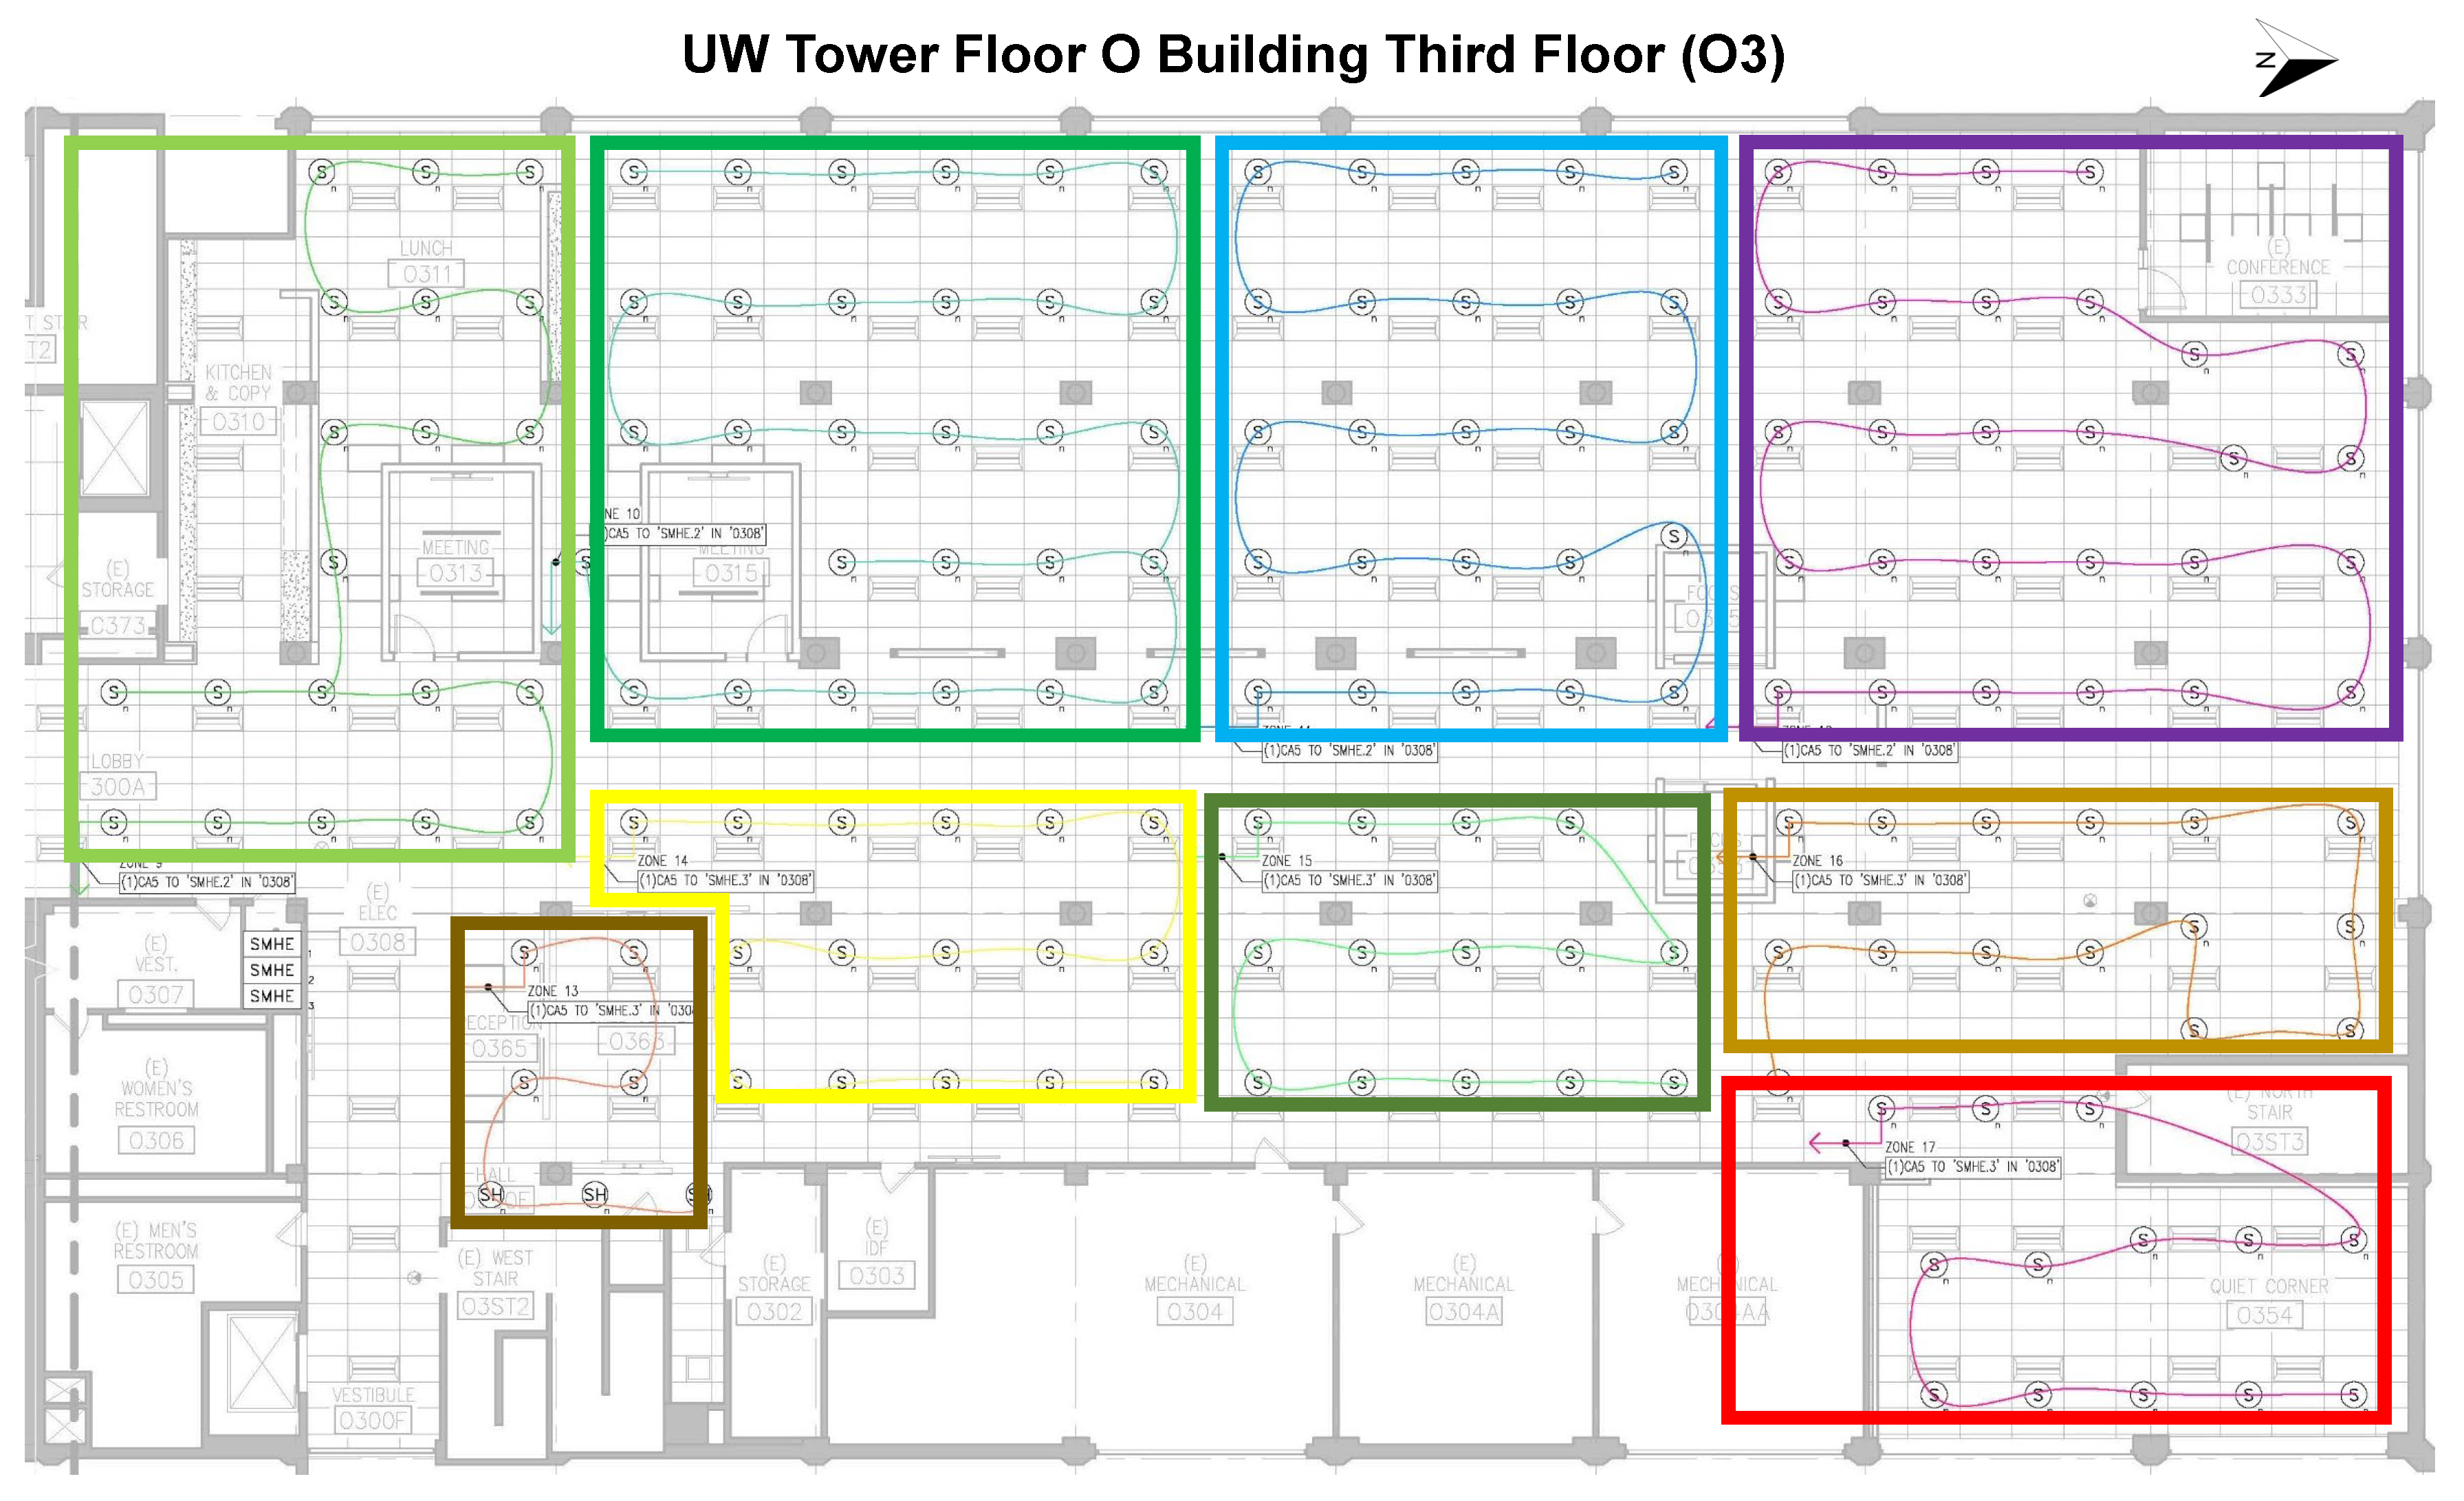
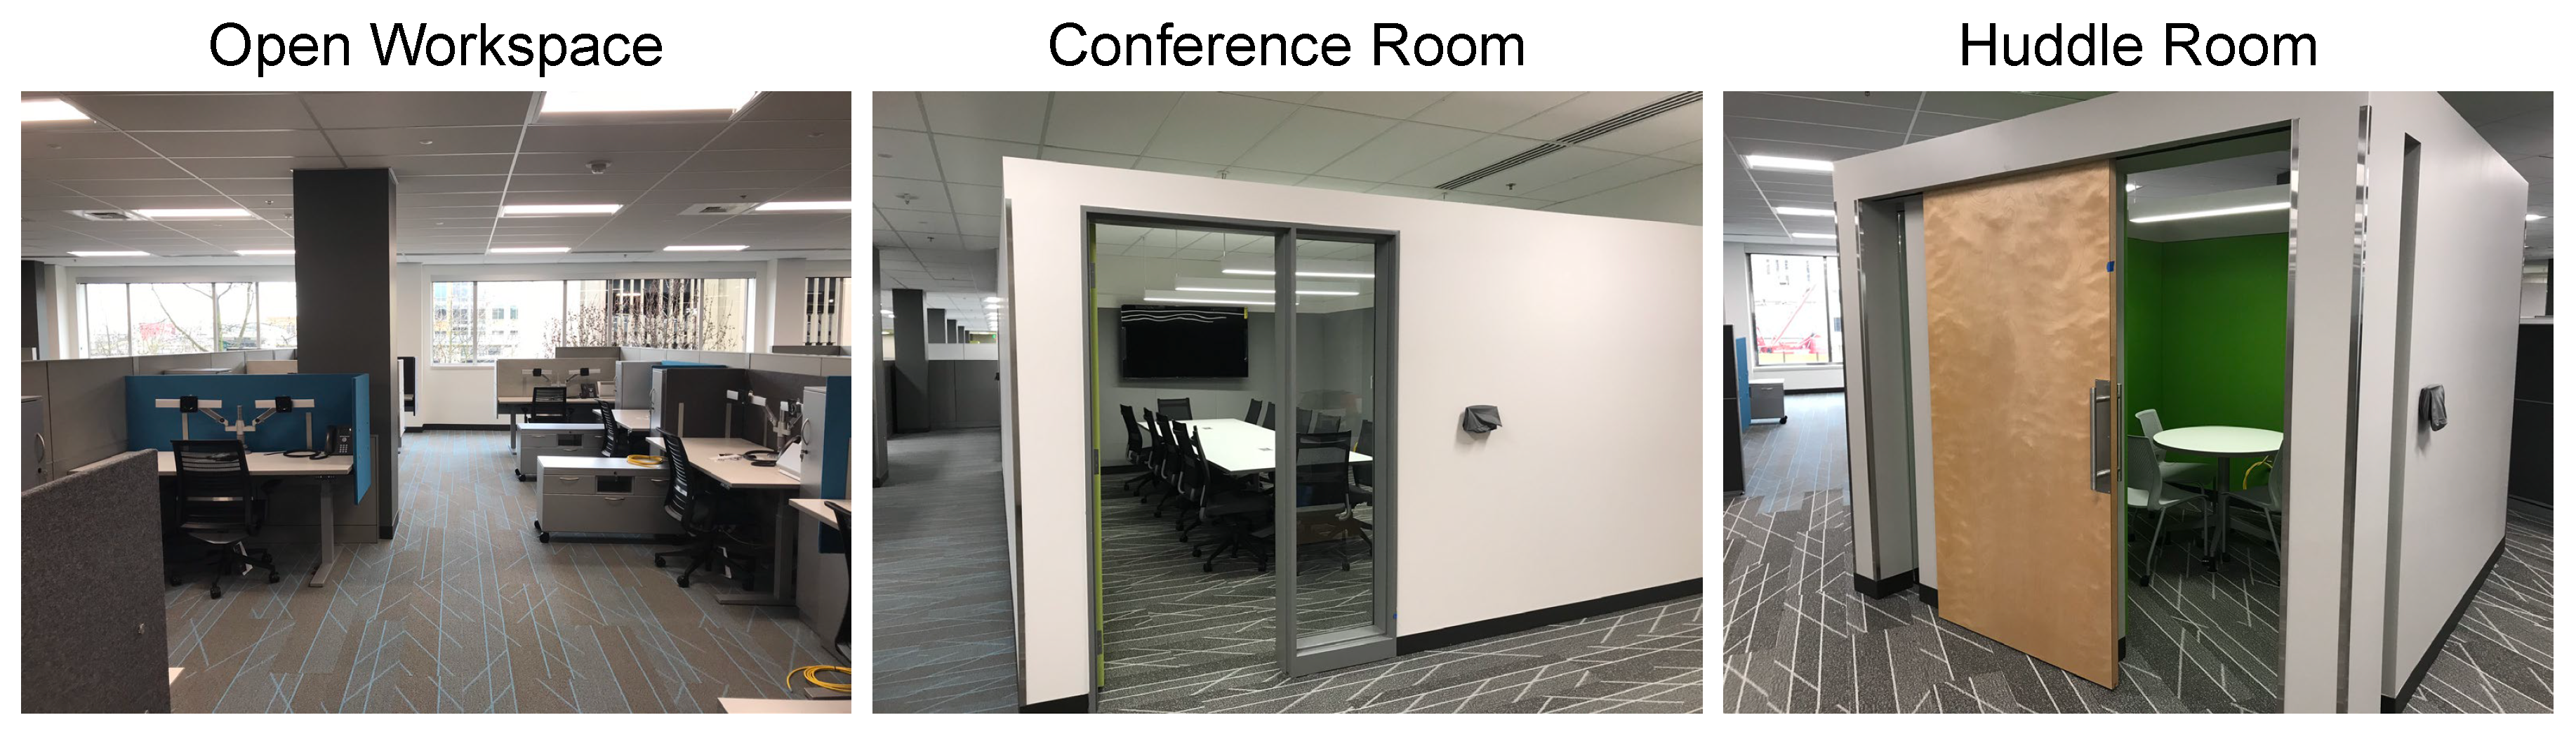
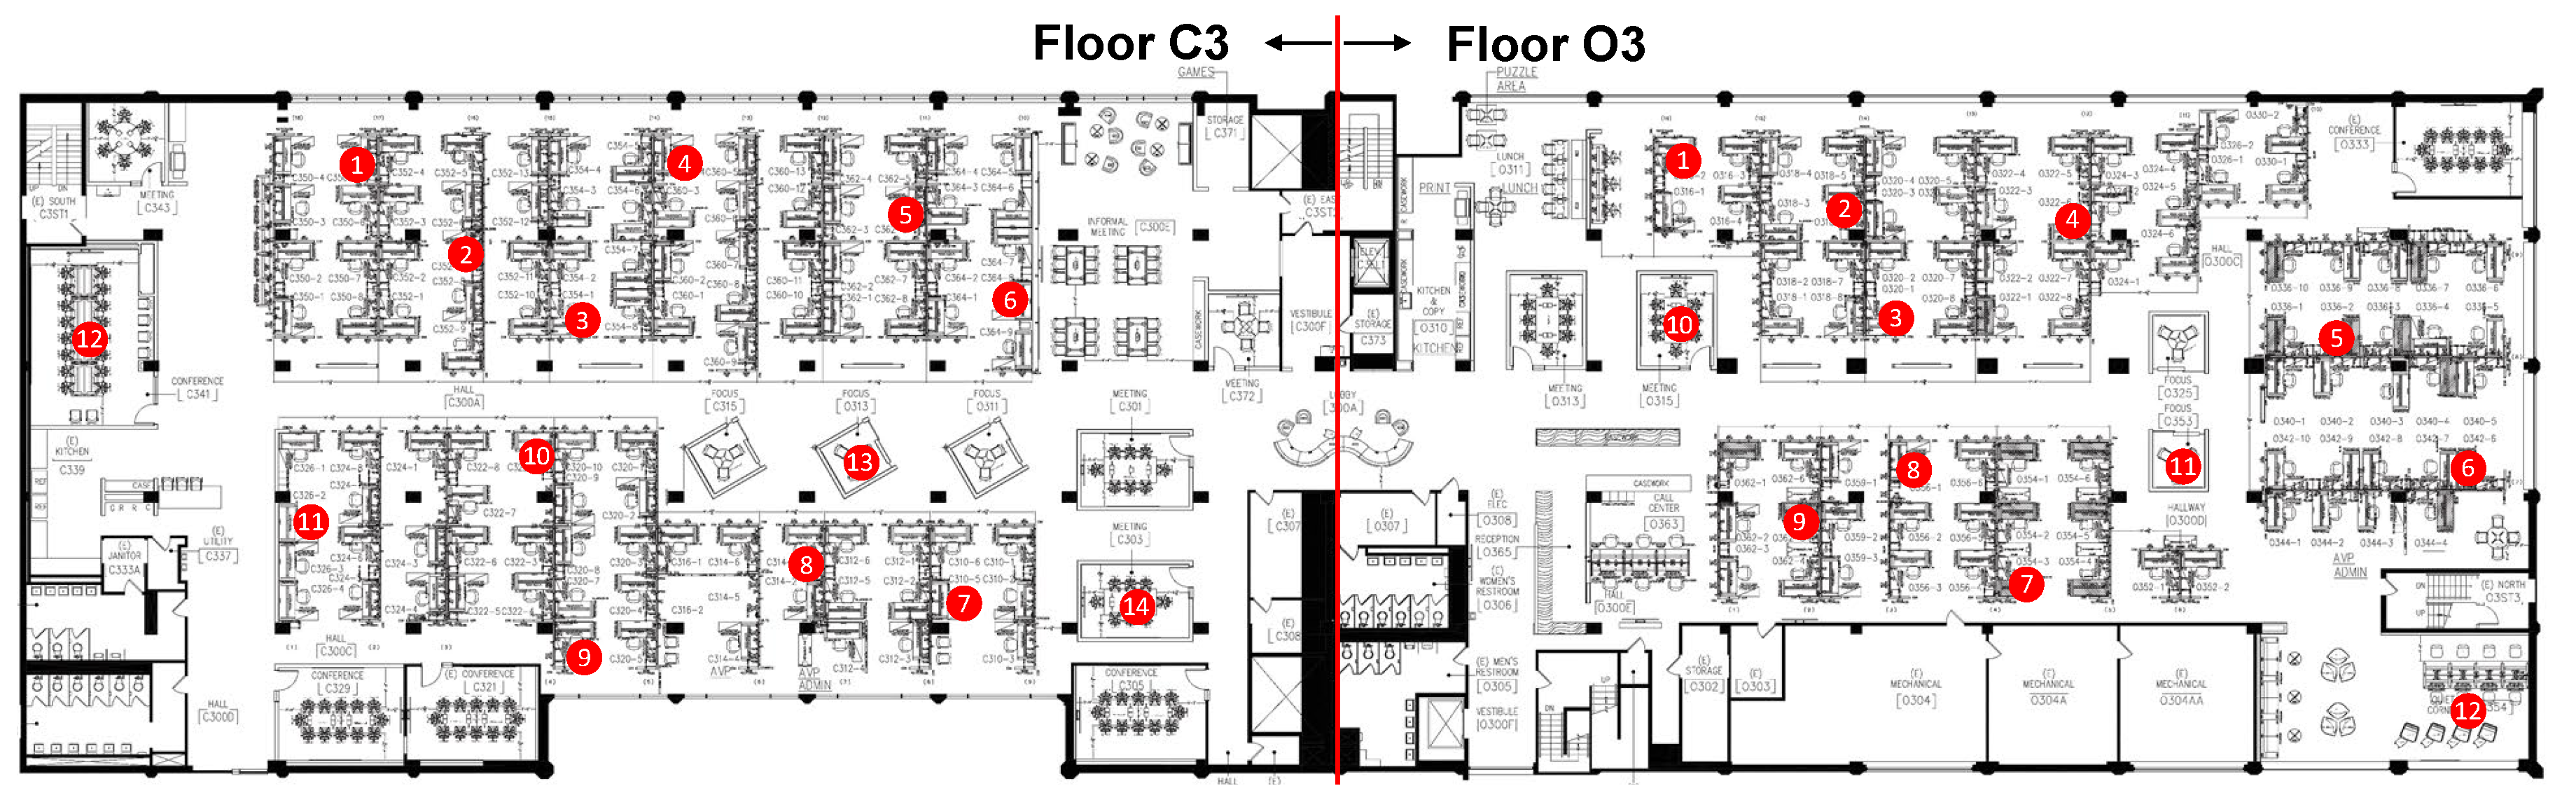
2.1. Description of Open Office Space

The overall scope of the refurbishment included new finishes, such as paint and carpet, new semi-private conference spaces to support small and large meetings, new furniture and workstations that are fully adjustable and reconfigurable by occupants, new LED lighting fixtures and controls by tunable desk lamps, and new window coverings. The new workstations have lower partitions (originally from 1.57 to 1.42 m) and less area per person/workstation (approximate average of 5.39 down to 3.90 m 2 per workstation). Figure 2 shows renderings of the pre- and post-retrofit partial layout of the C3 and O3 office space.
With lower partitions and a higher social density, there was a significant design and engineering effort to investigate possible acoustical solutions. In an early design assessment, an option to extend the walls to the ceiling, and possibly underneath the floor slabs, was discussed. While this solution was preferred to minimize noise transfer, it was not feasible (or value-additive) because fire safety codes do not allow partitions to extend to the ceiling and requires 18 inches of clear space between the top of a wall to a fire sprinkler head. Redesigning and reinstalling the fire sprinkler system was cost prohibitive (i.e., doubling the original budget). The alternative solution was to install an electronic sound masking system; a floor plan of the new sound masking system is shown in Figure 3 and Figure 4, where the different sound masking system zones are highlighted.
Three-hundred fifty-three miniature, omnidirectional, direct field sound speakers/emitters were installed into the ceiling (185 in C3; 168 in O3) providing nearly 180 degrees of sound dispersion. The emitters are adjustable to allow the sound masking input to be reduced by up to 9 in 3 dB increments to compensate for different acoustic conditions within a zone. Each zone can be independently adjusted for masking and aux audio levels and spectra. The new sound masking system was tuned to have an A-weighted sound pressure level of 47 dBA for open offices, 45 dBA for conference rooms and huddle rooms.

2.2. Objective Measurements
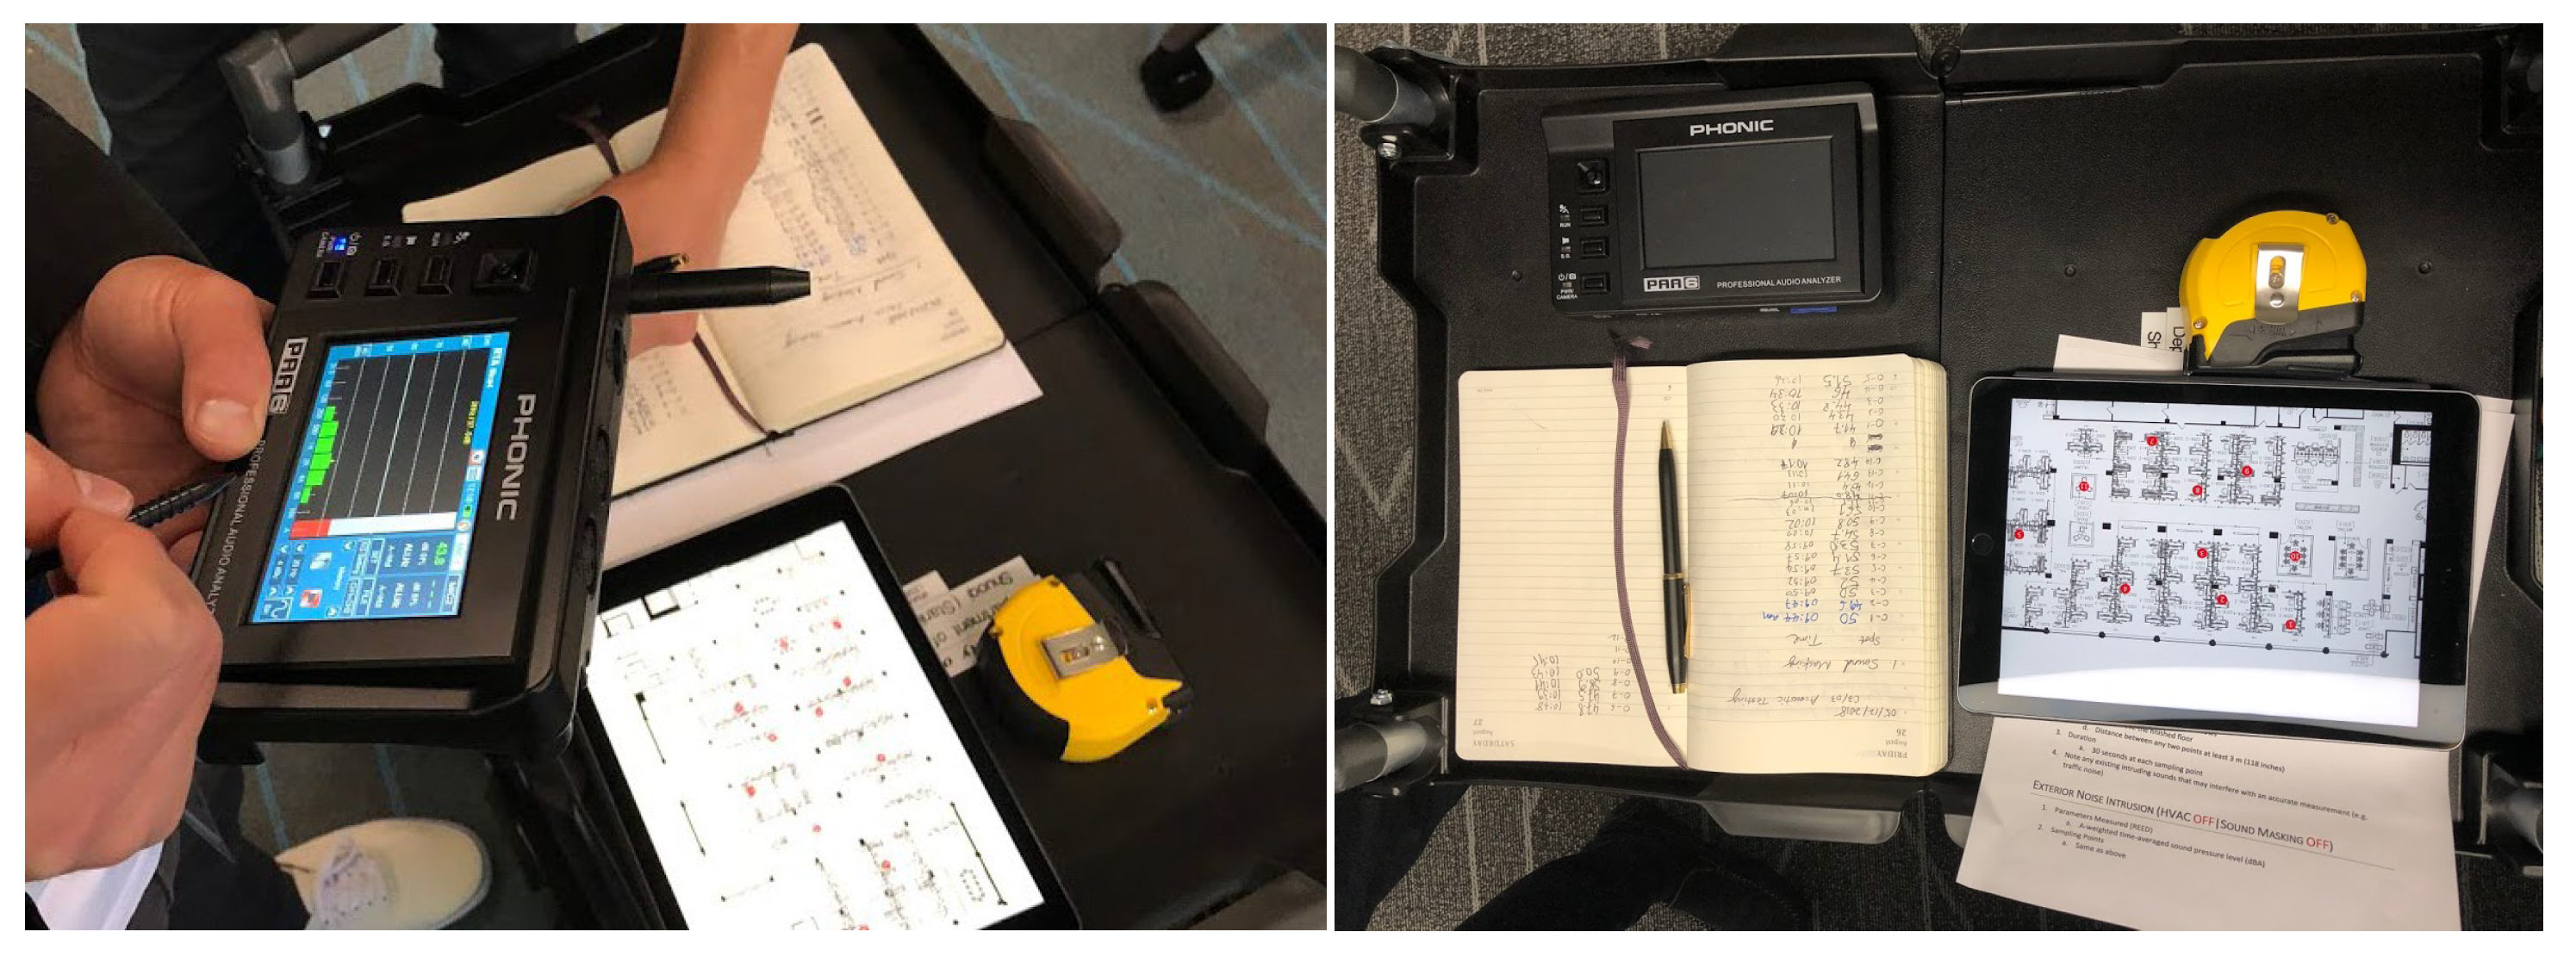
2.2.1. Equipment

Phonic PAA6 is a professional audio analyzer with a digital 2-channel audio analyzer and color touch liquid crystal display. In this study, the Phonic sound meter was used to measure internally generated noise, reverberation time, external noise, and sound masking noise level. The analyzer was calibrated by the manufacturer upon shipping. Figure 5 shows the equipment and a typical setup during data collection.

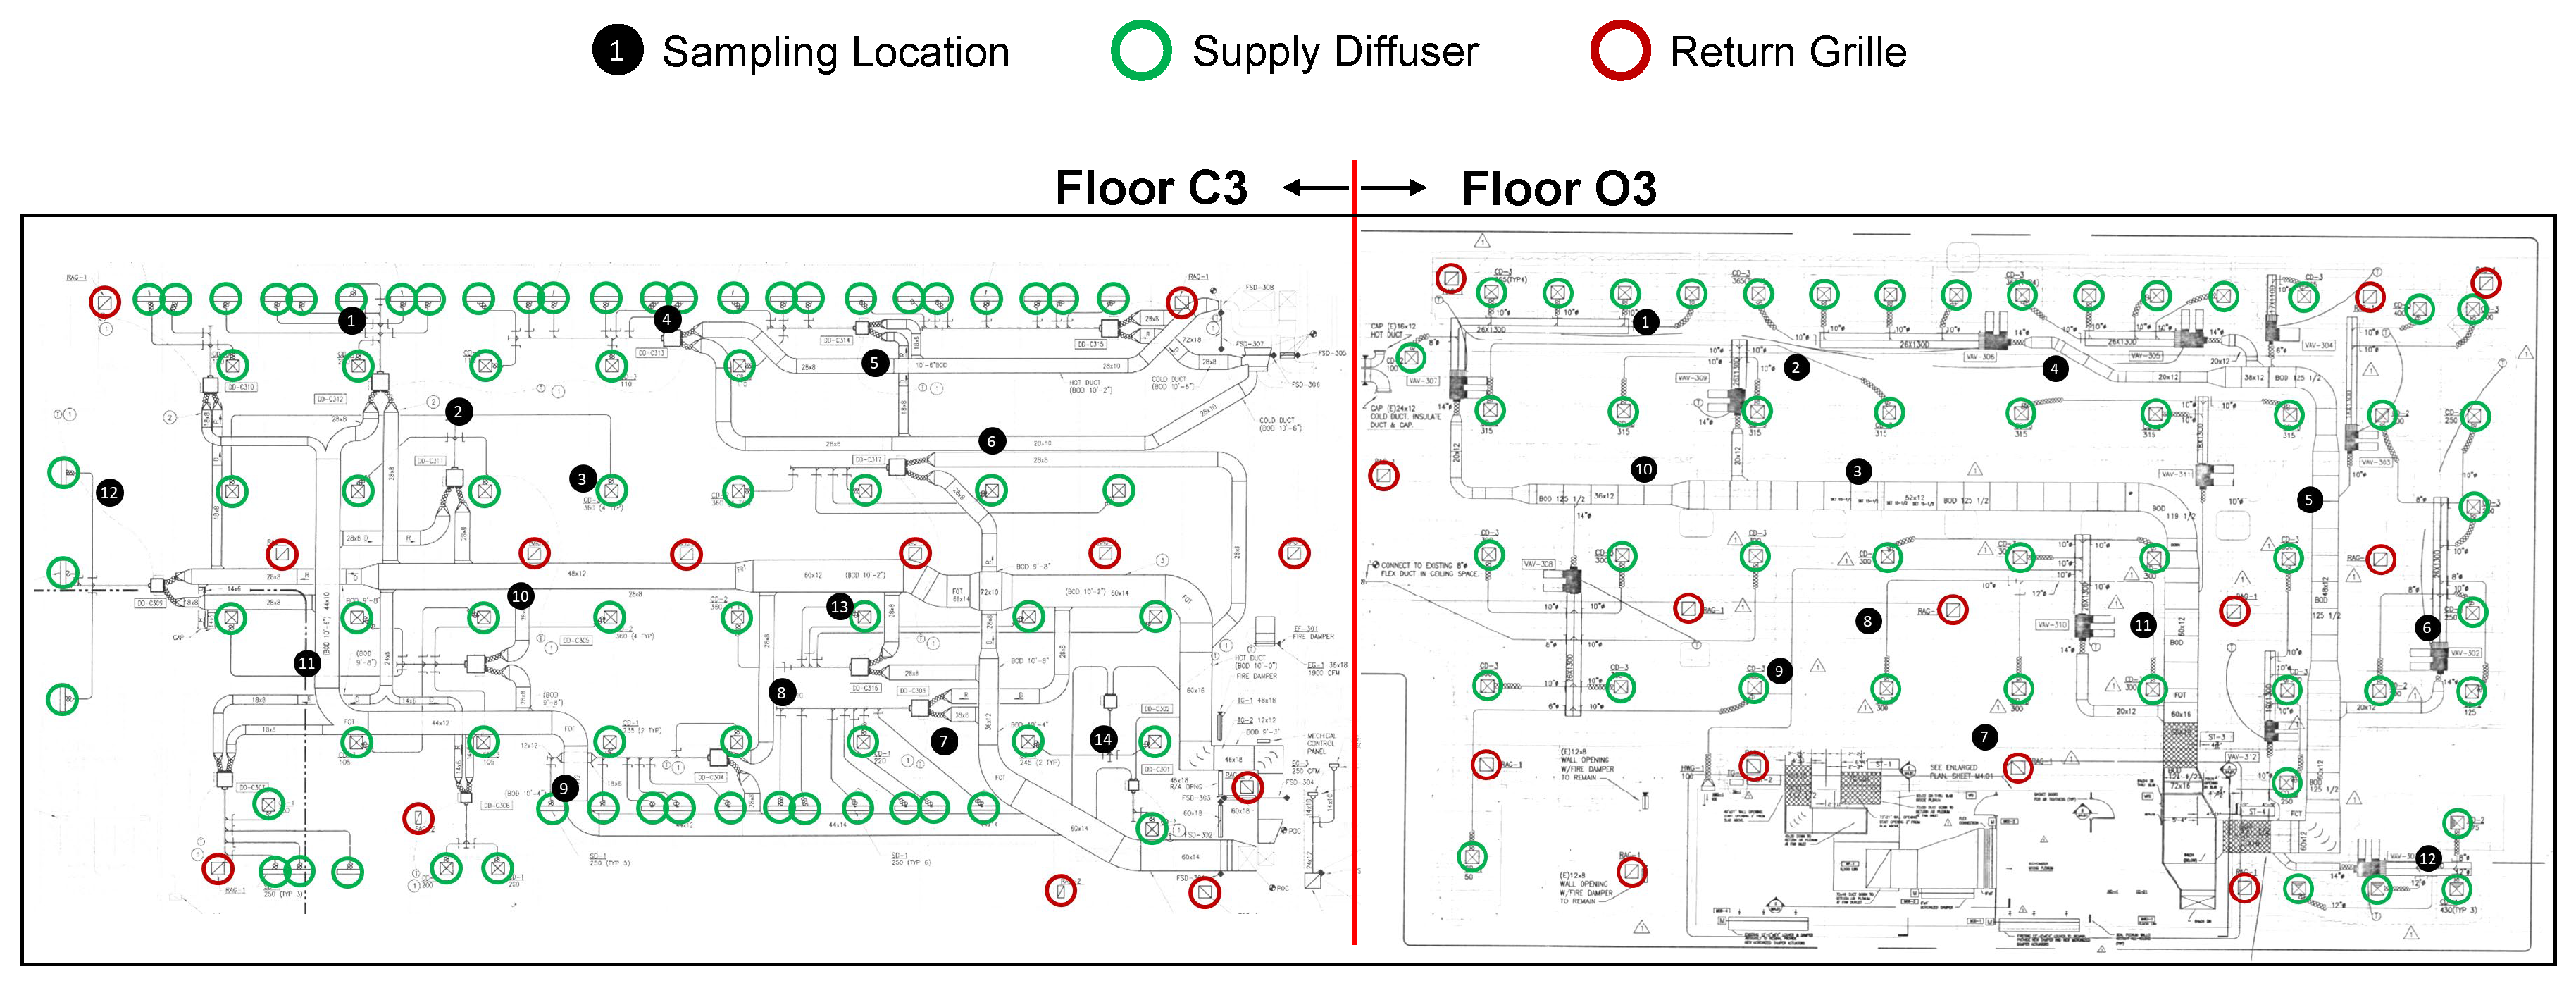
2.2.2. Measurement Protocol

The WELL Building Standard is developed by the International WELL Building Institute and is the first standard of its kind that focuses solely on the health and wellness of building occupants [7]. The standard contains over 100 features designed to enhance human health and well-being and they are divided into eight categories, i.e., air, water, nourishment, light, fitness, comfort, mind, and innovation. The acoustic comfort is part of the “comfort” category and is addressed by Features 74, 75, 78, and 79 in the standard. These features were reviewed to find all references and protocols for measuring indoor acoustics. The standard referred to government studies [39] which was reviewed in conjunction with ISO standards [40,41] to develop the final measurement protocol, as shown in Table 1.
Based on the recommended sampling points, the authors identified twenty-six different locations to measure the acoustical parameters. Twenty of these locations were in the open workspaces, three were in the conference rooms, and two in the huddle rooms. Figure 6 shows examples of the various types of rooms. Each sampling location is marked on the floor plan in Figure 7, with numbers corresponding to the order of measurement. Figure 8 also shows the locations of air supply diffusers and return grilles relative to the selected sampling locations. Data were downloaded immediately following the measurement for each parameter.
The equipment was placed on a moving cart with a tablet computer showing the selected sampling locations. The readings were recorded digitally on the tablet, as well as by hand on a paper notebook. At least two researchers were involved in measuring and cross-checking the data while the measurements progressed. Data collection was conducted in multiple rounds during unoccupied hours on the floor. Measurements of all parameters were completed over two days (after 18:00 on both 11 October and 15 October 2018).

2.3. Subjective Measurements

To analyze changes in occupants’ psychological perceptions of the acoustic environment before and after the refurbishment, an online questionnaire was administered to occupants using Qualtrics online survey software [42] at two time points. Because the first time point was approximately two to three weeks after employees had moved into a temporary office space, items were worded retroactively such that participants were prompted to answer while thinking about how they felt in the previous office space. Then, two months after the refurbishment had been completed and the occupants had moved back in, the online questionnaire (using the same items) was distributed a second time and participants were asked about their perceptions of the retrofitted office space.
The questionnaire consisted of five items asking occupants about their perception of the acoustical environment at work. The first four items (see Table 2 and Table 3 for exact item wording) were measured on a seven-point Likert scale from “very unsatisfactory” to “very satisfactory”. These items were drawn from the body of environmental psychology literature (see [43]). The fifth item was also measured on a seven-point Likert scale ranging from “strongly disagree” to “strongly agree”. This item was developed for the purposes of the present study.
While each item measures facets of satisfaction, they do not equate to a single “satisfaction with soundscape” scale. An analysis of internal consistency to test whether the items ought to be used together to measure a single psychological construct revealed an alpha of 0.78 for responses to the first questionnaire, and 0.80 in the second. Tavakol and Dennick [44] noted that, when Cronbach’s alpha levels do not surpass 0.9, items are not redundant. Thus, items used in the present study were examined as distinct facets of occupants’ satisfaction with physical attributes of their office setting that had undergone a design change concerning acoustics, not unlike Newsham et al. [45].

2.3.1. Environmental Health and Safety Reports

Across the UW campus, employees use an information management tool called UW Connect to report any issues with the facilities. Employees can also utilize the Online Accident Reporting System (OARS) if they experience a work-related physical incident (i.e., the sound masking system hurting their ears). In the present study, the university’s Human Resources department became aware of some occupants’ concerns of the acoustic environment in the retrofitted space and suggested that they fill out the OARS report after initially reviewing the UW Connect forms. The OARS reports were submitted directly to the university’s Environmental Health and Safety (EH&S) department, which triggered a further assessment.
The authors requested to review the redacted OARS incident reports. The EH&S department found eight reports about the renovation project identifying issues with the sound masking system. These reports were submitted by occupants during April and May 2018, immediately after occupants moved into the retrofitted space. There were no other acoustics-related OARS reports from the third floor of the same building submitted between 2004 and 2018.

2.3.2. Follow-Up Questionnaire

Two meetings were convened involving the Human Resources and Facilities Services to resolve concerns regarding the acoustical performance in the newly-retrofitted space. Follow-up questionnaires were distributed online to collect general comments after the recommissioning of the sound masking system, during which the acoustical engineer measured decibel levels in the area and spoke with occupants. The sound masking system volume was reduced, and the frequency was changed as recommended in the near and immediate space where the affected occupants were seated. Concurrently, the HVAC system was re-commissioned to reduce noise generated from its operation.

2.3.3. Participants

Twenty-seven occupants responded to the first distribution of the questionnaire; 57 participants took part in the second distribution. Of those 57 individuals, only eight were returning participants (the participants were asked to create a numeric code for themselves so that the responses from the same participant could be compared over time). Because not every participant who responded to the second questionnaire completed the first questionnaire (and because some participants did not create a code for themselves at all), the data for both periods were analyzed on aggregate.

3. Results

3.1. Objective Results

3.1.1. Exterior Noise Intrusion

The WELL building standard [7] requires that the average sound pressure level (dBA) of exterior noise intrusion not to exceed 50 dBA when measured using the protocol defined in Table 1. As shown in Figure 9, the distribution of the recorded exterior noise values across the sampling locations were fairly consistent. The results were within the range of 40.0–43.6 dBA across all sampling locations.

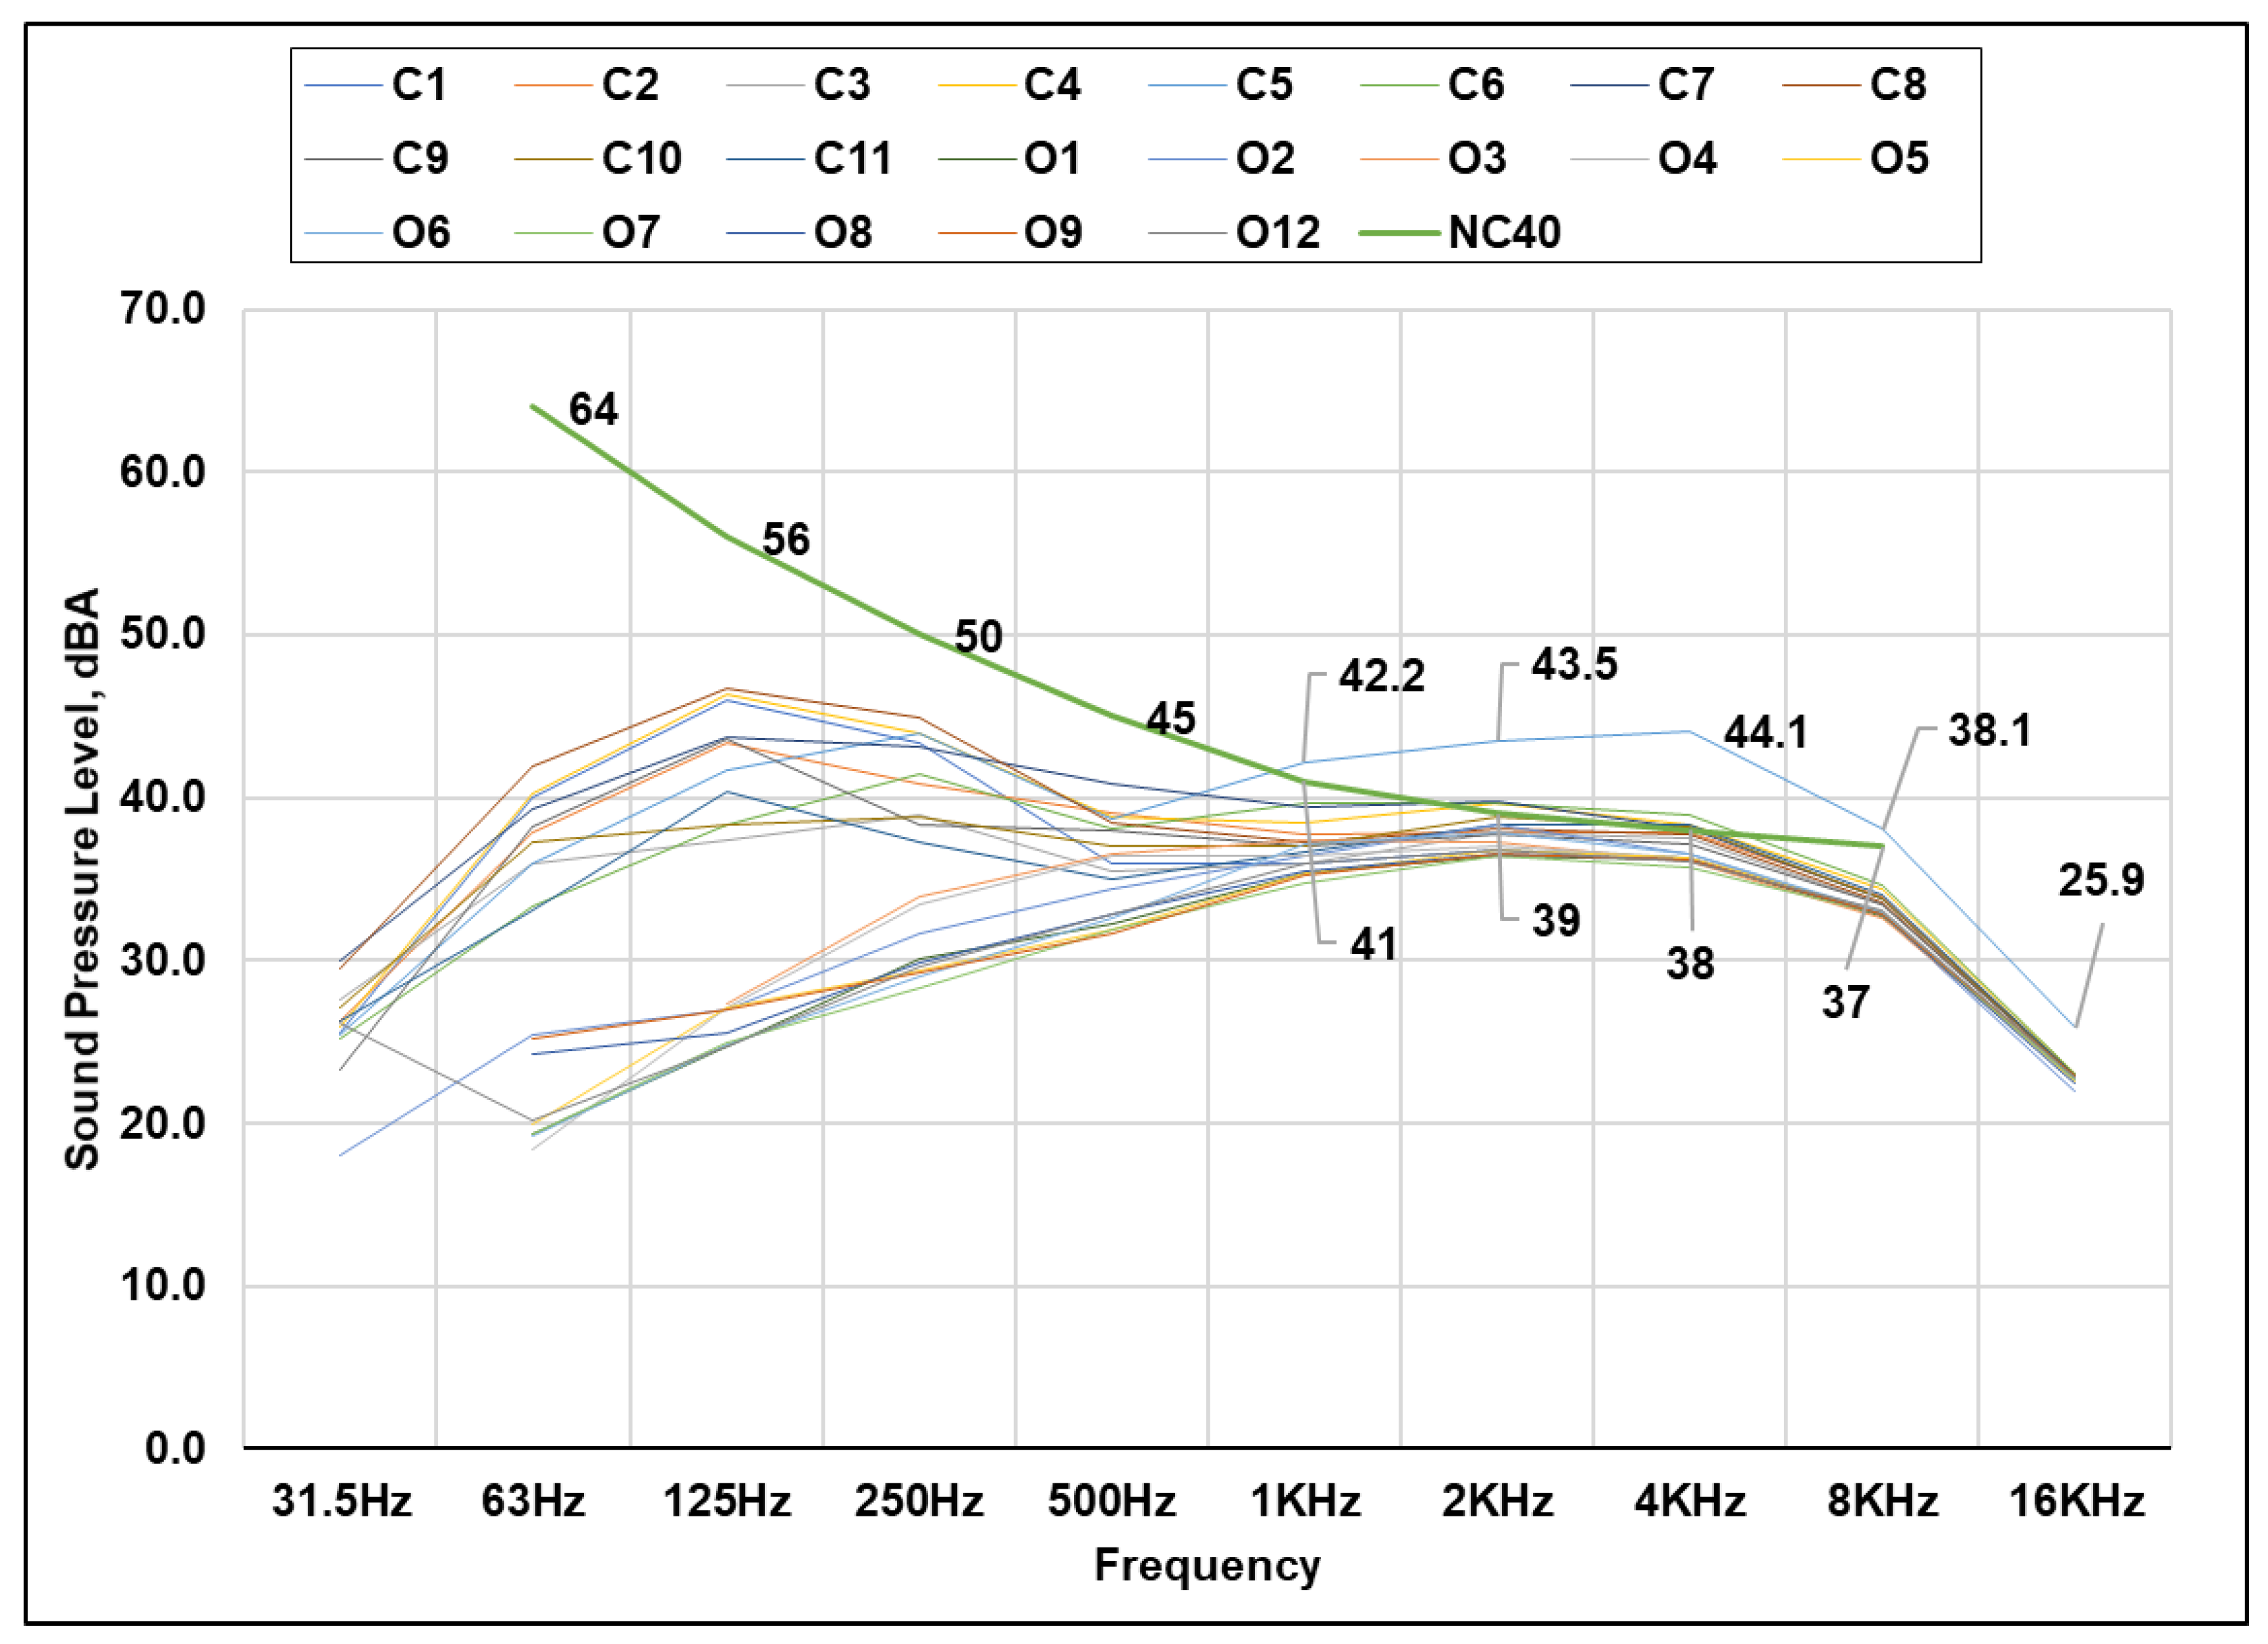
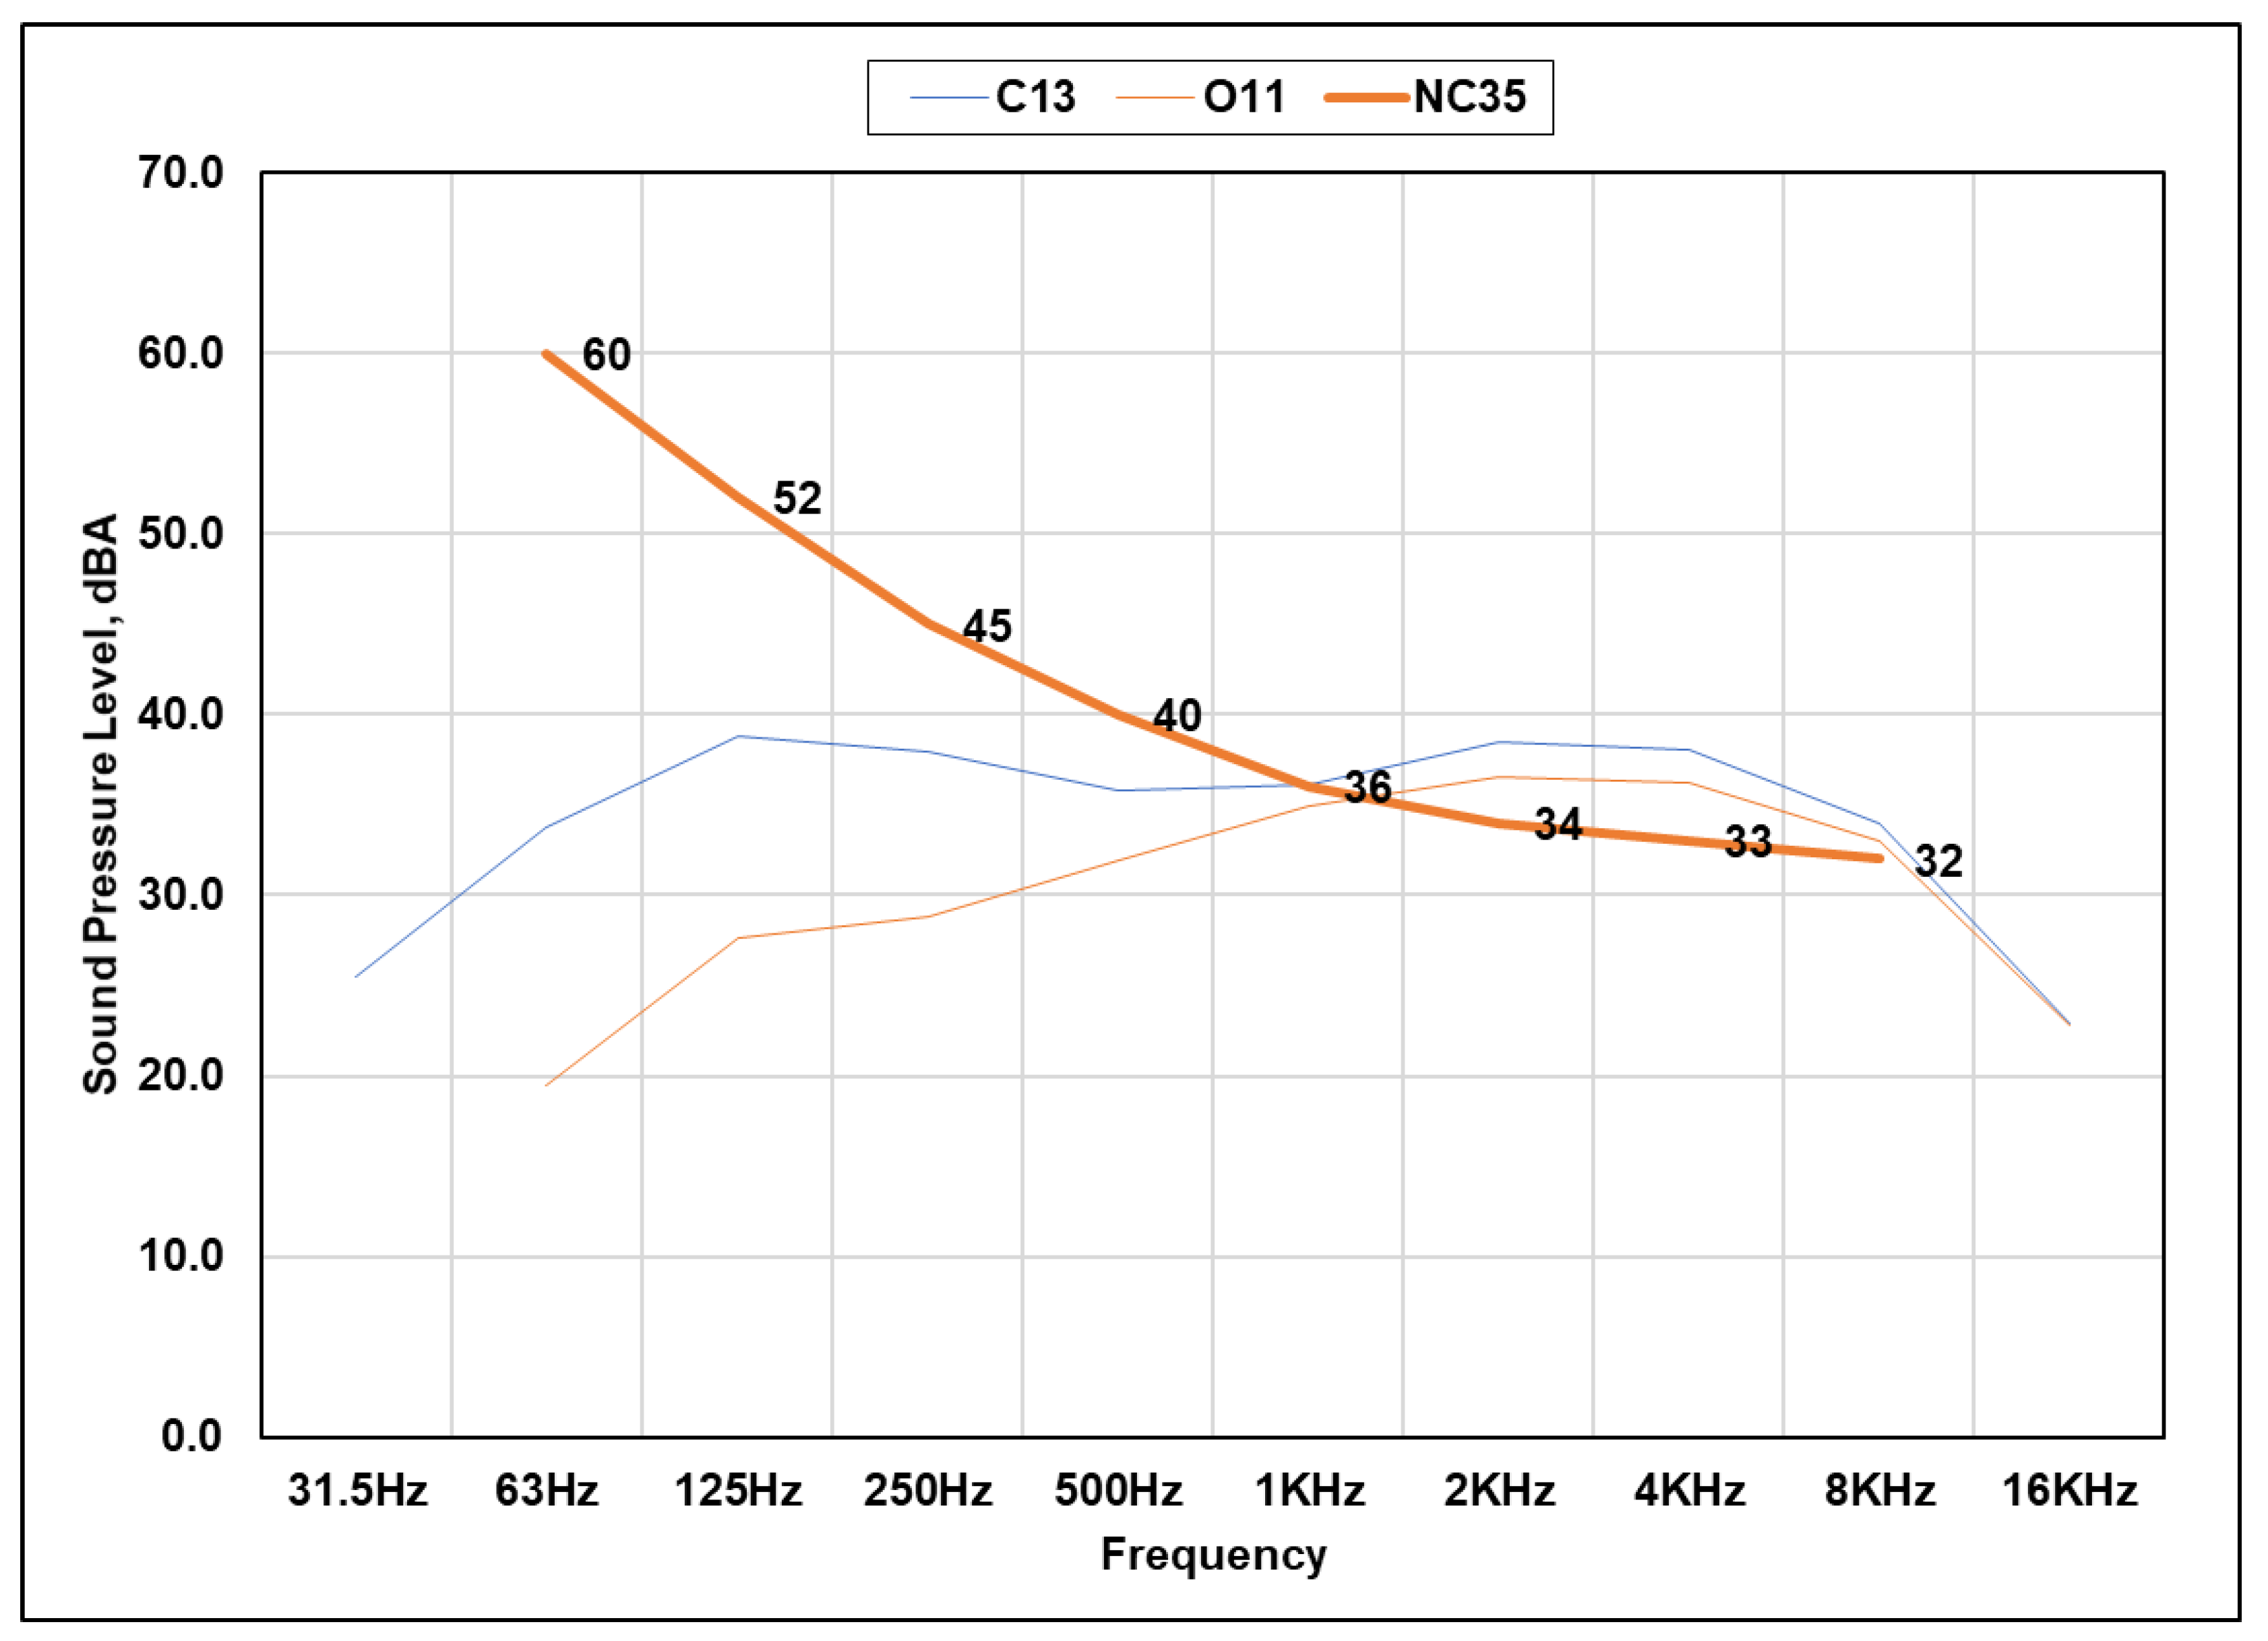
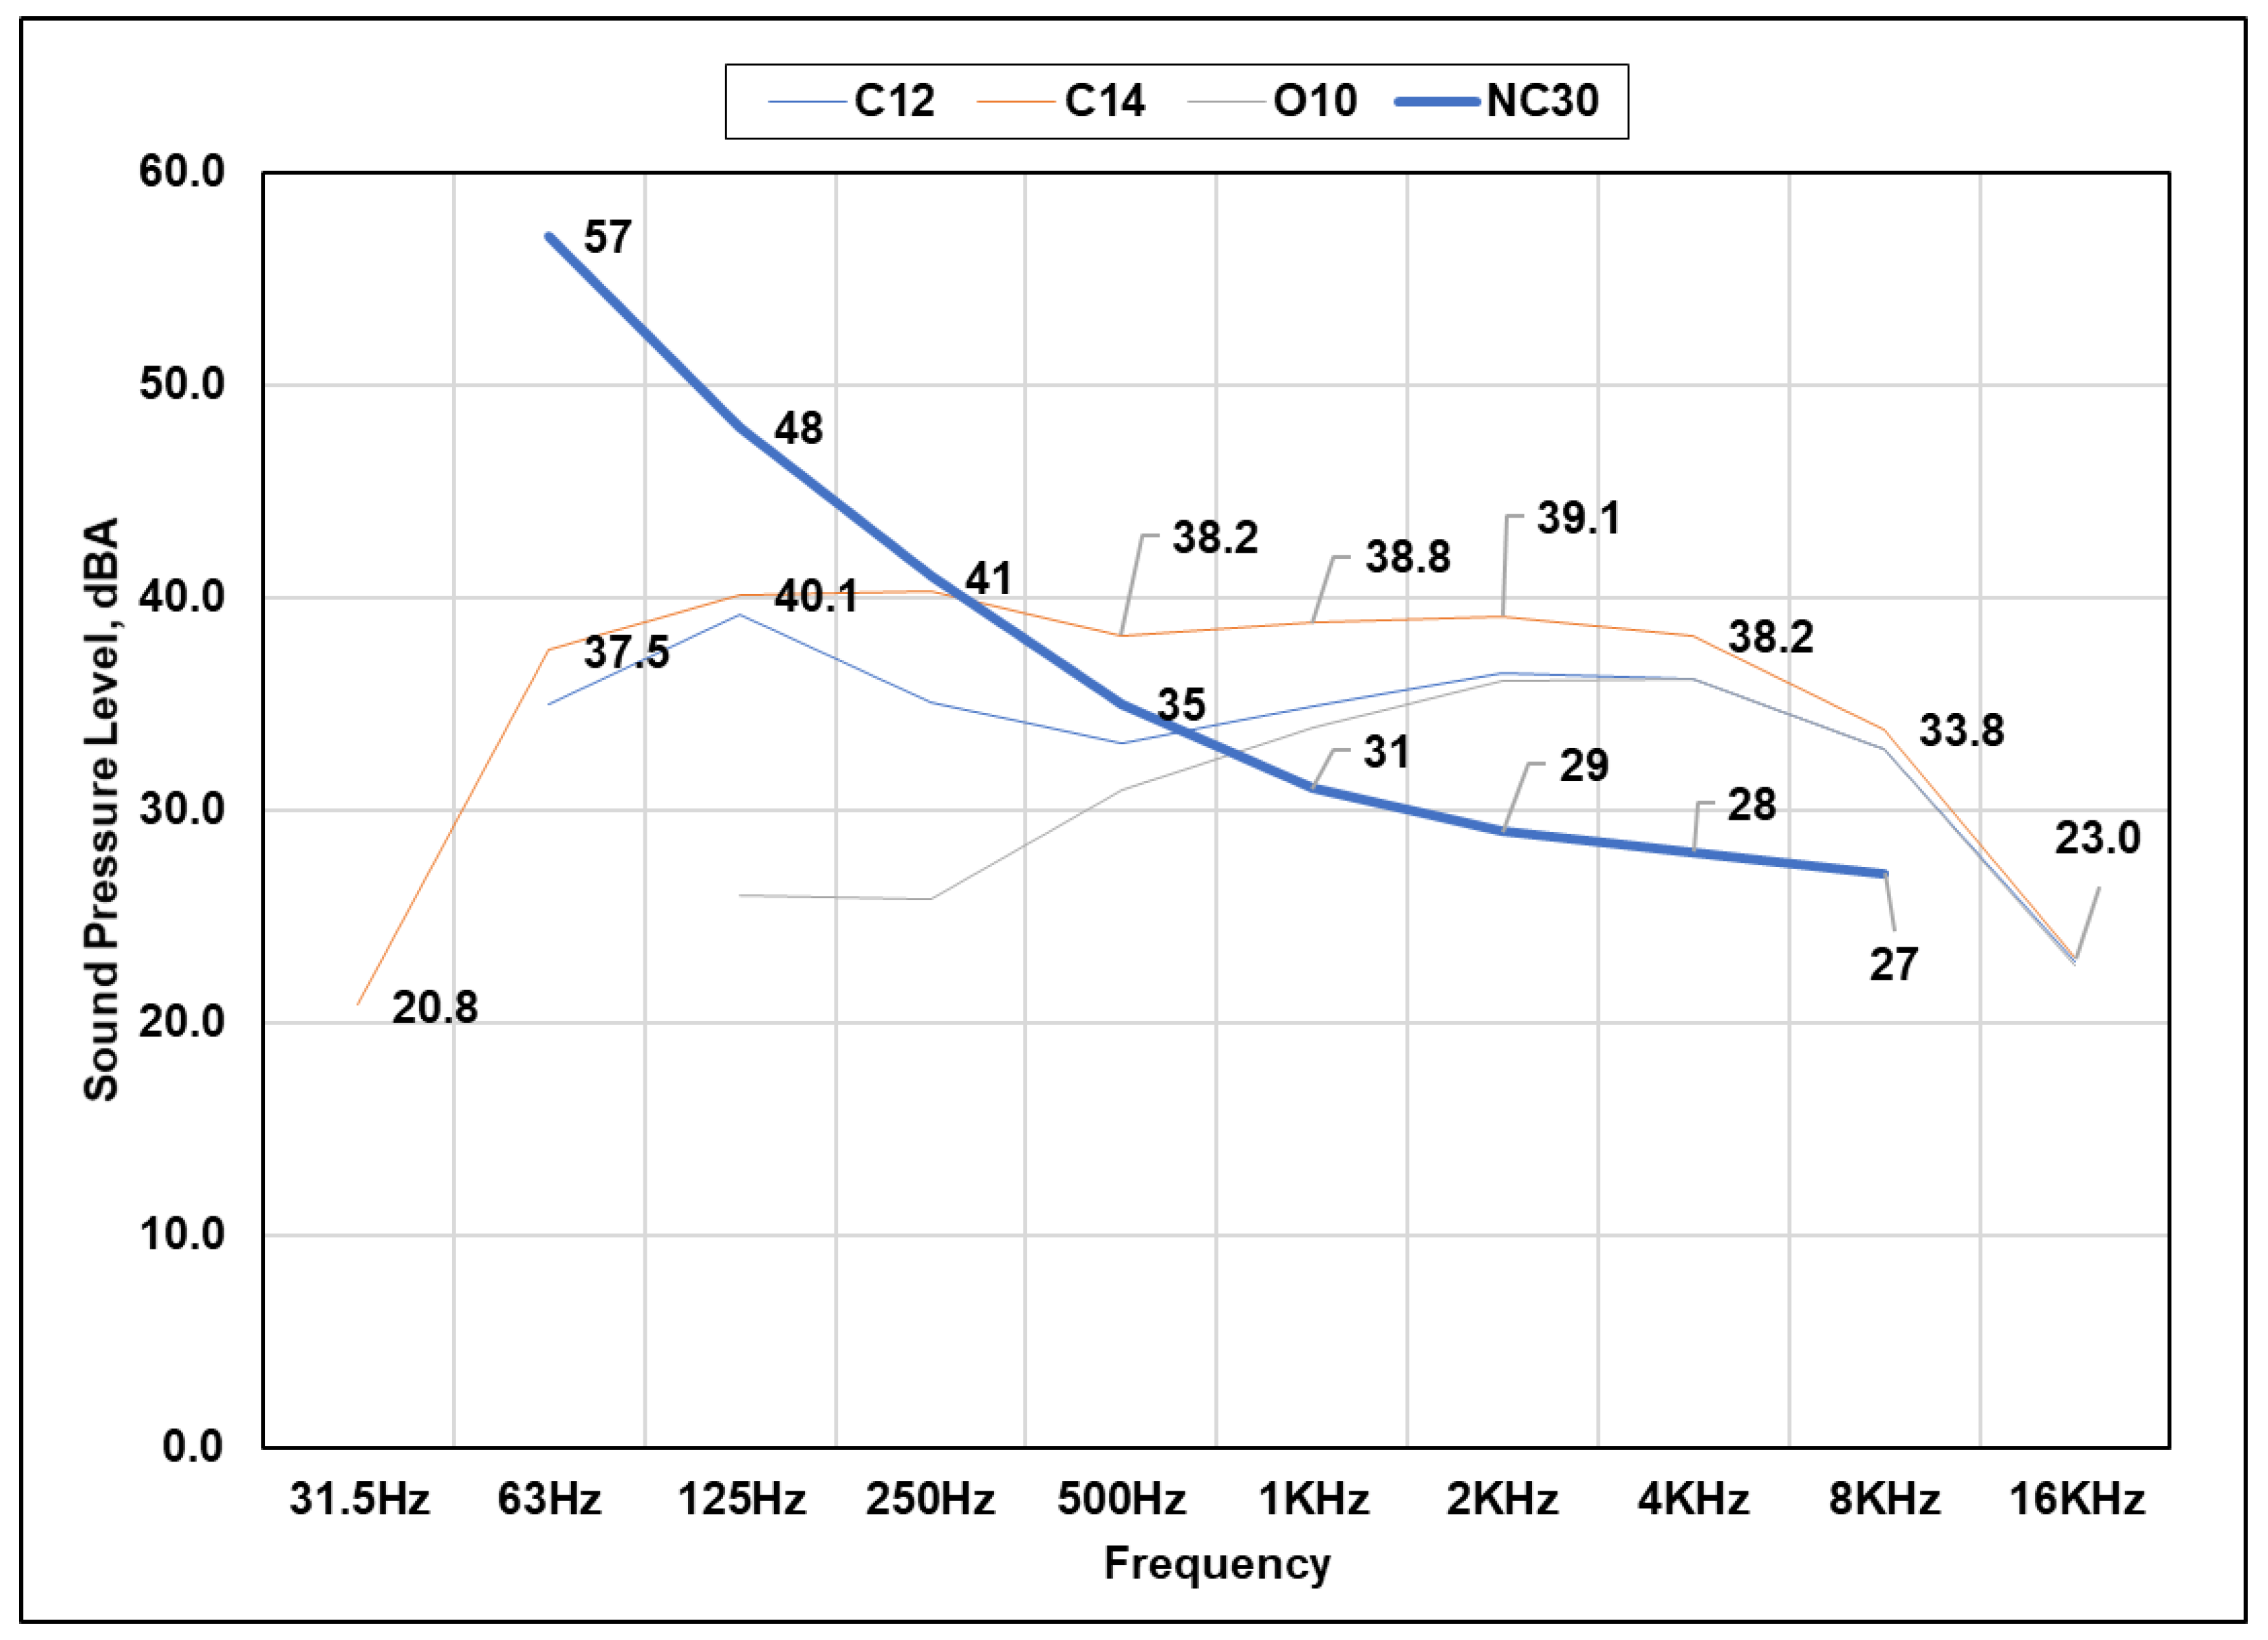
3.1.2. Internally Generated Noise

Internally generated noise was measured with the Phonic PAA6 Audio Analyzer with no occupant presence in the space, and the sound masking system turned off (but with the HVAC system kept running), as specified in Table 1. The WELL standard stipulates that internal noise sources, such as electronic devices, electrical systems, and mechanical equipment systems (HVAC), meet the following maximum noise criteria (NC) level: NC40 for open office spaces and lobbies, NC35 for enclosed offices, and NC30 for conference rooms.
Recorded values across all 26 sampling locations were plotted on three graphs (Figure 10, Figure 11 and Figure 12) where measurements were compared to the corresponding NC curves for open-plan offices, enclosed spaces (huddle rooms), and conference rooms, respectively. Measurements indicate that in all three conference rooms, and both huddle rooms, the NC values at mid and high frequencies (i.e., ranging from 1 to 8 kHz) exceeded the recommended limits. Noise readings in conference room C14 were higher compared to the reference curve (NC30). This may be attributed to the presence of the HVAC supply terminal in the ceiling above the conference room. A few supply air terminals are also located in close proximity to the conference room which could have contributed to the ambient noise level. Because the conference room has an open ceiling, noise generated by the HVAC system may have reflected off of the walls and stayed “entrapped” in the conference room. While the internally-generated noise in the majority of the space was below the recommended limit, at some locations (e.g., C4–C7) the measured noise level did not meet the NC40 requirements, exceeding the SPL levels at high frequencies where human hearing is more sensitive (near the range of 2–5 kHz).

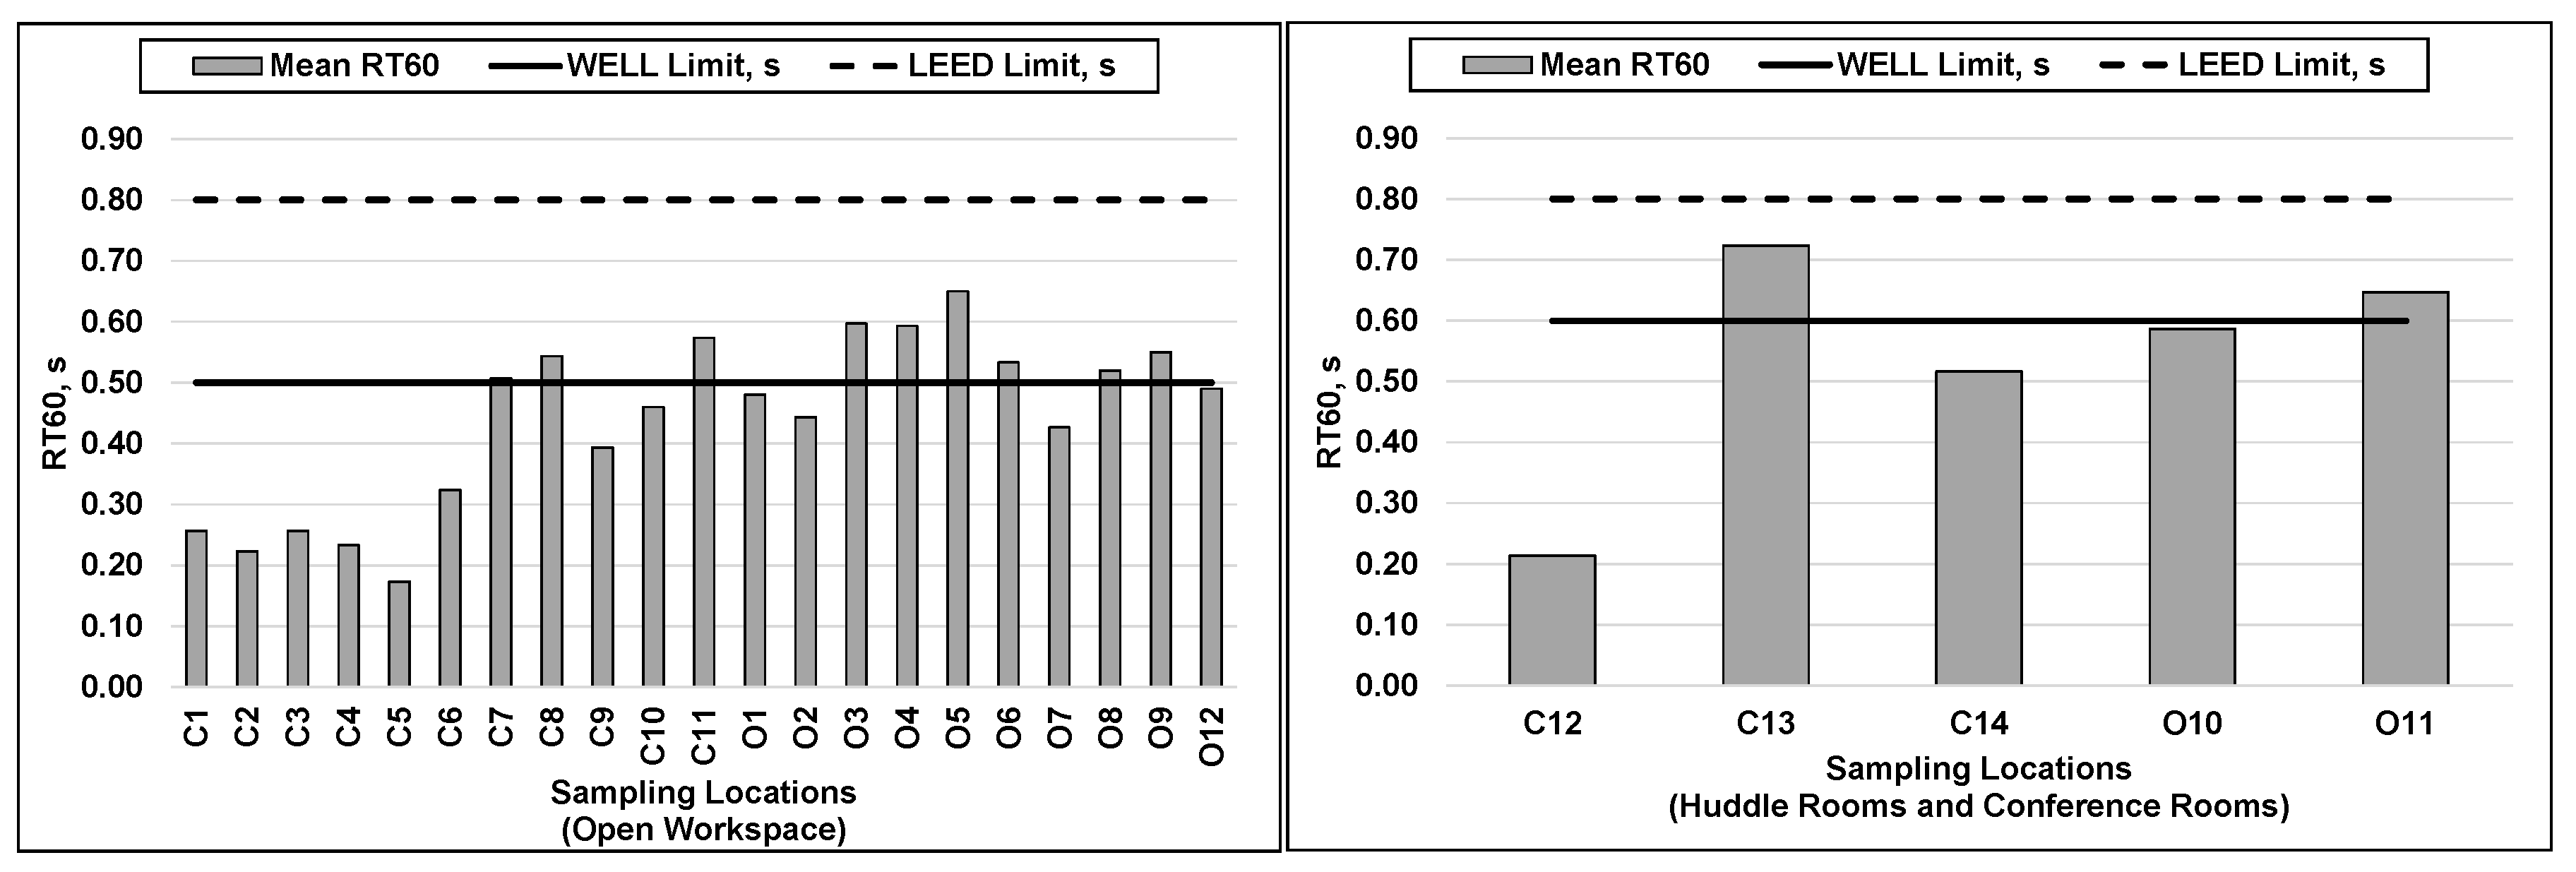
3.1.3. Reverberation Time

Reverberation time measurements were conducted with no occupant presence and both the HVAC and sound masking systems off in accordance with ISO 3382-2:2008 [40]. The standard stipulates that the sound source must be as omnidirectional as possible, as well as produce sound pressure levels sufficient to provide decay curves with the required minimum dynamic range without any intervention caused by background noise. The Phonic PAA6 analyzer was used to carry out the measurement. The authors measured the duration of time required for the averaged sound energy density to decrease by 60 dB after the source has stopped emitting sound (i.e., RT60). If the sound source is not sufficiently intense to ensure a 60 dB difference compared to the background noise (i.e., reverberation time has to be evaluated based on a smaller dynamic range than 60 dB), the Phonic PAA6 analyzer has a feature to extrapolate the recorded dynamic range to a decay time of 60 dB to determine the RT60. In this study, the authors used the extrapolation feature for all the samples because a 60 dB difference between the source and background noise was difficult to achieve.
The WELL standard requires that RT60 does not exceed 0.6 s in conference rooms and 0.5 s in open workspaces. Based on the field measurements, reverberation time exceeded the maximum recommended value in nine out of 21 sampling locations in the open spaces, and in two out of five sampling locations in enclosed spaces, as shown in Figure 13. However, a consensus has not been reached as to whether the 0.5 s limit for open workspace is optimal. For example, ASHRAE protocols [46] and LEED v4 [47] specify that reverberation time for the open-plan office, with or without sound masking, should not exceed 0.8 s, and the field measurements using protocols defined in Table 1 complied with this requirement.
The wider range of values with respect to limiting RT60 in office space suggests that the threshold of reverberation time across various types of office spaces can vary to ensure a satisfactory acoustical environment. A study conducted at Denmark Technical University [48] supports this statement by arguing that reverberation time is not a well-defined parameter to characterize the acoustics in open-plan office workspaces because the acoustical environment in these spaces can be affected by various factors, including the amount of sound absorption, screens, and the degree of background noise.

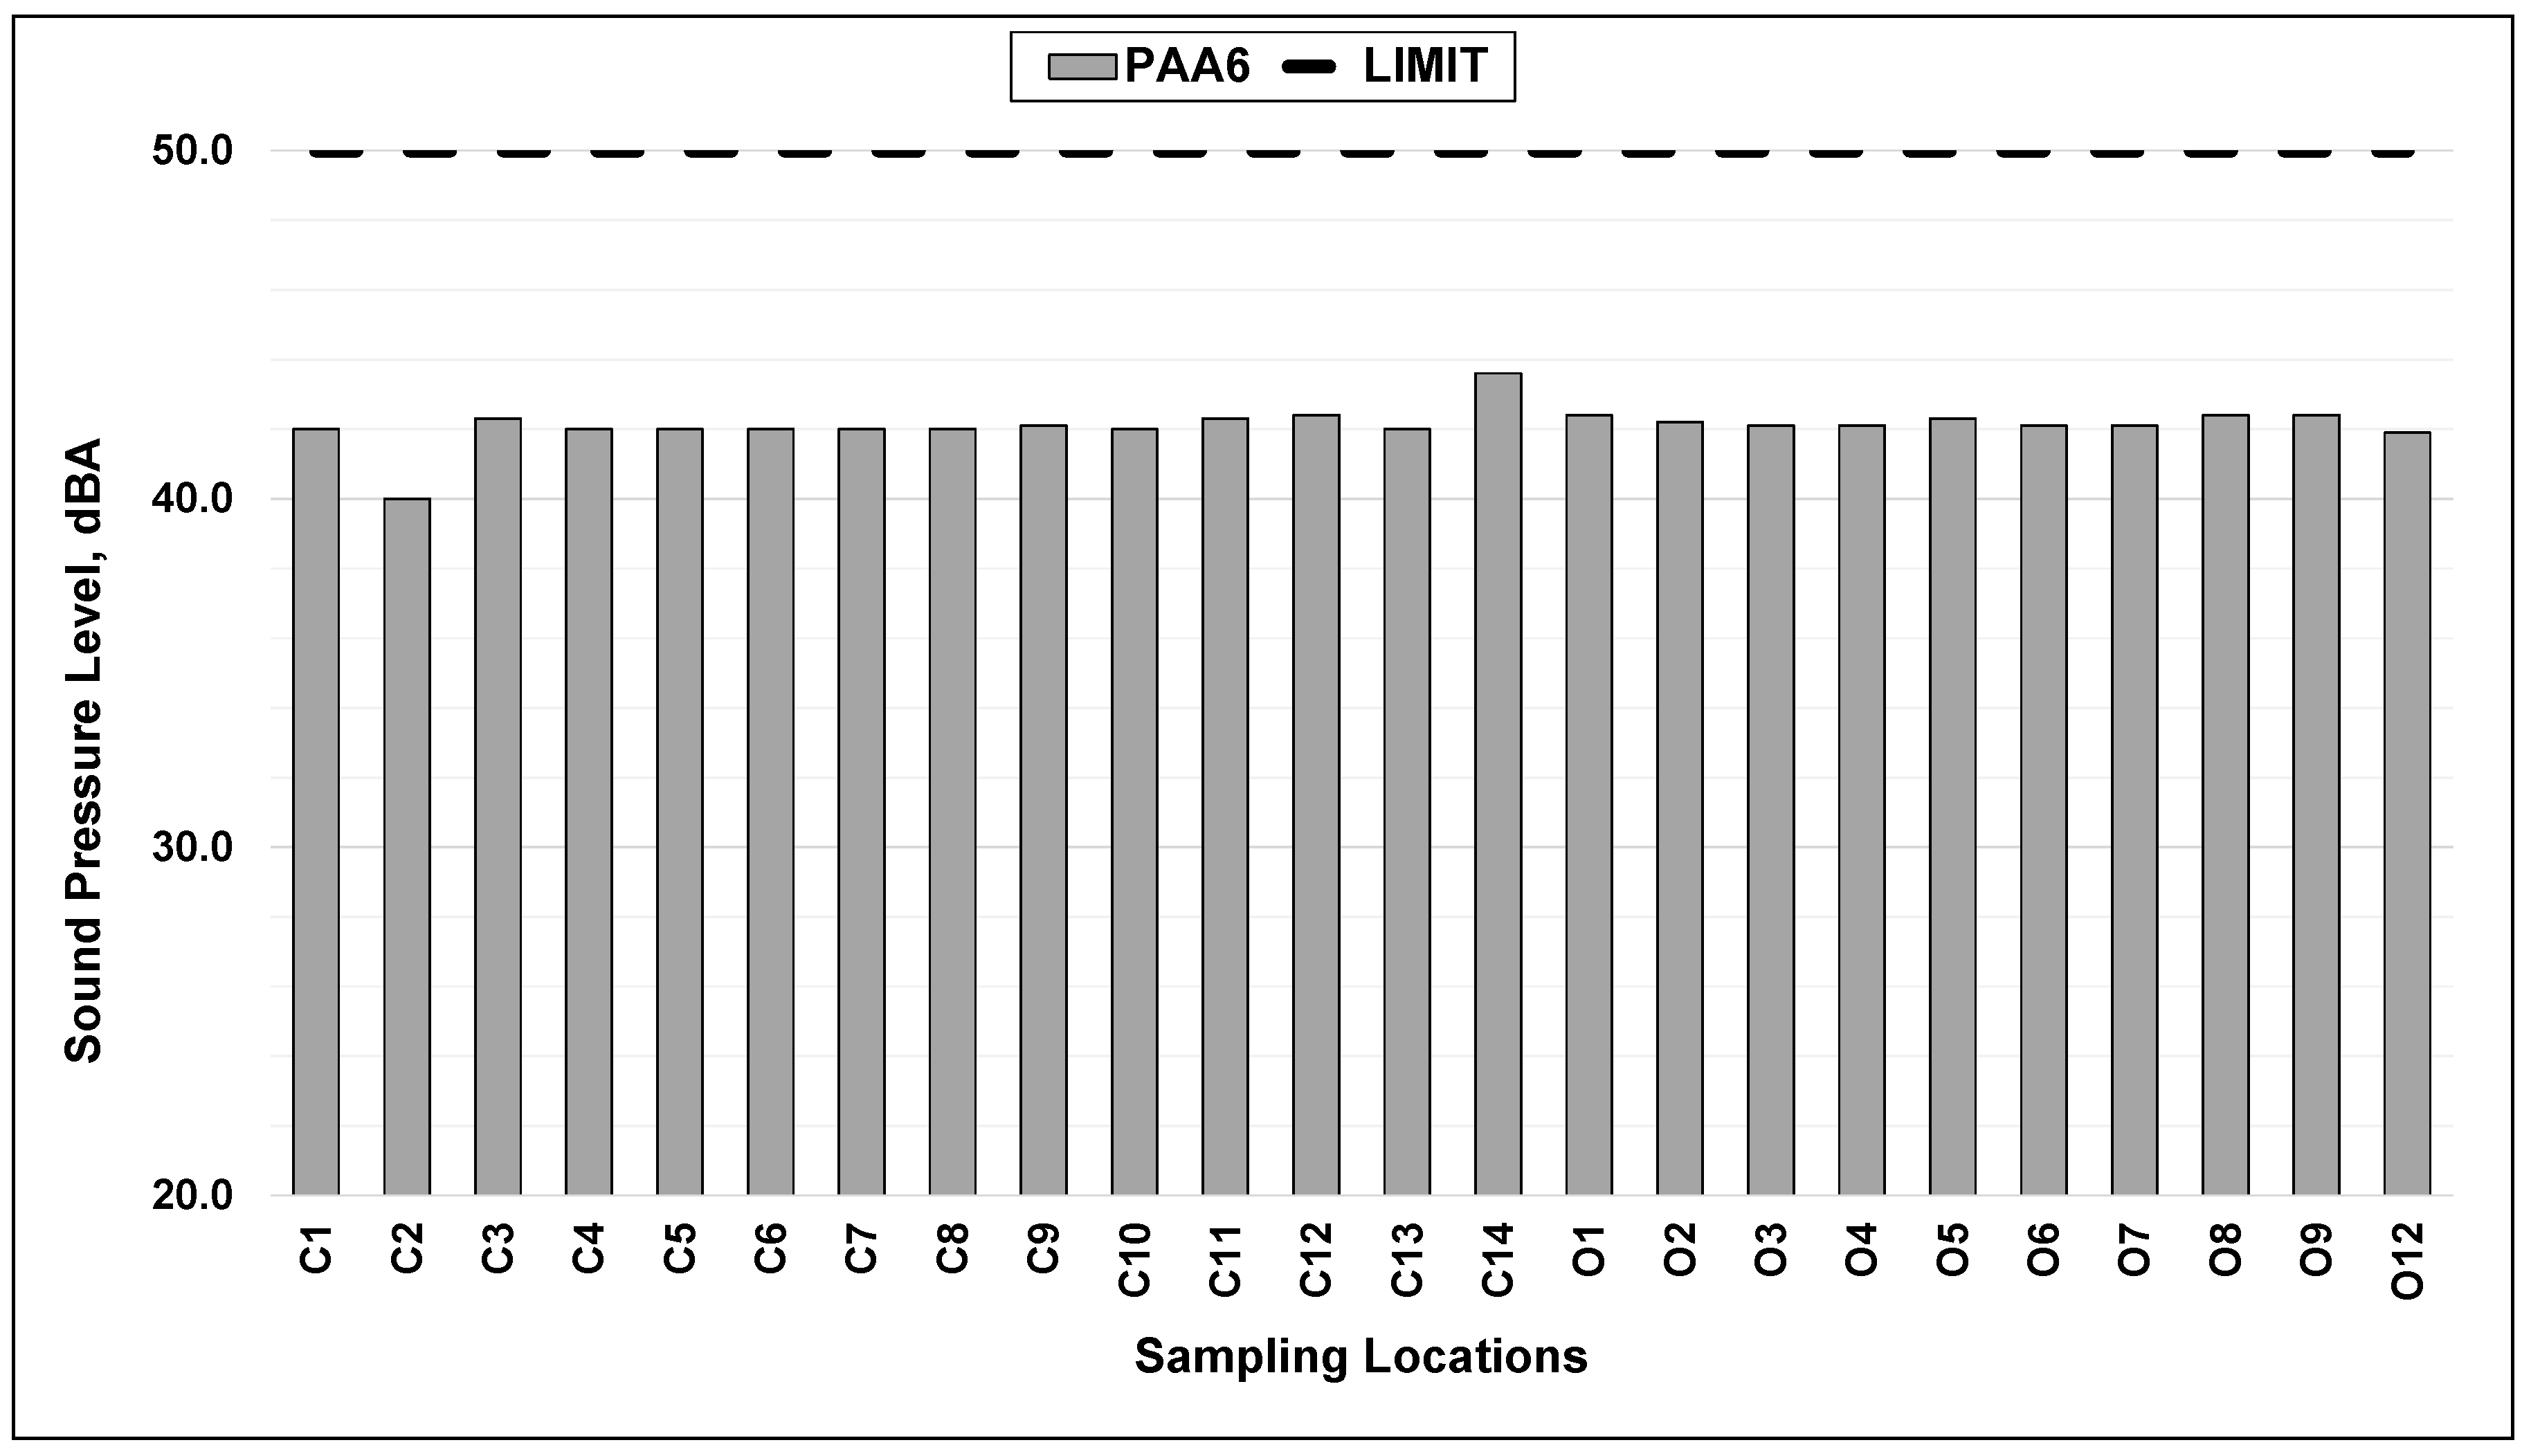
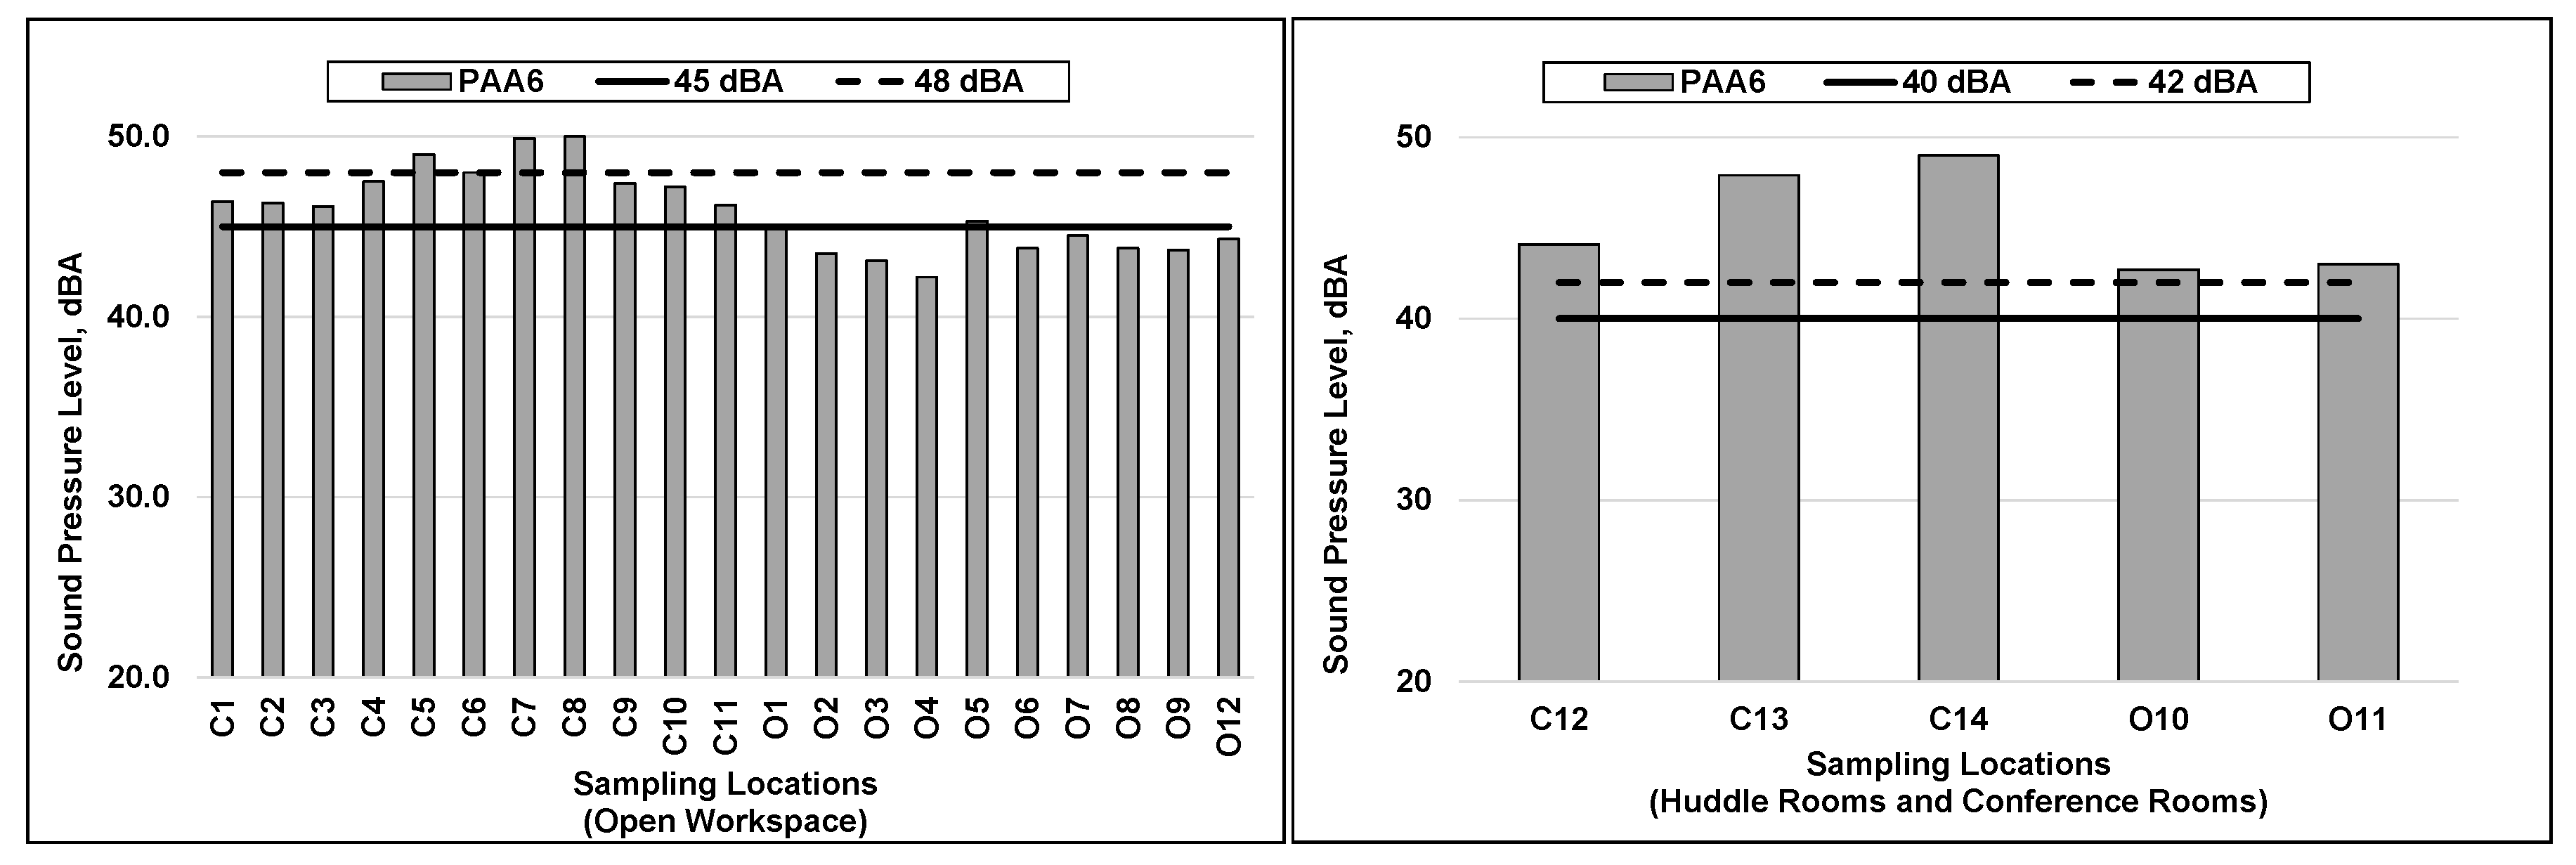
3.1.4. Sound Masking Noise

The measurements were conducted using Phonic PAA6 with no occupants in the space and with both the HVAC and sound masking system on. The WELL standard requires the noise levels of the sound masking system to fall within 45–48 dBA for open workspace and 40–42 dBA for enclosed space. These relatively narrow ranges demand a finely tuned and balanced sound masking system with a high degree of accuracy.
Figure 14 shows the measured noise levels of the sound masking system compared with the WELL standard for all of the sampling locations. Except for nine locations out of 26, the sound masking system-generated noise did not fall within the range recommended by the WELL standard for both open and enclosed workspaces. The measured sound pressure level exceeded the recommended values at three of the open workspace locations C5, C7, and C8, and in all the enclosed spaces. It can be seen in Figure 7 that C7 and C8 are near the huddle rooms and a conference room (e.g., C13 and C14), which may explain why the values exceeded the recommended sound masking system levels. These results reflect the intentional tuning of the sound masking system in the open workspace to reduce the distraction created by conversations and foot traffic occurring from nearby the conference and huddle rooms. In addition, the measured sound masking system noise in the O1–O6 region was relatively low compared to other areas because the occupants in the O1–O6 areas requested that the sound masking system be adjusted to a lower level.

3.2. Subjective Results

3.2.1. Quantitative Data

To explore the research question concerning whether objective measures of sound in the case study building coincide with occupants’ subjective perceptions, the occupants’ responses to questionnaire items were analyzed. Data for each item in both questionnaires were checked for normality based on recommendations by Kline [49]. All items met the criteria for acceptable skewness (values between +3 and −3) and acceptable kurtosis (values between +8 and −8). The means and standard deviations for the five items measuring occupants’ perceptions of attributes concerning acoustics in their office environment before the retrofit had been completed can be found in Table 2. Table 3 lists the means and standard deviations of these same items after the questionnaire was distributed a second time two months after the retrofit was complete and occupants moved back in.
While considering the work environment before the retrofit, participants responded quite neutrally to all five items: means were between 3 and 4 on the seven-point Likert scale where 3 represented a slightly unsatisfactory perception and 4 represented a more neutral impression. When responding to the same items on the second questionnaire, mean responses to some of the items increased slightly compared to the initial questionnaire, while others decreased slightly. A post hoc power analysis indicated that at least 29 participants were needed to reveal significant differences for two-tailed paired samples t-tests between variables at the p < 0.05 level and a large effect size, ρ = 0.70 [50]. Indeed, paired samples t-tests were conducted to understand whether any of these differences were statistically significant; none were ( p > 0.05 in all of the cases). However, given the very slight changes in means, this result likely concerns a lack of real differences in responses rather than a lack of power.
A separate post hoc power analysis indicated that at least 26 participants were needed to reveal significant two-tailed correlations between variables at the p < 0.05 level and a large effect size, ρ = 0.60 [50]. Thus, a sample of 27 participants is sufficient to draw conclusions from significant associations with a large effect size. Correlational analyses were undertaken to understand whether occupants’ responses to particular items significantly associated with one another. Data from the first questionnaire yielded a number of significant correlations between items. When thinking about their office setting before the retrofit had occurred, participants’ satisfaction with the amount of noise from other employees’ conversations while they were at their workstation significantly and positively correlated with their satisfaction with the level of privacy they perceived to have for conversations ( r = 0.69 , p < 0.01 ), as well as with their satisfaction with the amount of non-speech background noise heard at their workstations ( r = 0.72 , p < 0.01 ).
In addition, at the time of the first questionnaire, participants’ levels of satisfaction with the amount of noise from others’ conversations did not significantly associate with their perceived distance between them and the other people they worked with ( r = 0.19 , p > 0.05 ), or with their satisfaction with the extent of control they perceived to have over aspects of their physical workspace, including noise ( r = 0.34 , p > 0.05 ).
This pattern of correlations was mirrored in data collected after the second distribution of the questionnaire, with the addition of significant associations between some items not revealed to be significantly associated in the initial questionnaire. Like before, participants’ satisfaction with the amount of noise from other employees’ conversations while they were at their workstation significantly and positively correlated with their satisfaction with the level of privacy they perceived to have for conversations ( r = 0.46 , p < 0.01 ), as well as with their satisfaction with the amount of non-speech background noise heard at their workstations ( r = 0.34 , p < 0.01 ). In addition, two months after the occupants moved back into the retrofitted space, participants’ satisfaction with the amount of noise from other employees’ conversations while they were at their workstation significantly and positively correlated with perceived distance between them and other people they worked with ( r = 0.46 , p < 0.01 ), as well as with their satisfaction with the extent of control they perceived to have over aspects of their physical workspace, including noise ( r = 0.37 , p < 0.01 ).

3.2.2. Qualitative Data

To further understand these results, and explore the research question concerning underlying themes that describe why occupants become dissatisfied with sound masking systems, the anonymized qualitative data in the form of OARS reports were reviewed with permission from the university’s EH&S department. These reports were made by a small number of employees working on the floor at the time that both questionnaires were distributed. Abbaszadeh et al. [19] undertook a similar step when they analyzed complaint profiles of those dissatisfied with acoustical quality in their workspace. A systematic content analysis of this data were performed to extract common themes among complaints that may indicate whether occupants experienced improvements after the retrofit, as well as a greater sense of control over the acoustics of the space and whether issues were perceived to be cared for by facilities managers. Another purpose of this exercise was to explore the subjective effectiveness of facilities managers’ efforts to manage problematic acoustics issues after occupants had made complaints.
Eight employees submitted OARS reports to formally communicate ways in which the new masking system was negatively affecting their experience at work. Of the 19 distinct comments in these reports, four broad themes emerged. The most prominent theme concerned “health and pain” (i.e., 52.6% of comments contained words and phrases to do with health or pain). Some examples of these comments include: “white noise hurting employees’ ears, causing ringing”, and “white noise is aggravating employees’ tinnitus”. The next most frequent theme that emerged was “productivity” (26.3% of the data). One example of this theme is: “have to wear earplugs in order to get work done”. The themes of “absenteeism” (10.5%) and “frustration/organizational resentment” (10.5%) also captured comments made by employees (e.g., “working off-site to get away from the noise” and “lack of action from department after complaints from many”, respectively). Because only one disagreement occurred between two independent raters for one of the themes (i.e., “productivity”), Cohen’s kappa was acceptable (i.e., above 0.40 according to Altman [51]) ( κ = 0.44 ), indicating good inter-rater reliability and that this theme, and the other three, are clear and cogent.
After complaints were received, a follow-up question was posted online to employees working on the floor (see Section 2.3.2). Not surprisingly, more employees responded to this question than those who submitted independent incident reports to the EH&S department. Indeed, 15 individuals responded to the online question, affording 58 distinct comments to use in a content analysis of responses to a question asking for general comments about the system.
Because the nature of this question was broader than what was asked in a structured incident report form filled out by those whose data were analyzed in the first content analysis, more (i.e., nine) themes emerged from these data. However, only three of the nine themes were very frequent (i.e., “inadequate change”, “improvement”, and “conversational distraction”) while the remaining six (e.g., “health/pain”, “absenteeism”, “neutral/no issues”, “productivity”, “organizational appreciation”, and “organizational advice”) each made up only 3% or less of the comments afforded by occupants. No disagreements occurred between raters.
Forty-seven percent of participants’ comments had to do with a theme concerning “inadequate change” (e.g., “noise is still too much” and “it has been turned down in a few spots, but the spaced out sound is still bad/worse”). In contrast, 28% of the data concerned words and phrases indicating a theme of “improvement” (e.g., “the white noise is less loud” and “ironically, the sound seems louder today, but overall it has improved substantially”). A theme of “conversational distraction” also emerged frequently (e.g., “would be great if people would strive to speak with quiet voices if others are working near them” and “there has been more distraction by conversations since it was turned down, now having to work somewhere else”).

4. Discussion

In summary, the authors used ISO 3382-2:2008 and ISO 3382-3:2012 [40,41] to identify protocols for measuring the acoustical environment in office interiors. Twenty-six different measurement spots were identified across two buildings. Four acoustical parameters (i.e., exterior noise intrusion, internally generated noise, reverberation time, and sound masking level) were measured. Limitations of this study include measurements after working hours and short-term monitoring. The noise was measured after 18:00, which could mean that some of the main noise sources present during the working hours were not there anymore (e.g., construction and traffic noise). Objective measurements analyzed in the study represent data from short-term monitoring sessions as opposed to long-term measurements of indoor acoustics that could be representative of the entire year.
The exterior noise intrusion values were below the WELL Building Standard [7] recommended limit of 50 dBA across all sampling spots. The internally generated noise, in most of the open space offices, was below the recommended limit but, in some open workspaces, the measured HVAC-generated noise did not meet the NC40 requirements. Although some occupants perceived this excess sound to be an issue with the sound masking system, objective measurements indicated that the sound masking system was not contributing to the low-frequency noise and was performing within specifications. The vendor and the consultant suggested that if remediation was desired for the mechanically-generated noise, then the mechanical system must be investigated to develop a noise mitigation plan to match the intended sound masking and background noise goals. This is because the HVAC system generates sound across all frequencies while in operation. Although some of that sound can be attenuated by silencers installed in the ductwork, they may be efficient only at a particular frequency range (personal communication, 10 August 2018). Therefore, this aspect should be thoroughly examined and addressed in the HVAC system design stage. HVAC system noise reduction measures are to be implemented at the source (e.g., sound insulated fan and air handling unit), as well as along air passageways (e.g., silencers along the ductwork) (personal communication, 10 August 2018). These action items were addressed by the facility managers, and the situation was corrected. The facility managers assessed all of the Variable Air Volume (VAV) terminals in the space and adjusted the dampers and air flows to minimize noise transfer.
For the reverberation time, measurements slightly exceeded the maximum value recommended by the WELL Building Standard in approximately 40% of the spaces. However, all values were well within the US Green Building Council’s latest LEED v4 [47], as well as the ASHRAE Performance Measurement Protocols for Commercial Buildings [46]. Because reverberation time is affected by many factors, including the amount of sound absorption, screens, and the degree of background noise, more field studies like ours may add to the understanding of prescribing appropriate thresholds.
Finally, sound levels produced by the new sound masking system were not in agreement with the WELL Building Standard’s recommended range for both open-plan and enclosed offices. These results were expected because intentional adjustments were made to the system based on occupant feedback. Huddle rooms and conference rooms required higher sound masking, as did occupants from directly-adjacent offices to these spaces (whereas, occupants of cubicles located along the northwest wall of the O building desired much lower sound masking levels). Therefore, while objective assessments alone may indicate that sound masking levels do not meet typical green building guidelines, a performance-based approach was used to commission the system to a state of operation agreed upon by both facilities managers and occupants.
This agreement came about because of the small number of occupants who were disturbed by the sound masking system and formally complained through OARS. Of the comments made by these individuals, four key themes emerged indicating negative perceptions of the new system, mainly concerning “health and pain”, as well as “productivity” and “absenteeism”. Unfortunately, when more occupants were asked about their perceptions after attempts were made by facilities management to address the issue, a theme of inadequate change emerged most frequently from the data (i.e., almost half of the comments concerned this theme). While these data indicated some degree of subjective improvement (e.g., 28% of comments), and words concerning “health and pain” were less frequent, comments to do with “distraction” remained, despite a decline in negatively-valenced themes concerning “productivity” and “absenteeism”, after changes to the sound masking system had been completed.
Other subjective results reveal no significant changes between participants’ neutral perceptions of the acoustic environment that existed before the refurbishment and the environment after refurbishment, despite the installation of a sound masking system. Although no significant increase in occupant satisfaction occurred, correlational analyses exposed some successes of the sound masking system installation. When occupants were asked to recall their perceptions about the setting before the refurbishment had been completed, only two associations between questionnaire items measuring satisfaction with the acoustic environment were found (i.e., between participants’ satisfaction with the amount of noise from other employees’ conversations while they were at their workstation, and their satisfaction with the level of privacy they perceived to have for conversations, as well as with their satisfaction with the amount of non-speech background noise heard at their workstations). These correlations were found again when occupants were asked about their perceptions of the post-retrofit work environment, along with two other significant correlations that were not found when participants were considering the initial setting.
Although these new significant correlations may have emerged, in part, because of a greater number of participants responding to the second distribution of the questionnaire, they may also signify a cohesive acoustical experience for those working in the new office environment and that participants became more aware of how different attributes of the soundscape at work associated with their levels of satisfaction. None of the correlations were found to be inverse and, thus, it could be inferred that the physical environment was conducive for positive linear associations between perceptions of privacy and the settings’ acoustics with respect to background and conversational noise. Unfortunately, the extent to which the refurbished environment affected participants’ responses to items asking about their work setting before changes had been made is unclear. However, direct retroactive questions were posed in order to psychologically prompt participants to consider and remember not the current work setting but, rather, their previous one, in some cases. This study was done in situ and was not a controlled experiment. Therefore, some limitations exist when interpreting results without information about the influence the current setting had on participants’ responses about the previous one.
To offer all occupants closed-plan workspaces in today’s office building models would counter many modern lighting and air quality goals [19]. Taken together, results of this case study, along with other research focusing on merging engineering and social science, further highlight the need for innovative design frameworks that afford occupants with sustainable, resource-efficient buildings that account for varied human needs and desires for quietness and privacy.

5. Conclusions

Facilities managers should expect that individual differences will occur in terms of how occupants perceive design changes to office buildings. Rather than a single commissioning process, facilities managers should emphasize the importance of an iterative commissioning framework that centers on small-scale pilot testing in conjunction with systematic survey methods to obtain, analyze, and interpret occupant feedback about their work setting and how they perceive and behave in it. The case study supports this practice by communicating how interdisciplinary methodologies can be used to understand how occupants respond to operational solutions at a granular level to evaluate “success” for office modernization programs that include acoustical solutions. Although objective measurements and industry guidelines for designing satisfactory indoor acoustic environments are necessary, changes to the physical environment, and acoustical systems, in particular, should be evaluated carefully and, sometimes, a case-by-case approach is needed to ensure occupant satisfaction with the soundscape in their work environment. Thus, the findings can help improve upon healthy building guidelines. While a “scorecard” approach is helpful, some deviation from a standard (with appropriate justification) can add flexibility into a design and spur on innovation in modern buildings that aim to positively affect occupant health and satisfaction.

Author Contributions

Conceptualization, A.K. and L.M.; Methodology, A.K. and L.M.; Resources, T.S. and K.L.; Data Curation, A.P. and S.W.; Writing—Original Draft Preparation, A.K. and L.M.; Writing—Review and Editing, S.W. and L.M.; Visualization, S.W. and A.P.; and Supervision, T.S. and K.L.

Funding

This research received no external funding.

Acknowledgments

The authors would like to thank the UW IT occupants for allowing us to access their space and for participating in the survey; Mike Norton (UW Facility Services) for assisting with operating the sound masking and HVAC systems to conduct the acoustical measurements; Brandon Kemperman (UW EH&S) for sharing the reports and measurement equipment; Alex Bjornson (VIU) for assisting with the preliminary content analysis of the EH&S reports and follow up question; and the Valle Scholarship and Scandinavian Exchange Program for supporting the research project.

Conflicts of Interest

The authors declare no conflict of interest.

Abbreviations

The following abbreviations are used in this manuscript:
ASHRAEAmerican Society of Heating, Refrigerating and Air-Conditioning Engineers
HVACHeating, ventilation, and air conditioning
LEEDLeadership in Energy and Environmental Design

References

  1. Kim, J.T. Sustainable and healthy buildings. Energy Build. 2012, 46, 1–2. [Google Scholar] [CrossRef]
  2. Liu, G.; Xiao, M.; Zhang, X.; Gal, C.; Chen, X.; Liu, L.; Pan, S.; Wu, J.; Tang, L.; Clements-Croome, D. A review of air filtration technologies for sustainable and healthy building ventilation. Sustain. Cities Soc. 2017, 32, 375–396. [Google Scholar] [CrossRef]
  3. Gensler. The Future of Workplace. 2015. Available online: https://www.gensler.com/design-forecast-2015-the-future-of-workplace (accessed on 26 April 2019).
  4. McCunn, L.J.; Kim, A.; Feracor, J. Reflections on a retrofit: Organizational commitment, perceived productivity and controllability in a building lighting project in the United States. Energy Res. Soc. Sci. 2018, 38, 154–164. [Google Scholar] [CrossRef]
  5. Center for Active Design, Inc. Reference Guide for the Fitwel Certification System; Fitwel: New York, NY, USA, 2018; Available online: https://fitwel.org/standard (accessed on 26 April 2019).
  6. International Living Future Institute. Living Building Challenge 3.1; International Living Future Institute: Seattle, WA, USA, 2016; Available online: http://go.pardot.com/l/464132/2019-03-18/gf5m7p (accessed on 26 April 2019).
  7. International WELL Building Institute. The WELL Building Standard; International WELL Building Institute: New York, NY, USA, 2018; Available online: https://www.wellcertified.com/en/explore-standard (accessed on 26 April 2019).
  8. Brennan, A.; Chugh, J.S.; Kline, T. Traditional versus Open Office Design. Environ. Behav. 2002, 34, 279–299. [Google Scholar] [CrossRef]
  9. Rasila, H.; Rothe, P. A problem is a problem is a benefit? Generation Y perceptions of open-plan offices. Prop. Manag. 2012, 30, 362–375. [Google Scholar] [CrossRef]
  10. Witterseh, T.; Wyon, D.P.; Clausen, G. The effects of moderate heat stress and open-plan office noise distraction on SBS symptoms and on the performance of office work. Indoor Air 2004, 14, 30–40. [Google Scholar] [CrossRef]
  11. Jahncke, H.; Hygge, S.; Halin, N.; Green, A.M.; Dimberg, K. Open-plan office noise: Cognitive performance and restoration. J. Environ. Psychol. 2011, 31, 373–382. [Google Scholar] [CrossRef]
  12. Pierrette, M.; Parizet, E.; Chevret, P.; Chatillon, J. Noise effect on comfort in open-space offices: Development of an assessment questionnaire. Ergonomics 2014, 58, 96–106. [Google Scholar] [CrossRef] [PubMed]
  13. Kim, J.; de Dear, R. Workspace satisfaction: The privacy-communication trade-off in open-plan offices. J. Environ. Psychol. 2013, 36, 18–26. [Google Scholar] [CrossRef] [Green Version]
  14. Leder, S.; Newsham, G.R.; Veitch, J.A.; Mancini, S.; Charles, K.E. Effects of office environment on employee satisfaction: A new analysis. Build. Res. Inf. 2016, 44, 34–50. [Google Scholar] [CrossRef]
  15. Brill, Michael and Weidemann, Sue. Disproving Widespread Myths about Workplace Design; Technical Report; BOSTI Associates: Jasper, IN, USA, 2001; Available online: https://www.researchgate.net/profile/Sue_Weidemann/publication/243775154/inline/jsViewer/59ad922a458515d09ce19241 (accessed on 26 April 2019).
  16. Brookes, M.J.; Kaplan, A. The Office Environment: Space Planning and Affective Behavior. Hum. Factors J. Hum. Factors Ergon. Soc. 1972, 14, 373–391. [Google Scholar] [CrossRef]
  17. Gifford, R. Environmental Psychology: Principles and Practice, 5th ed.; Optimal Books: Coville, WA, USA, 2014. [Google Scholar]
  18. Aiello, J.R.; Baum, A. Residential Crowding and Design; Plenum Press: New York, NY, USA, 1979. [Google Scholar]
  19. Abbaszadeh, S.; Zagreus, L.; Lehrer, D.; Huizenga, C. Occupant Satisfaction with Indoor Environemental Quality in Green Buildings. In Proceedings of Healthy Buildings 2006; International Society of Indoor Air Quality and Climate (ISIAQ): Santa Cruz, CA, USA, 2006; Volume III, pp. 365–370. Available online: http://escholarship.org/uc/item/9rf7p4bs (accessed on 26 April 2019).
  20. Haapakangas, A.; Kankkunen, E.; Hongisto, V.; Virjonen, P.; Oliva, D.; Keskinen, E. Effects of Five Speech Masking Sounds on Performance and Acoustic Satisfaction. Implications for Open-Plan Offices. Acta Acust. United Acust. 2011, 97, 641–655. [Google Scholar] [CrossRef]
  21. Loewen, L.J.; Suedfeld, P. Cognitive and Arousal Effects of Masking Office Noise. Environ. Behav. 1992, 24, 381–395. [Google Scholar] [CrossRef]
  22. Renz, T.; Leistner, P.; Liebl, A. Effects of the location of sound masking loudspeakers on cognitive performance in open-plan offices: Local sound masking is as efficient as conventional sound masking. Appl. Acoust. 2018, 139, 24–33. [Google Scholar] [CrossRef]
  23. Vassie, K.; Richardson, M. Effect of self-adjustable masking noise on open-plan office worker’s concentration, task performance and attitudes. Appl. Acoust. 2017, 119, 119–127. [Google Scholar] [CrossRef]
  24. Hioka, Y.; Tang, J.W.; Wan, J. Effect of adding artificial reverberation to speech-like masking sound. Appl. Acoust. 2016, 114, 171–178. [Google Scholar] [CrossRef]
  25. Haapakangas, A.; Hongisto, V.; Varjo, J.; Lahtinen, M. Benefits of quiet workspaces in open-plan offices—Evidence from two office relocations. J. Environ. Psychol. 2018, 56, 63–75. [Google Scholar] [CrossRef]
  26. Kjellberg, A. Effects of reverberation time on the cognitive load in speech communication: Theoretical considerations. Noise Health 2004, 7, 11–21. [Google Scholar]
  27. Kristiansen, J.; Persson, R.; Lund, S.P.; Shibuya, H.; Nielsen, P.M. Effects of Classroom Acoustics and Self-Reported Noise Exposure on Teachers’ Well-Being. Environ. Behav. 2011, 45, 283–300. [Google Scholar] [CrossRef]
  28. Scannell, L.; Hodgson, M.; Villarreal, J.G.M.; Gifford, R. The Role of Acoustics in the Perceived Suitability of, and Well-Being in, Informal Learning Spaces. Environ. Behav. 2015, 48, 769–795. [Google Scholar] [CrossRef]
  29. Lee, Y.S. Office layout affecting privacy, interaction, and acoustic quality in LEED-certified buildings. Build. Environ. 2010, 45, 1594–1600. [Google Scholar] [CrossRef]
  30. Sundstrom, E.; Herbert, R.K.; Brown, D.W. Privacy and Communication in an Open-Plan Office. Environ. Behav. 1982, 14, 379–392. [Google Scholar] [CrossRef]
  31. Pejtersen, J.; Allermann, L.; Kristensen, T.S.; Poulsen, O.M. Indoor climate, psychosocial work environment and symptoms in open-plan offices. Indoor Air 2006, 16, 392–401. [Google Scholar] [CrossRef] [PubMed]
  32. Álvarez-Morales, L.; Zamarreño, T.; Girón, S.; Galindo, M. A methodology for the study of the acoustic environment of Catholic cathedrals: Application to the Cathedral of Malaga. Build. Environ. 2014, 72, 102–115. [Google Scholar] [CrossRef]
  33. Crociata, S.D.; Simone, A.; Martellotta, F. Acoustic comfort evaluation for hypermarket workers. Build. Environ. 2013, 59, 369–378. [Google Scholar] [CrossRef]
  34. Jeon, J.Y.; You, J.; Jeong, C.I.; Kim, S.Y.; Jho, M.J. Varying the spectral envelope of air-conditioning sounds to enhance indoor acoustic comfort. Build. Environ. 2011, 46, 739–746. [Google Scholar] [CrossRef]
  35. Huisman, E.; Morales, E.; van Hoof, J.; Kort, H. Healing environment: A review of the impact of physical environmental factors on users. Build. Environ. 2012, 58, 70–80. [Google Scholar] [CrossRef] [Green Version]
  36. Hodgson, M. Acoustical Evaluation of Six “Green’ Office Buildings. J. Green Build. 2008, 3, 108–118. [Google Scholar] [CrossRef]
  37. De Salis, M.; Oldham, D.; Sharples, S. Noise control strategies for naturally ventilated buildings. Build. Environ. 2002, 37, 471–484. [Google Scholar] [CrossRef]
  38. Abdalrahman, Z.; Galbrun, L. Soundscape assessment of a water feature used in an open-plan office. In Proceedings of the 33rd PLEA International Conference, Edinburgh, UK, 2–5 July 2017; Brotas, L., Roaf, S., Nicol, F., Eds.; NCEUB: Edinburgh, UK, 2017; Volume 3, pp. 4734–4741. [Google Scholar]
  39. U.S. General Services Administration Center for Workplace Strategy Public Buildings Service. Sound Matters: How to Achieve Acoustic Comfort in the Contemporary Office; U.S. General Services Administration Center for Workplace Strategy Public Buildings Service: Washington, DC, USA, 2012. Available online: https://www.gsa.gov/cdnstatic/GSA_Sound_Matters_%28Dec_2011%29_508.pdf (accessed on 26 April 2019).
  40. ISO. ISO 3382-3:2012 Acoustics—Measurement of Room Acoustic Parameters—Part 3: Open Plan Offices; International Organization for Standardization: Geneva, Switzerland, 2008. [Google Scholar]
  41. ISO. ISO 3382-2:2008 Acoustics—Measurement of Room Acoustic Parameters—Part 2: Reverberation Time in Ordinary Rooms; International Organization for Standardization: Geneva, Switzerland, 2012. [Google Scholar]
  42. Qualtrics. Qualtrics; Provo, UT, USA, 2018. Available online: https://www.qualtrics.com (accessed on 26 April 2019).
  43. Veitch, J.A.; Charles, K.E.; Farley, K.M.; Newsham, G.R. A model of satisfaction with open-plan office conditions: COPE field findings. J. Environ. Psychol. 2007, 27, 177–189. [Google Scholar] [CrossRef] [Green Version]
  44. Tavakol, M.; Dennick, R. Making sense of Cronbach’s alpha. Int. J. Med. Educ. 2011, 2, 53–55. [Google Scholar] [CrossRef] [PubMed]
  45. Newsham, G.; Brand, J.; Donnelly, C.; Veitch, J.; Aries, M.; Charles, K. Linking indoor environment conditions to job satisfaction: A field study. Build. Res. Inf. 2009, 37, 129–147. [Google Scholar] [CrossRef]
  46. ASHRAE; USGBC; CIBSE. Performance Measurement Protocols for Commercial Buildings; ASHRAE: Atlanta, GA, USA, 2010. [Google Scholar]
  47. U.S. Green Building Council. LEED v4 for Building Design and Construction; U.S. Green Building Council: Washington, DC, USA, 2016. [Google Scholar]
  48. Rindel, J.H. Prediction of acoustical parameters for open plan offices according to ISO 3382-3. J. Acoust. Soc. Am. 2012, 131, 3357. [Google Scholar] [CrossRef]
  49. Kline, R.B. Principles and Practice of Structural Equation Modeling, 4th ed.; The Guilford Press: New York, NY, USA, 2015. [Google Scholar]
  50. Faul, F.; Erdfelder, E.; Buchner, A.; Lang, A.G. Statistical power analyses using G*Power 3.1: Tests for correlation and regression analyses. Behav. Res. Methods 2009, 41, 1149–1160. [Google Scholar] [CrossRef] [PubMed] [Green Version]
  51. Altman, D.G. Practical Statistics for Medical Research, 1st ed.; Chapman and Hall: London, UK, 1991. [Google Scholar]
Figure 1. Study timeline for objective and subjective data collection.
Acoustics 01 00027 g001
Figure 2. Comparison between the pre- and post-retrofit office layout.
Acoustics 01 00027 g002
Figure 3. The sound masking system zones on floor C3 (each zone is marked by a different color).
Acoustics 01 00027 g003
Figure 4. The sound masking system zones on floor O3 (each zone is marked by a different color).
Acoustics 01 00027 g004
Figure 5. Equipment and measurement setup.
Acoustics 01 00027 g005
Figure 6. Different types of rooms on the floor.
Acoustics 01 00027 g006
Figure 7. Selected sampling locations.
Acoustics 01 00027 g007
Figure 8. Locations of air supply diffusers and return grilles.
Acoustics 01 00027 g008
Figure 9. Exterior noise intrusion measured at each sampling location.
Acoustics 01 00027 g009
Figure 10. Internally generated noise curves in open spaces compared with NC40 curve.
Acoustics 01 00027 g010
Figure 11. Internally generated noise curves in huddle rooms compared with NC35 curve.
Acoustics 01 00027 g011
Figure 12. Internally generated noise curves in conference rooms compared with NC30 curve.
Acoustics 01 00027 g012
Figure 13. Reverberation time measurements (RT60) in various spaces compared with WELL and LEED recommended limits.
Acoustics 01 00027 g013
Figure 14. The sound masking system noise levels measured by the authors and the acoustical consultant.
Acoustics 01 00027 g014
Table 1. Indoor acoustic performance measurement protocol.
ParameterMethodSystem On/OffSampling
HVACSound MaskingLocationDuration
Sound MaskingA-weighted time-averaged sound pressure level (dBA)OnOn10% of the total number of open workspaces and 10% of the total number of enclosed rooms (1 sample per location)30 s at each sampling point
Internally Generated NoiseNoise CriterionOnOff
Exterior Noise IntrusionA-weighted time-averaged sound pressure level (dBA)OffOff
Reverberation TimeImpulse Response (RT60)OffOff10% of the total number of open workspaces and 10% of the total number of enclosed rooms (3 samples per location)-
Table 2. Descriptive statistics for items measuring occupant perceptions of their acoustical environment at work before retrofit whereby 1 = an unsatisfactory response and 7 = a very satisfactory response .
ItemMeanSD
Amount of noise from other peoples’ conversations while you were at your workstation ( n = 27 )3.331.92
Distance between you and other people with whom you work ( n = 27 )4.891.76
Level of privacy for conversations ( n = 27 )3.301.79
Amount of background noise (i.e., not speech) you heard at your workstation ( n = 27 )3.741.81
I was satisfied with the extent of control I had over aspects of my physical workspace (e.g., lighting, noise, privacy) ( n = 27 )3.071.75
Table 3. Descriptive statistics for items measuring occupant perceptions of their acoustical environment at work after retrofit whereby 1 = an unsatisfactory response and 7 = a very satisfactory response .
ItemMeanSD
Amount of noise from other peoples’ conversations while you were at your workstation ( n = 56 )4.141.86
Distance between you and other people with whom you work ( n = 56 )4.451.86
Level of privacy for conversations ( n = 56 )3.291.75
Amount of background noise (i.e., not speech) you heard at your workstation ( n = 56 )3.521.90
I was satisfied with the extent of control I had over aspects of my physical workspace (e.g., lighting, noise, privacy) ( n = 57 )3.511.83

