Abstract
Fecal calprotectin (FC), chitinase 3-like-1 protein (CHI3L1), S100A12 and osteoprotegerin (OPG) are biomarkers of intestinal inflammation. This cross-sectional study aimed to evaluate these biomarkers in a cohort of children with Crohn’s disease (CD) and compare them with other measures of disease activity. Stool samples from children with CD were used to measure FC, CHI3L1, S100A12 and OPG by enzyme-linked immunosorbent assay. Serum inflammatory markers were measured and pediatric CD disease activity index (PCDAI) scores calculated. The simple endoscopic score for CD (SES-CD) was reported for a subgroup who underwent ileocolonoscopy corresponding with the stool samples. Sixty-five children were recruited. Children in clinical remission had lower FC and CHI3L1 levels than those with active disease (FC: 277 vs. 1648 µg/g, p = 0.012; CHI3L1: 23 vs. 227 ng/g, p = 0.013). FC levels differed between patients with clinically active or inactive isolated ileal CD. Although FC and CHI3L1 levels correlated strongly (r = 0.83), none of the fecal markers correlated well with serum markers. Only FC and OPG correlated with SES-CD scores (r = 0.57 and r = 0.48, respectively). In conclusion, FC correlated with both endoscopic and clinical disease activity and was the only biomarker that differentiated between active and inactive ileal CD. CHI3L1 also predicted clinical disease activity and correlated highly with FC. Further investigation of the role of CHI3L1 is required.
1. Introduction
Crohn’s disease (CD) is one of two main subtypes of inflammatory bowel disease (IBD) [1]. Although the pathogenesis of IBD is not clearly understood, interactions between the intestinal microbiome and host immune responses in the setting of genetic risk are felt to be most important [2].
CD is generally characterized by a relapsing remitting pattern of GI tract inflammation. Disease monitoring is crucial in guiding treatment choices, assessing response to an intervention and for monitoring the maintenance of remission. Endoscopic assessment is considered to be the gold standard for diagnosis and assessment of intestinal inflammation in CD [3,4]. However, this is expensive, invasive and unpleasant, making it difficult to repeat regularly. Although serum biomarkers can be measured easily and cheaply to assess the presence of inflammation, they lack specificity [5]. Fecal biomarkers, on the other hand, can provide a more specific indication of intestinal inflammation, are relatively cheap to measure, are easy to obtain and changes may be detected earlier than serum markers [6].
Fecal calprotectin (FC) is the most studied fecal biomarker in the setting of IBD and is widely available in routine clinical practice. FC, predominantly derived from neutrophils, reliably reflects endoscopic findings of intestinal inflammation [7,8,9]. Although FC is more variable in children aged less than five years of age, a normal level in older children would be expected to be <50 µg/g [5]. Modest elevation of FC can be seen in other situations, such as gastrointestinal malignancy, nonsteroidal anti-inflammatory drug use or infectious gastroenteritis. FC assessment can also be limited by intrasample variability and variation over the course of a day [9,10]. In addition, FC measurement may be less reliable in individuals with disease involvement proximal to the colon [7,11,12].
Consequently, various other fecal biomarkers have been evaluated. S100A12, also known as calgranulin C or EN-RAGE, is another member of the S100 family of proteins [13]. S100A12 may be more specific in differentiating between IBD and functional GI disorders than FC, and also appears to vary less with age [5,14,15]. However, it may be less stable in stool than FC and also appears to be unhelpful in isolated ileal CD [16,17]. Osteoprotegerin (OPG) is a member of the tumor necrosis factor receptor superfamily and is involved in bone metabolism and tumorigenesis [18,19]. OPG contributes to inflammatory pathways and has been described as a fecal marker of inflammation in pediatric IBD [20,21]. More recently, Chitinase 3-Like-1 (CHI3L1) has been shown to be a useful biomarker of intestinal inflammation [22,23]. CHI3L1 is expressed by colonic epithelial cells, macrophages and neutrophils and is also upregulated in various solid tumors.
The primary aim of this study was to ascertain the relationship between clinical disease activity and levels of FC, CHI3L1, S100A12 and OPG in stool samples collected from a cohort of children with CD. Further aims were to determine the relationships of these markers to patient features (sex and age), disease location and standard inflammatory markers.
2. Methods
2.1. Patient Recruitment
This cross-sectional cohort study prospectively recruited children, aged 18 years or less, with existing or new CD in the South Island of New Zealand. Diagnosis of CD was based on upper and lower endoscopy, with histological and radiological criteria, as per the revised Porto criteria [3,24]. There were no specific exclusion criteria. Date of initial endoscopic assessment was used as the date of diagnosis. Patient demographics were recorded at enrolment, along with disease classification, anthropometric measurements, medical treatment and clinical disease activity. Endoscopic severity was documented utilizing the Simple Endoscopic Score for CD (SES-CD) only in the children recruited within one month of their endoscopic assessment [25].
2.2. Standard Serum Markers of Inflammation
The results of routinely measured serum inflammatory markers were recorded. These included C-reactive protein (CRP), erythrocyte sedimentation rate (ESR), hematocrit (HCT), albumin and platelets. Standard laboratory cut-off values were used.
2.3. Clinical Disease Assessment
Disease activity was measured with the validated Pediatric CD activity index (PCDAI) [26]. Standard cut-off values were utilized: <10 for remission, 10–27.5 for mild disease, ≥27.5–37.5 for moderate disease and ≥37.5 for severe disease [27,28]. In addition, the modified PCDAI (modPCDAI) score was also calculated for each patient [29].
2.4. Fecal Biomarker Measurement
Patients were asked to collect stool samples at home. After collection, stools were initially stored at 4° Celsius prior to transport the same day to the laboratory, where they were stored at −80° Celsius until used for biomarker measurement.
Fecal extractions were conducted according to relevant enzyme-linked immunosorbent assay (ELISA) protocols and resulting supernatants were used immediately for immunoassays. In brief, stool was weighed and then extraction buffer added at set weight to buffer ratios. This was agitated on a vortex (VF2, IKA Labortechnik, Staufen, Germany) into a homogenous mixture. Further homogenizing took place on a suspension mixer (Gyrotory shaker model G2, New Brunswick Scientific Co, Edison, NJ, USA) for 30 min. Samples were then centrifuged at 13,000× g for 10 min and the resulting supernatant used in the ELISAs.
Commercial ELISA kits were utilized for FC (Bühlmann Laboratories, fCAL ELISA kit, EK-CAL2 192 test, Schönenbuch, Switzerland), CHI3L1 (R&D Systems, Human Chitinase 3-like-1 DuoSet ELISA, Minneapolis, MN, USA) and OPG (R&D Systems, Human Osteoprotegerin/TNFRSF11B DuoSet, Minneapolis, MN, USA) following manufacturers’ protocols. S100A12 was measured by ELISA following a previously developed protocol [14].
2.5. Statistical Analysis
Standard descriptive statistics were used to summarize the data including medians and interquartile ranges for continuous variables and frequencies and percentages for categorical variables. The nonparametric Mann–Whitney U and Kruskall–Wallis tests were used for comparing biomarker levels between demographic and disease characteristic groups. Chi-square or Fisher’s exact tests were employed for the comparisons of categorical measures. The Spearman’s rank correlation coefficient was used for exploring the strength of the association between continuous measures. A correlation coefficient of 0.3–0.5 was considered as weak, 0.5–0.7 as moderate and >0.7 as strong. A two-tailed p-value < 0.05 was considered statistically significant. Statistical analysis was performed using SPSS (IBM SPSS version 26, Armonk, NY, USA) and figures were created utilizing GraphPad (GraphPad Prism version 9, San Diego, CA, USA).
2.6. Ethics
This project was approved by the New Zealand Health and Disability Ethics Committee (MEC/12/02/019). Informed consent was signed by patients or by their guardian if the patient was below the age of 16 years.
3. Results
3.1. Background Characteristics
A total of 65 children were enrolled: 20 (31%) were within one month of diagnosis (Table 1). A total of 70% of the patients were male and almost two-thirds (65%) were receiving at least one medical therapy at enrolment. The median PCDAI score for the group was 10 (IQR = 5–23, n = 65). Based upon PCDAI scores, most patients were in remission (40%) or had mild disease (43%) at enrolment. In addition, the median ModPCDAI score was 0 (IQR = 0–5, n = 35).

Table 1.
Baseline characteristics of 65 children with Crohn’s disease (CD).
3.2. Fecal Biomarker Levels
CHI3L1 was measured in all 65 samples. Due to insufficient sample volume, fewer samples were available for analysis of FC (n = 58), S100A12 (n = 63) and OPG (n = 63).
Fecal biomarker levels did not vary according to sex or age at enrolment (Table 2). Children in clinical remission (PCDAI < 10 points) had significantly lower levels of FC (277 vs. 1648 µg/g; p = 0.012) and CHI3L1 (23 vs. 227 ng/g; p = 0.013) compared to patients with clinically active disease. S100A12 (13 vs. 58 µg/g, p = 0.164) and OPG (63 vs. 81 pg/mL, p = 0.288) did not differ between the children in remission and those with active disease.
Table 2.
Levels of fecal biomarkers in children with Crohn’s disease.
When assessed according to the level of disease severity (remission, mild, moderate or severe), FC levels were elevated only in those with severe disease compared to those in remission (Figure 1). Fecal CHI3L1 levels were higher in those with moderate or severe disease compared to the group in remission. In contrast, OPG and S100A12 levels did not differentiate between grade of disease severity.
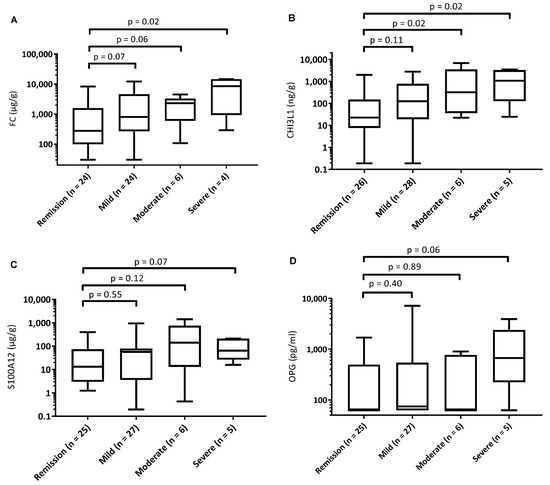
Figure 1.
Boxplots showing biomarker levels for patients with Crohn’s disease according to clinical disease severity group. (A): fecal calprotectin, (B): fecal chitinase 3-like-1 protein, (C): fecal S100A12, (D): fecal osteoprotegerin. PCDAI remission: <10, mild: 10–27.5, moderate: 27.5–37.5, severe: 37.5–100.
Overall, the patients with isolated ileal (L1) CD had lower fecal biomarker levels than patients with any colonic involvement (L2 and L3 together) (Table 2). In addition, CHI3L1 and S100A12 (but not FC and OPG) levels differed between the L1 and L2 subgroups (Figure 2). Upon evaluating the subgroup with isolated ileal location (L1), the children in remission had lower FC levels than those with active disease (81 vs. 475 µg/g, p = 0.014). However, CHI3L1, S100A12 and OPG levels did not differ between these two subgroups (Table 2), although the small sample sizes limit the power for these comparisons.
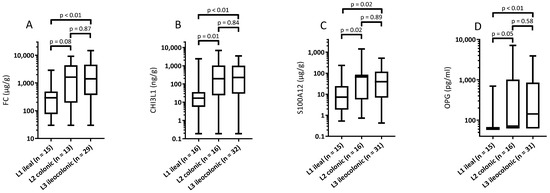
Figure 2.
Fecal biomarker levels according to disease location in children with Crohn’s disease. Box plot with median, minimum, maximum 25th and 75th percentiles for levels of (A) calprotectin; (B) chitinase 3-like-1; (C) S100A12; and (D) osteoprotegerin.
3.3. Correlations between Fecal Biomarkers and Other Markers
There were weak to strong correlations between the individual fecal biomarkers (Table 3). The strongest correlation was between FC and CHI3L1 and the weakest correlation was between OPG and S100A12.
Table 3.
Spearman’s rank correlation coefficients in children with Crohn’s disease.
Overall, the fecal biomarkers correlated poorly with serum markers. CHI3L1 correlated with ESR, platelets and CRP values, while FC and OPG correlated only with ESR and platelet count. Albumin and HCT values did not correlate with any fecal marker. Only FC and CHI3L1 showed weak correlations with both the PCDAI and the modPCDAI scores. S100A12 levels correlated poorly with the modPCDAI but not with the PCDAI. Only FC (r = 0.57) and OPG (r = 0.48) showed a correlation with the SES-CD scores in the 20 children who had undergone ileocolonoscopy in the preceding month (Table 3).
4. Discussion
The current study is the first to assess and compare the utility of four fecal biomarkers, namely FC, CHI3L1, S100A12 and OPG, in a cohort of children with CD. FC and CHI3L1 were higher in patients with clinically active disease than in those in clinical remission. Each of the four biomarkers appeared to be lower in the subset with isolated ileal disease compared to those with any colonic involvement. Within the children with isolated ileal disease, only FC levels differed according to disease activity. FC and OPG correlated with endoscopic severity in the subgroup who had a concurrent ileocolonoscopy.
Assessing disease activity in children with CD is crucial in guiding treatment, assessing response to an intervention, monitoring for maintenance of remission and predicting disease course. Valid and reliable markers are especially important in establishing if an intervention has enabled the achievement of therapeutic targets, including mucosal healing [30]. The results from the current study indicate that fecal biomarkers can provide a reliable indication of current disease activity, when compared to clinical disease activity scores and serum markers. Interestingly, in this regard the levels of FC, CHI3L1 and S100A12 correlated more strongly with the modPCDAI scores than PCDAI scores, reflecting the restricted focus of this index upon just serum markers of inflammation [29].
The four fecal biomarkers showed weak-to-good correlation with each other. Although expressed by different cell types, FC and CHI3L1 showed the strongest correlation, which was numerically higher than reported in one previous study involving children with IBD [22,31,32].
Previous studies have shown contradictory results about the value of fecal biomarker levels in ileal CD without colonic involvement [7,11,12]. In the current study, fecal biomarker levels were lower in the children with isolated ileal CD compared to those with colonic or ileocolonic disease regardless of disease activity. Further, only FC levels were different between patients with quiescent or active isolated ileal disease. Together these findings suggest that only FC might be useful for ileal CD. This may not reflect the location specifically: rather, it may reflect the product of severity and disease extent.
The current study did not demonstrate any clear relationship between age and fecal biomarker levels for any of the four markers of interest. Some previous reports have shown variable and generally higher levels of FC in preschool children [10,33,34,35]. S100A12 has previously appeared to be less affected by age than FC [14]. In contrast, OPG and CHI3L1 have not yet been assessed in younger children.
The results arising from the current report indicated that fecal CHI3L1 measurement provided a useful assessment of disease activity in the group of children with CD. This 40 kDA protein (also known as YKL40), that binds chitin without any catalytic activity, is elevated in serum and airways secretions in individuals with cystic fibrosis (CF) [36]. A recent report also indicated elevated levels of fecal CHI3L1 in children with CF [37]. In that report, which included children from New Zealand and Australia, the levels in the children with CF were lower than the levels seen in the children in the current study, but greater than the levels detected in healthy children.
Vind et al. [38] also showed elevated levels of serum CHI3L1 in individuals with UC and CD compared to control subjects. Serum levels differentiated disease activity only in the subjects with UC in that study. Subsequently, two studies have evaluated fecal levels of CHI3L1 in the setting of IBD. Both these reports demonstrated a significant relationship between levels of the protein and endoscopic disease activity [31,39]. In addition to a correlation between endoscopic severity in the group with CD, Buisson et al. [39] showed that fecal CHI3L1 values also correlated with CD activity index scores, CRP results and FC in 54 adults with CD. Furthermore, Aomatsu et al. [31] demonstrated a relationship between fecal CHI3L1 levels and the SES-CD and PCDAI scores, CRP levels and ESR results in 87 children with CD.
In contrast, the current study did not find any association between CHI3L1 and endoscopic severity for those patients who underwent ileocolonoscopy corresponding with the fecal stool sample. However, the correlation with CHI3L1 and clinical disease activity was higher than that reported in the earlier study of children with CD [31].
This prospective study enabled the collection of stool samples from 65 children with well-defined CD. Furthermore, clinical assessments and standard inflammatory markers were recorded to match the time of stool-sample collections. However, endoscopic scores were not available for the entire cohort and no histologic scores were available. Furthermore, disease location was defined as location at diagnosis, which may not reflect subsequent disease extension. Although the total cohort included 65 children, subgroup analyses were limited due to smaller sizes.
5. Conclusions
In conclusion, the current study has demonstrated a correlation between specific fecal biomarkers and disease activity in children with CD, with fecal biomarker levels appearing lower in children with isolated ileal disease. Overall, FC performed well in these analyses: FC differentiated disease activity in patients with isolated ileal disease, correlated with endoscopic severity and correlated with clinical disease activity. Interestingly, CHI3L1, a less-studied biomarker of disease activity in CD, correlated highly with FC and showed correlation with clinical disease activity. While further prospective studies with larger cohorts of patients should focus further on the utility of CHI3L1 in comparison to other markers and on the additive value of biomarker combinations, at present the results arising do not yet support the use of CHI3L1, S100A12 or OPG instead of FC in clinical practice.
Author Contributions
Conceptualization, A.S.D. and R.B.G.; methodology, A.S.D., L.A., R.B.G., S.T.L. and D.A.L.; formal analysis, A.G.V., L.A., C.M.F. and A.S.D.; investigation, A.G.V., L.A., F.A.E.d.V. and A.M.P.v.T.; resources, A.S.D. and R.B.G.; data curation, A.G.V., L.A., F.A.E.d.V. and A.M.P.v.T.; writing—original draft preparation, A.G.V., L.A. and A.S.D.; writing—review and editing, all authors; supervision, A.S.D., R.B.G. and L.A.; project administration, A.S.D.; funding acquisition, A.S.D. All authors have read and agreed to the published version of the manuscript.
Funding
This research was funded by Cure Kids grant number 3535. The APC was funded by editorial invitation.
Institutional Review Board Statement
The study was conducted in accordance with the Declaration of Helsinki, and approved by the New Zealand Health and Disability Ethics Committee (MEC/12/02/019).
Informed Consent Statement
Written informed consent was obtained from all subjects included in the study.
Data Availability Statement
Further data available from the authors on request.
Acknowledgments
We thank the patients and their caregivers for their participation in this study.
Conflicts of Interest
A.G.V., L.A., CF, AP and SL have no declarations of interest. RG has served on advisory boards for Janssen, AbbVie and Zespri (All unrelated to this manuscript). FV has received speaker and/or honoraria fees from AbbVie and Janssen (all unrelated to this manuscript). D.A.L. has received speaker and/or honoraria fees and served on advisory boards for Janssen, Abbvie and Nestle (all unrelated to this manuscript). A.S.D. has served on advisory boards for Janssen, Abbvie and Nestle (all unrelated to this manuscript).
References
- Day, A.S.; Ledder, O.; Leach, S.T.; Lemberg, D.A. Crohn’s and colitis in children and adolescents. World J. Gastroenterol. 2012, 18, 5862–5869. [Google Scholar] [CrossRef] [PubMed]
- Selvakumar, D.; Evans, D.; Coyte, K.Z.; McLaughlin, J.; Brass, A.; Hancock, L.; Cruickshank, S. Understanding the development and function of the gut microbiota in health and inflammation. Frontline Gastroenterol. 2022, 13, e13–e21. [Google Scholar] [CrossRef] [PubMed]
- IBD Working Group of the European Society for Paediatric Gastroenterology Hepatology and Nutrition. Inflammatory bowel disease in children and adolescents: Recommendations for diagnosis—The Porto criteria. J. Pediatr. Gastroenterol. Nutr. 2005, 41, 1–7. [Google Scholar] [CrossRef] [PubMed]
- Annese, V.; Daperno, M.; Rutter, M.D.; Amiot, A.; Bossuyt, P.; East, J.; Ferrante, M.; Götz, M.; Katsanos, K.H.; Kießlich, R.; et al. European evidence based consensus for endoscopy in inflammatory bowel disease. J. Crohn’s Colitis 2013, 7, 982–1018. [Google Scholar] [CrossRef]
- Day, A.S.; Leach, S.T.; Lemberg, D.A. An update on diagnostic and prognostic biomarkers in inflammatory bowel disease. Expert Rev. Mol. Diagn. 2017, 17, 835–843. [Google Scholar] [CrossRef]
- Musci, J.O.; Cornish, J.S.; Dabritz, J. Utility of surrogate markers for the prediction of relapses in inflammatory bowel diseases. J. Gastroenterol. 2016, 51, 531–547. [Google Scholar] [CrossRef]
- D’haens, G.; Ferrante, M.; Vermeire, S.; Baert, F.; Noman, M.; Moortgat, L.; Geens, P.; Iwens, D.; Aerden, I.; Van Assche, G.; et al. Fecal calprotectin is a surrogate marker for endoscopic lesions in inflammatory bowel disease. Inflamm. Bowel Dis. 2012, 18, 2218–2224. [Google Scholar] [CrossRef]
- Mao, R.; Xiao, Y.L.; Gao, X.; Chen, B.-L.; He, Y.; Yang, L.; Hu, P.-J.; Chen, M.-H. Fecal calprotectin in predicting relapse of in-flammatory bowel diseases: A meta-analysis of prospective studies. Inflamm. Bowel Dis. 2012, 18, 1894–1899. [Google Scholar] [CrossRef]
- Sherwood, R.; Walsham, N. Fecal calprotectin in inflammatory bowel disease. Clin. Exp. Gastroenterol. 2016, 9, 21–29. [Google Scholar] [CrossRef]
- Rugtveit, J.; Fagerhol, M.K. Age-Dependent Variations in Fecal Calprotectin Concentrations in Children. J. Pediatr. Gastroenterol. Nutr. 2002, 34, 323. [Google Scholar] [CrossRef]
- Jensen, M.D.; Kjeldsen, J.; Nathan, T. Fecal calprotectin is equally sensitive in Crohn’s disease affecting the small bowel and colon. Scand. J. Gastroenterol. 2011, 46, 694–700. [Google Scholar] [CrossRef] [PubMed]
- Sipponen, T.; Savilahti, E.; Kolho, K.L.; Nuutinen, H.; Turunen, U.; Färkkilä, M. Crohn’s disease activity assessed by fecal calprotectin and lactoferrin: Correlation with Crohn’s disease activity index and endoscopic findings. Inflamm. Bowel Dis. 2008, 14, 40–46. [Google Scholar] [CrossRef] [PubMed]
- Sidler, M.A.; Leach, S.T.; Day, A.S. Fecal S100A12 and fecal calprotectin as noninvasive markers for inflammatory bowel disease in children. Inflamm. Bowel Dis. 2008, 14, 359–366. [Google Scholar] [CrossRef] [PubMed]
- Day, A.S.; Ehn, M.; Gearry, R.B.; Lemberg, D.A.; Leach, S.T. Fecal S100A12 in Healthy Infants and Children. Dis. Markers 2013, 35, 295–299. [Google Scholar] [CrossRef] [PubMed]
- Kaiser, T.; Langhorst, J.; Wittkowski, H.; Becker, K.; Friedrich, A.W.; Rueffer, A.; Dobos, G.J.; Roth, J.; Foell, D. Faecal S100A12 as a non-invasive marker distinguishing inflammatory bowel disease from irritable bowel syndrome. Gut 2007, 56, 1706–1713. [Google Scholar] [CrossRef]
- Däbritz, J.; Langhorst, J.; Lügering, A.; Heidemann, J.; Mohr, M.; Wittkowski, H.; Krummenerl, T.; Foell, D. Improving Relapse Prediction in Inflammatory Bowel Disease by Neutrophil-Derived S100A12. Inflamm. Bowel Dis. 2013, 19, 1130–1138. [Google Scholar] [CrossRef] [PubMed]
- Karl, J.; Wild, N.; Tacke, M.; Andres, H.; Garczarek, U.; Rollinger, W.; Zolg, W. Improved Diagnosis of Colorectal Cancer Using a Combination of Fecal Occult Blood and Novel Fecal Protein Markers. Clin. Gastroenterol. Hepatol. 2008, 6, 1122–1128. [Google Scholar] [CrossRef] [PubMed]
- De Voogd, F.A.E.; Gearry, R.B.; Mulder, C.J.; Day, A.S. Osteoprotegerin: A novel biomarker for inflammatory bowel disease and gastrointestinal carcinoma. J. Gastroenterol. Hepatol. 2016, 31, 1386–1392. [Google Scholar] [CrossRef]
- Pang, T.; Leach, S.T.; Katz, T.; Day, A.S.; Ooi, C.Y. Fecal Biomarkers of Intestinal Health and Disease in Children. Front. Pediatr. 2014, 2, 6. [Google Scholar] [CrossRef] [PubMed]
- Nahidi, L.; Leach, S.T.; Sidler, M.A.; Levin, A.; Lemberg, D.A.; Day, A.S. Osteoprotegerin in pediatric Crohn’s disease and the effects of exclusive enteral nutrition. Inflamm. Bowel Dis. 2011, 17, 516–523. [Google Scholar] [CrossRef]
- Skinner, A.; Lerer, T.; Wyzga, N.; Viswanathan, A.; Sylvester, F. S1225 Fecal Osteoprotegerin: A Marker for Pediatric Ulcera-tive Colitis At Diagnosis—A Pilot Study. Gastroenterology 2008, 134, A-205. [Google Scholar] [CrossRef]
- Mizoguchi, E. Chitinase 3-Like-1 Exacerbates Intestinal Inflammation by Enhancing Bacterial Adhesion and Invasion in Colonic Epithelial Cells. Gastroenterology 2006, 130, 398–411. [Google Scholar] [CrossRef] [PubMed]
- Eurich, K.; Segawa, M.; Toei-Shimizu, S.; Mizoguchi, E. Potential role of chitinase 3-like-1 in inflammation-associated carcinogenic changes of epithelial cells. World J. Gastroenterol. 2009, 15, 5249–5259. [Google Scholar] [CrossRef] [PubMed]
- Levine, A.; Koletzko, S.; Turner, D.; Escher, J.C.; Cucchiara, S.; de Ridder, L.; Kolho, K.-L.; Veres, G.; Russell, R.K.; Paerregaard, A.; et al. The ESPGHAN Revised Porto Criteria for the Diagnosis of Inflammatory Bowel Disease in Children and Adolescents. J. Pediatr. Gastroenterol. Nutr. 2014, 58, 795–806. [Google Scholar] [CrossRef] [PubMed]
- Daperno, M.; D’Haens, G.; Van Assche, G.; Baert, F.; Bulois, P.; Maunoury, V.; Sostegni, R.; Rocca, R.; Pera, A.; Gevers, A.; et al. Development and validation of a new, simplified endoscopic activity score for Crohn’s disease: The SES-CD. Gastrointest. Endosc. 2004, 60, 505–512. [Google Scholar] [CrossRef]
- Hyams, J.S.; Ferry, G.D.; Mandel, F.S.; Gryboski, J.D.; Kibort, P.M.; Kirschner, B.S.; Griffiths, A.M.; Katz, A.J.; Grand, R.J.; Boyle, J.T.; et al. Development and validation of a pediatric Crohn’s disease activity index. J. Pediatr. Gastroenterol. Nutr. 1991, 12, 439–447. [Google Scholar] [CrossRef] [PubMed]
- Turner, D.; Griffiths, A.M.; Walters, T.D.; Seah, T.; Markowitz, J.; Pfefferkorn, M.; Keljo, D.; Otley, A.; LeLeiko, N.S.; Mack, D.; et al. Appraisal of the pediatric Crohn’s disease activity index on four prospectively collected datasets: Recommended cutoff values and clinimetric properties. Am. J. Gastroenterol. 2010, 105, 2085–2092. [Google Scholar] [CrossRef]
- Turner, D.; Griffiths, A.M.; Walters, T.D.; Seah, T.; Markowitz, J.; Pfefferkorn, M.; Keljo, D.; Waxman, J.; Otley, A.; LeLeiko, N.S.; et al. Mathematical weighting of the pediatric Crohn’s disease activity index (PCDAI) and comparison with its other short versions. Inflamm. Bowel Dis. 2012, 18, 55–62. [Google Scholar] [CrossRef]
- Leach, S.; Nahidi, L.; Tilakaratne, S.; Day, A.S.; Lemberg, D. Development and Assessment of a Modified Pediatric Crohn Disease Activity Index. J. Pediatr. Gastroenterol. Nutr. 2010, 51, 232–236. [Google Scholar] [CrossRef]
- Turner, D.; Ricciuto, A.; Lewis, A.; D’Amico, F.; Dhaliwal, J.; Griffiths, A.M.; Bettenworth, D.; Sandborn, W.J.; Sands, B.E.; Reinisch, W.; et al. STRIDE-II: An Update on the Selecting Therapeutic Targets in Inflammatory Bowel Disease (STRIDE) Initiative of the International Organization for the Study of IBD (IOIBD): Determining Therapeutic Goals for Treat-to-Target strategies in IBD. Gastroenterology 2021, 160, 1570–1583. [Google Scholar] [CrossRef]
- Aomatsu, T.; Imaeda, H.; Matsumoto, K.; Kimura, E.; Yoden, A.; Tamai, H.; Fujiyama, Y.; Mizoguchi, E.; Andoh, A. Faecal chitinase 3-like-1: A novel biomarker of disease activity in paediatric inflammatory bowel disease. Aliment. Pharmacol. Ther. 2011, 34, 941–948. [Google Scholar] [CrossRef]
- Lopez, R.N.; Leach, S.T.; Lemberg, D.A.; Duvoisin, G.; Gearry, R.B.; Day, A.S. Fecal biomarkers in inflammatory bowel disease. J. Gastroenterol. Hepatol. 2017, 32, 577–582. [Google Scholar] [CrossRef] [PubMed]
- Şahin, B.S.G.; Keskindemirci, G.; Özden, T.A.; Durmaz, Ö.; Gökçay, G. Faecal calprotectin levels during the first year of life in healthy children. J. Paediatr. Child Health 2020, 56, 1806–1811. [Google Scholar] [CrossRef] [PubMed]
- Hestvik, E.; Tumwine, J.K.; Tylleskär, T.; Grahnquist, L.; Ndeezi, G.; Kaddu-Mulindwa, D.H.; Aksnes, L.; Olafsdottir, E. Faecal calprotectin concentrations in apparently healthy children aged 0–12 years in urban Kampala, Uganda: A community-based survey. BMC Pediatr. 2011, 11, 9. [Google Scholar] [CrossRef] [PubMed]
- Soto-Méndez, M.-J.; Romero-Abal, M.-E.; Schümann, K.; Gil, Á.; Solomons, N.W. Normative Fecal Calprotectin Concentrations in Guatemalan Preschoolers Are High Relative to Children Reported Elsewhere. J. Pediatr. Gastroenterol. Nutr. 2017, 64, 238–244. [Google Scholar] [CrossRef] [PubMed]
- Leonardi, S.; Parisi, G.F.; Capizzi, A.; Manti, S.; Cuppari, C.; Scuderi, M.G.; Rotolo, N.; Lanzafame, A.; Musumeci, M.; Salpietro, C. YKL-40 as marker of severe lung disease in cystic fibrosis patients. J. Cyst. Fibros. 2016, 15, 583–586. [Google Scholar] [CrossRef][Green Version]
- Permain, J.; Appleton, L.; Ho, S.S.C.; Coffey, M.; Ooi, C.Y.; Keenan, J.I.; Day, A.S. Children With Cystic Fibrosis Have Elevated Levels of Fecal Chitinase-3-like-1. J. Pediatr. Gastroenterol. Nutr. 2022, 75, 48–51. [Google Scholar] [CrossRef]
- Vind, I.; Johansen, J.; Price, P.; Munkholm, P. Serum YKL-40, a potential new marker of disease activity in patients with inflammatory bowel disease. Scan. J. Gastroenterol. 2003, 38, 599–605. [Google Scholar]
- Buisson, A.; Vazeille, E.; Minet-Quinard, R.; Goutte, M.; Bouvier, D.; Goutorbe, F.; Pereira, B.; Barnich, N.; Bommelaer, G. Faecal chitinase 3-like 1 is a reliable marker as accurate as faecal calprotectin in detecting endoscopic activity in adult patients with inflammatory bowel diseases. Aliment. Pharmacol. Ther. 2016, 43, 1069–1079. [Google Scholar] [CrossRef]
Publisher’s Note: MDPI stays neutral with regard to jurisdictional claims in published maps and institutional affiliations. |
© 2022 by the authors. Licensee MDPI, Basel, Switzerland. This article is an open access article distributed under the terms and conditions of the Creative Commons Attribution (CC BY) license (https://creativecommons.org/licenses/by/4.0/).