
Article

Effect of Laser Scan Speed on the Tribocorrosion Behavior of Laser Engineered Net Shaping (LENS)-Manufactured Stainless Steel 316L in a Simulated Physiological Solution

by
Deeparekha Narayanan
1,†,
Maha Messaadi Ben Said
2,†,
Fadlallah Abouhadid
2,
Myriam Dumont
2,
Ibrahim Karaman
1 and
Homero Castaneda
1,*
1
Department of Materials Science and Engineering, Texas A&M University, College Station, TX 77843, USA
2
MSMP-EA7350, Arts et Métiers Paris Tech, 8 Bd de Louis XIV, 59000 Lille, France
*
Author to whom correspondence should be addressed.
These authors contributed equally to this work.
Corros. Mater. Degrad. 2026, 7(2), 30; https://doi.org/10.3390/cmd7020030
Submission received: 8 March 2026 / Revised: 4 May 2026 / Accepted: 8 May 2026 / Published: 13 May 2026

Abstract

This study evaluated the influence of scan rate (4.23 mm/s [S10] and 6.35 mm/s [S15]) on the localized corrosion and tribocorrosion behavior of a laser engineered net shaping (LENS)-produced stainless steel 316L (SS316L) in a phosphate-buffered saline (PBS) solution. Electrochemical impedance spectroscopy (EIS) was performed by applying an AC signal from 105 to 10−2 Hz and cyclic potentiodynamic polarization (CPP) was performed by sweeping from −150 mV to +1.5 V (vs. open circuit potential) and back to characterize passivation and pitting susceptibility. Potentiostatic tribocorrosion tests were conducted using a reciprocating tribometer integrated with a potentiostat to probe material response in passive and cathodic regimes. S15 exhibited manufacturing-related defects that served as preferential pit initiation sites, with pits in both S10 and S15 showing evidence of cell-interior dissolution. Electrochemical results indicated that the charge transfer resistance was reduced by 66% for S15 and that the repassivation potential decreased by 35% compared to S10. Under tribocorrosion, material degradation was dominated by mechanical wear for both samples. However, sliding significantly accelerated electrochemical dissolution in S15, with the corrosion rate affected by wear (Vc-w) increasing by 46.8%. Scanning electron microscopy (SEM) and energy dispersive X-ray spectroscopy (EDS) of wear scars revealed plastic deformation, abrasive grooves, and bio-tribofilm formation composed primarily of phosphates. Micro-pits associated with processing defects were observed exclusively in S15. Overall, lower scan rate processing (S10) produced a more defect-resistant microstructure with improved resistance to localized corrosion and tribocorrosion in PBS.

1. Introduction

The emergence of additive manufacturing technologies has facilitated the manufacture of controlled metal microstructures with designed properties [1,2]. Stainless steel 316L (SS316L) is one of the most widely used austenitic stainless steels [3,4]. It is very versatile and has numerous applications including but not limited to structural, chemical and nuclear industries. Due to its biocompatibility, corrosion resistance and relatively low cost compared to Co-Cr-Mo and Ti-based alloys, it also finds widespread use in medical components such as dental implants and orthopedic applications [4,5,6,7,8,9,10]. Its corrosion resistance is mostly attributed to the formation of a compact, protective passive film comprising Cr2O3 reinforced by Ni and Mo [11].
SS316L alloys manufactured via additive manufacturing techniques, such as the direct energy deposition (DED) process, have distinguishable microstructures compared to their wrought counterpart. In DED alloys, microstructures are composed of fine cellular structures of different morphologies whose size and orientation are determined by the printing parameters. This hybrid structure has been found to exhibit enhanced corrosion resistance with increased pitting corrosion resistance [12,13,14,15]. While extensive studies have examined the corrosion and mechanical behavior of AM SS316L in chloride-containing solutions [14,16], significantly fewer investigations have addressed its tribocorrosion behavior, despite its critical importance in biomedical environments where simultaneous mechanical wear and electrochemical degradation occur (e.g., articulating implants). Tribocorrosion has been shown to significantly accelerate degradation in SS316L by destabilizing the passive film and promoting localized corrosion under sliding conditions [17]. J. Stendal et al. [18] investigated the tribocorrosion response of selective laser-melted (SLM) 316L stainless steel in 0.9 wt.% NaCl and simulated body fluid (SBF) containing bovine serum albumin, benchmarking its performance against wrought 316L. Tests were conducted at open circuit potential (OCP) and under passive polarization to decouple mechanical depassivation and electrochemical repassivation behavior. The SLM specimens demonstrated inferior repassivation kinetics relative to the wrought alloy when compared against the rate of passive film removal during sliding. The reduced tribocorrosion resistance was attributed primarily to process-induced porosity and surface heterogeneities inherent to SLM fabrication. Despite this, the total material loss of the SLM alloy was reported to be lower than that of the wrought counterpart under the studied conditions. Y. Bao et al. [19] evaluated DED SS316L in 3.5 wt.% NaCl and reported enhanced tribocorrosion performance compared to forged SS316L, which was attributed to the distinctive microstructural features generated during the DED process that improve resistance to synergistic wear–corrosion degradation.
Despite these advances, the current literature has largely focused on comparisons between additively manufactured and wrought materials or on process–property relationships under isolated corrosion or wear conditions. There remains limited understanding of the coupled influence of process parameter variation on tribocorrosion behavior, particularly in DED systems. M. Rzeszotarska et al. [20] studied the influence of layer thickness as controlled by the powder feed rates on the mechanical and corrosion behavior of LENS SS316L. They found that higher power feed rates led to lower layer thicknesses and higher hardness values. Upon corrosion testing in 0.9 wt% NaCl solution, they found that pitting corrosion resistance decreased with increased powder feed rate. H. Balhara et al. [21] studied the influence of laser power and scan speed on the resulting microstructures formed in LENS SS316L. They found that increasing laser power caused larger ripple curvatures and higher scan speed with differences in heterogeneous structures formed at higher versus lower laser powers. When lower laser powers were combined with higher scan speeds, they observed the presence of voids and defects due to lower overlap between deposited layers. In this context, laser scan rate is a critical parameter, as it directly governs melt pool stability, energy input, defect formation, and microstructural evolution. Variations in scan rate can significantly influence defect density, passive film stability, and mechanical integrity, all of which are expected to affect the synergistic wear–corrosion response. However, the specific role of scan rate in controlling the tribocorrosion performance of LENS SS316L remains insufficiently explored, representing a key knowledge gap.
Furthermore, although tribocorrosion studies are often conducted in chloride-containing electrolytes, there is limited work linking DED processing parameters to tribocorrosion performance in physiologically relevant environments. Phosphate-buffered saline (PBS) is widely used as a controlled electrolyte for the preliminary screening of biomedical alloys due to its reproducible chloride content and near-physiological pH. However, the extent to which process-induced microstructural variations influence tribocorrosion behavior in such environments remains unclear, particularly for DED-fabricated materials. Addressing this gap is essential for evaluating the suitability of additively manufactured SS316L for biomedical implant applications.
In this work, the effect of two different laser scan speeds on the corrosion and tribcorrosion behavior of LENS SS316L samples was evaluated in a simulated physiological environment. The initial microstructures of the samples were characterized using optical microscopy (OM) and scanning electron microscopy (SEM). The passivation and localized corrosion behavior was studied using electrochemical impedance spectroscopy (EIS) and cyclic potentiodynamic polarization (CPP). Potentiostatic tribocorrosion tests were carried out using a ball-on-plane tester in an electrochemical cell suitable for a three-electrode setup equipped with a potentiostat at the cathodic and passive potentials. After localized corrosion and tribocorrosion testing, the pit morphologies and wear tracks were characterized using OM and SEM to identify features that underwent degradation. The combined results were used to propose a mechanistic framework describing bio-tribocorrosion behavior as a function of processing-induced microstructural variation.

2. Materials and Methods

2.1. Material Synthesis and Initial Characterization

The LENS SS316L samples were manufactured using an Optomec MRS printer (Optomec, Albuquerque, NM, USA). The printing parameters were a powder feed rate of 5 rpm, a scan orientation of ±45° and a laser power of 300 W. Two scan speeds, 4.23 mm/s, designated as S10, and 6.35 mm/s, designated as S15, were selected to represent two different thermal regimes and produce variation in the obtained microstructure. The printed 1 cm3 cubic specimens were removed from the substrate using an electric discharge machine (EDM). The edges of the as-printed samples were ground to remove any roughness, cut into samples of 0.5 mm thickness, and then mounted in epoxy resin. The exposed cross-section was 1 cm2 which was then polished using a series of emery papers from 500 to 4000 grit for corrosion and tribology testing. The hardness of the samples was measured using a Vickers hardness tester. For metallographic observations, specimens were further polished with a 9, 3 and 1 μm diamond suspension solution and finished in a 0.04 μm SiO2 solution to ensure a mirror-like finish. They were then etched in an aqua regia (3:1 HCl:HNO3 solution) to reveal microstructural features.

2.2. Electrochemical Tests

A phosphate-buffered saline (PBS) solution often used to simulate physiological conditions was used for testing. The composition was 8 g/L NaCl, 0.2 g/L KCl, 0.594 g/L Na2HPO4 and 0.2 g/L KH2PO4 with the solution pH being 7.4. Electrochemical measurements were conducted using a three-electrode system comprising the LENS SS316L as the working electrode (WE), a 5 cm2 circular platinum mesh spot welded to a 6 cm Pt-Nb rod as the counter electrode (CE) along with a saturated calomel electrode (SCE) reference electrode (RE). The samples were mounted in epoxy with Cu wires serving as electrical connections and polished up to 1200-grit SiC paper. They were then cleaned, dried and immersed in the PBS solution (under ambient, aerated conditions) with the following sequence of experiments performed:
(a)
Open circuit potential (OCP) measurements for 30 min until stable.
(b)
Electrochemical impedance spectroscopy (EIS) from 100,000 Hz to 0.01 Hz at 10 mV AC amplitude and 10 points/decade at OCP using the procedure described in ASTM G106-89 [22].
(c)
Cyclic potentiodynamic polarization (CPP) from −150 mV to +1.5 V (vs. OCP) at a scanning rate of 1 mV/s, with the reverse scan performed back to −150 mV (vs. OCP) using the procedure described in ASTM G61-86 [23].
All experiments were performed twice to ensure reproducibility. The cathodic, passivation and pitting potentials were then identified from these results to be used for the potentiostatic tribocorrosion experiments.

2.3. Potentiostatic Tribocorrosion Tests

Tribocorrosion experiments were conducted using a reciprocating tribometer synchronized with the Solartron 1287 potentiostat/galvanostat (Solartron Analytical, Farnborough, UK) as shown in Figure 1. For the ball-on-plane contact, a ceramic ball (Al2O3) ball of 6 mm diameter was fixed onto a pin with a flat LENS SS316L surface as the plane. A normal load of 1 N was applied providing a Hertzian contact pressure of 450 MPa with a stroke length of 2 mm. The total sliding distance was 20 m for a sliding speed of 12 mm/s. The roughness of the ball and the SS316L surface were evaluated before the tests and were found to be comparable at around Ra = 1.2 ± 0.3 µm.
The SS316L samples were immersed in 30 mL of the electrolyte solution under ambient, aerated conditions and tribocorrosion was tested with the following sequence of potential applications:
(a)
Potential was maintained at OCP for 5 min.
(b)
Potentials for tests were specified according to previously identified regions based on CPP testing:
The cathodic region, where the dissolution of the metal is inhibited and the induced wear is mainly attributed to mechanical loading.
The passive region, where the current is used to dissolve the metal, leading to formation of a passive oxide film. The induced wear is attributed to the synergy between chemical and mechanical competition, providing details on the influence of the generation of the passive film on friction behavior.
The total duration of testing was 1800 s with the coefficient of friction measured along with the current density. All experiments were performed at room temperature and repeated three times for reproducibility.

2.4. Characterization After Testing

After the corrosion tests, the surfaces were cleaned thoroughly and resulting pits were observed using a JEOL JCM 6000Plus (JEOL Ltd., Tokyo, Japan) scanning electron microscope (SEM). After tribocorrosion testing, wear scars induced in the LENS SS316L were analyzed using a Keyence VHX-7000 (Keyence Corporation, Osaka, Japan) digital microscope. In addition to the qualitative evaluation of the surface damage, this equipment was used to estimate the wear scar dimensions, i.e., width and depth from the worn surface, by utilizing its capability to capture images at different planes along the Z-direction to produce a fully focused 3D image. The vertical resolution was adjusted to 0.1 μm. The total wear volume was calculated using software based on interferometry measurements.
A JEOL JCM 6000Plus (JEOL Ltd., Tokyo, Japan) SEM equipped with energy dispersive X-ray spectroscopy (EDS) capabilities was used to map the composition of the tribofilms formed after testing.

3. Results and Discussion

3.1. Microstructure and Mechanical Properties

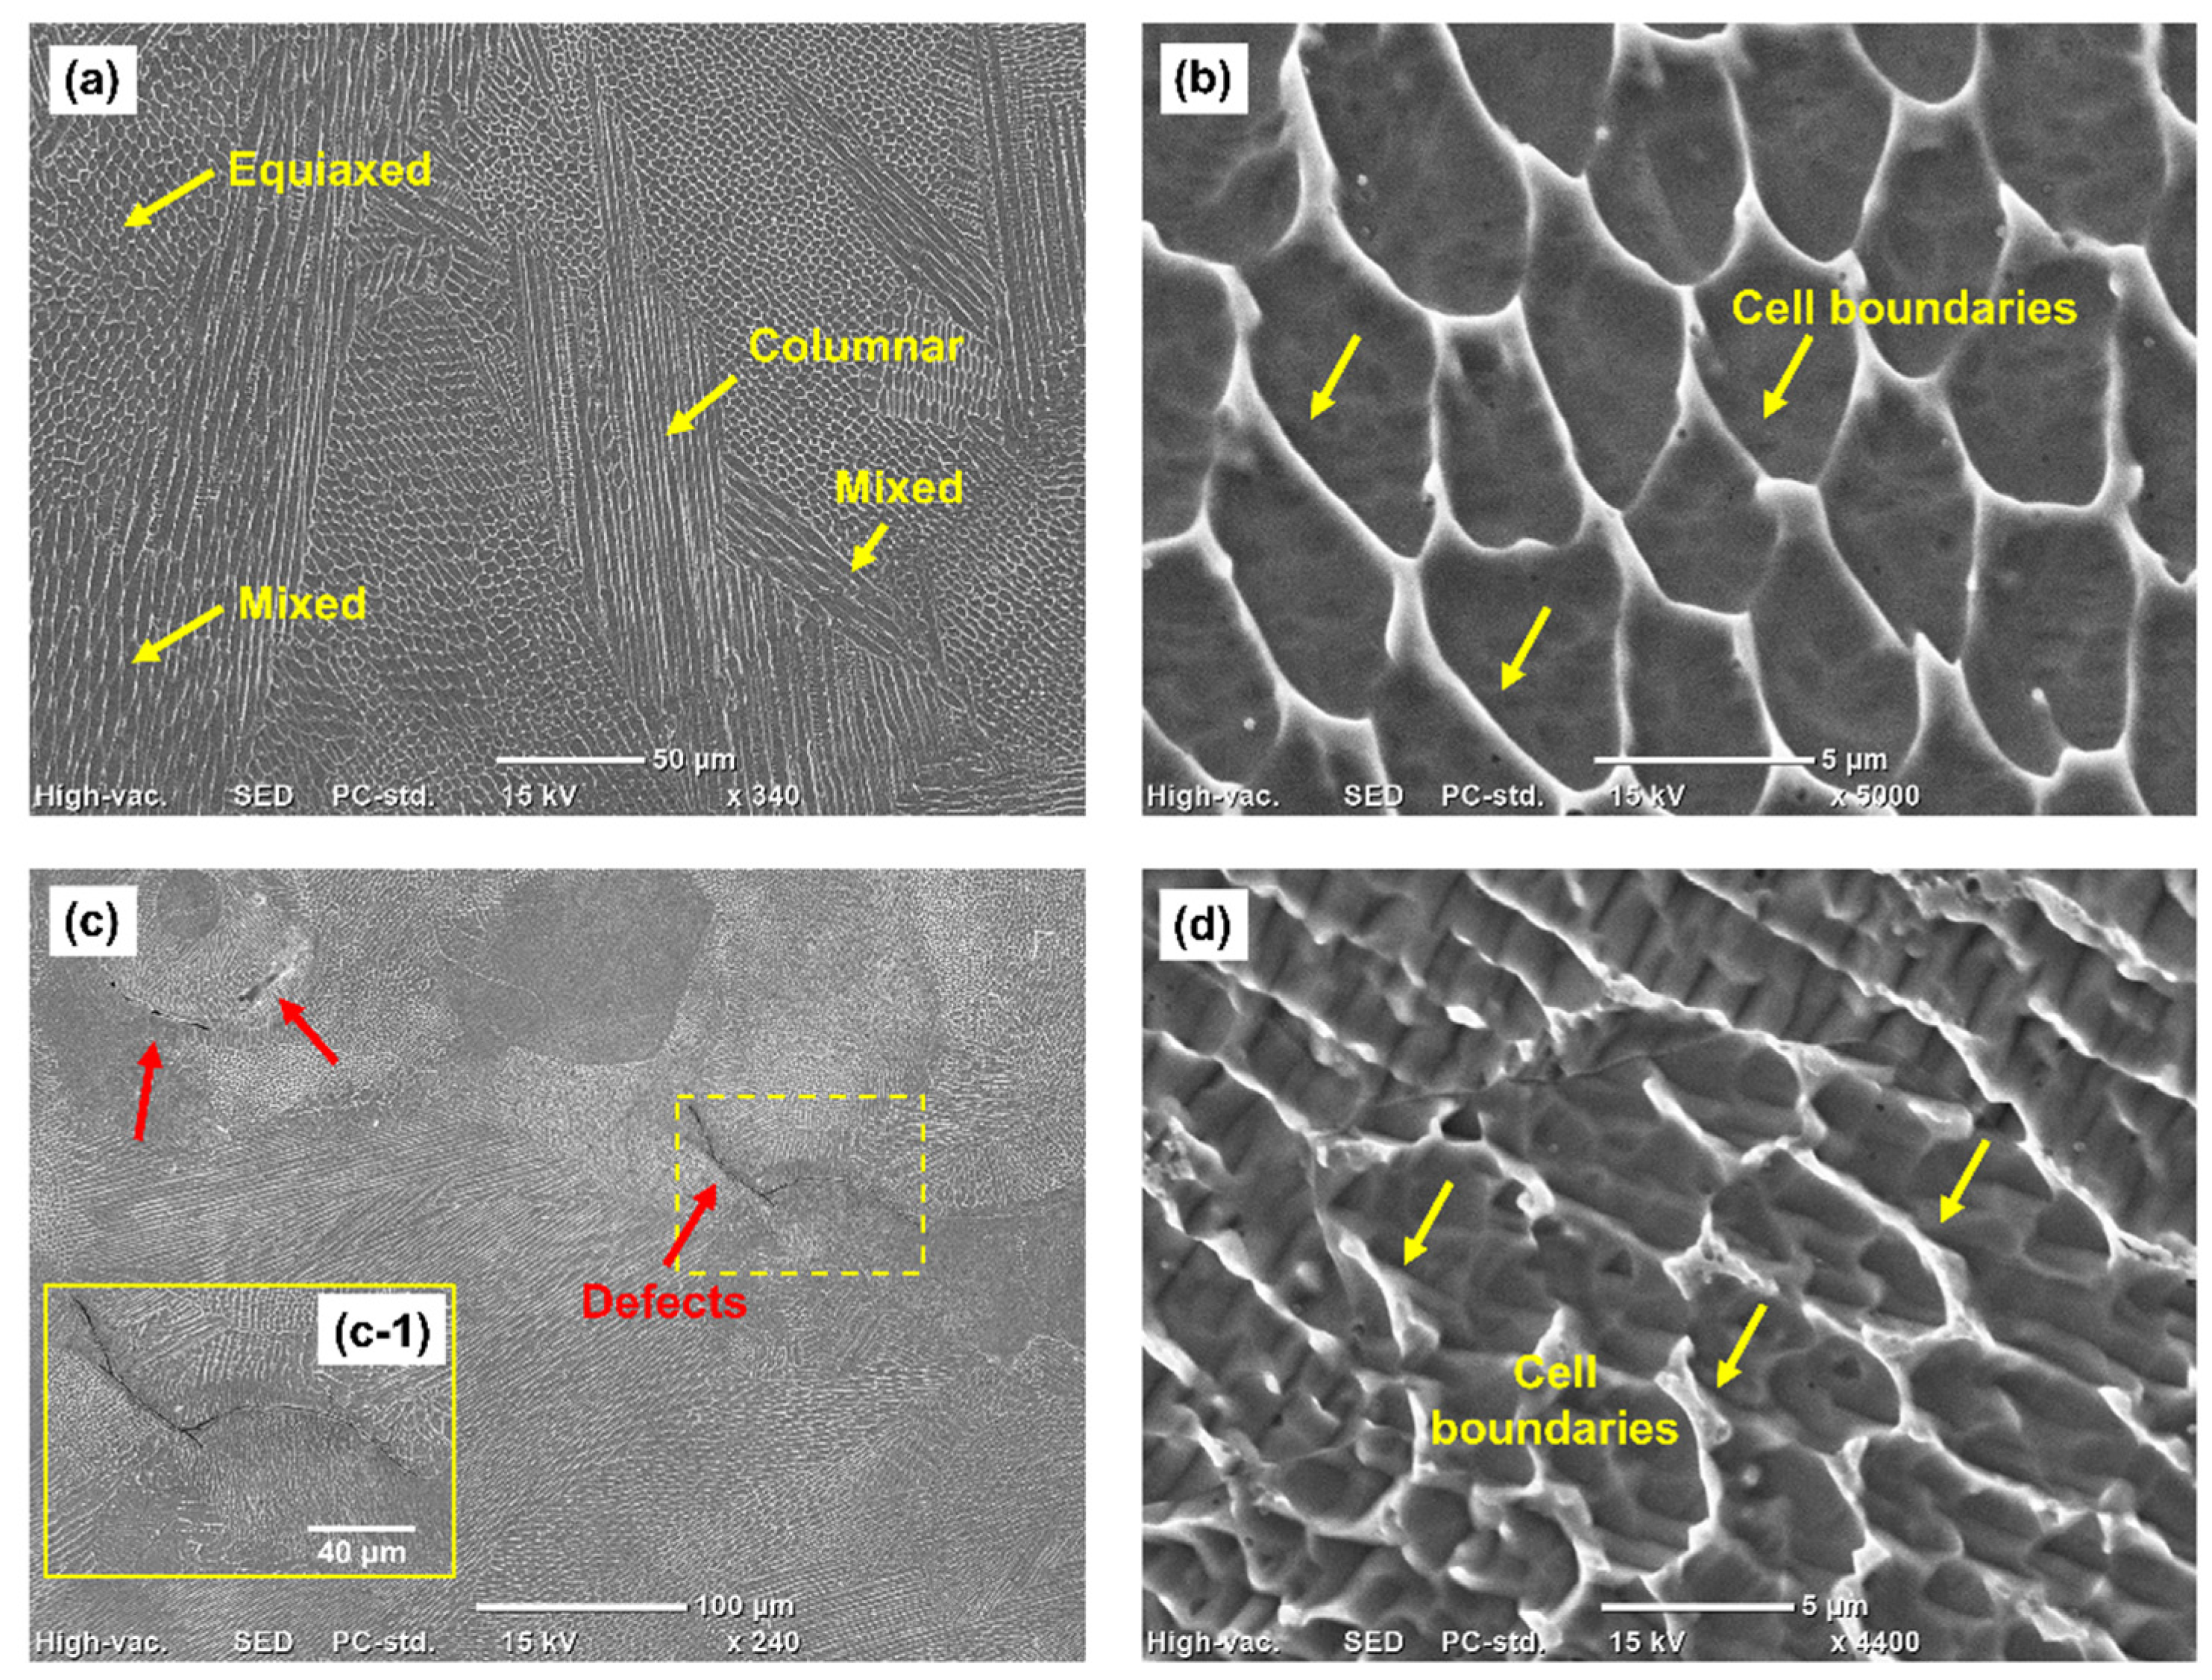
The SEM images of the samples are shown in Figure 2. They showed the formation of ripples and scan track boundaries which are typically observed in LENS-manufactured SS316L [21]. As can be seen from Figure 2a,c, the microstructure comprises various morphologies of cell formations which are typical in additively manufactured materials. The cells were enclosed within cell boundaries. The average cell widths ranged from 2 to 5 μm. As seen in Figure 2b,d, S10 showed more continuous cell boundaries while S15 showed slightly more discontinuous cell boundaries. S15 also showed some defects such as lack of fusion, porosity and unmelted powder particles as shown in Figure 2c and the magnified inset image Figure 2(c-1). Although quantitative porosity analysis was not performed in this study, qualitative metallographic and SEM observations clearly indicate a higher prevalence of lack-of-fusion and keyhole-type defects at higher scan speed conditions. This trend is consistent with the established literature, where increasing scan speed reduces volumetric energy density and promotes incomplete melting, resulting in increased defect formation and reduced densification in SS316L [21,24]. Micro-porosity might still be present in the S10 sample but the presence of such explicit defects was not observed. Macro-hardness measurements indicated that S15 was harder than S10 with measurements of 209 ± 18 Hv10 compared with 187 ± 10 Hv10 respectively. Scan speed controls the speed at which the laser beam scans across the surface and influences the fusion characteristics as well as residual stress and has been found to influence microstructure and hardness in other AM SS316L works as well [25,26].
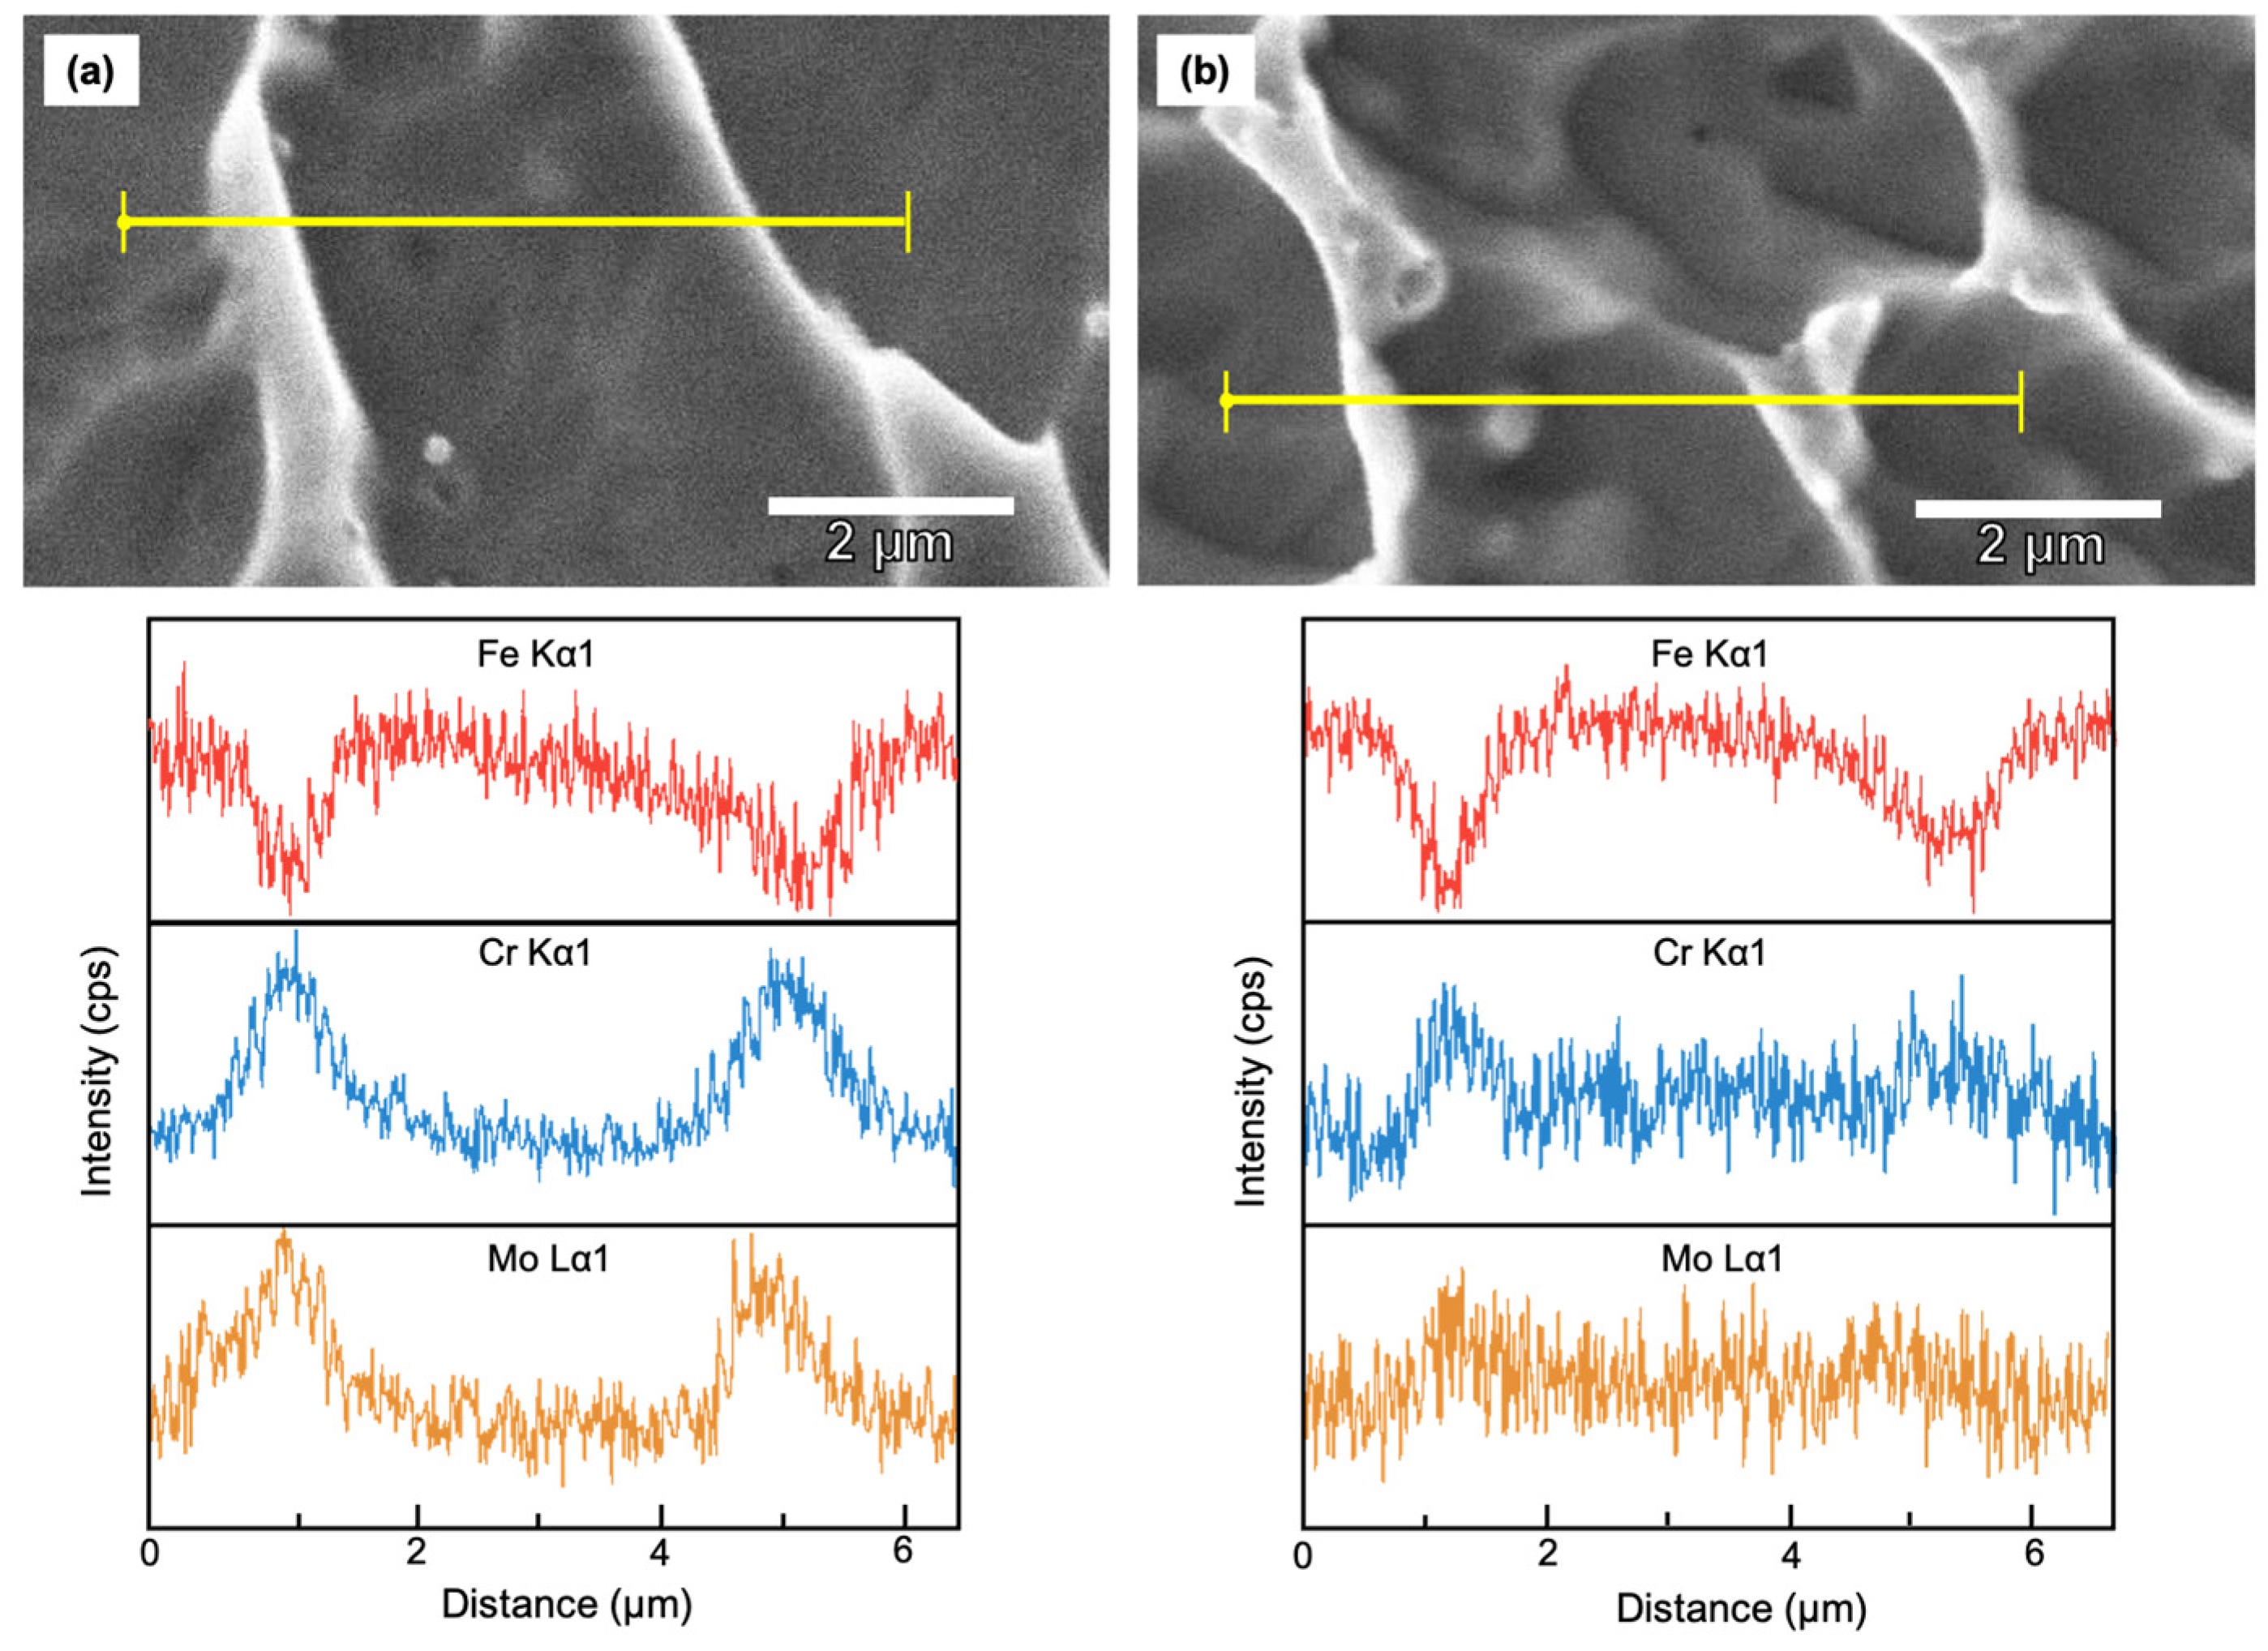
Figure 3 shows the energy dispersive X-ray spectroscopy (EDS) line-scans of Cr, Mo and Fe distribution across the cells and cell boundaries of S10 and S15. It can be seen that there is a slight drop in Fe content and an increase in Mo and Cr at the cell boundaries with a depletion of these elements at the cells. This is generally due to the rejection of solute elements to the cell boundaries from the fast cooling rates occurring during solidification in the LENS process. This has been reported in other works on additively manufactured stainless steel samples as well [14,15,16,27].

3.2. Electrochemical Impedance Spectroscopy (EIS) Results

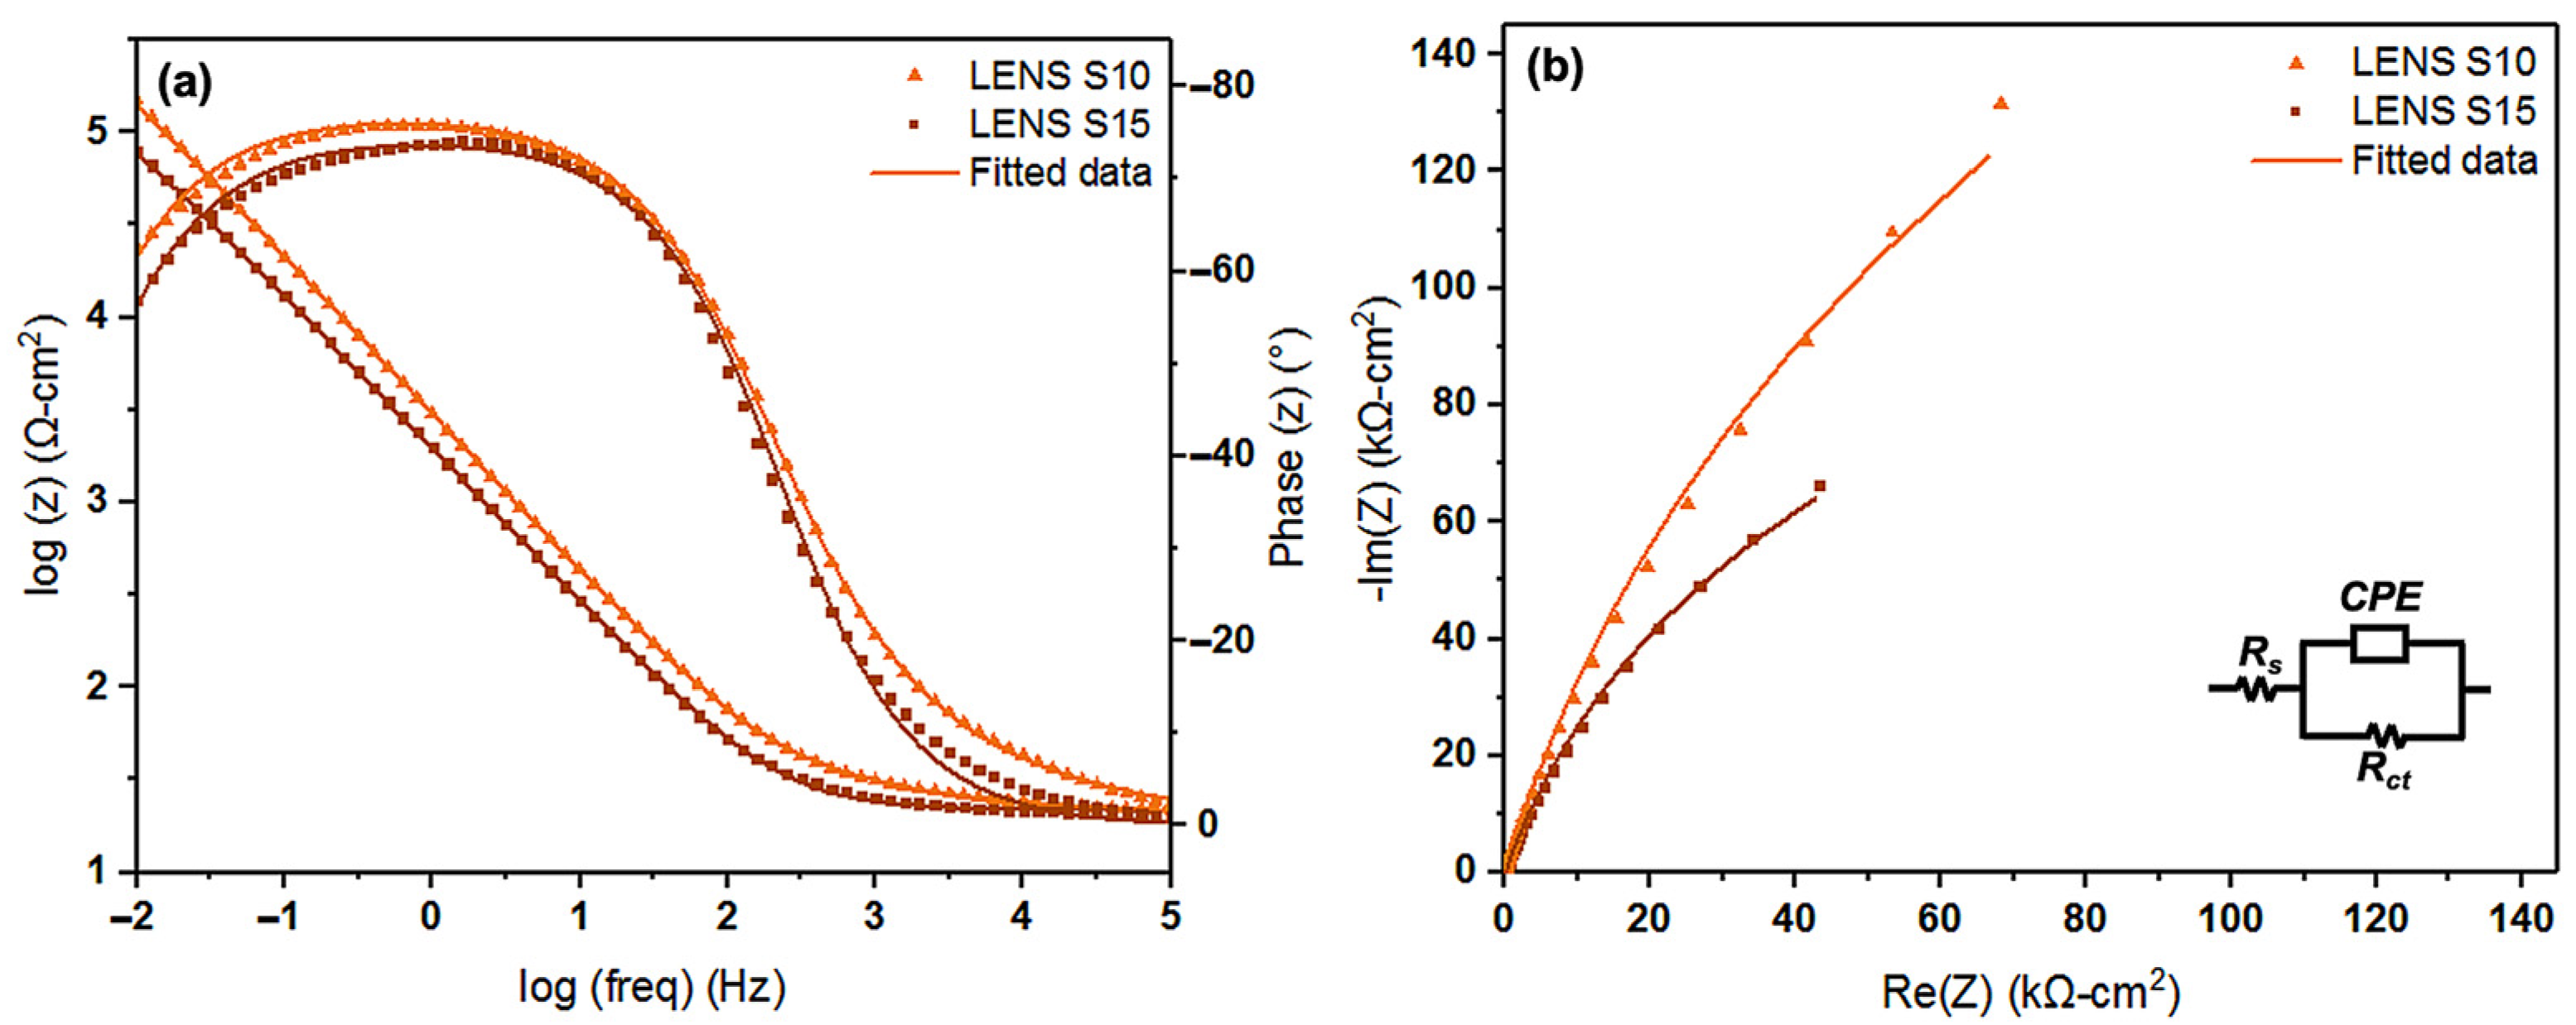
Figure 4 shows the EIS results after 1 h of exposure in the PBS solution for the S10 and S15 samples. From the Bode plot, it can be seen that both the alloys showed a pseudocapacitive film at the interface due to the phase angles being closer to −80° in the medium to low frequency range (100–0.1 Hz). The Nyquist plots showed the presence of semi-circular arcs of large radii which also indicates lower charge transfer or corrosion-related reactions at the interface. The data was fit using a modified Randles circuit (inset of Figure 4b) with a constant phase element (CPE) instead of a pure capacitor with the fitting parameters presented in Table 1. While the charge transfer resistance (Rct) values of S10 and S15 were in the same magnitude, the value reduced by 66% for the latter compared to the former. This could be due to the presence of defects on the surface of S15 which lead to discontinuities in the passive film. These values are slightly lower than those reported for SLM SS316L in the literature which is expected due to the cooling rates in the SLM process producing much finer features [28,29]. However, they are higher than those reported for wrought SS316L which implies higher corrosion resistance. The n values observed were in the range of 0.8–0.9 and are typically associated with stable passive films exhibiting minor heterogeneity. Thus, the electrochemical interface in both conditions can be considered reasonably homogeneous at the macroscopic scale, with only moderate deviation from ideal capacitive behavior.

3.3. Cyclic Potentiodynamic Polarization (CPP) Results

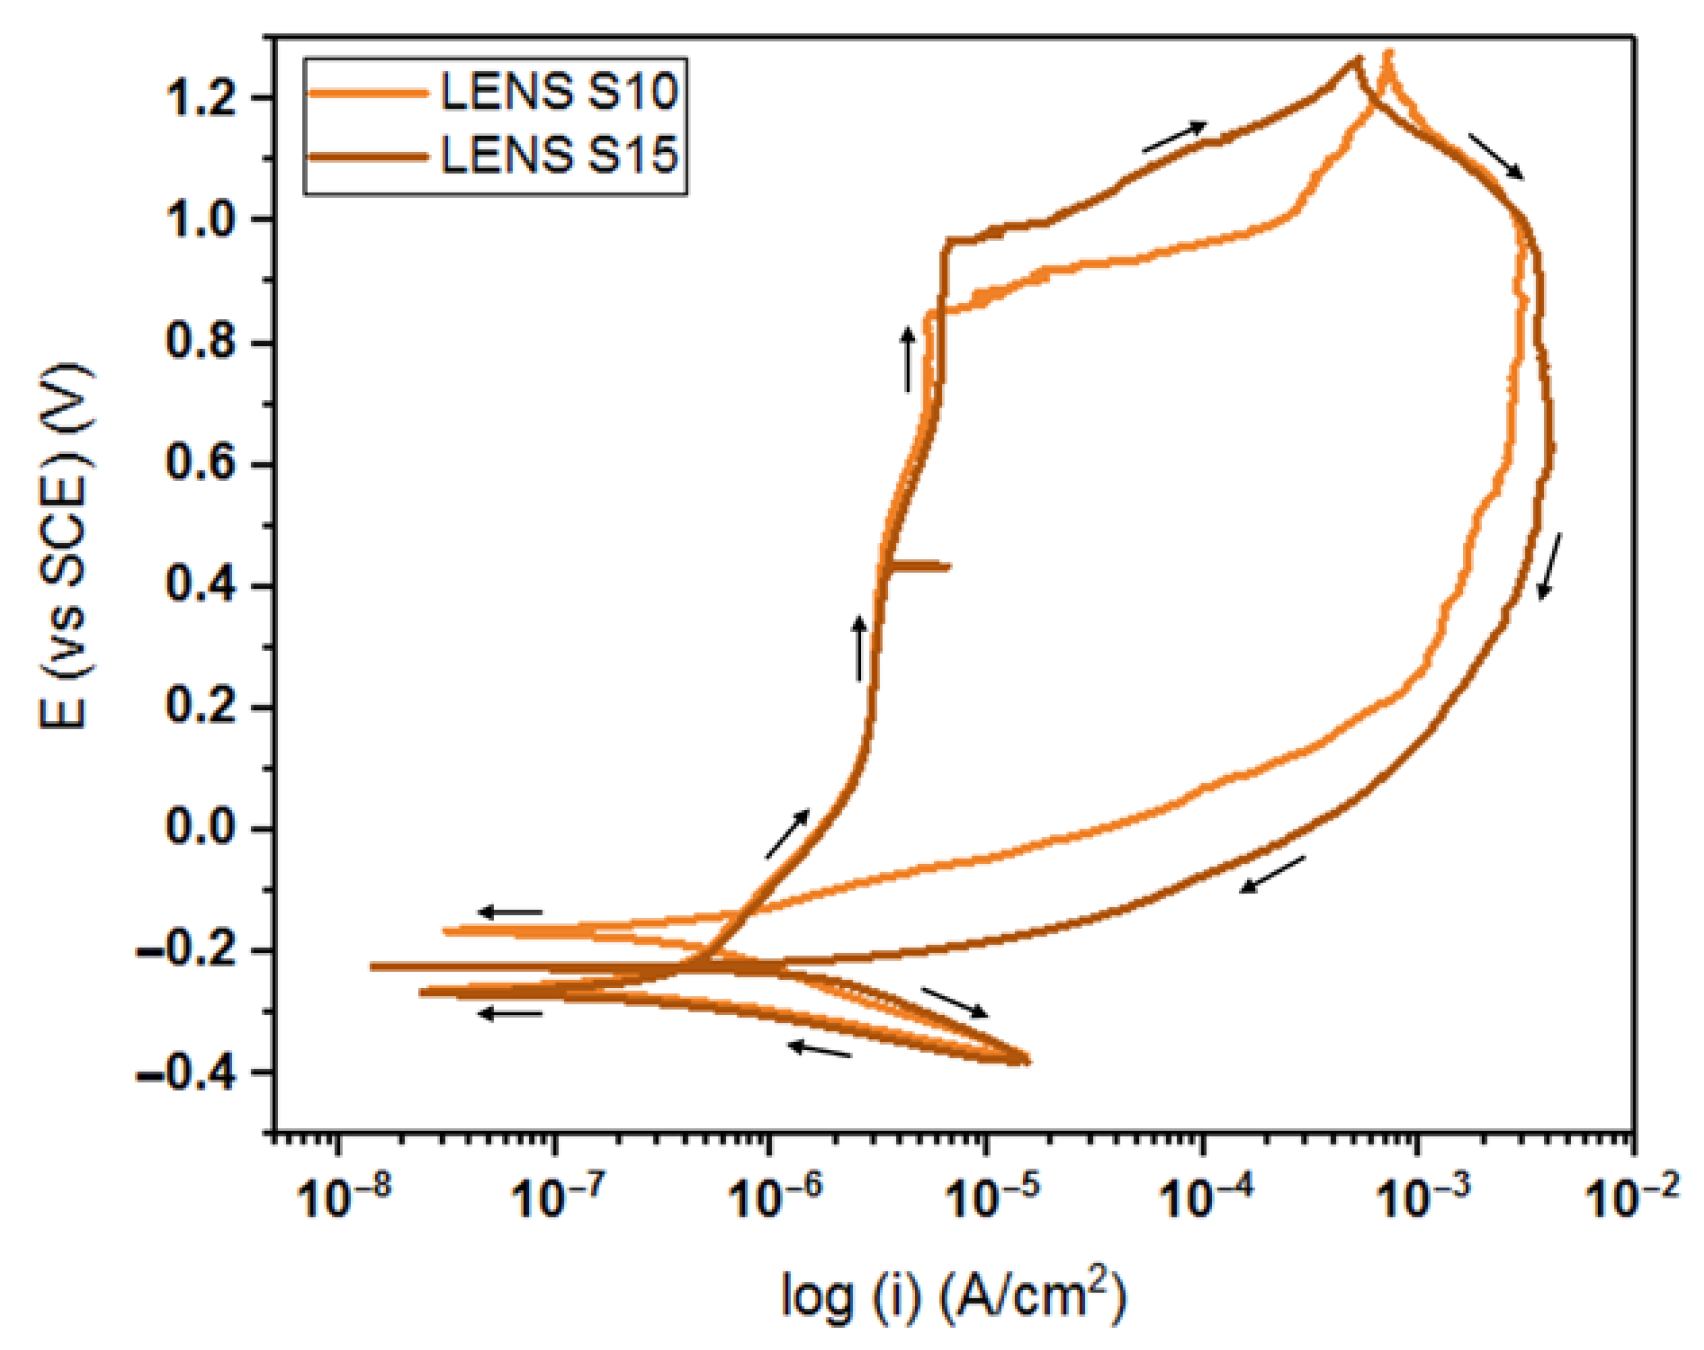
Figure 5 compares the CPP scans for S10 and S15 specimens in the PBS solution. The results show the presence of a wide passive range in both samples with a breakdown in passivity close to 900 mV (vs. SCE). The samples showed a positive hysteresis which is indicative of the occurrence of pitting corrosion. Table 2 summarizes the corrosion potential (Ecorr), corrosion current density (icorr), passivation current density (ipass), repassivation potential (Erep) and the breakdown potential (Eb) extracted from the CPP results. S15 shows a slightly higher pitting potential in comparison to S10 despite the presence of defects which implies that the defects did not affect the material’s ability to remain passive under higher applied potentials. However, the Erep was lower by 35% than that of S10 which indicates that once pits started to initiate and grow, the ability of the material to repassivate was markedly lower. The Eb obtained for the LENS samples was found to be higher than the values reported in the literature for conventionally manufactured samples which are between 300 and 450 mV (vs. Ag/AgCl) [29,30,31].

3.4. Potentiostatic Tribocorrosion Tests

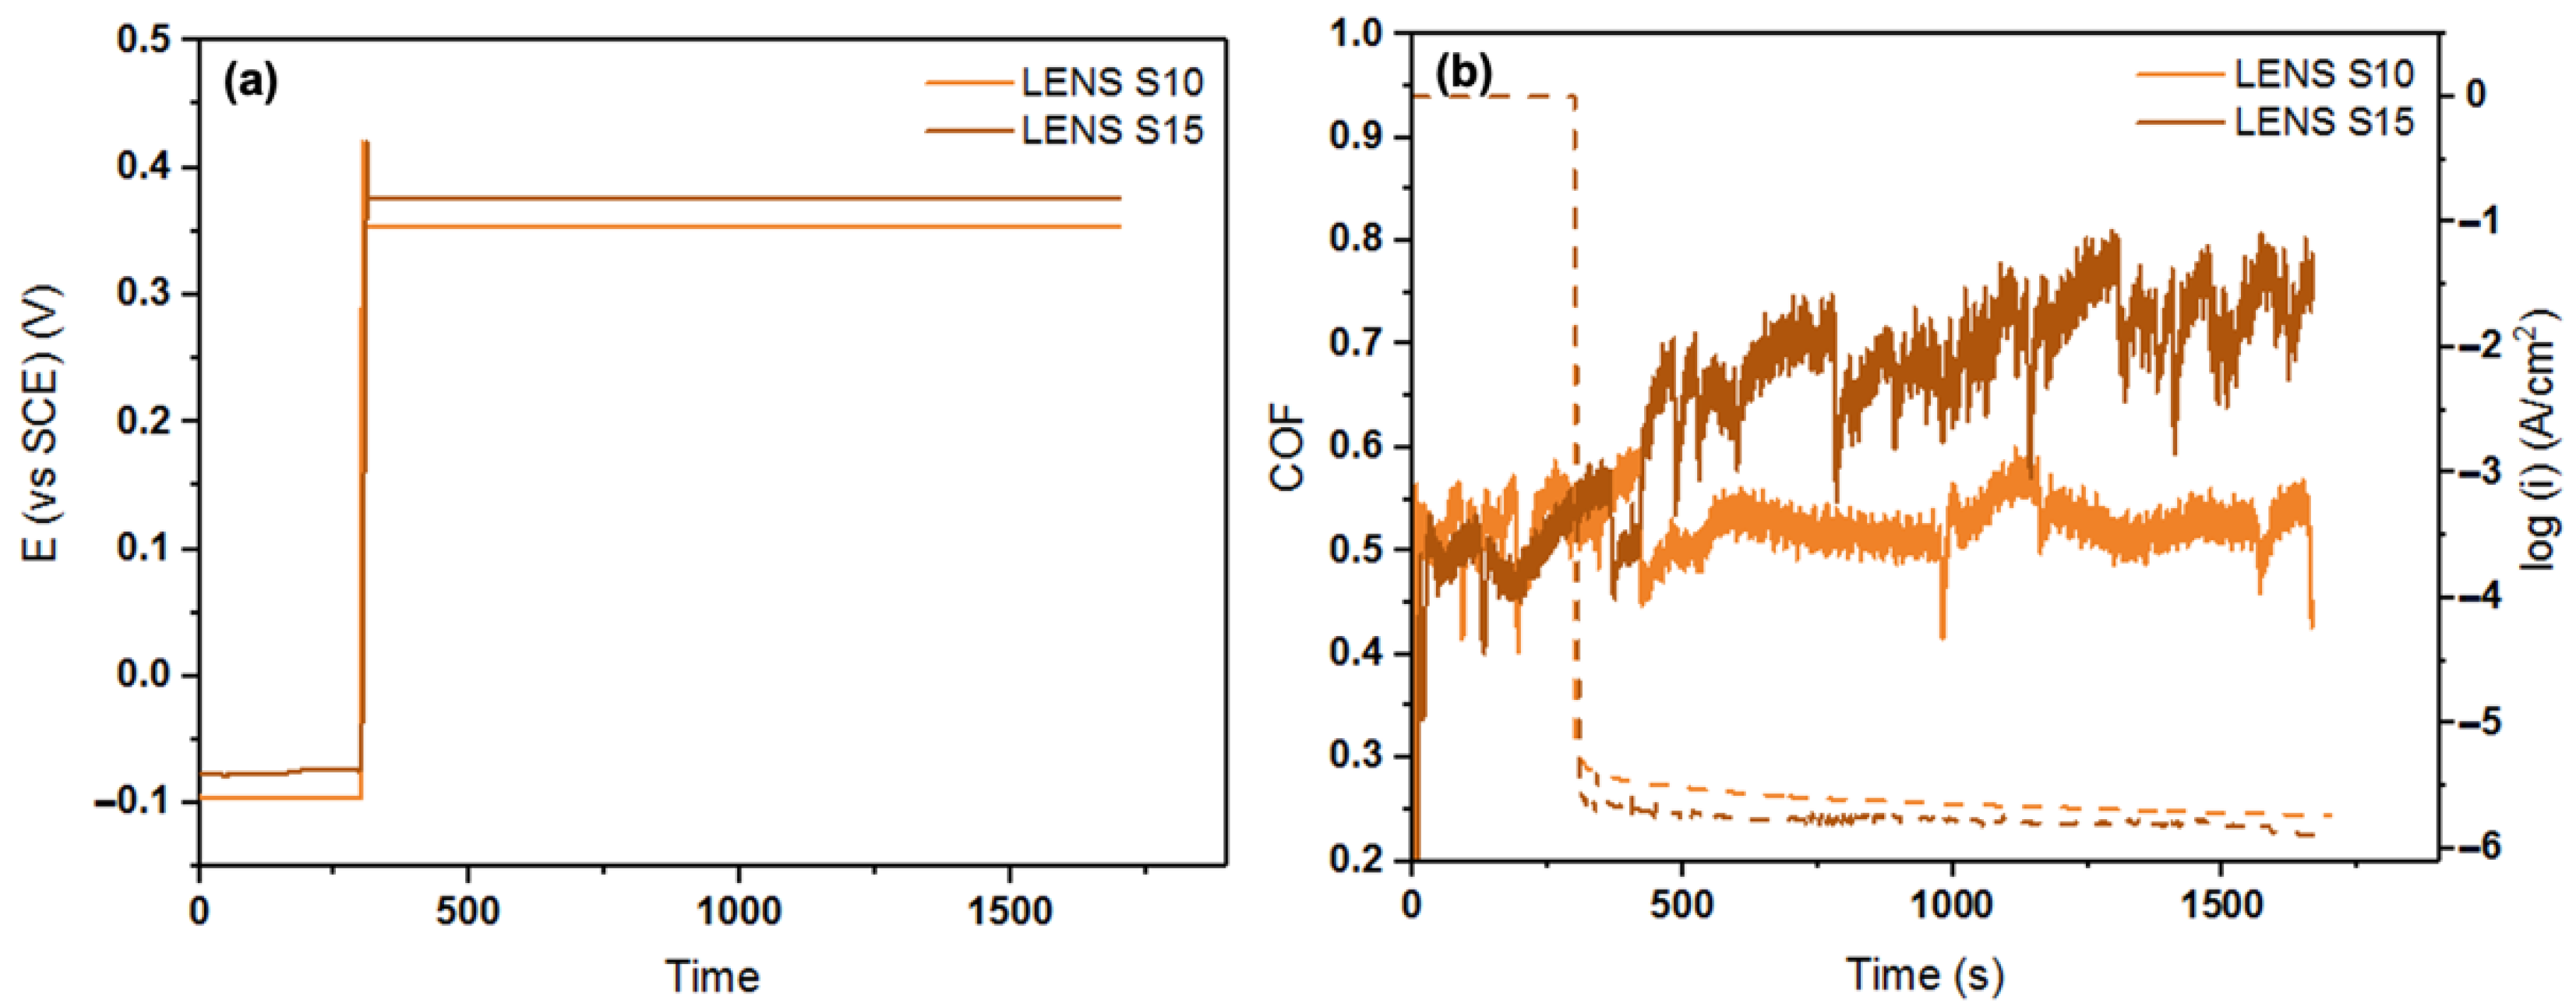
Potentiostatic tribocorrosion tests were performed at potentials selected from the cathodic and passive potentials obtained from the CPP tests. Sliding was performed during the entire duration of testing but the first 300 s (5 min) was just under OCP conditions after which the selected potential was applied. Figure 6 shows the potential (Figure 6a), coefficient of friction (COF) and current density (Figure 6b) variation during the tribocorrosion tests of the two samples in the PBS solution only for the passive region to focus on the nature of the passive films formed. A potential of +450 mV (vs. OCP) was selected as the passive potential. Sliding under OCP conditions can be used to obtain information about the electrochemical activity of the surface under equilibrium conditions. From the potential profiles (Figure 6a), it can be seen that the potentials were around −100 mV (vs. SCE) which meant that the surfaces were slightly less active during the start of sliding when compared to purely exposing to the solution. The potential of S15 was slightly more negative than that of S10 but it was within a comparable range.
Figure 6b shows the temporal variation in the friction coefficient during testing as a function of the applied potential. Towards the end of the OCP region, the coefficient of friction (COF) started to increase due to the beginning of construction of a native oxide film.
Upon application of the potential selected from the passive region, the COF continued to increase to higher values in the case of the S15 sample whereas a drop was observed in the case of the S10 sample before it stabilized around a lower value. Looking at the current densities, the values are an order of magnitude higher than the icorr upon corrosion testing alone which shows the influence of wear on the corrosion rate of the materials. The current density during sliding and potential application (Figure 6b) was slightly lower for S15 but in the same magnitude as that of S10. Both the current density and coefficient of friction (COF) for S15 exhibited greater fluctuations compared to S10, which maintained relatively stable values. This suggests that the tribofilm formed on the S15 sample experienced more frequent localized breakdowns, whereas S10 developed a more stable and protective surface film during sliding. Based on the CPP tests in the PBS solution, the repassivation potential (Erep) of S10 is higher than S15 which indicates that the ability of the passive film to repassivate after breakdown is higher in the former than the latter. The lower ability for repassivation could possibly be the reason for current fluctuations and continued increase in COF on the S15 surface. Additionally, the defects observed from improper fusion in the S15 sample could also contribute to the local breakdowns in passivity observed.
Similar tests were performed on a wrought SS316L sample and the mean COF during potential application was 0.52, 0.68 and 0.75 for S10, S15 and the commercial SS316L respectively. S15 showed a higher COF than S10 which could be due to its higher hardness or frequent rupture and repassivation of passive film.

3.5. Characterization After Corrosion and Wear Tests

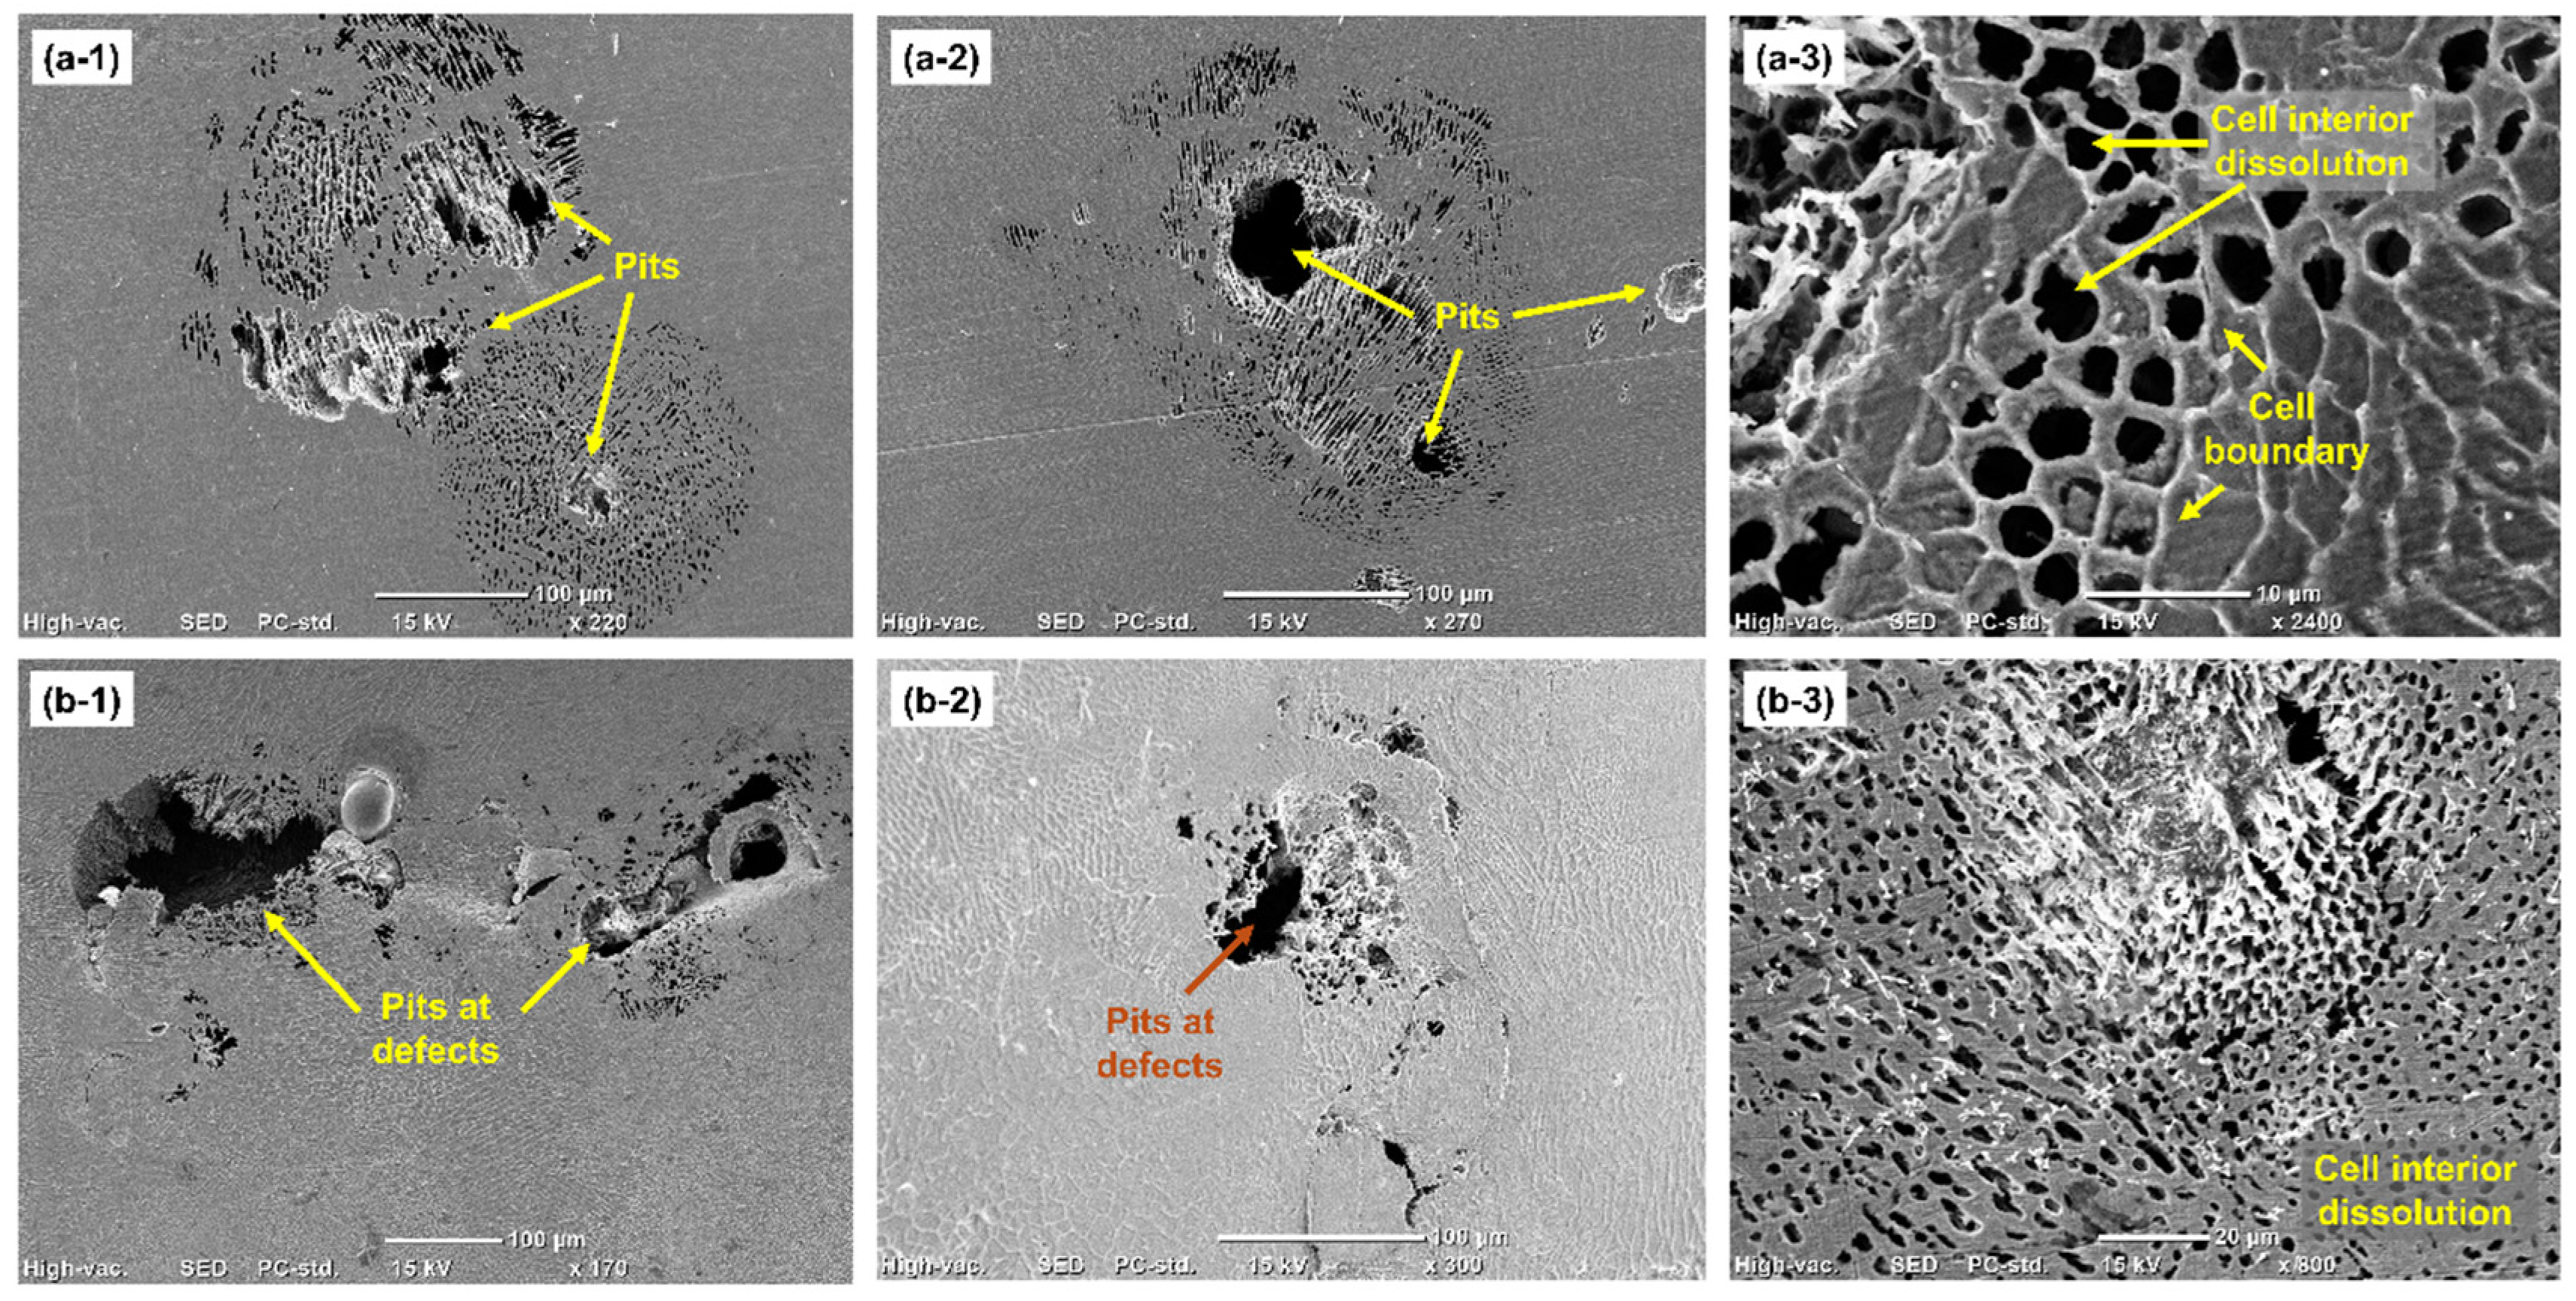
The samples were cleaned after the CPP tests in PBS and etched in aqua regia to reveal any microstructural features present around the pits formed. The SEM images of the pits formed in S10 and S15 after CPP in PBS are shown in Figure 7(a-1), (a-2), (a-3) and (b-1), (b-2), (b-3) respectively. In both samples, widespread areas of attack were observed in the regions surrounding the pits. The pit sizes on all the samples ranged from 20 to 250 μm. Several pits in the S15 sample were found near defects as can be seen in Figure 7(b-1,b-2). Such evidence was not observed in S10. From the morphology of the regions of attack surrounding the pits, the selective dissolution of cell interiors was observed as seen in Figure 7(a-3,b-3). This can be related to the depletion of Cr and Mo at the cell interiors observed from the SEM-EDS line-scans. The micro-segregation of Cr and Mo to the cell boundaries possibly made them more cathodic/passive in comparison to the cell interiors which contained lesser amounts of these passivating elements. Volta potential mapping across LENS samples in a previous study found that the cell boundaries were at a more positive potential than the cell interiors which could further support this theory [14]. Therefore, it is possible that micro-galvanic cells are developed with the cell interiors serving as anodes and getting selectively attacked. For sample S10, pitting was possibly initiated via cell interior dissolution but for S15, since pits were mostly located at or near defects, these were possibly the initiation sites.
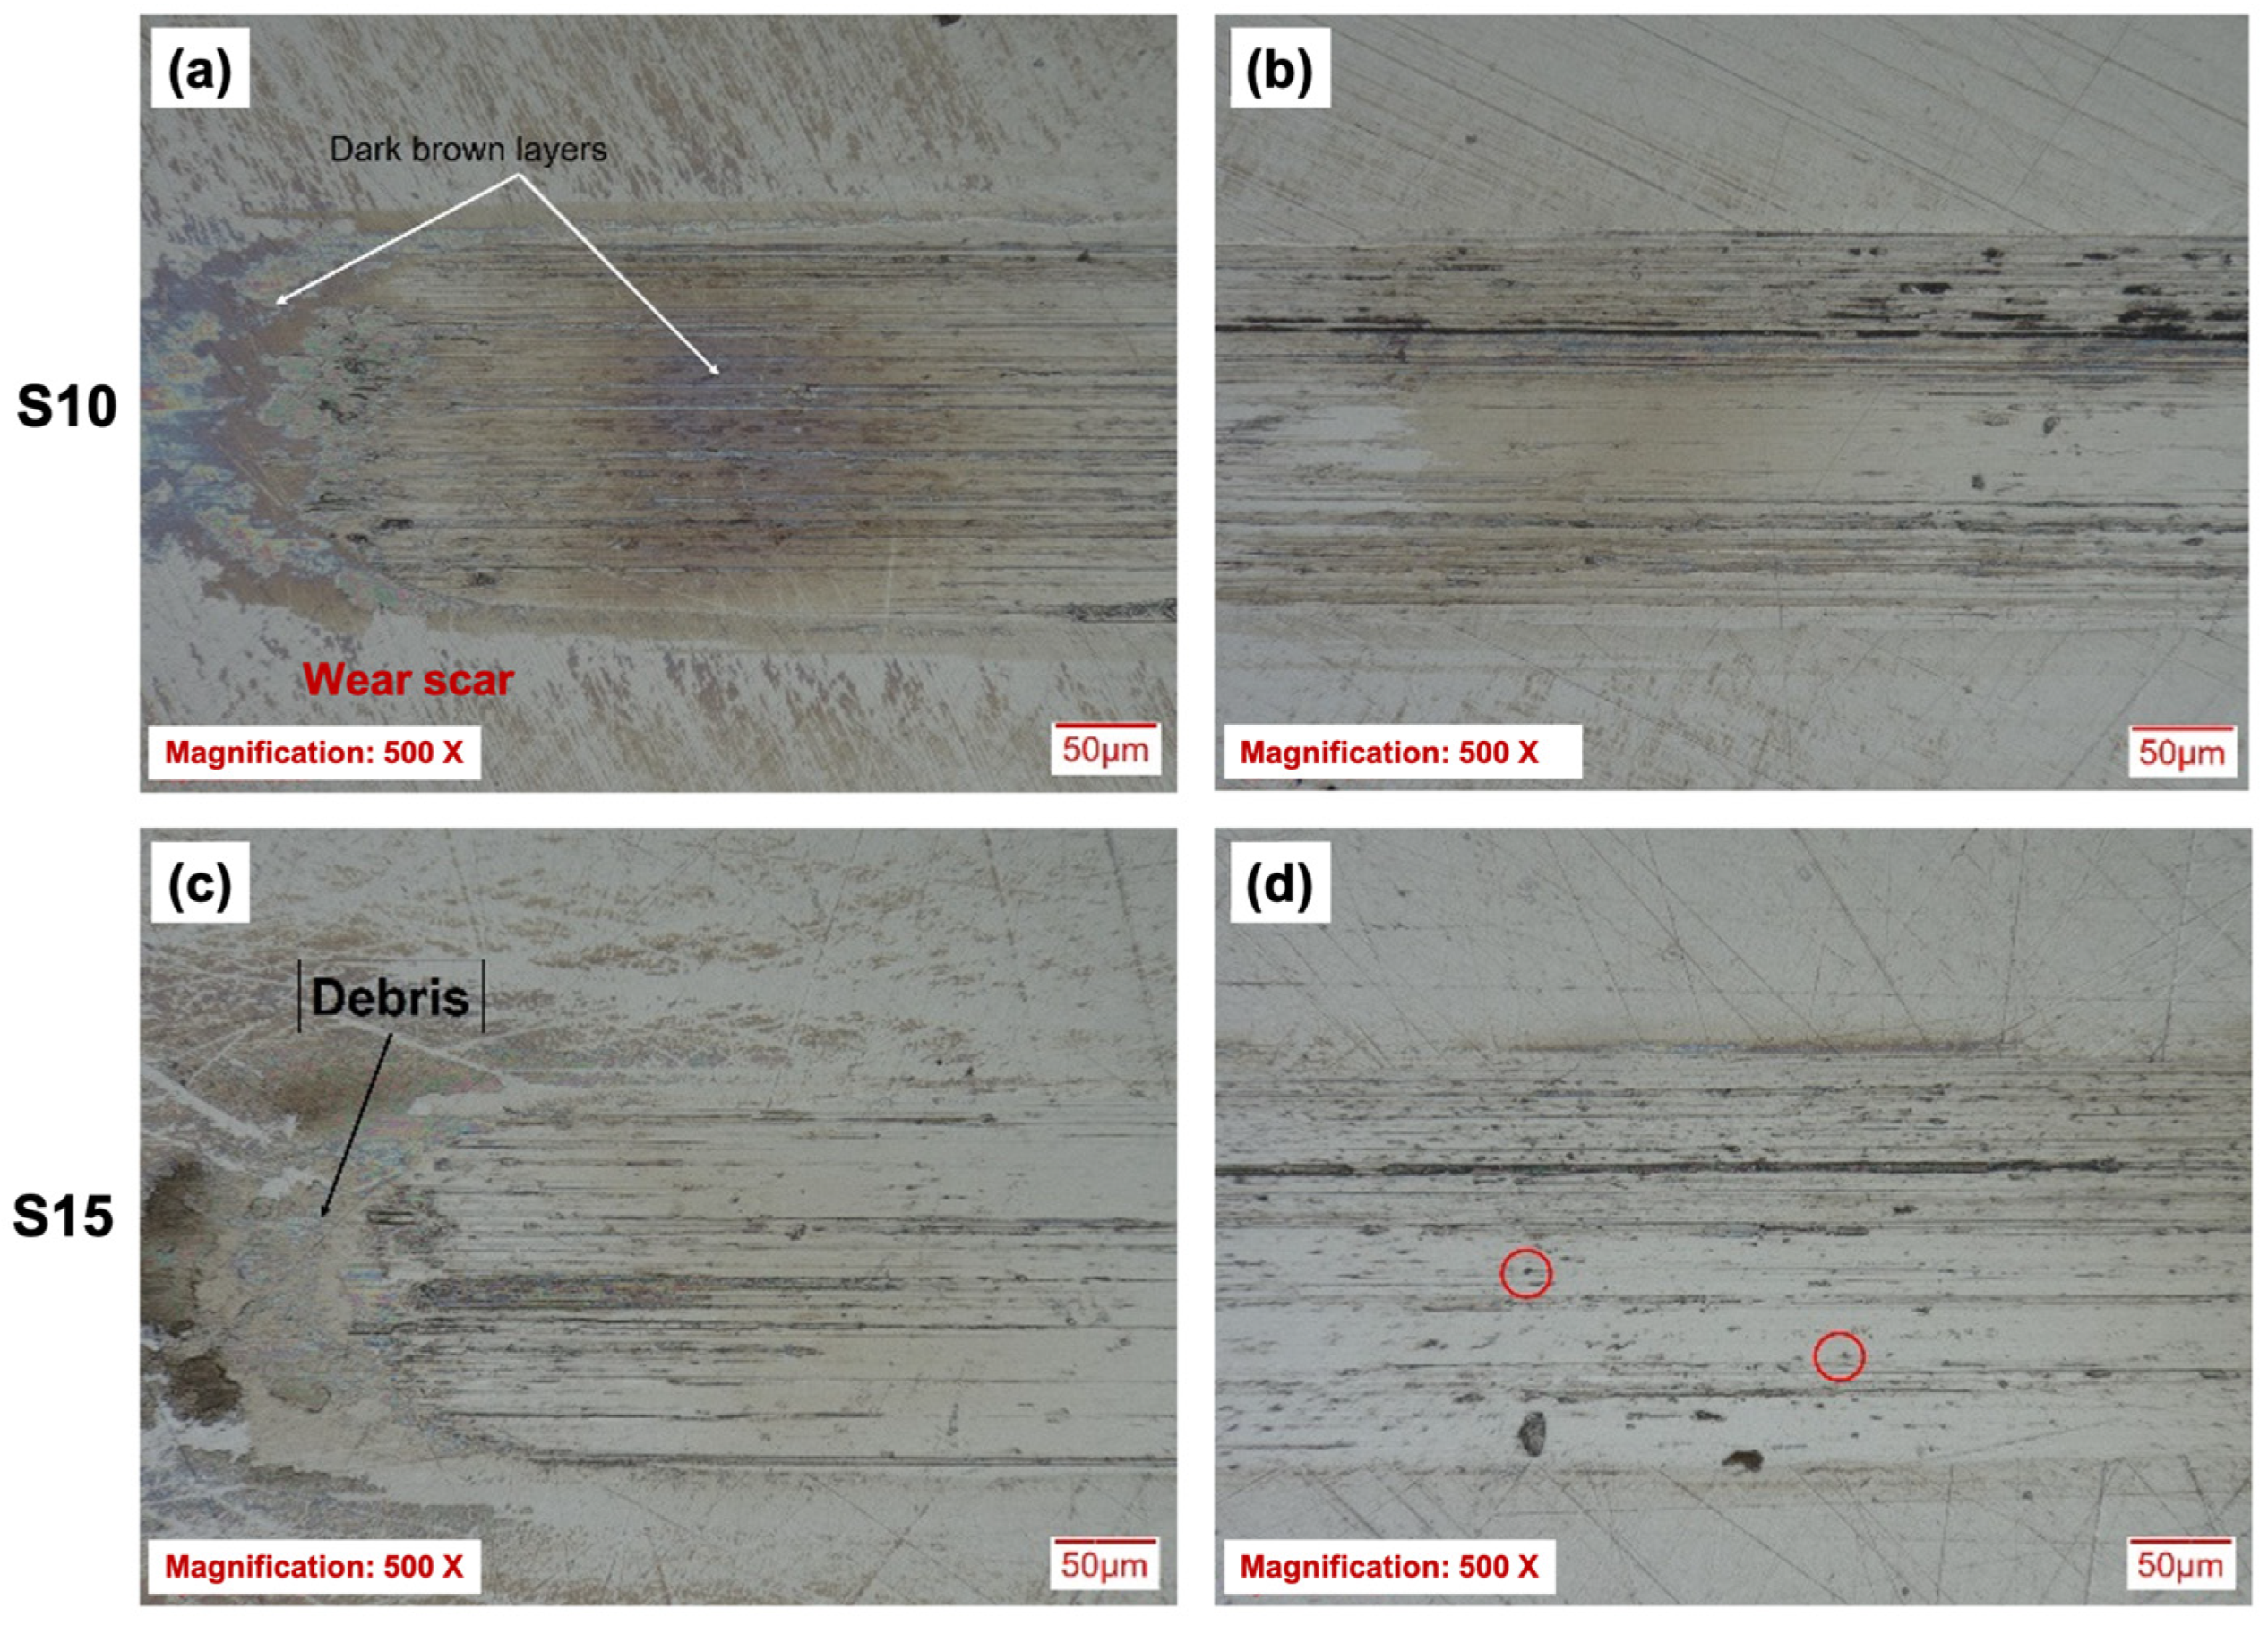
The OM images of the wear scars after tribocorrosion testing in the cathodic and passivation regions for S10 and S15 are shown in Figure 8. As seen from Figure 8a,c, which show the scars on S10 and S15 after the tribocorrosion test in the cathodic region, the presence of debris at the wear scar edges was observed. This suggests the formation of a thin solid surface film resulting from a chemical reaction between the electrolyte components and the metallic surfaces under stress. This boundary film, or tribofilm, is trapped in the asperities of the surface and appears as a dark-brown coloration.
Abrasive grooves remain visible even at the passivation potential in PBS solution (Figure 8b,d), indicating that the passive oxide film is thin and mechanically weak, and therefore unable to withstand the applied contact stresses during sliding. In Figure 8d, micro-pits are also present within the wear track of the S15 sample, further confirming that material removal is primarily governed by abrasion-dominated degradation. Repeated mechanical disruption of the oxide film causes it to fracture and generate wear debris. These debris particles become trapped within the confined contact zone and act as hard third-body abrasives, leading to additional surface damage through plowing and scratching, commonly referred to as three-body abrasion. At the same time, two-body abrasion occurs due to the significant hardness mismatch between the ceramic counterface and the relatively softer SS316L matrix, further contributing to the observed wear morphology.
The dimensions of the wear scars were measured from the OM images and details are presented in Table 3 and the calculated tribocorrosion parameters are shown in Table 4. Often, the volume loss induced by tribocorrosion testing is described as the result of both mechanical and chemical wear [32,33,34]:
V t = V w + V c + V s
V s = V w - c + V c - w
where Vt is the total material loss volume, Vw is the lost volume of material due to mechanical wear alone, Vc is the volume lost due to corrosion alone and ΔVs is the synergic effect that is devised into corrosion rate affected by wear (Vc-w) and wear rate affected by corrosion (Vw-c).
Vw and Vt were calculated using the software in Keyence VHX-7000 digital microscope (Keyence Corporation, Osaka, Japan) by performing wear tests at the cathodic polarization potential and passivation potentials, respectively. Vc and Vw-c were calculated from the polarization test performed without wear and from wear tests at the passivation potentials, respectively, using the following equations:
V c = i c o r r M t n F ρ
V w - c = i s l i d i n g M t n F ρ
where icorr and isliding are the current during pure corrosion and tribocorrosion test, t is the time of exposure (s), M is the molecular weight (55.845 g/mol), F is the Faraday’s constant equal to 96,485 C⋅mol−1, ρ is the density (7.87 g/cm3) and n is the valence oxidation state (n = 2). The icorr values used for the calculations are from those reported in Table 2 as obtained from fitting the linear region of the CPP results (±150 mV from Ecorr). The isliding was obtained by averaging the values measured over the 1667 s during which sliding was performed from the data presented in Figure 6b.
From the calculated parameters in Table 4, the total material loss (Vt) for S15 (4.7 × 10⁻³ mm3) is approximately 14.6% higher than that of S10 (4.1 × 10⁻³ mm3), indicating that S15 undergoes more severe degradation under tribocorrosion conditions. Although the pure corrosion component (Vc) is nearly identical for both samples (0.041 × 10⁻³ mm3 for S10 and 0.040 × 10⁻³ mm3 for S15, i.e., <3% difference) clear differences emerge in the mechanical and synergistic contributions.
The pure mechanical wear volume (Vw) is slightly higher for S15 (3.6 × 10⁻³ mm3) compared to S10 (3.4 × 10⁻³ mm3), corresponding to an increase of approximately 5.9%, suggesting that S15 experiences greater material removal under purely mechanical conditions. This is consistent with the larger wear scar depths observed for S15 at both cathodic and passivation conditions, particularly under passivation (3.9 µm for S15 vs. 3.3 µm for S10, representing an increase of approximately 18%). These values are slightly higher than those reported upon sliding under OCP conditions for conventional SS316L in various comparable physiological solutions such as Ringer’s, PBS and saline which is expected since sliding in the current study was performed under cathodic conditions where the native passive film cannot be formed [35,36].
Importantly, the synergistic contribution (ΔVs) is significantly higher for S15 (1.06 × 10⁻³ mm3) than for S10 (0.659 × 10⁻³ mm3), corresponding to an increase of approximately 61%. This indicates that the interaction between wear and corrosion is more detrimental in S15. When decomposing the synergy term, the corrosion rate affected by wear (Vc-w) is markedly larger for S15 (0.955 × 10⁻³ mm3) than for S10 (0.508 × 10⁻³ mm3), representing an increase of approximately 88%. This suggests that mechanical sliding more strongly accelerates electrochemical dissolution in S15, likely due to more frequent passive film breakdown and slower repassivation kinetics. This behavior is strongly correlated with the lower repassivation potential (Erep) of S15, which is approximately 35% lower than that of S10. The reduced Erep indicates inferior repassivation capability and lower passive film stability in S15, making it more susceptible to sustained depassivation under sliding conditions. Combined with the higher defect density in S15, these microstructural discontinuities act as localized sites for passive film breakdown, facilitating repeated depassivation–repassivation cycles and enhancing corrosion kinetics during tribocorrosion.
Conversely, the wear rate affected by corrosion (Vw-c) is slightly lower for S15 (0.105 × 10⁻³ mm3) compared to S10 (0.151 × 10⁻³ mm3), corresponding to a decrease of approximately 30%. This implies that corrosion contributes less to mechanically assisted material removal in S15, even though the overall synergistic damage is higher. Therefore, the dominant degradation mechanism in S15 appears to be corrosion accelerated by wear rather than wear enhanced by corrosion.
Overall, while pure corrosion contributes minimally to total volume loss in both samples, the synergistic interaction plays a decisive role. For both materials, mechanical wear (Vw) is the dominant contributor to total loss; however, S15 exhibits a substantially higher corrosion–wear interaction term, leading to greater total degradation. This behavior is primarily attributed to the combined effects of higher defect density and reduced repassivation capability (lower Erep) in S15, which promote passive film instability and enhanced localized dissolution under sliding conditions. These findings highlight that tribocorrosion performance in LENS SS316L is governed not only by intrinsic corrosion resistance but also by process-induced microstructural features that control passive film stability and its ability to recover during mechanical disruption.
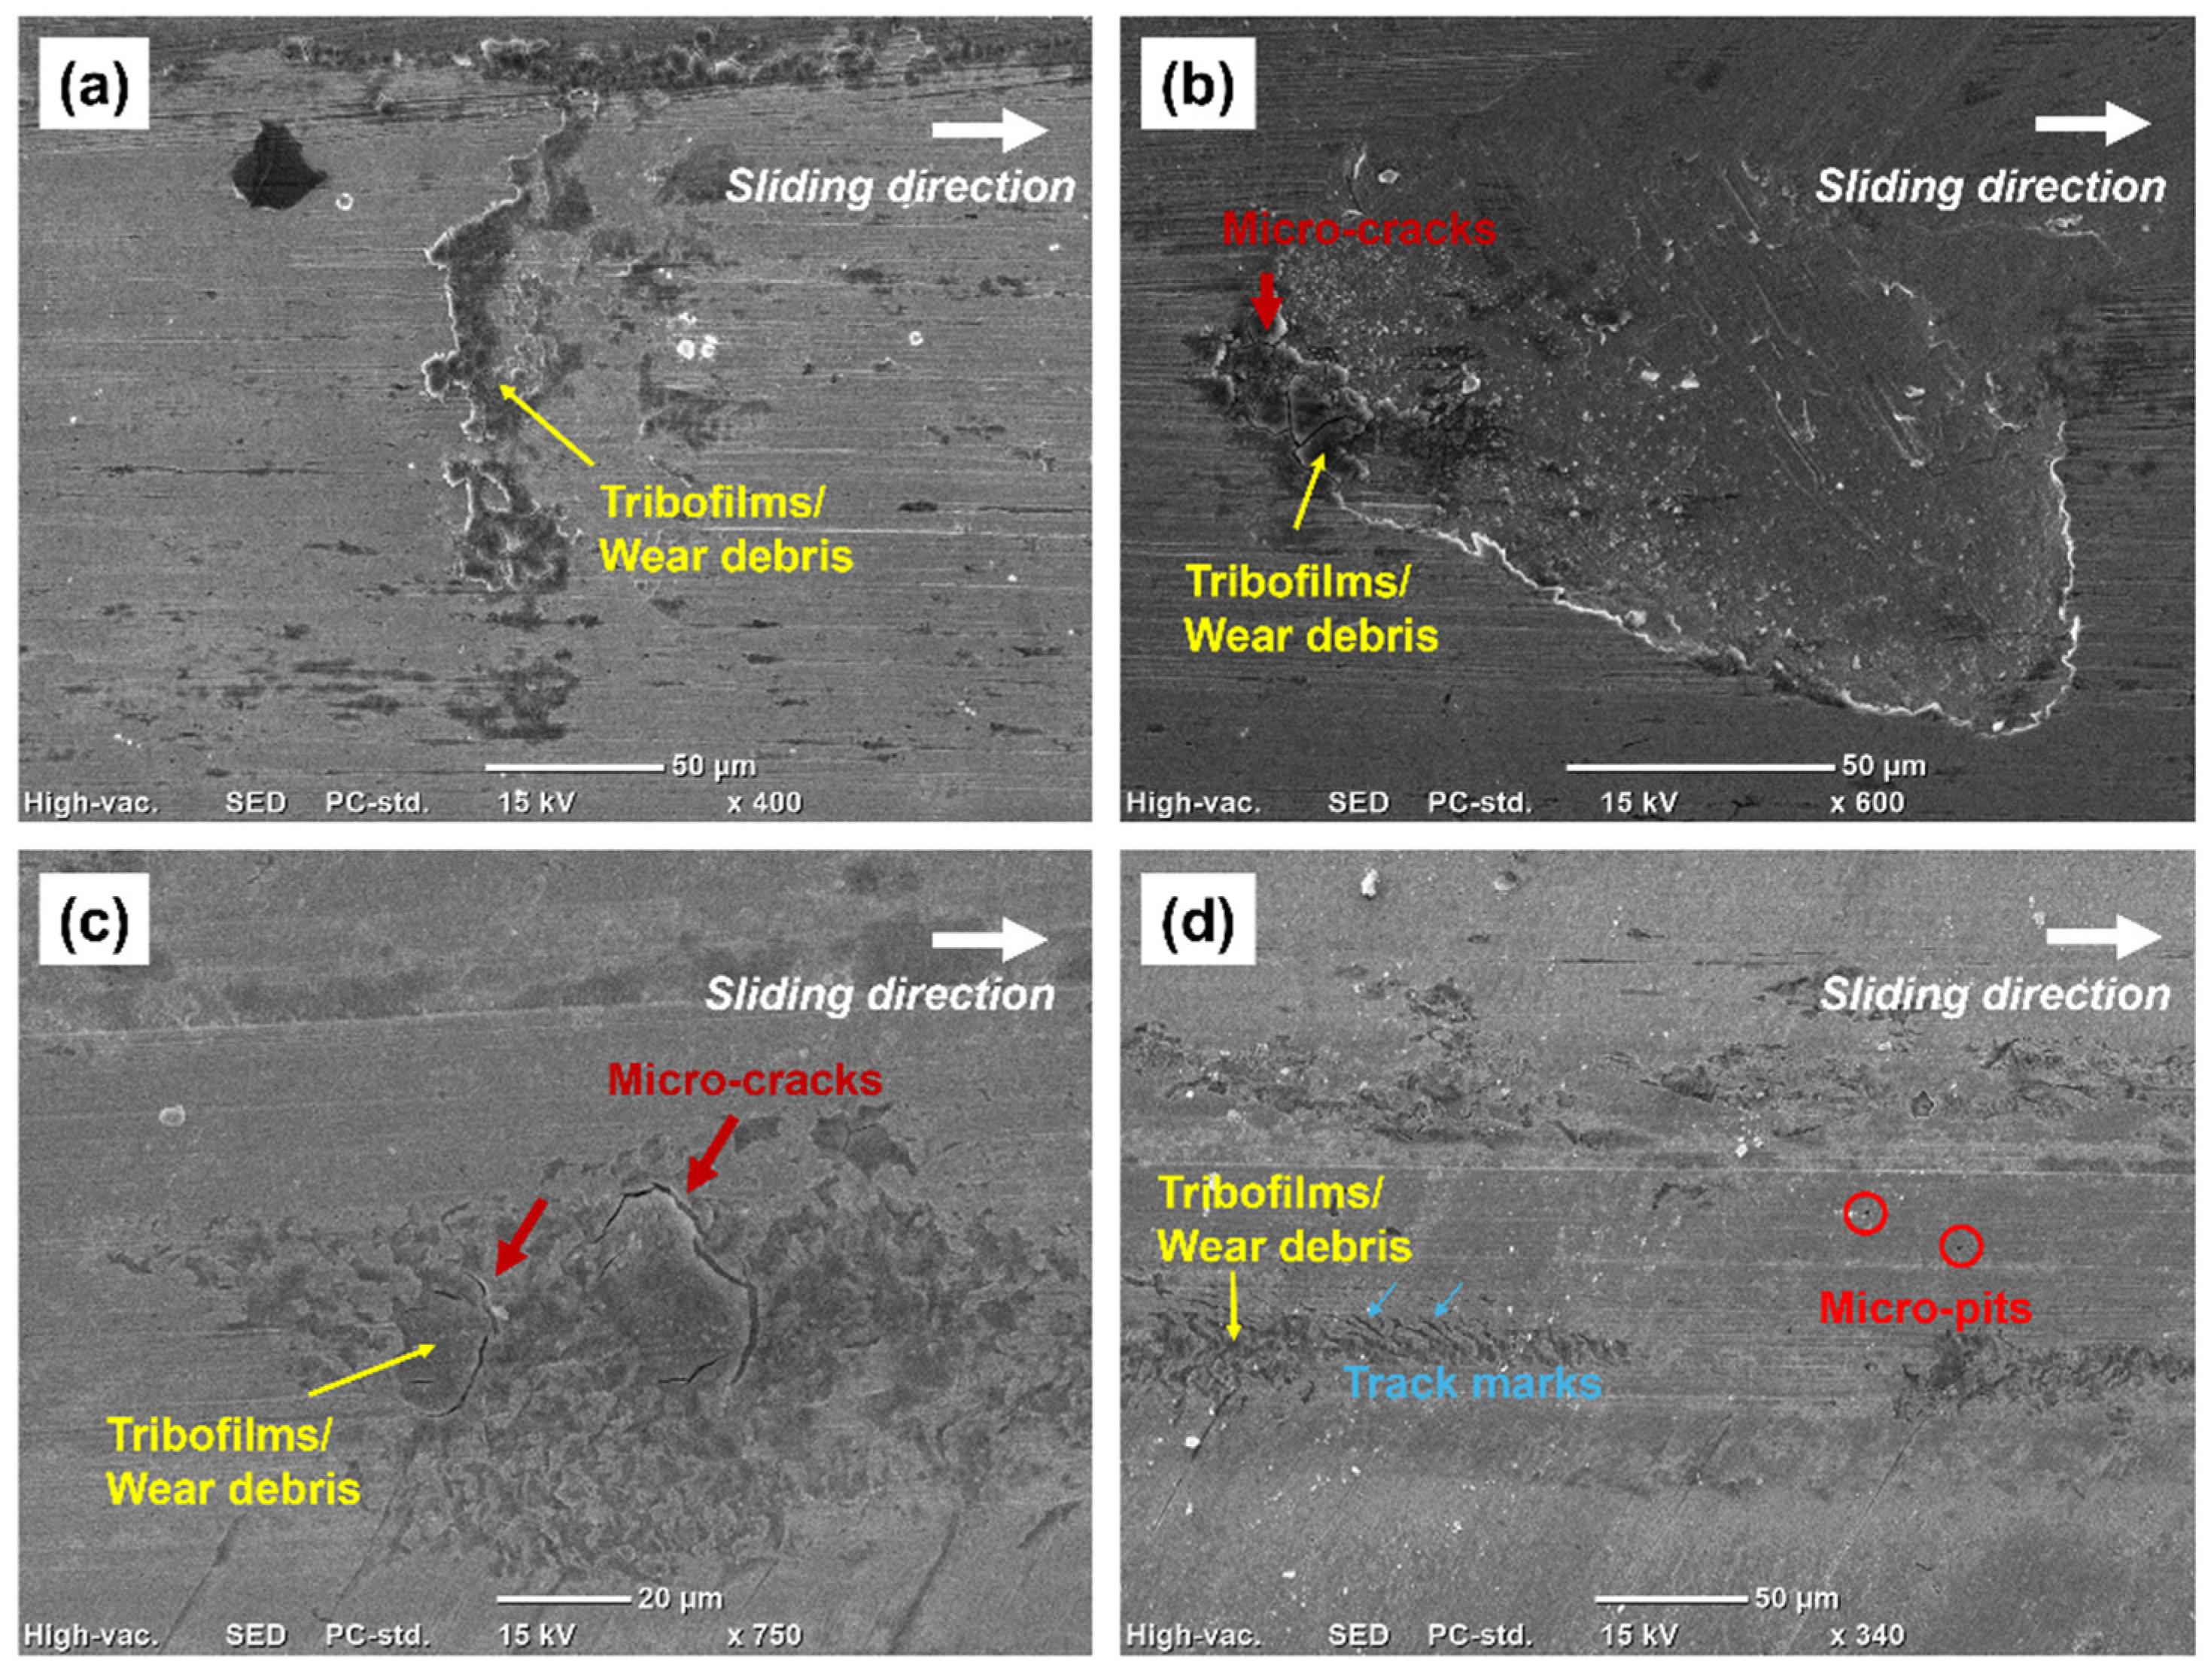
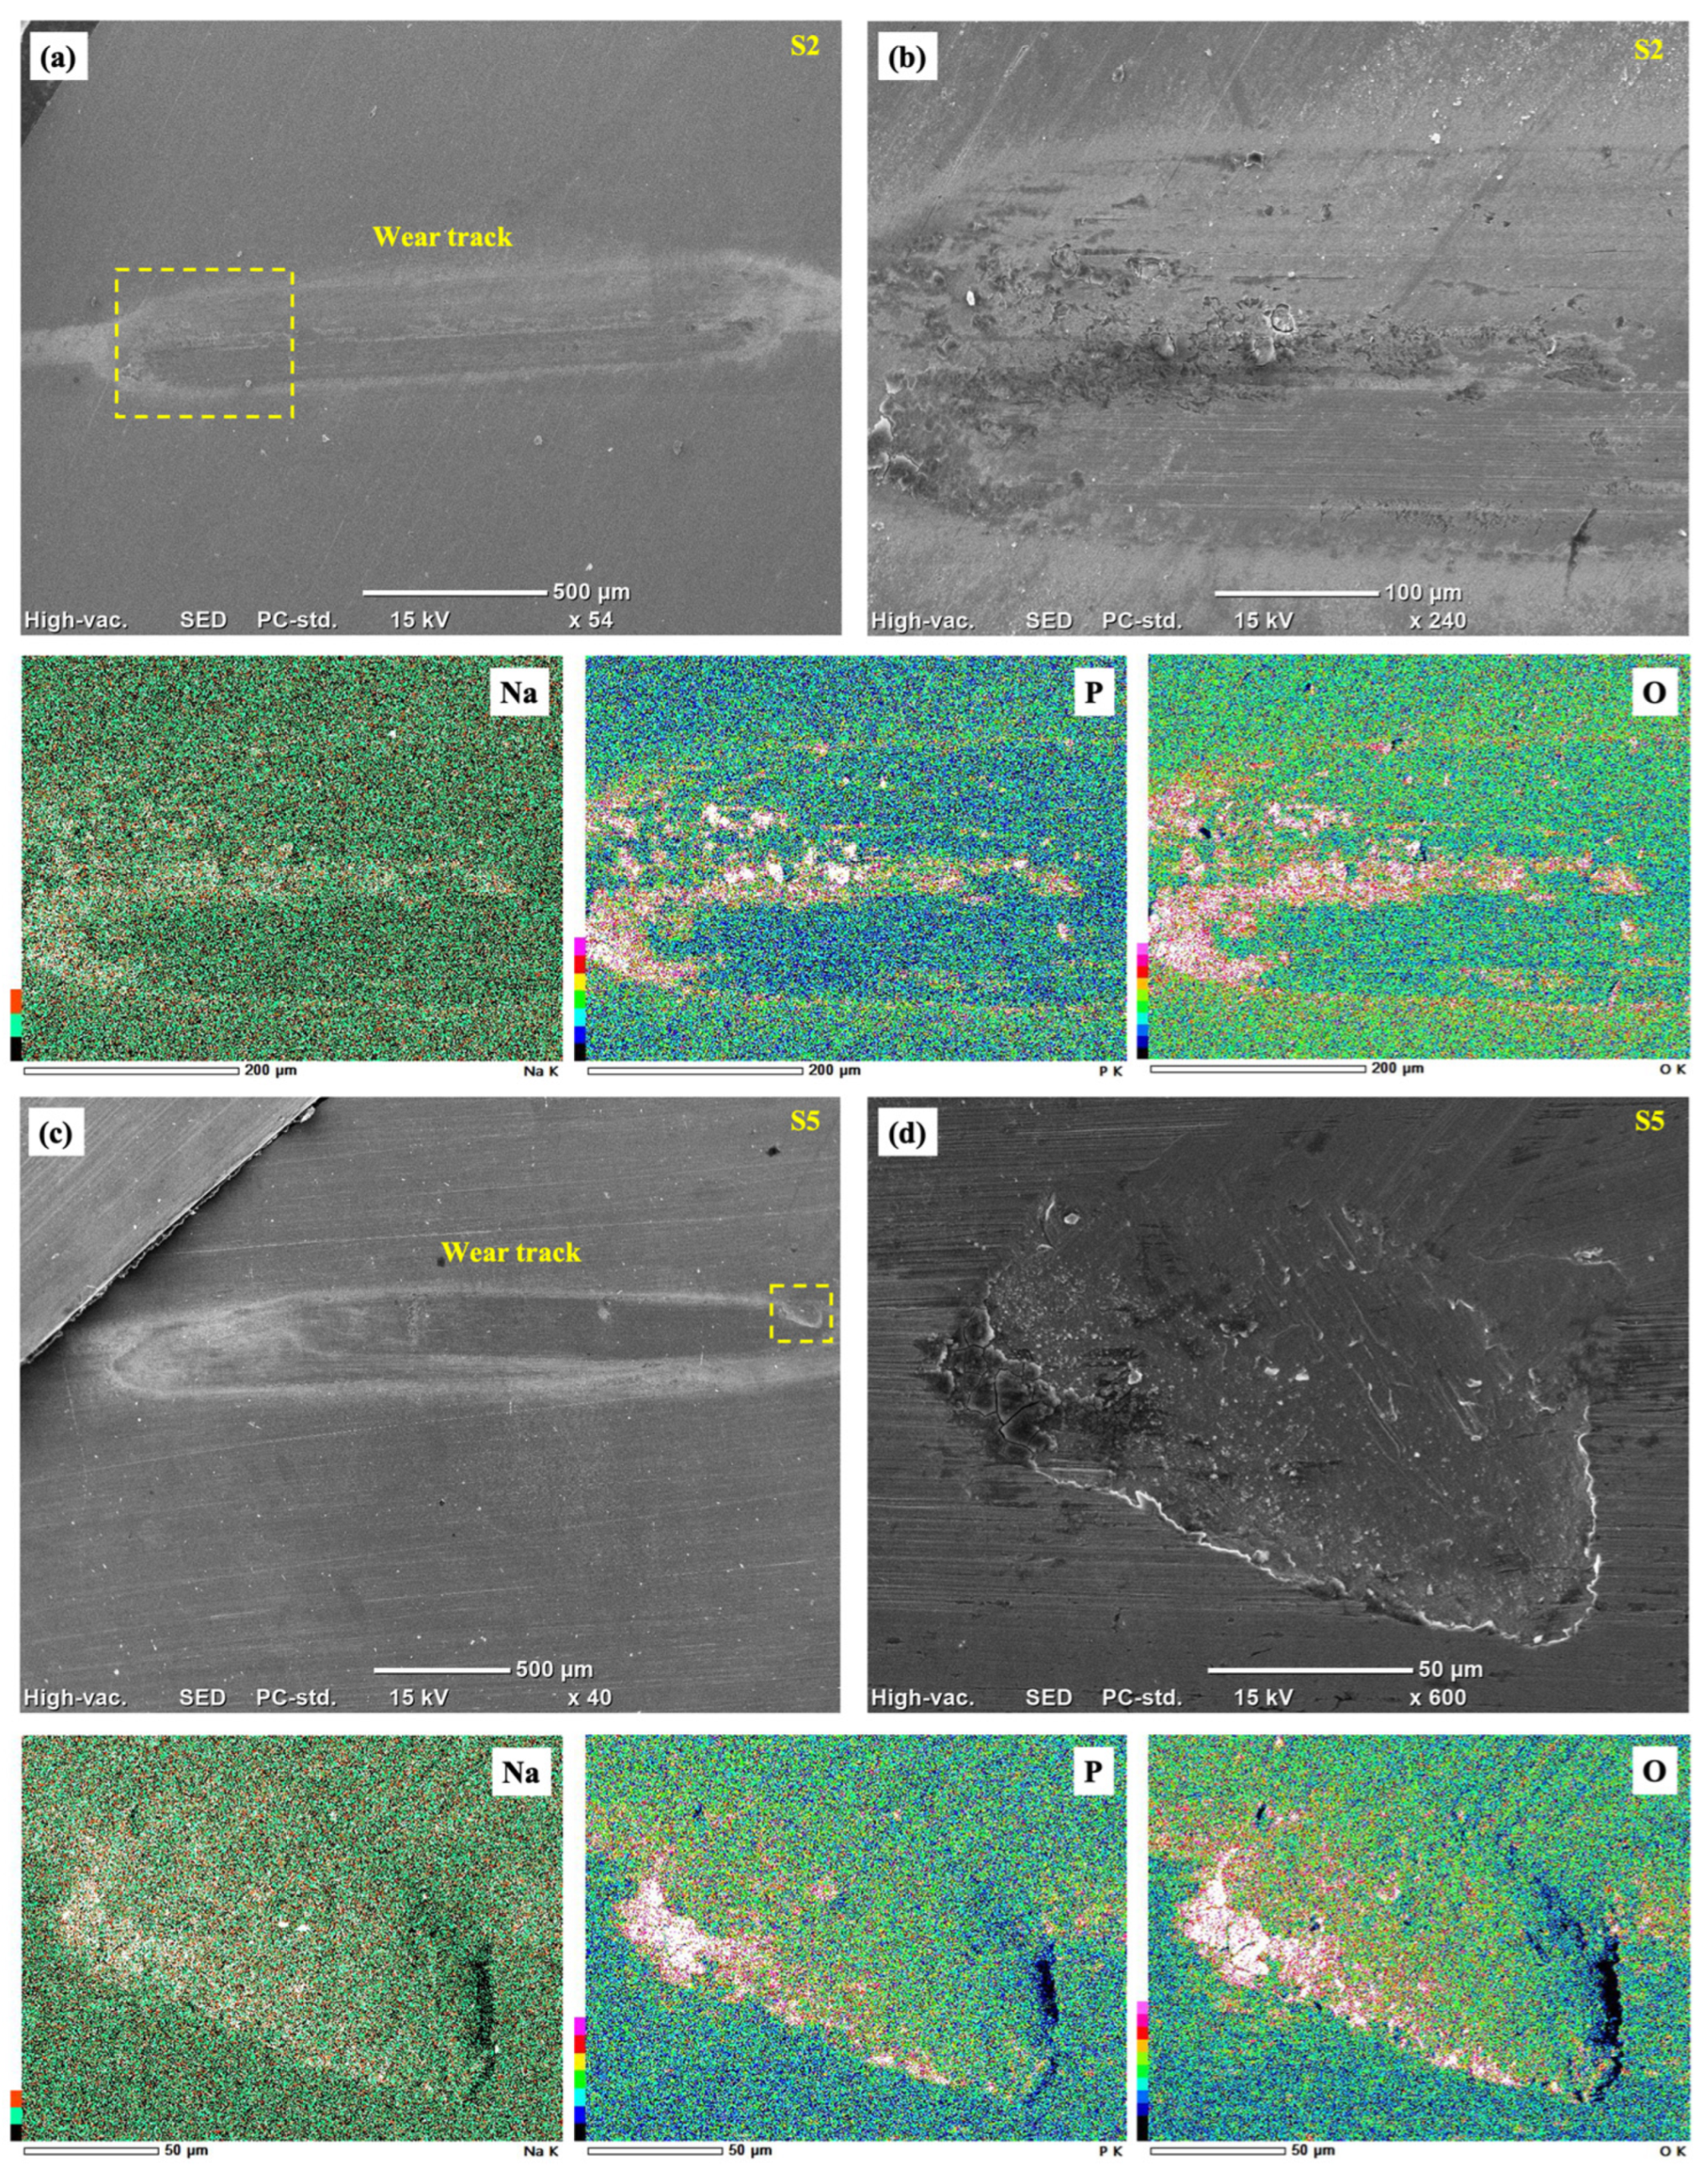
Figure 9 shows the SEM images after tribocorrosion testing in the passive region and the EDS results obtained from measurements at the tribofilms indicated in the figures are shown in Table 5. Similar to the observations from the OM results, both samples showed the formation of bio-tribofilms/wear debris at certain regions in the wear with S15 exhibiting some micro-pits as well (Figure 9d). From the EDS measurements (Table 5), the film formed in the wear tracks consisted of phosphorous and oxygen, in addition to the main alloying elements in SS316L (Fe, Cr, Mo, Ni, Mn) which, given the solution the alloys were tested in, could indicate phosphate-based films. Other studies have shown that such bio-tribofilms form on biomedical alloys exposed to PBS [37,38] solution. EDS mapping of these bio-tribofilms are presented in Figure A1 in Appendix A.
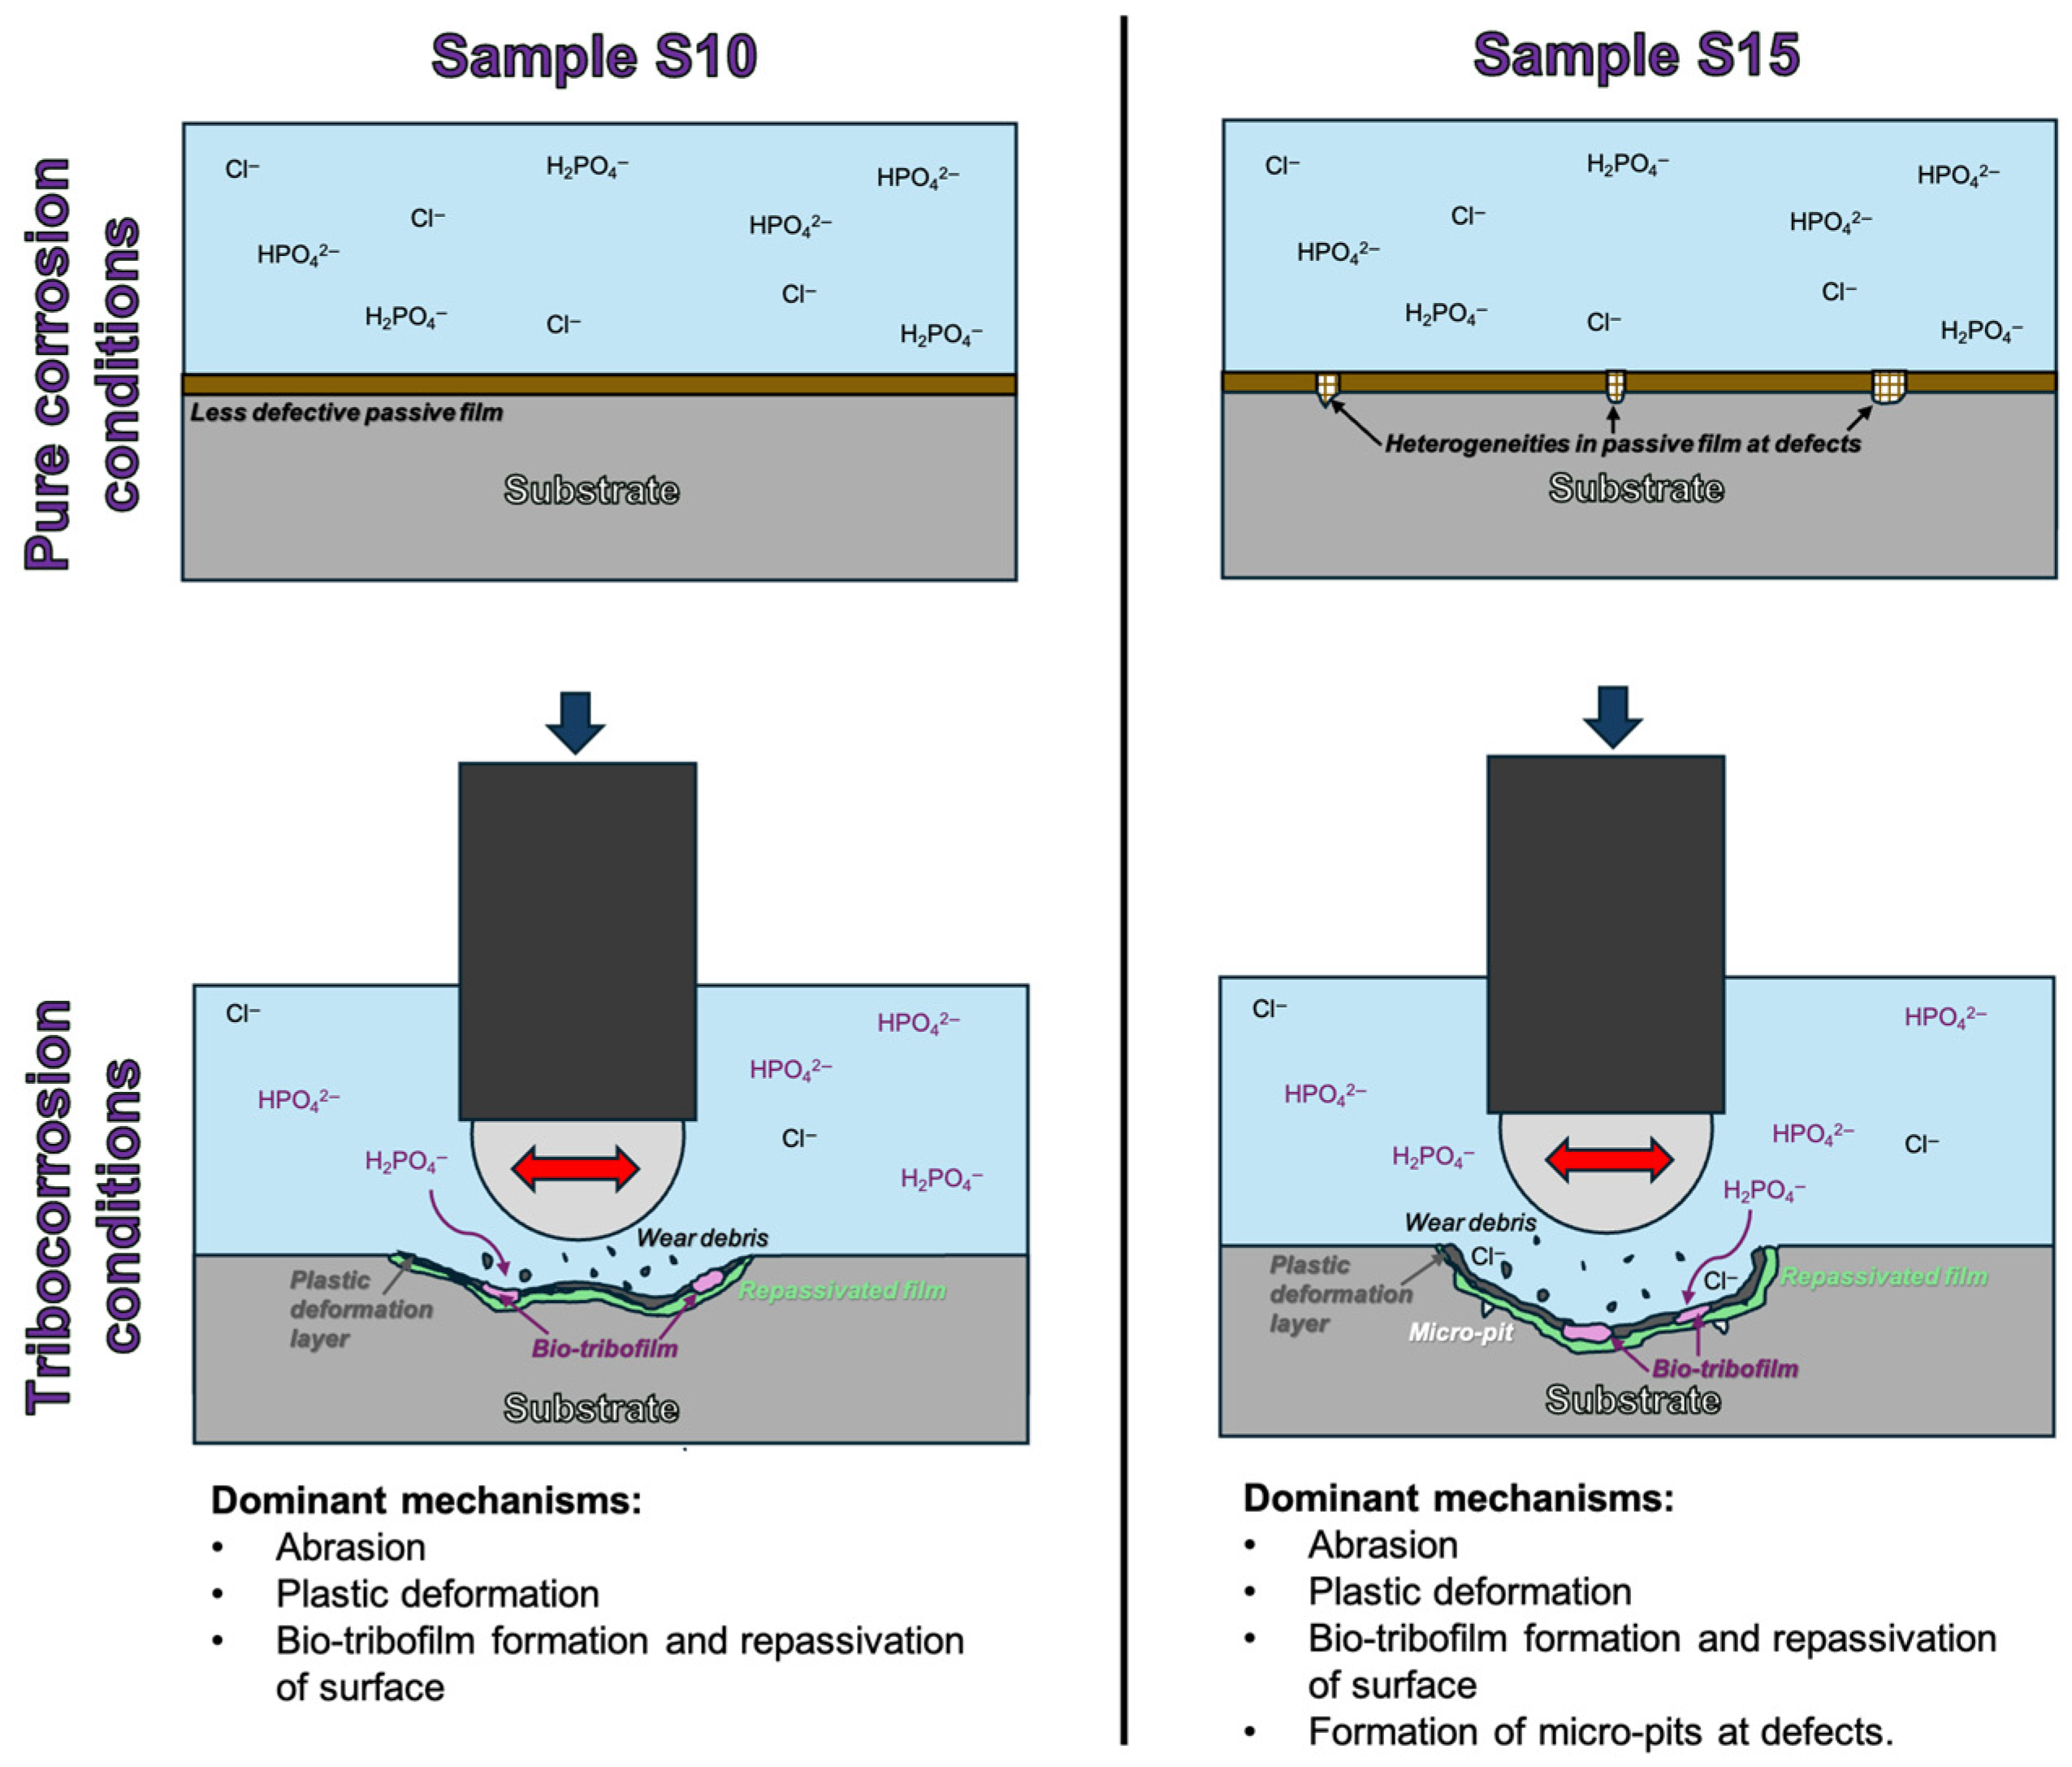
The surface characteristics after passivation under pure corrosion and tribocorrosion for S10 and S15 have been summarized in Figure 10. The LENS sample manufactured with a higher scan speed showed more manufacturing defects that reduced the repassivation capacity of the passive film, increased the presence of micro-pits in the wear tracks and showed a much higher volume loss due to corrosion rate accelerated by wear. Overall, the tribocorrosion behavior of LENS SS316L was better under passive conditions compared to wrought SS316L but wear mechanisms such as abrasion and plastic deformation still dominated volume loss. Therefore, even though the intrinsic corrosion resistance of AM samples are higher, further work needs to be carried out to improve wear resistance in AM SS316L.

4. Conclusions

This study investigated the passivation, localized corrosion and tribocorrosion behavior of two LENS SS316L samples manufactured using two different scan speeds. The following conclusions can be drawn from the results and observations:
  • The LENS samples showed the formation of fine, heterogeneous cellular features enclosed within cell boundaries. S10 (lower scan speed) showed more continuous cell boundaries whereas S15 (higher scan speed) showed the presence of discontinuous boundaries. S15 showed the presence of manufacturing defects such as porosities and lack of fusion. Both samples showed the micro-segregation of Cr and Mo to the cell boundaries compared to the cell interiors.
  • EIS results showed that the passive film formed on S10 was more compact and less defective than that on S15 with the latter showing a 66% reduction in Rct. Both samples showed susceptibility to pitting corrosion in PBS with similar breakdown potentials with the Erep of S15 being lower than S10 by 35%.
  • The mean COF during potential application was 0.52 and 0.68 for the S10 and S15 samples respectively with the S15 sample showing more fluctuations in the sliding current density which could be due to frequent rupture and repassivation of passive film.
  • Pits on the samples after CPP testing showed evidence of cell interior dissolution in both samples with most of the pits present at or near defects in S15.
  • Volume loss was dominated by wear in both samples with the corrosion rate accelerated by wear being much higher than wear rate accelerated by corrosion. The synergistic contribution, ΔVs and corrosion rate affected by wear (Vc-w) was significantly higher for S15 than for S10 with increases of 61% and 88% respectively.
  • The wear tracks showed grooves from abrasion, evidence of plastic deformation and the formation of bio-tribofilms comprising phosphates at certain regions. S15 also showed the presence of micro-pits possibly formed at defects.
Although PBS is widely used as a standardized medium for preliminary evaluation of biomedical implant corrosion behavior, it represents a simplified physiological environment. Real in vivo conditions involve complex interactions including protein adsorption, inflammatory species, pH fluctuations, and mechanical loading, all of which can significantly alter passive film stability and localized corrosion behavior. Therefore, the present results should be interpreted as comparative in vitro indicators of corrosion resistance relevant to early-stage material screening, rather than direct predictors of long-term in vivo performance. While the impact of these features under pure corrosion was not too significant, they negatively impacted the resistance towards synergistic degradation factors. The process parameters selected for manufacturing SS316L therefore need to be carefully selected to avoid the formation of such features to better improve tribocorrosion resistance.

5. Study Limitations

This study provides initial insights into the effect of scan speed on the tribocorrosion behavior of LENS-fabricated SS316L. However, its statistical scope is limited. Only two scan speeds were investigated and electrochemical and tribocorrosion measurements were performed in duplicates, resulting in a small sample size that restricts the robustness of statistical comparisons and trend generalization. While the high cost and process complexity associated with LENS fabrication constrained the number of experimental conditions and repeats, future work should incorporate a broader range of scan speeds and increased replication to enable statistically significant analysis and more definitive conclusions. Furthermore, although the present results highlight promising material behavior, additional validation including extended testing under physiologically relevant conditions and in vivo studies is necessary before translation to practical biomedical applications can be considered.

Author Contributions

Conceptualization, D.N.; methodology, D.N. and M.M.B.S.; investigation, D.N., M.M.B.S. and F.A.; formal analysis, D.N., M.M.B.S. and F.A.; resources, I.K., H.C. and M.D.; writing—original draft preparation, D.N. and M.M.B.S.; writing—review and editing, F.A., H.C. and M.D.; materials provided, I.K., H.C. and M.D.; project administration, H.C. and M.D.; funding acquisition, H.C. All authors have read and agreed to the published version of the manuscript.

Funding

This research was funded by the National Institute of Standards and Technology; Federal Award Number: 70NANB21H041.

Data Availability Statement

Data will be made available on request due to it being a part of an ongoing study.

Conflicts of Interest

The authors declare no conflicts of interest.

Appendix A. Additional SEM-EDS Maps of Wear Tracks

Figure A1. SEM images and energy dispersive X-ray spectroscopy (EDS) maps of wear tracks and bio-tribofilms formed in PBS on (a,b) S15 and (c,d) S10 after potentiostatic tribo-tests at Epass.
Cmd 07 00030 g0a1

References

  1. Svetlizky, D.; Zheng, B.; Vyatskikh, A.; Das, M.; Bose, S.; Bandyopadhyay, A.; Schoenung, J.M.; Lavernia, E.J.; Eliaz, N. Laser-based directed energy deposition (DED-LB) of advanced materials. Mater. Sci. Eng. A 2022, 840, 142967. [Google Scholar] [CrossRef] [Scilit]
  2. Svetlizky, D.; Das, M.; Zheng, B.; Vyatskikh, A.L.; Bose, S.; Bandyopadhyay, A.; Schoenung, J.M.; Lavernia, E.J.; Eliaz, N. Directed energy deposition (DED) additive manufacturing: Physical characteristics, defects, challenges and applications. Mater. Today 2021, 49, 271–295. [Google Scholar] [CrossRef] [Scilit]
  3. Pandey, A.K.; Kumar, A.; Kumar, R.; Gautam, R.K.; Behera, C.K. Tribological performance of SS 316L, commercially pure Titanium, and Ti6Al4V in different solutions for biomedical applications. Mater. Today Proc. 2023, 78, A1–A8. [Google Scholar] [CrossRef] [Scilit]
  4. Holmes, D.; Sharifi, S.; Stack, M.M. Tribo-corrosion of steel in artificial saliva. Tribol. Int. 2014, 75, 80–86. [Google Scholar] [CrossRef] [Scilit]
  5. Alonso, C.; Castellote, M.; Andrade, C. Chloride threshold dependence of pitting potential of reinforcements. Electrochim. Acta 2002, 47, 3469–3481. [Google Scholar] [CrossRef] [Scilit]
  6. Hodge, C.; Stack, M.M. Tribo-corrosion mechanisms of stainless steel in soft drinks. Wear 2010, 270, 104–114. [Google Scholar] [CrossRef] [Scilit]
  7. Yazdi, M.; Khan, F.; Abbassi, R.; Quddus, N.; Castaneda-Lopez, H. A review of risk-based decision-making models for microbiologically influenced corrosion (MIC) in offshore pipelines. Reliab. Eng. Syst. Saf. 2022, 223, 108474. [Google Scholar] [CrossRef] [Scilit]
  8. Pejaković, V.; Berger, L.M.; Thiele, S.; Rojacz, H.; Rodríguez Ripoll, M. Fine grained titanium carbonitride reinforcements for laser deposition processes of 316L boost tribocorrosion resistance in marine environments. Mater. Des. 2021, 207, 109847. [Google Scholar] [CrossRef] [Scilit]
  9. Narayanan, D.; Liu, M.; Kuttolamadom, M.; Castaneda, H. Identification and development of a new local corrosion mechanism in a Laser Engineered Net Shaped (LENS) biomedical Co-Cr-Mo alloy in Hank’s solution. Corros. Sci. 2022, 207, 110599. [Google Scholar] [CrossRef] [Scilit]
  10. Zhang, X.-M.; Chen, Z.-Y.; Luo, H.-F.; Zhou, T.; Zhao, Y.-L.; Ling, Z.-C. Corrosion resistances of metallic materials in environments containing chloride ions: A review. Trans. Nonferrous Met. Soc. China 2022, 32, 377–410. [Google Scholar] [CrossRef] [Scilit]
  11. Yue, X.; Yang, Z.; Huang, L.; Zhang, L.; Li, J.; Xue, Z.; Pan, J. Passivation characteristics of ultra-thin 316L foil in NaCl solutions. J. Mater. Sci. Technol. 2022, 127, 192–205. [Google Scholar] [CrossRef] [Scilit]
  12. Racot, A.; Aubert, I.; Touzet, M.; Thiebaut, S.; Demesy, M. Statistical analysis of the pitting corrosion induced by potentiostatic pulse tests of wrought and SLM 316L stainless steels. Corros. Sci. 2022, 197, 110036. [Google Scholar] [CrossRef] [Scilit]
  13. Narayanan, D.; Martinez, A.; Martin, U.; Mansoor, B.; Case, R.; Castaneda, H. Localized corrosion in selective laser melted SS316L in CO2 and H2S brines at elevated temperatures. npj Mater. Degrad. 2024, 8, 50. [Google Scholar] [CrossRef] [Scilit]
  14. Narayanan, D.; Martinez, A.; Mansoor, B.; Karaman, I.; Castaneda, H. A comprehensive study of the influence of type of additive manufacturing technique and build orientation on the passivation and corrosion behavior of stainless steel 316L. Electrochim. Acta 2025, 522, 145942. [Google Scholar] [CrossRef] [Scilit]
  15. Goldsberry, R.; Narayanan, D.; Case, R.; Mansoor, B.; Castaneda, H. Effect of Temperature on Passive Film Characteristics of LPBF (Laser Powder-Bed Fusion) Processing on UNS-S31603. Materials 2024, 17, 3420. [Google Scholar] [CrossRef] [Scilit] [PubMed]
  16. Revilla, R.I.; Van Calster, M.; Raes, M.; Arroud, G.; Andreatta, F.; Pyl, L.; Guillaume, P.; De Graeve, I. Microstructure and corrosion behavior of 316L stainless steel prepared using different additive manufacturing methods: A comparative study bringing insights into the impact of microstructure on their passivity. Corros. Sci. 2020, 176, 108914. [Google Scholar] [CrossRef] [Scilit]
  17. Wang, Z.; Wu, Y.; Qiao, L.; Yan, Y. Decline in pitting corrosion resistance of 316 L stainless steel induced by Cr-depleted layer during tribocorrosion. npj Mater. Degrad. 2025, 9, 23. [Google Scholar] [CrossRef] [Scilit]
  18. Stendal, J.; Fergani, O.; Yamaguchi, H.; Espallargas, N. A Comparative Tribocorrosion Study of Additive Manufactured and Wrought 316L Stainless Steel in Simulated Body Fluids. J. Bio-Tribo-Corros. 2018, 4, 9. [Google Scholar] [CrossRef] [Scilit]
  19. Bao, Y.; Wu, J.; Ji, X. Tribocorrosion Performance of Additively Manufactured 316L Stainless Steel in 3.5% NaCl Solution. J. Tribol. 2026, 148, 034202. [Google Scholar] [CrossRef] [Scilit]
  20. Rzeszotarska, M.; Zasada, D.; Płociński, T.; Stępniowski, W.J.; Polański, M. On the Influence of Manufacturing Parameters on the Microstructure, Mechanical Properties and Corrosion Resistance of AISI 316L Steel Deposited by Laser Engineered Net Shaping (LENS®). Materials 2023, 16, 1965. [Google Scholar] [CrossRef] [Scilit]
  21. Balhara, H.; Botcha, B.; Wolff, S.J.; Bukkapatnam, S.T.S. Ripple formations determine the heterogeneous microstructure of directed energy deposition (DED)-printed 316L components. Mater. Des. 2023, 227, 111756. [Google Scholar] [CrossRef] [Scilit]
  22. ASTM G106-89; Standard Practice for Verification of Algorithm and Equipment for Electrochemical Impedance Measurements. ASTM International: West Conshohocken, PA, USA, 2015. [CrossRef] [Scilit]
  23. ASTM G61-86; Standard Test Method for Conducting Cyclic Potentiodynamic Polarization Measurements for Localized Corrosion Susceptibility of Iron-, Nickel-, or Cobalt-Based Alloys. ASTM International: West Conshohocken, PA, USA, 2018. [CrossRef] [Scilit]
  24. Zheng, B.; Haley, J.; Yang, N.; Yee, J.; Terrassa, K.; Zhou, Y.; Lavernia, E.; Schoenung, J. On the evolution of microstructure and defect control in 316L SS components fabricated via directed energy deposition. Mater. Sci. Eng. A 2019, 764, 138243. [Google Scholar] [CrossRef] [Scilit]
  25. Yazar, K.U.; Pawar, S.; Park, K.S.; Choi, S.H. Effect of process parameters on the clad morphology, microstructure, microtexture, and hardness of single layer 316 L stainless steel during direct energy deposition. Mater. Charact. 2022, 191, 112148. [Google Scholar] [CrossRef] [Scilit]
  26. Vallejo, N.D.; Lucas, C.; Ayers, N.; Graydon, K.; Hyer, H.; Sohn, Y. Process Optimization and Microstructure Analysis to Understand Laser Powder Bed Fusion of 316L Stainless Steel. Metals 2021, 11, 832. [Google Scholar] [CrossRef] [Scilit]
  27. Narayanan, D.; Chen, L.; Mansoor, B.; Castaneda, H. A new insight into pitting initiation in selective laser melted 316L stainless steel. Mater. Lett. 2023, 333, 133562. [Google Scholar] [CrossRef] [Scilit]
  28. Lodhi, M.J.K.; Deen, K.M.; Greenlee-Wacker, M.C.; Haider, W. Additively manufactured 316L stainless steel with improved corrosion resistance and biological response for biomedical applications. Addit. Manuf. 2019, 27, 8–19. [Google Scholar] [CrossRef] [Scilit]
  29. Yue, X.; Zhang, L.; Hua, Y.; Wang, J.; Dong, N.; Li, X.; Xu, S.; Neville, A. Revealing the superior corrosion protection of the passive film on selective laser melted 316L SS in a phosphate-buffered saline solution. Appl. Surf. Sci. 2020, 529, 147170. [Google Scholar] [CrossRef] [Scilit]
  30. Karimi, S.; Nickchi, T.; Alfantazi, A. Effects of bovine serum albumin on the corrosion behaviour of AISI 316L, Co–28Cr–6Mo, and Ti–6Al–4V alloys in phosphate buffered saline solutions. Corros. Sci. 2011, 53, 3262–3272. [Google Scholar] [CrossRef] [Scilit]
  31. Narayanan, D.; Truong, T.D.; Martin, U.; Andani, M.T.; Castaneda, H. Evaluation of the corrosion behavior of laser powder bed fusion (L-PBF) stainless steel 316 L in a simulated synovial fluid under inflammatory conditions. Materialia 2025, 42, 102499. [Google Scholar] [CrossRef] [Scilit]
  32. Zhao, X.; Jia, D.; Wei, S.; Gao, Y.; Liu, H. Investigation of tribo-corrosion behaviors of SLM-printed CX stainless steel under different loads. J. Mater. Res. Technol. 2024, 30, 5266–5277. [Google Scholar] [CrossRef] [Scilit]
  33. Tan, L.; Wang, Z.; Ma, Y.; Yan, Y.; Qiao, L. Tribocorrosion investigation of 316L stainless steel: The synergistic effect between chloride ion and sulfate ion. Mater. Res. Express 2021, 8, 086501. [Google Scholar] [CrossRef] [Scilit]
  34. Li, Z.; Geng, M.; Wang, J.; Wen, L.; Ai, Y.; Sun, D. Synergy analysis of tribocorrosion behaviour of aluminum alloy under different hydrostatic pressures. J. Mater. Res. Technol. 2024, 33, 6949–6957. [Google Scholar] [CrossRef] [Scilit]
  35. Carquigny, S.; Takadoum, J.; Ivanescu, S. Corrosion and tribocorrosion study of 316L steel, Ti–6Al–4V and Ti–10Zr–10Nb–5Ta. Tribol.-Mater. Surf. Interfaces 2019, 13, 112–119. [Google Scholar] [CrossRef] [Scilit]
  36. Ruggiero, A.; De Stefano, M. Experimental investigation on the bio-tribocorrosive behavior of Ti6Al4V alloy and 316 L stainless steel in two biological solutions. Tribol. Int. 2023, 190, 109033. [Google Scholar] [CrossRef] [Scilit]
  37. Yazdi, R.; Ghasemi, H.M.; Abedini, M.; Wang, C.; Neville, A. Tribocorrosion behaviour of Ti6Al4V under various normal loads in phosphate buffered saline solution. Trans. Nonferrous Met. Soc. China 2020, 30, 1300–1314. [Google Scholar] [CrossRef] [Scilit]
  38. Taufiqurrakhman, M.; Bryant, M.G.; Neville, A. Tribofilms on CoCrMo alloys: Understanding the role of the lubricant. Biotribology 2019, 19, 100104. [Google Scholar] [CrossRef] [Scilit]
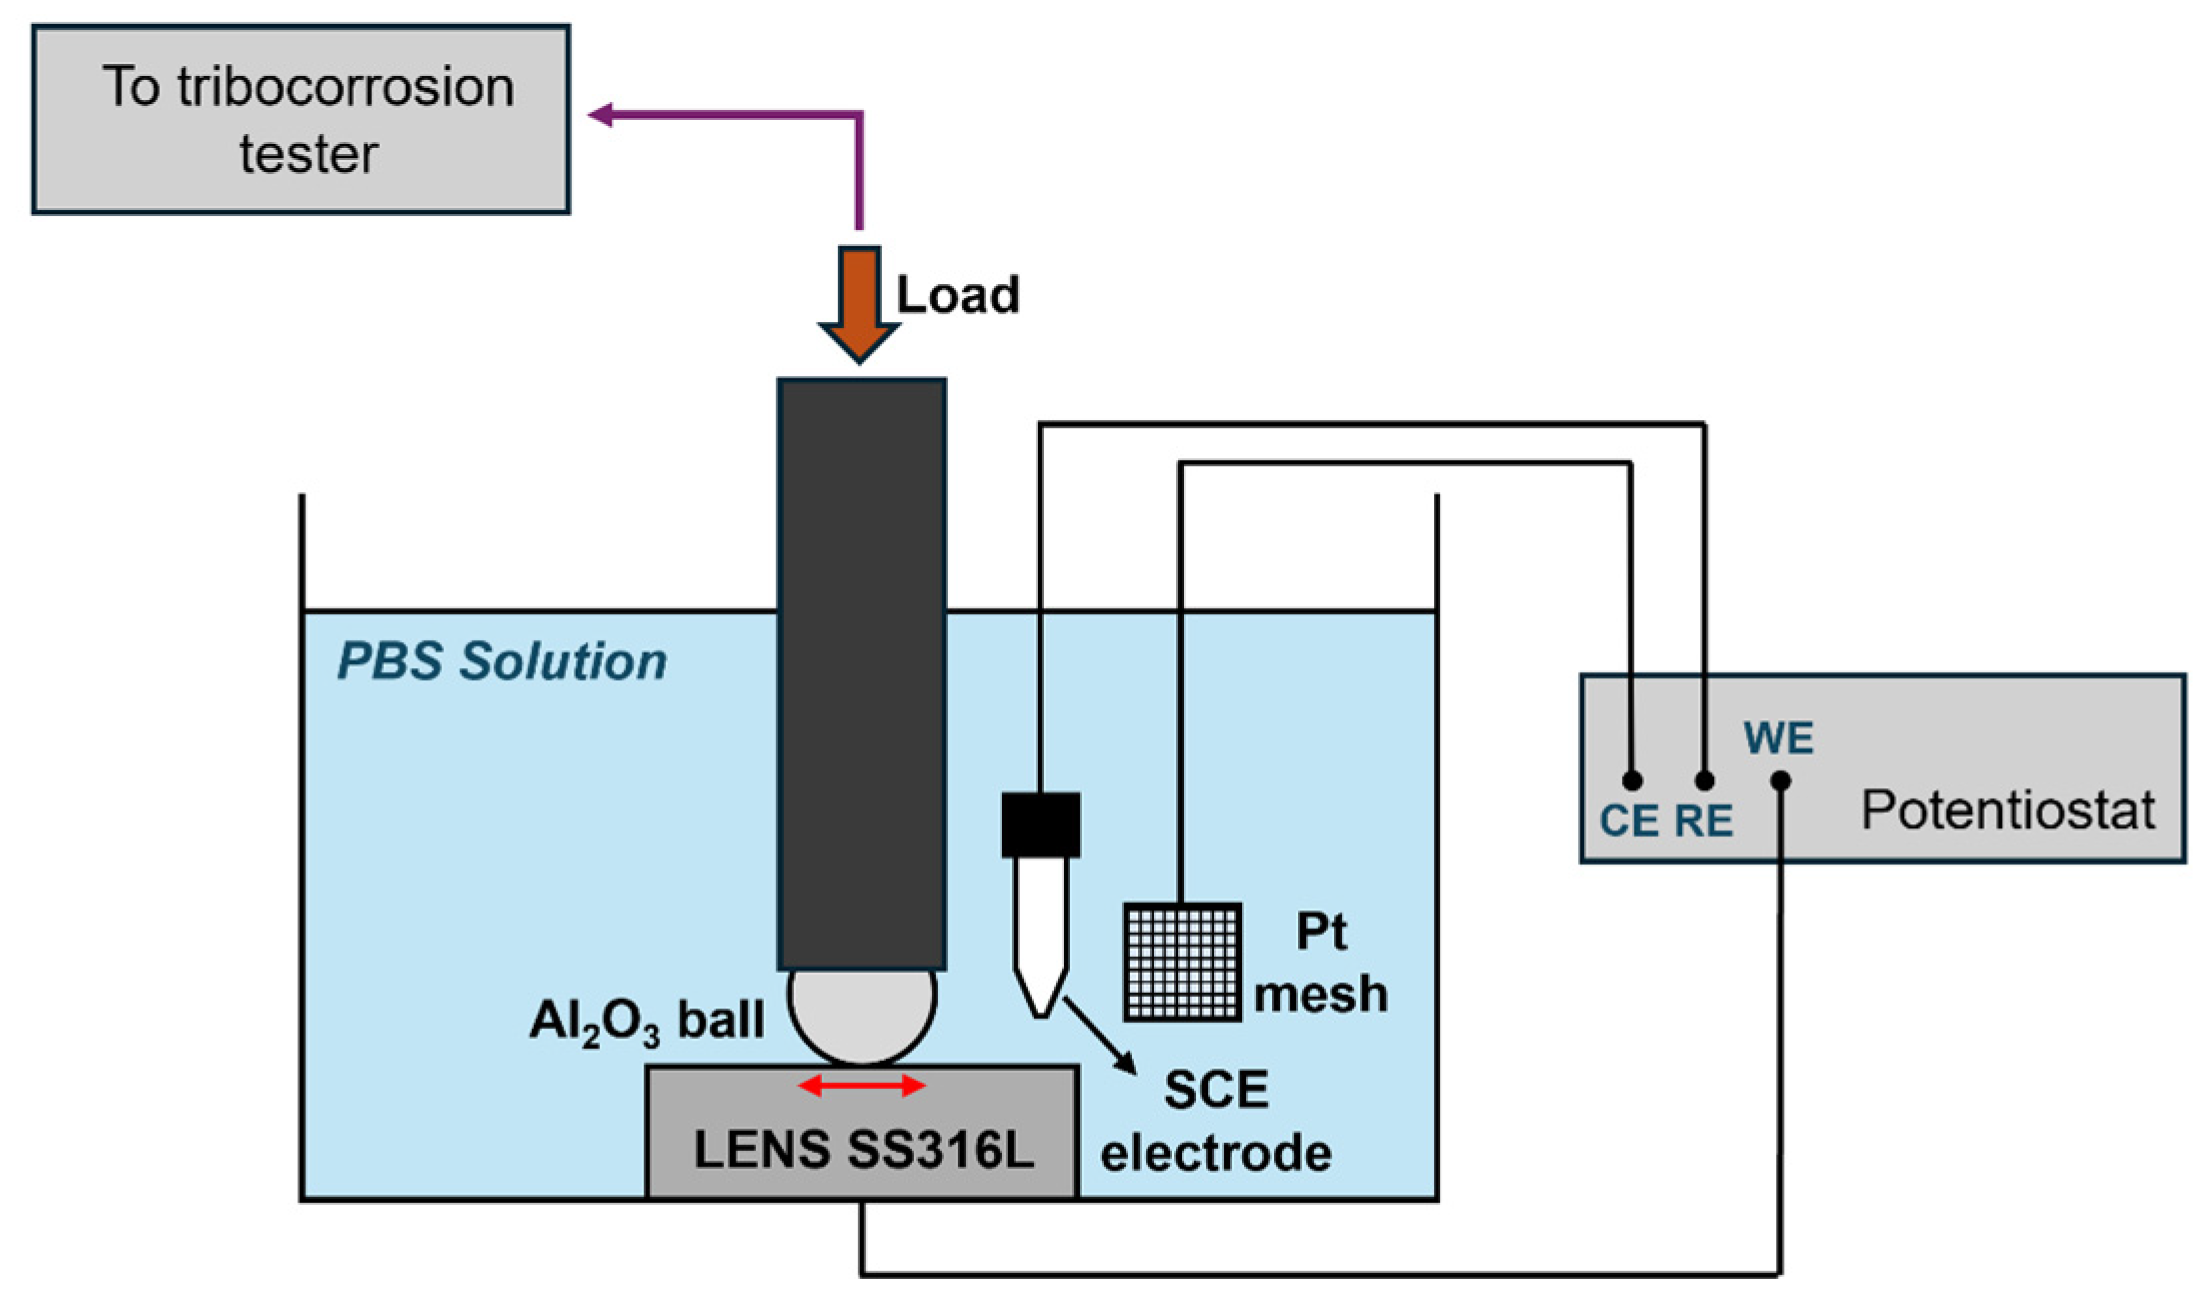
Figure 1. Tribocorrosion experimental setup used in this study.
Cmd 07 00030 g001
Figure 2. SEM micrographs showing the various features developed on (a,b) S10 and (c,d) S15 with (c-1) showing a magnified image of the defects observed near the scan track boundaries.
Cmd 07 00030 g002
Figure 3. SEM-EDS line-scans showing the evolution of Fe, Cr and Mo across cells and cell boundaries in (a) S10 and (b) S15.
Cmd 07 00030 g003
Figure 4. (a) Bode and (b) Nyquist plots (inset: electrical circuit used to fit the data) showing the passivation behavior of LENS SS316L manufactured using two different scan speeds in the PBS solution.
Cmd 07 00030 g004
Figure 5. Cyclic potentiodynamic polarization (CPP) scans of the S10 and S15 samples in PBS solution.
Cmd 07 00030 g005
Figure 6. Comparison of (a) measured potential and (b) coefficient of friction (COF, shown by the solid lines) and current density (shown by the dashed lines) during sliding under passive conditions for the S10 and S15 samples.
Cmd 07 00030 g006
Figure 7. SEM images showing the pits formed on (a) S10 and (b) S15 samples after the CPP tests: (a-1,a-2) pit morphologies and (a-3) cell interior dissolution in S10; (b-1,b-2) pits formed at the defects and (b-3) evidence of cell interior dissolution in S15.
Cmd 07 00030 g007
Figure 8. OM images of the worn areas at the end of the tribocorrosion testing in the PBS solution: (a,c) Ecath and (b,d) Epass for the S10 and S15 samples.
Cmd 07 00030 g008
Figure 9. SEM images of features observed in the wear tracks of the (a,b) S10 and (c,d) S15 samples.
Cmd 07 00030 g009
Figure 10. Summary of passivation under pure corrosion and tribocorrosion conditions for S10 and S15.
Cmd 07 00030 g010
Table 1. EIS fitting parameters for S10 and S15 in the PBS solution.
SampleRs
(Ω cm2)
Rct
(kΩ cm2)
Qct (×10−6)
(S−1 cm−2 sn)
nctχ2 (×10−3)
S1024.1 ± 0.83675.4 ± 56.4 70.13 ± 3.40.83 ± 0.011.45
S1521.7 ± 0.81227.2 ± 24.698.13 ± 4.50.82 ± 0.010.37
Table 2. Electrochemical parameters obtained from the CPP results.
SamplesElectrochemical Results
(V vs. SCE)
Ecorr
(mV vs. SCE)
Eb
(mV vs. SCE)
Erep
(mV vs. SCE)
icorr
(nA/cm2)
ipass
(μA/cm2)
S10−260.6 ± 19852.5 ± 18−165.5 ± 35347 ± 453.05 ± 0.98
S15−267.3 ± 25968.6 ± 16−224.3 ± 27339 ± 213.03 ± 0.75
Table 3. Summary of wear scar dimensions resulting from tribocorrosion testing of samples S10 and S15 in the PBS solution.
SamplesPotential TestedWidth (µm)Depth (µm)
S10Ecath170 ± 73 ± 0.9
Epass190 ± 113.3 ± 0.7
S15Ecath150 ± 103.6 ± 0.2
Epass180 ± 83.9 ± 0.5
Table 4. Tribocorrosion parameters obtained for samples S10 and S15 in the PBS solution.
SamplesVw
(10−3 mm3)
Vt
(10−3 mm3)
Vc
(10−3 mm3)
ΔVs
(Vt − Vw − Vc)
(10−3 mm3)
Vw-c
(10−3 mm3)
Vc-w
Vs − Vw-c)
(10−3 mm3)
S103.4 ± 0.144.1 ± 0.120.041 ± 0.0010.659 ± 0.20.151 ± 0.050.508 ± 0.21
S153.6 ± 0.284.7 ± 0.30.040 ± 0.0011.06 ± 0.40.105 ± 0.030.955 ± 0.4
Table 5. EDS results from area maps of tribofilms from the SEM images obtained for S10 and S15.
Elements
(wt%)
Sample S10Sample S15
Figure 9aFigure 9bFigure 9cFigure 9d
Fe59.5259.560.3961.06
Cr17.4717.1317.4917.78
Ni11.0911.1411.1611.36
Mo2.021.971.991.99
Mn0.970.920.940.94
O7.287.526.215.34
P1.111.161.261.09
Cl0.120.10.110.11
Na0.420.560.450.33
Disclaimer/Publisher’s Note: The statements, opinions and data contained in all publications are solely those of the individual author(s) and contributor(s) and not of MDPI and/or the editor(s). MDPI and/or the editor(s) disclaim responsibility for any injury to people or property resulting from any ideas, methods, instructions or products referred to in the content.