Article

In-Situ Evaluation of the Protectivity of Coatings Applied to Metal Cultural Artefacts Using Non-Destructive Electrochemical Measurements

1
Department of Engineering, University of Northampton, Northampton NN1 5PH, UK
2
National Maritime Museum, ul. Olowianka 9-13, 80-751 Gdańsk, Poland
3
Department of Polymer Technology, Gdańsk University of Technology, 11/12 Gabriela Narutowicza Street, 80-233 Gdańsk, Poland
*
Author to whom correspondence should be addressed.
Corros. Mater. Degrad. 2021, 2(1), 120-132; https://doi.org/10.3390/cmd2010007
Submission received: 18 December 2020 / Revised: 24 February 2021 / Accepted: 3 March 2021 / Published: 9 March 2021
(This article belongs to the Special Issue Cultural Heritage Materials Degradation and Its Prevention)

Abstract

:
Electrochemical Noise Measurement (ENM) and DC electrolytic resistance measurement (ERM) can be used to assess the level of protectiveness provided by an organic coating (paint or varnish) to the underlying metal. These techniques also have applicability to the thinner, transparent type of coatings used to protect archaeological artefacts. Two studies are presented here demonstrating how ERM and ENM techniques can be applied in artefact preservation. The similarity of the techniques, both of which are a measure of resistance, means results can be considered to be analogous. The first study investigated the use of ERM to determine the protection levels provided by typical coatings in order to develop a database of coating type and application for objects, for specific environments. The second study used ENM to evaluate coatings which had been applied to historic artefacts recovered from shipwrecks in the Baltic Sea and displayed inside the museum or kept in the museum store area. The studies showed the usefulness of both techniques for determining the level of protection of a coating and how a better performing coating can be specified if a pre-existing coating on an artefact has been found to be unsuitable.

1. Introduction

Metal archaeological objects need application of a varnish type protective coating to protect them from further corrosion during storage and/or display in the museum. The criteria for selecting a coating to be applied to an archaeological object differ from those for coatings for typical industrial application. A coating for protecting archaeological items needs to fulfil several requirements including being as invisible as possible, the ability to remove the coating easily, respect for the original material of the artefact as well as lasting protectivity and easy maintenance. A challenge which affects the strippability and adhesion is the presence on the metal object of corrosion product layers (sometimes 10 s or 100 s of microns in thickness) which may need to be preserved as part of the historical and informative value of the object [1,2]. Typically, these coatings are applied by brush and sometimes by spray. They are often based on wax e.g., paraffin wax although more specific acrylic types (the Paraloid series) are also used. The thickness of the coating is very important to the protection afforded but normally conservators and applicators are not aware as to how thick the coatings are after application to real objects. Additionally, users have no way of discovering the optimum number of coats; or of monitoring the performance of the coating in service. A numerical assessment method is required. The work described in this paper looks at developing such a method.
Electrochemical methods are used in conservation field mainly for the purposes of removing corrosion layers or dechlorination treatments of metallic objects [3]. However, recently some attention has been drawn to the employment of electrochemical methods in evaluation of protective coatings used in cultural heritage [4,5]. Non-intrusive electrochemical (EC) techniques like electrochemical noise measurement (ENM) and also electrochemical impedance measurement (EIS) have become available to measure the extent to which a specific coated cultural artefact made of metal had degraded due to corrosion when exposed to an external environment [6]. This was the Toku sculpture in Canberra. This large object (10 m high), made from steel had had an “arty” but, as it turned out, non-protective paint coating applied before erection. The environment was more severe than expected and there were corrosion problems evident within two years. The inadequateness of the coating system was confirmed by using solid state probes with pseudo reference electrodes based on platinized copper in conjunction with portable (EIS) and (ENM) equipment. That work showed how these techniques can be taken out onto site to make in situ measurements. A similar approach enabling in situ measurements was performed by Simone Corbellini et al. [7]. These authors developed two approaches using dry and gel-based electrodes with a portable Electrochemical Impedance Spectroscopy system in order to assess the state of protective coatings on metal artefacts. Following laboratory research, the gel-based electrodes were applied for monitoring of the iron chains of the Amiens Cathedral in the north of France. These electrodes enabled differentiation between the different protectivity of corrosion layers and indicated risky areas due to porous layers [7]. Another useful method, although mainly used in the laboratory, is the measurement of DC electrolytic resistance method ERM). This is a variation of the original technique used by Bacon, Smith and Rugg, who assessed 300 paint systems and came to the conclusion that the best parameter for assessing their protectivity was the electrolytic resistance [8]. They showed that for steels in sea water when coating resistance was greater than log R = 8 (R = 108 Ω), good protection was obtained. On the contrary, resistance values lower than log R = 6 (R = 106 Ω) indicated poor protection. The explanation normally given is that the ionic mobility within the coating is related to the ease with which corrosive constituents pass through the coating to the metal substrate in the presence of an electrolyte. Another parallel explanation is that the coating imparts a high DC resistance between and anodes and cathodes. Work has shown [9] that the value of the main parameter derived from Electrochemical Noise Measurement (viz Rn) is close to or the same as the DC resistance value. Hence the results from using the two techniques can be considered analogous, ERM being more applicable in lab situations and ENM in field situations.
The first study in this work used ERM to assess a set of coatings applied in the museum in the typical way that it is done in practice, viz by brush. Previous work [10] had applied similar coatings to steel and copper laboratory samples using a KBar and by dipping.
In the first study four different polymer coatings typically used by the National Maritime Museum for the protection of objects recovered from sea water immersion were investigated both on steel Q panels and on pure copper using ERM in a laboratory situation. In the second study, the electrochemical noise method (ENM) was used to assess coatings on actual archaeological objects in the museum.

2. Materials and Methods

2.1. Experimental

The following types of coating were investigated:
  • Paraloid B44 (based on an acrylic polymer)—10% solution in ethanol
  • Paraloid B82 (based on an acrylic polymer)—10% solution in acetone
  • Winacet (based on polyvinyl acetate)—10% solution in toluene
  • McKenic (based on an acrylic polymer)—10% solution in toluene
Note that all these coatings are thermoplastic and can be removed easily by application of the appropriate solvent (given above). Further detail can be found [11].
The coatings were applied onto steel Q panels and onto copper panels by brush. Single and double layers systems were examined. The resistance measurement system (ERM) is presented in Figure 1.
A drop of diluted Harrison’s solution (DHS: 0.35% ammonium sulphate and 0.05% sodium chloride by weight) was placed on the sample surface with a pipette. The area under the drop was typically 2 cm2 and the temperature 20 °C. A Calomel reference electrode (SCE = +0.241 V versus SHE) was immersed in the drop. The steel or copper sample and the electrode were connected to the high impedance Electrometer which enables the reading of the resistance of the coated area under the drop of solution. Note that the Keithley DC Electrometer, when operated correctly to measure resistance, ensures that the minimum current (and hence minimum voltage across the sample) is used to obtain a reading (normally less than 100 mV). This minimizes the intrusiveness of the measurement. The DC resistances and the thicknesses were measured in three different areas of each sample using a Defelsko Positest instrument DFT gauge range 0–500 µm, precision ±3%. Further detail can be found in Reference [11].

2.2. Results

2.2.1. Thickness of Coatings

The values given in Table 1 and in Table 2 are the averages of the three readings. Normally the spread in thickness values was low i.e., ±25%. These thickness results are discussed further in reference [11]. However, it is apparent from the results for Winacet and the McKenic coatings, where the 2-layer coatings are not consistently thicker than the 1-layer coatings, how difficult it is to apply a controlled amount of coating in uniform fashion by brushing and how necessary it is to check the coating thickness after application.

2.2.2. Surface Images

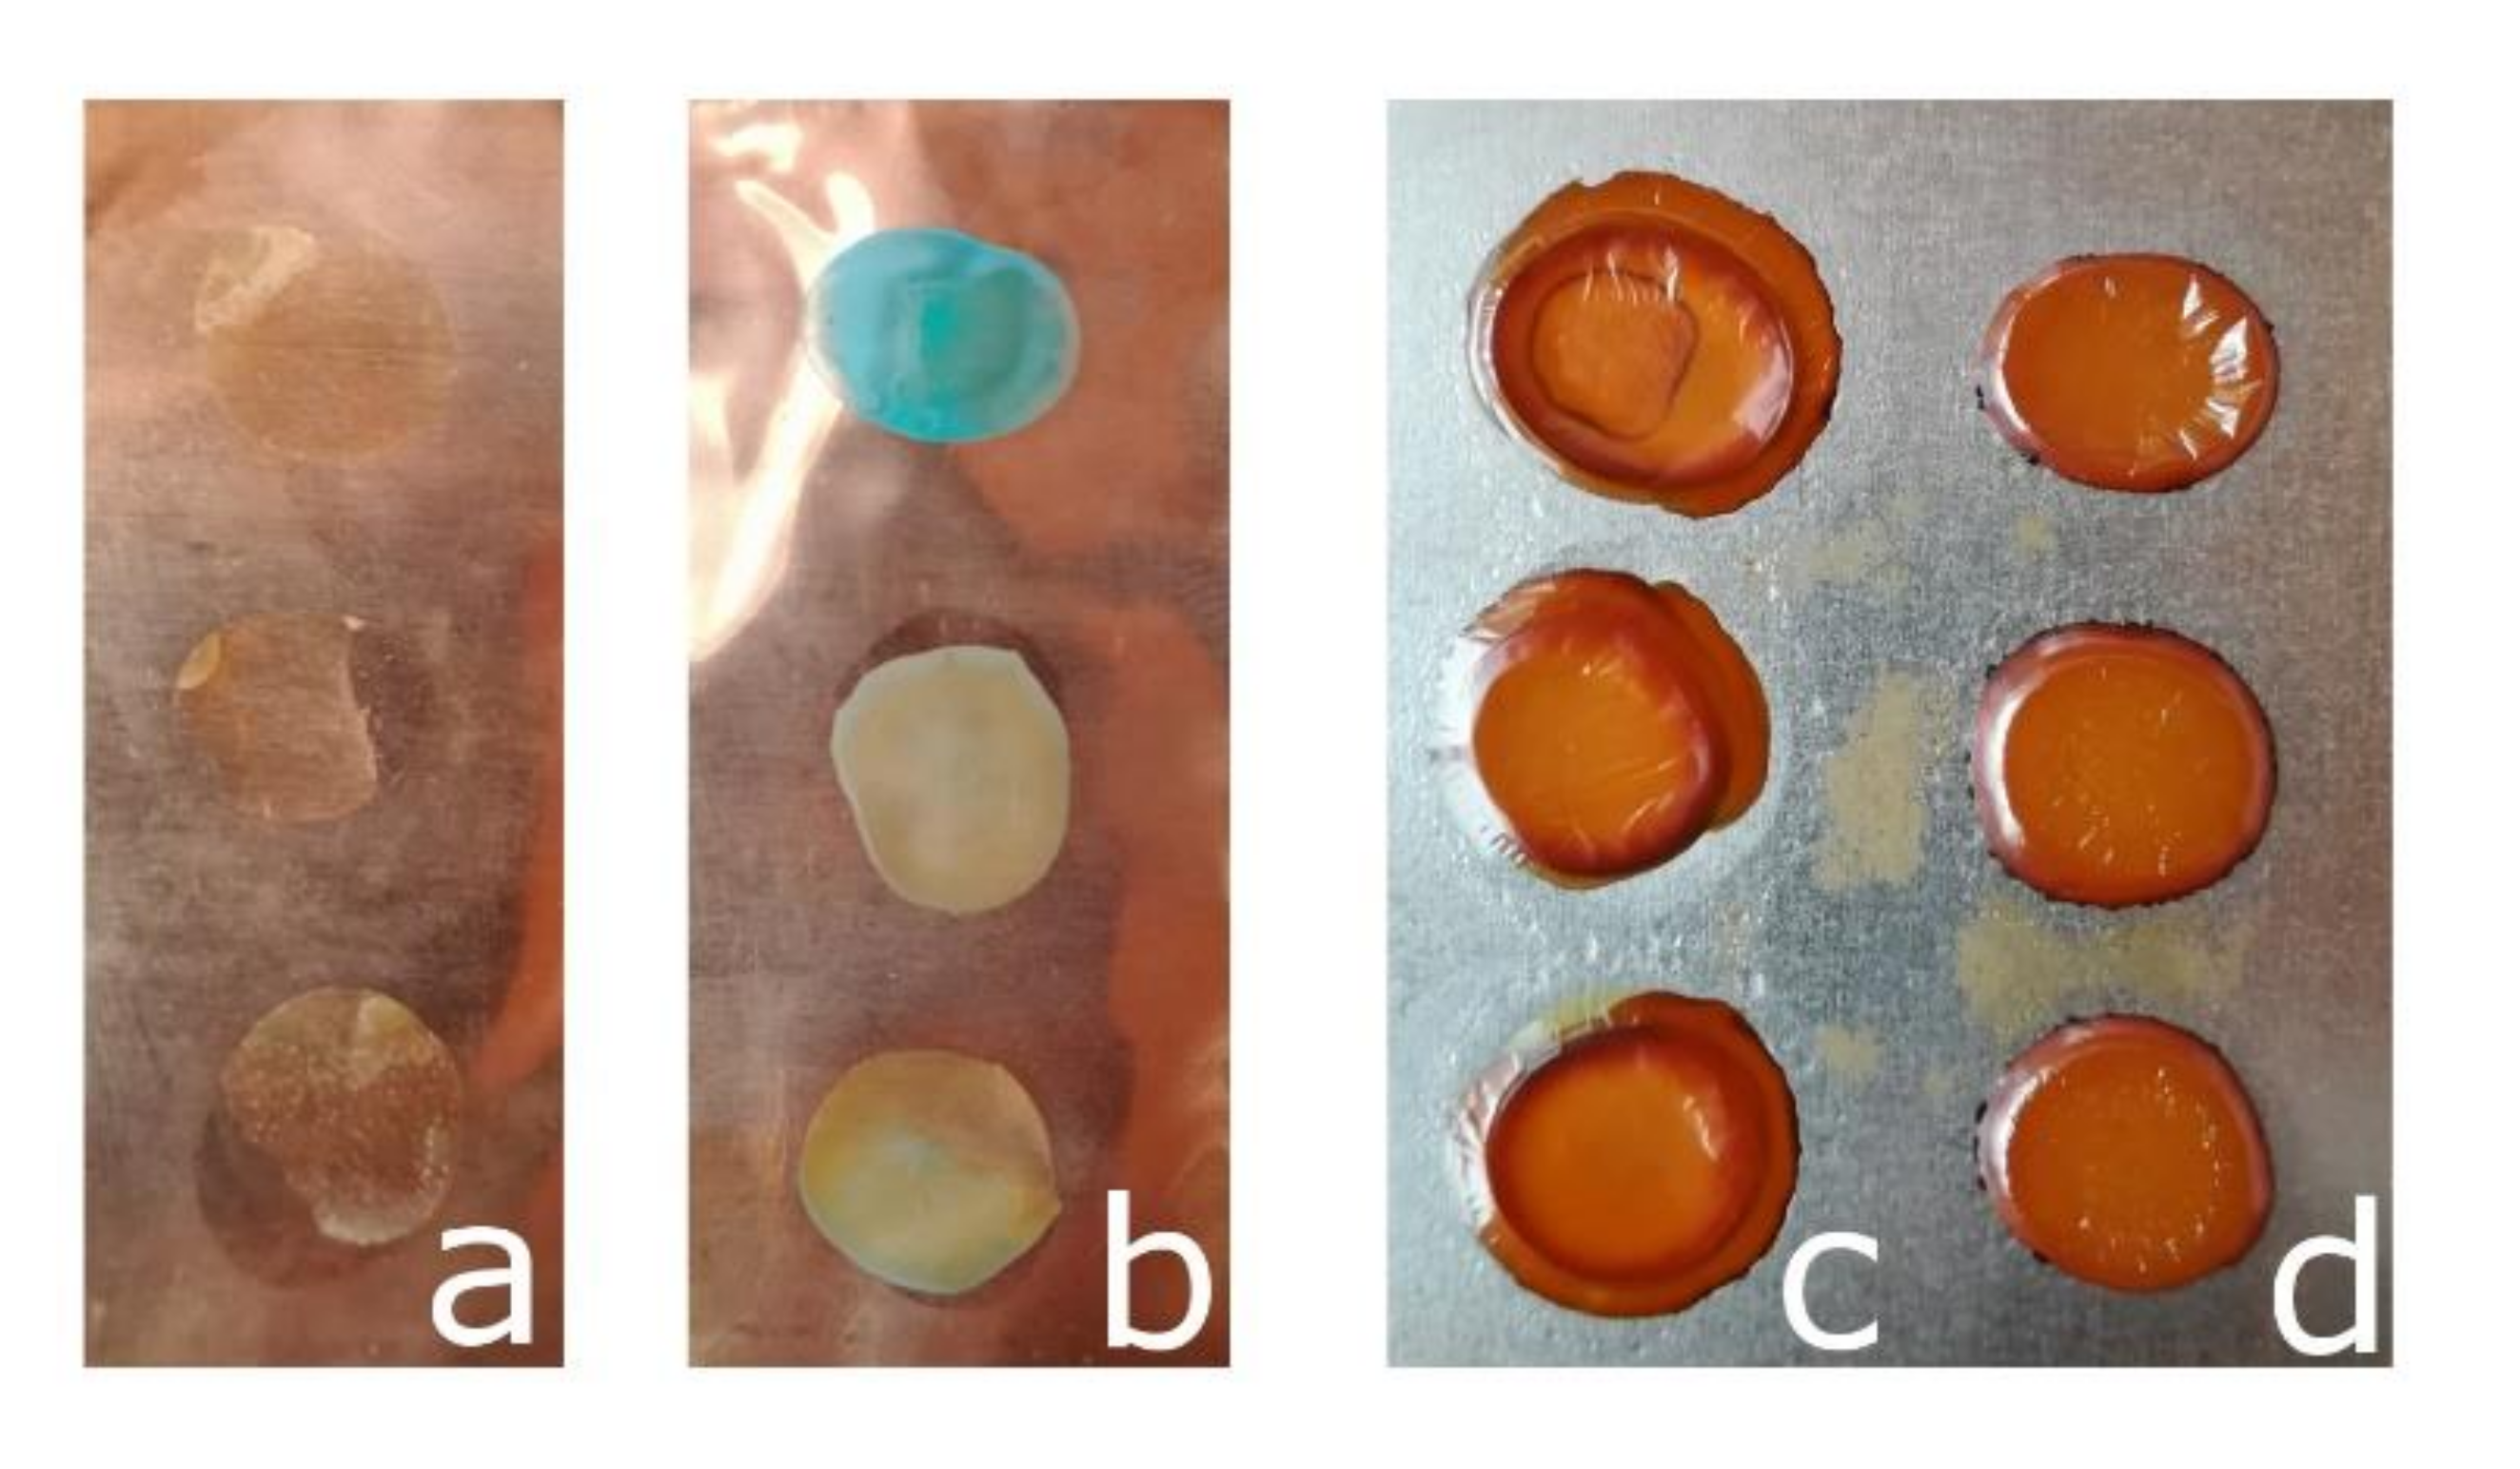
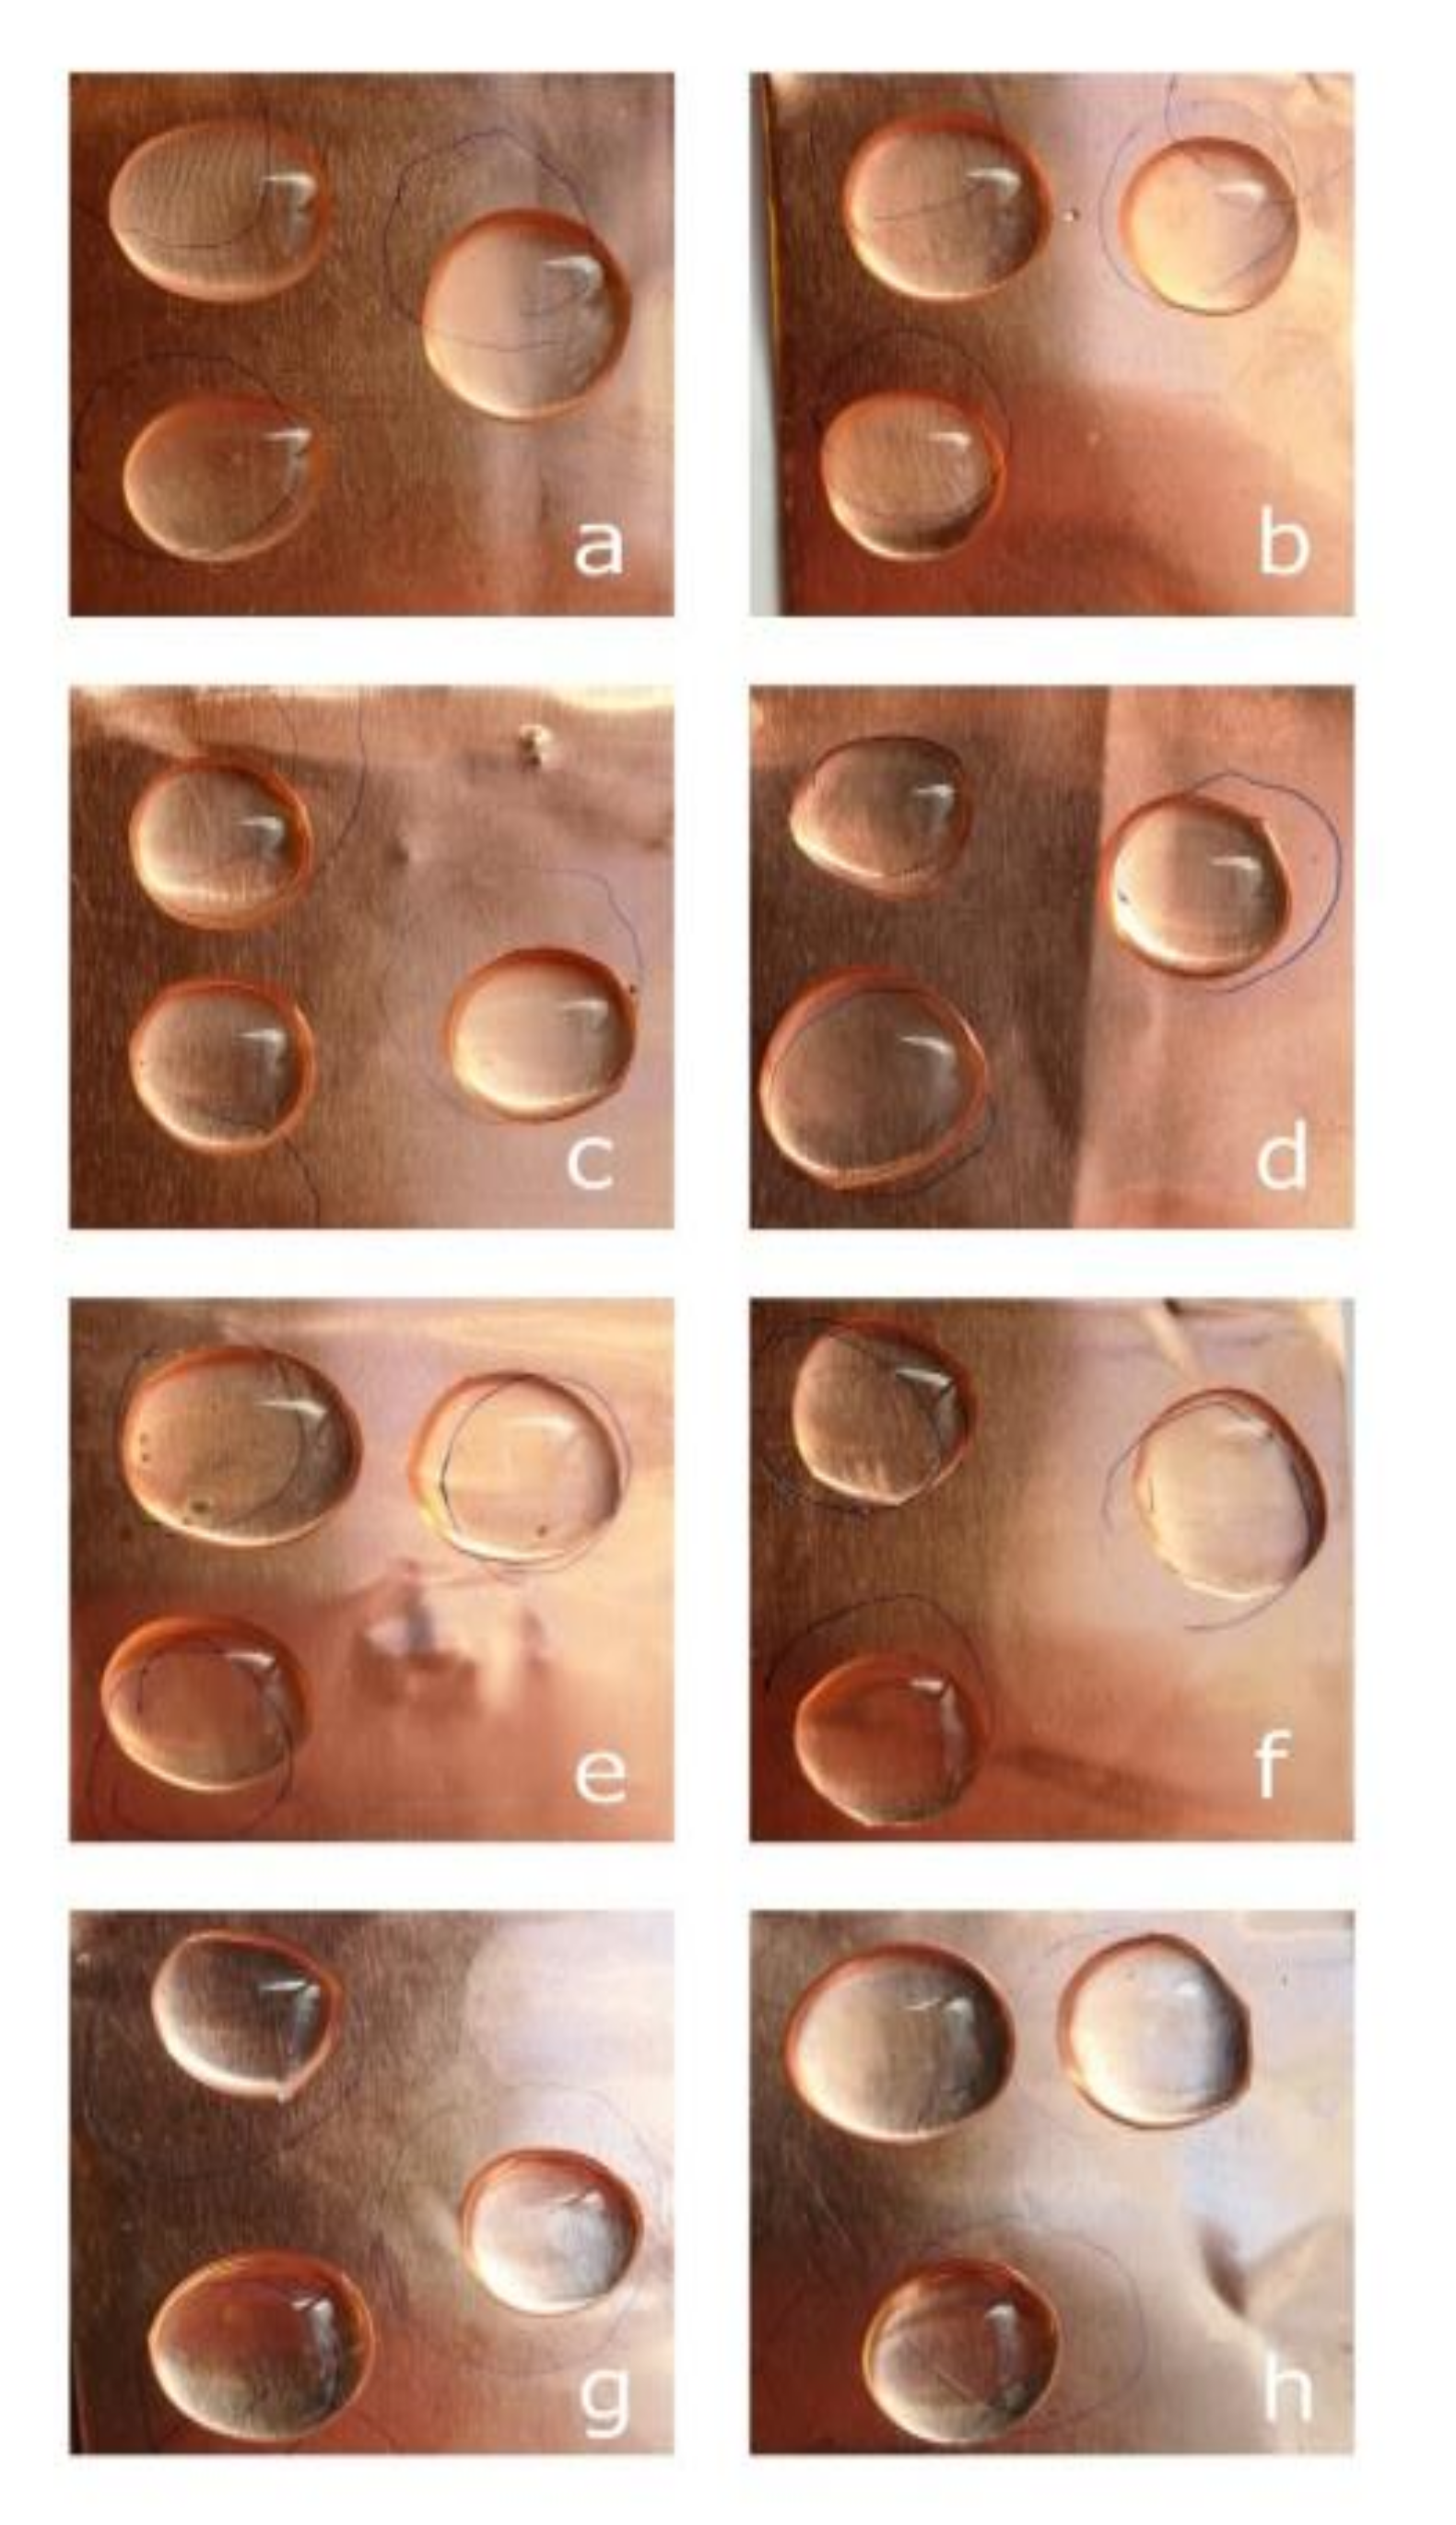
The surfaces were photographed after exposure to the solutions as described in Section 2.1, with the images categorized into three sections. Figure 2 shows the amount of corrosion observed on reference steel and reference copper samples with no coating on (a) copper after 24 h exposure to 0.05% NaCl, (b) copper after 24 h exposure to diluted Harrison’s solution, (c) steel after 24 h exposure to 0.05% NaCl, (d) steel after 24 h exposure to diluted Harrison’s solution. Figure 3 and Figure 4 present corrosion of steel and copper substrates respectively, with the four different polymer coatings applied, after 24 h exposure to diluted Harrison’s solution. Figure 3 shows visible corrosion of the substrate however Figure 4 shows faint to no visible corrosion.

2.2.3. ERM Measurements

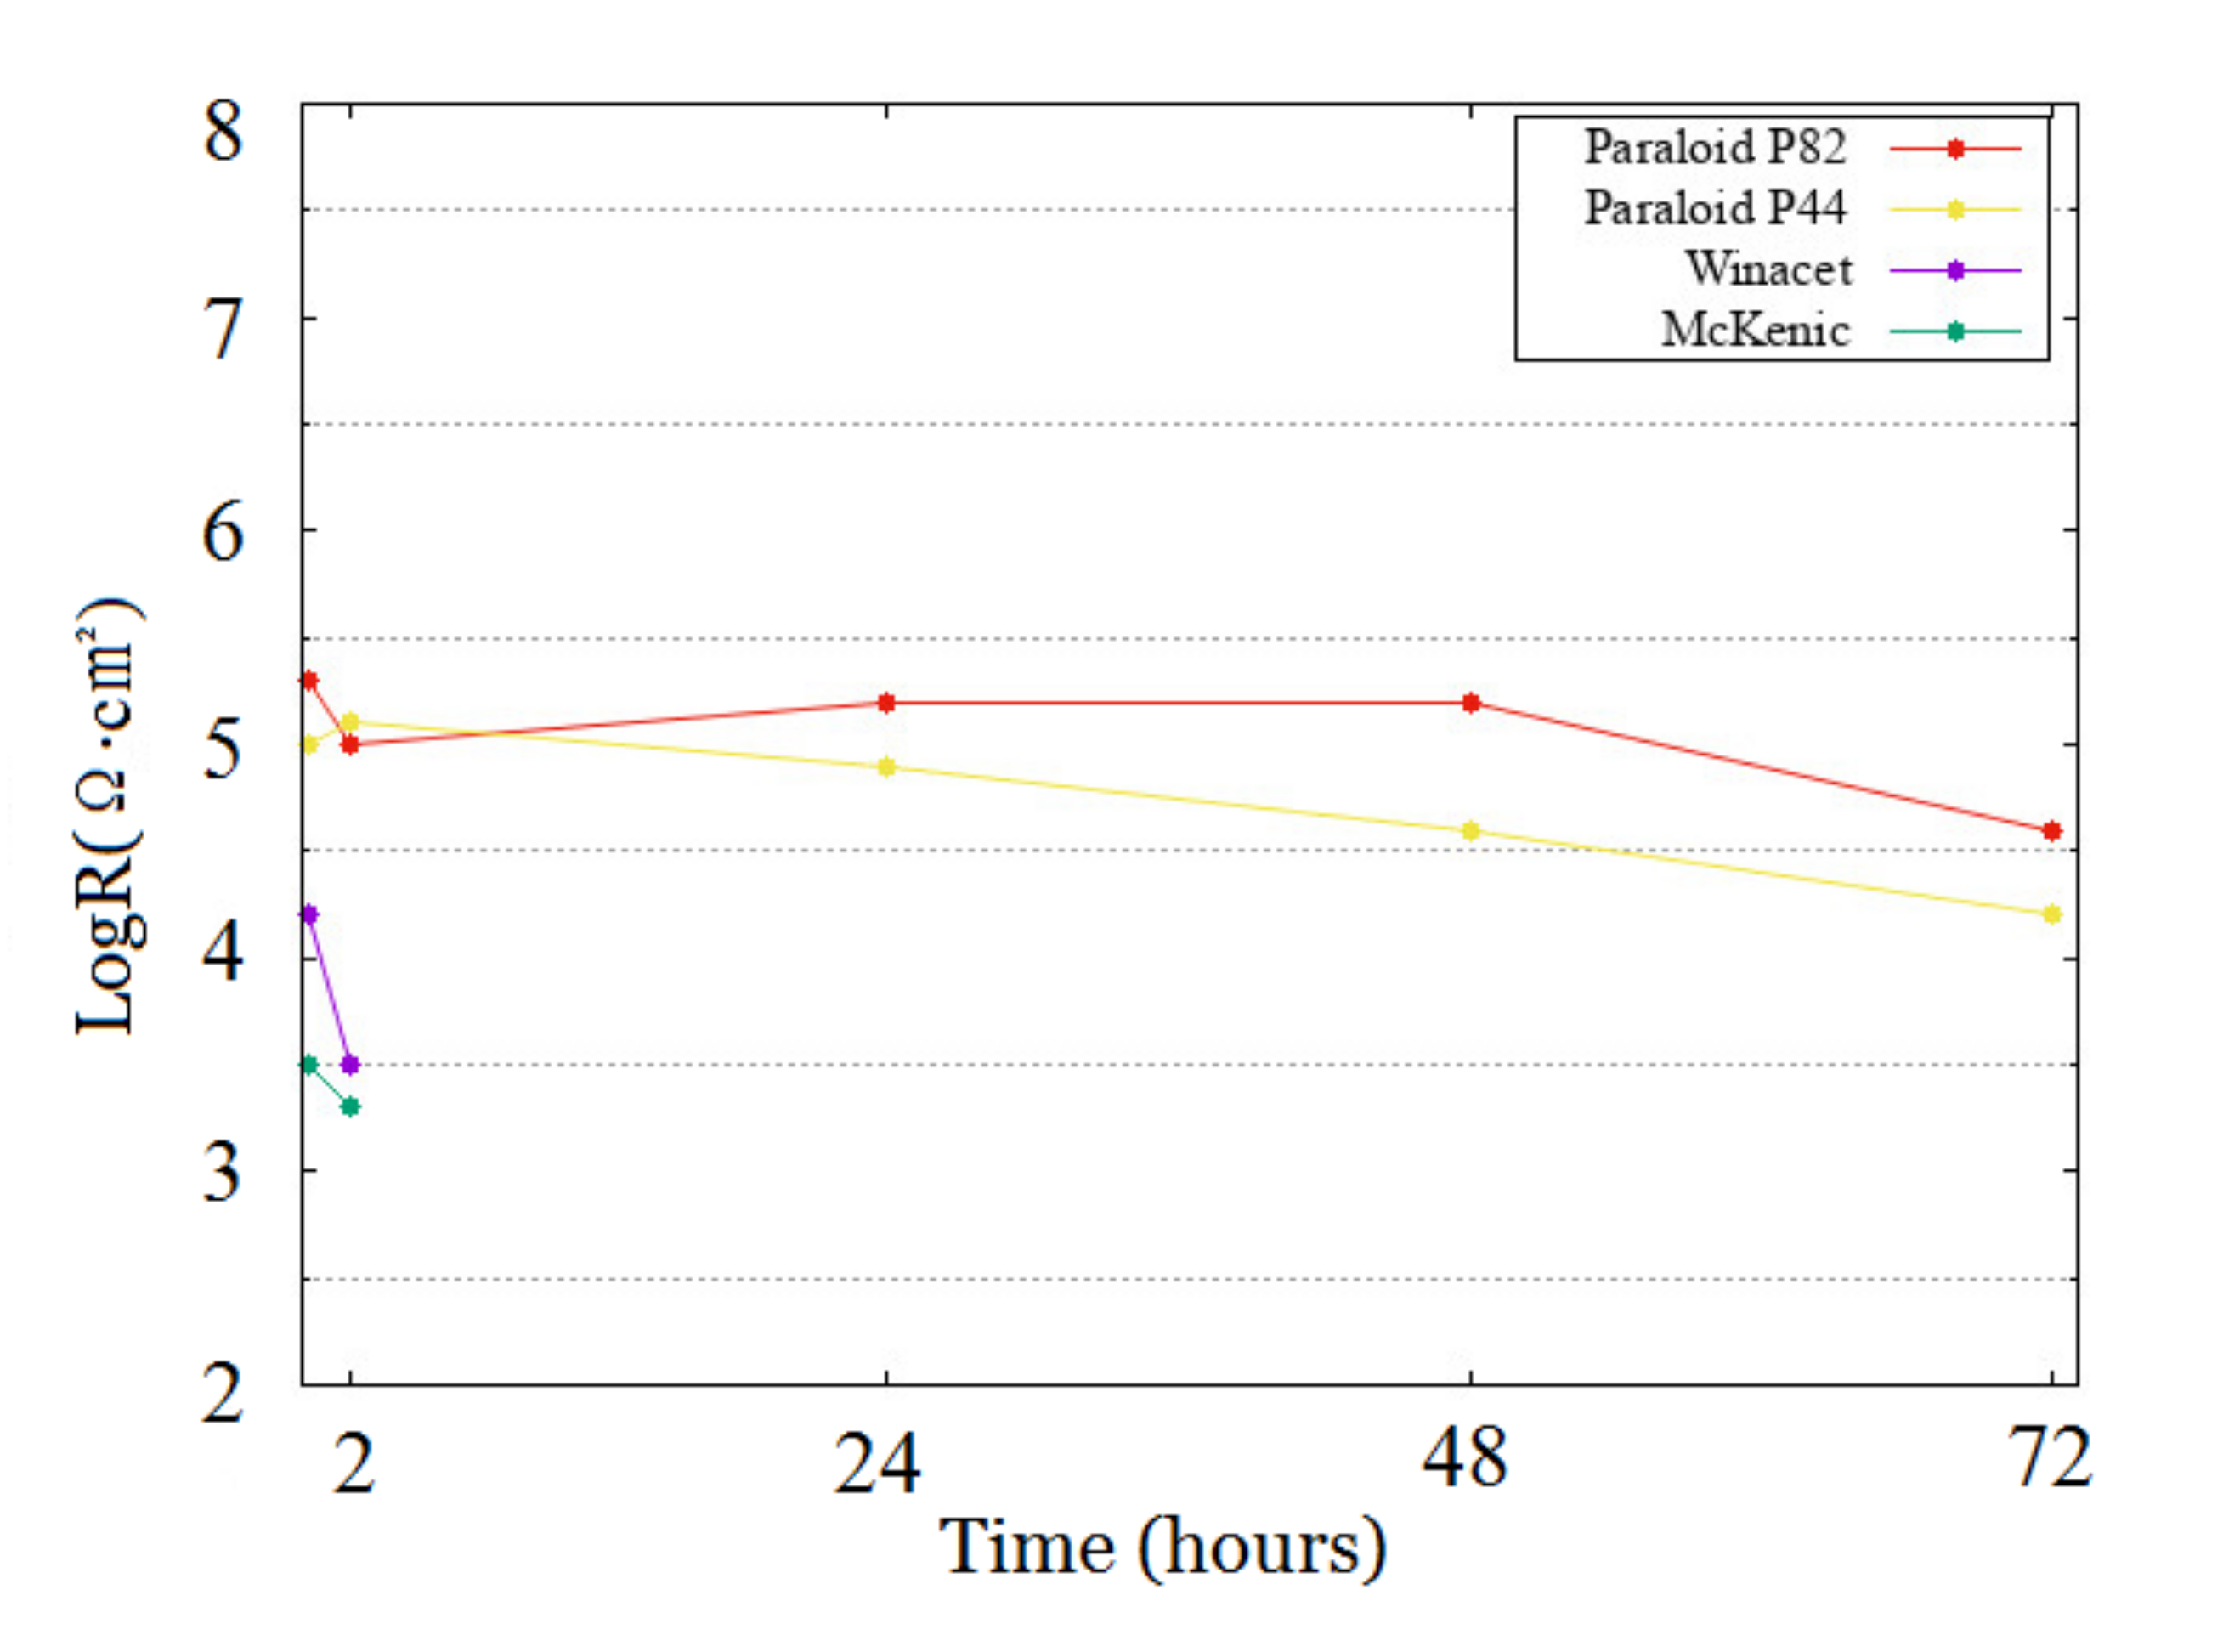
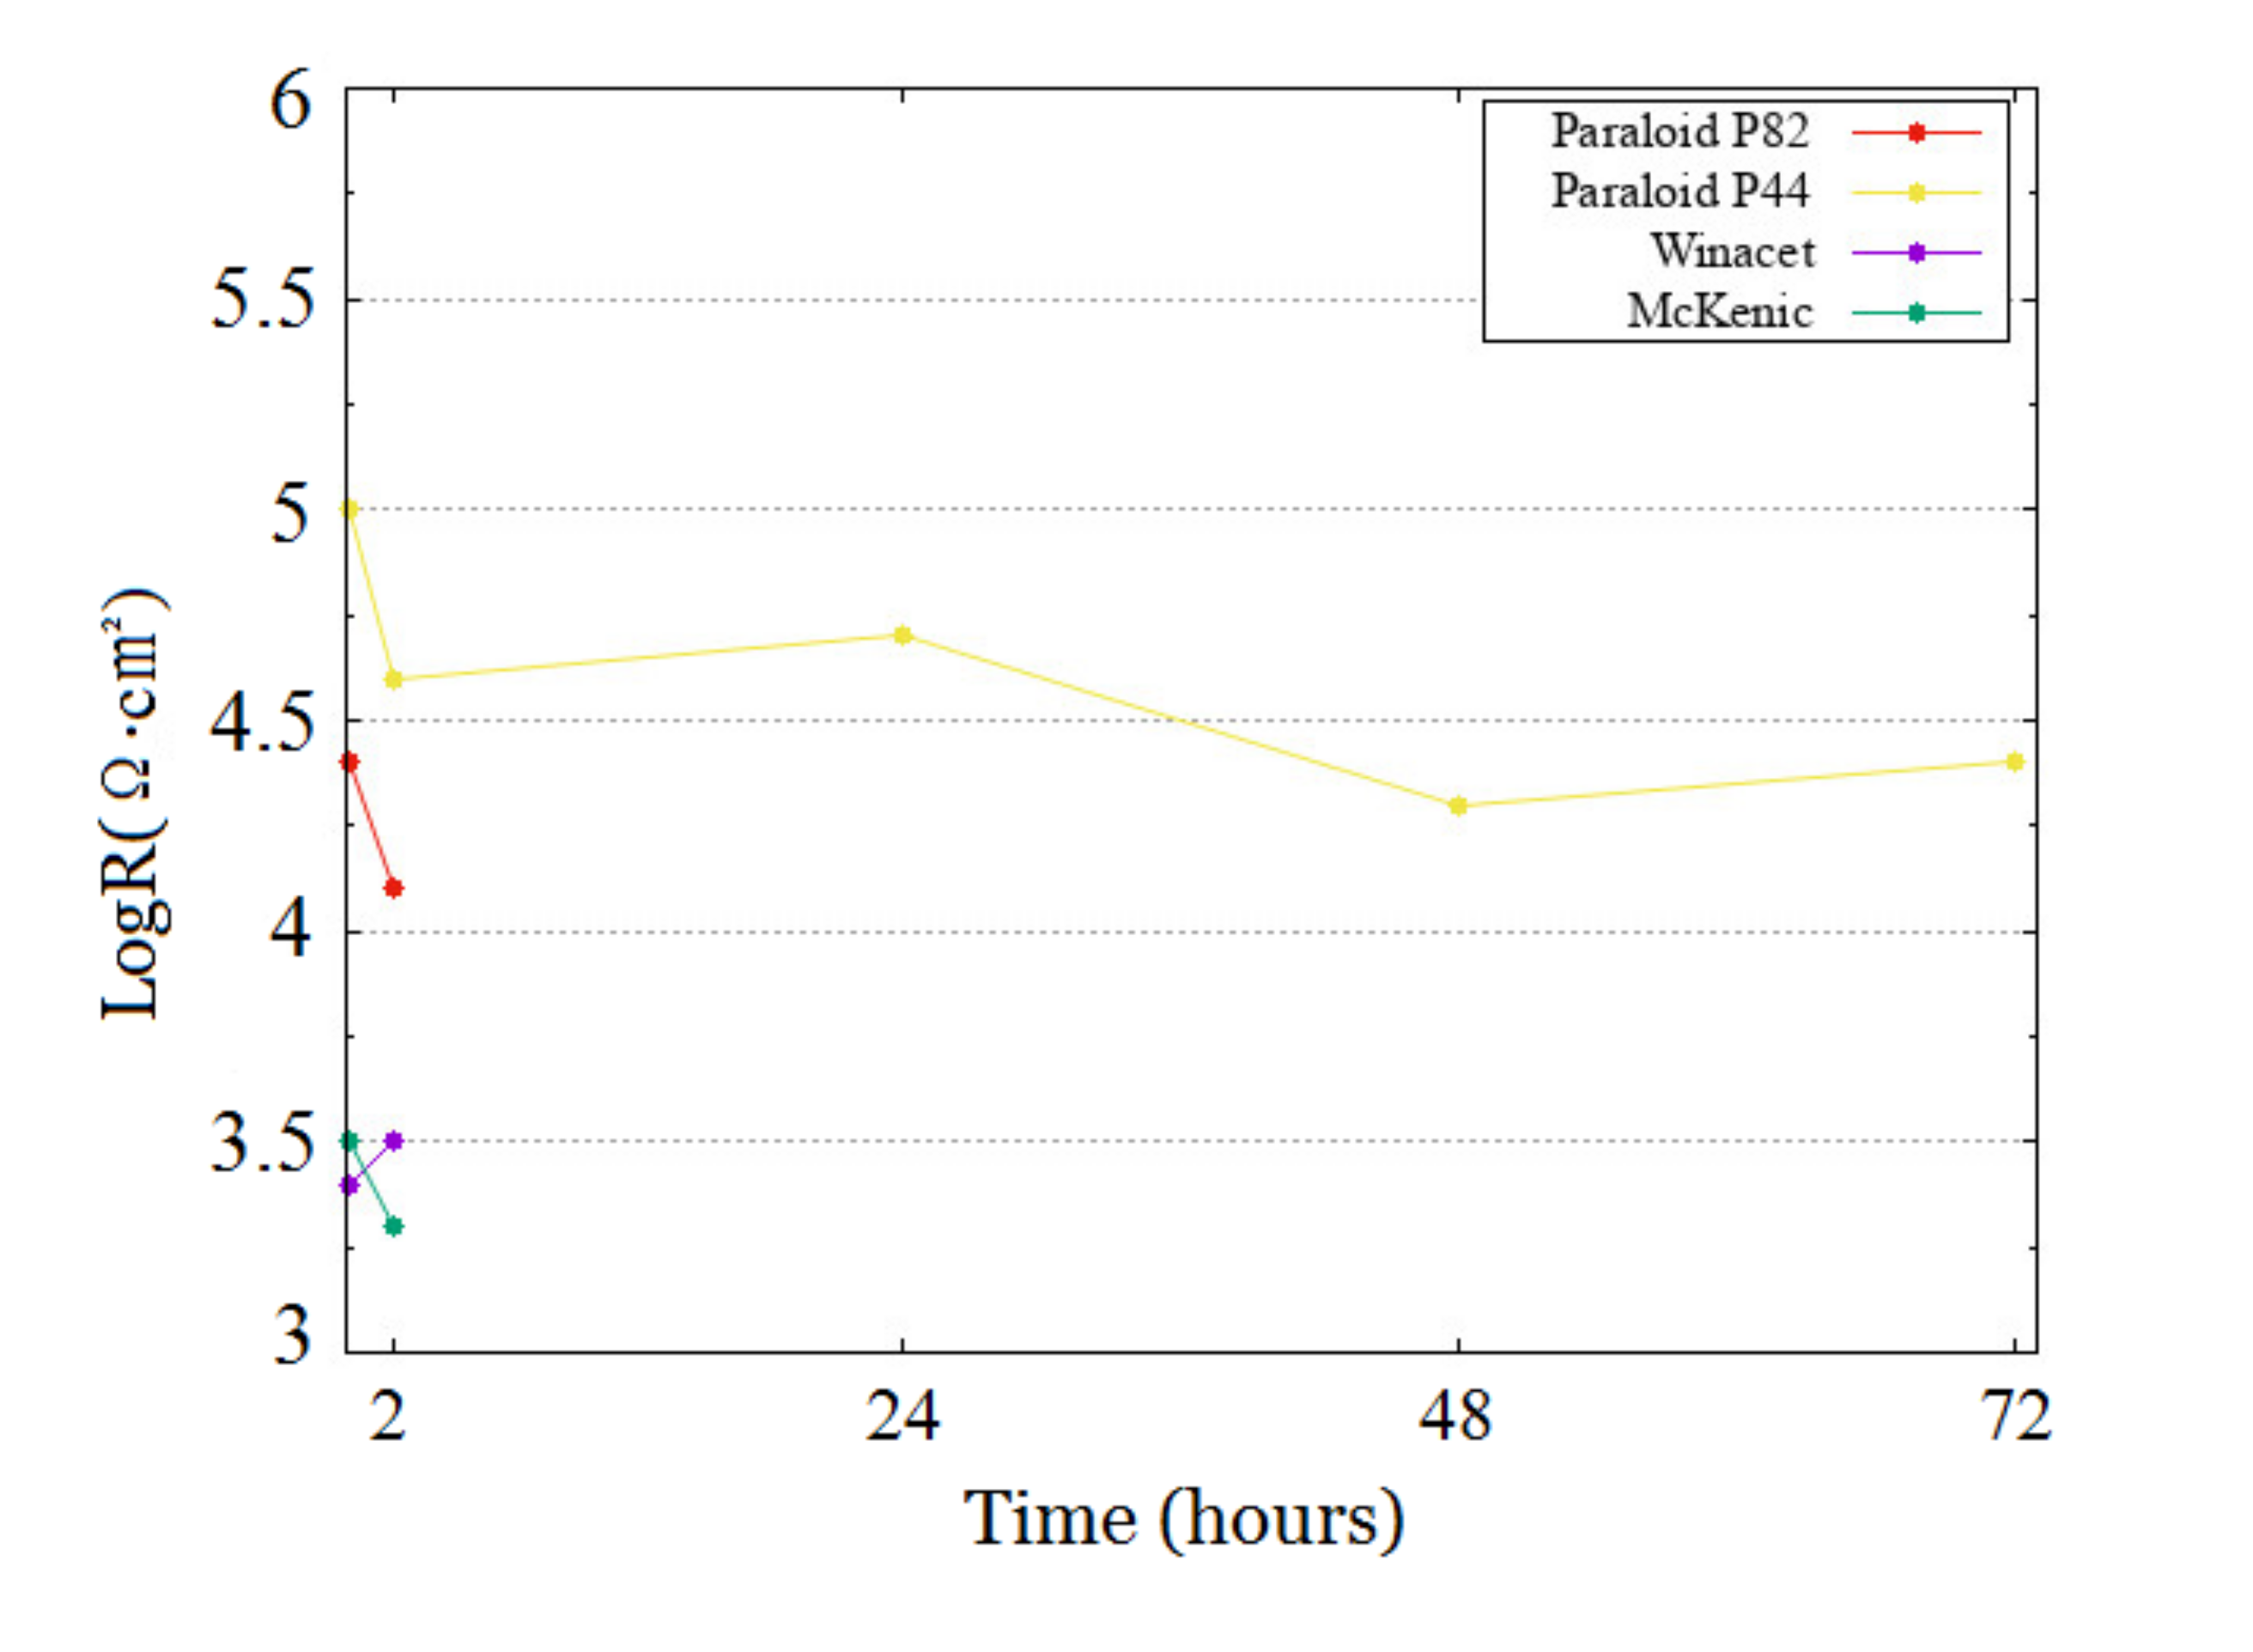
Figure 5 (two coat) and Figure 6 (single coat) show the DC resistance of the four coatings (Paraloid B82, Paraloid B44, Winacet and McKenic) on steel when exposed to diluted Harrison’s solution as a function of time; either up to 2 h or up to 72 h (the reason why the times vary is because where corrosion had started the resistance values soon became very low; at that stage the test was terminated). Figure 7 (two coat) and Figure 8 (single coat) show the DC resistance of the same four coatings on copper over time in the same environment. All measurements were conducted at Room Temperature (around 20 °C).

2.3. Discussion

2.3.1. Steel

Figure 5 shows that the Paraloid B82 and B44 exhibited a small initial drop in resistance; then it remains steady. Its resistance after 48 h of exposure equals approximately R = 105 Ω (2 × 10⁵ Ω-cm2) for the two layered system. This highish value of resistance relates to the good protection this system afforded to the steel (see Figure 3b). However, for the single coat Paraloid B82 shown in Figure 6, the resistance rapidly dropped to R = 103.5 Ω within two hours; this related to the poor protection afforded to the steel substrate visible in Figure 3a. Figure 5 shows that two layered Paraloid B44 had the second highest value of resistance at R = 104.5 Ω after 48 h. This correlated with its good protection against corrosion (see Figure 3d). With Paraloid B44 the single layer system maintained a resistance of 104.5 Ω up to 48 h and exhibited quite good protection as shown in Figure 3c. Figure 5 and Figure 6 show that the McKenic and Winacet DC resistance values rapidly fell to a low value (R = 103.5 Ω) within two hours. In both cases corrosion appeared within 24 h (see Figure 3e–h).

2.3.2. Copper

As shown in Figure 7 and Figure 8, Paraloid B82 and B44 both exhibited a rapid initial fall in DC resistance. They then steadied out, with the two layered system of Paraloid B44 giving a value of R of about 106.25 Ω after 48 h and the B82 (two layer) a value of R = 105.5 Ω (both highish values). No corrosion was seen (Figure 4b,d). The single layer Paraloid B44 and B82 systems had a lower resistance of around R = 104.5 Ω after 48 h but the protection afforded was quite high in both cases (see Figure 4a,c). Figure 7 and Figure 8 also show DC results for Winacet and McKenic. Again, after a rapid initial drop, they remained fairly steady but at low values (R = 104 Ω (Winacet) and R = 103.5 Ω (McKenic). Some corrosion was seen on the former as shown in Figure 4e.

2.4. Summary

The results of this work show that the DC resistance value as measured by ERM provides a good indication of the level of protection being afforded. Paraloid B82 and Paraloid B44 both provided good protection against corrosion when applied in the manner used in the museum on both steel and copper. Two coat systems always provided much better protection and had much higher DC resistance values than single coat. Resistance values were generally higher on copper than on steel. The level of protection afforded on the copper was also greater reflecting that metal’s higher nobility. Winacet and McKenic coatings provided worse protection against corrosion. Although on the Bacon Smith and Rugg criteria [8] the resistances were all borderline or poor (mostly DC resistance log R(Ω) < 6), it should be noted that the Bacon Smith and Rugg scale was produced based on coatings exposed for long periods of immersion in sea water. The criteria will be lower for coatings whose purpose is to protect against corrosion under less severe conditions. In this work assessment based on DC resistance and corrosion appearance allows us to put the coatings in order, as follows:
  • On Steel: Paraloid B82 = Paraloid B44 >> Winacet > McKenic
  • On Copper: Paraloid B44 ≥ Paraloid B82 > McKenic = Winacet
Note that this agrees in general with previous work [10] despite the application method being different in this work (brushing compared with dipping or KBar).
Regarding explaining why there is variation between the coatings, this probably relates to the hydrophobicity level of the coating constituents and the level of tightness of the chain structure. It must be concluded that one or both of these factors is higher in the Paraloids than in the Winacet and McKenic coatings. The fact that two coat is more than twice as protective as single coat is generally explained by there being small weaknesses in the coating structure and the chance of overlap of these is much reduced when a two coat system is employed [12].

3. Study 2

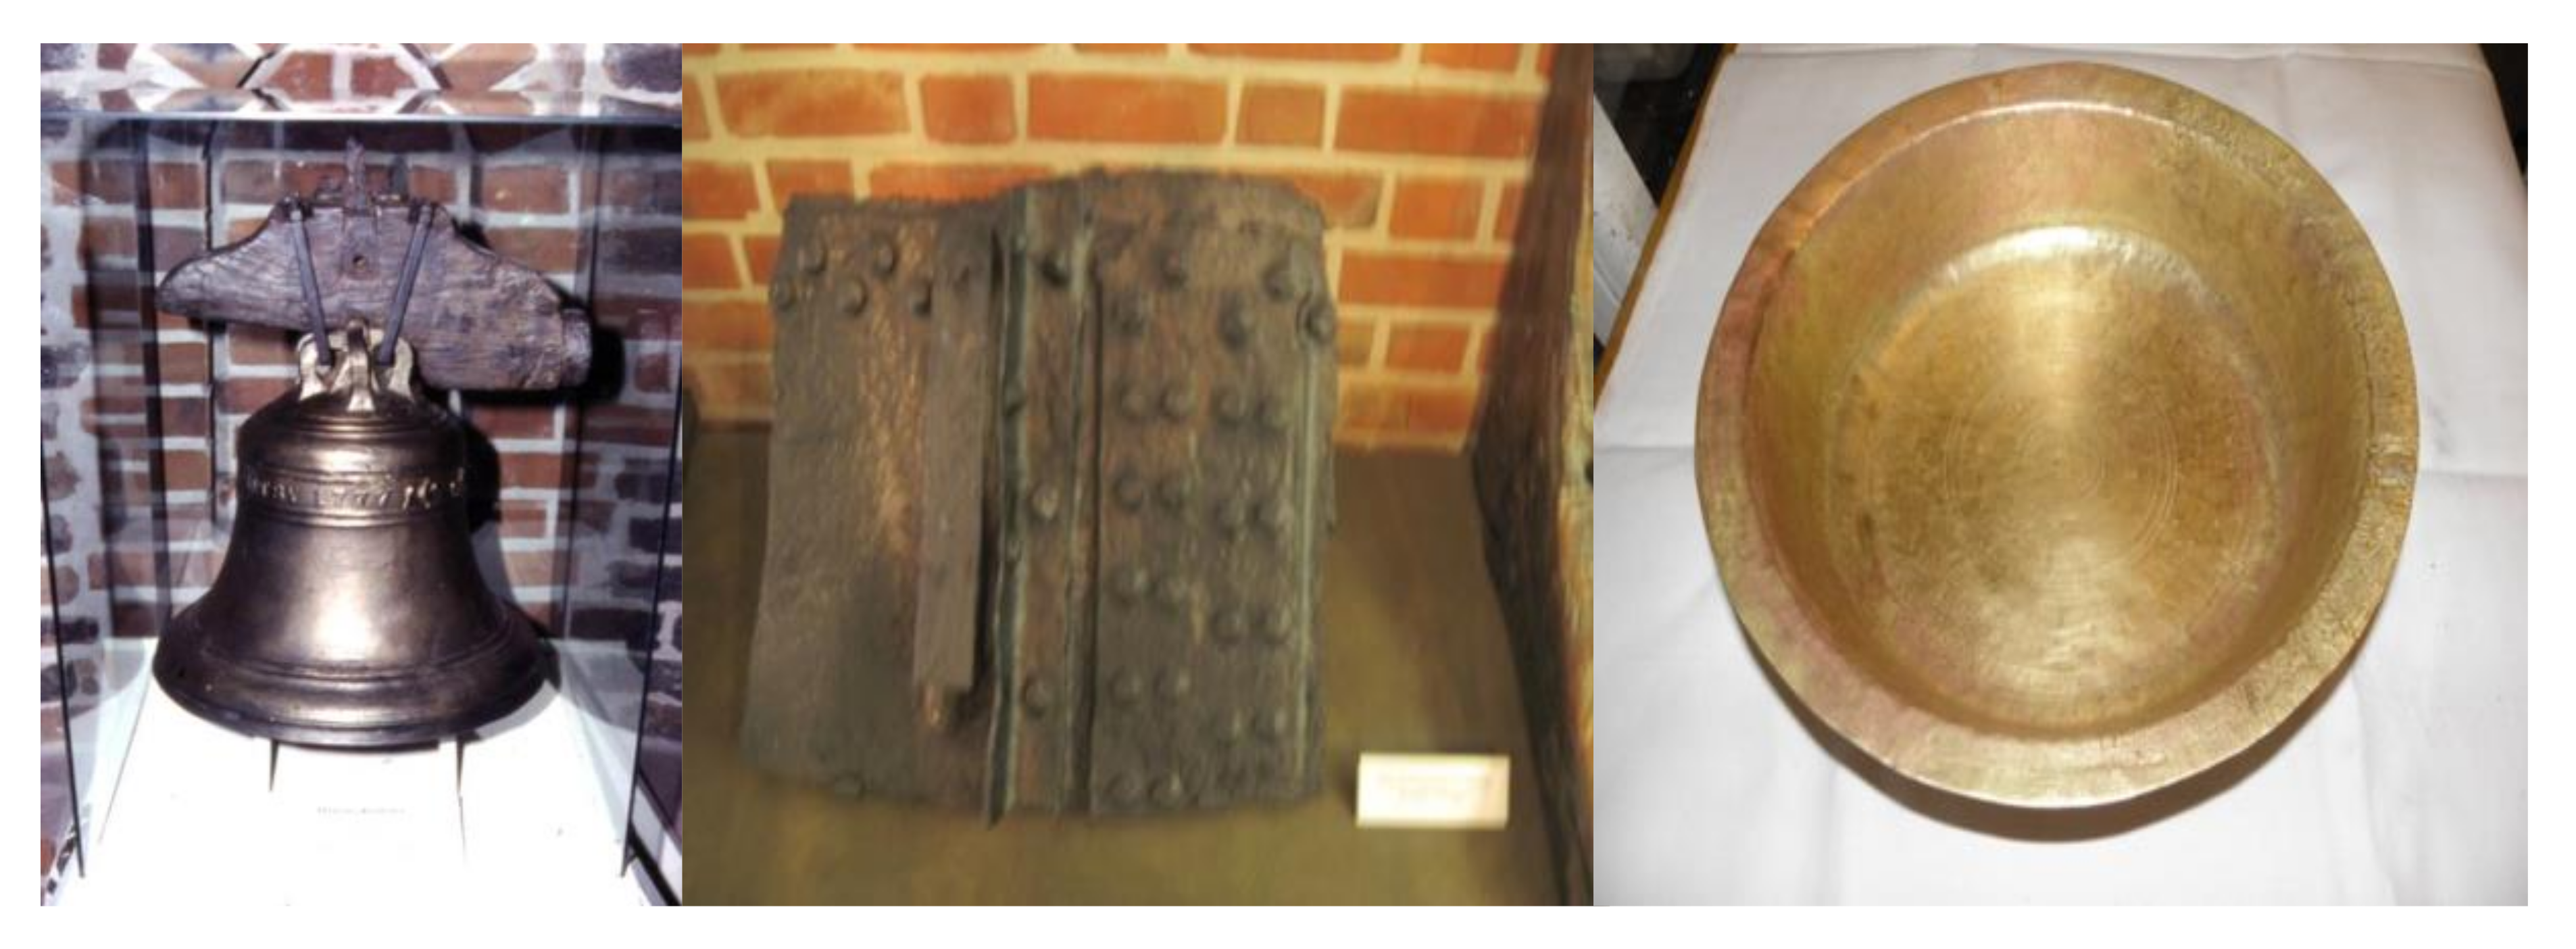
The second part of this paper looks at assessing coatings on actual objects, all recovered from the sea. The items are illustrated below in Figure 9 and Figure 10. The technique of choice for the in situ measurement on these objects has been ENM. This is justified on the basis that the Rn value obtained by ENM gives equivalent results to ERM (note that this is also true of the 0.1 Hz Impedance value obtained by EIS). Additionally, the ERM technique is difficult to automate. Further discussion about the ENM technique can be found below and in References [6,13].

3.1. Electrochemical Noise Measurement (ENM) Using the Single Substrate Arrangement

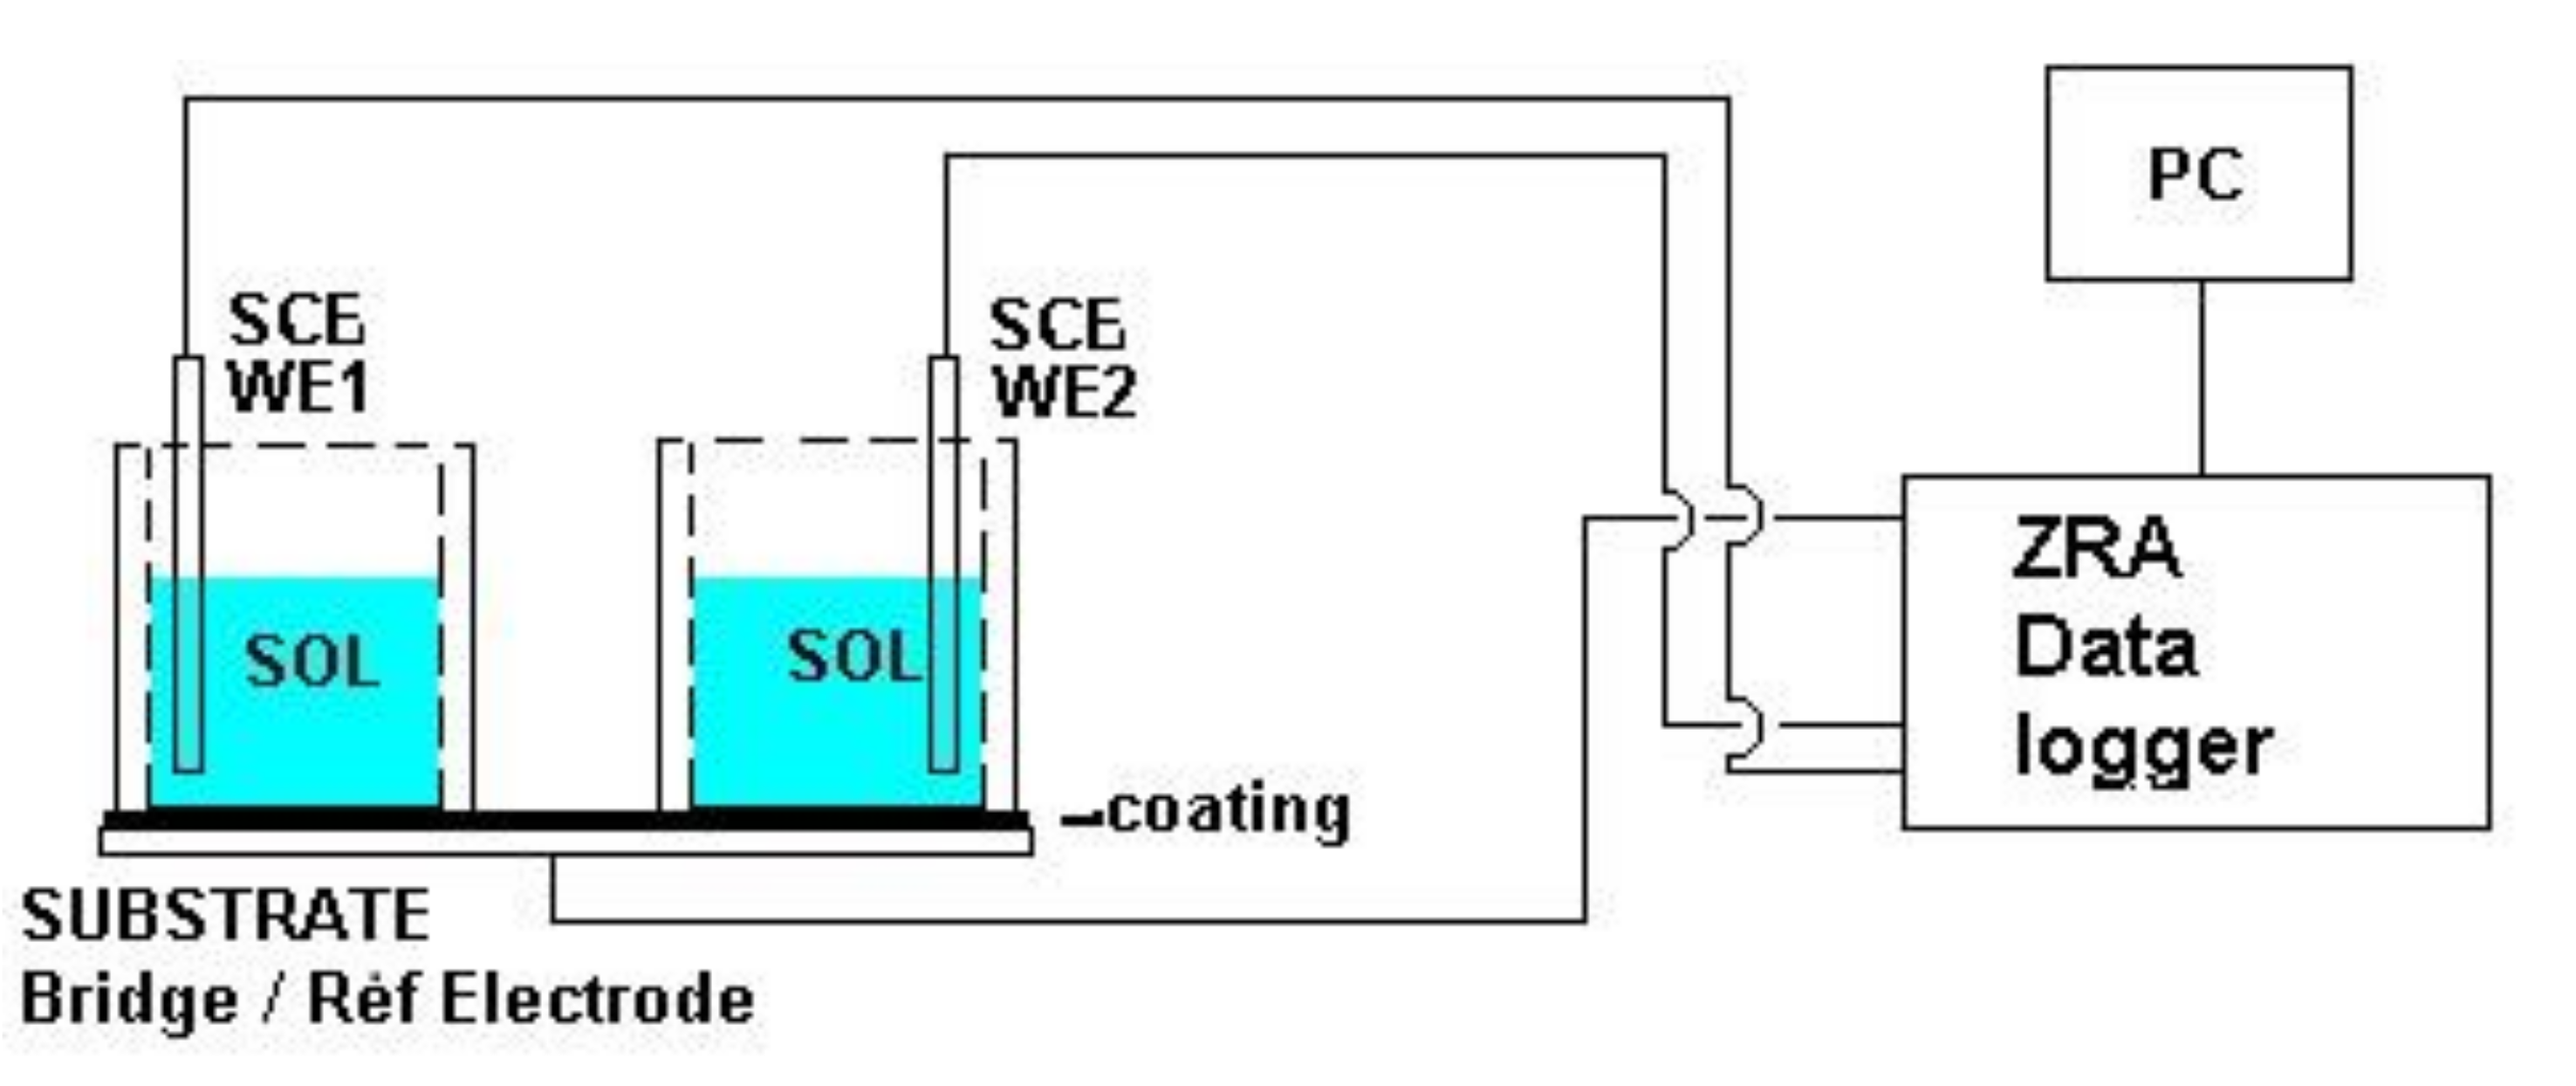
First introduced by Mabbutt and Mills in 1998 [13], in the laboratory set up two cells are affixed to one piece of coated metal. The two separate coated areas defined by each cell form WE1 and WE2 and. and they are interrogated by Saturated Calomel Electrode (SCEs) immersed in each cell. The metal substrate itself becomes the reference. Current noise is recorded between the two SCEs; potential noise is recorded between the SCE’s and substrate. From this the resistance noise (Rn) can be calculated which, as stated earlier, relates to the DC resistance. The Rn value is calculated by dividing the standard deviation of the voltage values by the standard deviation of the current values. The data can be treated to improve accuracy either by detrending (removing drift from the data set) or by brushing (choosing a fraction of the data set to operate on). The experimental arrangement a used for measuring the sword is shown in Figure 9.

3.2. Procedure

Three coated objects on display in the museum: a section from the Otago hull (coated iron), a sword and a bell, shown in Figure 10, were removed from their cases and their coatings assessed non-destructively using the Electrochemical Noise Method.
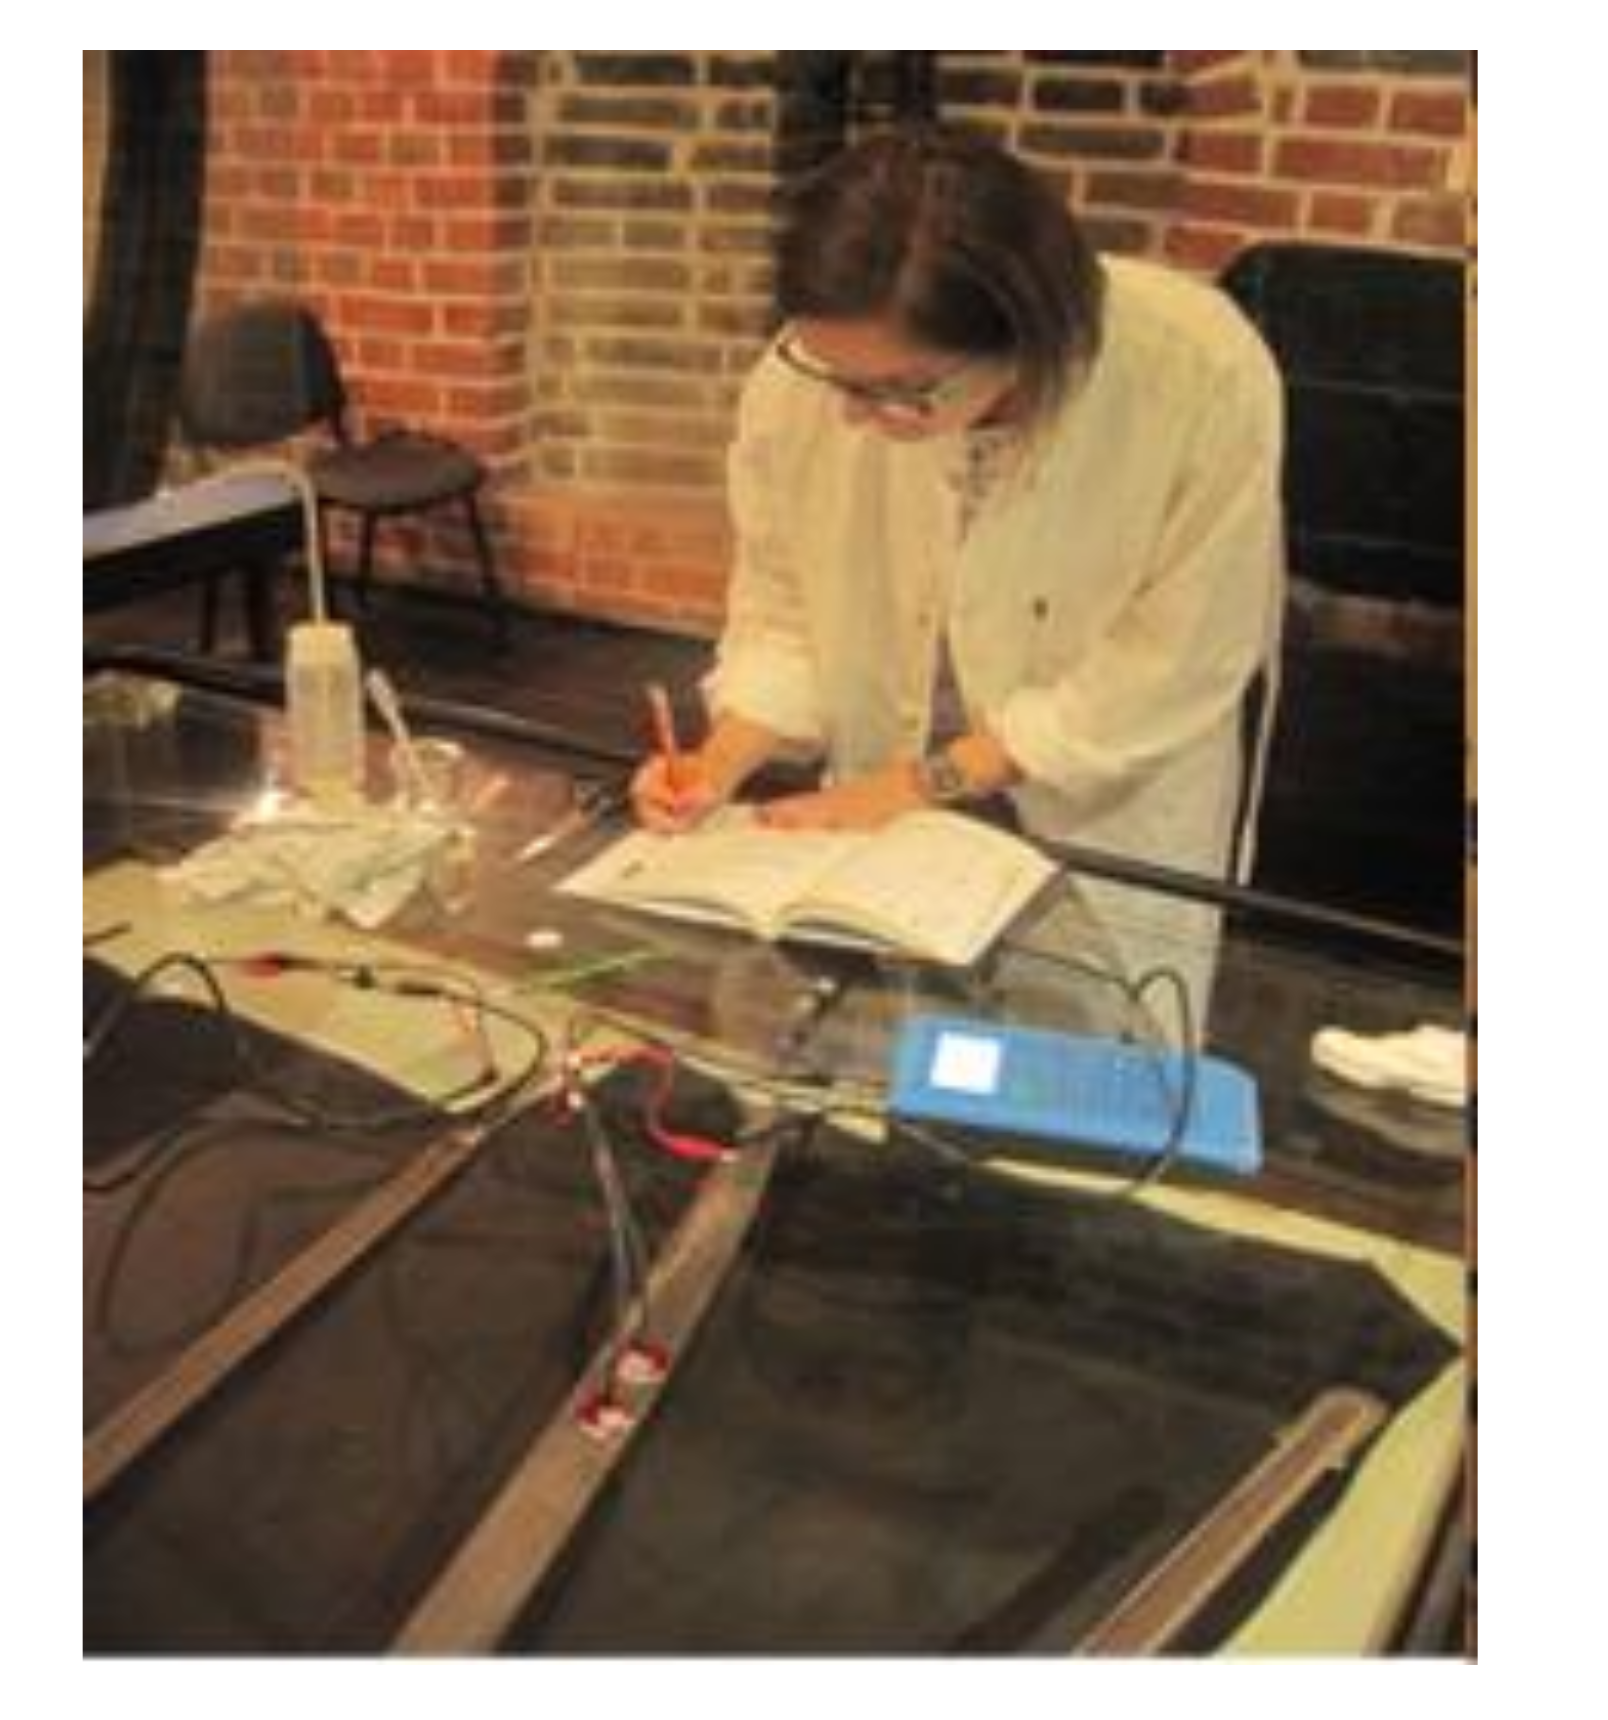
Additionally, eight brass bowls in storage were measured (made on six areas (I-VI) of each bowl in pairs (I-II, III-IV, V-VI). A commercial instrument (portable noise measuring device, the ProCoMeter) was used to make the ENM measurements. These were conducted using SS (single substrate) mode (Figure 11). However, instead of the SCEs used in the laboratory, for this “field work” pseudo reference electrodes were used to form a probe. These probes were based on silver/silver chloride electrodes which produce a stable (very low noise) potential when in contact with a specific sodium chloride solution (in this case 3% NaCl (0.6 M). The reason for using a relatively strong concentration of chloride was to be able to compare the results with the laboratory results given in study 1. Weaker chloride solutions could be used. Filter paper saturated with 3% NaCl was inserted between the electrode and coated object. Probes were left in place for fifteen minutes. Data was gathered (twice) over 5 min at 2 readings/s (512 data points). Current (using a ZRA) and Voltage are measured automatically. Probes were held in place with magnets (for steel objects) or tape (copper alloy objects). ENM testing on the sword is shown in Figure 12. The area exposed for each measurement was about 2 cm2. Measurements were conducted at Room Temperature (around 22 °C).

3.3. Results

3.3.1. Thickness Measurement

This was again performed by Defelsko Positest thickness gauge. Results were obtained from each of the areas (3 cm2) examined. They were measured in five places and the average thickness was calculated. Additionally, minimum thickness was noted. Values are given in Table 3.

3.3.2. ENM Results

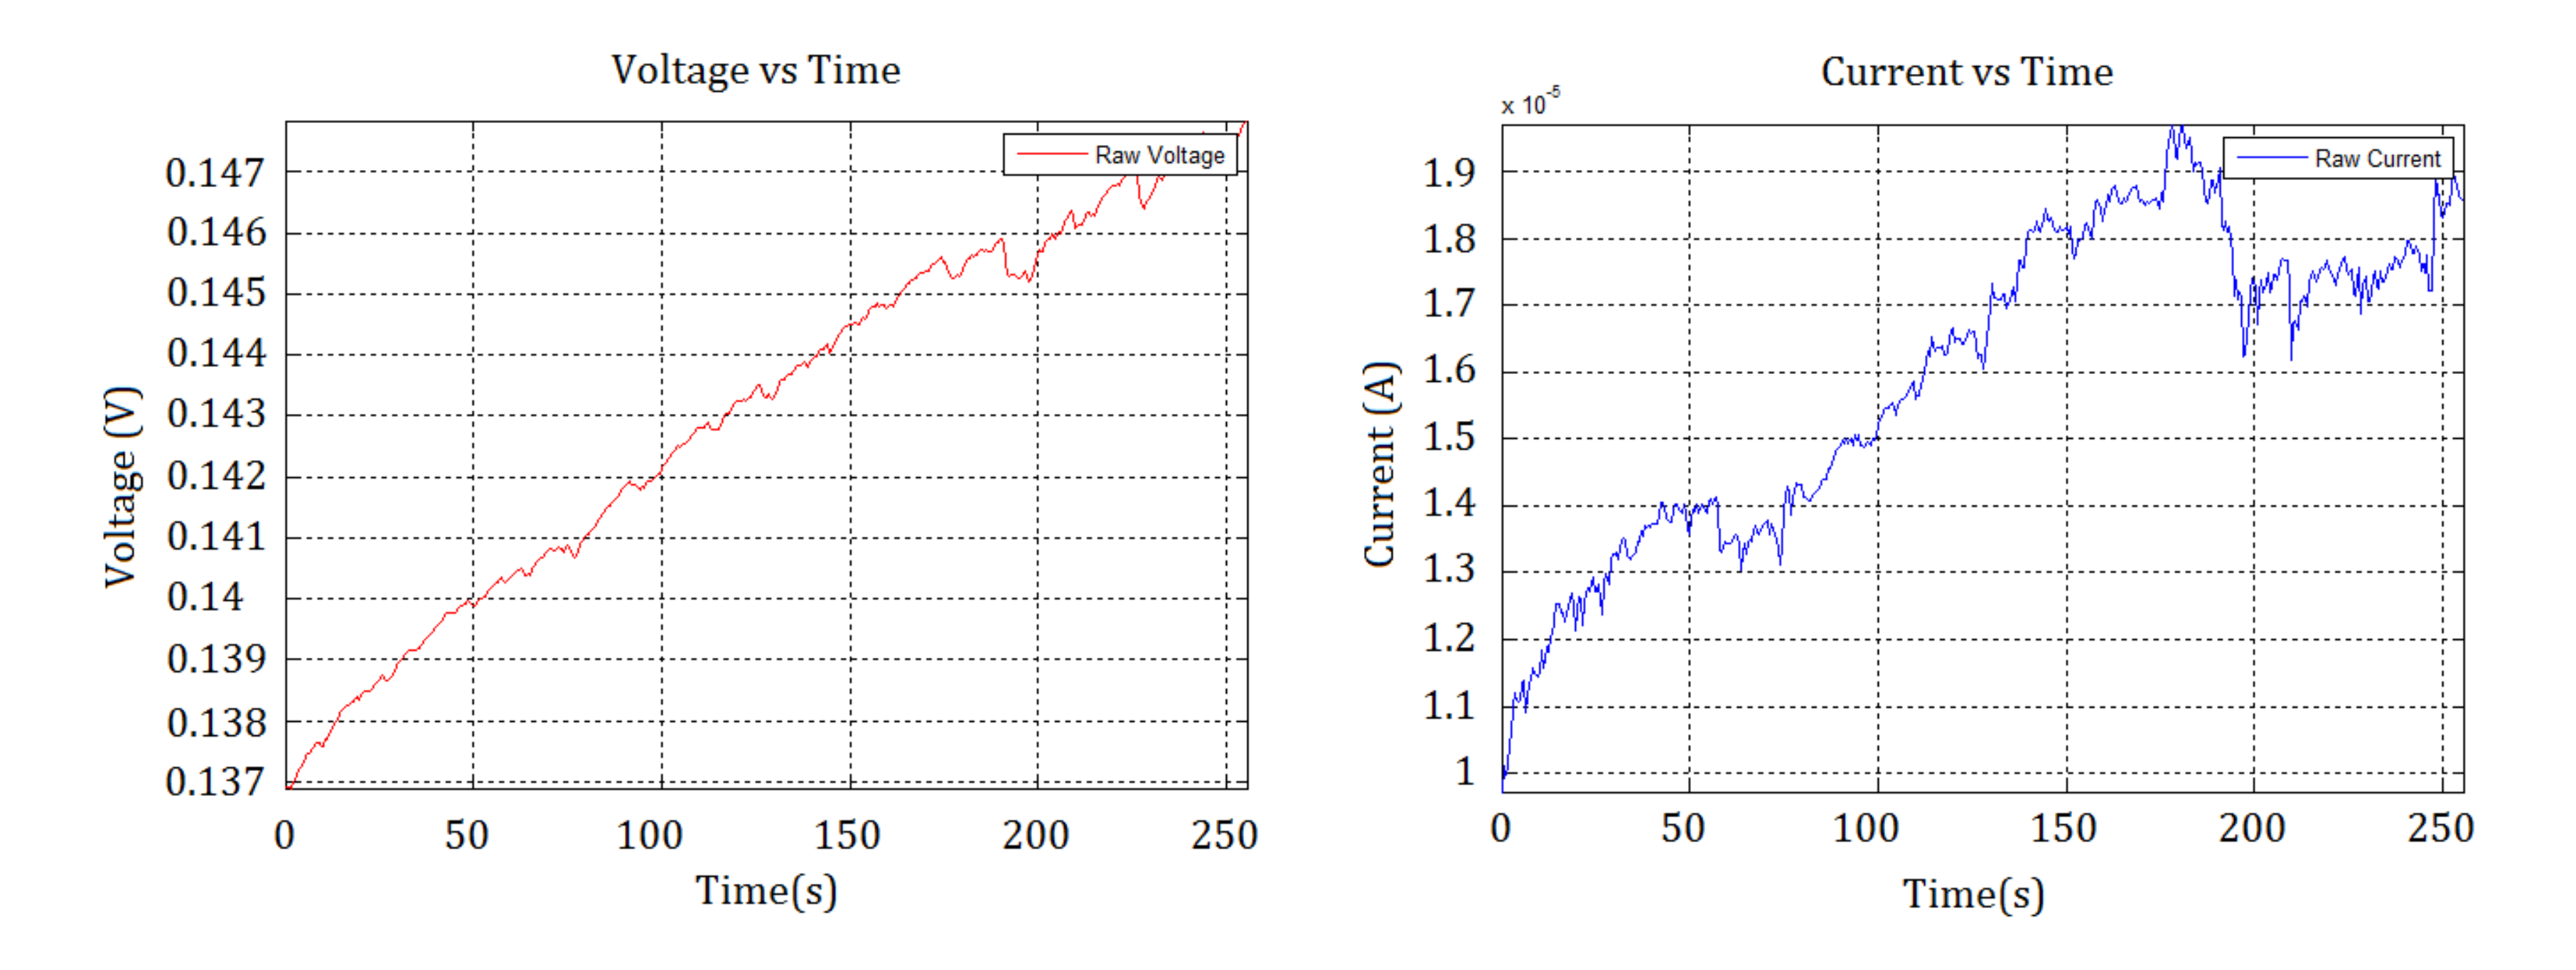
Figure 12 shows typical voltage and current data for the bell. Additionally, the Rn values were automatically calculated and are noted in the title of the graph both without trend removal and with trend removal. Rn values obtained from all the objects are given in Table 4. All values presented in this table are after de-trending (linear de-trend). In several cases the data has been brushed (and then de-trended). Rn is given in in Ω-cm2, i.e., all values have been corrected for area. Results are the average of two Rn values (averaged to nearest 10 ohms). With some exceptions (e.g., higher resistance areas e.g., bowl 3) reproducibility between the two readings was good (within ±20%).

3.3.3. Correlation between Thickness Values and Resistance Noise (Rn) Values of the Bowls

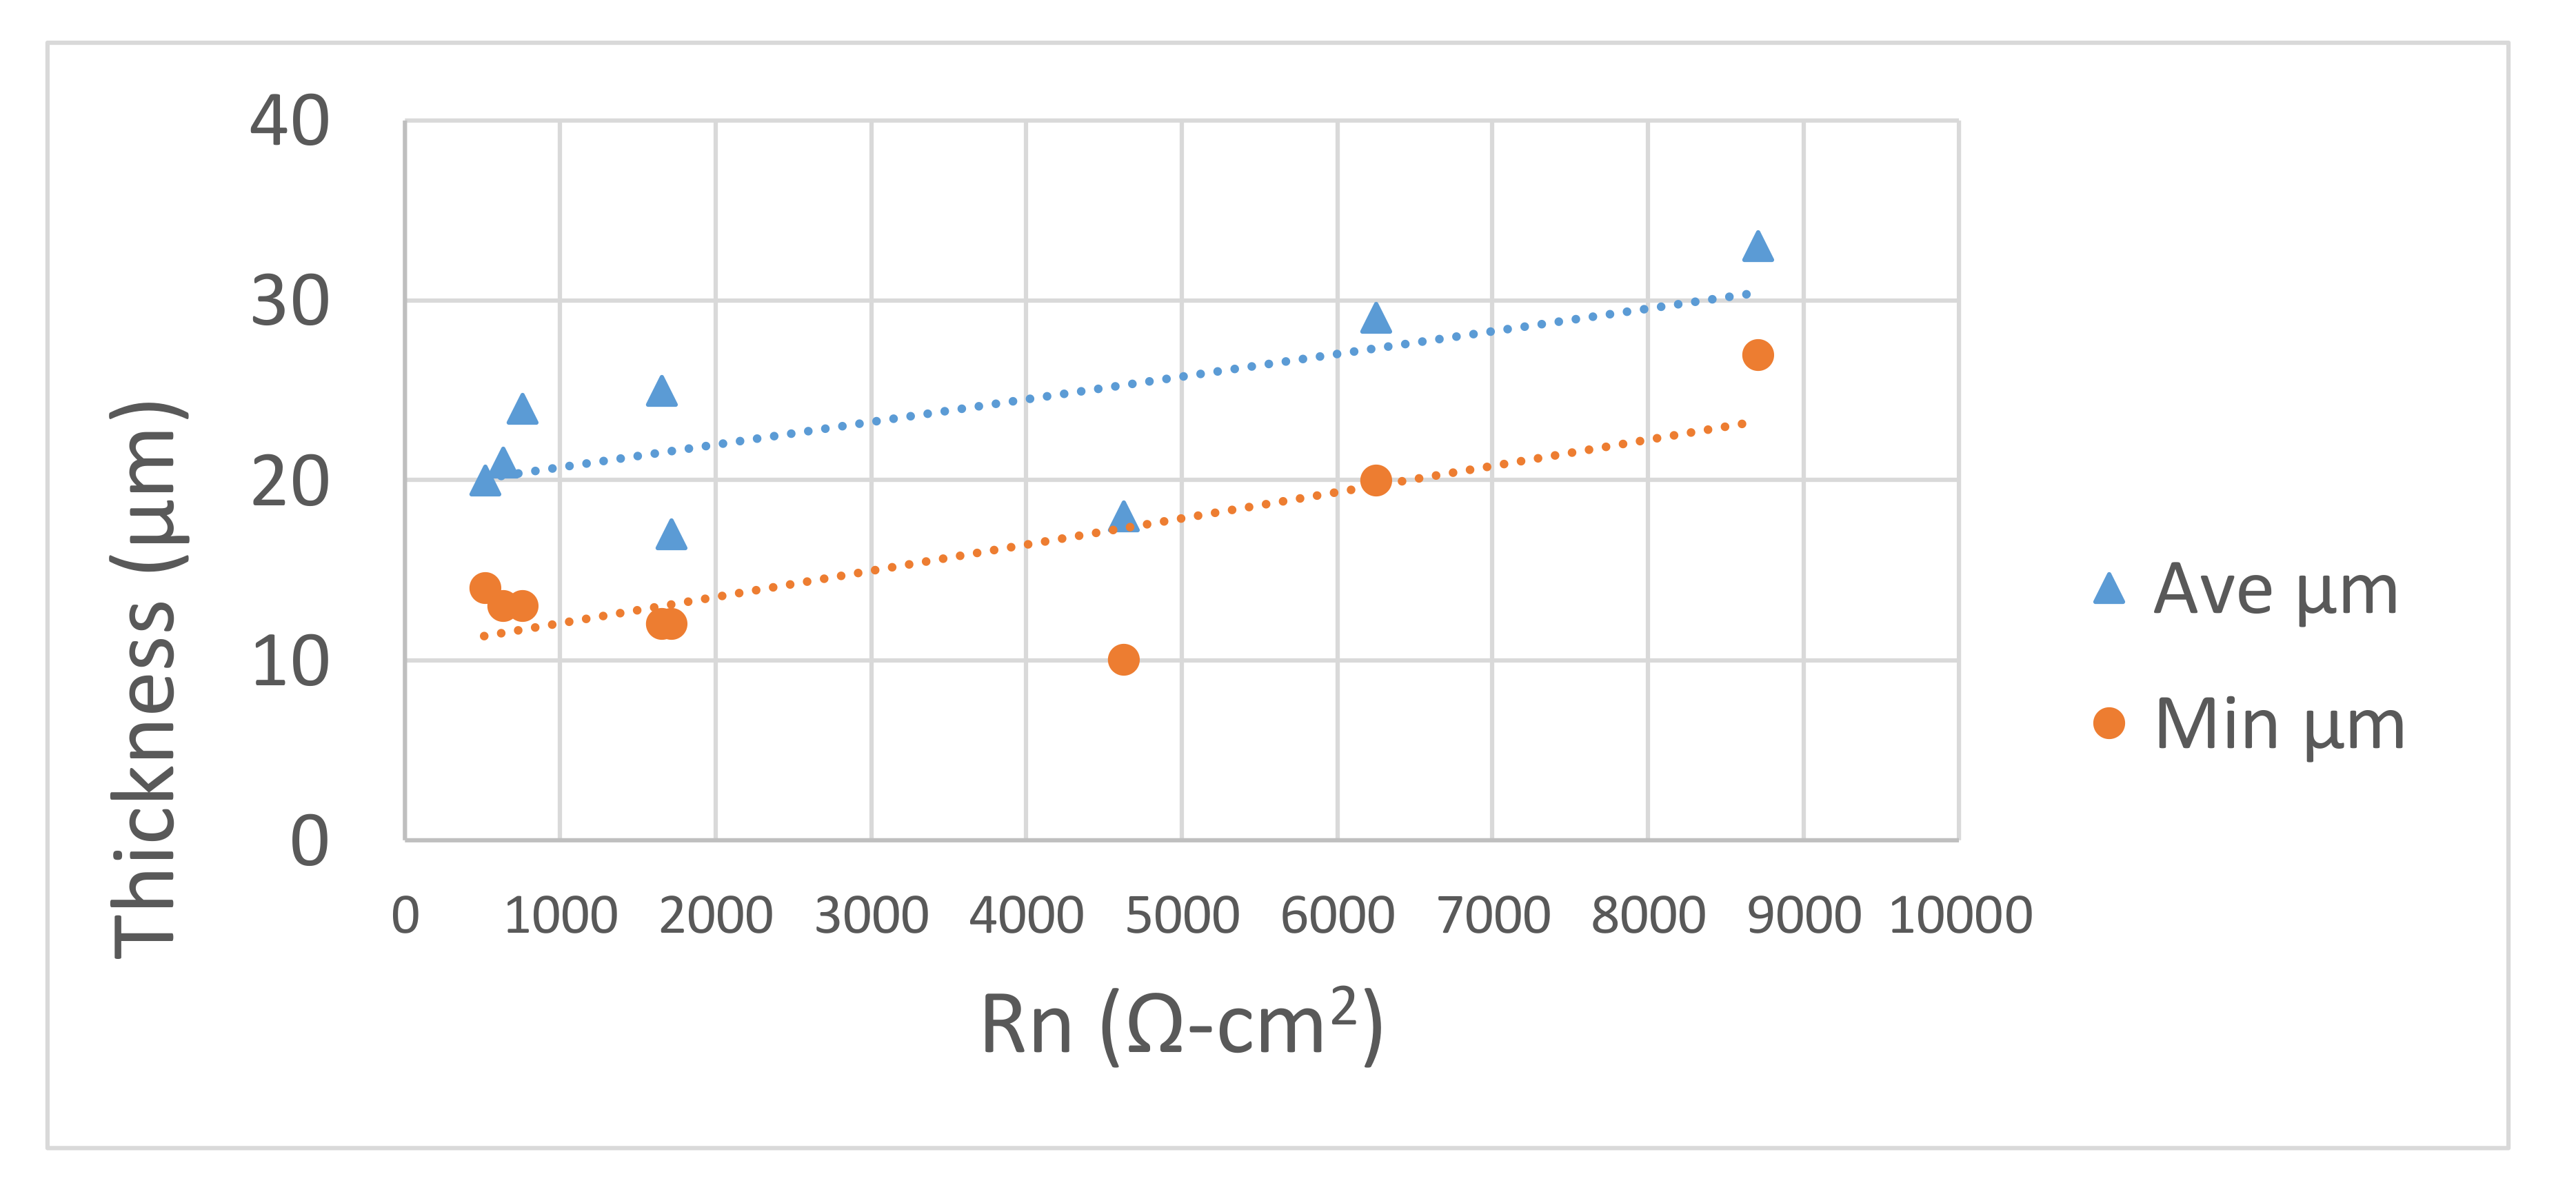
As shown in Figure 13 there is some evidence of correlation for the bowls between the thickness of coatings and level of protectivity as measured by Rn value. The results suggest the correlation is better for minimum thickness versus Rn than average thickness versus Rn (there was one outlier (probably caused by a short, transverse (surface) electrical path with low resistance between WE1 and WE2) which has not been included). The results also suggest that the scatter in the Rn values is at least partly due to the variation in thickness of the coating.

3.4. Discussion of Results from Study 2

Resistance noise (Rn) values for the sword are very low. This is not unexpected as very little coating had been applied. Resistance noise values for Otago are high as expected: a relatively thick (50 μm), good quality paint type coating had been applied to this object. Resistance noise values for bell and bowls are intermediate. There is some scatter among values for bowls (Figure 13).

3.5. Comparison ENM and ERM

As different electrochemical methods were used for the lab study compared with museum study. ERM measurements (using the Keithley Electrometer and a standard Ag/AgCl ref electrode) were made on three of the bowls previously examined in situ.by ENM. The results were a little higher (1.2 KΩ-cm2 to 7 KΩ-cm2) but had similar variation to the values obtained earlier by ENM (0.3 KΩ-cm2–3 KΩ-cm2). Bearing in mind that the DC instrument used is not designed to make low resistance measurements, that the Ag/AgCl electrode (R about 1.5 KΩ-cm2) may have been limiting the value measurable in the DC work, and that the experimental conditions and the areas examined were not exactly the same, this level of correlation is considered to be adequate.

4. Conclusions

These results are promising. The lab study shows how these types of coating can be assessed electrochemically and put into order of protection. The in situ study shows how a non-destructive technique like ENM can be used to assess the protectivity of the coating in situ when actually applied to archaeological objects. The actual values for what constitutes good, poor and a middling protection by these kind of coating still needs defining. It is likely that the range of values will be different from the standard Bacon, Smith and Rugg criteria. A suggestion based on these results is that a value of >105 Ω-cm2 should be good, a range from 5 × 10⁴–5 × 10³ Ω-cm2 should be fair and less than 5 × 10³ Ω-cm2 will be poor. Further laboratory results on a wider range of objects is needed to confirm these ranges. The in situ study has shown that Electrochemical Noise Method can be used successfully in the field for this application and results are comparable with those obtained in the laboratory. Regarding further work, in terms of application in the field a drawback with ENM in this single substrate mode is that two areas have to be interrogated. These may have different values and which is dominant is uncertain. The ENM measuring instrument used has a number of other modes including Multiple Single Substrate (MSS) which gets around this drawback [14]. This instrument also has a No Connection to the Substrate (NOCS) mode which has obvious advantages. Further work could involve application of these other modes. This will help increase confidence that the values are representative of the coating system as applied to the object as a whole.

Author Contributions

Conceptualization, D.J.M. and K.S.; methodology, D.J.M., K.S. and T.W.; formal analysis, D.J.M., K.S. and T.W.; investigation, D.J.M., K.S. and T.W.; resources, D.J.M. and K.S.; writing—original draft preparation, T.W. and K.S.; writing—review and editing, D.J.M.; visualization, D.J.M.; supervision, D.J.M. and K.S.; project administration, D.J.M., K.S.; All authors have read and agreed to the published version of the manuscript.

Funding

This research received no external funding.

Data Availability Statement

The data presented in this study are available in this article.

Acknowledgments

The authors would like to thank NMM conservator Piotr Dziewanowski for his help in applying the coatings to the NMM objects and to thank interns Katarzyna Mielcarek and Monica Rodziewicz for help in performing electrochemical measurements on the museum’s objects. Sincere thanks go to DCVG company for the loaning of the ENM measuring equipment (ProCoMeter) and involving us in the testing of the ENM device for assessing coatings in the conservation area. Finally, they thank “Leo” (TianYang Lan) for doing the analysis of the electrochemical noise data to provide both untreated and detrended Rn values. Thanks also to Louise Atkin for her efforts in creating the final copy of this paper.

Conflicts of Interest

The authors declare no conflict of interest.

References

  1. Cano, E.; Lafuente, D.; Bastidas, D.M. Use of EIS for the evaluation of the protective properties of coatings for metallic cultural heritage: A review. J. Solid State Electrochem. 2010, 14, 381–391. [Google Scholar] [CrossRef] [Green Version]
  2. Cano, E.; Bastidas, D.M.; Argyropoulos, V.; Fajardo, S.; Siatou, A.; Bastidas, J.M.; Degrigny, C. Electrochemical characterization of organic coatings for protection of historic steel artefacts. J. Solid State Electrochem. 2010, 14, 453–463. [Google Scholar] [CrossRef] [Green Version]
  3. Guilminot, E.; Neff, D.; Remazeilles, C.; Reguer, S.; Kergourlay, F.; Pele, C.; Dillman, P.; Refait, P.; Nicot, F.; Mielcarek, F.; et al. Influence of critical parameters on the dichlorination tertamnet of ferrous objectsfrom seawater. Stud. Conserv. 2012, 57, 227–236. [Google Scholar] [CrossRef]
  4. Adriaens, A.; Dowsett, M. Time resolved spectroelectrochemistry studies for protection of heritage metals. Surf. Eng. 2008, 24, 84–89. [Google Scholar] [CrossRef] [Green Version]
  5. Keersmaecker, M.D.; De Wael, K.; Adriaens, A. The use of lead dodecanoate as an environmentally friendly coating to inhibit the corrosion of lead objects: Comparison of three different deposition methods. Prog. Org. Coat. 2012, 74, 1–7. [Google Scholar] [CrossRef] [Green Version]
  6. Jamali, S.S.; Zhao, Y.; Gao, Z.; Li, H.; Hee, A.C. In situ evaluation of corrosion damage using non-destructive electrochemical measurements—A case study. J. Ind. Eng. Chem. 2016. [Google Scholar] [CrossRef]
  7. Corbellini, S.; Parvis, M.; Grassini, S. Noninvasive solution for Electrochemical Impedance Spectroscopy on metallic works of art. IEEE Trans. Instrum. Meas. 2012, 61, 1193–1200. [Google Scholar] [CrossRef] [Green Version]
  8. Bacon, R.C.; Smith, J.J.; Rugg, F.M. Electrolytic resistance in evaluating protective merit of coatings on metals. Ind. Eng. Chem. 1948, 40, 161–167. [Google Scholar] [CrossRef]
  9. Mills, D.J. Comparison of ENM, EIS and DC Resistance for assessing and monitoring anti-corrosive coatings. J. Corros. Sci. Eng. 2004, 8, 12. [Google Scholar]
  10. Schaefer, K.; Mills, D.J. The application of organic coatings in conservation of archaeological objects excavated from the sea. Progress Org. Coat. 2016, 102, 99–106. [Google Scholar] [CrossRef] [Green Version]
  11. Wityk, T. Anticorrosive Evaluation of Organic Based Archaeological Coatings Based on DC Resistance Measurements; Company Report (Project); University of Northampton: Northampton, UK, 2018. [Google Scholar]
  12. Mills, D.J.; Mayne, J.E.O. The inhomogeneous nature of polymer films and its effect on resistance inhibition. In Corrosion Control by Organic Coatings; Leidheiser, H.J., Ed.; NACE International: Houston, TX, USA, 1981; pp. 12–17. [Google Scholar]
  13. Mabbutt, S.J.; Mills, D.J. Recent UK work investigating anti-corrosive organic coatings using the Electrochemical Noise Method (ENM). Surf. Coat. Int. Part B Coat. Trans. 2001, 84, 277. [Google Scholar] [CrossRef]
  14. Mills, D.J.; Jamali, S.S. A critical review of Electrochemical Noise Measurement for assessment of organic coatings. Progress Org. Coat. 2016, 95, 26–37. [Google Scholar] [CrossRef] [Green Version]
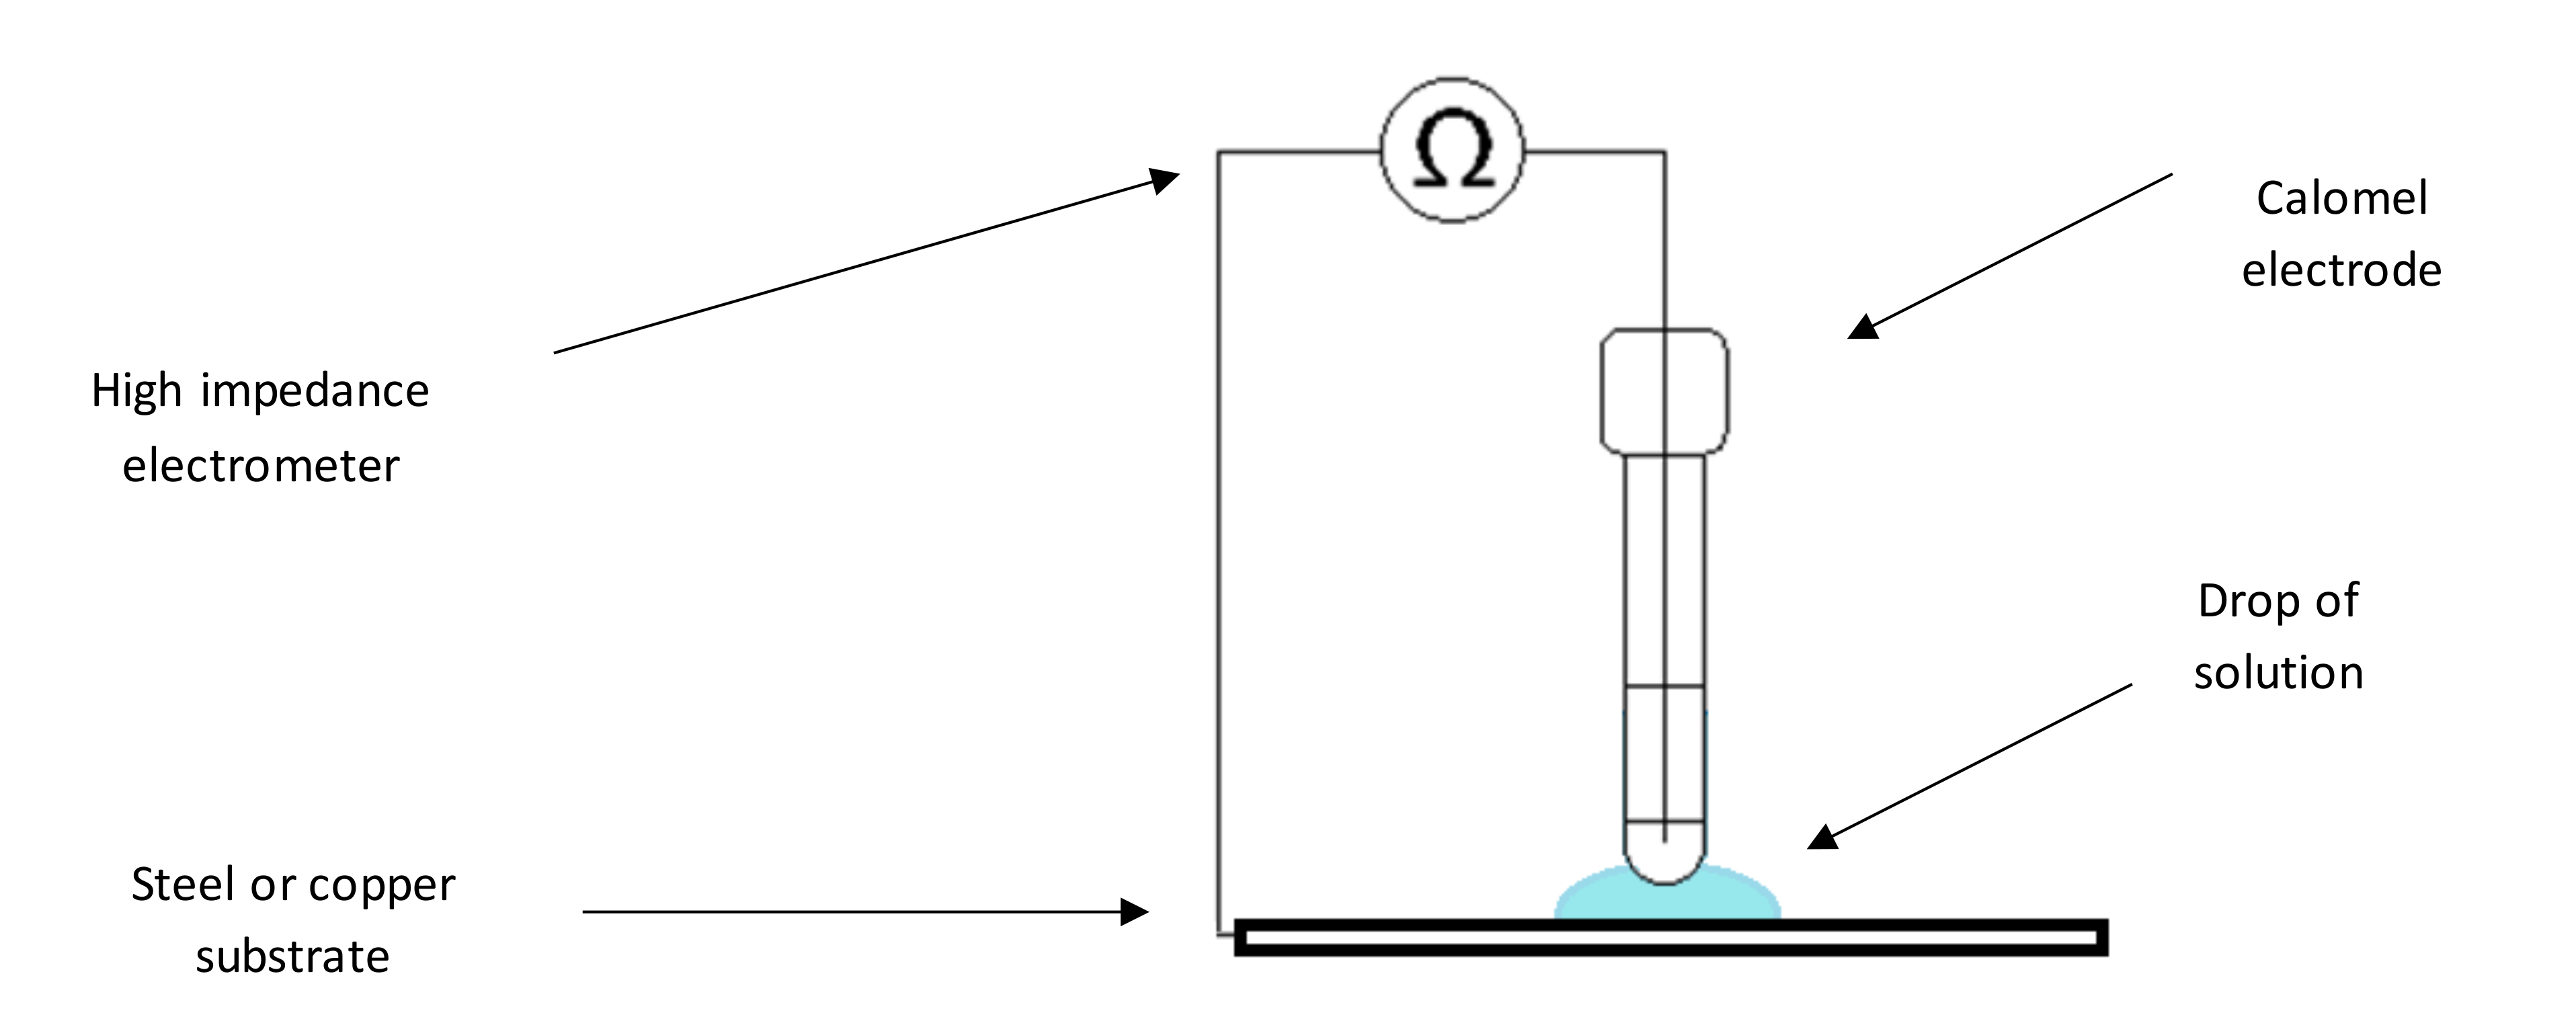
Figure 1. Schematic diagram showing method of making DC resistance measurement.
Cmd 02 00007 g001
Figure 2. Corrosion on the reference samples with no coating: (a) copper after 24 h exposure to 0.05% NaCl, (b) copper after 24 h exposure to diluted Harrison’s solution, (c) steel after 24 h exposure to 0.05% NaCl, (d) steel after 24 h exposure to diluted Harrison’s solution.
Cmd 02 00007 g002
Figure 3. One-layered (left) and two-layered (right) coatings on steel after 24 h exposure to diluted Harrison’s solution—(a,b) Paraloid B82, (c,d) Paraloid B44, (e,f) Winacet, (g,h) McKenic.
Cmd 02 00007 g003
Figure 4. One-layered (left) and two-layered (right) coatings on copper after 24 h exposure to dil. Harrison’s solution—(a,b) Paraloid B82; (c,d) Paraloid B44; (e,f) Winacet; (g,h) McKenic.
Cmd 02 00007 g004
Figure 5. Average DC resistance of the four coatings applied two coat on steel over 72 h.
Cmd 02 00007 g005
Figure 6. Average DC resistance of the four coatings applied single coat on steel over 72 h.
Cmd 02 00007 g006
Figure 7. Average DC resistance of the four coatings applied two coat on copper over 72 h.
Cmd 02 00007 g007
Figure 8. Average DC resistance of the four coatings applied single coat on copper over 72 h.
Cmd 02 00007 g008
Figure 9. ENM testing on a non-commissioned officer sword of the Russian Navy, worn between 1871–1894.
Cmd 02 00007 g009
Figure 10. Left to right: bell from Gen. Carleton shipwreck; part of the hull from Otago ship; brass bowl from the cargo of a wooden shipwreck dated between XVI-XVII century.
Cmd 02 00007 g010
Figure 11. Lab set up for making ENM measurements using the single substrate method.
Cmd 02 00007 g011
Figure 12. Typical graphs obtained by ENM from Bell (a) left hand pair: no detrend Rn = 1308 Ω-cm2, (b) right hand pair: de-trended Rn = 354 Ω-cm2 (NOTE values not corrected for area).
Cmd 02 00007 g012aCmd 02 00007 g012b
Figure 13. Plot of coating average thickness and coating minimum thickness against Rn value for the bowls.
Cmd 02 00007 g013
Table 1. Thickness of the coatings on the steel samples (µm).
Area
Number
PB44
1 Layer
PB44
2 Layers
PB82
1 Layer
PB82
2 Layers
Winacet
1 Layer
Winacet
2 Layers
McKenic
1 Layer
McKenic
2 Layers
13.06.33.35.04.74.32.02.0
21.74.75.38.34.03.33.31.3
32.34.33.37.74.77.32.02.0
Table 2. Thicknesses of coatings on copper samples (µm).
Area
Number
PB44
1 Layer
PB44
2 Layers
PB82
1 Layer
PB82
2 Layers
Winacet
1 Layer
Winacet
2 Layers
McKenic
1 Layer
McKenic
2 Layers
113.326.310.710.712.07.010.37.7
220.736.311.715.09.06.35.310.7
39.334.79.021.010.38.79.318.6
Table 3. Thickness values (brass bowls).
Thickness Values from Areas of Bowl 2 Used for ENM Measurements (μm)
Area No Measured IIIIIIIVVVI
Single values174939502625
233032522831
262541391333
20540471231
273136391041
Average values22.62837.645.417.832.2
Table 4. ENM results obtained from: Otago hull, sword, bell and three bowls.
ItemNumberAreaNoise Resistance (Ω cm2)Comment
Otago1-3.80 × 10⁵brushed 18–85
2-1.59 × 10⁶brushed 55–185
Sword1-3.80 × 101brushed 138–212
2-3.90 × 101brushed 180–260
Bell1-3.22 × 10²brushed 0–170
2-4.14 × 10²not brushed
Bowls11 (I-II)2.09 × 10³-
2 (III-IV)2.55 × 10³-
3 (V-VI)2.50 × 10²-
21 (I-II)1.70 × 10²-
2 (III-IV)6.00 × 101-
3 (V-VI)2.10 × 10²-
31 (I-II)2.90 × 10³-
2 (III-IV)1.54 × 10³-
3 (V-VI)5.70 × 10²-
Publisher’s Note: MDPI stays neutral with regard to jurisdictional claims in published maps and institutional affiliations.