
Impact of Solid State Roadway Lighting on Melatonin in Humans

 , and
, and
Abstract
:1. Introduction
2. Results
2.1. Melatonin Assay Performance
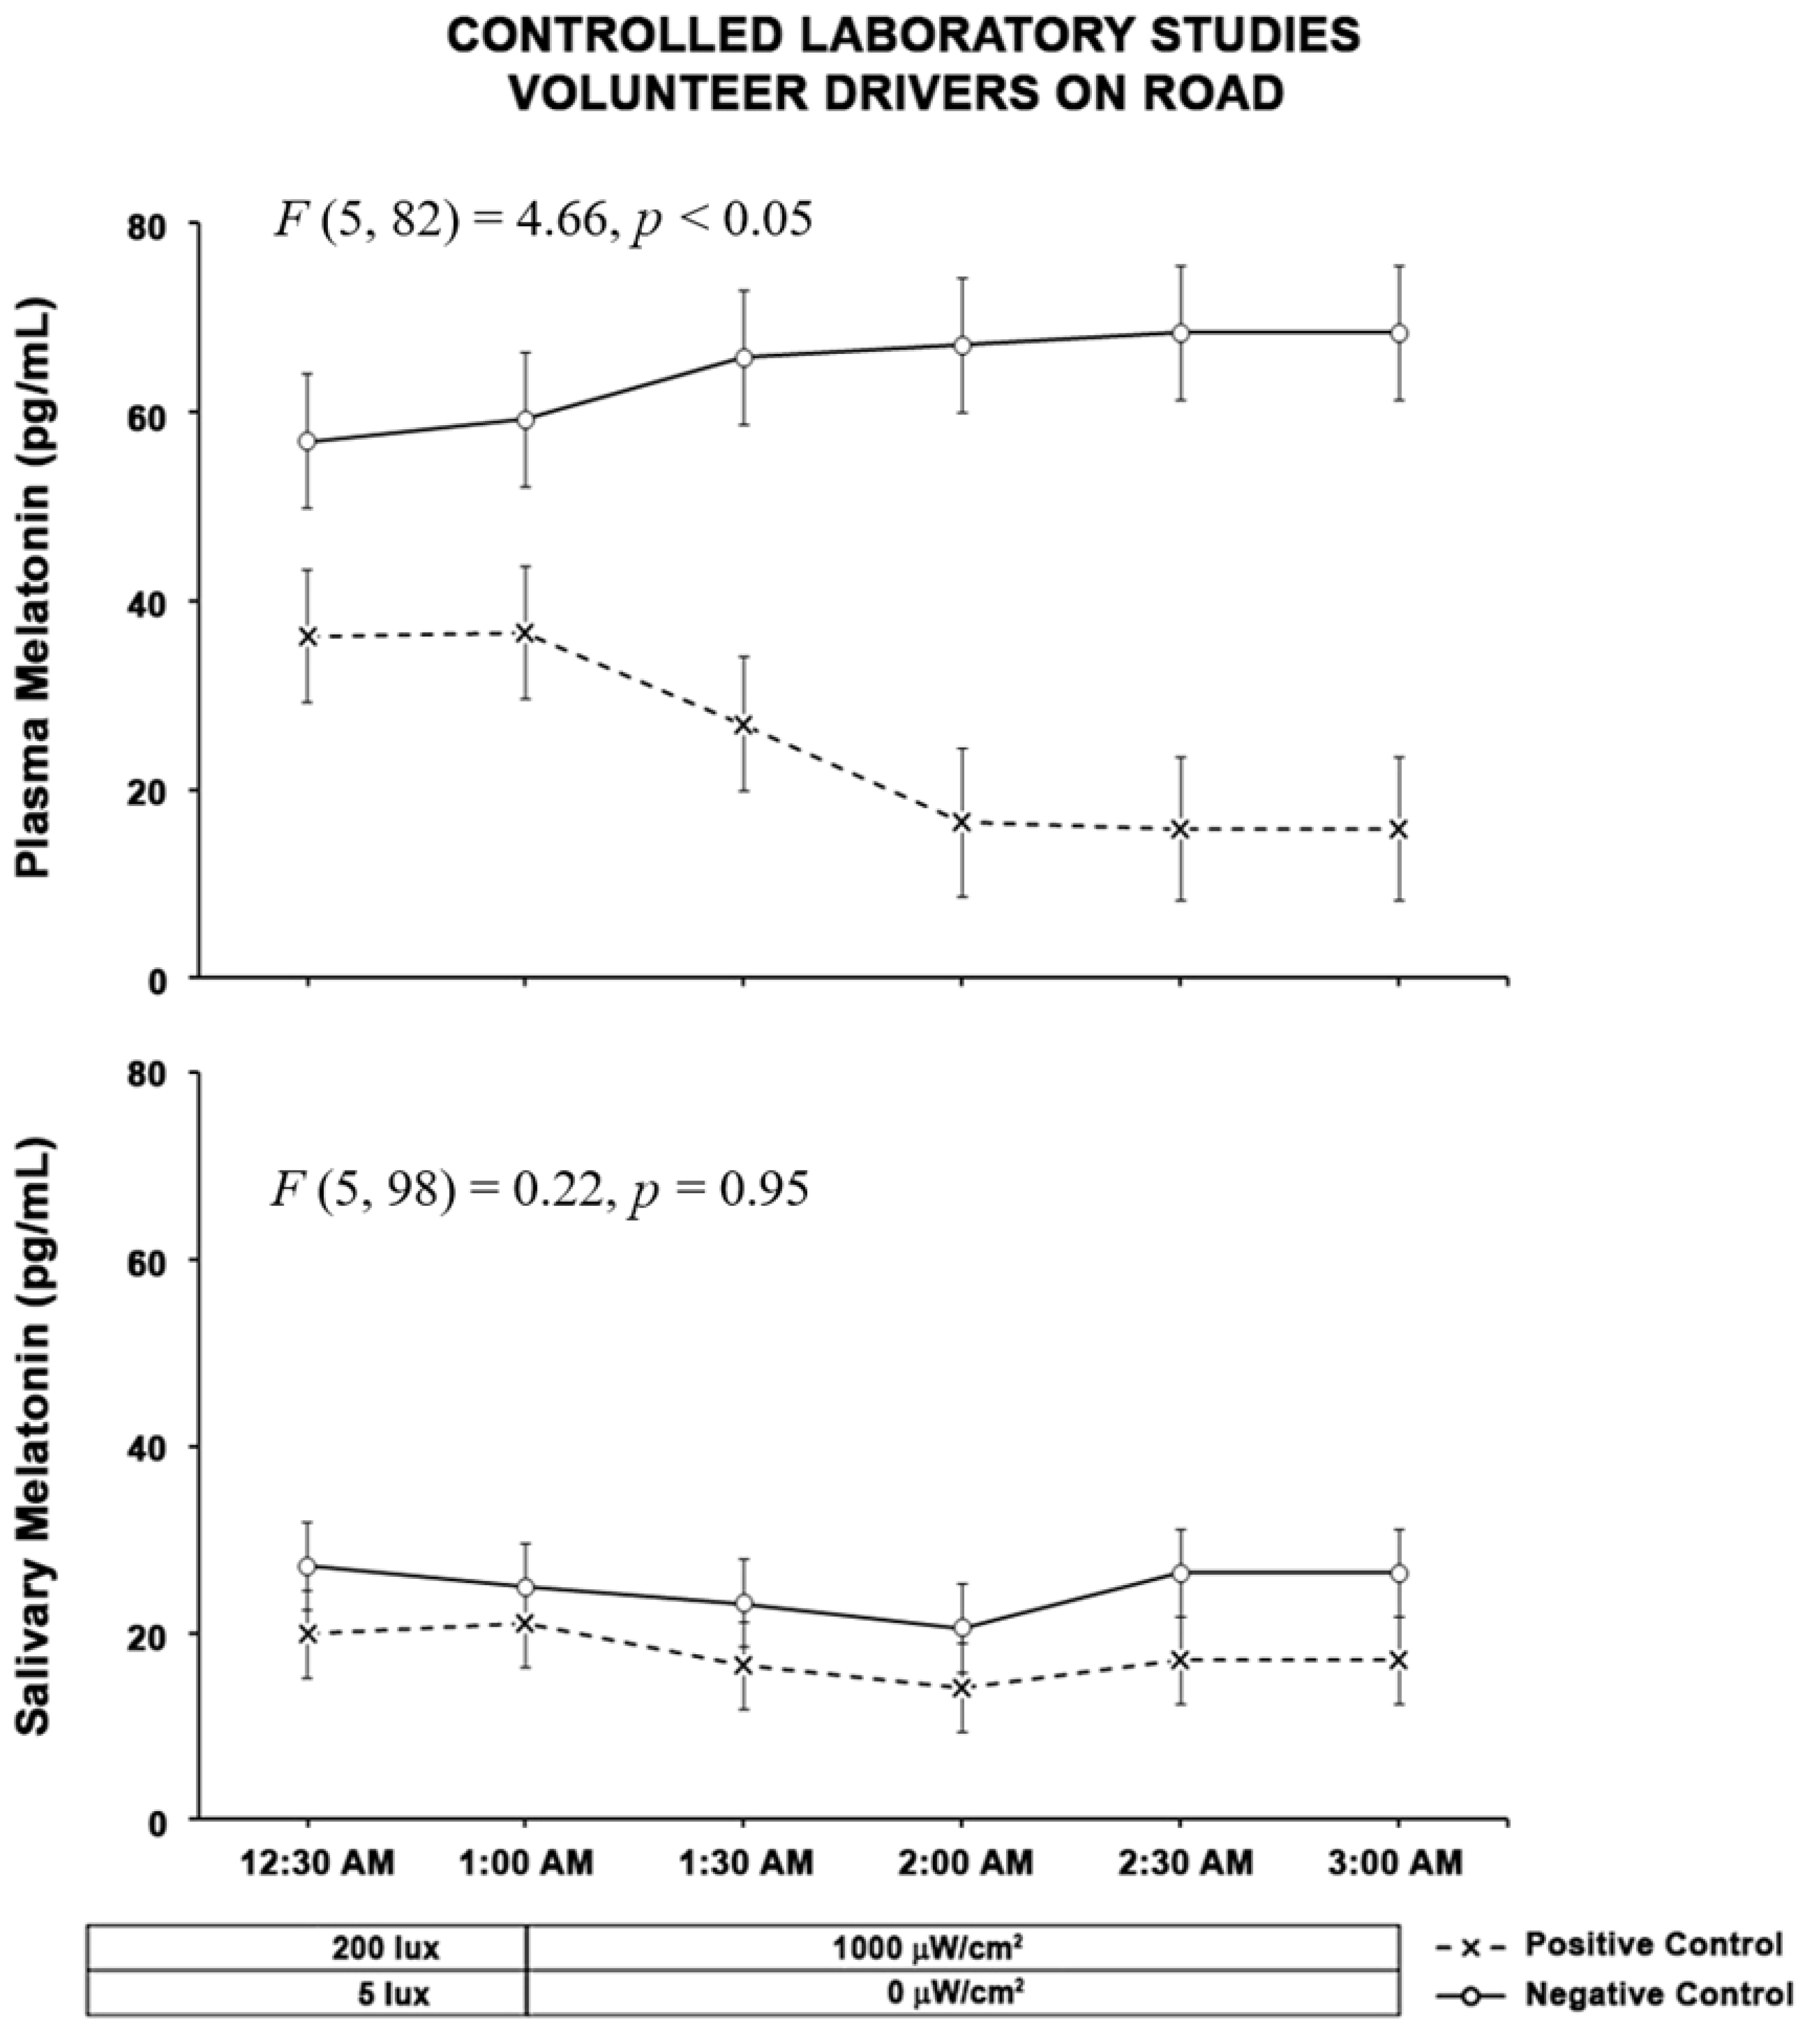
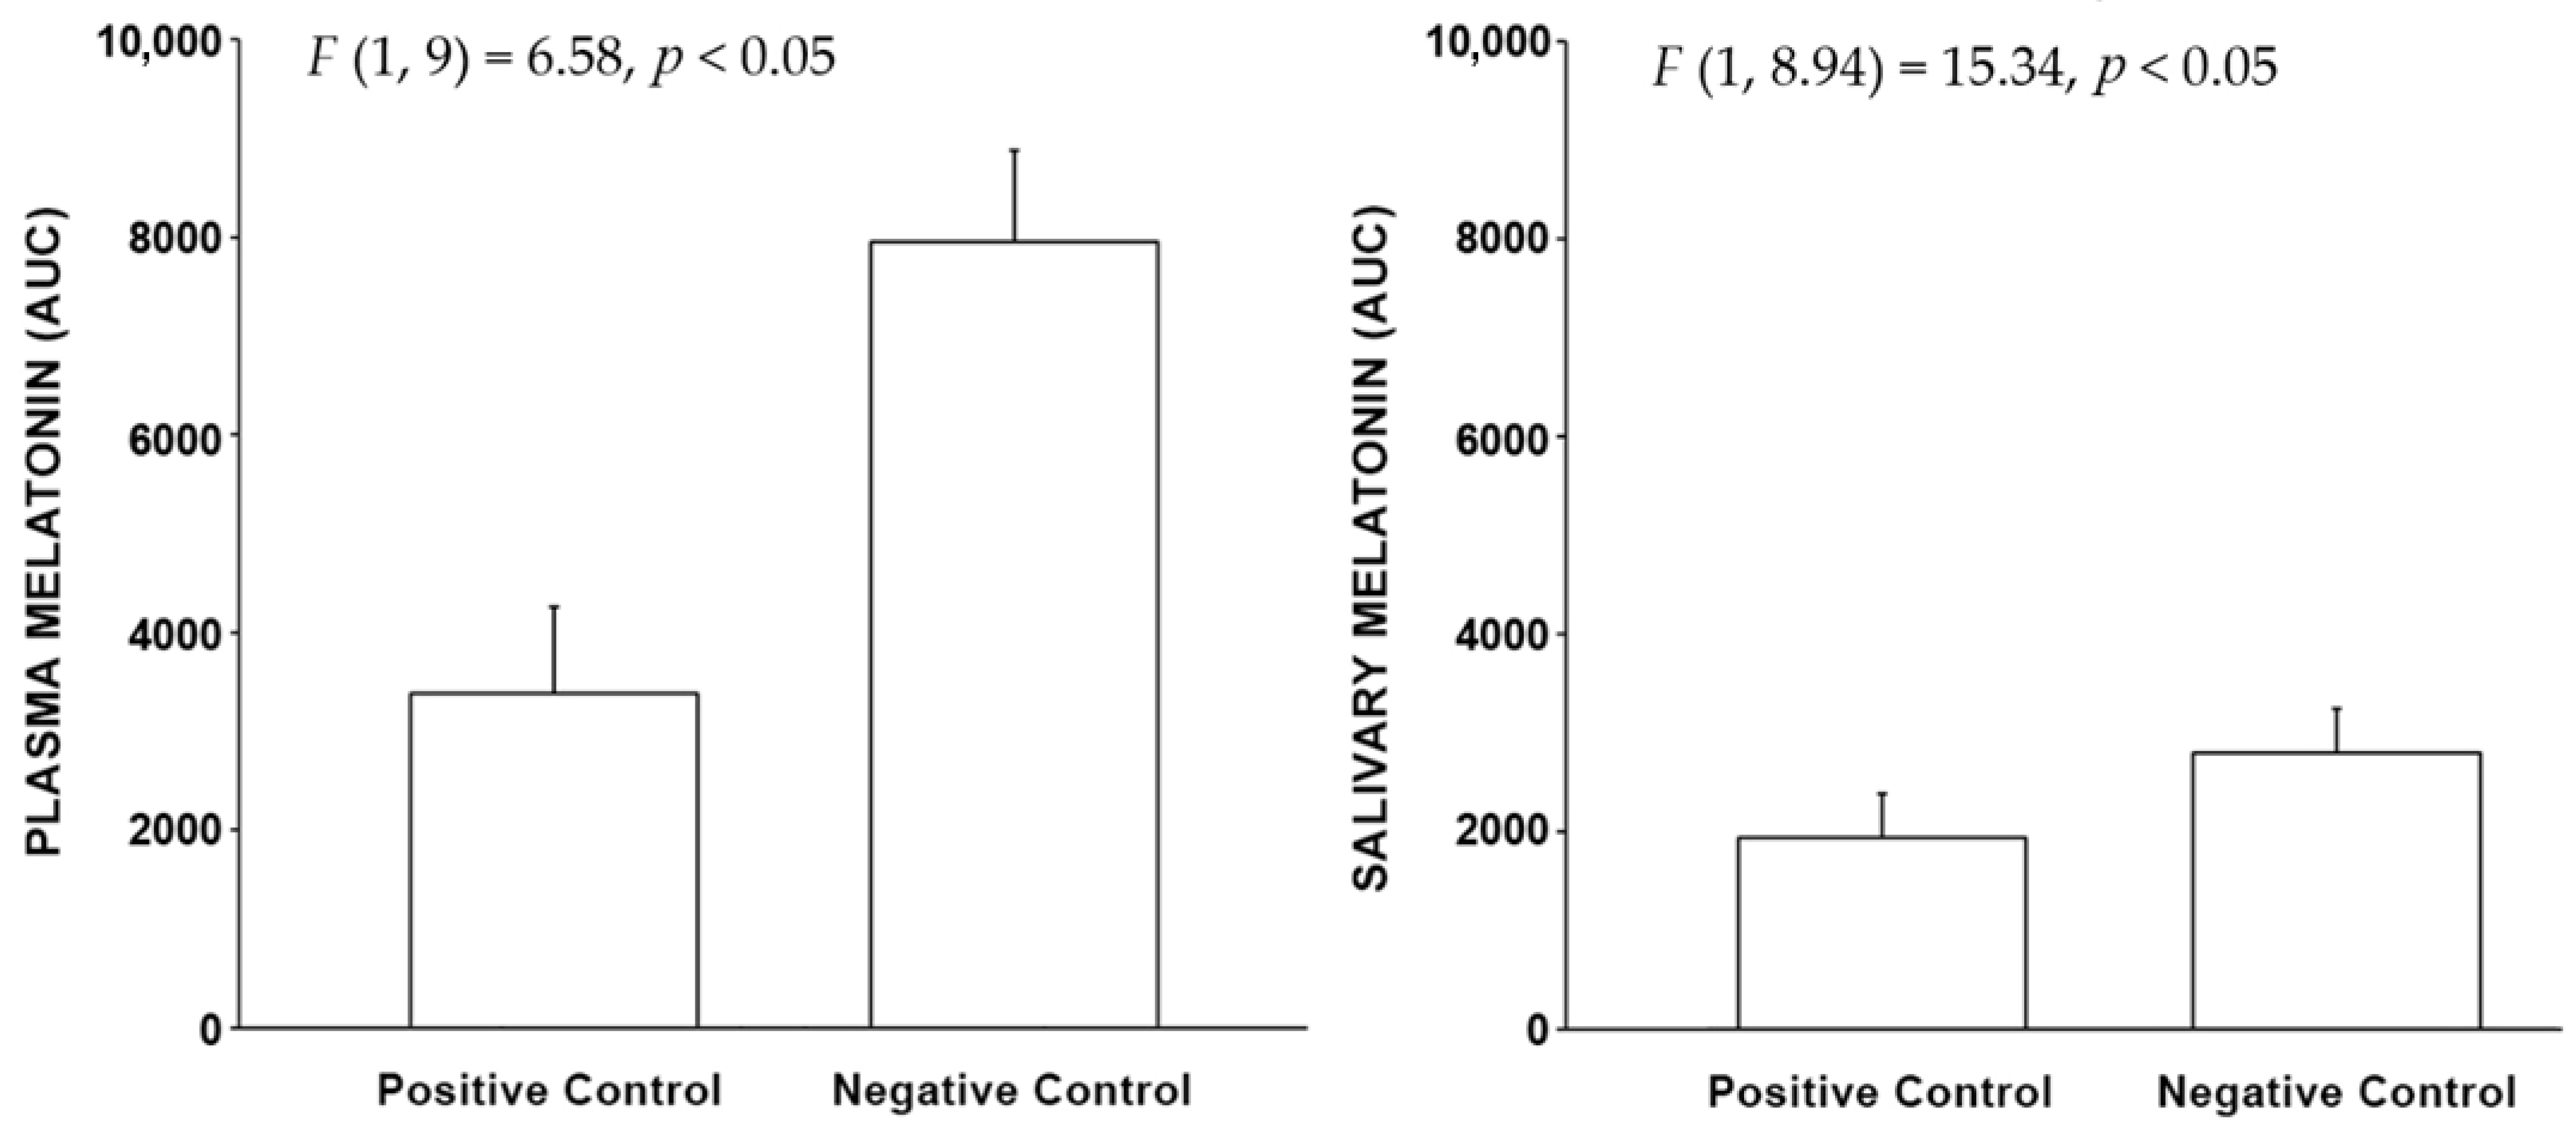
2.2. Control Results
2.2.1. Drivers
2.2.2. Pedestrians
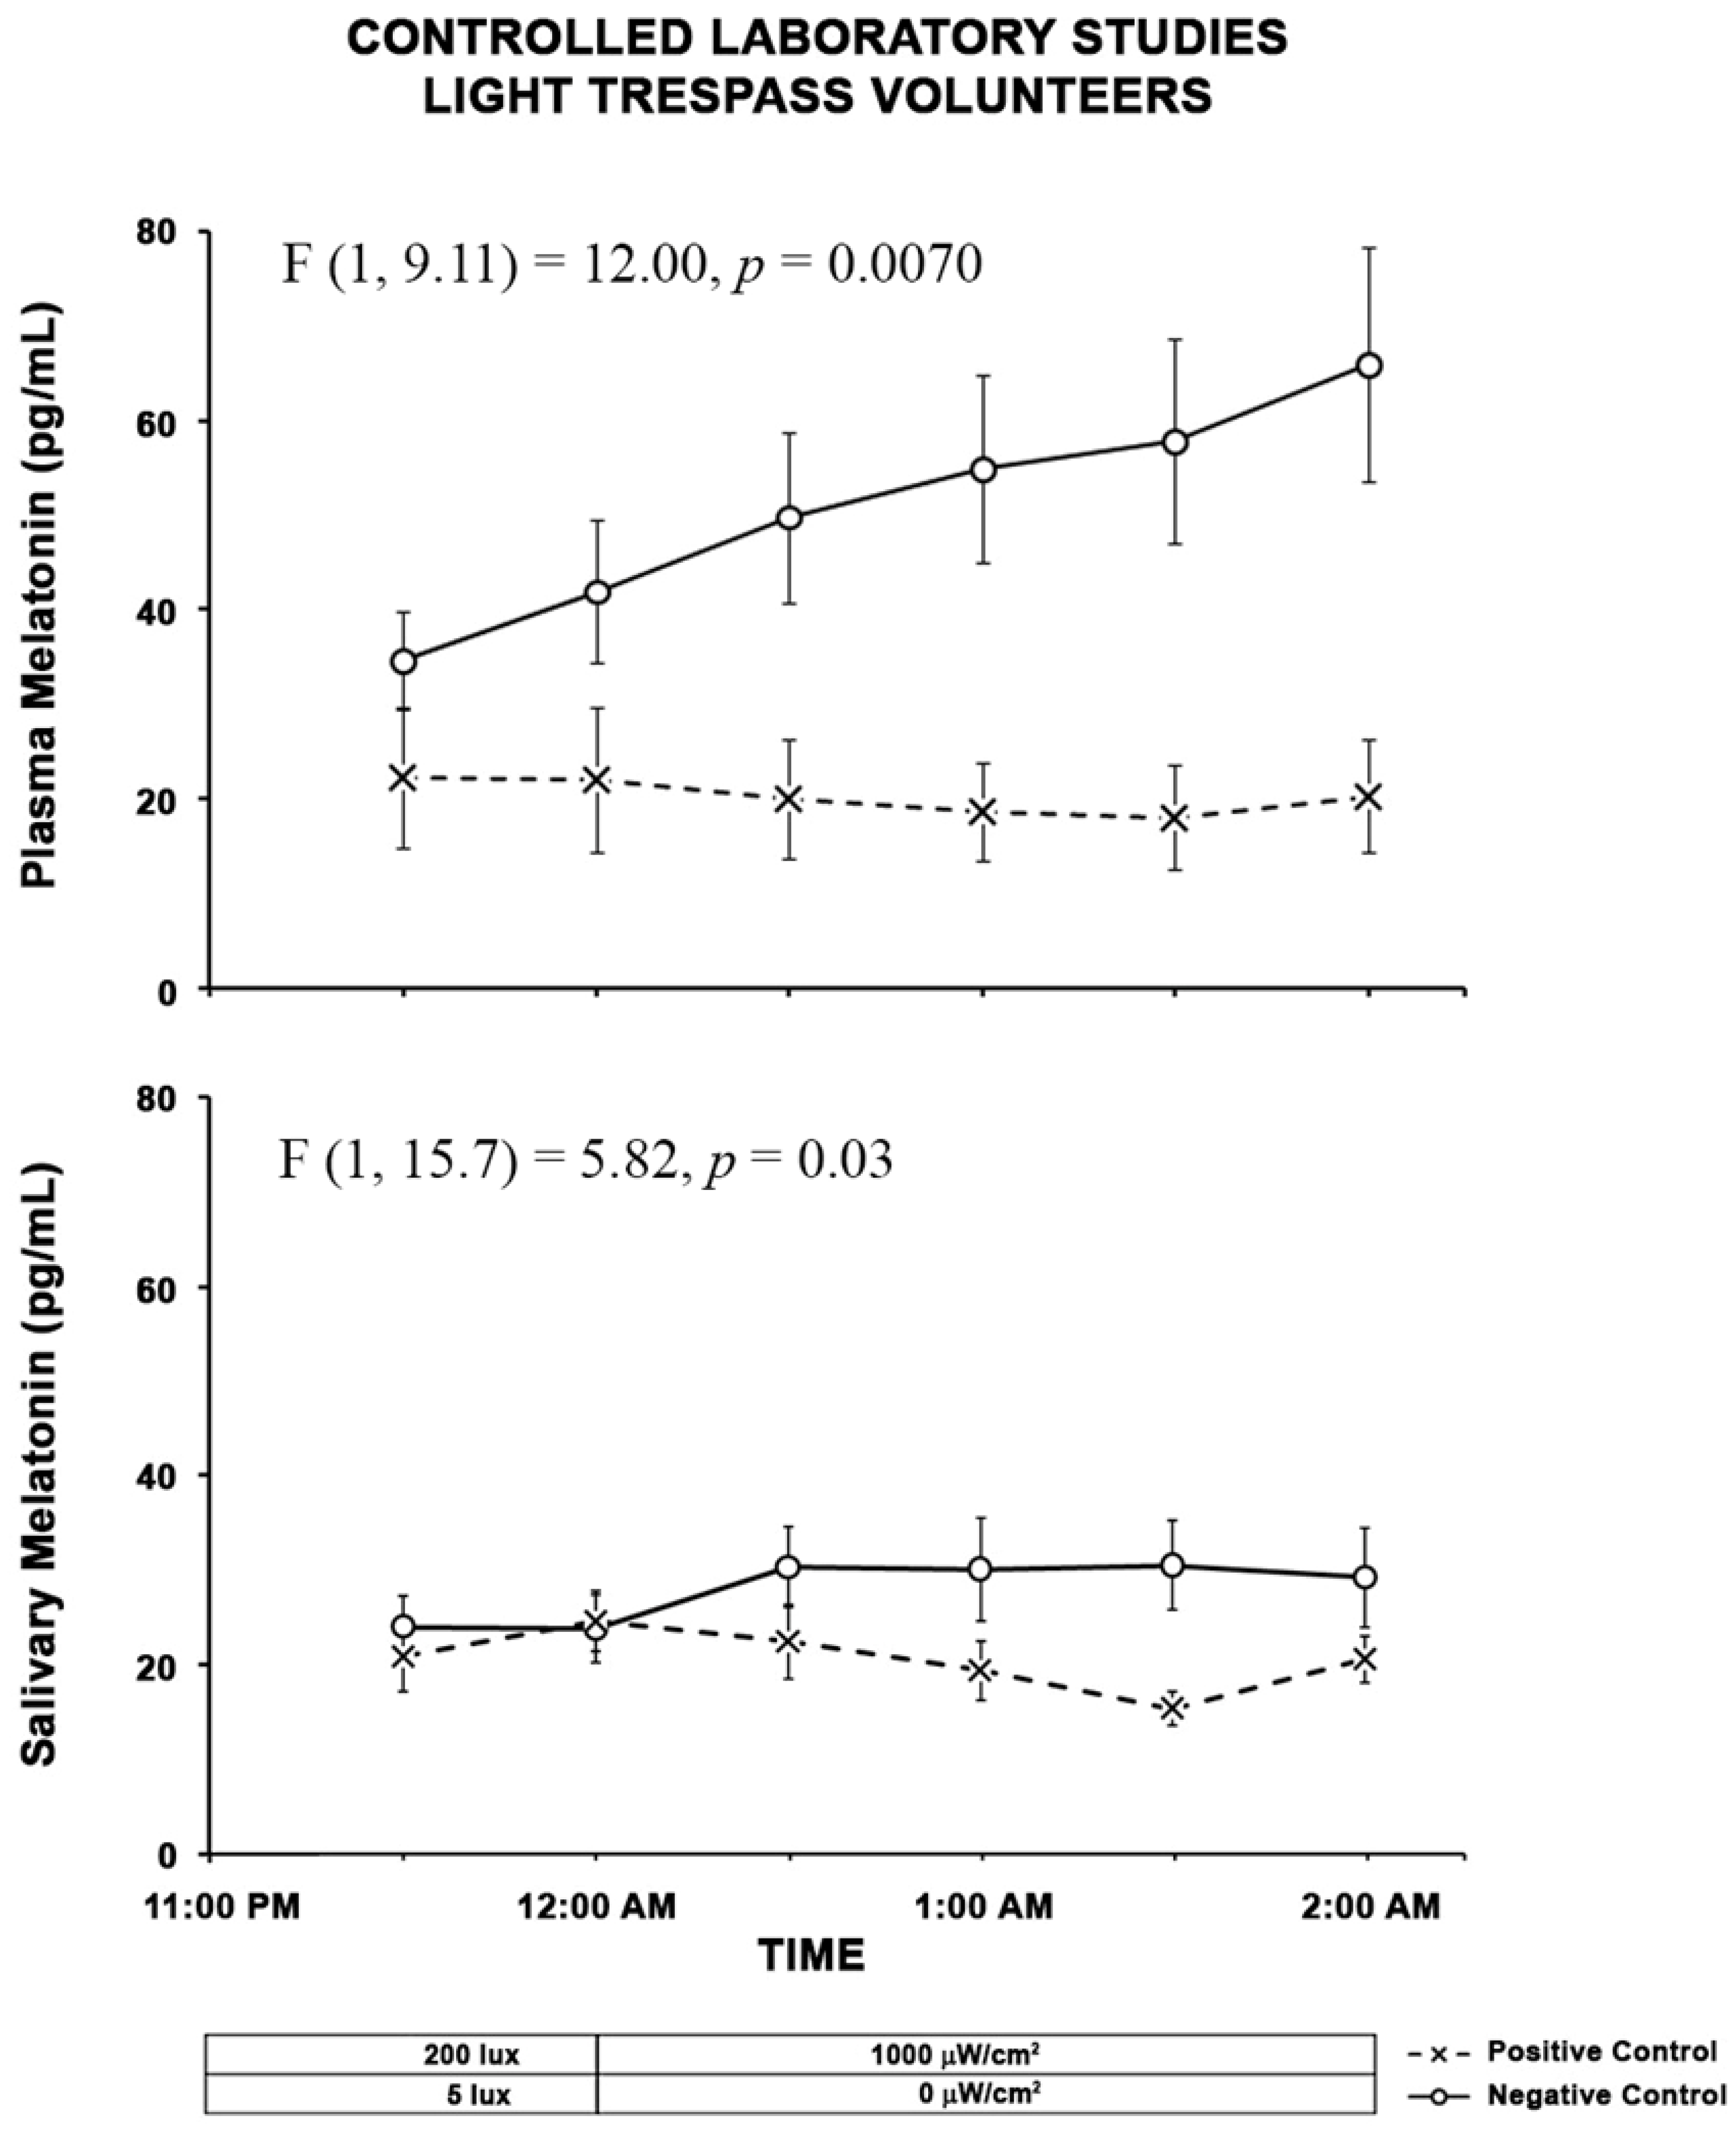
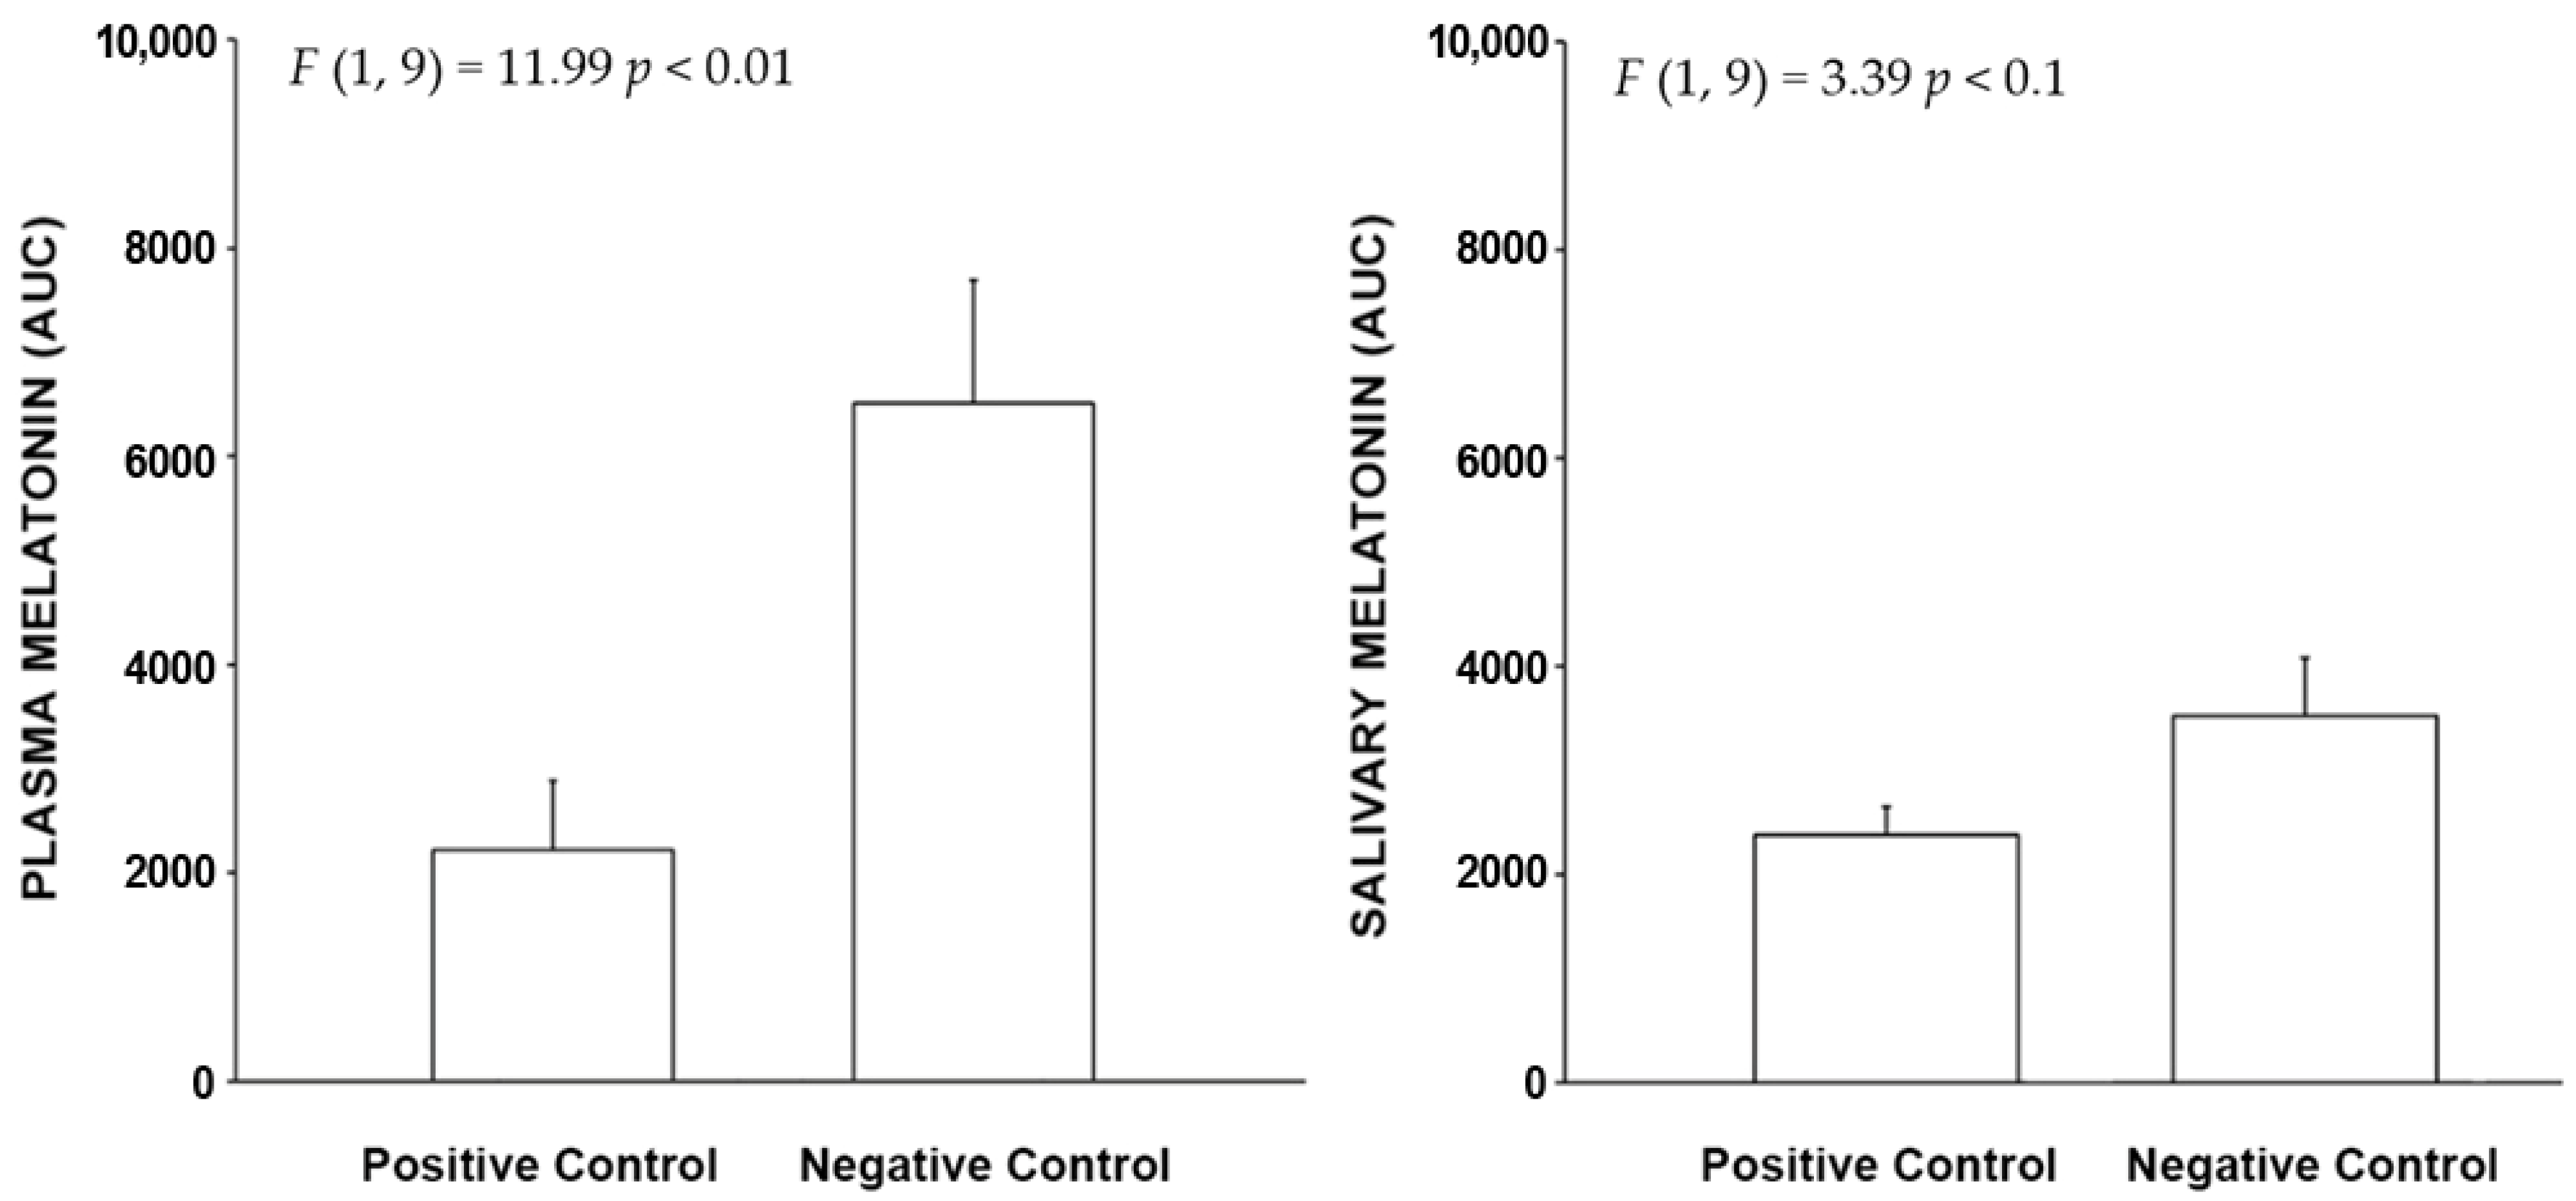
2.2.3. Light Trespass
2.3. Exposure Results
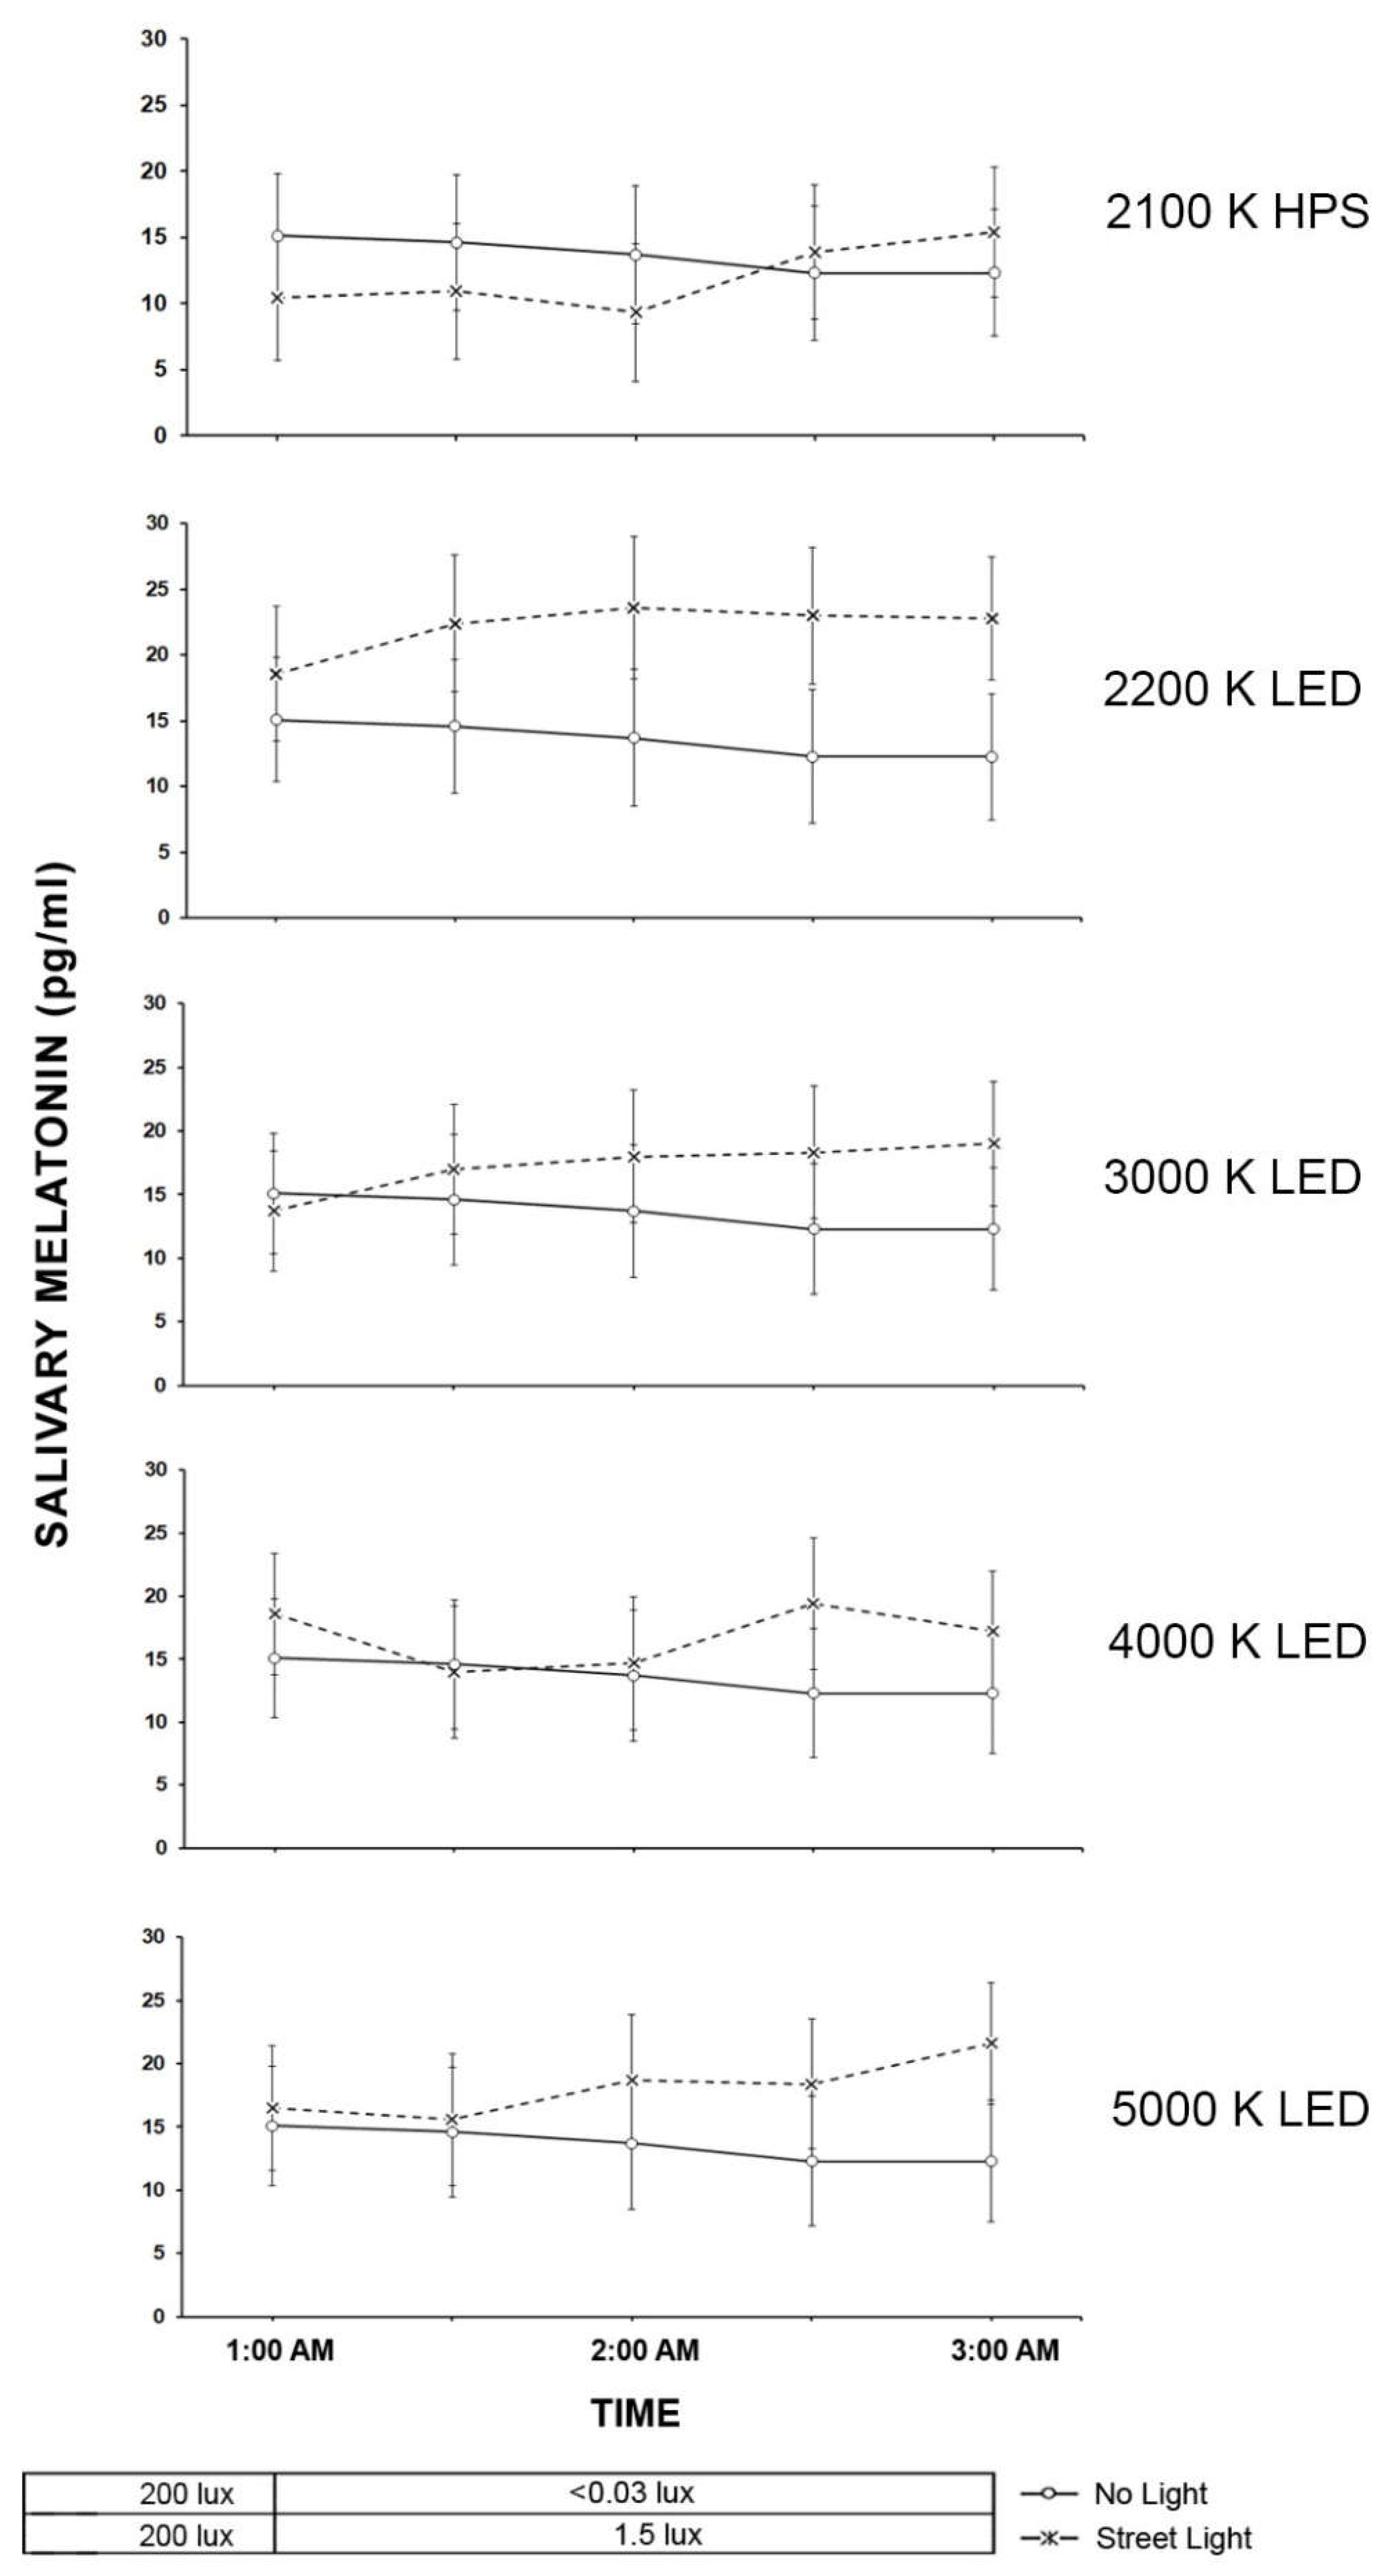
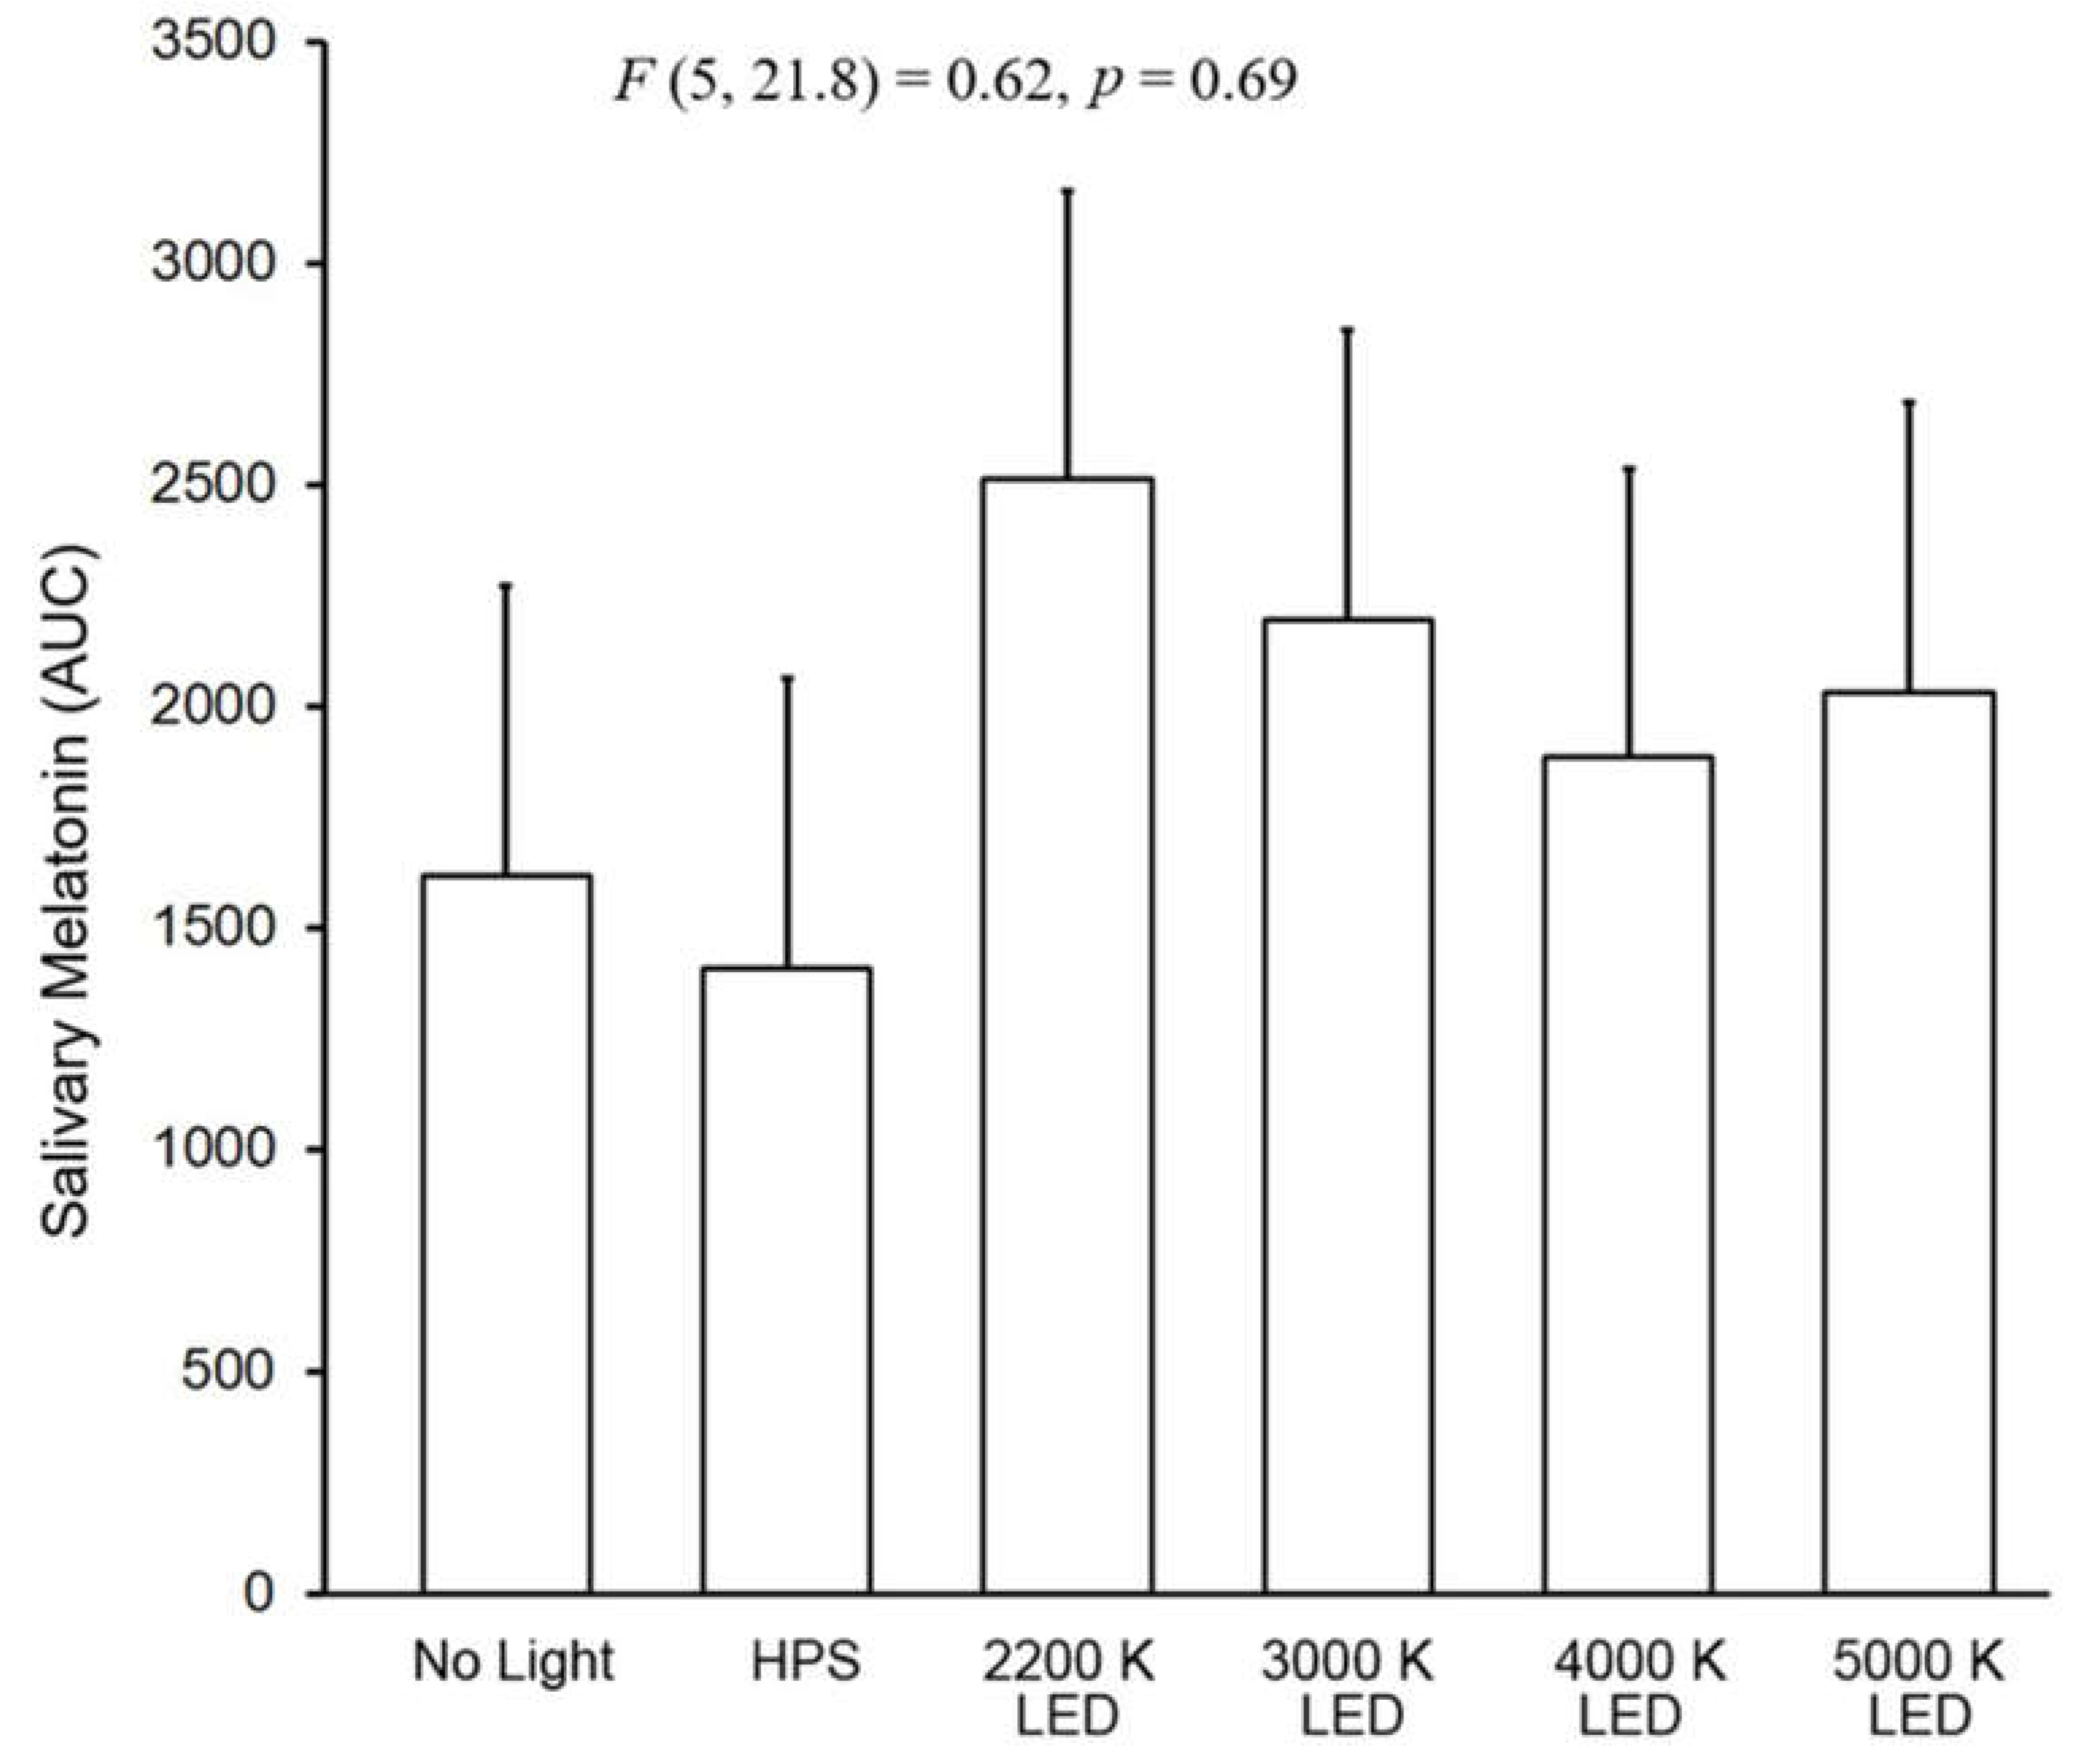
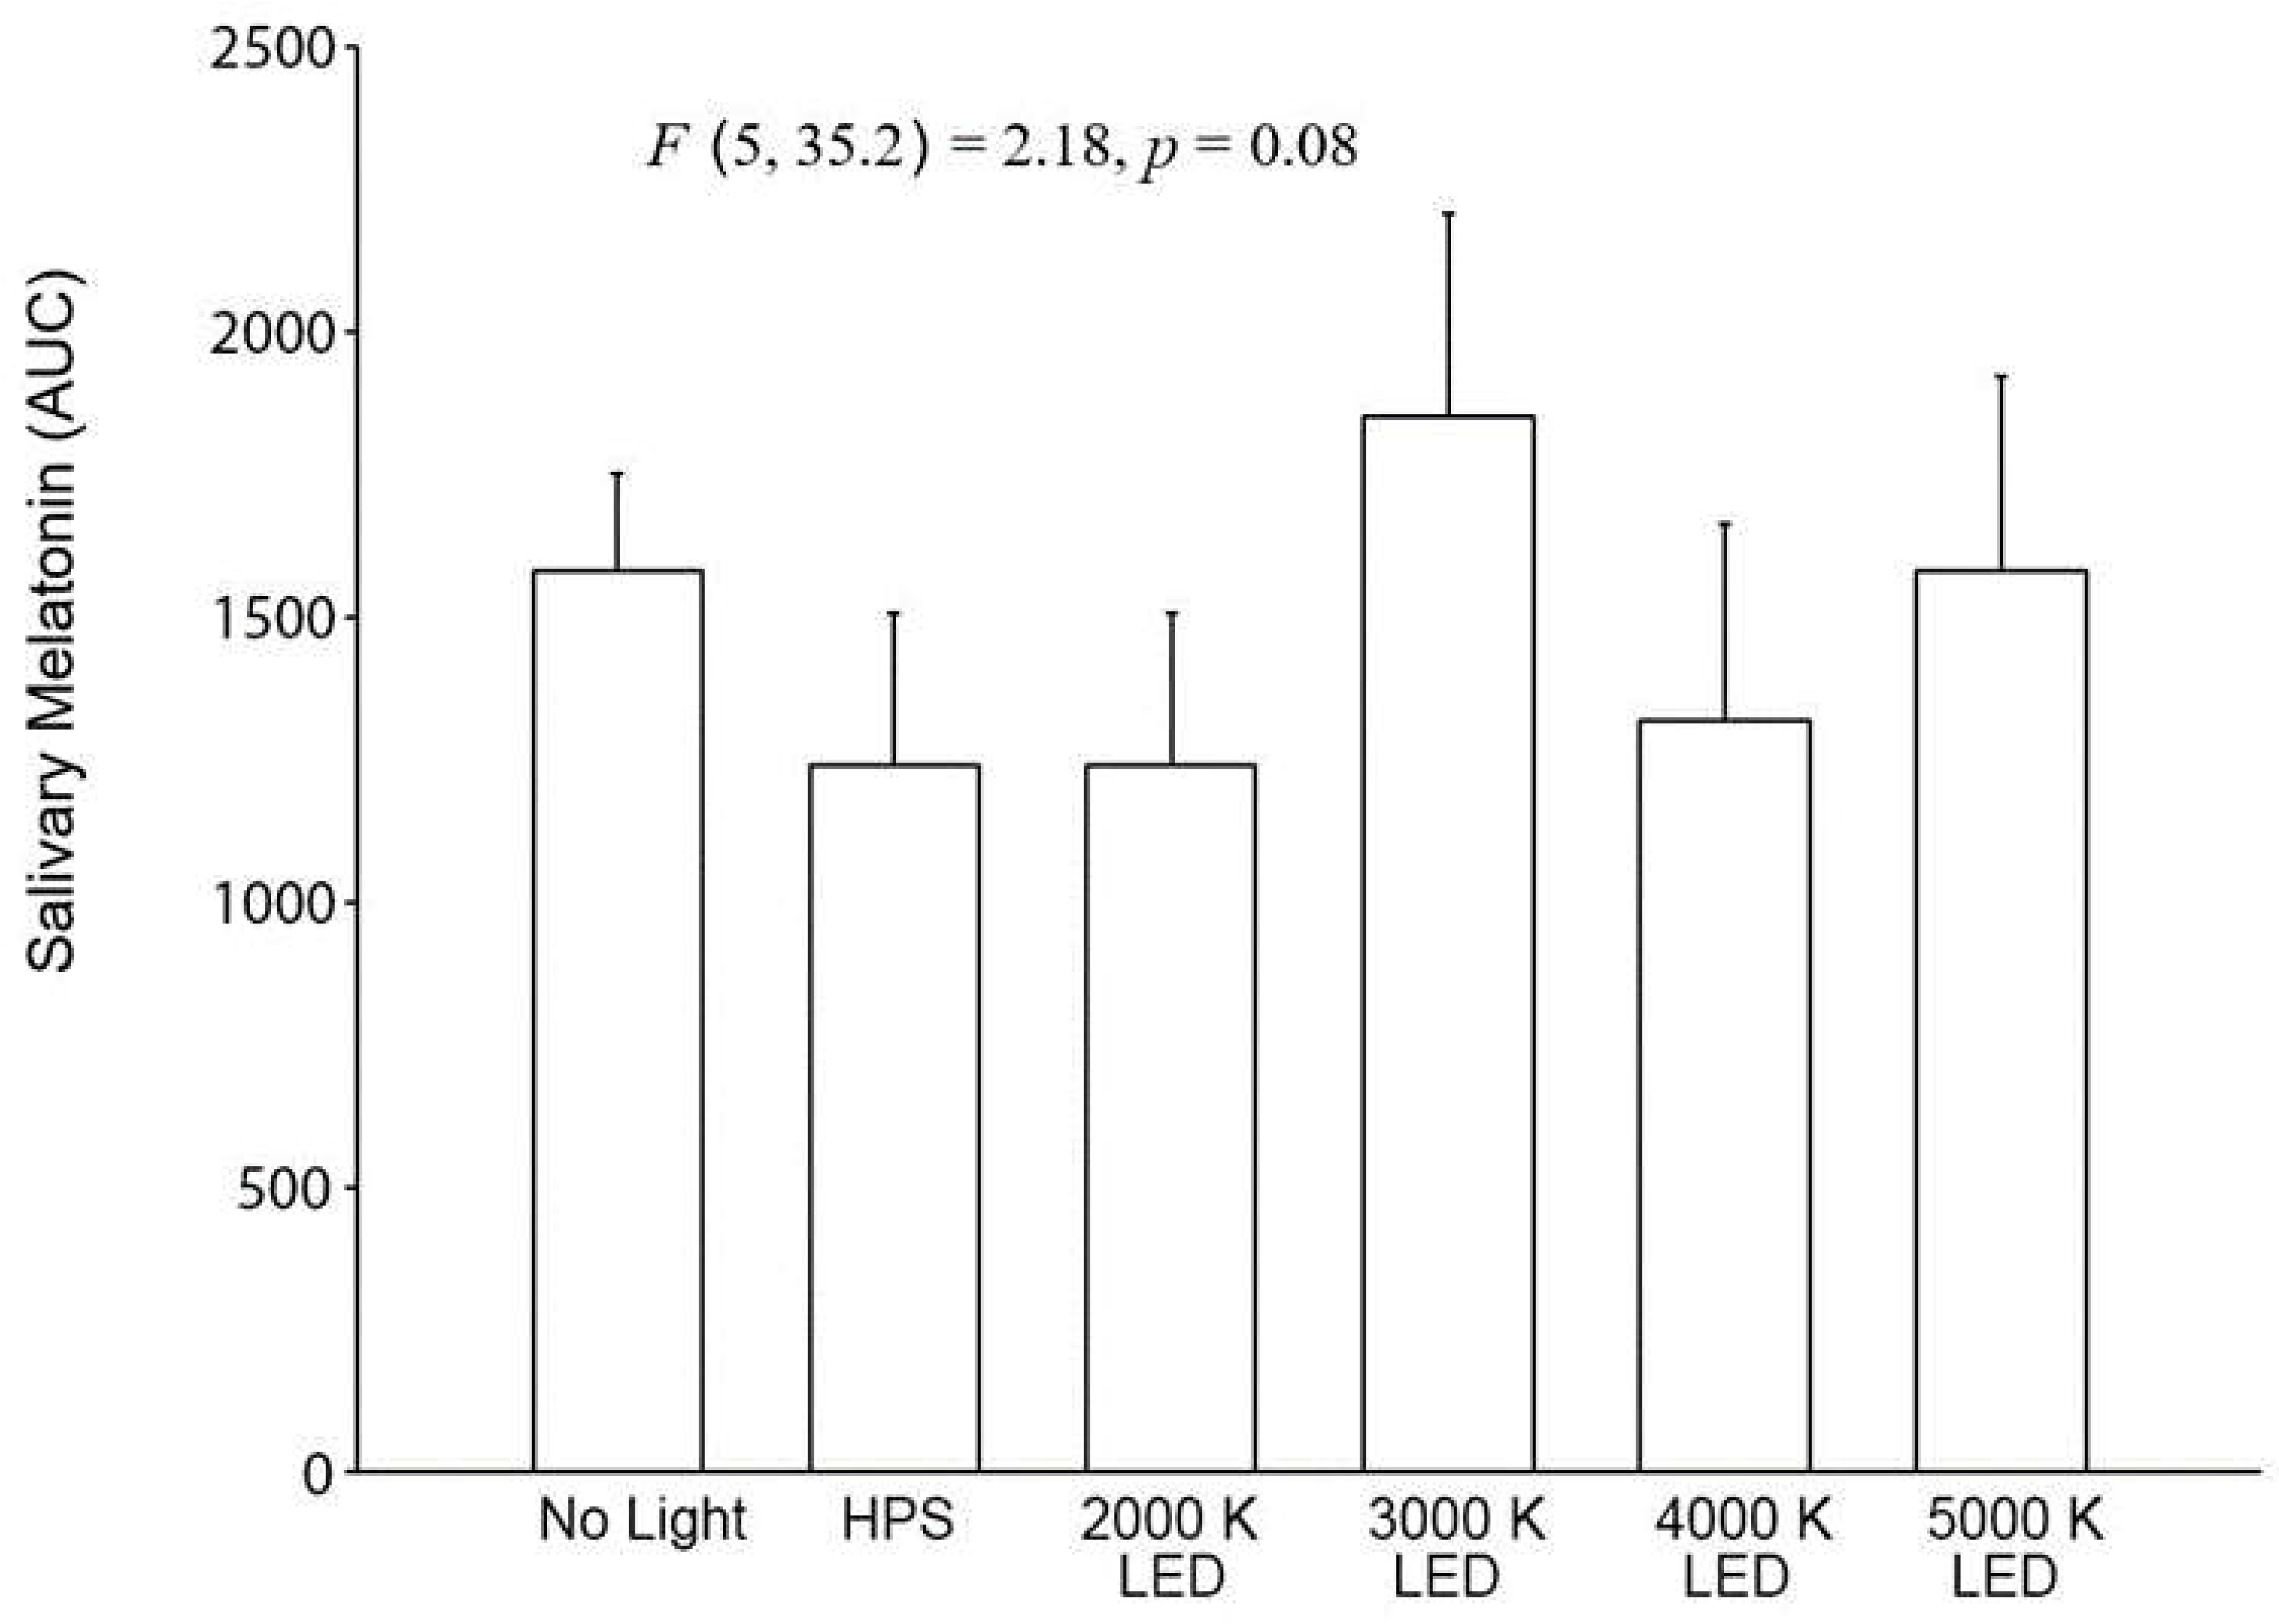
2.3.1. Drivers
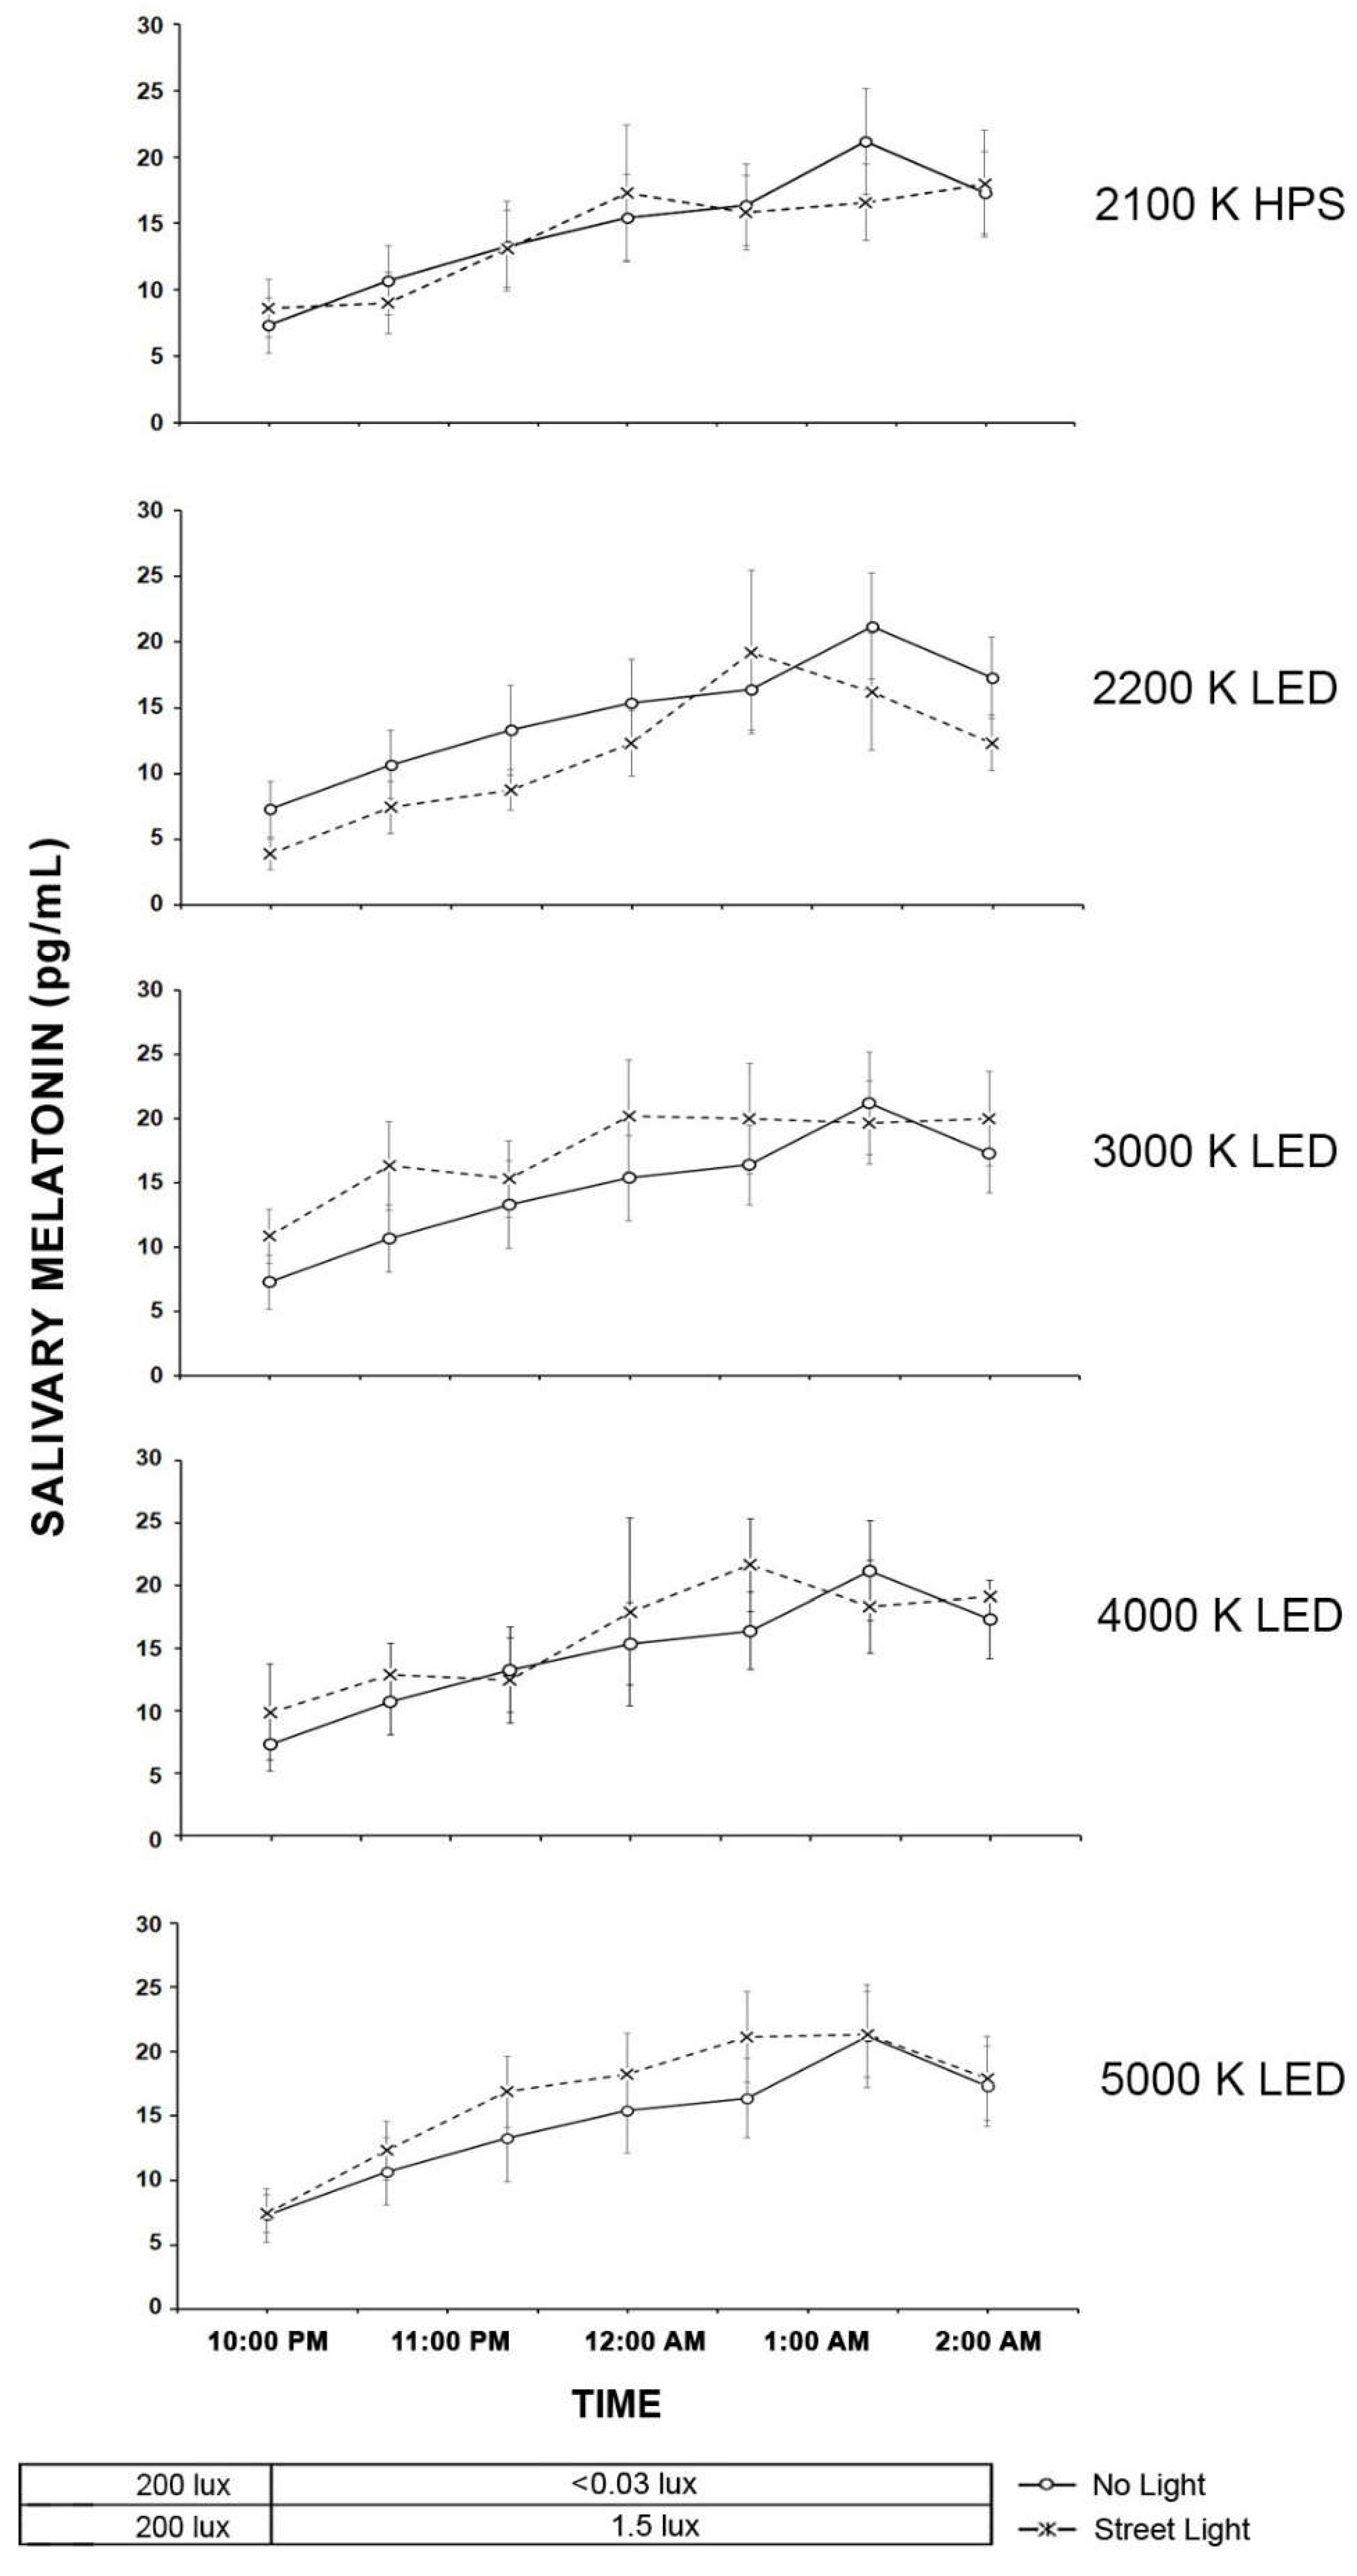
2.3.2. Pedestrians
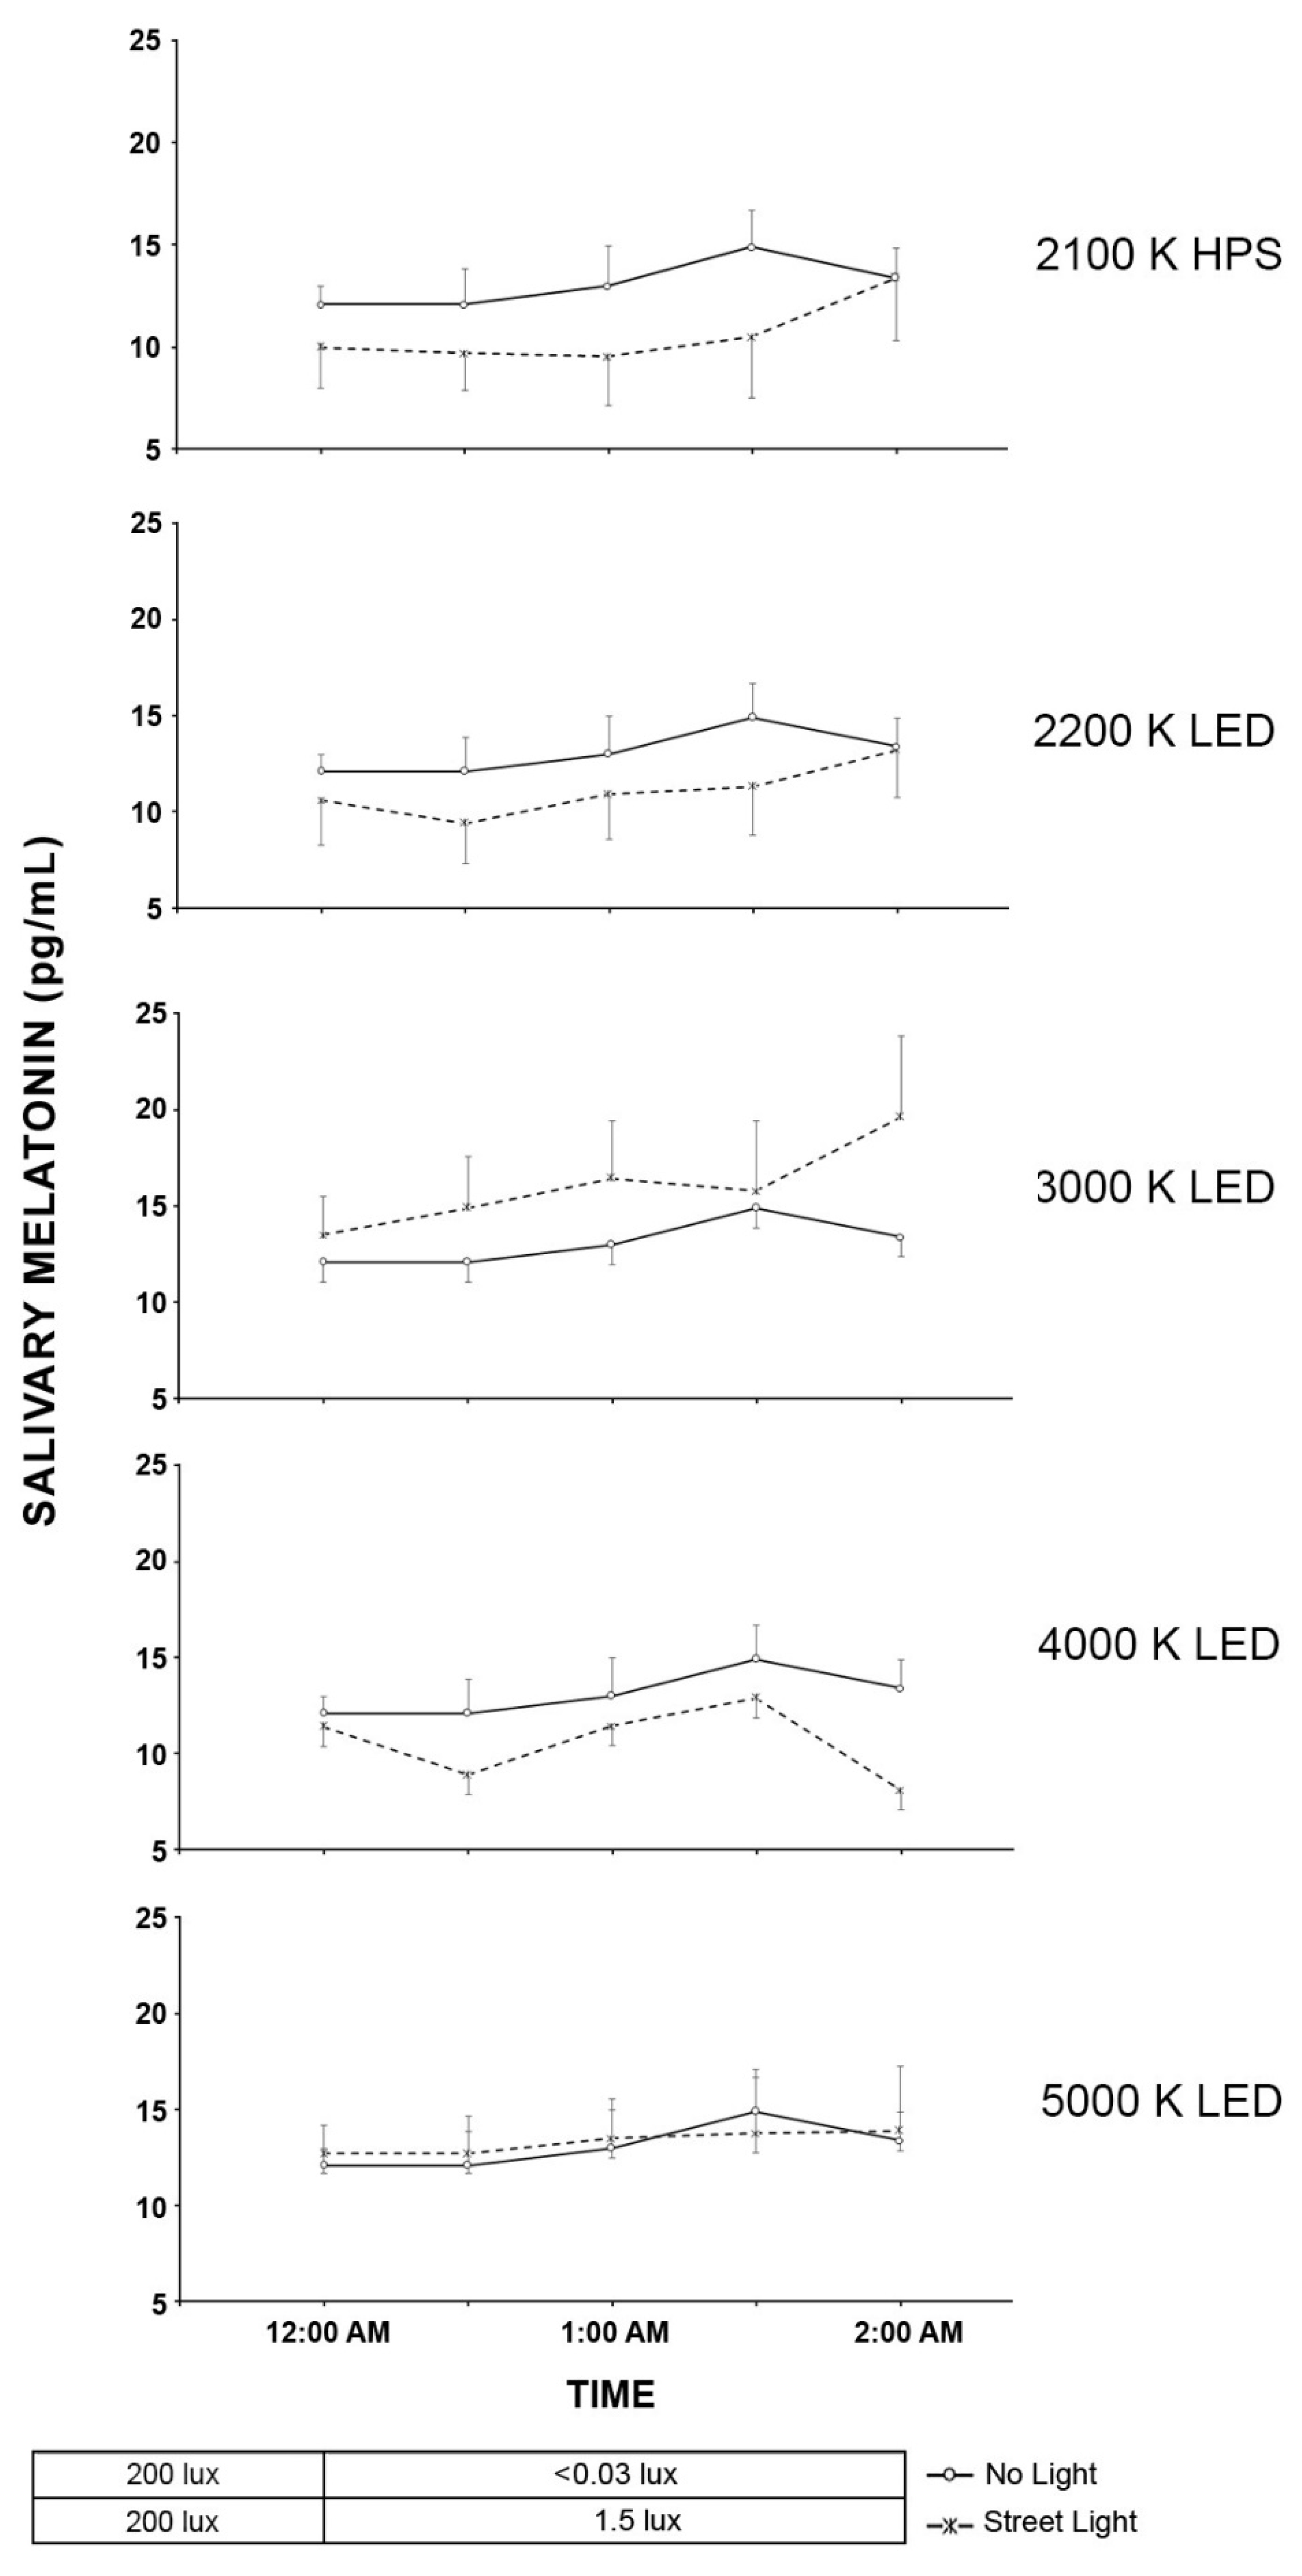
2.4. Light Trespass
3. Discussion
3.1. Control
3.2. Exposure
4. Methods
4.1. Control Experiment Methods
4.1.1. Control Exposure Space
4.1.2. Positive and Negative Control Sessions
4.2. Exposure Experimental Design
4.3. Equipment and Materials
4.3.1. Light Conditioning Space
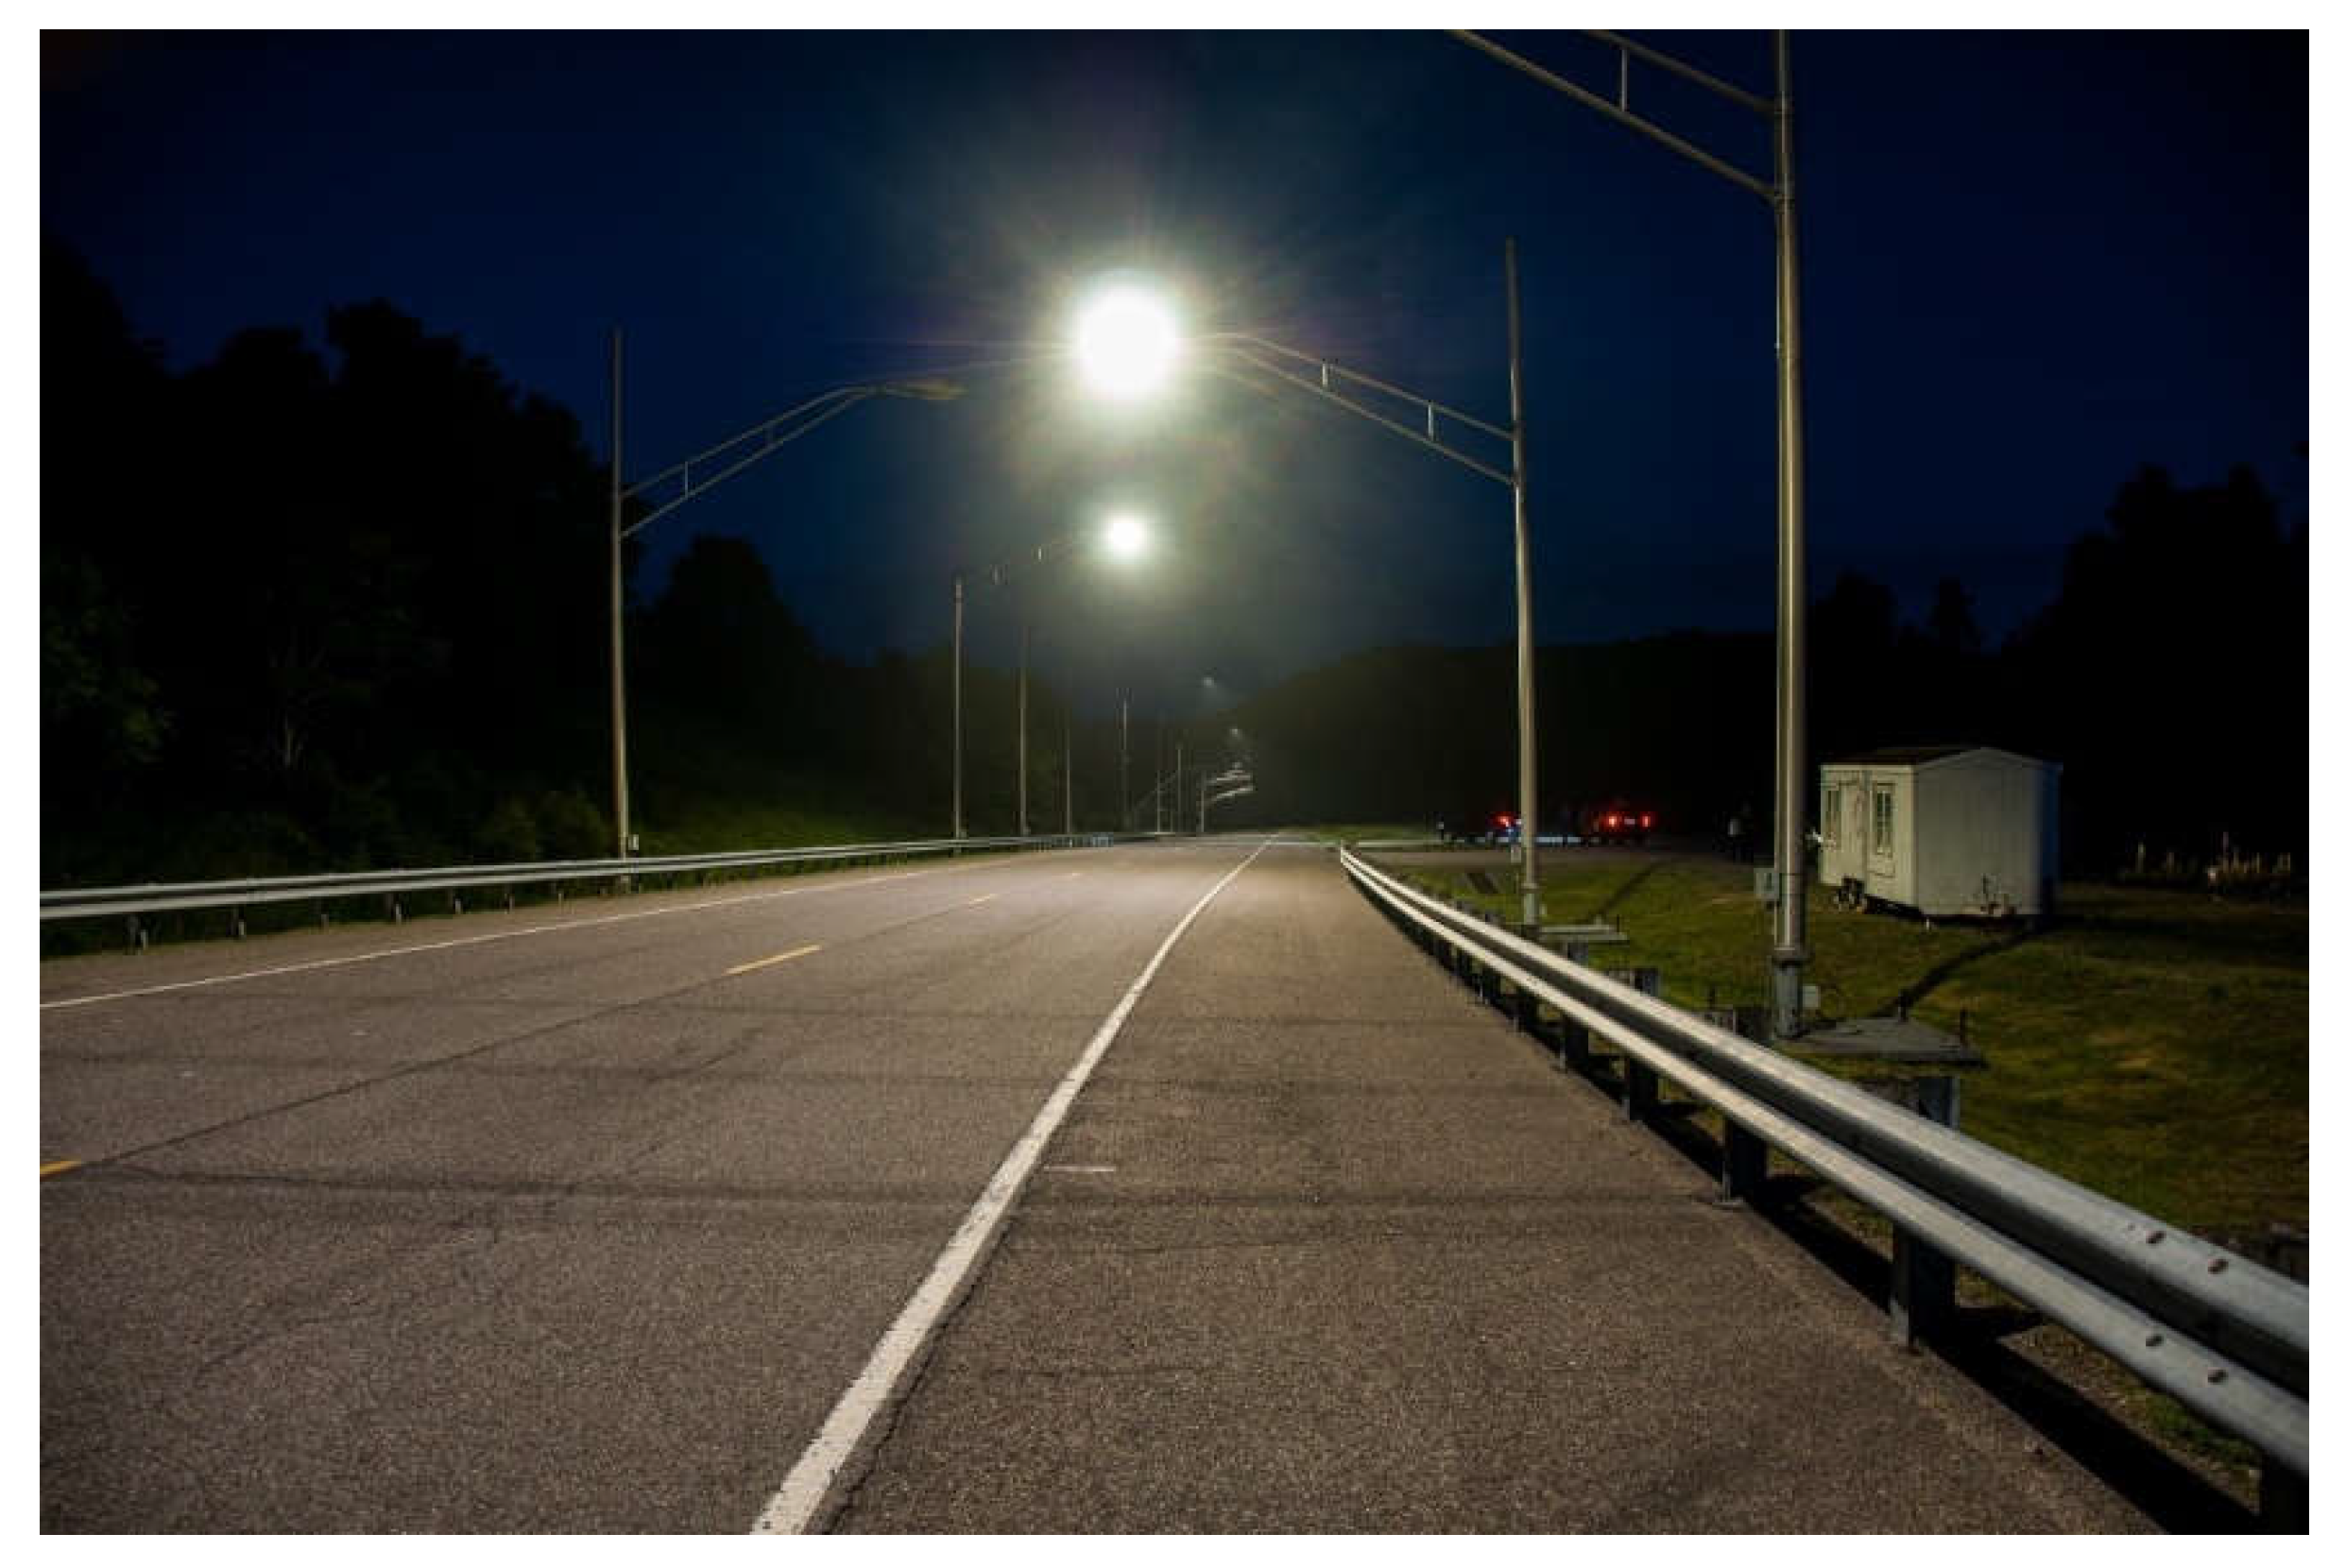
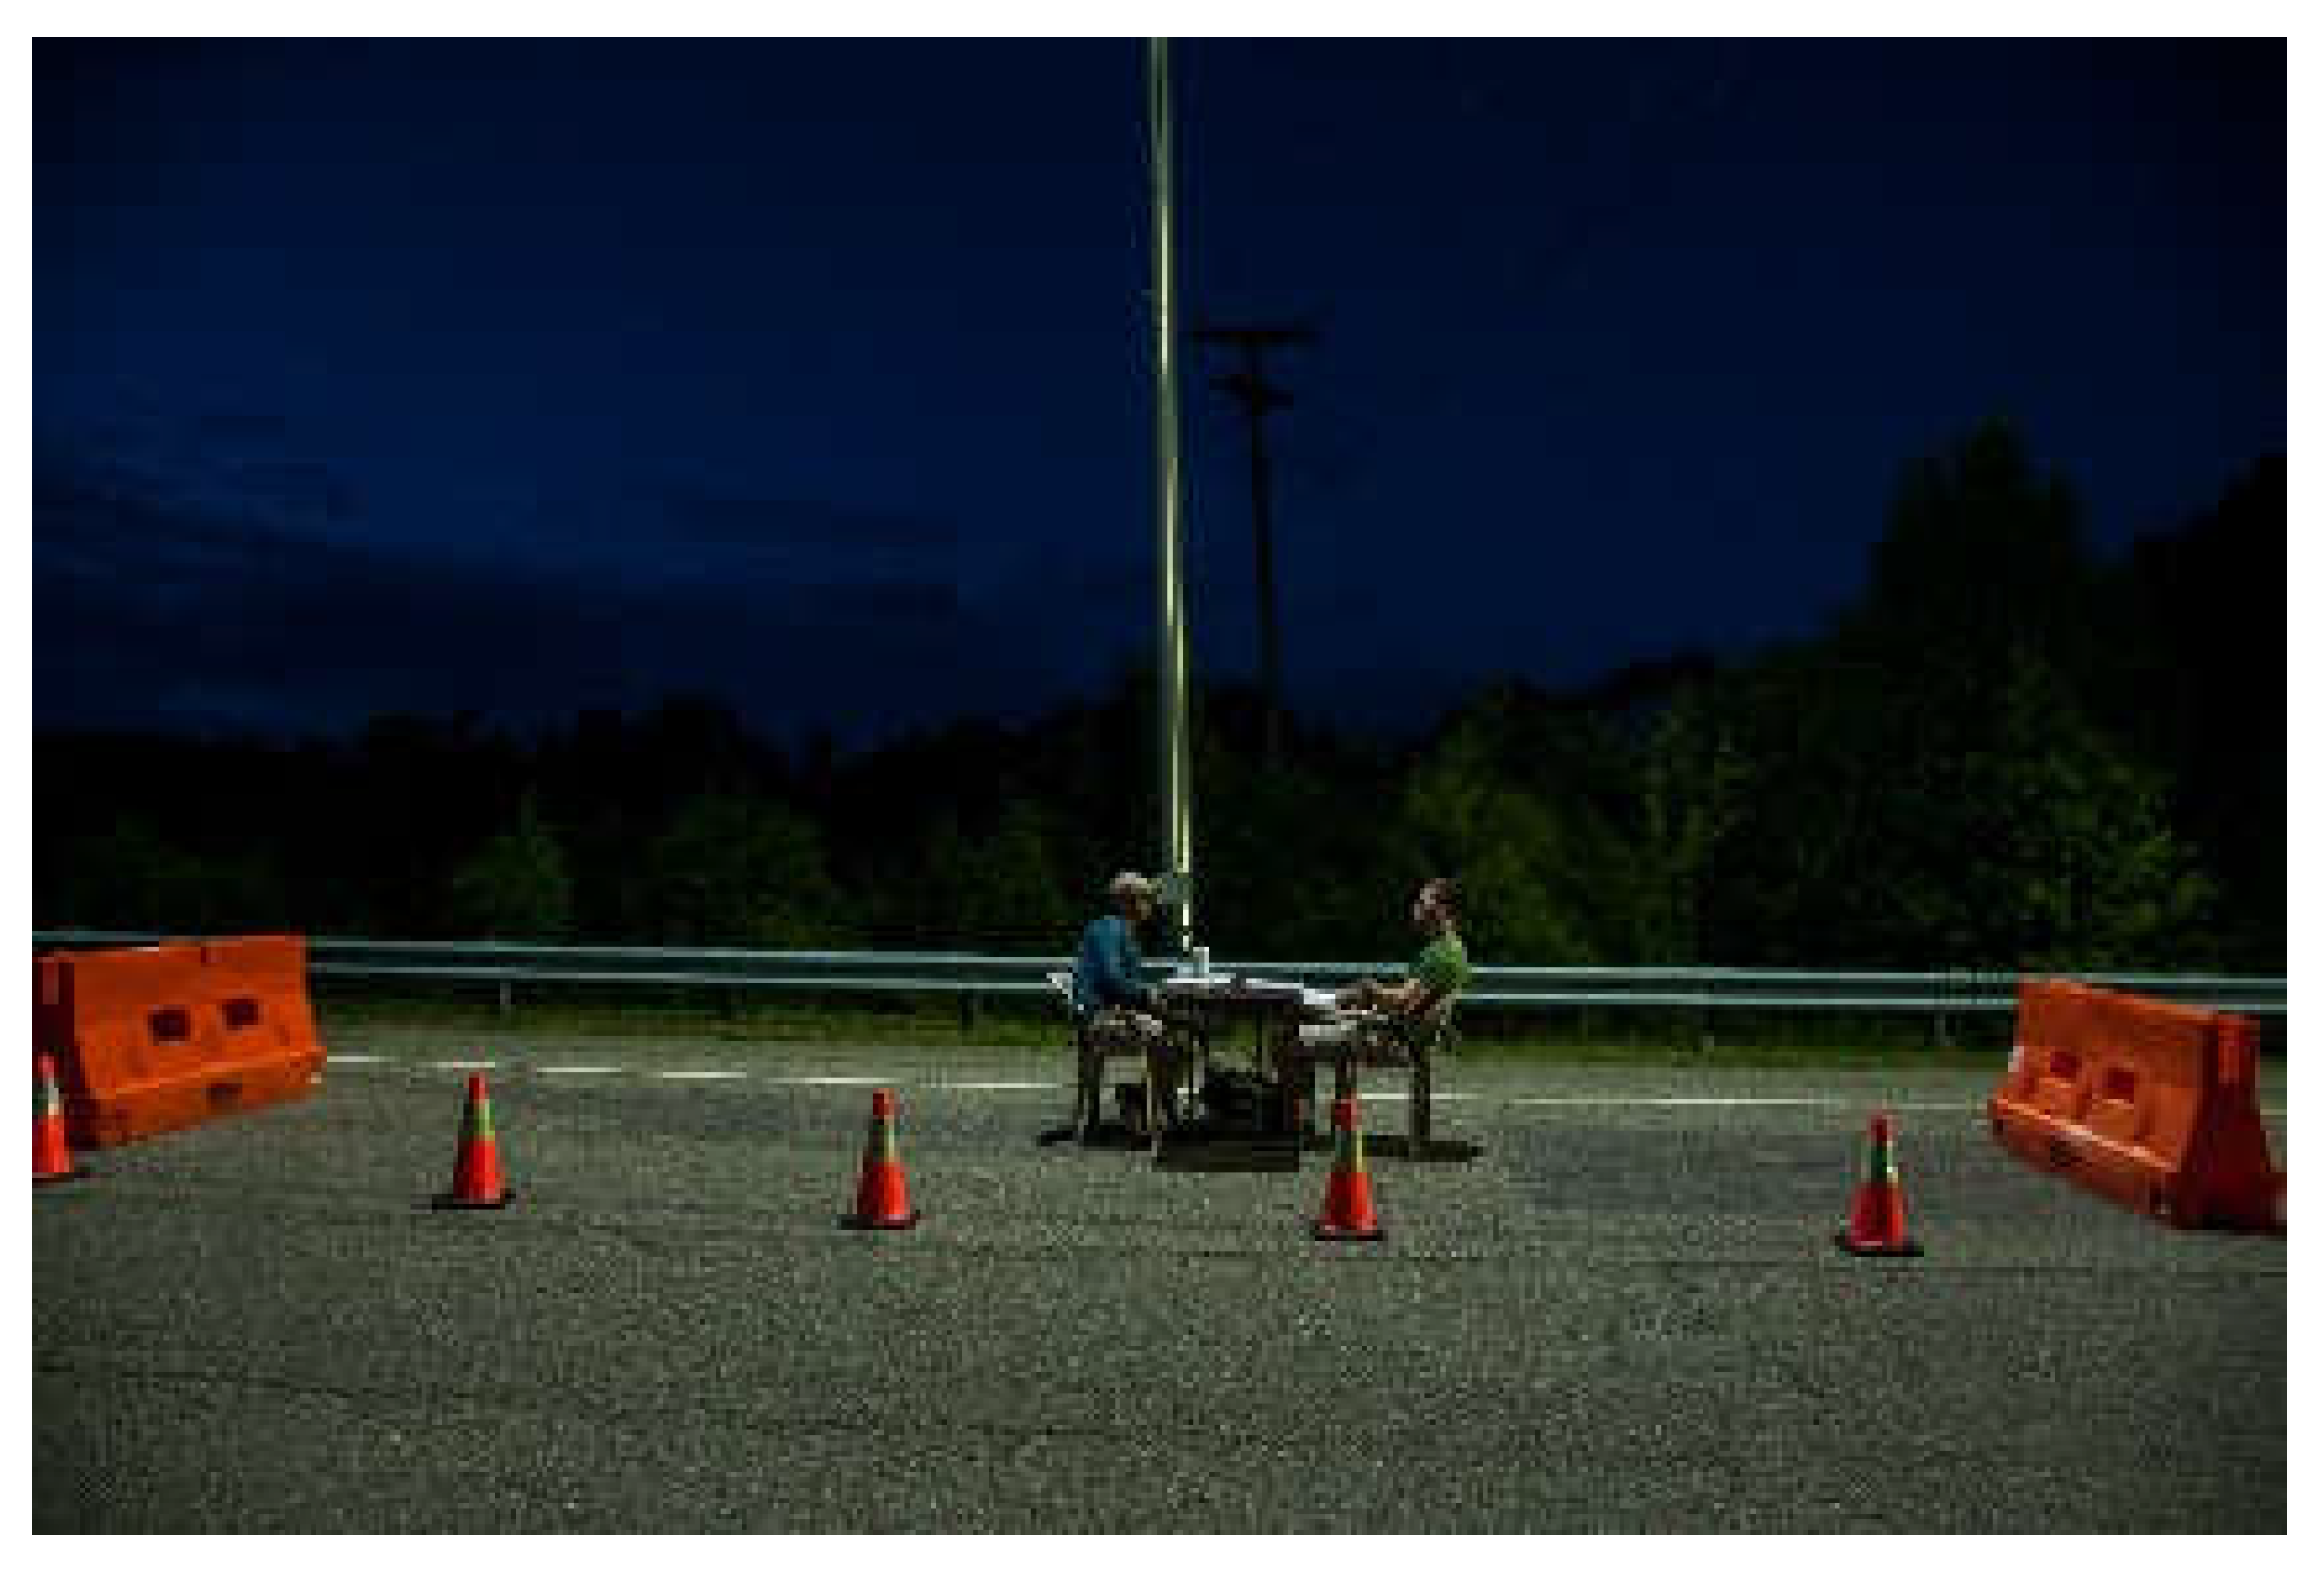
4.3.2. Smart Road Facility
4.4. Procedure
4.4.1. Orientation Session
4.4.2. Experimental Exposure Sessions
4.4.3. Conditioning
4.4.4. Road Lighting Exposure Sessions
4.4.5. Sample Processing
4.5. Participants
4.6. Data Analysis
5. Conclusions
- Using plasma-based measurements to provide a more sensitive measure of melatonin to roadway lighting trespass.
- Studying additional durations and intensities to define the boundaries of impact of the roadway lighting more fully on melatonin regulation.
- Obtaining measurement of other physiological and behavioral parameters to show different impacts of light trespass from roadway lighting on human health and well-being.
Author Contributions
Funding
Institutional Review Board Statement
Informed Consent Statement
Data Availability Statement
Acknowledgments
Conflicts of Interest
References
- World Health Organization. Regional Office for the Eastern Mediterranean, Technical Discussion on Road Traffic Injuries: A Growing Public Health Concern; EM/RC56/Tech.Disc.1; Fifty-sixth Session. 2009. Available online: https://apps.who.int/iris/handle/10665/122745 (accessed on 30 October 2022).
- Gibbons, R.; Guo, F.; Median, A.; Terry, T.; Du, J.; Lukevich, P.; Corkum, D.; Vetere, P. Guidelines for the Implementation of Reduce Lighting on Roadways; FHWA-HRT-14-050; Federal Highway Administration: McLean, VA, USA, 2014.
- American Medical Association. Human and Environmental Effects of Light Emitting Diode (LED) Community Lighting; CSAPH Report 2-A-16; American Medical Association: Chicago, IL, USA, 2016. [Google Scholar]
- Duffy, J.; Czeisler, C. Effect of light on human circadian physiology. Sleep Med. Clin. 2009, 4, 165–177. [Google Scholar] [CrossRef] [PubMed] [Green Version]
- Lucas, R.J.; Peirson, S.N.; Berson, D.M.; Brown, T.M.; Cooper, H.M.; Czeisler, C.A.; Figueiro, M.G.; Gamlin, P.D.; Lockley, S.W.; O’Hagan, J.B.; et al. Measuring and using light in the melanopsin age. Trends Neurosci. 2014, 37, 1–9. [Google Scholar] [CrossRef] [PubMed]
- Bedrosian, T.A.; Fonken, I.K.; Nelson, R.J. Endocrine Effects of Circadian Disruption. Annu. Rev. Physiol. 2016, 78, 109–131. [Google Scholar] [CrossRef] [Green Version]
- James, P.; Bertrand, K.A.; Hart, J.E.; Schernhammer, E.S.; Tamimi, R.M.; Laden, F. Outdoor Light at Night and Breast Cancer Incidence in the Nurses’ Health Study II. Environ. Health Perspect. 2017, 125, 087010. [Google Scholar] [CrossRef] [Green Version]
- West, K.E.; Jablonski, M.R.; Warfield, B.; Cecil, K.S.; James, M.; Ayers, M.A.; Maida, J.; Bowen, C.; Sliney, D.H.; Rollag, M.D.; et al. Blue light from light-emitting diodes elicits a dose-dependent suppression of melatonin in humans. J. Appl. Physiol. 2011, 110, 619–626. [Google Scholar] [CrossRef] [Green Version]
- Cajochen, C.; Frey, S.; Anders, D.; Späti, J.; Bues, M.; Pross, A.; Mager, R.; Wirz-Justice, A.; Stefani, O. Evening exposure to a light-emitting diodes (LED)-backlit computer screen affects circadian physiology and cognitive performance. J. Appl. Physiol. 2011, 110, 1432–1438. [Google Scholar] [CrossRef] [PubMed] [Green Version]
- Chang, A.-M.; Aeschbach, D.; Duffy, J.F.; Czeisler, C.A. Evening use of light-emitting eReaders negatively affects sleep, circadian timing, and next-morning alertness. Proc. Natl. Acad. Sci. USA 2015, 112, 1232–1237. [Google Scholar] [CrossRef] [PubMed] [Green Version]
- North West Energy Alliance. Seattle LED Adaptive Lighting Study; Contract No.: E14-286; North West Energy Alliance: Portland, OR, USA, 2014. [Google Scholar]
- Bhagavathula, R.; Gibbons, R.B. Light Levels for Parking Facilities Based on Empirical Evaluation of Visual Performance and User Perceptions. Leukos 2019, 16, 115–136. [Google Scholar] [CrossRef]
- Gibbons, R.B.; Li, Y.; Meyer, J. Assessment of the Performance of Light-Emitting Diode Roadway Lighting Technology; Virginia Transportation Research Council: Charlottesville, VA, USA, 2015. [Google Scholar]
- Illuminating Engineering Society. Recommended Practice: Lighting Roadway and Parking Facilities; ANSI/IES RP-8-18; Illuminating Engineering Society: New York, NY, USA, 2018. [Google Scholar]
- CIE. CIE System for Metrology of Optical Radiation for ipRGC-Influenced Responses to Light; CIE: Vienna, Austria, 2018. [Google Scholar]
- CIE. Position Statement on Non-Visual Effects of Light—Recommending Proper Light at the Proper Time, 2nd ed.; CIE: Vienna, Austria, 2019. [Google Scholar]
- Brown, T.M.; Brainard, G.C.; Cajochen, C.; Czeisler, C.A.; Hanifin, J.P.; Lockley, S.W.; Lucas, R.J.; Münch, M.; O’Hagan, J.B.; Peirson, S.N.; et al. Recommendations for daytime, evening, and nighttime indoor light exposure to best support physiology, sleep, and wakefulness in healthy adults. PLoS Biol. 2022, 20, e3001571. [Google Scholar] [CrossRef] [PubMed]
- Board, T.R.; National Academies of Sciences, Engineering and Medicine. LED Roadway Lighting: Impact on Driver Sleep Health and Alertness; The National Academies Press: Washington, DC, USA, 2021; 56p. [Google Scholar] [CrossRef]
- Ohayon, M.M.; Milesi, C. Artificial Outdoor Nighttime Lights Associate with Altered Sleep Behavior in the American General Population. Sleep 2016, 39, 1311–1320. [Google Scholar] [CrossRef] [PubMed] [Green Version]
- Rao, D.; Yu, H.; Bai, Y.; Zheng, X.; Xie, L. Does night-shift work increase the risk of prostate cancer? A systematic review and meta-analysis. Onco Targets Ther. 2015, 8, 2817–2826. [Google Scholar] [PubMed] [Green Version]
- Stevens, R.G.; Brainard, G.C.; Blask, D.E.; Lockley, S.W.; Motta, M.E. Breast cancer and circadian disruption from electric lighting in the modern world. CA Cancer J. Clin. 2013, 64, 207–218. [Google Scholar] [CrossRef]
- American Medical Association. Light Pollution: Adverse Health Effects of Nighttime Lighting; CSAPH Report 4-A-12; American Medical Association: Chicago, IL, USA, 2012. [Google Scholar]
- US Department of Energy. MS-SSLC 2016 The Light Post -Of cial MSSLC e-Newsletter June. Available online: https://www.energy.gov/sites/prod/les/2016/06/f32/postings_06-21-16.pdf (accessed on 9 June 2019).
- Illuminating Engineering Society of North America. Human and Environmental Effects of Light Emitting Diode (LED) Community Lighting; IES Board Position on AMA CSAPH Report 2-A-16; Illuminating Engineering Society: New York, NY, USA, 2017. [Google Scholar]
- Kennaway, D.J. A critical review of melatonin assays: Past and present. J. Pineal Res. 2019, 67, e12572. [Google Scholar] [CrossRef] [Green Version]
- Illuminating Engineering Society. Lighting for Interior and Exterior Residential Environments; ANSI/IES RP-11-20; Illuminating Engineering Society: New York, NY, USA, 2020. [Google Scholar]
- Hébert, M.; Martin, S.K.; Lee, C.; Eastman, C.I. The effects of prior light history on the suppression of melatonin by light in humans. J. Pineal Res. 2002, 33, 198–203. [Google Scholar] [CrossRef] [PubMed] [Green Version]
- Jasser, S.A.; Hanifin, J.P.; Rollag, M.D.; Brainard, G.C. Dim Light Adaptation Attenuates Acute Melatonin Suppression in Humans. J. Biol. Rhythm. 2006, 21, 394–404. [Google Scholar] [CrossRef] [PubMed]
- CIE. CIE S 026 α-opic Toolbox: Commission Internationale de l’Eclairage 2020. Available online: http://cie.co.at/technical-work/technical-resources (accessed on 3 October 2021).
- Cellini, N.; Buman, M.P.; McDevitt, E.A.; Ricker, A.A.; Mednick, S.C. Direct comparison of two actigraphy devices with polysomnographically recorded naps in healthy young adults. Chronobiol. Int. 2013, 30, 691–698. [Google Scholar] [CrossRef] [PubMed]
- Takano, K.; Boddez, Y.; Raes, F. I sleep with my Mind’s eye open: Cognitive arousal and overgeneralization underpin the misperception of sleep. J. Behav. Ther. Exp. Psychiatry 2016, 52, 157–165. [Google Scholar] [CrossRef] [PubMed]
- Fraser, S.; Cowen, P.; Franklin, M.; Franey, C.; Arendt, J. Direct radioimmunoassay for melatonin in plasma. J. Clin. Chem. 1983, 29, 396–397. [Google Scholar] [CrossRef]
- English, J.; Middleton, B.; Arendt, J.; Wirz-Justice, A. Rapid direct measurement of melatonin in saliva using an iodinated tracer and solid phase second antibody. Ann. Clin. Biochem. 1993, 30, 415–416. [Google Scholar] [CrossRef] [PubMed]


| Start Time | Exposure Time | Duration | Roadway Luminance | Corneal Illuminance | Saliva Sampling Rate | |
|---|---|---|---|---|---|---|
| Driver | 11 P.M. | 1 A.M. to 3 A.M. | 2 h | 1.0 cd/m2 | 1.4 lux | Every 30 min |
| Pedestrian | 8 P.M. | 10 P.M. to 2 A.M. | 4 h | 1.0 cd/m2 | 10.0 lux | Every 40 min |
| Light Trespass | 10 P.M. | 12 A.M. to 2 A.M. | 2 h | 1.0 cd/m2 | 1.5 lux | Every 30 min |
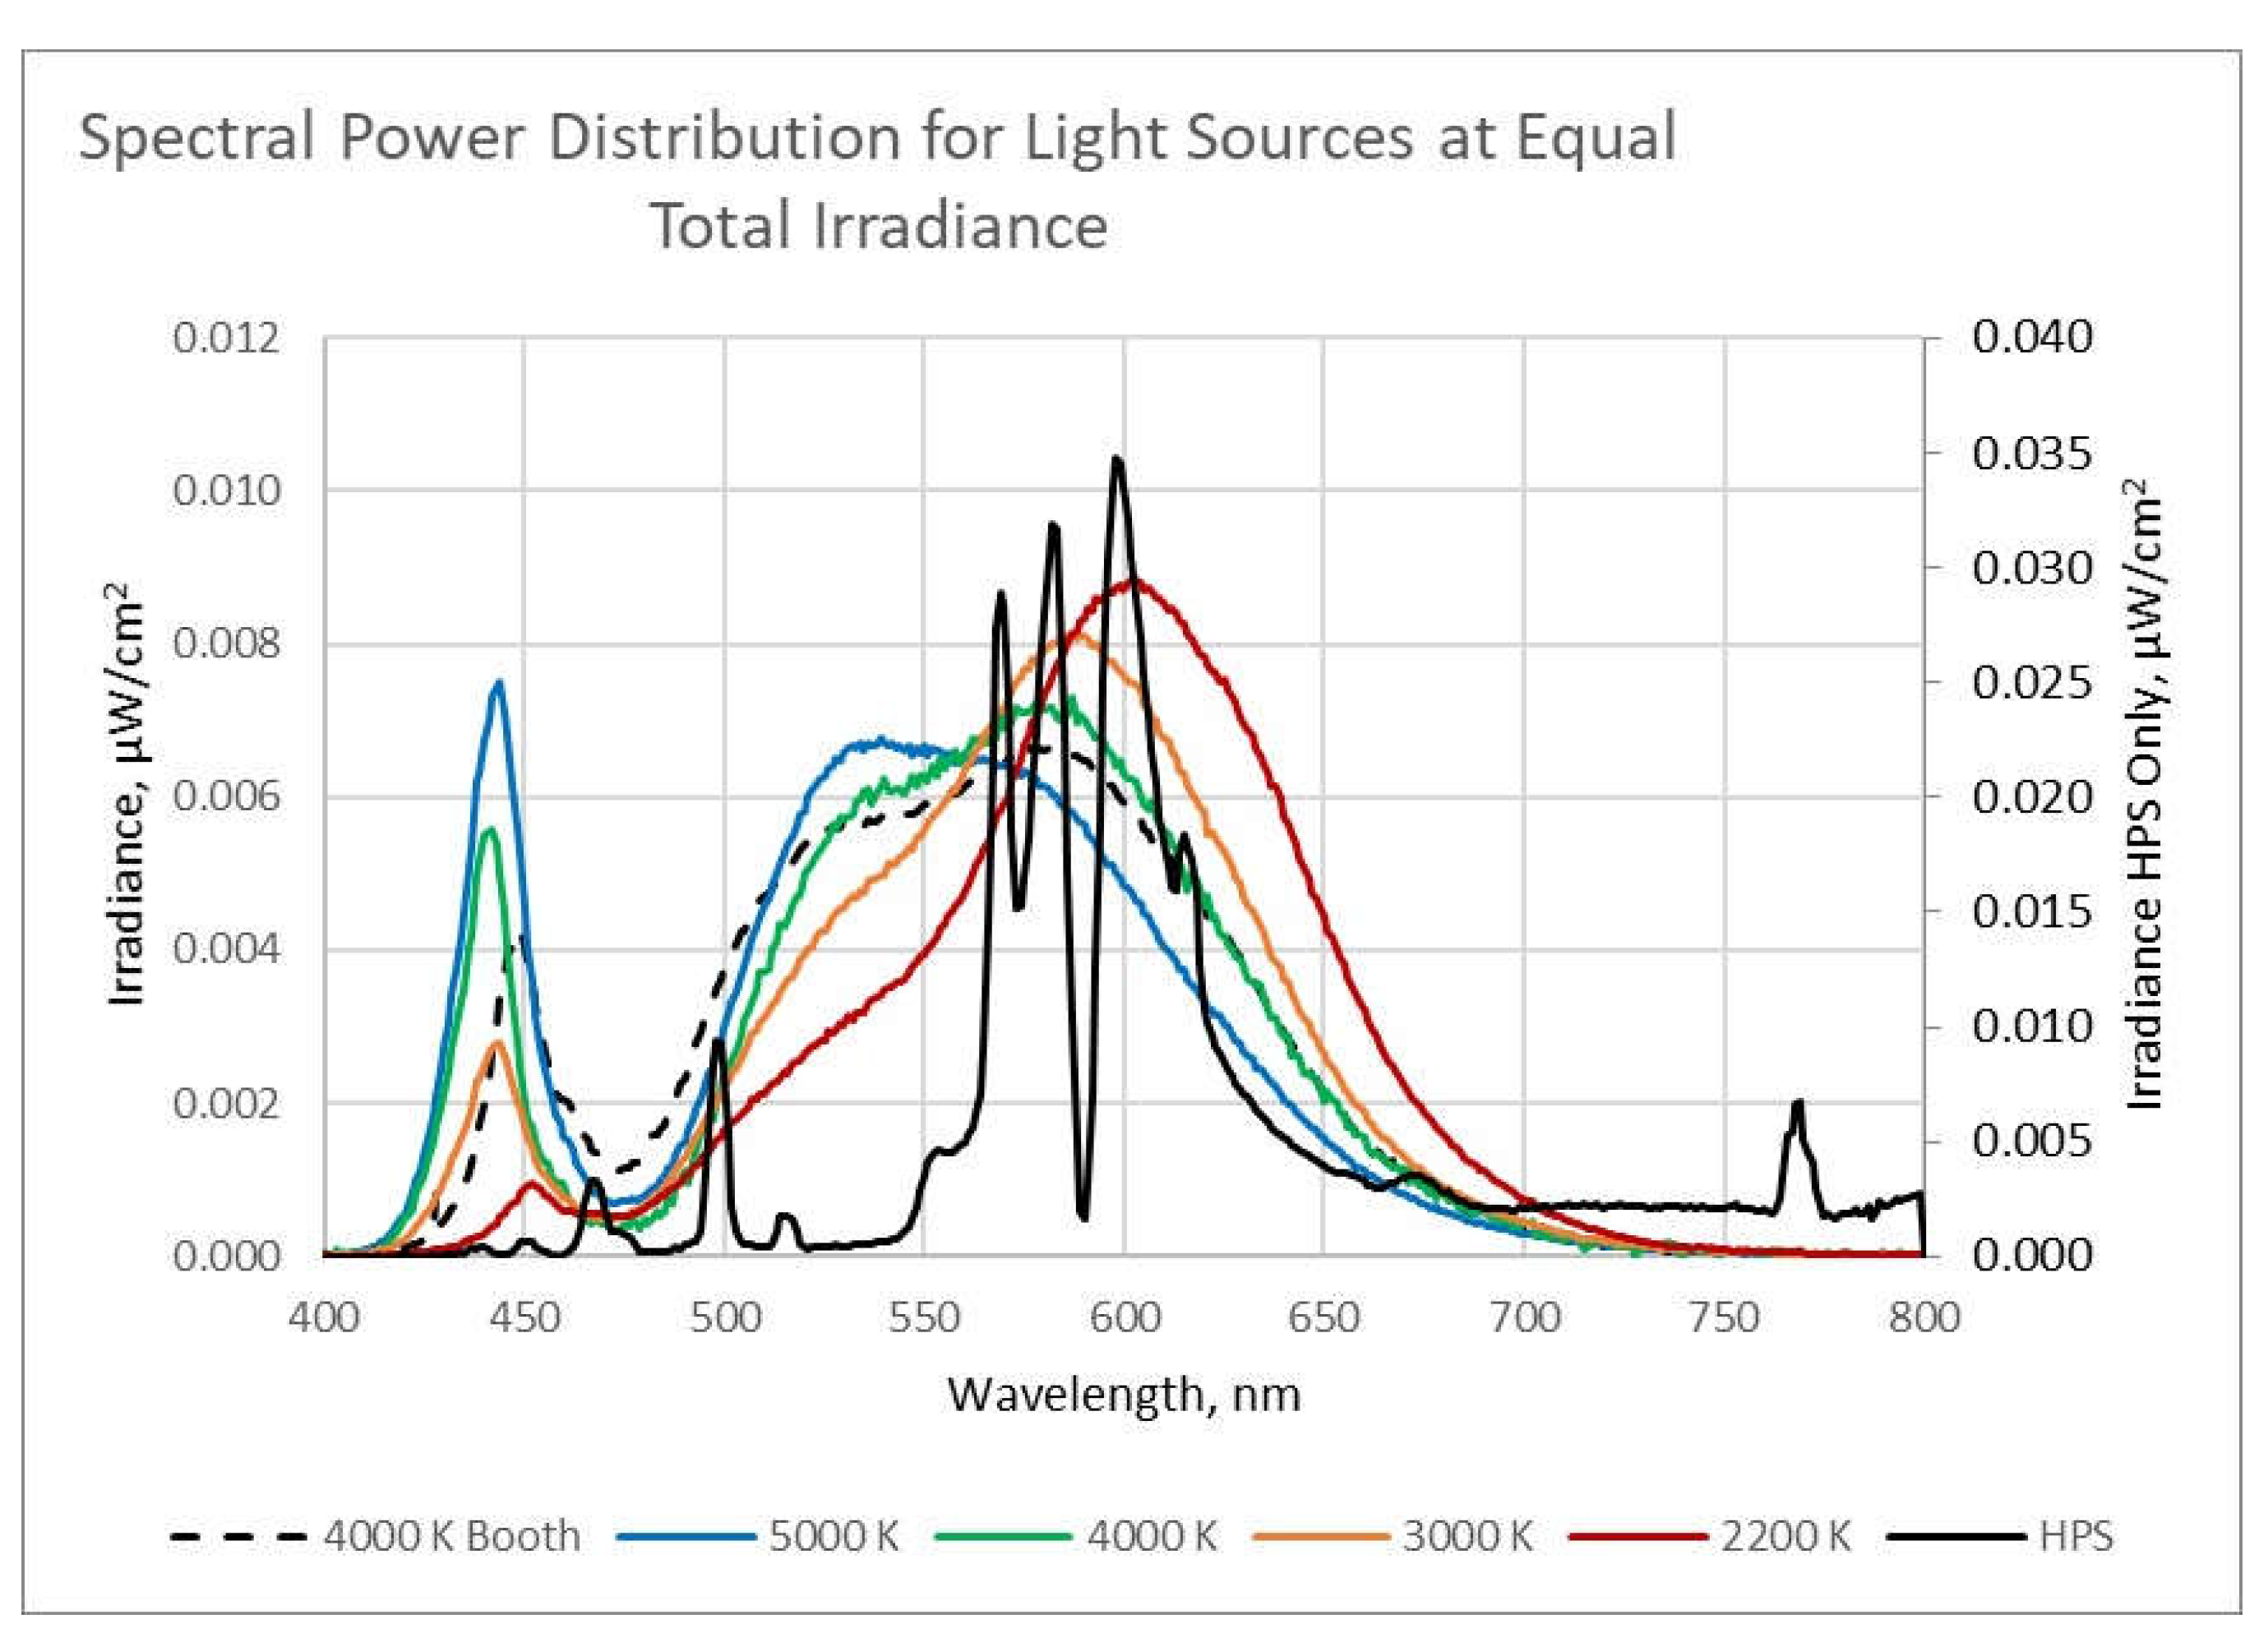
| Condition | 5000 K LED | 4000 K LED | 3000 K LED | 2200 K LED | 2100 K HPS |
|---|---|---|---|---|---|
| S-cone α opic EDI [lux] | 0.77 | 0.50 | 0.31 | 0.14 | 0.09 |
| M-cone α opic EDI [lux] | 1.39 | 1.30 | 1.23 | 1.11 | 0.99 |
| L-cone α opic EDI [lux] | 1.44 | 1.46 | 1.48 | 1.53 | 1.58 |
| Rhodopic EDI [lux] | 1.04 | 0.84 | 0.73 | 0.58 | 0.35 |
| Melanopic EDI [lux] | 0.86 | 0.65 | 0.55 | 0.42 | 0.22 |
Publisher’s Note: MDPI stays neutral with regard to jurisdictional claims in published maps and institutional affiliations. |
© 2022 by the authors. Licensee MDPI, Basel, Switzerland. This article is an open access article distributed under the terms and conditions of the Creative Commons Attribution (CC BY) license (https://creativecommons.org/licenses/by/4.0/).
Share and Cite
Gibbons, R.B.; Bhagavathula, R.; Warfield, B.; Brainard, G.C.; Hanifin, J.P. Impact of Solid State Roadway Lighting on Melatonin in Humans. Clocks & Sleep 2022, 4, 633-657. https://doi.org/10.3390/clockssleep4040049
Gibbons RB, Bhagavathula R, Warfield B, Brainard GC, Hanifin JP. Impact of Solid State Roadway Lighting on Melatonin in Humans. Clocks & Sleep. 2022; 4(4):633-657. https://doi.org/10.3390/clockssleep4040049
Chicago/Turabian StyleGibbons, Ronald B., Rajaram Bhagavathula, Benjamin Warfield, George C. Brainard, and John P. Hanifin. 2022. "Impact of Solid State Roadway Lighting on Melatonin in Humans" Clocks & Sleep 4, no. 4: 633-657. https://doi.org/10.3390/clockssleep4040049
APA StyleGibbons, R. B., Bhagavathula, R., Warfield, B., Brainard, G. C., & Hanifin, J. P. (2022). Impact of Solid State Roadway Lighting on Melatonin in Humans. Clocks & Sleep, 4(4), 633-657. https://doi.org/10.3390/clockssleep4040049